Article

Analysis of SI-Related BoGAPDH Family Genes and Response of BoGAPC to SI Signal in Brassica oleracea L.

College of Agronomy and Biotechnology, Southwest University, Chongqing 400715, China
*
Author to whom correspondence should be addressed.
These authors Contributed equally to this work.
Genes 2021, 12(11), 1719; https://doi.org/10.3390/genes12111719
Submission received: 12 September 2021 / Revised: 21 October 2021 / Accepted: 27 October 2021 / Published: 28 October 2021
(This article belongs to the Special Issue Genetic Research and Plant Breeding)

Abstract

:
Glyceraldehyde 3-phosphate dehydrogenase (GAPDH) is not only involved in carbohydrate metabolism, but also plays an important role in stress resistance. However, it has not been reported in Brassica oleracea. In this study, we performed a genome-wide identification of BoGAPDH in B. oleracea and performed cloning and expression analysis of one of the differentially expressed genes, BoGAPC. A total of 16 members of the BoGAPDH family were identified in B. oleracea, which were conserved, distributed unevenly on chromosomes and had tandem repeat genes. Most of the genes were down-regulated during self-pollination, and the highest expression was found in stigmas and sepals. Different transcriptome data showed that BoGAPDH genes were differentially expressed under stress, which was consistent with the results of qRT-PCR. We cloned and analyzed the differentially expressed gene BoGAPC and found that it was in the down-regulated mode 1 h after self-pollination, and the expression was the highest in the stigma, which was consistent with the result of GUS staining. The promoter region of the gene not only has stress response elements and plant hormone response elements, but also has a variety of specific elements for regulating floral organ development. Subcellular localization indicates that the BoGAPC protein is located in the cytoplasm and belongs to the active protein in the cytoplasm. The results of prokaryotic expression showed that the size of the BoGAPC protein was about 37 kDa, which was consistent with the expected results, indicating that the protein was induced in prokaryotic cells. The results of yeast two-hybrid and GST pull-down showed that the SRK kinase domain interacted with the BoGAPC protein. The above results suggest that the BoGAPDH family of B. oleracea plays an important role in the process of plant stress resistance, and the BoGAPC gene may be involved in the process of self-incompatibility in B. oleracea, which may respond to SI by encoding proteins directly interacting with SRK.

1. Introduction

Self-incompatibility (SI) is a complex genetic mechanism formed in the long-term evolution of plants to prevent self-incompatibility and promote heterosis. Its molecular mechanism is mainly focused on the synergistic effect of SI signal transduction elements on self-pollen germination or pollen tube growth. It is based on the process of phosphorylation activation of SI signal elements and ubiquitin degradation of pollen affinity factors [1].
Glyceraldehyde 3-phosphate dehydrogenase (GAPDH) is ubiquitous in plant plastids (or chloroplasts). GAPDH in chloroplasts is mainly composed of GapA and GapB subunits, which encode genes called GAPB and GAPA, with NAPD (H) as the coenzyme. Genes encoding GapC subunits in cytoplasm are called GAPC, with NAD+ as the coenzyme [2]. In addition to participating in the important function of energy metabolism, GAPDH also plays a key role in plant resistance to stress. During the growth of poplar, GAPDH responds to the signal of water shortage [3]. When Arabidopsis thaliana transferred from normal growth conditions to heat shock, anaerobes or increased sucrose supply, the level of GAPC transcription increased [4]. AtGAPC can interact with phospholipase Dδ (PLDδ) to transduce H2O2 signals in plant response to drought stress and promote seed oil accumulation [5,6,7]. Rice increased salt tolerance through overexpression of the GAPC gene [8]. The GAPDH gene interacts with osmotic pressure-activated protein kinase to produce immune response in tobacco after salt treatment [9]. GAPC3 and GAPC4 are induced by anaerobic stress in Maize [10]. The transcription factor TaWRKY40 of wheat positively regulated the expression of TaGAPC1 to enhance drought resistance, and wheat GAPDH12 was significantly upregulated in buds under cold, high temperature, drought and salt stress to participate in the response to adversity stress [11,12]. In addition, GAPDH plays an active role in membrane fusion, vascular bundle formation, phosphotransferase activity, nuclear RNA output, telomere binding, DNA replication and repair, viral pathogenicity and other functions [2]. Meanwhile, it has been found in recent years that GAPDH also plays an important role in embryo development, pollen development, root growth, ABA signal transduction and other aspects [13,14].
The research focus of self-incompatibility has shifted from the key factors in self-incompatibility reactions, such as traditional S-locus receptor kinase (SRK), S-locus glycoprotein (SLG) and S-locus cysteine-rich protein (SCR), to a new direction [15]. In the process of the self-incompatibility physiological reaction, the self-pollen falls to the stigma, and the stigma produces anti-adverse rejection, which causes the self-pollen to fail to hydrate or germinate, triggering the programmed cell death (PCD) of the self-flowering pollen. The effect of pollen inducing SI on stigma is similar to that of an external stress stimulator; reactive oxygen species (ROS) are thought to induce different types of PCD during development. It was found that pollen from different species or incompatibility accumulated a high level of H2O2 when scattered on the stigma, but this level decreased significantly on the compatible stigma [16,17,18]. GAPC not only plays a role in energy supply, but also transmits the ROS signal in PLDδ interaction. Some scholars have pointed out that PLDδ participates in SI as a target of armadillo-repeat containing protein 1 (ARC1) in SI. However, it is not clear whether there is another way to participate in SI, such as the interaction with GAPDH to transfer the high accumulation of H2O2 in SI reaction. A total of 16 members were identified in the B. oleracea genome, and their evolution analysis, structure analysis, promoter analysis, collinearity analysis and expression pattern analysis were carried out. The differentially expressed BoGAPC genes in SI transcriptome were further explored, such as cloning, bioinformatics analysis, tissue specificity analysis, promoter activity analysis, subcellular localization, prokaryotic expression and yeast two-hybrid. The purpose of this study is to prove that the protein encoded by this gene is involved in the self-incompatibility reaction of B. oleracea and to provide a basis for the further study of B. oleracea SI.

2. Materials and Methods

2.1. Conserved Domain Analysis of GAPDH Family Genes in B. oleracea and A. thaliana

To identify and classify the GAPDH gene family members, we searched the B. oleracea genome database (http://brassicadb.org/brad/geneFamily.php (accessed on 5 March 2020)), the TAIR genome database (https://www.Arabidopsis.org/index.jsp (accessed on 5 March 2020)) and the Ensembl database (http://plants.ensembl.org/Brassica_Oleracea/Info/index (accessed on 5 March 2020)) to query and download the B. oleracea and Arabidopsis whole genome sequences, resulting in B. oleracea and Arabidopsis chromosome sequence information and related annotation files.
Through sequence alignment and conservative region analysis, we found that B. oleracea and Arabidopsis GAPDH family genes contained Gp_dh_N superfamily or Gp_dh_C superfamily conserved regions. The conservative domains Gp_dh_N (ID: PF00044.24) and Gp_dh_C (ID: PF02800.20) hidden Markov model (HMM) matrix files were searched and downloaded online through the Pfam database (http://pfam.xfam.org/ (accessed on 5 March 2020)). The hmmsearch program was used to search for the genes containing conserved domains in all protein files of B. oleracea and A. thaliana. The genes were screened based on the e-value value of 1 × 10⁻²⁰, and the screened genes were reconstructed by the hmmbuild program to reconstruct the HMM of the conserved domain of GAPDH protein specific to B. oleracea species. The newly constructed HMM was used to screen GAPDH family genes in B. oleracea and Arabidopsis protein databases, and the protein sequence information of GAPDH family in B. oleracea and A. thaliana was obtained.
The conserved motifs of B. oleracea GAPDH gene family were analyzed online by MEME (http://meme-suite.org/tools/meme/ (accessed on 9 May 2020)). The search domain number was 10, the minimum amino acid number of motif was 6 and the longest amino acid number was 50. The search results were processed into vector graphics by TBools software (20200512, Guangzhou, China).

2.2. Evolutionary Analysis of Members of GAPDH Gene Family in B. oleracea and Related Species

The GAPDH gene family was sequentially screened in turnip, Brassica napus, maize, rice and tomato according to the method described in Section 2.1. The GAPDH gene family members of the seven species obtained were aligned by MUSCLE. The phylogenetic tree of the GAPDH family of B. oleracea, A. thaliana, turnip, Brassica napus, maize, rice and tomato species was constructed by using the maximum likelihood method (ML) with bootstrap set to 1000 by MEGA X software (MEGA X, Philadelphia, PA, USA).
The ratio of the nonsynonymous substitution rate (Ka) and the synonymous substitution rate (Ks) of the GAPDH gene family in B. oleracea was calculated by KAKS software (KaKs_Calculator2.0, Beijing, China) using the CDS sequence files of B. oleracea and Arabidopsis genomes. The KAKS tandem repeat pairs were screened based on similarity of more than 80% and the length of the alignment of the two sequences being more than 75% of the longer sequence. Circos maps of GAPDH gene collinearity within B. oleracea genomes and between B. oleracea and Arabidopsis genomes were drawn and analyzed by Circos software (Circos, Vancouver, BC, Canada).

2.3. Chromosome Mapping of GAPDH Family Genes in B. oleracea

The location information of GAPDH family genes on 9 chromosomes of B. oleracea was recorded by using the genome annotation file, and the chromosomal location map of genes was plotted by using Map Gene (http://mg2c.IASk.in/mg2C_v2.1/ (accessed on 13 May 2020)), an online mapping tool.

2.4. Transcript Structure of GAPDH Family Genes in B. oleracea and Analysis of Cis-Acting Regulatory Elements in Promoters

We used the B. oleracea genome annotation file to draw the transcript structure of the B. oleracea GAPDH gene family through the online tool Gene Structure Display Server 2.0 (http://gsds.cbi.pku.edu.cn/ (accessed on 16 May 2020)).
We used Brassica genome annotation files to extract the B. oleracea family of GAPDH gene translation initiation site about 1500 bp sequence upstream, using the New PLACE online website (https://www.dna.affrc.go.jp/PLACE/?Action=newplace (accessed on 16 May 2020)) to analyze and identify cis-regulating elements in the promoter subregion. The analysis results were extracted and submitted to the online website Gene Structure Display Server 2.0 (http://gsds.cbi.pku.edu.cn/ (accessed on 9 May 2020)) to draw homeopathic components.

2.5. Expression Analysis of BoGAPDH Gene Family

According to the obtained BoGAPDH family gene sequence, qRT-PCR-specific primers were designed (Table S2). Using B. oleracea tissue, unpollinated stigma, self-pollination for 15, 30 and 60 min and cross-pollination for 15, 30 and 60 min stigma cDNA as templates, the expression pattern was detected by RT-PCR. RT-PCR experiments were performed in separate tubes. (For details of RNA extraction and RT-PCR methods, please refer to the Supplementary Material S1: Materials and Methods.) Using B. oleracea BoActin as the internal reference gene, the relative expression level of the target gene was calculated by the 2−ΔΔCT method. The software we used to perform and analyze the RT-PCR results was Excel 2016 and the equipment used was the BIO-Rad CFX Connect Real-Time PCR System.
BoGAPDH family genes were scanned and compared with the data of B. oleracea SI transcriptome and Xanthomonas campestris pv stress transcriptome (NCBI accession number GSE107720) in our laboratory to screen the differentially expressed BoGAPDH genes and speculate the functional differences of differentially expressed genes and family genes.

2.6. Experimental Materials

The materials of B. oleracea self-incompatibility line A4 and F1 were provided by the Institute of Cruciferae of Southwest University, Chongqing, China, and planted in isolation in the culture base. In late March 2019, A4 materials with consistent growth were selected to be artificially castrated on the day of flowering, and mature A4 and F1 pollens were used for self-pollination (SI) and cross-pollination (CP). The pollination period was 0, 15, 30 and 60 min. After pollination, the pollen on the stigma was quickly swept away and cryopreserved in liquid nitrogen immediately. At the same time, leaves, buds, sepals, petals, anthers and stigmas were stored in liquid nitrogen.
Plant Total RNA Isolation Kit, Plasmid Mini extraction kit, synthesis and sequencing of various primers were performed by Sangon Biotech (Shanghai, China) Co., Ltd.; the reverse transcription kit was purchased from TransGen Biotech (Beijing, China) Co., Ltd.; and agrobacterium tumefaciens GV3101, yeast Y2HGold and prokaryotic expression strain E. coli BL21 (DE3) were purchased from Shanghai Weidi Biotechnology Co., Ltd. (Shanghai, China).

2.7. Cloning of Target Genes

The corresponding B. oleracea sequences were obtained by comparing the NCBI database and the B. oleracea database. According to the principle of homologous recombination and the characteristics of yeast expression vector, primers BoGAPC-AD-F and BoGAPC-AD-R (Table S1) were designed with Primer 6.0 software (Primer 6.0, Vancouver, Canada). Using B. oleracea stigma gDNA and cDNA as templates, the concentration of gDNA and cDNA used in the PCR reactions was 500 ng µL−1, the volume used was 1 µL and the amount of gDNA and cDNA used as templates in the PCR was 500 ng. The coding sequence of BoGAPC was amplified by PCR in PrimerSTAR Max DNA Polymerase (TaKaRa, Beijing, China) 25 µL reaction system. The reaction system was as follows: 1 µL of DNA template, 1 µL of BoGAPC-AD-F and BoGAPC-AD-R, 9.5 µL of ddH2O and 12.5 µL of 2 × PCR Mixster Mix. The reaction program was as follows: 94 °C pre-denaturation 3 min; 94 °C 30 s, 59 °C 30 s, 72 °C extension 1 min 10 s, 35 cycles; and 72 °C final extension 5 min. The amplified products were sent to Sangon Biotech (Shanghai) Co., Ltd. for sequencing. After correct sequencing, the target fragment was ligated with pGADT7 vector and transferred into E. coli competent cell DH5α. The positive clones were selected by PCR and sent to Sangon Biotech (Shanghai) Co., Ltd. for sequencing. According to the above method, the primers SRKj-AD-F and SRKj-AD-R were designed to amplify the kinase domain of the self-incompatibility intermediate protein SRK (Table S1), and ligated to yeast expression vector pGBKT7.

2.8. Bioinformatics Analysis

The bioinformatics analysis of the target gene was carried out by using either online websites or software. The amino acids of the coding sequence of the target gene were deduced by Bio-soft (http://www.biosoft.com/w/overview.html (accessed on 9 May 2020)) and DNAMAN 8.0 (https://www.lynnon.com/ (accessed on 9 May 2020)). The physical and chemical properties of the protein encoded by the target gene were analyzed by the online website ExPASy-ProtParam tool (http://www.expasy.org/ (accessed on 9 May 2020)), the transmembrane domain of the protein was predicted by Signalp (http://www.cbs.dtu.dk/services/SignalP/ (accessed on 9 May 2020)), the transmembrane domain of the protein was predicted by TMHMM (http://www.cbs.dtu.dk/services/TMHMM-2.0/ (accessed on 9 May 2020)) and the phosphorylation sites and N-glycosylation sites were predicted by Netphos (http://www.cbs.dtu.dk/services/NetPhos/ (accessed on 9 May 2020)) and NetNGlyc (http://www.cbs.dtu.dk/services/NetGlyc/ (accessed on 9 May 2020)), respectively. ProtScale (https://web.expasy.org/protscale/ (accessed on 12 May 2020)) predicted the hydrophobicity/hydrophilicity of the target protein, SMART (http://smart.embl-heidelberg.de/ (accessed on 12 May 2020)) was used to analyze the advanced domain of the protein, PROSITE (http://prosite.expasy.org/ (accessed on 12 May 2020)) was used to analyze the functional sites of the protein, the cis-acting elements of the promoter of the target gene were analyzed by PlantCARE (http://bioinformatics.psb.ugentbe/webtools/plantcare/ (accessed on 12 May 2020)) and the software MEGA X and the NCBI (http://www.ncbi.nlm.nih.gov/ (accessed on 26 May 2020)) database were used to construct the evolutionary tree.

2.9. Analysis of BoGAPC Expression

The expression of BoGAPC was analyzed using the experimental method described in Section 2.5.

2.10. Promoter Activity Analysis

The sequence of about 1500 bp upstream of the promoter of the target gene was found on NCBI as the target fragment. Using primer BoGAPC-GUSF/BoGAPC-GUSR (Table S1), the target fragment was amplified with B. oleracea stigma gDNA as a template, and the fusion expression vector was constructed with a pCAMBIA 1391 binary expression vector. The plasmid was extracted and transformed into Agrobacterium tumefaciens GV3101. After detecting the positive transformants, the positive transformants were cultured according to 1:100. The wild type A. thaliana was transformed into wild type A. thaliana by inflorescence infection, and the hygromycin resistance was screened. The homozygous transgenic A. thaliana was sown by screening, and the flowers, buds, leaves and pods were placed in GUS staining solution and incubated overnight at 37 °C. The flowers, buds, leaves and pods of wild type A. thaliana were stained and decolorized with 75% alcohol, observed and photographed under stereomicroscope.

2.11. Subcellular Localization

According to the coding sequence of the target gene, the green fluorescent gene GFP was ligated according to the homologous recombination method mentioned above, and the vector used was PAN580. A. thaliana protoplasts were prepared from A. thaliana growing about 4 weeks old and flat leaves with an orientation angle of about 45°. The recombinant plasmids and empty plasmids with a concentration of about 1000 ng/μL were transferred into Arabidopsis protoplasts by the PEG method and cultured at 23 °C for 12–16 h. The localization of the target protein was observed under a laser confocal microscope.

2.12. Prokaryotic Expression

The target gene was ligated with the prokaryotic expression vector pGEX-4T-1. After the correct sequencing, the strain was expanded and cultured, and the plasmid was extracted. The next steps were to transform the plasmid into E. coli BL21 (DE3), perform PCR detection, expand the positive transformant according to 1:100 and inoculate 100 μL of the bacterial solution in 100 mL of 100 μg mL−1 ampicillin-resistant LB liquid medium. Then, we placed the culture on a shaker at 37 °C at 225 r/min until the OD600 reached about 0.5–0.6, and added IPTG to a final concentration of 1 mmol L−1. After overnight induction at 16 °C, the bacteria were collected for ultrasonic fragmentation, the supernatant was collected by centrifugation, the target protein was purified by beaver GST fusion protein and the expression of the target gene protein was detected by SDS-PAGE electrophoresis. The uninduced target gene protein, induced unpurified target gene protein, induced purified target gene protein and induced purified pGEX-4T-1 empty protein were compared.

2.13. Yeast Two-Hybrid Interaction Identification and Protein Interaction Detection by GST Pull-Down

The next steps were to connect the target gene and the BoSRK kinase region to the yeast expression vector pGADT7 and pGBKT7, respectively. When the sequencing was correct, the two recombinant plasmids were extracted and transformed into yeast-competent cells by the polyethylene glycol/lithium acetate method. A negative control (PGADT7-T × PGBDT7 Lam), a positive control (PGAGT7-T × PGBDT7-53) and the experimental group (pGADT7-BoGAPC × pGBKT7-BoSRKj) were competent and plated onto auxotrophic SD/-Trp/-Leu solid media and incubated at 30 °C, inverted for 4 to 5 days to observe plaque growth. The single colony pick point of the growing plaque was smeared on the nutrient-deficient QDO (SD/-Leu/-Trp/-His/Ade) solid medium and cultured at 30 °C upside down for 4–5 days to observe whether there was colony growth.
BoSRKj was ligated into the pET15b expression vector, and the extracted plasmid was transferred into E. coli (DE3) to induce expression. The BoGAPC-GST protein purified by 2.12 GST magnetic beads was incubated with BoSRKj-His overnight at 4 °C for protein binding assay, and the obtained protein was detected by electrophoresis.

3. Results

3.1. Evolutionary Analysis of GAPDH Gene in B. oleracea L.

GAPDH family genes contain conserved regions of the Gp_dh_N superfamily or the Gp_dh_C superfamily, which is consistent with the conservative regions of GAPDH genes in other plants, indicating that this gene family is relatively conservative in all plant evolution. In the conserved domain of GAPDH family genes, the conserved domain of the Gp_dh_N superfamily is the N-terminal NAD+ binding domain, and the conserved region of the Gp_dh_C superfamily is the C-terminal catalytic domain [19]. Through the combination of the B. oleracea genome database and the Tair genome database, the newly constructed GAPDH conserved domain hidden Markov matrix model was used to screen GAPDH family genes [20]. We identified 16 members of the BoGAPDH gene family and 12 members of the AtGAPDH gene family (Table 1).
In order to better understand and verify the phylogenetic relationship among members of the GAPDH gene family in B. oleracea, 16 BoGAPDH, 12 AtGAPDH, 28 BnGAPDH, 13 BrGAPDH, 8 OsGAPDH, 11 SlGAPDH and 55 ZmGAPDH genes were obtained by using the Maximum Likelihood (ML) method to construct the phylogenetic tree (Figure 1).
The phylogenetic tree can be divided into five groups according to their phylogenetic relationship and evolutionary relationship. Group I is a cruciferous heterosexual group composed of 26 GAPDH genes, Group II is a Gramineae-specific group composed of 23 GAPDH genes, Group III is an eggplant heterosexual group composed of 6 GAPDH genes, Group IV is composed of 14 cruciferous genes and 1 Solanaceae GAPDH gene and the final group is composed of Cruciferae, Gramineae and Solanaceae. The closest relative of the GAPDH family proteins is between B. oleracea and Arabidopsis, turnip and Brassica napus, the second-most distant relative of tomato and the most distant relative of Maize in Poaceae rice. The long branching path length may represent the differentiation time successively; most of the B. napus GAPDH genes are found on the same branch as those of A. thaliana, B. rapa and B. napus, and the degree of gene sequence similarity between species genomes is higher than that within species, indicating strong gene homology and possibly similar biological functions.

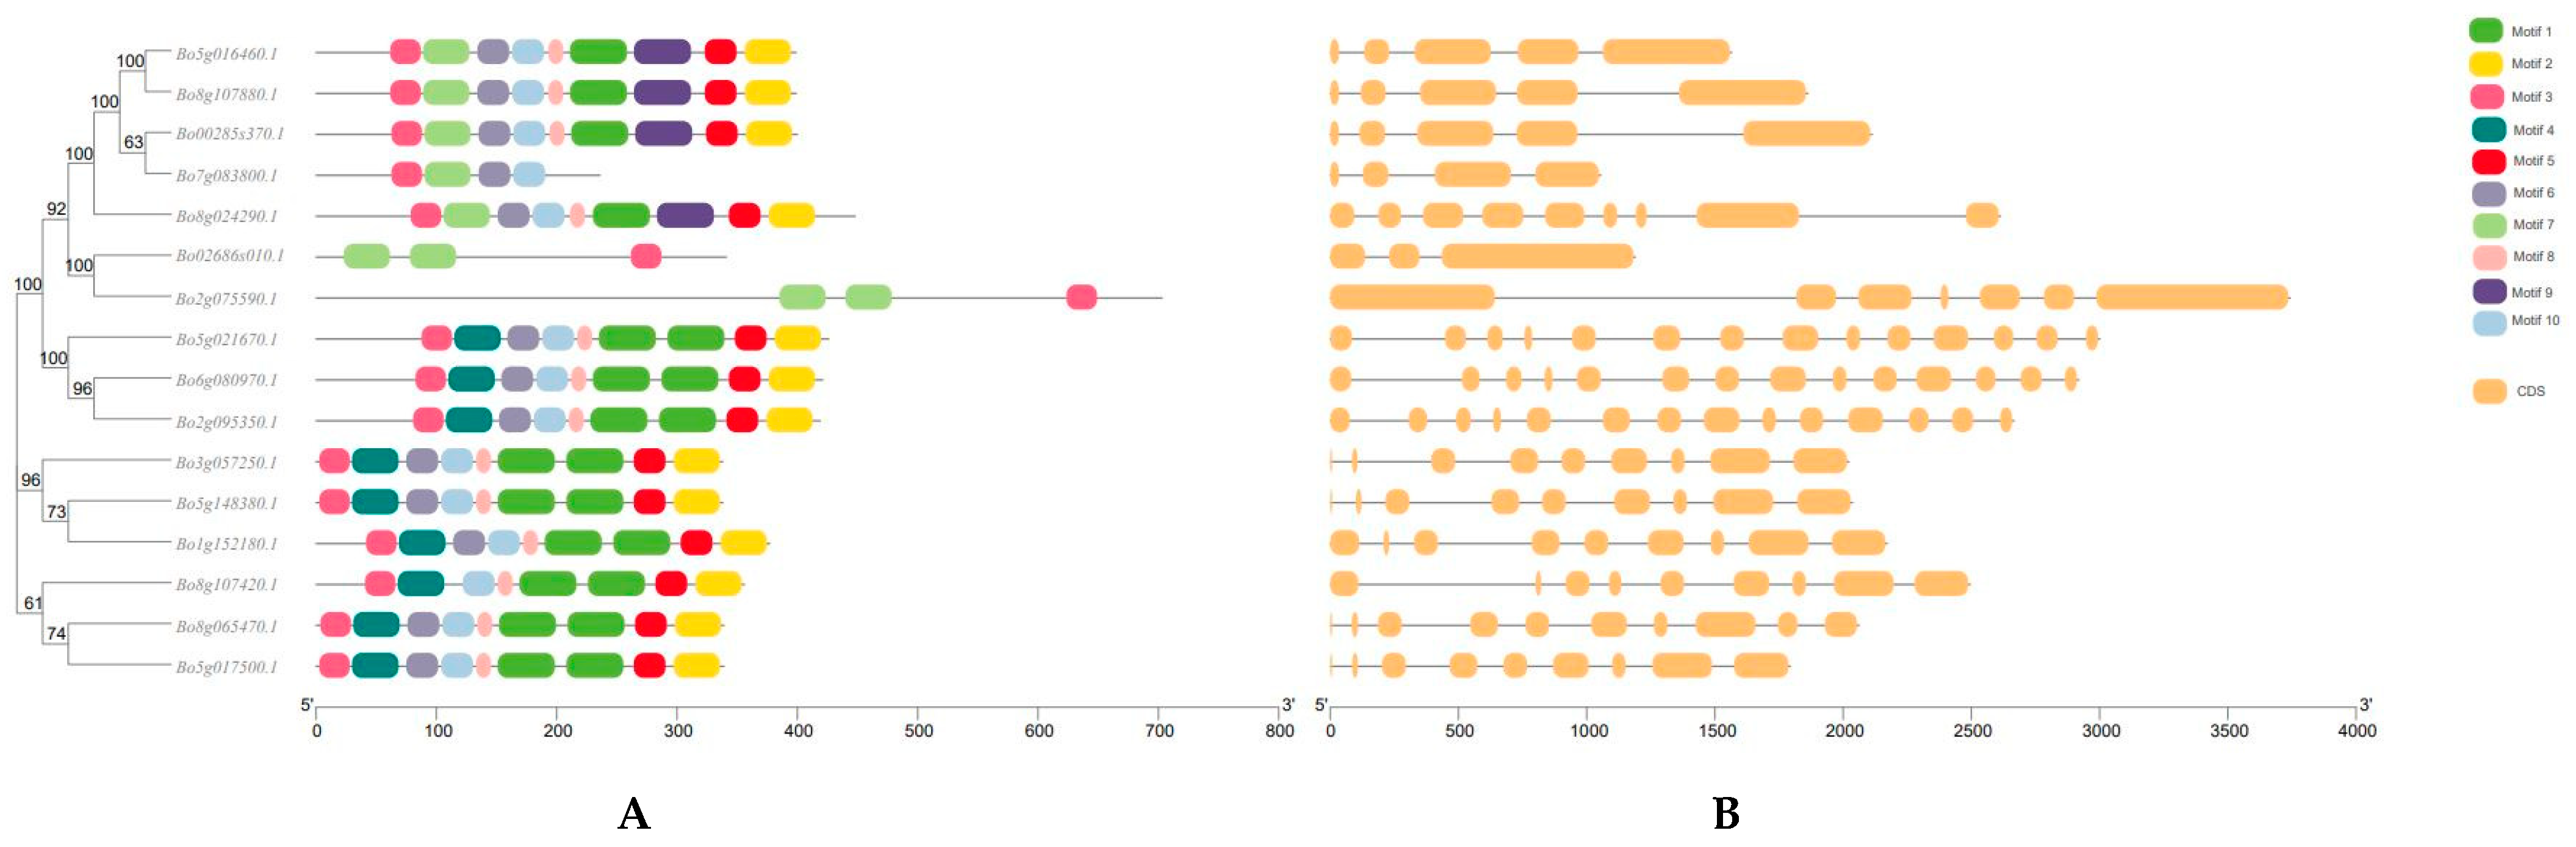
3.2. Structure and Analysis of GAPDH Gene Family Members in B. oleracea L.

The protein domains encoded by B. oleracea GAPDH gene family members were analyzed online by MEME software. It was found that there were 10 conserved motifs in B. oleracea GAPDH family members (Figure S1). The length of these motifs varied from 6 to 50 amino acids. The conserved motif E-value, starting position and length are shown in Table S3.
Through the conservative motif and structure distribution map, it can be seen that the conserved motifs of BoGAPDH genes with similar genetic relationships are basically the same or similar. In terms of the number of conserved genes, most genes have nine conserved motifs, only one gene has four conserved motifs and two genes have three conserved motifs, indicating that B. oleracea GAPDH family genes are relatively conservative in the process of evolution. However, the similarity of CDS and intron in number and distribution is lower than that of conservative motifs (Figure 2). In the transcript structure analysis, there are two genes with the same conservative motif, but there are significant differences in the number and location of CDS, indicating that the evolution process of B. oleracea GAPDH family genes is more complex. The distance between conserved motifs and relatively conserved motifs of Bo02686s010.1 gene and Bo2g075590.1 gene is the same, but there is a significant difference in gene length, CDS and intron distribution, indicating that the evolutionary mechanism is more complex, which may lead to significant differences in function, and it is possible to participate not only in SI signal transduction but also in physiological and biochemical responses to stress.

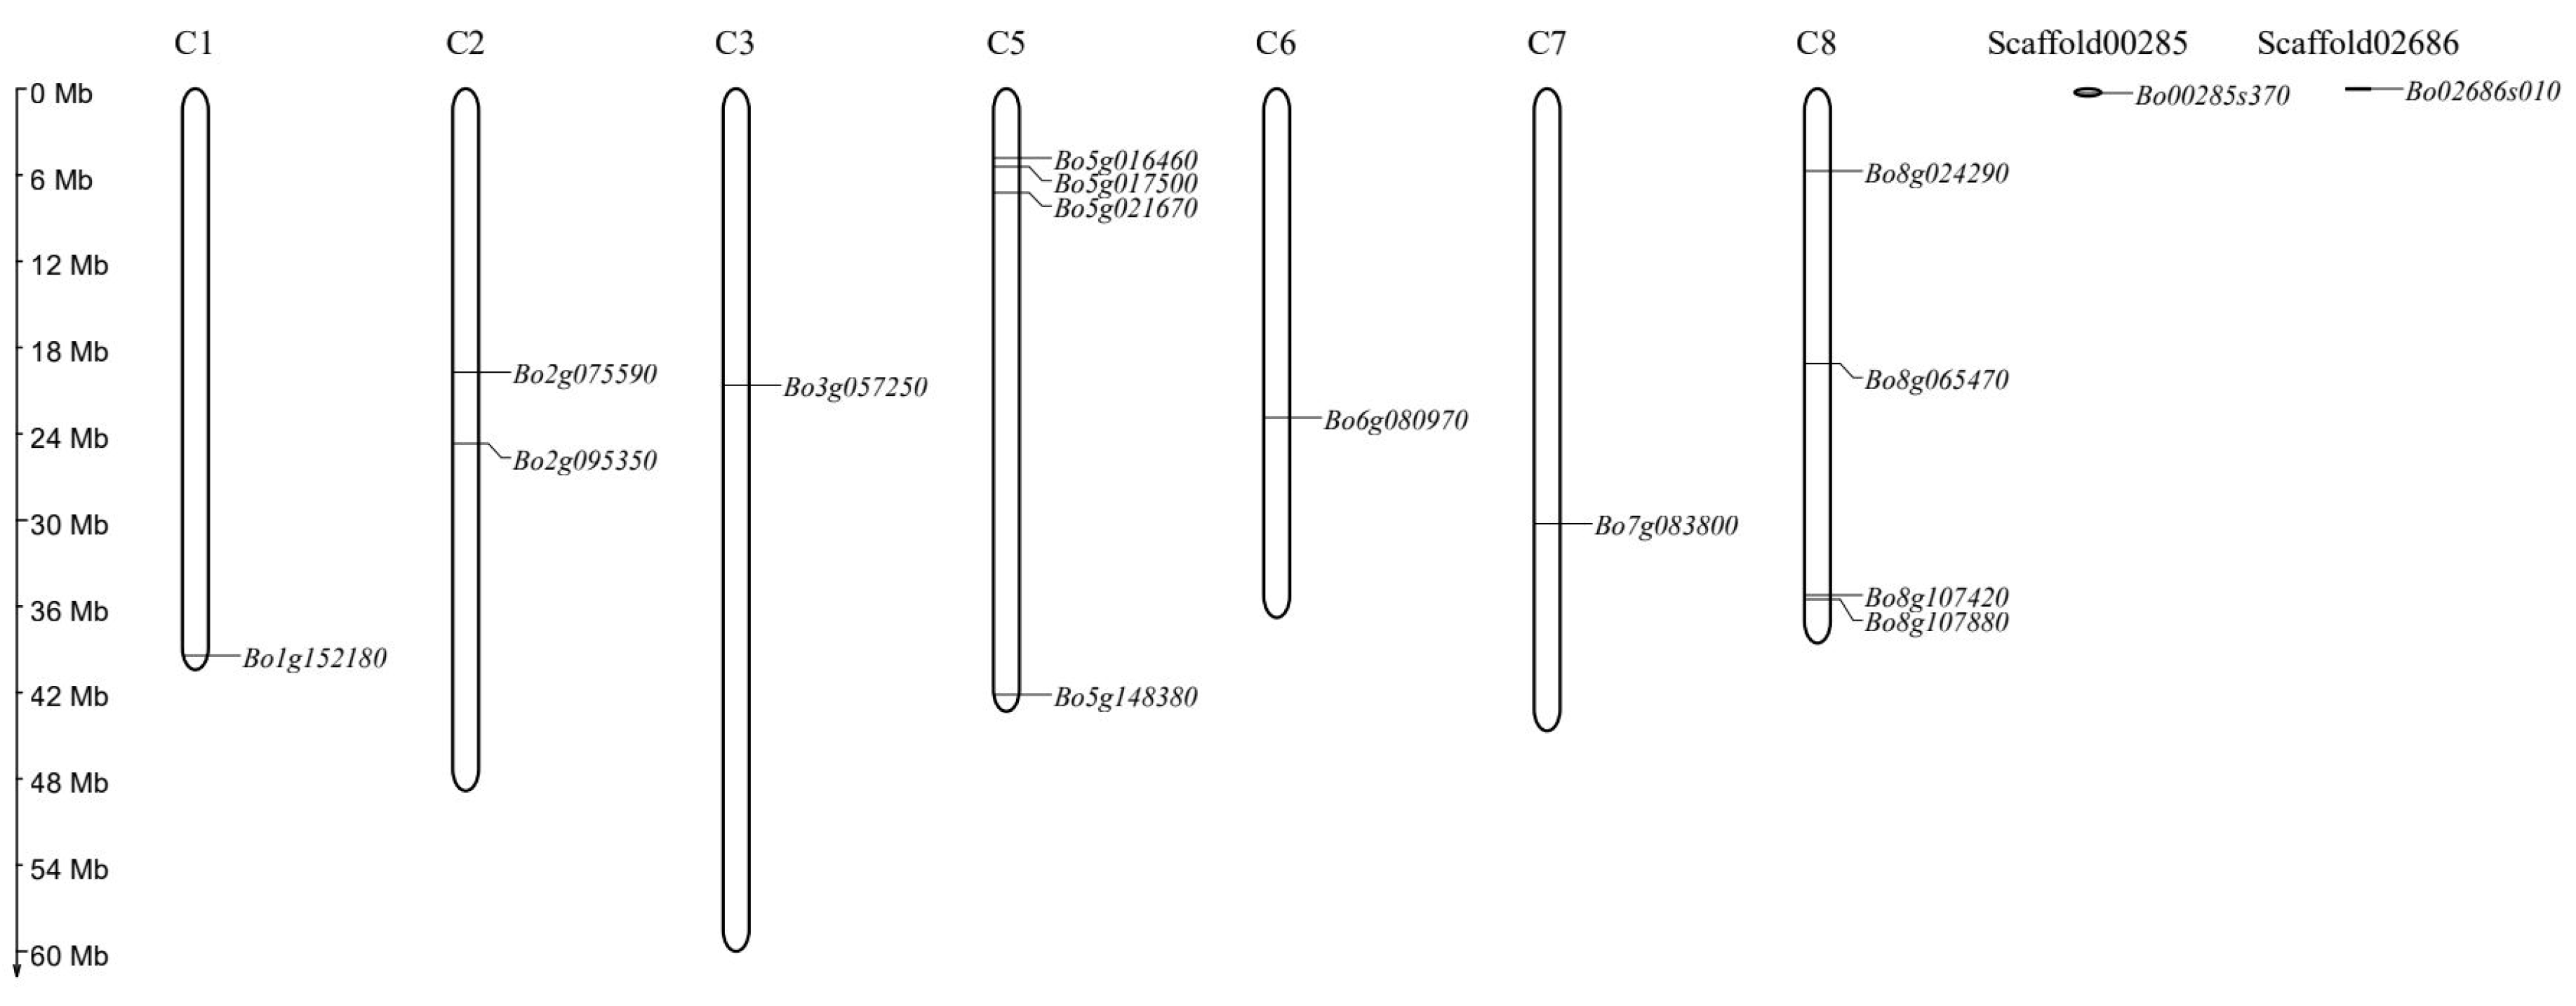
3.3. Chromosome Mapping of GAPDH Gene in B. oleracea

Through the chromosome location of the gene, the distribution of the identified BoGAPDH gene on the chromosome was detected, and it was found that the GAPDH gene family was not uniformly distributed in the B. oleracea genome. As shown in Figure 3, a total of 16 BoGAPDH genes are mapped to chromosomes C1, C2, C3, C5, C6, C7 and C8. Bo00285s370.1 and Bo02686s010.1 are located on chromosome scaffolds Scaffold00285 and Scaffold02686, respectively. Chromosomes 1, 3, 6 and 7 and Scaffold00285 and Scaffold02686 show single gene distribution; there are two genes on chromosome 2 and four genes are distributed on chromosomes 5 and 8. There are three genes on chromosome 5 and there is a small physical distance between the two genes on chromosome 8, so there may be tandem replication events.

3.4. Cis-Acting Regulatory Elements of B. oleracea GAPDH Gene

The promoter is a DNA sequence that binds to transcription factors and RNA polymerase to regulate the downstream genes of the promoter, which plays an extremely important role in gene transcriptional expression. Various response elements on the promoter are the key regions for its response to various environmental factors, such as auxin response, light response, stress response, etc. [21]. The purpose of this study is to elucidate the possible regulatory mechanism of 16 screened BoGAPDH family genes in abiotic or biological stress responses. The upstream 1.5 kb sequences of the translation initiation sites of these genes were extracted and submitted to the PLACE database for analysis and identification of cis regulatory elements in the promoter region. The results showed that the main regulatory elements detected in the 16 gene promoters included: ERELEE4: ethylene response element; IBOXCORE: light response element; MYCCONSENSUSAT: response element related to dehydration reaction and abscisic acid signal transduction in Arabidopsis; POLLENLELAT52: pollen-specific cis-acting element; WBOXATNPR1: pressure- and defense-related response element; and WRKY71OS: anti-elements related to gibberellin signaling (Figure 4).
The ERELEE4 regulatory element is related to the ripening and senescence of plant seeds and fruits, and may also be involved in the regulation of plant circadian rhythm. This element participates in the growth of tomato and plays an important role in fruit ripening. In addition, it also plays an active role in the senescence mechanism of carnation and stress response of Chilean tomato [22,23]. IBOXCORE regulatory element is a conserved sequence upstream of photoregulatory genes in monocotyledons and dicotyledons, related to photoregulated transcription. Some scholars have pointed out that the mutation of this regulatory element will seriously affect the expression of light-regulated genes in Arabidopsis, while the growth and development of plants sense the changes in light in the external environment through the light receptor and activate a series of signal transduction processes, thus flowering in time and completing the fruiting [24,25,26]. Flowering time in B. oleracea may affect subsequent pollination or the low quality of pollen may lead to a decrease in seed yield, and the molecular mechanism of this regulatory element mediating light signal to regulate flowering may have a greater impact on flowering and seed setting in B. oleracea. The MYCCONSENSUSAT regulatory element is a promoter region recognition site of the dehydration response gene rd22 in A. thaliana, and the MYC recognition site has a cis-acting element role in drought-induced rd22 gene expression. Subsequent studies have shown that the AtMYC2 protein plays a role as a transcriptional activator in ABA-inducible gene expression under drought stress in plants, and MYCCONSENSUSAT has also been reported as a cold response regulatory element in Arabidopsis [27,28,29,30,31]. POLLENLELAT52 is a pollen-specific cis-acting element that exists in the promoters of BoGAPDH family genes. Studies have demonstrated that this regulatory element is involved in the precise pollen development and tissue-specific expression of LAT52 in tomato, and can affect the transcriptional activation of LAT52 [32,33]. Other scholars have shown that the 5′-upstream region of LeMAN5 endonuclease-β-Mannanase, which is related to tomato pollen germination and pollen tube elongation, contains four copies of pollen-specific cis-acting element POLLEN1LELAT52 (AGAAA), which can be used to control pollen fertility. This physiological regulation of pollen may play an important role in the process of self-incompatibility in B. oleracea [33]. The WBOXATNPR1 regulatory element plays an important role in responding to environmental stress and enables plants to acquire disease resistance through pathogen-induced enhancement of the Arabidopsis transcription factor AtWRKY18 [34,35,36]. The WRKY71OS regulatory element is the transcriptional repressor of the gibberellin signal transduction pathway [37]. The above cis-acting element analysis showed that these B. oleracea GAPDH genes could respond to different biotic or abiotic stresses and were closely related to the development of B. oleracea pollen.

3.5. Tandem Repeat Gene Pair and Collinearity Analysis of GAPDH Family Genes in B. oleracea and A. thaliana

The expansion of plant gene family is mainly through gene fragment replication and tandem replication, so the gene copy event on the genome can be used as a reference standard to judge the degree of gene evolution. The ratio of the non-synonymous substitution rate (Ka) to the synonymous substitution rate (Ks) was calculated by KAKS software in the B. oleracea GAPDH gene family. The main screening criteria for KAKS tandem repeat gene pairs are the similarity of the latter two sequences being more than 80%, and the length of the alignment of the two sequences being more than 75% of the longer sequence [38].
We obtained 16 pairs of repetitive genes in the BoGAPDH family (Table S4). The KaKs of these 16 pairs was less than 1, indicating that their purification selection reduced the rate of amino acid change. In order to further study the replication of BoGAPDH family genes in B. oleracea, we downloaded relevant genomic information from the B. oleracea and Arabidopsis databases to find tandem repetitive gene pairs within and between genomes, and then plotted Circos maps to analyze the collinear relationship. Figure 5A is based on the chromosome location information of B. oleracea and A. thaliana and 17 pairs of tandem repeat genes selected, and the intergenomic collinearity analysis map was drawn by Circos software. The red lines indicate the collinearity of GAPDH family members between genomes. Figure 5B is an intragenomic collinearity analysis map drawn by Circos software based on the location information of nine chromosomes in the B. oleracea genome and 14 pairs of tandem repetitive genes screened. The red lines represent the collinearity of GAPDH family members in the B. oleracea genome and the different colors of the background are the collinear blocks drawn according to the collinear gene pairs in the whole genome of B. oleracea.

3.6. Expression Analysis of GAPDH Family Genes in B. oleracea

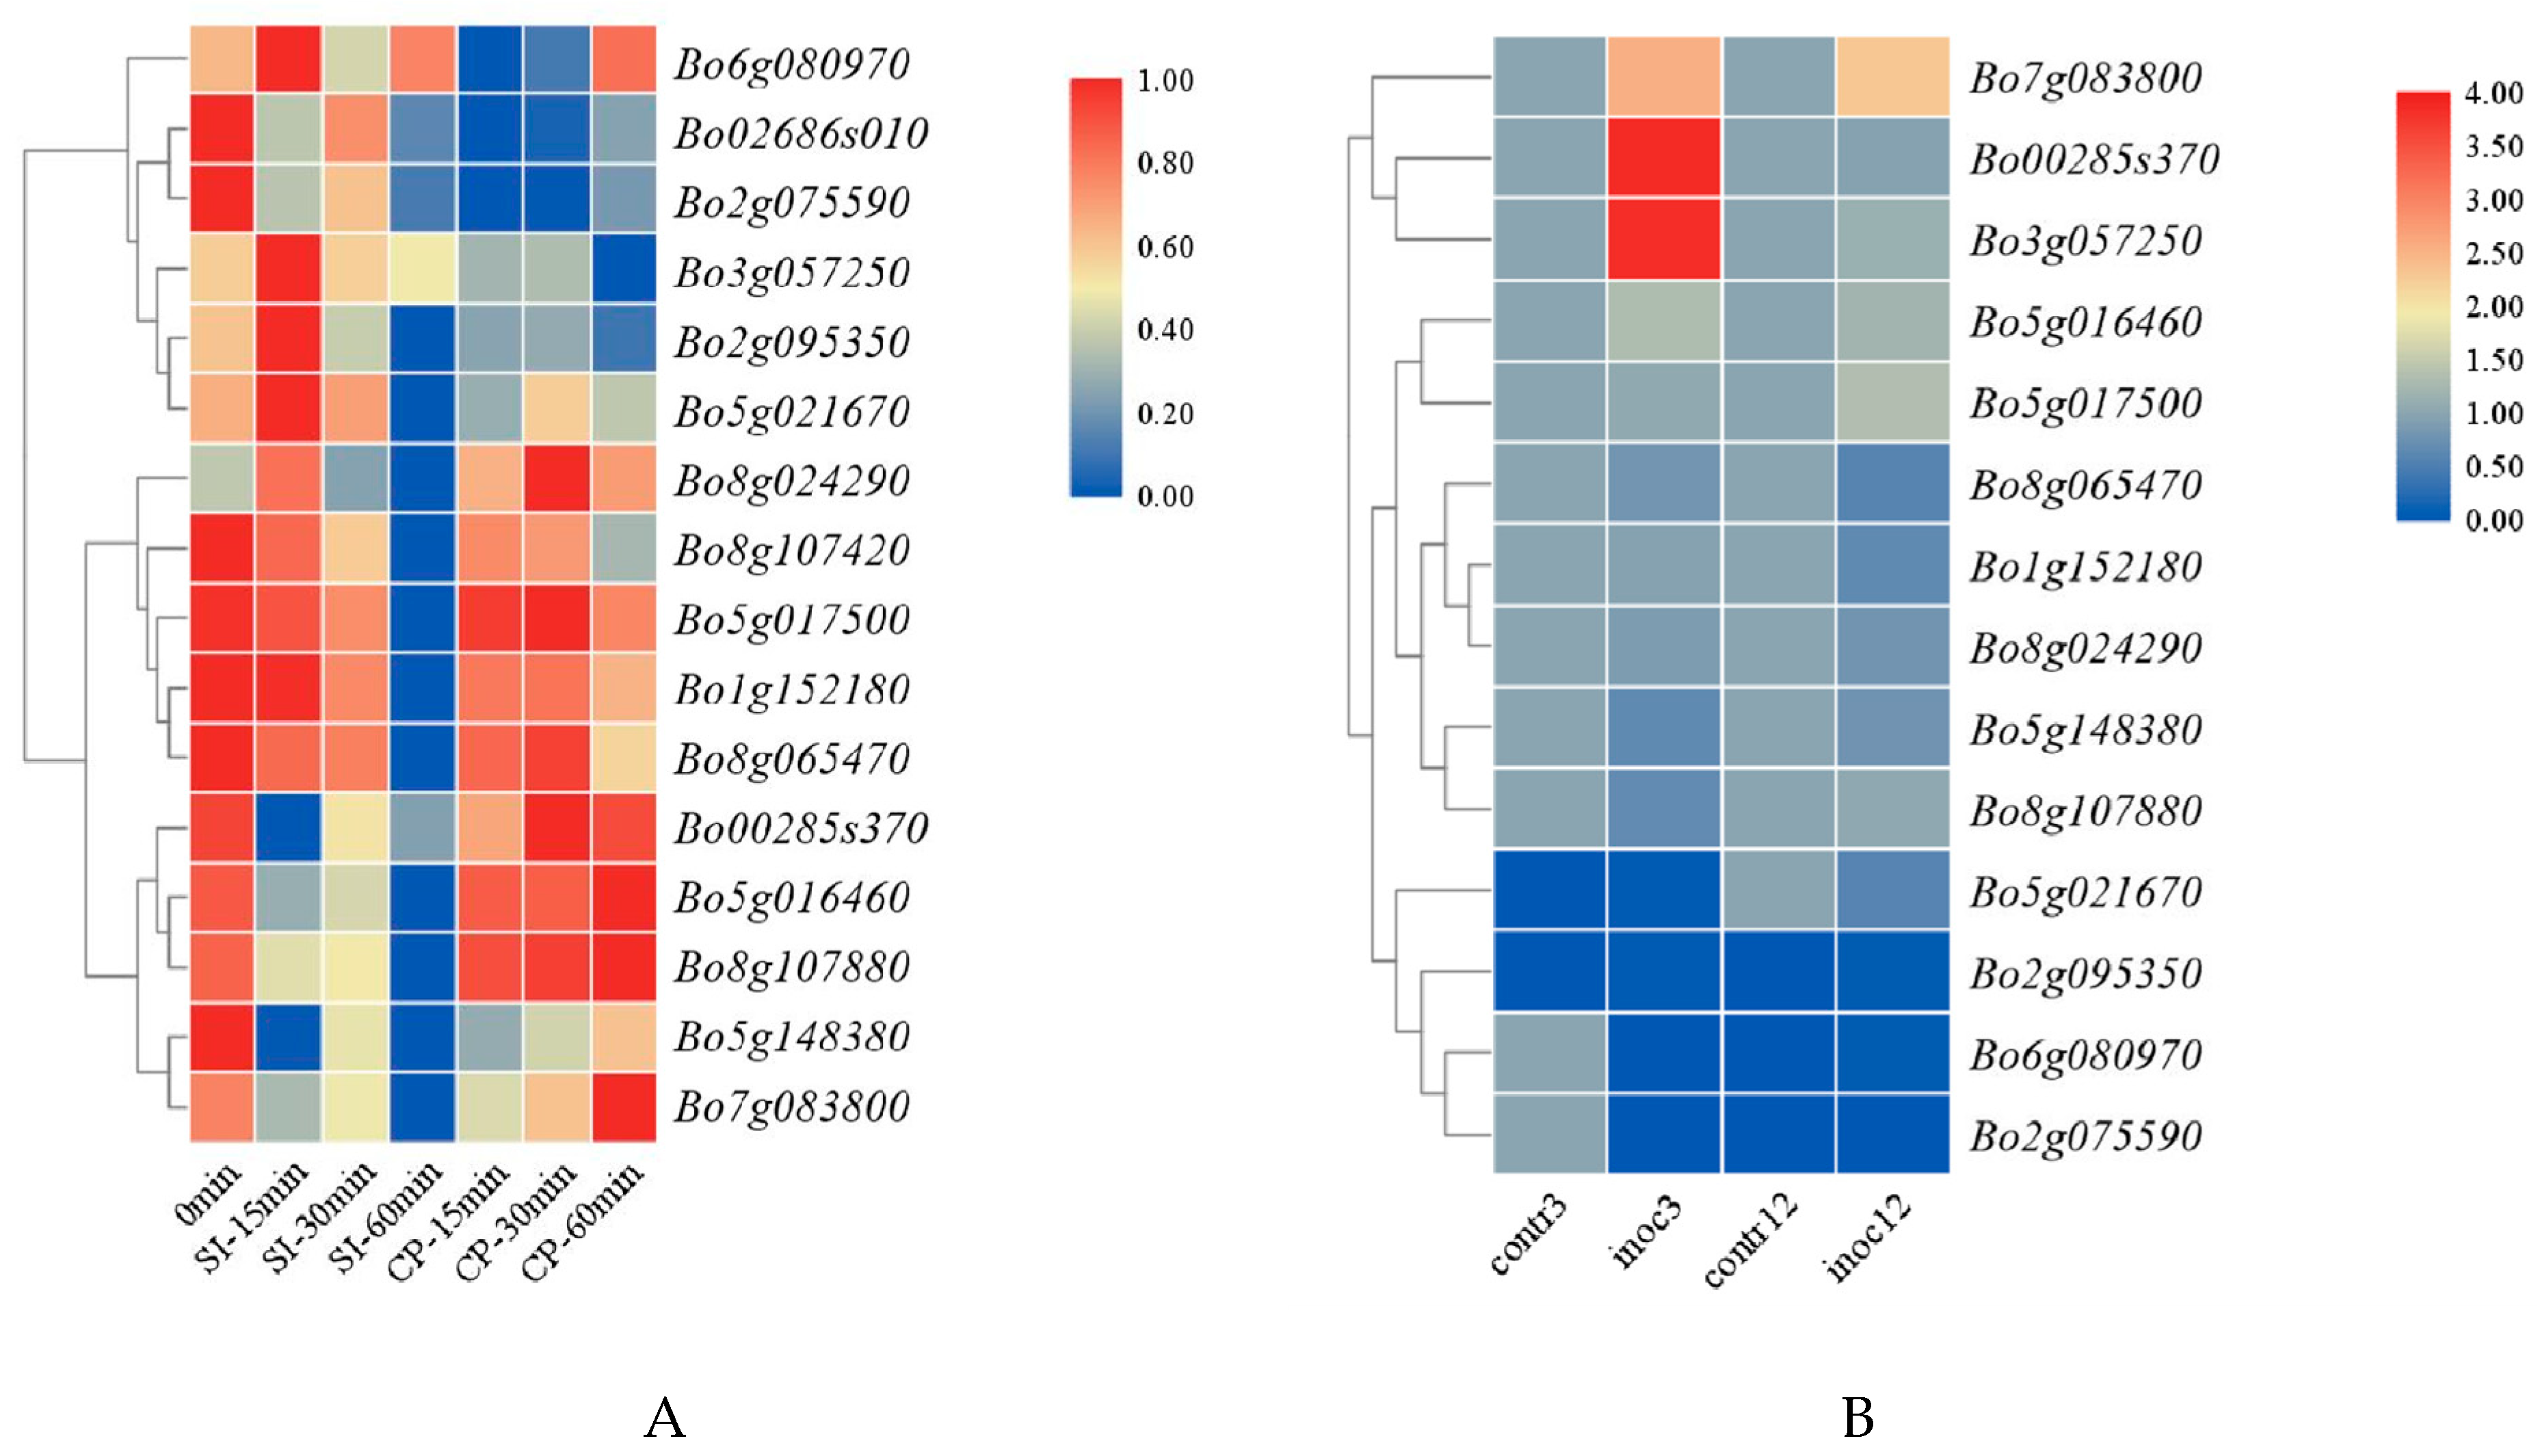
3.6.1. Expression Analysis of GAPDH Family Genes in B. oleracea during Self-Pollination and Cross-Pollination

In order to further the differential expression of GAPDH family genes in B. oleracea after self-pollination and cross-pollination, 14 genes were selected for expression analysis by qRT-PCR. As shown in Figure S2, in self-pollination 0–60 min, the expression pattern of Bo5g017500.1 and Bo8g107880.1 was first up-regulated and then down-regulated, and all other genes were down-regulated in 0–15 min, which was the critical period of SI reaction. In 30–60 min, the expressions of Bo7g083800.1, Bo1g152180.1, Bo6g080970.1, Bo02686s010.1 and Bo5g016460.1 were gradually up-regulated and then down-regulated. Bo8g065470.1 and Bo8g104720.1 were first down-regulated and then up-regulated in self-pollination 0–60 min, and generally showed a down-regulation trend, while Bo00285s370.1, Bo2g095350.1, Bo8g024290.1 and Bo5g021670.1 showed a down-regulation trend after self-pollination. In cross-pollination 0–60 min, Bo5g017500.1 and Bo8g107880.1 were up-regulated at first and then down-regulated, Bo7g083800.1 and Bo02686s010.1 were down-regulated at first and then up-regulated, Bo5g016460.1 and Bo8g024290.1 were up-regulated at first and then down-regulated and then up-regulated, but the expression of these six genes showed an up-regulation trend as a whole. The results showed that most of the genes were consistent with the results of transcriptome analysis.

3.6.2. Tissue Expression Analysis of GAPDH Gene in B. oleracea

The qRT-PCR results of B. oleracea tissue showed that most of the genes were highly expressed in stigma and sepals, and the genes highly expressed in stigma may be directly involved in the signal transduction process of stigma SI. In addition, Bo7g083800.1 was also highly expressed in pollen, Bo02686s010.1 was highly expressed in petals, Bo5g017500.1 was highly expressed in stamens and Bo8g107880.1 was highly expressed in leaves and stems (Figure S3).

3.6.3. Expression Analysis of BoGAPDH Gene in B. oleracea Transcriptome

There are 16 members of the BoGAPDH gene family, and the functions of the coding proteins are also different. This gene family not only plays an important role in glycolysis and stress resistance, but also participates in B. oleracea self-incompatibility in some way. To explore whether the genes encoding proteins in this family all have the above functions, or if only some proteins exert one function or multiple functions, we combined B. oleracea SI transcriptome data analysis and found that in the BoGAPDH family, most genes were significantly differentially expressed 60 min after self- versus cross-pollination (Figure 6A). It may be that most genes in this family are involved in the regulation of the SI pathway in B. oleracea.
The transcriptome data related to stress were searched by NCBI, and the transcriptome data of B. oleracea stressed by Xanthomonas campestris were selected (NCBI accession number is GSE107720). It was found that there were three genes differentially expressed in the BoGAPDH family on the third day of stress (Figure 6B), which were Bo00285s370.1, Bo3g057250.1 and Bo7g083800.1. On the 12th day, Bo7g083800.1 was differentially expressed, and BoGAPDH differentially expressed genes were all up-regulated. This shows that B. oleracea adapts to stress by up-regulating the coding protein expression of these three genes. BoGAPDH family genes play an important role in the process of disease resistance and stress in B. oleracea, and GAPDH family genes encode proteins with diverse functions, which do not play a single functional role during plant growth, and different genes encode proteins that carry out different physiological functions.

3.6.4. Full-Length Cloning of BoGAPC Gene

The results of Bo8g065470.1 cloning differentially expressed in SI transcriptome showed that the size of the gDNA PCR product was about 2000 bp; for cDNA PCR, the product was about 1000 bp (Figure 7). The results of sequencing showed that the length of gDNA sequence obtained by PCR amplification was 2061 bp, and cDNA sequence length was 1020 bp. Combined with NCBI alignment, it was found that it was a coding sequence of cytoplasmic glyceraldehyde 3-phosphate dehydrogenase, so the gene was named BoGAPC.

3.6.5. Protein Structure Analysis of BoGAPC

The structural characteristics of BoGAPC protein were analyzed by DNAMAN software and ExPASy ProParam online software (Figure S4). The protein consists of 339 amino acids with a relative molecular weight of 37.07 kD, a theoretical isoelectric point of pI of 5.01, a total number of positively charged and negatively charged amino acids of 0 and an instability index of 45.88. It belongs to an unstable protein with a short half-life and a fat index of 26.37. The hydrophobicity index was 0.747, and the prediction of subcellular localization of the protein showed that it was located in the cytoplasm, so the protein may be a hydrophilic protein. The protein has two N-glycosylation sites, but it does not contain any signal peptide or a transmembrane helix region, and it is not a membrane protein or secretory protein, so it will not be glycosylated, although there are potential glycosylation sites. In this protein, 15 serine (Ser), 10 threonine (Thr) and 3 tyrosine (Tyr) may be protein kinase phosphorylation sites. The protein contains a conserved domain of Gp_dh_N, which is located between the amino acid residues of 7157 amino acid. The three-dimensional structure prediction of BoGAPC was obtained by using the online website Expasy (https://swissmodel.expasy.org/ (accessed on 21 May 2020)) (Figure S5).

3.6.6. Protein Evolution Analysis of BoGAPC

Phylogenetic tree construction of BoGAPC with corresponding protein amino acid sequences within other species using Mega x software revealed that BoGAPC is the closest related relative to BnGAPC in oilseed rape and the furthest related to AtGAPC (Figure S6). In order to clarify the homology of GAPC proteins among different species, we compared them with rape BnGAPC, turnip BrGAPC, A. thaliana AtGAPC, dicotyledonous Solanaceae tomato SlGAPC, monocotyledonous Gramineae rice OsGAPC and maize ZmGAPC. The results showed that there was a relatively conserved protein fragment between monocotyledonous and dicotyledonous species, that is, the conserved domain of Gp_dh_N (Figure S7).

3.6.7. Expression Analysis of BoGAPC Gene

The expression of BoGAPC was detected by qRT-PCR at various time periods after different pollination treatments in kale, and the results indicated that the gene was in a down-regulated expression mode from 0 to 1 h after self-pollination, thus suggesting that the apparent down-regulation of the gene after self-pollination may be in response to the signal of self-incompatibility, and the down-regulation of BoGAPC expression within 1 h of self-pollination may be the result of the onset of SI response. By combining the subsequent results that the protein encoding this gene may interact with SRK, a key factor of SI response, BoGAPC may negatively regulate the occurrence of SI response in kale by interacting with SRK. The expression of this gene was found to be the highest in the stigma, followed by the sepals, and the process of self-incompatibility in kale is that the self-pollen falls on the stigma, and the stigma generates rejection resistance, resulting in the inability of the self-pollen to hydrate or germinate. The expression of this gene is the lowest in the pollen, which produces a tenfold difference from the expression in the stigma. This is consistent with the pattern of self-incompatibility (Figure 8).

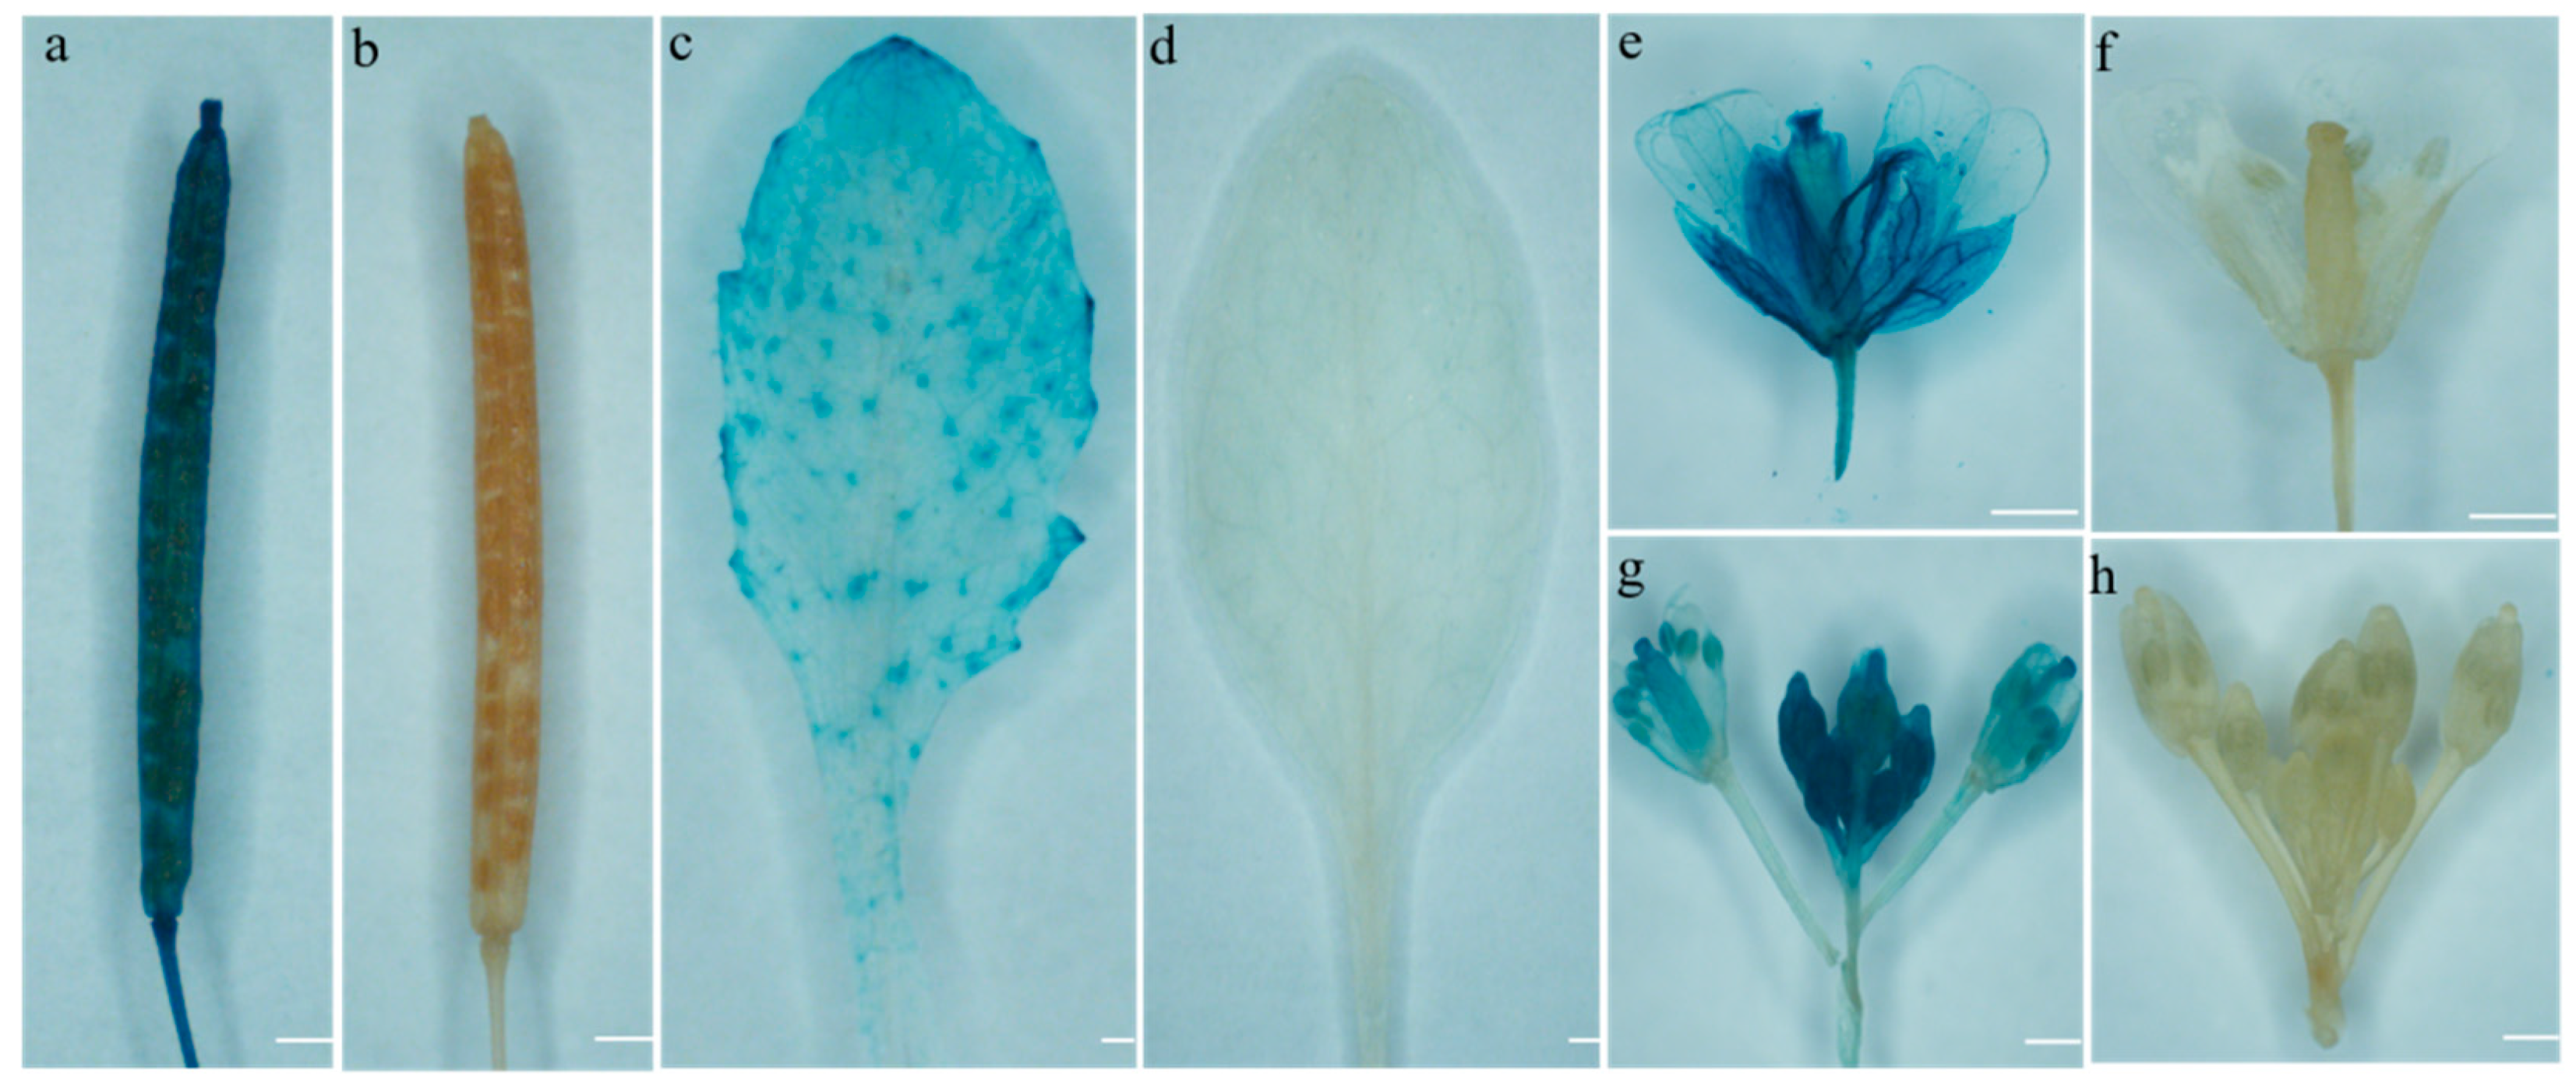
3.6.8. Analysis of the Specificity of the Promoter of the BoGAPC Gene

Through the analysis of the BoGAPC promoter region, several elements were found: abscisic acid response element, gibberellin response element, ethylene response element, light response element, defense response element, flower-specific cis-acting element, carbon metabolism-related element and so on (Table S5). These findings indicate that this gene, in addition to playing an important role in carbon metabolism, is involved in other physiological processes through a variety of cis-acting elements in addition to hormone response elements and multiple specific acting elements involved in floral organ development. This gene may also be involved in SI through plant hormone response elements as well as pollen-specific acting elements.
In order to see more intuitive results of promoter analysis in plant tissues, we constructed an expression vector with β-glucuronidase (GUS) as a reporter gene promoter. The successfully constructed BoGAPC-pCAMBIA1391 binary expression vector was transformed into A. thaliana by inflorescence infection to obtain transgenic plants. After screening to homozygous, leaves, petals, buds and pods were immersed in GUS dye solution and stained at 37 °C. After staining, the plants were decolorized with ethanol, and the wild type A. thaliana with the same growth was selected as the control. As shown in Figure 9, BoGAPC was highly expressed in pods, sepals and stigmas, higher at the top and base of pods than in shells, lower in leaves and petals and mainly at the edge of leaves (Figure 9).

3.6.9. Subcellular Localization of BoGAPC

By constructing the BoGAPC-PAN fusion expression vector and transferring it into the protoplasts of A. thaliana, it was found that BoPGAPC was obviously located in the cytoplasm and belonged to the active protein in the cytoplasm, which was consistent with the characteristics of no signal peptide and transmembrane domain of the protein (Figure 10).

3.6.10. Prokaryotic Expression of BoGAPC

The protein expressed by the recombinant strain linked to BoGAPC and pGEX-4T-1 was purified by beaver GST fusion protein, and the expression of the target protein was detected by SDS-PAGE electrophoresis (Figure 11). From left to right, there are protein markers. Lane 1 is uninduced pGEX-4T-1-BoGAPC protein, lane 2 is induced unpurified pGEX-4T-1-BoGAPC protein, lane 3 is induced purified pGEX-4T-1-BoGAPC protein and lane 4 is induced purified empty protein. The size of the protein expressed in empty pGEX-4T-1 was about 26 kD, and the protein band in lane 3 was about 65 kD. The predicted size of BoGAPC protein was about 37 kD, and the size of the fusion protein was about 63 kD. The size of the target protein was consistent with the predicted results, indicating that the pGEX-4T-1-GAPC fusion protein was successfully induced in prokaryotic cells.

3.6.11. Interaction between BoGAPC and BoSRKj

After successful ligation of BoSRKj and pGBKT7 yeast expression vector, the plasmid was extracted for self-activation detection. Under the premise of no self-activation, yeast two-hybrid was used to determine the interaction between BoGAPC and BoSRK kinase domain. The results of yeast double hybrid showed that the experimental group (pGADT7-BoGAPC × pGBKT7-BoSRKj), the negative control group (pGADT7-T × pGBDT7-Lam) and the positive control group (pGADT7-T × pGBDT7-53) were transformed into yeast-receptive cells and coated on SD/-Trp/-Leu plate. After 3 days of inverted culture at 30 °C, leukoplakia grew in both the experimental group and the positive control group, while the plaque in the negative control group was red (Figure 12A). The plaque of the experimental group was detected by PCR to expand the target band, indicating that the recombinant plasmid was transformed into the yeast cells. The next steps were to dilute the single spot on the second plate with sterile water 100 times and apply it to the SD/-Trp/Leu/-His/Ade plate, and invert it for 3–5 days. We found that both the experimental group and the positive control can be on the plate. The negative control cannot grow normally, indicating that there is an interaction between BoSRKj and BoGAPC.
The interaction between BoGAPC and BoSRKj was verified by in vitro GST pull-down (Figure 12B).

4. Discussion

4.1. Members of GAPDH Family Participate in Plant Stress Resistance

When GAPC gene mutation occurs in A. thaliana, there are fertility defects, changes in embryonic development and morphological changes in long-horned fruit. Abortion and empty embryo sacs are shown in the basal and apical pods, respectively, which changes the development of seeds and fruits, and significantly reduces the seed setting rate [39]. When GAPC is inhibited in Brassica rape, it may affect tapetum and microspore development, thus causing abortion in rapeseed [40]. In A. thaliana, cytoplasmic GAPDH (GAPC) can be ubiquitinated by E3 ubiquitin protein ligase SINAL7 in vitro, changing its catalytic activity, while E3 ubiquitin protein ligase is associated with various biological processes, such as cell cycle control and regulation of multiple developmental pathways [41,42,43,44]. GAPDH also plays the role of multifunctional protein in plant abiotic stress and plant fertility [45]. Recent studies have shown that overexpression of OsGAPB in rice under low light stress increases stress tolerance and reduces the effect of low yield caused by low light stress [46]. The expression of PPN2 gene in yeast is controlled by the strong constitutive promoter of glyceraldehyde 3-phosphate dehydrogenase gene (PKG1), resulting in a significant increase in cobalt/zinc ion-stimulated cohesive phosphatase activity, and cells overexpressing PPN2 are more resistant to peroxides and alkali [47]. TaGAPC5/6 genes were found to respond positively to drought stress through reactive oxygen species (ROS) scavenging and stomatal movement in wheat. The results of the study demonstrated that a new positive regulatory mechanism of TaGAPC could help wheat fine-tune its drought response. In addition, some scholars identified MYB binding sites (AACTAAA/C) in the promoter sequences of GAPCp2 and GAPCp3 identified as a key cis-element in response to drought stress [48,49]. In the analysis of the GAPDH gene family in sweet orange (umbilical orange), the GO analysis results of genes interacting with CsGAPDHs indicated that CsGAPDHs might be involved in the response to inorganic substances. Under the condition of phosphorus deficiency, CsGAPDH3 and CsGAPDH 6 were down-regulated and up-regulated, respectively, suggesting that GAPDHs play a role in some phosphorus-related processes [50].
Plants adapt to adversity by up- or down-regulating GAPDH, and B. oleracea undergoes the same process of self-incompatibility in response to adversity generated by stigma rejection of autogamous pollen. The self-incompatibility transcriptome of B. oleracea showed that most members of the gene family showed a down-regulated expression trend during self-pollination. In the transcriptome data of B. oleracea under Xanthomonas campestris stress, BoGAPDH differentially expressed genes were up-regulated to adapt to bacterial stress. Analysis of BoGAPDH family expression during self-pollination and cross-pollination showed that most members of this gene family responded to adversity by down-regulating expression during the self-pollination phase, and this result was consistent with the B. oleracea transcriptome data.

4.2. Replication and Evolution of GAPDH Gene in B. oleracea

GAPDH family genes have been identified in many species, including A. thaliana, sweet orange (navel orange), rice, cassava, wheat, etc., indicating that the GAPDH family mainly plays a role in plant abiotic stress tolerance [11,50,51,52]. At present, there is no research report on B. oleracea GAPDH family genes. In this study, 16 B. oleracea GAPDH genes and 12 Arabidopsis GAPDH genes were identified in B. oleracea and A. thaliana genome databases. The phylogenetic relationships of BoGAPDH genes in B. oleracea, Arabidopsis, turnip, Brassica napus, maize, rice and tomato were systematically analyzed and compared. The analysis of conserved motif and gene structure revealed the evolutionary relationship, gene expansion and functional diversity of the GAPDH gene family in B. oleracea. Chromosome mapping and collinearity analysis showed that the GAPDH family members in B. oleracea genome and between B. oleracea and Arabidopsis genomes reduced the rate of amino acid change during long-term evolution; the genes were relatively conserved, and these genes may be amplified by the same ancestor gene. A large number of cis-acting elements related to pollen specificity, hormone regulation and dehydration were found in the promoter of BoGAPDH family genes, which further proved that these genes play an important role in the regulation of plant development and abiotic stress. Plant SI may be related to plant stress resistance in evolution. This study provides a targeted basis for the selection of genes for follow-up study of B. oleracea SI response.

4.3. BoGAPC May Be Involved in Self-Incompatibility Signal Transduction in B. oleracea

In A. thaliana, GAPDH (GAPC) can be ubiquitinated by E3 ubiquitin protein ligase SINAL7 in vitro, changing its catalytic activity, while E3 ubiquitin protein ligase is associated with various biological processes, such as cell cycle control and regulation of multiple developmental pathways [41,42,43,44]. ARC1 is a typical E3 ubiquitin ligase in B. oleracea self-incompatibility, which plays an important role in the signal process of self-incompatibility. At the same time, PUB protein and ARC1 belong to E3 ubiquitin ligase, which may lead to self-incompatibility by negative regulation of pollen germination or interaction with SRK during B. oleracea self-incompatibility [53,54,55]. E3 ubiquitin ligase plays an important role in B. oleracea self-incompatibility, and BoGAPC may be involved in B. oleracea self-incompatibility by interacting with E3 ubiquitin ligase or producing other biological stress responses.
In this study, most of the BoGAPDH family genes were down-regulated in 0–60 min of self-pollination, and highly expressed in stigma and sepals, which may be directly involved in SI signal transduction in stigma, resulting in down-regulation of expression. BoGAPDH is a small gene family; most of the genes in the SI response exhibit the same expression pattern and may be involved in SI through the same mode of action, and the other physiological functions this gene family remain of significant research value. BoGAPC was down-regulated within 1 h after self-pollination. Plant tissue fluorescence quantitative analysis showed that the expression of this gene was the highest in stigma, followed by sepals, and the lowest in pollen. The quantitative results of tissue expression were consistent with the results of GUS staining. Through cis element analysis of the promoter region of the gene, it was found that the gene not only had stress response elements and plant hormone response elements, but also had a variety of specific elements regulating the development of floral organs. Subcellular localization showed that the BoGAPC protein was located in the cytoplasm, and the prokaryotic expression results showed that the size of BoGAPC protein was about 37 kD, which was consistent with the expected results, indicating that the protein was induced to be expressed in prokaryotic cells.
The results of yeast two-hybrid and GST pull-down showed that the SRK kinase domain interacted with BoGAPC protein, which further proved that it could participate in SI through direct interaction with SRK. B. oleracea self-incompatibility is genetically controlled by an S-locus gene with polymorphisms, SLG, with SRK being the two S alleles segregating at the S-locus. SRK is a key self-incompatibility factor in Brassica, and the traditional theory of self-incompatibility is based on the interaction of SLG–SRK–ARC1 trios that transduces self-incompatibility signaling downstream to cause stigma cells to become deficient in self-pollen and fail to germinate, leading to the occurrence of self-incompatibility reactions. SRK plays a critical role throughout the signaling process by serving as the binding region for the C-terminal arm repeat region of the downstream substrate ARC1, the current international frontiers in SI signaling. The ARC1 protein is not the only downstream signaling element of SRK—there are still many unknown signaling elements involved in the self-incompatibility signaling process [56]. Our experimental results show that BoGAPC protein can interact with the SRK kinase domain, indicating that the protein may participate in SI through direct interaction with SRK and play an important role in SI signal transduction.
According to the above results, it is inferred that BoGAPC may be a gene involved in the process of self-incompatibility in B. oleracea.

5. Conclusions

In this study, we analyzed the evolution, structure, promoters and collinearity of 16 members of B. oleracea BoGAPDH protein family, and analyzed the expression pattern of the genes encoded by this family protein after self-incompatibility. The results showed that the family protein was evolutionarily conservative and played an important role in stress resistance. Through the cloning and expression analysis of the gene encoded by BoGAPC protein, we found that BoGAPC may respond to the self-incompatibility signal by interacting with BoSRK.

Supplementary Materials

The following are available online at https://www.mdpi.com/article/10.3390/genes12111719/s1. Figure S1: The sequence logos of GAPDH family genes in B. oleracea. Figure S2: BoGAPDH expression analysis after pollination. The black column indicates compatible pollination, and the gray column indicates incompatible pollination. The pollination period is 0 min, 15 min, 30 min, 60 min. Figure S3: Tissue Expression Analysis of BoGAPDH. B. oleracea tissue includes leaves, sepal, pollen, petals, stigma, bud, stem and stamen. Figure S4: BoGAPC cDNA and its amino acid sequence. The first row represents the sequence of the bases, and the second row represents the amino acids corresponding to the bases, the underlined part is the conservative domain of Gp_dh_N. Figure S5: Prediction of three-dimensional structure of BoGAPC protein. Figure S6: Phylogenetic tree of BoGAPC and other species GAPC protein. Figure S7: Alignment of BoGAPC of B. oleracea with homologous proteins of other species. Black: amino acid identity 100%; pink: amino acid identity 75%; blue: amino acid identity 50%, the underlined part is the conservative domain of Gp_dh_N. Table S1: Primers used in gene cloning. Table S2: Primers used in RT-PCR. Table S3: Conservative domains and amino acids of GAPDH family genes in B. oleracea. Table S4: KaKa analysis. Table S5: Cis-elements in the upstream regulation region of BoGAPC. Supplementary Material S1: Materials and Methods.

Author Contributions

Conceptualization, L.Z.; methodology, H.Z., Q.L., T.Z. and Q.X.; validation, Q.X. and D.H.; formal analysis, Q.X., Y.Z. and H.Z.; resources, Q.L., S.Z. and Y.L.; data curation, Q.X.; writing—original draft preparation, Q.X. and H.Z.; writing—review and editing, Q.X.; supervision, H.Z. and Y.Z. All authors have read and agreed to the published version of the manuscript.

Funding

This study was supported by the National Natural Science Foundation of China (31572127) and the Fundamental Research Funds for the Central Universities (XDJK2020D024).

Institutional Review Board Statement

Not applicable.

Informed Consent Statement

Not applicable.

Data Availability Statement

This manuscript includes the essential data either as figures or as Supplementary Materials. Publicly available datasets were analyzed in this study. This data can be found at https://www.ncbi.nlm.nih.gov/GSE107720 (accessed on 9 May 2020).

Acknowledgments

We thank the Institute of Cruciferae of Southwest University, Chongqing, China, for providing us with Brassica oleracea materials.

Conflicts of Interest

The authors declare no conflict of interest. The funders had no role in the design of the study; in the collection, analyses or interpretation of data; in the writing of the manuscript, or in the decision to publish the results.

References

  1. Fujii, S.; Kubo, K.; Takayama, S. Non-self- and self-recognition models in plant self-incompatibility. Nat. Plants 2016, 2, 16130. [Google Scholar] [CrossRef] [PubMed]
  2. Petersen, J.; Brinkmann, H.; Cerff, R. Origin, evolution, and metabolic role of a novel glycolytic GAPDH enzyme recruited by land plant plastids. J. Mol. Evol. 2003, 57, 16–26. [Google Scholar] [CrossRef]
  3. Pelah, D.; Shoseyov, O.; Altman, A.; Bartels, D. Water-stress response in Aspen (Populus tremula): Differential accumulation of dehydrin, sucrose synthase, GAPDH homologues, and soluble sugars. J. Plant Physiol. 1997, 151, 96–100. [Google Scholar] [CrossRef]
  4. Yang, Y.; Kwon, H.B.; Peng, H.P.; Shih, M.C. Stress responses and metabolic regulation of glyceraldehyde-3-phosphate dehydrogenase genes in Arabidopsis. Plant Physiol. 1993, 101, 209–216. [Google Scholar] [CrossRef] [PubMed] [Green Version]
  5. Guo, L.; Devaiah, S.P.; Narasimhan, R.; Pan, X.; Zhang, Y.; Zhang, W.; Wang, X. Cytosolic glyceraldehyde-3-phosphate dehydrogenases interact with phospholipase Ddelta to transduce hydrogen peroxide signals in the Arabidopsis response to stress. Plant Cell 2012, 24, 2200–2212. [Google Scholar] [CrossRef] [Green Version]
  6. Guo, L.; Ma, F.; Wei, F.; Fanella, B.; Allen, D.K.; Wang, X. Cytosolic phosphorylating glyceraldehyde-3-phosphate dehydrogenases affect Arabidopsis cellular metabolism and promote seed oil accumulation. Plant Cell 2014, 26, 3023–3035. [Google Scholar] [CrossRef] [Green Version]
  7. Kim, S.C.; Guo, L.; Wang, X. Phosphatidic acid binds to cytosolic glyceraldehyde-3-phosphate dehydrogenase and promotes its cleavage in Arabidopsis. J. Biol. Chem. 2013, 288, 11834–11844. [Google Scholar] [CrossRef] [PubMed] [Green Version]
  8. Zhang, X.H.; Rao, X.L.; Shi, H.T.; Li, R.J.; Lu, Y.T. Overexpression of a cytosolic glyceraldehyde-3-phosphate dehydrogenase gene OsGAPC3 confers salt tolerance in rice. Plant Cell Tiss. Org. 2011, 107, 1–11. [Google Scholar] [CrossRef]
  9. Wawer, I. Regulation of Nicotiana tabacum osmotic stress-activated protein kinase and its cellular partner GAPDH by nitric oxide in response to salinity. Biochem. J. 2010, 429, 73–83. [Google Scholar] [CrossRef] [PubMed] [Green Version]
  10. Manjunath, S.; Sachs, M.M. Molecular characterization and promoter analysis of the maize cytosolic glyceraldehyde 3-phosphate dehydrogenase gene family and its expression during anoxia. Plant Mol. Biol. 1997, 33, 97–112. [Google Scholar] [CrossRef] [PubMed]
  11. Zeng, L.; Deng, R.; Guo, Z.; Yang, S.; Deng, X. Genome-wide identification and characterization of Glyceraldehyde-3-phosphate dehydrogenase genes family in wheat (Triticum aestivum). BMC Genom. 2016, 17, 240. [Google Scholar] [CrossRef] [PubMed] [Green Version]
  12. Zhang, L.; Xu, Z.; Ji, H.; Zhou, Y.; Yang, S. TaWRKY40 transcription factor positively regulate the expression of TaGAPC1 to enhance drought tolerance. BMC Genom. 2019, 20, 795. [Google Scholar] [CrossRef] [PubMed] [Green Version]
  13. Rius, S.P.; Casati, P.; Iglesias, A.A.; Gomez-Casati, D.F. Characterization of an A. thaliana mutant lacking a cytosolic non-phosphorylating glyceraldehyde-3-phosphate dehydrogenase. Plant Mol. Biol. 2006, 61, 945–957. [Google Scholar] [CrossRef] [PubMed]
  14. Munoz-Bertomeu, J.; Bermudez, M.A.; Segura, J.; Ros, R. Arabidopsis plants deficient in plastidial glyceraldehyde-3-phosphate dehydrogenase show alterations in abscisic acid (ABA) signal transduction: Interaction between ABA and primary metabolism. J. Exp. Bot. 2011, 62, 1229–1239. [Google Scholar] [CrossRef] [PubMed] [Green Version]
  15. Doucet, J.; Lee, H.K.; Goring, D.R. Pollen Acceptance or Rejection: A Tale of Two Pathways. Trends Plant Sci. 2016, 21, 1058–1067. [Google Scholar] [CrossRef] [PubMed]
  16. Dickinson, H. Dry Stigmas, Water and Self-Incompatibility in Brassica. Sex. Plant Reprod. 1995, 8, 1–10. [Google Scholar] [CrossRef]
  17. Haque, T.; Eaves, D.J.; Lin, Z.; Zampronio, C.G.; Cooper, H.J.; Bosch, M.; Smirnoff, N.; Franklin-Tong, V.E. Self-incompatibility triggers irreversible oxidative modification of proteins in incompatible pollen. Plant Physiol. 2020, 183, 1391–1404. [Google Scholar] [CrossRef] [PubMed] [Green Version]
  18. Lin, Z.; Xie, F.; Trivino, M.; Karimi, M.; Bosch, M.; Franklin-Tong, V.E.; Nowack, M.K. Ectopic expression of a self-incompatibility module triggers growth arrest and cell death in vegetative cells. Plant Physiol. 2020, 183, 1765–1779. [Google Scholar] [CrossRef]
  19. Scheibe, R.; Baalmann, E.; Backhausen, J.E.; Rak, C.; Vetter, S. C-terminal truncation of spinach chloroplast NAD(P)-dependent glyceraldehyde-3-phosphate dehydrogenase prevents inactivation and reaggregation. Biochim. Biophys. Acta 1996, 1296, 228–234. [Google Scholar] [CrossRef]
  20. Lozano, R.; Hamblin, M.T.; Prochnik, S.; Jannink, J.L. Identification and distribution of the NBS-LRR gene family in the Cassava genome. BMC Genom. 2015, 16, 360. [Google Scholar] [CrossRef] [Green Version]
  21. Lu, R.; Liu, D.; Ge, F.; Chen, C. Transient expression analysis of squalene epoxidase gene (SE) promoter of Panax notoginseng. Acta Physiol. Sin. 2015, 51, 495–500. [Google Scholar]
  22. Itzhaki, H.; Maxson, J.M.; Woodson, W.R. An ethylene-responsive enhancer element is involved in the senescence-related expression of the carnation glutathione-S-transferase (GST1) gene. Proc. Natl. Acad. Sci. USA 1994, 91, 8925–8929. [Google Scholar] [CrossRef] [Green Version]
  23. Montgomery, J.; Goldman, S.; Deikman, J.; Margossian, L.; Fischer, R.L. Identification of an ethylene-responsive region in the promoter of a fruit ripening gene. Proc. Natl. Acad. Sci. USA 1993, 90, 5939–5943. [Google Scholar] [CrossRef] [Green Version]
  24. Donald, R.G.; Cashmore, A.R. Mutation of either G box or I box sequences profoundly affects expression from the Arabidopsis rbcS-1A promoter. EMBO J. 1990, 9, 1717–1726. [Google Scholar] [CrossRef]
  25. Rose, A.; Meier, I.; Wienand, U. The tomato I-box binding factor LeMYBI is a member of a novel class of myb-like proteins. Plant J. 1999, 20, 641–652. [Google Scholar] [CrossRef] [Green Version]
  26. Giuliano, G.; Pichersky, E.; Malik, V.S.; Timko, M.P.; Scolnik, P.A.; Cashmore, A.R. An evolutionarily conserved protein binding sequence upstream of a plant light-regulated gene. Proc. Natl. Acad. Sci. USA 1988, 85, 7089–7093. [Google Scholar] [CrossRef] [PubMed] [Green Version]
  27. Abe, H.; Urao, T.; Ito, T.; Seki, M.; Shinozaki, K.; Yamaguchi-Shinozaki, K. Arabidopsis AtMYC2 (bHLH) and AtMYB2 (MYB) function as transcriptional activators in abscisic acid signaling. Plant Cell 2003, 15, 63–78. [Google Scholar] [CrossRef] [Green Version]
  28. Agarwal, M.; Hao, Y.; Kapoor, A.; Dong, C.H.; Fujii, H.; Zheng, X.; Zhu, J.K. A R2R3 type MYB transcription factor is involved in the cold regulation of CBF genes and in acquired freezing tolerance. J. Biol. Chem. 2006, 281, 37636–37645. [Google Scholar] [CrossRef] [Green Version]
  29. Chinnusamy, V.; Ohta, M.; Kanrar, S.; Lee, B.H.; Hong, X.; Agarwal, M.; Zhu, J.K. ICE1: A regulator of cold-induced transcriptome and freezing tolerance in Arabidopsis. Genes Dev. 2003, 17, 1043–1054. [Google Scholar] [CrossRef] [PubMed] [Green Version]
  30. Hartmann, U.; Sagasser, M.; Mehrtens, F.; Stracke, R.; Weisshaar, B. Differential combinatorial interactions of cis-acting elements recognized by R2R3-MYB, BZIP, and BHLH factors control light-responsive and tissue-specific activation of phenylpropanoid biosynthesis genes. Plant Mol. Biol. 2005, 57, 155–171. [Google Scholar] [CrossRef] [Green Version]
  31. Lee, B.H.; Henderson, D.A.; Zhu, J.K. The Arabidopsis cold-responsive transcriptome and its regulation by ICE1. Plant Cell 2005, 17, 3155–3175. [Google Scholar] [CrossRef] [PubMed] [Green Version]
  32. Bate, N.; Twell, D. Functional architecture of a late pollen promoter: Pollen-specific transcription is developmentally regulated by multiple stage-specific and co-dependent activator elements. Plant Mol. Biol. 1998, 37, 859–869. [Google Scholar] [CrossRef]
  33. Filichkin, S.A.; Leonard, J.M.; Monteros, A.; Liu, P.P.; Nonogaki, H. A novel endo-beta-mannanase gene in tomato LeMAN5 is associated with anther and pollen development. Plant Physiol. 2004, 134, 1080–1087. [Google Scholar] [CrossRef] [PubMed] [Green Version]
  34. Chen, C.; Chen, Z. Potentiation of developmentally regulated plant defense response by AtWRKY18, a pathogen-induced Arabidopsis transcription factor. Plant Physiol. 2002, 129, 706–716. [Google Scholar] [CrossRef] [Green Version]
  35. Chen, W. Expression profile matrix of Arabidopsis transcription factor genes suggests their putative functions in response to environmental stresses. Plant Cell 2002, 14, 559–574. [Google Scholar] [CrossRef] [PubMed]
  36. Eulgem, T.; Rushton, P.J.; Robatzek, S.; Somssich, I.E. The WRKY superfamily of plant transcription factors. Trends Plant Sci. 2000, 5, 199–206. [Google Scholar] [CrossRef]
  37. Zhang, Z.L.; Xie, Z.; Zou, X.; Casaretto, J.; Ho, T.H.; Shen, Q.J. A rice WRKY gene encodes a transcriptional repressor of the gibberellin signaling pathway in aleurone cells. Plant Physiol. 2004, 134, 1500–1513. [Google Scholar] [CrossRef] [PubMed] [Green Version]
  38. Gu, Z.; Cavalcanti, A.; Chen, F.C.; Bouman, P.; Li, W.H. Extent of gene duplication in the genomes of Drosophila, nematode, and yeast. Mol. Biol. Evol. 2002, 19, 256–262. [Google Scholar] [CrossRef] [Green Version]
  39. Rius, S.P.; Casati, P.; Iglesias, A.A.; Gomez-Casati, D.F. Characterization of Arabidopsis lines deficient in GAPC-1, a cytosolic NAD-dependent glyceraldehyde-3-phosphate dehydrogenase. Plant Physiol. 2008, 148, 1655–1667. [Google Scholar] [CrossRef] [Green Version]
  40. Zhou, J.; Dong, C.; Liu, X.; Qin, R.; Shi, L.; Liu, S. The expression differences of GAPC and AT2G36580 in different tissues and organs of Brassica napus and their relationship with male sterility. Chin. J. Oil Crop. 2008, 2, 157–161. [Google Scholar]
  41. Hu, G.; Fearon, E.R. Siah-1 N-terminal RING domain is required for proteolysis function, and C-terminal sequences regulate oligomerization and binding to target proteins. Mol. Cell Biol. 1999, 19, 724–732. [Google Scholar] [CrossRef] [Green Version]
  42. Peralta, D.A.; Araya, A.; Busi, M.V.; Gomez-Casati, D.F. The E3 ubiquitin-ligase SEVEN IN ABSENTIA like 7 mono-ubiquitinates glyceraldehyde-3-phosphate dehydrogenase 1 isoform in vitro and is required for its nuclear localization in A. thaliana. Int. J. Biochem. Cell Biol. 2016, 70, 48–56. [Google Scholar] [CrossRef]
  43. Peralta, D.A.; Araya, A.; Gomez-Casati, D.F.; Busi, M.V. Over-expression of SINAL7 increases biomass and drought tolerance, and also delays senescence in Arabidopsis. J. Biotechnol. 2018, 283, 11–21. [Google Scholar] [CrossRef] [PubMed]
  44. Teixeira, L.K.; Reed, S.I. Ubiquitin ligases and cell cycle control. Annu. Rev. Biochem. 2013, 82, 387–414. [Google Scholar] [CrossRef]
  45. Lu, B.; He, W.; Shen, Y.; Jiang, J.; Chen, X.; Chen, W.; Lu, L. CDNA cloning and sequence analysis of glyceraldehyde 3-phosphate dehydrogenase gene from longan cotyledon embryo. J. Fujian Agric. For. Univ. 2009, 38, 507–511. [Google Scholar]
  46. Liu, Y.; Pan, T.; Tang, Y.; Zhuang, Y.; Liu, Z.; Li, P.; Li, H.; Huang, W.; Tu, S.; Ren, G.; et al. Proteomic Analysis of Rice Subjected to Low Light Stress and Overexpression of OsGAPB Increases the Stress Tolerance. Rice 2020, 13, 30. [Google Scholar] [CrossRef] [PubMed]
  47. Ryazanova, L.P.; Ledova, L.A.; Andreeva, N.A.; Zvonarev, A.N.; Eldarov, M.A.; Kulakovskaya, T.V. Inorganic Polyphosphate and Physiological Properties of Saccharomyces cerevisiae Yeast Overexpressing Ppn2. Biochemistry 2020, 85, 516–522. [Google Scholar] [CrossRef]
  48. Zhang, L.; Lei, D.; Deng, X.; Li, F.; Ji, H.; Yang, S. Cytosolic glyceraldehyde-3-phosphate dehydrogenase 2/5/6 increase drought tolerance via stomatal movement and reactive oxygen species scavenging in wheat. Plant Cell Environ. 2020, 43, 836–853. [Google Scholar] [CrossRef]
  49. Zhang, L.; Song, Z.; Li, F.; Li, X.; Ji, H.; Yang, S. The specific MYB binding sites bound by TaMYB in the GAPCp2/3 promoters are involved in the drought stress response in wheat. BMC Plant Biol. 2019, 19, 366. [Google Scholar] [CrossRef] [Green Version]
  50. Miao, L.; Chen, C.; Yao, L.; Tran, J.; Zhang, H. Genome-wide identification, characterization, interaction network and expression profile of GAPDH gene family in sweet orange (Citrus sinensis). PeerJ 2019, 7, e7934. [Google Scholar] [CrossRef] [Green Version]
  51. Singh, P.; Kaloudas, D.; Raines, C.A. Expression analysis of the Arabidopsis CP12 gene family suggests novel roles for these proteins in roots and floral tissues. J. Exp. Bot. 2008, 59, 3975–3985. [Google Scholar] [CrossRef] [Green Version]
  52. Zeng, H.; Xie, Y.; Liu, G.; Lin, D.; He, C.; Shi, H. Molecular identification of GAPDHs in cassava highlights the antagonism of MeGAPCs and MeATG8s in plant disease resistance against cassava bacterial blight. Plant Mol. Biol. 2018, 97, 201–214. [Google Scholar] [CrossRef]
  53. Hu, D.; Xie, Q.; Liu, Q.; Zuo, T.; Zhang, H.; Zhang, Y.; Lian, X.; Zhu, L. Genome-Wide Distribution, Expression and Function Analysis of the U-Box Gene Family in Brassica oleracea L. Genes 2019, 10, 1000. [Google Scholar] [CrossRef] [PubMed] [Green Version]
  54. Lian, X.; Zeng, J.; Zhang, H.; Converse, R.; Wang, Y.; Bai, X.; Zhu, L. PUB7, a pollen expression gene induced by self-pollination, negatively regulates pollen germination. Acta Biochim. Biophys. Sin. 2019, 51, 548–551. [Google Scholar] [CrossRef] [PubMed]
  55. Shi, S.; Gao, Q.; Zuo, T.; Lei, Z.; Pu, Q.; Wang, Y.; Liu, G.; He, X.; Ren, X.; Zhu, L. Identification and characterization of BoPUB3: A novel interaction protein with S-locus receptor kinase in Brassica oleracea L. Acta Biochim. Biophys. Sin. 2019, 51, 723–733. [Google Scholar] [CrossRef] [PubMed]
  56. Nasrallah, J.B.; Nasrallah, M.E. Robust self-incompatibility in the absence of a functional ARC1 gene in Arabidopsis thaliana. Plant Cell 2014, 26, 3838–3841. [Google Scholar] [CrossRef] [PubMed] [Green Version]
Figure 1. Phylogenetic analysis of GAPDH proteins in Brassica oleracea, Arabidopsis, turnip, Brassica napus, corn, rice and tomato species. The Maximum Likelihood (ML) phylogenetic tree was constructed by using MEGA X software; the bootstrap value is set to 1000. Group I is Cruciferae-specific, Group II is Gramineae-specific, Group III is Solanaceae-specific, Group IV consists of 14 Cruciferae and 1 Solanaceae GAPDH genes, and the rest, coded as Group V, are Cruciferae, Gramineae and Solanaceae. The red line indicates kale, the dark green line indicates Arabidopsis, the light green line indicates turnip, the dark blue line indicates maize, the light blue line indicates rice, the yellow line indicates kale-type oilseed rape and purple indicates tomato.
Genes 12 01719 g001
Figure 2. (A) Conserved motif distribution of BoGAPDH gene; the 10 conservative motifs are represented by different colors. (B) The structural distribution of the BoGAPDH gene; yellow represents exons, lines represent introns.
Genes 12 01719 g002
Figure 3. Chromosomal and scaffold distribution of GAPDH genes in B. oleracea.
Genes 12 01719 g003
Figure 4. Analysis of cis-acting elements in the promoter region of the GAPDH gene in B. oleracea. ERELEE4: ethylene response element; IBOXCORE: light response element; MYCCONSENSUSAT: response element related to dehydration reaction and abscisic acid signal transduction in Arabidopsis; POLLENLELAT52: pollen-specific cis-acting element; WBOXATNPR1: pressure- and defense-related response element; WRKY71OS: anti-elements related to gibberellin signaling.
Genes 12 01719 g004
Figure 5. GAPDH gene tandem replication in the B. oleracea genome and between the B. oleracea and Arabidopsis genomes. (A) GAPDH gene tandem replication event between B. oleracea C1–C9 and Arabidopsis Chr1–Chr5. The solid red line indicates tandem duplication between genes. (B) Tandem replication events between the B. oleracea C1–C9 chromosomes. The solid red line indicates the replication between GAPDH genes, and the blocks with different colors in the background indicate the replication of all genes in the B. oleracea genome.
Genes 12 01719 g005
Figure 6. (A) Expression patterns of BoGAPDH gene family after self-pollination and cross-pollination. (B) The expression pattern of BoGAPDH gene family stimulated by Xanthomonas campestris pv.
Genes 12 01719 g006
Figure 7. The agarose gel electrophoresis of cDNA and the gDNA and PCR product of BoGAPC.
Genes 12 01719 g007
Figure 8. (A) BoGAPC expression analysis after pollination. The pollination period is 0 min, 15 min, 30 min and 60 min. SP: self-pollination; CP: cross-pollination. (B) Tissue expression analysis, B. oleracea tissue includes leaves, sepal, pollen, petals, stigma, bud, stem and stamen.
Genes 12 01719 g008
Figure 9. GUS staining diagram. Transgenic Arabidopsis was used as the experimental group and Columbia wild type Arabidopsis was the control group: (a) pods; (c) leaves; (e) flowers; (g) buds; (b,d,f,h) CK. Bar = 25 μm.
Genes 12 01719 g009
Figure 10. Subcellular localization of BoGAPC-GFP fusion protein. GFP control is the empty control, and Bo-GAPC is experimental. The scale is 5 μm.
Genes 12 01719 g010
Figure 11. Prokaryotic expression protein analysis of BoGAPC protein. Lane 1 is uninduced pGEX-4T-1-BoGAPC protein, lane 2 is induced unpurified pGEX-4T-1-BoGAPC protein, lane 3 is induced purified pGEX-4T-1-BoGAPC protein and lane 4 is induced purified empty protein.
Genes 12 01719 g011
Figure 12. (A) Test protein–protein interactions on SD/-Leu/-Trp plate and SD/-Ade/-His/-Leu/-Trp plate. DDO: SD/-Leu/-Trp, QDO: SD/-Ade/-His/-Leu/-Trp. Positive control: pGADT7-T × pGBDT7-53, negative control: pGADT7-T × pGBDT7-Lam, experimental group: pGADT7-BoGAPC × pGBKT7-BoSRKj. (B) In vitro GST pull-down assay for the interaction of BoGAPC and BoSRKj. Purified BoSRKj-His tagged protein was pulled down by BoGAPC-GST fusion protein and was detected by Western blot analysis using His antibody.
Genes 12 01719 g012
Table 1. GAPDH gene information in B. oleracea and A. thaliana.
Gene IDChrGene Length (bp)CDS (bp)No. of AAPIMolecular Weight (D)
Bo00285s370.1Scaffold00285211212034005.0399,916.96
Bo02686s010.1Scaffold02686119010263415.0882,080.15
Bo1g152180.1C1217211343775.0294,630.74
Bo2g075590.1C2374321127034.92171,516.98
Bo2g095350.1C2266612604195.02104,769.31
Bo3g057250.1C3202210173565.0783,516.28
Bo5g016460.1C5156512003995.0299,854.00
Bo5g017500.1C5179410203395.0683,749.58
Bo5g021670.1C5300112814265.02106,195.90
Bo5g148380.1C5203710173385.0583,667.04
Bo6g080970.1C6291912664215.02105,067.33
Bo7g083800.1C710557112365.1359,271.32
Bo8g024290.1C8261413474484.99110,675.48
Bo8g065470.1C8206110203395.0783,721.50
Bo8g107420.1C8249510713565.0588,265.82
Bo8g107880.1C8186212003995.02100,014.22
AT1G12900.1Chr1195012003995.0499,919.44
AT1G12900.2Chr119149543175.0979,272.45
AT1G12900.3Chr1185710533505.0886,837.59
AT1G12900.4Chr1178410533505.0886,837.59
AT1G12900.5Chr1201613264415.01111,216.46
AT1G13440.1Chr1280110173385.0883,708.07
AT1G13440.2Chr124519333105.1076,429.79
AT1G16300.1Chr1336512634205.02104,385.82
AT1G42970.1Chr1254213444475.01110,193.00
AT1G79530.1Chr1350612694425.02105,332.66
AT3G04120.1Chr3274810173385.0683,798.81
AT3G26650.1Chr3218311913965.0499,013.50
Publisher’s Note: MDPI stays neutral with regard to jurisdictional claims in published maps and institutional affiliations.

