Abstract
Next-generation sequencing technologies have enabled the discovery of numerous sequence variations among closely related crop varieties. We analyzed genome resequencing data from 24 Korean temperate japonica rice varieties and discovered 954,233 sequence variations, including 791,121 single nucleotide polymorphisms (SNPs) and 163,112 insertions/deletions (InDels). On average, there was one variant per 391 base-pairs (bp), a variant density of 2.6 per 1 kbp. Of the InDels, 10,860 were longer than 20 bp, which enabled conversion to markers resolvable on an agarose gel. The effect of each variant on gene function was predicted using the SnpEff program. The variants were categorized into four groups according to their impact: high, moderate, low, and modifier. These groups contained 3524 (0.4%), 27,656 (2.9%), 24,875 (2.6%), and 898,178 (94.1%) variants, respectively. To test the accuracy of these data, eight InDels from a pre-harvest sprouting resistance QTL (qPHS11) target region, four highly polymorphic InDels, and four functional sequence variations in known agronomically important genes were selected and successfully developed into markers. These results will be useful to develop markers for marker-assisted selection, to select candidate genes in map-based cloning, and to produce efficient high-throughput genome-wide genotyping systems for Korean temperate japonica rice varieties.
1. Introduction
Rice is the world’s second most important cereal crop, following only maize (Zea mays). Worldwide, nearly 504 million metric tons of milled rice was produced from about 162 million hectares of paddy fields in 2019 (http://www.fao.org/faostat, accessed on 10 August 2021). Rice (Oryza sativa) can be classified into two main subgroups: indica and japonica. Indica genotypes are grown in tropical regions, whereas japonica varieties are grown in tropical or temperate regions. Generally, the genetic diversity of japonica varieties is lower than that of indica varieties [1]. Korean japonica rice varieties belong to the temperate japonica group and thus have a low level of genetic diversity. They exhibit low levels of polymorphism with traditional molecular markers, including restriction fragment length polymorphisms (RFLPs) and simple sequence repeats (SSRs), and this has hindered gene mapping and marker-assisted selection. Korean japonica rice varieties, however, show wide phenotypic variation in many important traits, including flowering time, plant architecture, disease and pest resistance, seed size, grain quality, pre-harvest sprouting resistance, and resistance to abiotic stress. Mapping and identification of the genes responsible for this variation and the development of selective markers are therefore required to facilitate molecular breeding.
Next-generation sequencing (NGS) technologies have revealed numerous sequence variations in closely related varieties of temperate japonica rice, and have enabled the development of a sufficient number of polymorphic markers to allow genotyping of populations derived from crosses between these varieties. Resequencing of the japonica variety Koshihikari revealed 67,051 single nucleotide polymorphisms (SNPs) relative to the reference japonica rice sequence, Nipponbare [2]. Moreover, 25,199 new SNPs were discovered by resequencing two other Japanese japonica rice varieties (Rikuu132 and Eiko), and a core set of 768 SNPs were selected for diversity and genetic analyses of biparental populations of Japanese rice accessions [3]. In addition, whole-genome sequencing of Omachi, a Japanese landrace of japonica rice, identified 132,462 SNPs, 16,448 insertions, and 19,318 deletions that differed between the Omachi and Nipponbare genomes [4]. Whole-genome sequencing of six cultivars (five temperate japonica cultivars and one tropical japonica cultivar (Moroberekan)) revealed that the Moroberekan genome contained five times more SNPs than the temperate japonica cultivars when compared with Nipponbare [5]. Whole-genome sequencing also revealed an average of 99,955 putative SNPs and 14,617 putative InDels in comparison with Nipponbare in 10 closely related rice cultivars grown in Hokkaido, the northernmost region of rice paddy cultivation in Japan [6].
Various high-throughput SNP assays have been developed in rice using SNPs discovered through resequencing. These include a custom-designed Affymetrix array consisting of 44,100 SNPs; an Illumina GoldenGate assay consisting of 1536 SNPs; and a suite of low-resolution 384-SNP assays for the Illumina BeadXpress Reader [7,8,9]. A core set of 768 SNPs were used to develop an Illumina GoldenGate platform for diversity and genetic analysis of Japanese temperate japonica rice varieties [2]. Two Illumina Infinium-based 6 K arrays, RiceSNP6K [10] and C6AIR [11], have been developed and used for diversity analysis, QTL mapping, marker-assisted backcross breeding (MABB), and pedigree verification of breeding lines. The C7AIR SNP array, which contains 7,098 markers, is an improved development of the previously released C6AIR [12]. The 700 K High Density Rice Array (HDRA700K) has been used for genome-wide association studies (GWAS) [13]. The 1K-Rice Custom Amplicon, or 1k-RiCA, was developed using highly informative SNPs within indica rice breeding pools for genetic and breeding purposes [14]. A core SNP array based on 467 Kompetitive Allele-Specific PCR (KASP) markers has been used successfully for rice germplasm assessment, genetic diversity, and population evaluation [15].
We previously analyzed genome resequencing data from 13 Korean temperate japonica rice varieties and discovered 740,566 SNPs, from which we developed 1225 KASP markers [16,17,18]. These markers were successfully used for QTL mapping of several important traits and MABB within Korean temperate japonica varieties [19,20,21,22]. However, the number of varieties analyzed in these studies was too small; thus, it was necessary to identify more of the sequence variation present in Korean temperate japonica rice varieties. We therefore analyzed genome resequencing data from 24 Korean temperate japonica rice varieties. This revealed 954,233 sequence variations consisting of 791,121 SNPs and 163,112 insertions/deletions (InDels). These results will be useful for the production of markers for marker-assisted selection, and for the development of more comprehensive and efficient high-throughput genome-wide genotyping systems for Korean temperate japonica rice varieties. In addition, these data provide valuable information for the development of DNA markers and the selection of candidate genes during map-based gene cloning with populations derived from crosses between Korean temperate japonica rice varieties.
2. Materials and Methods
A total of 24 Korean temperate japonica rice varieties (Cheongho, Dami, Dongan, Dongjin, Giho, Haechanmulgyeol, Hiami, Hwacheong, Hwayeong, Ilpum, Jinbu43, Jopyeong, Joun, Junam, Nampyeong, Odae, Saeilmi, Saenuri, Samgwang, Seogan, Seomyeong, Sindongjin, Sobi, and Unbong40) were grown in a greenhouse of the National Institute of Agricultural Sciences (NIAS) of the Rural Development Administration (RDA, Jeonju, Korea). Genomic DNA was extracted from the leaves using the DNeasy Plant Mini Kit (QIAGEN, Hilden, Germany).
Resequencing of the entire genome of 11 varieties (Cheongho, Dami, Dongan, Haechanmulgyeol, Jinbu43, Jopyeong, Saeilmi, Seogan, Seomyeong, Sindongjin, and Sobi) was performed using an Illumina HiSeq2000 instrument (Illumina, San Diego, USA) with a paired-end library. Raw sequencing data from the remaining 13 japonica varieties were reported previously [16].
Analysis of the resequencing data was performed according to the methods reported by Kumagai et al. [23] using the Trimmomatic 0.36 [24], BWA-mem (v0.7.12) (https://sourceforge.net/projects/bio-bwa/, 25 August 2021), Picard 2.9.0 (http://broadinstitute.github.io/picard/, 25 August 2021), GATK (v4.1.3.0) (https://github.com/broadinstitute/gatk/, 25 August 2021), and SnpEff (v4.3t) [25] programs. Briefly, the low-quality bases and adapter sequences in each read were removed using Trimmomatic. The reads were mapped to the IRGSP-1.0 Nipponbare reference genome [26] using BWA-mem with the default setting. After removing PCR duplicates with Picard 2.9.0, the variants were called for each sample using the GATK HaplotypeCaller. The variants of each variety were combined using GATK CombineGVCFs, and varieties were genotyped using GATK GenotypeGVCFs. Hard filtering of variants was done using GATK VariantFiltration and GATK SelectVariants with the filter “QD < 5.0, FS > 50.0, SOR > 3.0, MQ < 50.0, MQRankSum < −2.5, ReadPosRankSum < −1.0, ReadPosRankSum > 3.5”. The effect of each variant site was annotated using SnpEff; rice genome annotation information from the RAP database (RAP-DB, https://rapdb.dna.affrc.go.jp/, 25 August 2021) [27] was used in the SnpEff analysis. The position, genotypes of varieties, and annotation of variants were extracted using SnpSift (v4.3t) [28]; in addition, SnpSift was used to extract variants with high and moderate impact effects. InDels longer than 20 bp were extracted using GATK SelectVariants. The nucleotide diversity (π), allele number, and frequency of alleles at each variant were calculated using vcftools (v0.1.13) [29]. The polymorphism information content (PIC) value was calculated based on the frequency of alleles.
To develop InDel markers in the qPHS11 region (22.0–25.0 Mbp on chromosome 11), nine InDels in this region longer than 20 bp were selected, and primers were designed based on their flanking sequences using the CLC Genomics Workbench (v6.0.1) program (http://www.qiagen.com, 25 August 2021). To develop highly polymorphic InDel markers, four InDels with PIC values greater than 0.4 and without missing data were selected, and primers were designed based on their flanking sequences. In order to find sequence variations in the well-known agronomically important genes, the list of “Agronomically important genes” in RAP-DB (https://rapdb.dna.affrc.go.jp, 25 August 2021) was used. Among the found genes, four genes including Hd1, Hd6, GS3, and SD1 were selected, and the primers were designed based on the flanking sequences of functional sequence variations in those genes. The primer sequences of the markers are shown in Supplementary Table S1.
Phylogenetic analysis of the 24 varieties was conducted using the SNPhylo [30] and MEGA X programs [31]. Population structure for varieties was determined using the STRUCTURE (version 2.3.4) [32,33] program, varying the number of clusters (K) from one to fifteen, with five replications. The models, following admixture and correlated allele frequency with a 5000 burnin length and a run length of 50,000, were used for conducting model-based structure analysis. Output of STRUCTURE analysis was collected using the STRUCTURE harvester [34], and the most probable K value was determined based on the LnP(D) and Evanno’s ΔK [35].
3. Results
3.1. Detection of Variations in Genome Sequences
We analyzed the genome resequencing data of 24 Korean temperate japonica rice varieties (Cheongho, Dami, Dongan, Dongjin, Giho, Haechanmulgyeol, Hiami, Hwacheong, Hwayeong, Ilpum, Jinbu43, Jopyeong, Joun, Junam, Nampyeong, Odae, Saeilmi, Saenuri, Samgwang, Seogan, Seomyeong, Sindongjin, Sobi, and Unbong40). The quantity of raw genome sequence data from the different varieties ranged from 14.55 Gbp (Odae) to 55.99 Gbp (Junam) with a mean of 27.50 Gbp (Supplementary Table S2). After read mapping of the Nipponbare reference genome, the mapped nucleotides ranged from 13.28 Gbp (Odae) to 52.01 Gbp (Junam) with a mean of 25.61 Gbp. The mapping depth ranged from 35.58× to 139.35× with a mean of 68.35×. We identified 954,233 sequence variants, including 791,121 SNPs and 163,112 InDels, between the 24 Korean japonica rice varieties. Overall, chromosome 5 contained the lowest number of variants (20,602), and chromosome 11 the highest (202,097). On average, there was one variant per 391 bp, a variant density of 2.6 per 1 kbp (Table 1).

Table 1.
Number of variants per chromosome.
The distributions of sequence variations per 100 kbp interval and nucleotide diversity within a 100 kbp window over the 12 rice chromosomes are shown in Figure 1. Most intervals contained SNPs, although their density was uneven across each chromosome. Chromosomes 6, 8, 10, 11, and 12 had the widest ranges with variation density as high as 100–1000 per 100 kbp; the nucleotide diversity within a 100 kbp window was especially high over large regions of chromosomes 6, 8, and 11. By contrast, variation density and nucleotide diversity were mostly low on chromosome 5.
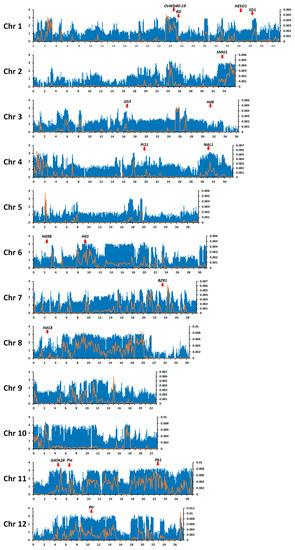
Figure 1.
Distributions of sequence variation and nucleotide diversity per 100 kbp on each of the 12 rice chromosomes. X-axis shows the physical distance along each chromosome in mega base-pairs (Mbp). Left-hand Y-axis shows the common logarithm of the number of variations; blue bars show variation frequency. Right-hand Y-axis shows nucleotide diversity within 100 kbp windows (π), represented by the orange line. The positions of well-known agronomically important genes harboring sequence variations in 24 Korean temperate japonica rice varieties were indicated by red arrows.
The distribution of InDel sizes is shown in Figure 2. InDel size ranged from 1 to 234 bp, although 1 bp InDels occurred most frequently (75,490 InDels). Further information about each InDel, including genotypes of varieties and annotation, is provided in Supplementary Table S3. InDels longer than 20 bp can be converted to markers resolvable on agarose gels, which enables their practical use in ordinary laboratories. We identified 10,860 InDels longer than 20 bp; their full details are provided in Supplementary Table S4.
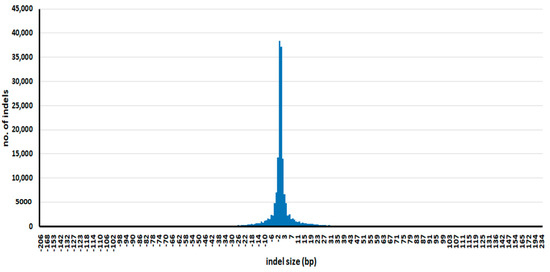
Figure 2.
Distribution of InDel sizes. Minus values are deletions, and positive values are insertions.
To test the usefulness of the InDel data, we designed nine InDel markers in the region of qPHS11, a major QTL for pre-harvest sprouting resistance found in the recombinant inbred line (RIL) population derived from a cross between Odae and Unbong40 [19]. An analysis showed that eight markers revealed polymorphisms between the parental varieties, Odae and Unbong40, and one marker failed to amplify by PCR (Figure 3a). We also designed four highly polymorphic InDel markers with PIC values greater than 0.4. All of these revealed polymorphisms between the 24 varieties, as expected (Figure 3b). These results confirmed that the InDels identified in this study enabled the development of accurate and useful markers.

Figure 3.
Development of markers based on sequence variation between 24 Korean japonica rice varieties. (a) Development of InDel markers in the qPHS11 region. (b) Development of markers based on highly polymorphic InDels. (c) Development of gene-based markers; gene names are given on the right-hand side of the photograph. M: standard size markers; 1–24 represent the varieties Cheongho, Dami, Dongan, Dongjin, Giho, Haechanmulgyeol, Hiami, Hwacheong, Hwayeong, Ilpum, Jinbu43, Jopyeong, Joun, Junam, Nampyeong, Odae, Saeilmi, Saenuri, Samgwang, Seogan, Seomyeong, Sindongjin, Sobi, and Unbong40, respectively.
3.2. Prediction of the Effects of Variation on Gene Function
The effects of the sequence variations on gene function were predicted using the SnpEff program [25]. The impacts of the effects were categorized into four groups: high, moderate, low, and modifier. These groups contained 3524 (0.4%), 27,656 (2.9%), 24,875 (2.6%), and 898,178 (94.1%) variants, respectively (Table 2). Frameshift mutations were the most common variants in the high-impact group (2518), whereas missense mutations were the most common variants in the moderate-impact group (25,436) (Table 3). Synonymous mutations were the most common variants (19,629) in the low-impact group, whereas variations in upstream gene sequences were the most common variants (361,453) in the modifier group (Table 3). Additional information about variants with high and moderate impact is provided in Supplementary Table S5. The variation identified in this study will be very useful for selecting candidate genes in specific target regions during map-based gene cloning with populations derived from crosses between Korean temperate japonica varieties.
Table 2.
Classification of variants by predicted effects on gene function.
Table 3.
Classification of variants by their effects.
In order to identify sequence variations in the well-known agronomically important genes, we referred to the genes in the list of “Agronomically important genes” in RAP-DB (https://rapdb.dna.affrc.go.jp, 25 August 2021), which included 73 genes. We found sequence variations in 18 genes among them (Table 4, Supplementary Table S6). Especially, the sequence variations in SD1, GS3, HD6, HD3B, HD1, Hd18, Pia, Pb1, and Ptr genes were identical with those that have been reported to be functional variations. Based on these results, we designed four functional markers for Hd1, Hd6, GS3, and SD1 genes. A 43 bp deletion causing a frameshift in the first exon was found in Hd1 [36,37], and was used to design a marker for Hd1. The genome resequencing data analysis showed that Joun and Unbong40, which are early-maturing varieties, contained the deletion genotype, while other varieties contained the reference genotype; this finding was confirmed by an analysis using the marker for Hd1 (Figure 3c). An SNP causing the loss of the stop codon was found in Hd6 and used to design a marker. HD6 encodes the α-subunit of a protein kinase, CASEIN KINASE II (CK2); the Nipponbare allele contains a premature stop codon, whereas the allele found in Kasalath, an indica variety, does not [38]. The genome resequencing data analysis showed that only Odae contained the Kasalath allele, while all the other tested varieties had the Nipponbare allele. An analysis with the Hd6 marker confirmed this result (Figure 3c). GS3 regulates grain length [39]. An SNP causing a premature stop codon was found in GS3 and was used to design a marker. The genome resequencing data analysis showed that Dami, Sindongjin, and Sobi, which are large-grained varieties, contained the premature stop codon, while the other varieties possessed the reference genotype; this finding was confirmed by an analysis using the GS3 marker (Figure 3c). Mutations in SD1 reduce culm length [40]. An SNP causing an amino acid change was found in this gene and used to design a marker. The genome resequencing data analysis showed that Ilpum, Jopyeong, Odae, Junam, and Seogan contained the variant sd1 genotype, but the other varieties contained the reference genotype. An analysis with the marker for the sd1 variant confirmed this finding (Figure 3c).
Table 4.
Summary of sequence variations in well-known agronomically important genes.
3.3. Structure and Phylogenetic Analysis
The SNPhylo program extracts SNP data which meet the criteria of ≥ MAF (Minor Allele Frequency) and ≤ missing rate threshold and are in approximate linkage equilibrium with each other from large SNP datasets produced by resequencing [30]. By using this program, 1758 representative SNPs were extracted with criteria of MAF higher than 0.1, missing rate lower than 0.1, and LD (Linkage Disequilibrium) threshold of 0.5 from all SNPs detected in 24 Korean japonica rice varieties. These SNPs were used in the following population structure and phylogeny analysis.
The population structure of 24 Korean japonica rice varieties was analyzed by using STRUCTURE 2.3.4 software. The Evanno’s ΔK values identified three genetically distinct populations (i.e., K = 3; Supplementary Figure S1), A, B, and C (Figure 4a). Then, MEGA X programs were used to construct a phylogenetic tree of the 24 Korean japonica rice varieties. This analysis also divided the varieties into three groups (Figure 4b): Group A (Samgwang, Haechanmulgyeol, Junam, Seomyeong, Seogan, Hwayeong, Sobi, Dami, and Sindongjin); Group B (Dongan, Nampyeong, Dongjin, Saeilmi, Cheongho, Saenuri, Hiami, Giho, Ilpum, Hwacheong, and Joun); and Group C (Unbong40, Jopyeong, Jinbu43, and Odae).
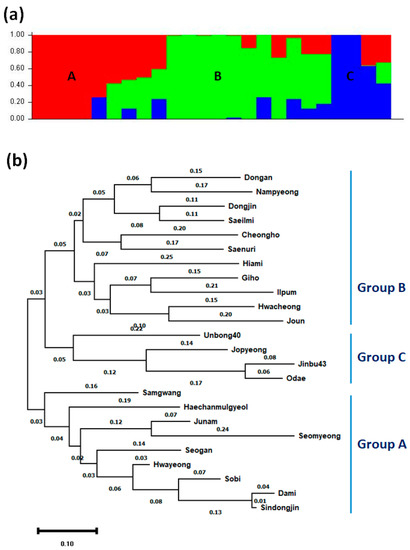
Figure 4.
Structure and phylogeny analysis of 24 Korean temperate japonica rice varieties. (a) Assignment of 24 Korean temperate japonica rice varieties into three populations (A, B, and C) using STRUCTURE 2.3.4 software. The different colors represent different populations. (b) Phylogenetic tree of 24 Korean temperate japonica rice varieties. The phylogenetic tree was inferred using the maximum likelihood method and Tamura–Nei model. The tree with the highest log likelihood is shown.
4. Discussion
In this study, we identified 954,233 sequence variants, 791,121 SNPs, and 163,112 InDels. We found 50,555 new SNPs, in addition to the 740,566 SNPs reported in our previous study [16], and performed a novel analysis of InDels. This result reveals ample sequence variation in Korean japonica rice varieties and may explain the wide phenotypic variation observed in many important traits, including flowering time, plant architecture, disease and pest resistance, seed size, grain quality, pre-harvest sprouting resistance, and resistance to abiotic stress. Using the SnpEff program, we predicted the effect of each variant on gene function: 3524 variants were predicted to have high-impact effects as they involved frameshift mutations, the gain or loss of a stop codon, or changes at splice donor or acceptor sites. These types of variants are extremely likely to be associated with variation in phenotypic traits. Moreover, 27,656 variants were missense mutations, in-frame insertion/deletions, or 5_prime_UTR_truncation and exon_loss_variants, which are predicted to have moderate effects on function and are thus also likely to be related to phenotypic variation. In addition, we cannot exclude the possibility that the remaining variants, predicted to have a low or modifier impact on function, are related to variation in phenotypic traits. Our analysis provided the position, genotypes of tested varieties, and full annotation of each variant, including its predicted effect on function. These data will be very helpful for future map-based cloning of genes underlying important traits in populations derived from crosses between Korean japonica varieties. In particular, within a target region associated with a trait, candidate genes can be identified based on the presence of variants that have a high or moderate impact on gene function.
The need for high-throughput genome-wide genotyping systems using arrays is increasing rapidly as marker-assisted selection and genomic selection become more popular techniques for plant breeding [54,55]. Highly polymorphic SNPs, SNPs affecting the function of known genes controlling agronomical traits, and SNPs located within a target gene interval are commonly used to develop high-throughput genome-wide genotyping systems [10,11,14,15]. Using the information produced by this study, suitable SNPs can be easily selected to develop genotyping systems for Korean japonica rice varieties. This is the goal of our future research.
The development of markers resolvable on agarose gels is important for genetic research and breeding. InDels longer than 20 bp are easily visualized on agarose gels and can thus be used in ordinary laboratories without the need for expensive equipment. Shen et al. [56] identified InDels between the rice varieties Nipponbare and 9311, and used InDels of 25–50 bp to construct 108 InDel markers. A further 346 markers based on InDels of 30–55 bp were developed following a comparison of the sequences of two indica and one japonica rice reference genomes [57]. InDels longer than 20 bp were detected by positional multiple sequence alignments between wild rice species and four cultivated rice varieties, and enabled the development of 541 genome-wide markers that discriminated between alleles from cultivated rice and seven AA-genome wild rice species [58]. We identified 10,860 InDels longer than 20 bp (Supplementary Table S4), and used this information to develop and successfully use eight InDel markers in the qPHS11 target region, as well as four other highly polymorphic InDel markers (Figure 3a,b). These results show that the InDel data generated by this study will be very useful for developing markers for fine-mapping and marker-assisted selection, as well as for the construction of a genome-wide InDel marker set for Korean japonica rice varieties.
Interestingly, a large difference in the numbers of sequence variations among chromosomes was observed. Chromosome 11 contained the highest number of variants (202,697), and chromosome 5 the lowest number of variants (20,602). A similar result has been reported by resequencing a Japanese temperate japonica rice variety, Koshihikari [2]. In comparison between Koshihikari and Nipponbare, which is the reference genome, chromosome 11 showed the highest number of SNPs (12,216), and chromosome 5 the second lowest number of SNPs (1032). Moreover, in resequencing 10 Japanese temperate japonica rice varieties released in Hokkaido, chromosome 11 contained the highest number of SNPs (10,870–18,779), and chromosome 5 the lowest number of SNPs (1563–2834) in comparison with Nipponbare [6]. In the study by Arai-Kichise et al. [5], six Japanese temperate japonica rice varieties were resequenced, and chromosome 11 contained the second highest number of SNPs (12,215–27,182), while chromosome 5 had the lowest number of SNPs (1184–6119) in comparison with Nipponbare [5]. Such a large difference seems to be seen only in temperate japonica rice varieties. The Moroberekan, a tropical japonica rice variety, did not show a large difference in SNP numbers: 61,350 on chromosome 5 and 61,169 on chromosome 11 [5]. The differences in the numbers of SNPs between chromosome 5 and chromosome 11 were much smaller in two Korean Tongil-type indica varieties: 72,242 and 87,759 on chromosome 5 vs. 121,783 and 126,752 on chromosome 11 [59]. The cause of the large differences in the numbers of sequence variations among chromosomes in temperate japonica rice varieties is unclear and needs further research.
Overall, the genomic variation found in this study will facilitate the development of markers for mapping important genes and for marker-assisted selection, together with the development of a high-throughput genome-wide genotyping system for Korean japonica rice varieties.
5. Conclusions
Through analyzing genome resequencing data from 24 Korean temperate japonica rice varieties, we discovered 954,233 sequence variations, including 791,121 SNPs and 163,112 InDels. The effect of each variant on gene function was predicted using the SnpEff program and was included in annotation. Eight InDels from a pre-harvest sprouting resistance QTL (qPHS11) target region, four highly polymorphic InDels, and four functional sequence variations in well-known agronomically important genes were selected and successfully developed into markers. These results will be useful to develop markers for marker-assisted selection, to select candidate genes in map-based cloning, and to produce efficient high-throughput genome-wide genotyping systems for Korean temperate japonica rice varieties.
Supplementary Materials
The following are available online at https://www.mdpi.com/article/10.3390/genes12111749/s1, Figure S1: Estimation of population using LnP(D) derived ΔK for K from 1 to 15, Table S1: Primer sequences of markers developed in this study, Table S2: Summary of genome resequencing data, Table S3: Information about InDels detected in this study, Table S4: Information about InDels longer than 20 bp detected in this study, Table S5: Information about variants with high or moderate effects on gene function, Table S6: Information about variants with high or moderate effects on gene function in well-known agronomically important genes.
Author Contributions
Conceptualization: H.J. and K.-H.K.; validation: J.B. and Y.-S.C.; formal analysis: C.L. and H.O.; investigation: Y.S.; resources: I.S.Y., G.-S.L. and S.L.K.; writing—original draft preparation: H.J.; writing—review and editing: H.J.; visualization: Y.S.; supervision: K.-H.K. All authors have read and agreed to the published version of the manuscript.
Funding
This research was funded by grants from the National Institute of Agricultural Sciences (NIAS), project code: PJ01498501, Republic of Korea.
Institutional Review Board Statement
Not applicable.
Informed Consent Statement
Not applicable.
Data Availability Statement
Data is contained within the article or supplementary material.
Conflicts of Interest
The authors declare no conflict of interest.
References
- Garris, A.J.; Tai, T.H.; Coburn, J.; Kresovich, S.; McCouch, S. Genetic structure and diversity in Oryza sativa L. Genetics 2005, 169, 1631–1638. [Google Scholar] [CrossRef] [PubMed]
- Yamamoto, T.; Nagasaki, H.; Yonemaru, J.-I.; Ebana, K.; Nakajima, M.T.; Shibaya, T.; Yano, M. Fine definition of the pedigree haplotypes of closely related rice cultivars by means of genome-wide discovery of single-nucleotide polymorphisms. BMC Genom. 2010, 11, 267. [Google Scholar] [CrossRef] [PubMed]
- Nagasaki, H.; Ebana, K.; Shibaya, T.; Yonemaru, J.-I.; Yano, M. Core single-nucleotide polymorphisms—A tool for genetic analysis of the Japanese rice population. Breed. Sci. 2010, 60, 648–655. [Google Scholar] [CrossRef][Green Version]
- Arai-Kichise, Y.; Shiwa, Y.; Nagasaki, H.; Ebana, K.; Yoshikawa, H.; Yano, M.; Wakasa, K. Discovery of genome-wide DNA polymorphisms in a landrace cultivar of Japonica rice by whole-genome sequencing. Plant Cell Physiol. 2011, 52, 274–282. [Google Scholar] [CrossRef]
- Arai-Kichise, Y.; Shiwa, Y.; Ebana, K.; Shibata-Hatta, M.; Yoshikawa, H.; Yano, M.; Wakasa, K. Genome-wide DNA polymorphisms in seven rice cultivars of temperate and tropical japonica groups. PLoS ONE 2014, 9, e86312. [Google Scholar] [CrossRef]
- Takano, S.; Matsuda, S.; Kinoshita, N.; Shimoda, N.; Sato, T.; Kato, K. Genome-wide single nucleotide polymorphisms and insertion–deletions of Oryza sativa L. subsp. japonica cultivars grown near the northern limit of rice cultivation. Mol. Breed. 2014, 34, 1007–1021. [Google Scholar] [CrossRef]
- Thomson, M.J.; Zhao, K.; Wright, M.; McNally, K.L.; Rey, J.; Tung, C.; Reynolds, A.; Scheffler, B.; Eizenga, G.; McClung, A.; et al. High-throughput single nucleotide polymorphism genotyping for breeding applications in rice using the BeadXpress platform. Mol. Breed. 2012, 29, 875–886. [Google Scholar] [CrossRef]
- Tung, C.; Zhao, K.; Wright, M.H.; Ali, M.L.; Jung, J.; Kimball, J.; Tyagi, W.; Thomson, M.J.; McNally, K.; Leung, H.; et al. Development of a research platform for dissecting phenotype–genotype associations in rice (Oryza spp.). Rice 2010, 3, 205–217. [Google Scholar] [CrossRef]
- Zhao, K.; Wright, M.; Kimball, J.; Eizenga, G.; McClung, A.; Kovach, M.; Tyagi, W.; Ali, M.L.; Tung, C.W.; Reynolds, A.; et al. Genomic diversity and introgression in O. sativa reveal the impact of domestication and breeding on the rice genome. PLoS ONE 2010, 5, e10780. [Google Scholar] [CrossRef]
- Yu, H.; Xie, W.; Li, J.; Zhou, F.; Zhang, Q. A whole-genome SNP array (RICE6K) for genomic breeding in rice. Plant Biotechnol. J. 2014, 12, 28–37. [Google Scholar] [CrossRef] [PubMed]
- Thomson, M.J.; Singh, N.; Dwiyanti, M.S.; Wang, D.R.; Wright, M.H.; Perez, F.A.; DeClerck, G.; Chin, J.H.; Malitic-Layaoen, G.A.; Juanillas, V.M.; et al. Large-scale development of a rice 6 K SNP array for genetics and breeding applications. Rice 2017, 10, 40. [Google Scholar] [CrossRef] [PubMed]
- Morales, K.Y.; Singh, N.; Perez, F.A.; Ignacio, J.C.; Thapa, R.; Arbelaez, J.D.; Tabien, R.E.; Famoso, A.; Wang, D.R.; Septiningsih, E.M.; et al. An improved 7K SNP array, the C7AIR, provides a wealth of validated SNP markers for rice breeding and genetics studies. PLoS ONE 2020, 15, e0232479. [Google Scholar] [CrossRef] [PubMed]
- McCouch, S.R.; Wright, M.H.; Tung, C.W.; Maron, L.G.; McNally, K.L.; Fitzgerald, M.; Singh, N.; DeClerck, G.; Agosto-Perez, F.; Korniliev, P.; et al. Open access resources for genome-wide association mapping in rice. Nat. Commun. 2016, 7, 10532. [Google Scholar] [CrossRef]
- Arbelaez, J.D.; Dwiyanti, M.S.; Tandayu, E.; Llantada, K.; Jarana, A.; Ignacio, J.C.; Platten, J.D.; Cobb, J.; Rutkoski, J.E.; Thomson, M.J.; et al. 1k-RiCA (1K-Rice Custom Amplicon) a novel genotyping amplicon-based SNP assay for genetics and breeding applications in rice. Rice 2019, 12, 55. [Google Scholar] [CrossRef]
- Yang, G.; Chen, S.; Chen, L.; Sun, K.; Huang, C.; Zhou, D.; Huang, Y.; Wang, J.; Liu, Y.; Wang, H.; et al. Development of a core SNP arrays based on the KASP method for molecular breeding of rice. Rice 2019, 12, 21. [Google Scholar] [CrossRef] [PubMed]
- Cheon, K.-S.; Baek, J.; Cho, Y.-I.; Jeong, Y.-M.; Lee, Y.-Y.; Oh, J.; Won, Y.J.; Kang, D.-Y.; Oh, H.; Kim, S.L.; et al. Single nucleotide polymorphism (SNP) discovery and kompetitive allele-specific PCR (KASP) marker development with Korean japonica rice varieties. Plant Breed. Biotech. 2018, 6, 391–403. [Google Scholar] [CrossRef]
- Cheon, K.-S.; Jeong, Y.-M.; Lee, Y.-Y.; Oh, J.; Kang, D.-Y.; Oh, H.; Kim, S.L.; Kim, N.; Lee, E.; Baek, J.; et al. Kompetitive allele-specific PCR marker development and quantitative trait locus mapping for bakanae disease resistance in Korean japonica rice varieties. Plant Breed. Biotech. 2019, 7, 208–219. [Google Scholar] [CrossRef]
- Cheon, K.S.; Jeong, Y.M.; Oh, H.; Oh, J.; Kang, D.Y.; Kim, N.; Lee, E.; Baek, J.; Kim, S.L.; Choi, I.; et al. Development of 454 new Kompetitive Allele-Specific PCR (KASP) markers for temperate japonica rice varieties. Plants 2020, 9, 1531. [Google Scholar] [CrossRef] [PubMed]
- Cheon, K.S.; Won, Y.J.; Jeong, Y.M.; Lee, Y.Y.; Kang, D.Y.; Oh, J.; Oh, H.; Kim, S.L.; Kim, N.; Lee, E.; et al. QTL mapping for pre-harvest sprouting resistance in japonica rice varieties utilizing genome re-sequencing. Mol. Genet. Genom. 2020, 295, 1129–1140. [Google Scholar] [CrossRef] [PubMed]
- Kang, D.-Y.; Cheon, K.-S.; Oh, J.; Oh, H.; Kim, S.L.; Kim, N.; Lee, E.; Choi, I.; Baek, J.; Kim, K.-H.; et al. Rice genome resequencing reveals a major quantitative trait locus for resistance to bakanae disease caused by Fusarium fujikuroi. Int. J. Mol. Sci. 2019, 20, 2598. [Google Scholar] [CrossRef] [PubMed]
- Kang, J.-W.; Shin, D.; Cho, J.-H.; Lee, J.-Y.; Kwon, Y.; Park, D.-S.; Ko, J.-M.; Lee, J.-H. Accelerated development of rice stripe virus-resistant, near-isogenic rice lines through marker-assisted backcrossing. PLoS ONE 2019, 14, e0225974. [Google Scholar] [CrossRef] [PubMed]
- Kim, M.S.; Yang, J.Y.; Yu, J.K.; Lee, Y.; Park, Y.J.; Kang, K.K.; Cho, Y.G. Breeding of high cooking and eating quality in rice by Marker-Assisted Backcrossing (MABc) using KASP markers. Plants 2021, 10, 804. [Google Scholar] [CrossRef]
- Kumagai, M.; Nishikawa, D.; Kawahara, Y.; Wakimoto, H.; Itoh, R.; Tabei, N.; Tanaka, T.; Itoh, T. TASUKE+: A web-based platform for exploring GWAS results and large-scale resequencing data. DNA Res. 2019, 26, 445–452. [Google Scholar] [CrossRef] [PubMed]
- Bolger, A.M.; Lohse, M.; Usadel, B. Trimmomatic: A flexible trimmer for Illumina sequence data. Bioinformatics 2014, 30, 2114–2120. [Google Scholar] [CrossRef]
- Cingolani, P.; Platts, A.; Wang le, L.; Coon, M.; Nguyen, T.; Wang, L.; Land, S.J.; Lu, X.; Ruden, D.M. A program for annotating and predicting the effects of single nucleotide polymorphisms, SnpEff: SNPs in the genome of Drosophila melanogaster strain w1118; iso-2; iso-3. Fly 2012, 6, 80–92. [Google Scholar] [CrossRef] [PubMed]
- Kawahara, Y.; de la Bastide, M.; Hamilton, J.P.; Kanamori, H.; McCombie, W.R.; Ouyang, S.; Schwartz, D.C.; Tanaka, T.; Wu, J.; Zhou, S.; et al. Improvement of the Oryza sativa Nipponbare reference genome using next generation sequence and optical map data. Rice 2013, 6, 4. [Google Scholar] [CrossRef]
- Sakai, H.; Lee, S.S.; Tanaka, T.; Numa, H.; Kim, J.; Kawahara, Y.; Wakimoto, H.; Yang, C.C.; Iwamoto, M.; Abe, T.; et al. Rice Annotation Project Database (RAP-DB): An integrative and interactive database for rice genomics. Plant Cell Physiol. 2013, 54, e6. [Google Scholar] [CrossRef] [PubMed]
- Cingolani, P.; Patel, V.M.; Coon, M.; Nguyen, T.; Land, S.J.; Ruden, D.M.; Lu, X. Using Drosophila melanogaster as a Model for Genotoxic Chemical Mutational Studies with a New Program, SnpSift. Front. Genet. 2012, 3, 35. [Google Scholar] [CrossRef] [PubMed]
- Danecek, P.; Auton, A.; Abecasis, G.; Albers, C.A.; Banks, E.; DePristo, M.A.; Handsaker, R.E.; Lunter, G.; Marth, G.T.; Sherry, S.T.; et al. The variant call format and VCFtools. Bioinformatics 2011, 27, 2156–2158. [Google Scholar] [CrossRef]
- Lee, T.H.; Guo, H.; Wang, X.; Kim, C.; Paterson, A.H. SNPhylo: A pipeline to construct a phylogenetic tree from huge SNP data. BMC Genom. 2014, 15, 162. [Google Scholar] [CrossRef] [PubMed]
- Kumar, S.; Stecher, G.; Li, M.; Knyaz, C.; Tamura, K. MEGA X: Molecular evolutionary genetics analysis across computing platforms. Mol. Biol. Evol. 2018, 35, 1547–1549. [Google Scholar] [CrossRef] [PubMed]
- Falush, D.; Stephens, M.; Pritchard, J.K. Inference of population structure using multilocus genotype data: Linked loci and correlated allele frequencies. Genetics 2003, 164, 1567–1587. [Google Scholar] [CrossRef] [PubMed]
- Pritchard, J.K.; Stephens, M.; Donnelly, P. Inference of population structure using multilocus genotype data. Genetics 2000, 155, 945–959. [Google Scholar] [CrossRef] [PubMed]
- Earl, D.A.; vonHoldt, B.M. STRUCTURE HARVESTER: A website and program for visualizing STRUCTURE output and implementing the Evanno method. Conserv. Genet. Resour. 2012, 4, 359–361. [Google Scholar] [CrossRef]
- Evanno, G.; Regnaut, S.; Goudet, J. Detecting the number of clusters of individuals using the software STRUCTURE: A simulation study. Mol. Ecol. 2005, 14, 2611–2620. [Google Scholar] [CrossRef] [PubMed]
- Wu, C.C.; Wei, F.J.; Chiou, W.Y.; Tsai, Y.C.; Wu, H.P.; Gotarkar, D.; Wei, Z.H.; Lai, M.H.; Hsing, Y.C. Studies of rice Hd1 haplotypes worldwide reveal adaptation of flowering time to different environments. PLoS ONE 2020, 15, e0239028. [Google Scholar] [CrossRef] [PubMed]
- Yano, M.; Katayose, Y.; Ashikari, M.; Yamanouchi, U.; Monna, L.; Fuse, T.; Baba, T.; Yamamoto, K.; Umehara, Y.; Nagamura, Y.; et al. Hd1, a major photoperiod sensitivity quantitative trait locus in rice, is closely related to the Arabidopsis flowering time gene CONSTANS. Plant Cell 2000, 12, 2473–2484. [Google Scholar] [CrossRef] [PubMed]
- Takahashi, Y.; Shomura, A.; Sasaki, T.; Yano, M. Hd6, a rice quantitative trait locus involved in photoperiod sensitivity, encodes the α subunit of protein kinase CK2. Proc. Natl. Acad. Sci. USA 2001, 98, 7922–7927. [Google Scholar] [CrossRef]
- Fan, C.; Yu, S.; Wang, C.; Xing, Y. A causal C-A mutation in the second exon of GS3 highly associated with rice grain length and validated as a functional marker. Theor. Appl. Genet. 2009, 118, 465–472. [Google Scholar] [CrossRef]
- Sasaki, A.; Ashikari, M.; Ueguchi-Tanaka, M.; Itoh, H.; Nishimura, A.; Swapan, D.; Ishiyama, K.; Saito, T.; Kobayashi, M.; Khush, G.S.; et al. Green revolution: A mutant gibberellin-synthesis gene in rice. Nature 2002, 416, 701–702. [Google Scholar] [CrossRef] [PubMed]
- Song, J.; Li, J.; Sun, J.; Hu, T.; Wu, A.; Liu, S.; Wang, W.; Ma, D.; Zhao, M. Genome-wide association mapping for cold tolerance in a core collection of rice (Oryza sativa L.) landraces by using high-density single nucleotide polymorphism markers from specific-locus amplified fragment sequencing. Front. Plant Sci. 2018, 9, 875. [Google Scholar] [CrossRef]
- Furukawa, T.; Maekawa, M.; Oki, T.; Suda, I.; Iida, S.; Shimada, H.; Takamure, I.; Kadowaki, K. The Rc and Rd genes are involved in proanthocyanidin synthesis in rice pericarp. Plant J. 2007, 49, 91–102. [Google Scholar] [CrossRef] [PubMed]
- Yano, K.; Yamamoto, E.; Aya, K.; Takeuchi, H.; Lo, P.C.; Hu, L.; Yamasaki, M.; Yoshida, S.; Kitano, H.; Hirano, K.; et al. Genome-wide association study using whole-genome sequencing rapidly identifies new genes influencing agronomic traits in rice. Nat. Genet. 2016, 48, 927–934. [Google Scholar] [CrossRef] [PubMed]
- Duan, P.; Rao, Y.; Zeng, D.; Yang, Y.; Xu, R.; Zhang, B.; Dong, G.; Qian, Q.; Li, Y. SMALL GRAIN 1, which encodes a mitogen-activated protein kinase kinase 4, influences grain size in rice. Plant J. 2014, 77, 547–557. [Google Scholar] [CrossRef] [PubMed]
- Fan, C.; Xing, Y.; Mao, H.; Lu, T.; Han, B.; Xu, C.; Li, X.; Zhang, Q. GS3, a major QTL for grain length and weight and minor QTL for grain width and thickness in rice, encodes a putative transmembrane protein. Theor. Appl. Genet. 2006, 112, 1164–1171. [Google Scholar] [CrossRef] [PubMed]
- Fukuoka, S.; Saka, N.; Koga, H.; Ono, K.; Shimizu, T.; Ebana, K.; Hayashi, N.; Takahashi, A.; Hirochika, H.; Okuno, K.; et al. Loss of function of a proline-containing protein confers durable disease resistance in rice. Science 2009, 325, 998–1001. [Google Scholar] [CrossRef] [PubMed]
- Qi, J.; Qian, Q.; Bu, Q.; Li, S.; Chen, Q.; Sun, J.; Liang, W.; Zhou, Y.; Chu, C.; Li, X.; et al. Mutation of the rice Narrow leaf1 gene, which encodes a novel protein, affects vein patterning and polar auxin transport. Plant Physiol. 2008, 147, 1947–1959. [Google Scholar] [CrossRef] [PubMed]
- Matsubara, K.; Ogiso-Tanaka, E.; Hori, K.; Ebana, K.; Ando, T.; Yano, M. Natural variation in Hd17, a homolog of Arabidopsis ELF3 that is involved in rice photoperiodic flowering. Plant Cell Physiol. 2012, 53, 709–716. [Google Scholar] [CrossRef]
- Bai, M.Y.; Zhang, L.Y.; Gampala, S.S.; Zhu, S.W.; Song, W.Y.; Chong, K.; Wang, Z.Y. Functions of OsBZR1 and 14-3-3 proteins in brassinosteroid signaling in rice. Proc. Natl. Acad. Sci. USA 2007, 104, 13839–13844. [Google Scholar] [CrossRef] [PubMed]
- Shibaya, T.; Hori, K.; Ogiso-Tanaka, E.; Yamanouchi, U.; Shu, K.; Kitazawa, N.; Shomura, A.; Ando, T.; Ebana, K.; Wu, J.; et al. Hd18, encoding histone acetylase related to arabidopsis FLOWERING LOCUS D, is involved in the control of flowering time in rice. Plant Cell Physiol. 2016, 57, 1828–1838. [Google Scholar] [CrossRef]
- Okuyama, Y.; Kanzaki, H.; Abe, A.; Yoshida, K.; Tamiru, M.; Saitoh, H.; Fujibe, T.; Matsumura, H.; Shenton, M.; Galam, D.C.; et al. A multifaceted genomics approach allows the isolation of the rice Pia-blast resistance gene consisting of two adjacent NBS-LRR protein genes. Plant J. 2011, 66, 467–479. [Google Scholar] [CrossRef] [PubMed]
- Hayashi, N.; Inoue, H.; Kato, T.; Funao, T.; Shirota, M.; Shimizu, T.; Kanamori, H.; Yamane, H.; Hayano-Saito, Y.; Matsumoto, T.; et al. Durable panicle blast-resistance gene Pb1 encodes an atypical CC-NBS-LRR protein and was generated by acquiring a promoter through local genome duplication. Plant J. 2010, 64, 498–510. [Google Scholar] [CrossRef] [PubMed]
- Zhao, H.; Wang, X.; Jia, Y.; Minkenberg, B.; Wheatley, M.; Fan, J.; Jia, M.H.; Famoso, A.; Edwards, J.D.; Wamishe, Y.; et al. The rice blast resistance gene Ptr encodes an atypical protein required for broad-spectrum disease resistance. Nat. Commun. 2018, 9, 2039. [Google Scholar] [CrossRef] [PubMed]
- Rasheed, A.; Hao, Y.; Xia, X.; Khan, A.; Xu, Y.; Varshney, R.K.; He, Z. Crop breeding chips and genotyping platforms: Progress, challenges, and persepectives. Mol. Plant 2017, 10, 1047–1064. [Google Scholar] [CrossRef] [PubMed]
- Thomson, M.J. High-throughput SNP genotyping to accelerate crop improvement. Plant Breed. Biotech. 2014, 2, 195–212. [Google Scholar] [CrossRef]
- Shen, Y.J.; Jiang, H.; Jin, J.P.; Zhang, Z.B.; Xi, B.; He, Y.Y.; Wang, G.; Wang, C.; Qian, L.; Li, X.; et al. Development of genome-wide DNA polymorphism database for map-based cloning of rice genes. Plant Physiol. 2004, 135, 1198–1205. [Google Scholar] [CrossRef] [PubMed]
- Hu, W.; Zhou, T.; Wang, P.; Wang, B.; Song, J.; Han, Z.; Chen, L.; Liu, K.; Xing, Y. Development of whole-genome agarose-resolvable LInDel markers in rice. Rice 2020, 13, 1. [Google Scholar] [CrossRef]
- Hechanova, S.L.; Bhattarai, K.; Simon, E.V.; Clave, G.; Karunarathne, P.; Ahn, E.K.; Li, C.P.; Lee, J.S.; Kohli, A.; Hamilton, N.R.S.; et al. Development of a genome-wide InDel marker set for allele discrimination between rice (Oryza sativa) and the other seven AA-genome Oryza species. Sci. Rep. 2021, 11, 8962. [Google Scholar] [CrossRef]
- Ji, H.; Ahn, E.; Seo, B.S.; Kang, H.-J.; Choi, I.; Kim, K.-H. Genome-wide detection of SNPs between two Korean tongil-type rice varieties. Korean J. Breed. Sci. 2016, 48, 460–469. [Google Scholar] [CrossRef]
Publisher’s Note: MDPI stays neutral with regard to jurisdictional claims in published maps and institutional affiliations. |
© 2021 by the authors. Licensee MDPI, Basel, Switzerland. This article is an open access article distributed under the terms and conditions of the Creative Commons Attribution (CC BY) license (https://creativecommons.org/licenses/by/4.0/).