Article

Acute Induction of Translocon-Mediated Ca2+ Leak Protects Cardiomyocytes Against Ischemia/Reperfusion Injury

1
Univ Lyon, CarMeN Laboratory, INSERM, INRA, INSA Lyon, Université Claude Bernard Lyon 1, 69500 Bron, France
2
Hospices Civils de Lyon, Groupement Hospitalier EST, Département de Cardiologie, IHU-OPERA Bâtiment B13, 69500 Bron, France
3
Cardiovascular functional explorations, Louis Pradel hospital, Hospices Civils de Lyon, 69677 Lyon, France
*
Author to whom correspondence should be addressed.
These authors equally contributed to this work.
These authors equally supervised this work.
Cells 2020, 9(5), 1319; https://doi.org/10.3390/cells9051319
Submission received: 14 April 2020 / Revised: 14 May 2020 / Accepted: 21 May 2020 / Published: 25 May 2020
(This article belongs to the Special Issue Dysregulation of Calcium Signalling in Disease)

Abstract

:
During myocardial infarction, dysregulation of Ca2+ homeostasis between the reticulum, mitochondria, and cytosol occurs in cardiomyocytes and leads to cell death. Ca2+ leak channels are thought to be key regulators of the reticular Ca2+ homeostasis and cell survival. The present study aimed to determine whether a particular reticular Ca2+ leak channel, the translocon, also known as translocation channel, could be a relevant target against ischemia/reperfusion-mediated heart injury. To achieve this objective, we first used an intramyocardial adenoviral strategy to express biosensors in order to assess Ca2+ variations in freshly isolated adult mouse cardiomyocytes to show that translocon is a functional reticular Ca2+ leak channel. Interestingly, translocon activation by puromycin mobilized a ryanodine receptor (RyR)-independent reticular Ca2+ pool and did not affect the excitation–concentration coupling. Second, puromycin pretreatment decreased mitochondrial Ca2+ content and slowed down the mitochondrial permeability transition pore (mPTP) opening and the rate of cytosolic Ca2+ increase during hypoxia. Finally, this translocon pre-activation also protected cardiomyocytes after in vitro hypoxia reoxygenation and reduced infarct size in mice submitted to in vivo ischemia-reperfusion. Altogether, our report emphasizes the role of translocon in cardioprotection and highlights a new paradigm in cardioprotection by functionally uncoupling the RyR-dependent Ca2+ stores and translocon-dependent Ca2+ stores.

Graphical Abstract

1. Introduction

During cardiac infarction, ischemia triggers a molecular disaster comprising drop in ATP concentration [1], acidosis [2], reactive oxygen species (ROS) accumulation [3], and Ca2+ homeostasis perturbations [4,5,6]. This leads to irreversible cellular damage [7] that can ultimately end by cardiomyocytes (CM) death [8]. In this molecular storm, Ca2+ ion, a preponderant second messenger, behaves as key inducer of ischemia/reperfusion (I/R)-mediated cell death. Indeed, the concomitant massive Ca2+ leak from internal stores overloads mitochondrial matrix and triggers the mitochondrial permeability transition pore (mPTP) opening [9,10], driving mitochondria to its terminal fate. In resting cardiac muscle, reticular Ca2+ concentration is finely tuned by calcium-binding proteins [11] and by the dynamic balance between Ca2+ uptake and Ca2+ release. Sarco-endoplasmic reticulum Ca2+ ATPase (SERCA) is the only known Ca2+ uptake pump, whereas Ca2+ release channels are divided into two categories: (1) channels activated by signalization pathways such as inositol-tri-phosphate receptors (IP3R) and ryanodine receptors (RyR), activated by IP3 and the Ca2+-induced Ca2+-release (CICR) mechanism, respectively, and (2) the Ca2+ leak channels, which generate reticular Ca2+ leak as a side effect of their own activity [12,13]. The physiological role of reticular Ca2+ channels from the first category is already well established, whereas the functionality of the leak channels in cardiomyocytes and their involvement in I/R-mediated mechanisms remain poorly understood. Over the last decade [14], most of the cardioprotective strategies have targeted calcium-mediated cyclophilin D activation in mitochondria [9,15] or the Ca2+ transfer from the sarco-endoplasmic reticulum (SR/ER) via IP3R2 [9,16] or RyR2 [4] to the mitochondria. Related preclinical in vitro studies were promising. Unfortunately, they have led to disappointing results in clinical trials [17]. There is thus an urgent need to find out new targets to prevent CM cell death and deleterious consequences of myocardial infarction.
Remarkably, the translocon (TLC), a component of the translation machinery, contributes to the SR/ER Ca2+ leak; meanwhile, it serves as the major entry site of newly synthesized polypeptides in the reticular membrane [18]. Reticular transmembrane proteins Sec61, Sec62, and Sec63 comprise the key component of the protein translocation machinery [19], and trimers of Sec61 α, β, and γ subunits form an aqueous central pore ranging from 2.6 nm to 6 nm [20]. As it represents one of the largest pores in the reticular membrane, its aperture should be tiny controlled to maintain reticular Ca2+ homeostasis. To compare, RYR channel shows a narrower diameter, from 0.7 nm to 1 nm [21,22,23]. In absence of translation, GRP78/BiP, a luminal ATP-binding partner of the heat shock protein 70 (HSP70) family of chaperones, binds to the channel to fold neosynthetized proteins and seals the pore [24] to avoid Ca2+ leakage [25]. During translation, the nascent polypeptidic chain may trigger a Ca2+ leak. In fact, a gap between Sec61 and the ribosomes has been suggested [26,27], allowing Ca2+ to cross the channel. In addition, at the end of translation, the polypeptidic chain is no longer in the pore. At that time, ribosomes are still bound and a physiological Ca2+ leak occurs [28].
Research on the TLC complex is made difficult by its imperative requirement for life, explaining why not so long ago most of the studies to investigate the role of TLC in physiopathology have relied on a tightly adjusted pharmacological modulation [29]. Several works, including ours, have thus demonstrated that TLC is a crucial passive Ca2+ leak channel [25,30,31,32,33,34,35,36,37]. More recently, gene silencing experiments have clarified the relative roles of the different Sec proteins, which are described in detail elsewhere [38]. In particular, Linxweiler et al. showed that SEC62 silencing intensifies the reticular Ca2+ efflux [39]. Moreover, Lu et al. have observed a diminished cell viability and an extended rate of apoptosis in the human glioblastoma cells when silencing the SEC61G gene (coding for Sec61γ) [40]. Not surprisingly, the term “Sec61 channelopathies” has newly emerged to design diseases directly affecting Sec61 subunits or components implicated in the pore gating (for a review, see [41]).
Given that TLC is ubiquitously expressed [18] and can contribute to cellular fate, we wondered whether this channel could be an effective target to minimize CM cell death during myocardial infarction. Our hypothesis was that acute pharmaceutical activation of TLC could pre-drain reticular Ca2+ stores before ischemia. This could prevent the massive cytoplasmic Ca2+ overload at reperfusion, as well as the subsequent mitochondrial Ca2+ overload, and consequently curtail I/R-mediated cell death.

2. Materials and Methods

All chemicals and fluorescent probes were purchased from Sigma-Aldrich and Life Technologies unless otherwise specified.

2.1. Animals

Experiments were carried out on 118 male C57BL/6J mice, aged between 8 to 12 weeks, which were obtained from Charles River laboratories. They received human care conformed to the Guide for the Care and Use of Laboratory Animals in our platform (agreement number C-693880502).
All our procedures were approved by the local institutional animal research committee (N°BH2012-65 for the chirurgical procedure and N°BH2012-64 for heart collection; date of approval: 3 December 2012). Animals were randomly distributed towards different experiments and surgical procedures (Ca2+ measurements: 45; H/R: 4; flow cytometry: 15; I/R: 38; heart rate and blood pressure: 12; protein expression: 4).

2.2. CM Isolation

As described previously [9], mice were first injected intraperitoneally by 100 μL of 50 UI/kg heparin sodium and then anesthetized with 70 mg/kg pentobarbital sodium. Once pedal pinch reflexes were completely inhibited, a thoracotomy was performed, and the heart was collected and cannulated by the aorta in a Langendorff system. Blood was washed out with perfusion buffer (in mM: 113 NaCl, 4.7 KCl, 0.6 KH2PO4, 0.6 Na2HPO4, 1.2 MgSO4-7H2O, 0.032 phenol red, 12 NaHCO3, 10 KHCO3, 10 HEPES (4-(2-hydroxyethyl)-1-piperazineethanesulfonic acid), 30 taurine, 10 mM 2.3-butanedione monoxime, 5.5 mM glucose) and pH was adjusted to 7.4. The heart was washed out with this buffer for 5 min at 37 °C.
Then, the heart was perfused at 37 °C with a digestion buffer (perfusion buffer 1×, 0.167 mg/mL Liberase Research Grade (Roche), 0.14 mg/mL trypsine 2.5% 10×, 12.5 μM CaCl2) at a constant rate. At the end of digestion, the enzymatic activity was interrupted by a stopping buffer 1 (Perfusion Buffer 1×, 10% bovine calf serum, 12.5 μM CaCl2) at 4 °C. The left ventricle was isolated in order to detach CM. The solution was then filtered (SEFAR Nitex 102 cm, Zurich Dutsher) in a 10 mL tube. After CM sedimentation, the medium was carefully replaced and cells were re-suspended in stopping buffer 2 (same composition of stopping buffer 1 but with only 5% bovine calf serum). This step was repeated in stopping buffer 2 containing gradually increased Ca2+ concentration (stopping buffer 2 + 0.05, 0.1, 0.5, and 1 mM CaCl2 by increasing order). At the end of the final incubation, cells were suspended in a M199 medium (Gibco) supplemented with 100 U/mL penicillin, 100 μg/mL streptomycin, and ITS (insulin 1 μg/mL, transferin 0.55 μg/mL, selenium 0.5 ng/mL).
CM were then seeded on 35 mm Ibidi dishes (Ibidi Biovalley; for Ca2+ measurements and H/R experiments) or Lab-tek chamber slides (Merck Millipore; for immunostaining), or else on glass coverslips (for Ca2+ transients) precoated with 10 μg/mL laminin (Corning), and then incubated for 2 h at 37 °C. Experiments were realized at the same day of the isolation with a 70–80% living CM estimated by observation.

2.3. Adenovirus Injection for Reticular and Mitochondrial Ca2+ Measurements

Seven- to nine-week-old C57BL/6J mice were anesthetized with isoflurane 2% and buprenorphine (IP, 0.075 mg/kg). Mice oral intubation was performed using a 22-gauge vinyl catheter and ventilated via a mice ventilator (model 687, Harvard Apparatus) with the following parameters: 0.2 mL tidal volume and 160 breaths/min breathe rate. Monitoring of body temperature was realized thanks to a rectal thermometer and maintained at 37 °C using a heating pad. A left thoracotomy was performed in the fourth left intercostal space. When the pericardium was opened, the heart was exposed to perform 4–5 intramyocardiac injections of 5 × 10⁸ PFU (Plaque Formation Unit) of the adenoviruses D4ER (reticular Ca2+ sensor) or 4mtD3CPV (mitochondrial Ca2+ sensor) in a total volume of 20 μL. After surgery, animals were allowed to recover from anesthesia, and once spontaneous breathing resumed, we removed the endotracheal tube. Seven days after recovery, mice were premedicated intraperitoneally with heparin (100 USP (United States Pharmacopeia) units per mouse). Anesthesia was induced with sodium pentobarbital (70 mg/kg). A thoracotomy was performed and the heart was collected. Adult ventricular cardiomyocytes were isolated using enzymatic digestion as described above.

2.4. Ca2+ Measurements

After the 2 h incubation in Ibidi dishes at 37 °C, the culture medium was replaced by a Ca2+-containing buffer (CCB; in mM: 140 NaCl, 5 KCl, 10 HEPES, 1 MgCl2, 2 CaCl2, 10 glucose; adjusted to pH 7.4). Cardiomyocytes were loaded in CCB containing 5 µM of fura-2-acetoxymethyl ester (fura2-AM) (for cytosolic Ca2+ imaging) for 30 min at room temperature.
After the fura2-AM loading, cells were washed twice for 5 min with a Ca2+-free buffer (CFB) (same as CCB but without CaCl2) containing 0.1 mM EGTA (ethylene glycol tetraacetic acid).
Pretreatment protocol: CM were pretreated with 200 µM puromycin for 30 min while being loaded with the probe, and in the case of double pretreatment with emetine, 20 µM of the latter was added 30 min before CM probe loading. In both cases, once the drug was added, it remained present during the whole experiment. The TLC inhibitor (emetine) was applied 5 minutes before its activator (puromycin) to ensure prior TLC inhibition and to avoid concomitant opposite effects of these compounds on TLC Ca2+ leakage [31,32]. After signal stabilization, CM were stimulated by either 5 µM ionomycin, 25 µM FCCP (Carbonyl cyanide 4-(trifluoromethoxy)phenylhydrazone), or 10 mM caffeine.
An ischemia-like hypoxia experiment was performed in a hypoxic chamber (Okolab-Bold line) where temperature and oxygen levels were monitored. Fura2-AM-loaded CM were washed with CCB, then, after fluorescence signal stabilization, we replaced the medium to hypoxic buffer (CCB without glucose) deprived from any supplementation or growth factor necessary for CM survival and normal function, and ventilated it with 99% N2 in order to replace all oxygen traces in the medium. Oxygen level was decreased in the chamber to 1%. After 30 min of ischemia-like hypoxia, CM were stimulated by 10 mM caffeine.
Measurements were performed using a wide-field LeicaDMI6000B microscope equipped with an Orca-Flash4.0 digital camera (HAMAMATSU). Using a Lambda DG-4+ filter (Sutter instruments), fura-2 AM was excited at 340 and 380 nm and their respective emitted fluorescence lights were measured at wavelength 510 nm. D4ER and 4mtD3CPV (Förster resonance energy transfer (FRET)-based sensors) were excited at 477 nm (CFP: Cyan Fluorescent Protein) and 514 nm (YFP: Yelllow Fluorescent Protein). Their emitted fluorescent lights were assessed at wavelength 540 nm. Images (2048 × 2048 pixels) were taken at 3 second intervals. Free Ca2+ content was estimated by the YFP to CFP fluorescence ratio, which was figured out as described in [42].
All experiments were performed at room temperature in a calcium-free buffer to prevent capacitative Ca2+ entry that would then add to the emptying of intracellular Ca2+ stocks, except for in vitro H/R and paced experiments.

2.5. Ca2+ Transients

For Ca2+ transients experiments, CM were plated on 24 mm glass coverslips. Coverslips were mounted on a Quick Change Chamber (RC-47FSLP Warner Instruments) and stimulation was delivered by a MyoPacer Field Stimulator (IonOptix). CM were loaded at 37 °C with fluo5-AM (5 μM) for 30 min. After loading, cells were washed in CCB, then the medium was replaced by a field stimulation buffer (FSB; in mM: 150 NaCl, 5.4 KCl, 10 HEPES, 2 MgCl2, 1 glucose, 2.5 pyruvate, 5 creatine, 5 taurine, 2 CaCl2). Cytosolic Ca2+ transients were recorded in fluo5-AM-loaded CM, field-stimulated at 1 Hz with a current pulse delivered via 2 platinum electrodes at RT for 0.5 ms and at 40 V amplitude. To measure mitochondrial Ca2+ transients, we injected mice with 4mtD3cpv adenovirus, as described previously. Isolated mice CM expressing the probe were field-stimulated for 1 min successively at 0.5, 1, and 2 Hz in FSB.
Fluo5-AM images were acquired with a Nikon A1Rplus confocal microscope equipped with a ×40 oil-immersion objective (line-scan mode = 256 lines per ms). Scanning was performed along the long axis of the cell. Fluo5-AM was excited at 488 nm by argon-ion laser. The respective emitted fluorescent light was collected at wavelength 525/50 nm using one high sensitive GaAsp detector. Cytoplasmic Ca2+ signal analysis was performed using custom-written [43] for the amplitude and the rate of decay, and the rising slope was obtained with an exponential fit (Origin Pro 8 software). 4mtD3cpv fluorescence was acquired as above.

2.6. Calcein Cobalt Protocol

Calcein method with cobalt quenching was used in order to evaluate mitochondrial mPTP opening [44,45]. Kinetics of mPTP opening were measured in live CM. Briefly, 1 µM calcein-AM was used for cell loading in CCB for 15 min at room temperature. After two washes, cells were additionally incubated for 30 min with 2 mM cobalt chloride and 200 µM sulfinpyrazon in CCB. Using a Nikon confocal microscope, cells were imaged every 5 seconds under resting conditions for 2 min before application of 2 µM ionomycin, which triggered the mPTP opening. Calcein-AM was excited at 488 nm by argon-ion laser. The respective emitted fluorescent light was collected at wavelength 525/50 nm using one high sensitive high sensitive GaAsp detector. A decrease in mitochondrial calcein-AM fluorescence reflects the opening of mPTP. For data analysis, background was subtracted and curves were normalized with the basal fluorescence.

2.7. In Vivo Model of Acute myocardial I/R Injury

As described previously, after anesthesia with 0.075 mg/kg of buprenorphine and 70 mg/kg of pentobarbital, C57BL/6 J (male, 8–10 weeks old) mice were intubated and put under assisted respiration. Heart rate was monitored by an electrocardiogram. A thoracotomy was performed, allowing access to the heart after cutting the fifth rib, as well as upper and lower intercostal muscles. The pericardium was then opened in order to place a knot around the anterior interventricular artery (IVA). Ischemia was affirmed on the electrocardiogram by the shift of the ST-segment (flat isoelectric section on electrocardiography between the end of the S wave and the beginning of the T wave) and lasted 45 min. Preconditioning was performed by IV injection of puromycin in the jugular vein 10 min before ischemia, whereas control mice were injected with the same volume of saline solution at 0.9%. At the end of the ischemia, the knot was loosened to reestablish blood circulation and the wound was stitched. Animal state and recovery were monitored for 24 h.
After 24 h of reperfusion, the animal was again anesthetized following the same protocol and then intubated with the rib cage being re-opened. The knot placed around the anterior inter-ventricular artery was recovered, and was then constricted to occlude the artery again. Evans blue dye was then injected through the vena cava, thus allowing the healthy zone to be colored in blue, leaving the ischemic area in pink, the area-at-risk (AR). The diffusion of Evans blue made it possible to discriminate the healthy zone (non-ischemic) of the AR.
Slices of the left ventricle that were 1mm thick were cut from the apex and delicately covered by a glass plate to be photographed. The slices were then incubated for 15 min in triphenyltetrazolium chloride (TTC) in order to discriminate the necrosis area (AN). Slices were weighed and sizes of different areas were determined by computer in planimetry (SigmaScanPro5). Myocardial infarct size was expressed as percentage of the ratio of the necrosis area (AN) over the area-at-risk (AR). Sham mice that underwent surgery without I/R were used as controls.

2.8. CM Mortality

Adult mouse cardiomyocytes (250 µg protein) were kept in suspension according to the two experimental groups: hypoxia-reoxygenation group (HR) and preconditioning by puromycine (PreC Puro, 200 µM, 30 min prior to hypoxia reoxygenation sequence), as previously described [46]. HR cells were incubated with 1.5 mL hypoxia buffer (140 mM NaCl, 5 mM KCl,1 mM MgCl2, 10 mM HEPES, 2 mM CaCl2). Hypoxia cells were transferred into a hypoxia incubator on the rocking platform at 37 °C with 0.5% O2. Cells were submitted to hypoxia for 1 h 30 min. In terms of reoxygenation, at the end of hypoxia, medium was changed for plating medium (MEM (Minimal Essential Medium) supplemented with 10% FBS, 1% penicillin/streptomycin, 10 mM butanedione monoxime, 2 mM glutamine, 200 mM ATP) and replaced into the incubator at 37 °C for 1 h. After the total sequence of hypoxia reoxygenation, a Fortessa X-20 instrument (BD Biosciences) was immediately used for flow cytometry measurements. To evaluate the cell viability, cardiomyocytes were loaded with propidium iodide (1 µg/mL) and analyzed extemporaneously. DIVA Software (BD Biosciences) was employed for data analysis by acquisition of 1000 events, and results were expressed as percentage of propidium iodide-positive cells (dead cells).

2.9. Statistical Analysis

Data are presented as medians. For small datasets (n < 10), data are represented as scatter plots that also show median. For larger datasets, data are represented as box and whisker plots where the line in the middle of the box is the median, the whiskers are drawn down to the 10% quartile value and up to the 90% quartile value, and additionally a “+” appears at the mean. For comparison between two groups, the Mann–Whitney non-parametric test was used, whereas the non-parametric Kruskal–Wallis test followed by the Dunn’s multiple comparisons test was used to analyze differences between multiple groups (unless otherwise specified). For flow cytometry analysis, Wilcoxon matched-pairs signed rank tests were performed. In the two-way ANOVA, one factor was the effect of puromycin pretreatment and the other factor was the effect of the frequency stimulation; values were matched and Bonferroni post-hoc test was used. Experiments were performed at least three times or more. Statistical analysis was performed with GraphPad Prism 6 software (La Jolla, CA, USA). p < 0.05 was considered significant.

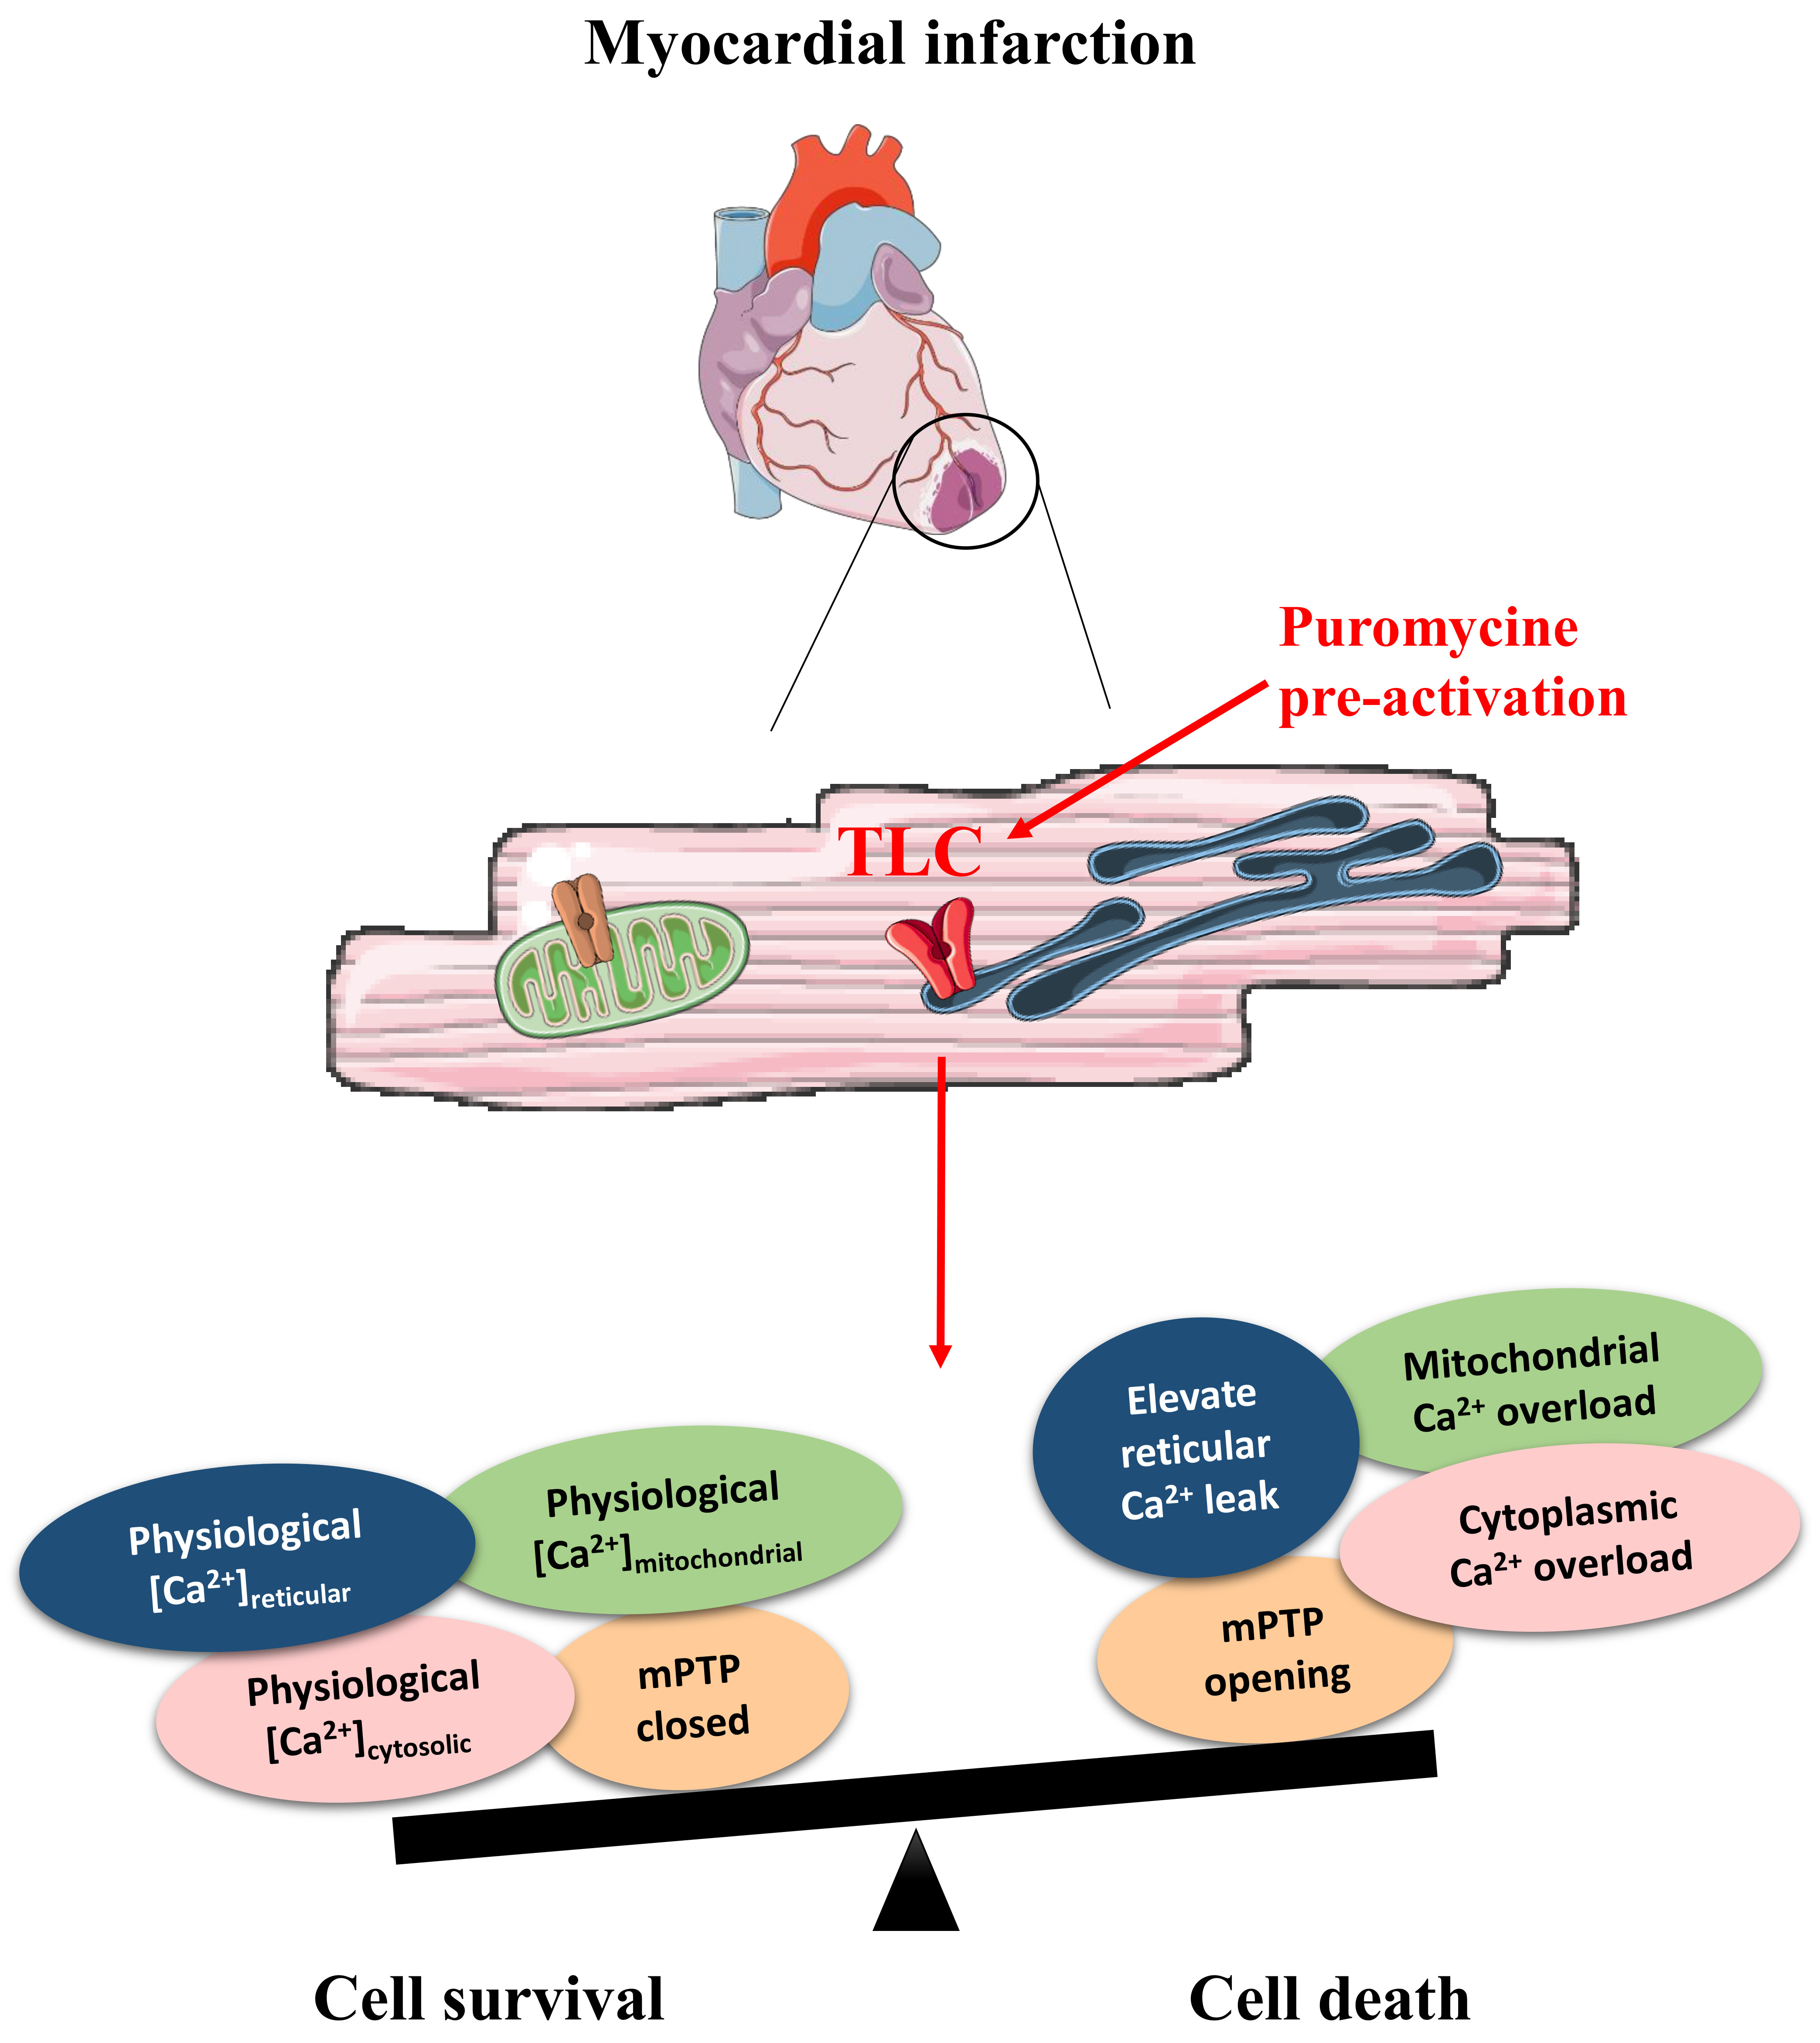
3. Results and Discussion

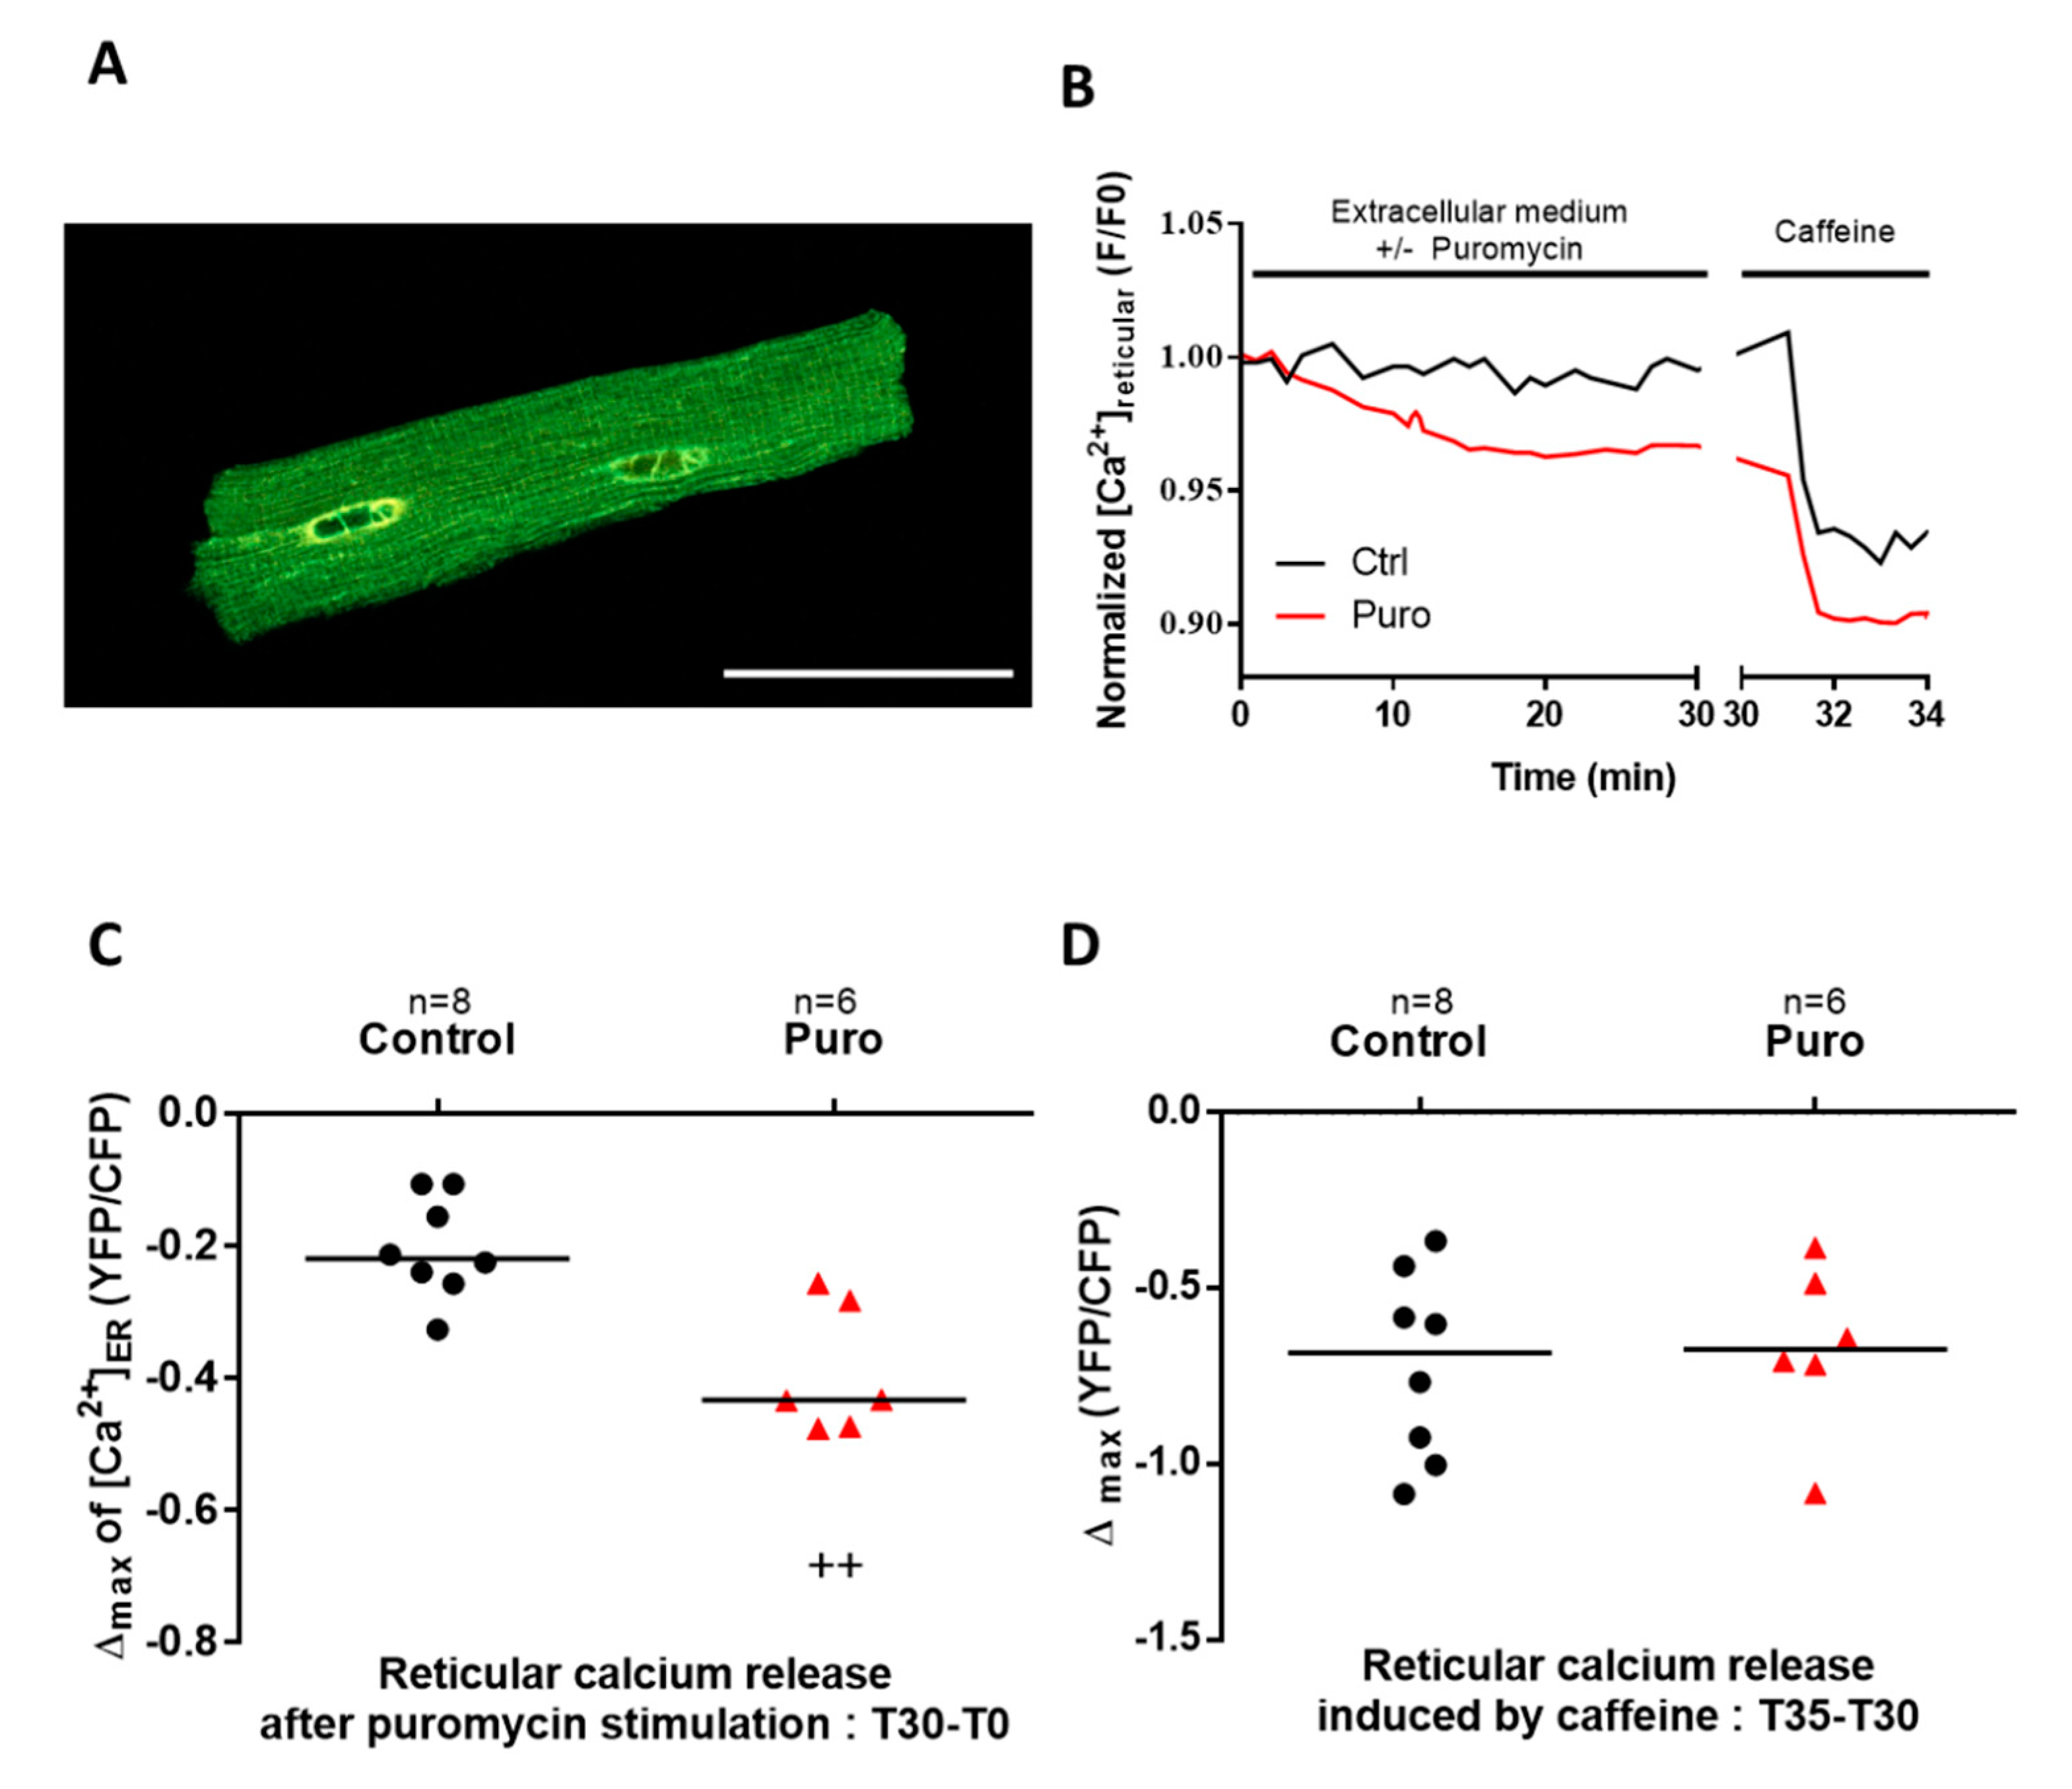
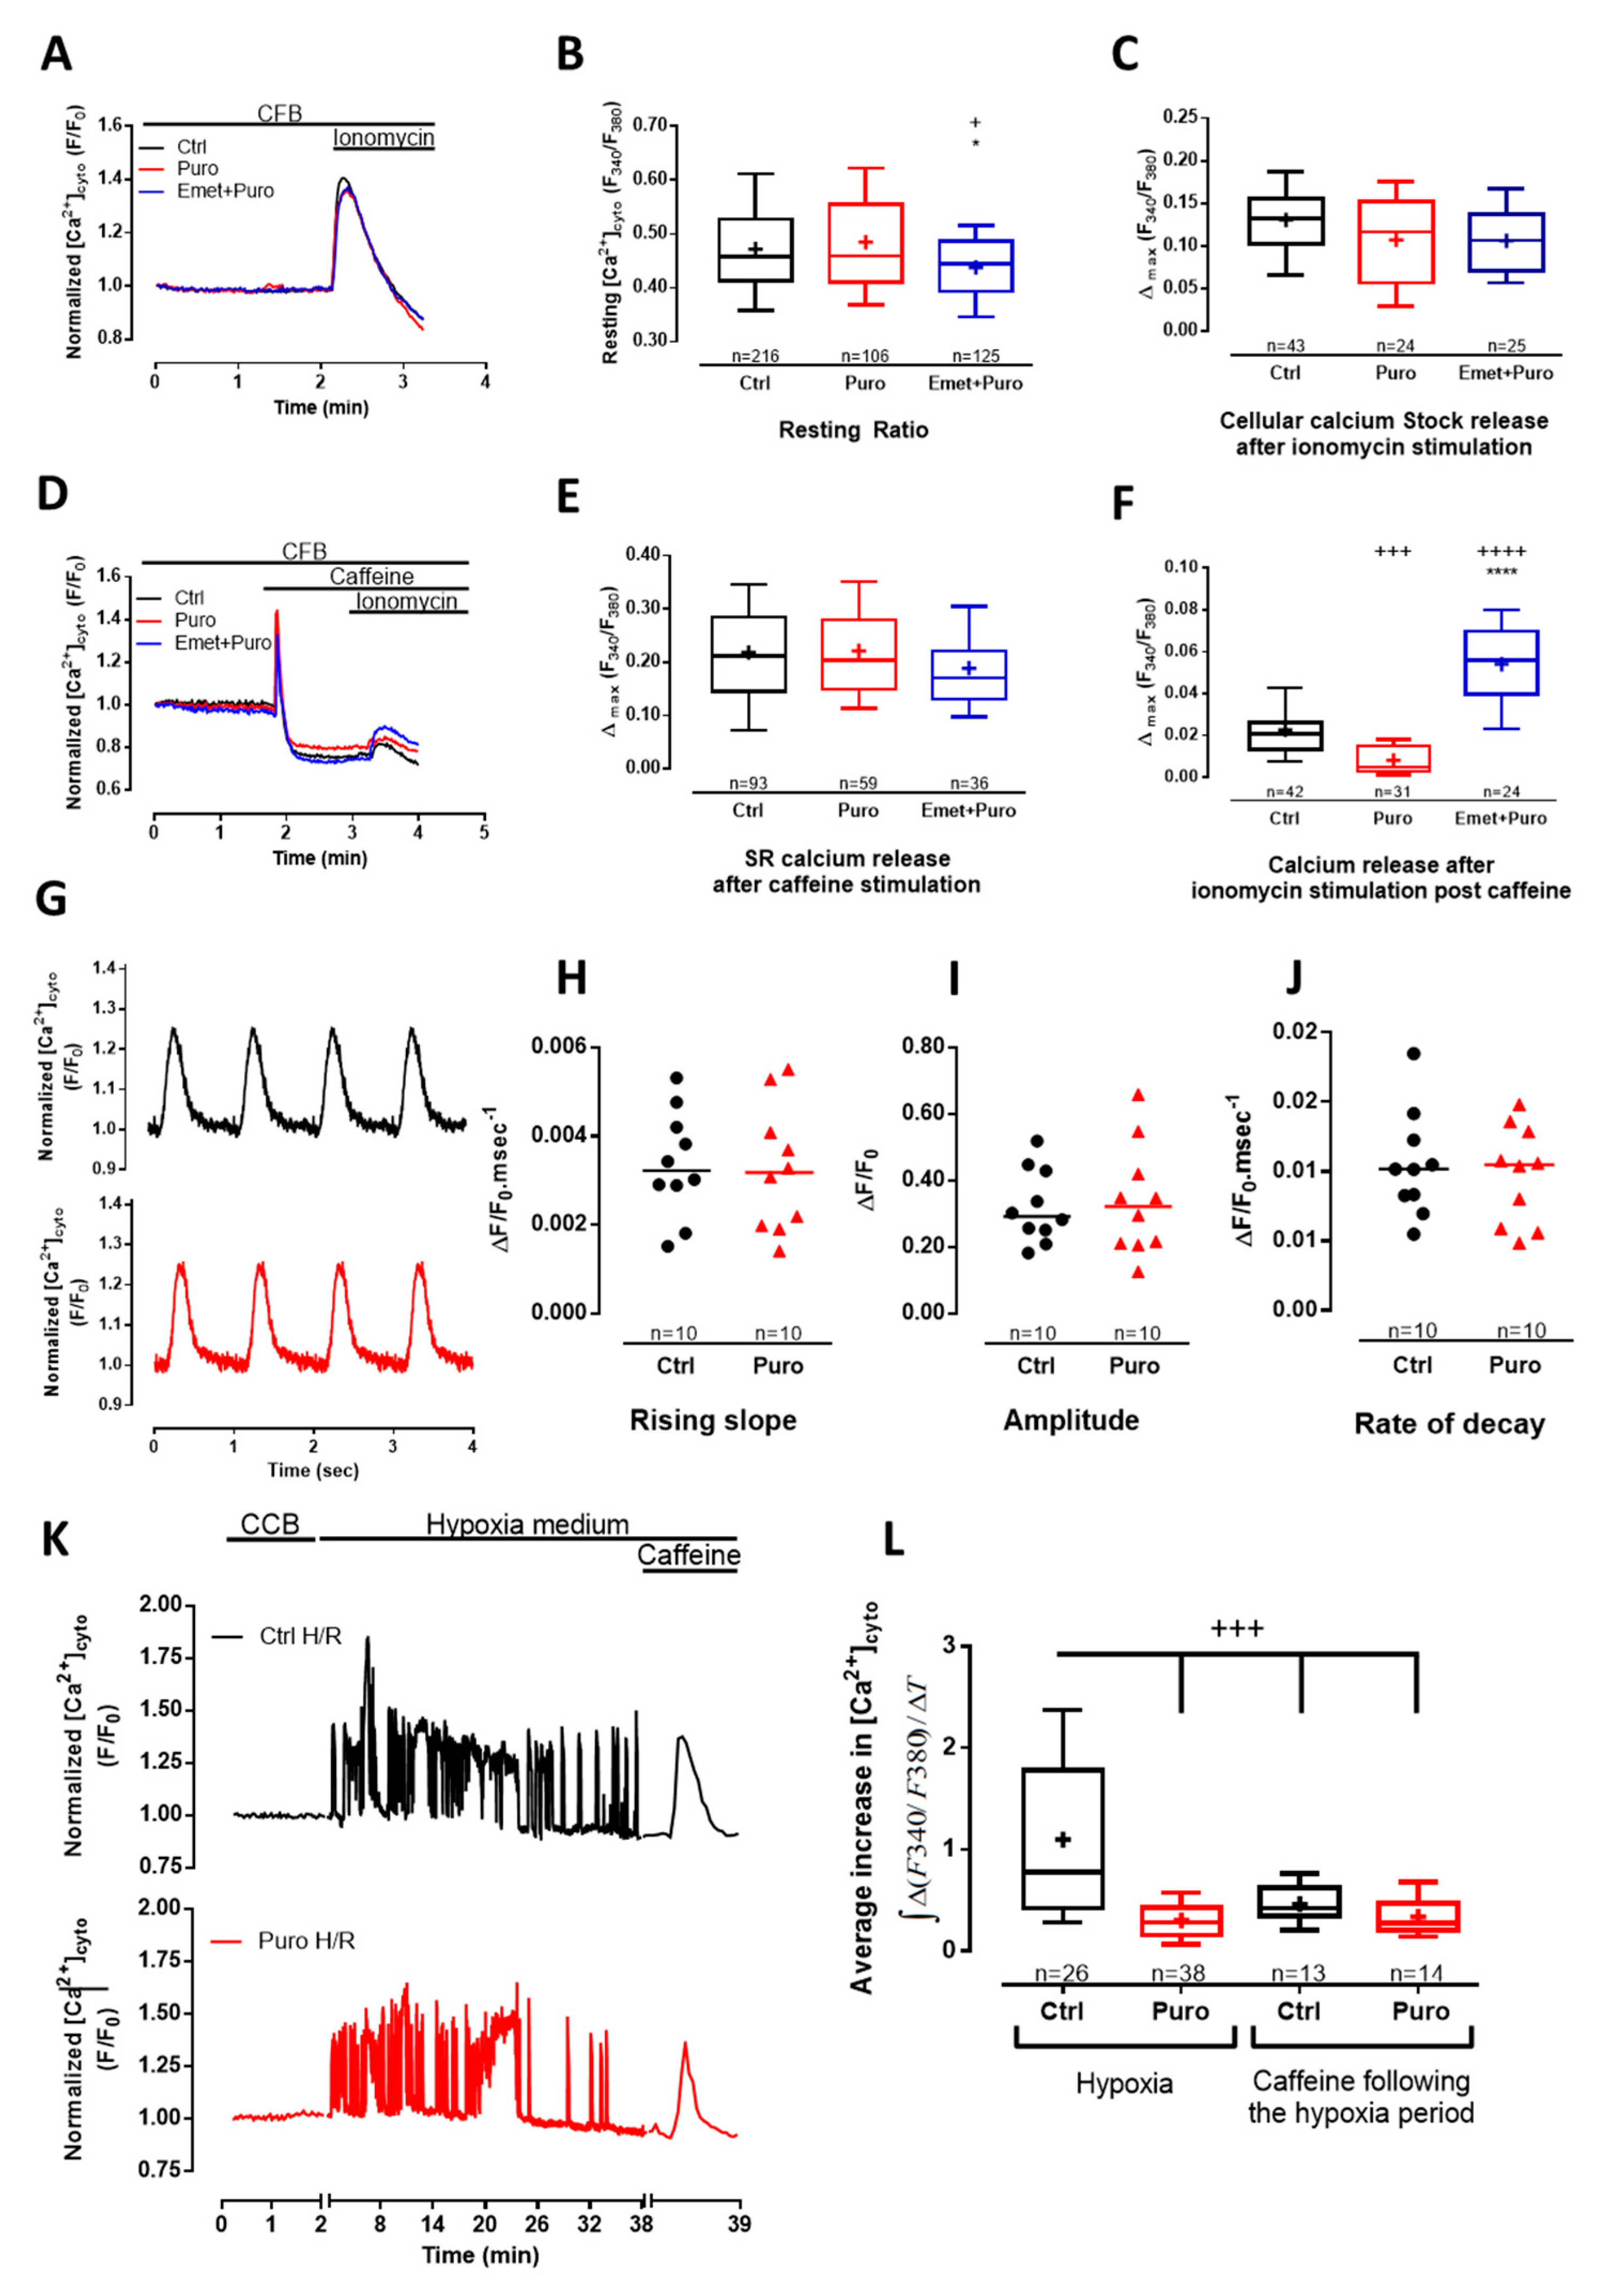
3.1. TLC Is a Functional Reticular Ca2+ Leak Channel in Isolated Mouse CM: Its Activation Mobilized a RyR-Independent Ca2+ Reticular Pool and Did Not Affect Excitation–Contraction (E-C) Coupling

First, TLC expression in mouse CM was confirmed by Western blot (Figure S1). We then investigated the functionality of TLC as a reticular Ca2+ leak channel by monitoring the evolution of the reticular Ca2+ concentration ([Ca2+]r). To this end, we used an in vivo adenoviral delivery strategy based on an intramyocardial injection of an adenovirus encoding a FRET-based reticular Ca2+ sensor, D4ER (Figure 1A). One week after the injection, adult mouse CM were freshly isolated. These primary cells provided us with a powerful model for heart research at the cellular level. Unfortunately, their lifetime is not compatible with transgenic modulation of TLC component expression, as both require transfection and a significant period of expression. Therefore, our present investigation was based on the use of TLC pharmacological agents. Puromycin mimics the 3’ end of aminoacetylated tRNA (transfer ribonucleic acid), releases the nascent peptidic chain, and allows Ca2+ to leak through the pore from the lumen to the cytoplasm [25,31,32]. On the other hand, emetine prevents ribosome binding to TLC and then avoids Ca2+ leak [47]. When cardiomyocytes were treated with puromycin (200 µM) for 30 min, we observed a significant and progressive [Ca2+]r decrease (Figure 1B,C; fluorescent ratio: −0.4334 vs. −0.2197) showing that TLC is a functional reticular Ca2+ leak channel in this model. The reticular RyR-dependent Ca2+ pool was then determined by a treatment with caffeine and was similar in control and in puromycin-treated CM (Figure 1D). Interestingly, these findings indicate that the caffeine-sensitive Ca2+ stores could be independent of the puromycin-sensitive Ca2+ stores, that is, RyR and TLC activation would mobilize two different Ca2+ pools. With a comparable approach using an angiotensin II treatment, we found no impact of TLC activation on the IP3R-dependant Ca2+ reticular stocks (Figure S2).
Next, we analyzed whether puromycin treatment could modify the cytosolic Ca2+ concentration ([Ca2+]cyto) using fura-2 loaded cells. Because acute puromycin perfusion failed to trigger a significant increase in [Ca2+]cyto, we submitted CM to a 30 min puromycin pretreatment, combined or not with emetine (as a control in order to inhibit puromycin activity). Steady-state [Ca2+]cyto was unchanged after puromycin-pretreatment (fluorescent ratio: 0.4583 vs. 0.4577 in control (Ctrl)), but was slightly decreased after a pretreatment with emetine prior to puromycin (fluorescent ratio: 0.4453; Figure 2A,B). No change in total cell Ca2+ content, quantified thanks to ionomycin treatment, was observed in CM pretreated with puromycin or concomitantly pretreated by puromycin and emetine (Figure 3A–C). To explain these results, one should note that the time-course of the puromycin response via TLC is slower than the caffeine time-course (Figure 1B). Moreover, one should be reminded that cytosolic Ca2+ elevations are counteracted by the combined action of Ca2+ reuptake by SERCA pumps, extrusion by the plasma membrane Ca2+ ATPase (PMCA) and the plasma membrane Na+/Ca2+ exchanger (NCX), and absorption by the mitochondria [48]. Thus, Ca2+ leakage triggered by puromycin treatment did not change the global [Ca2+]cyto at rest, even if TLC participated in its regulation (as shown by its inhibition by emetine prior to puromycin application).
To complete the study of the putative dichotomy between the TLC Ca2+ store (activated by puromycin) and the RyR-dependent Ca2+ store (sensitive to caffeine) and to evaluate their relative size, we first perfused caffeine to deplete the RyR-dependent stores, and consecutively we applied ionomycin to reveal the residual reticular Ca2+ pool (Figure 2D–F). The caffeine response was similar in each condition: control, puromycin, and puromycin + emetine (Figure 2D,E), corroborating our previous [Ca2+]r results (Figure 1). The size of the remaining caffeine-insensitive stores was smaller in puromycin-treated cells (fluorescent ratio: 0.005) than in controls (fluorescent ratio: 0.021; Figure 2F), proof of a prior depletion of TLC-dependent store. Conversely, emetine pretreatment not only abolished the effect of puromycin, but also triggered a larger increase (fluorescent ratio: 0.056) in the remaining Ca2+ stock compared to control CM (Figure 2F). This suggests that the inhibition of the reticular Ca2+ leak via TLC enhanced the concentration of this Ca2+ pool. Interestingly, we have previously shown similar results using human cancerous prostatic cells where the chronic inhibition of TLC caused an increase in the reticular Ca2+ concentration [25]. In order to sustain our results, we alternatively used pactamycin, another pharmacological Ca2+ leak inducer via TLC, and showed comparable effects on SR Ca2+ content (Figure S3).
It is common knowledge that reticular Ca2+ content is crucial for CM contraction, and changes in internal reticular Ca2+ stock could impair the excitation–contraction coupling mechanism. In order to evaluate whether TLC modulation could affect this parameter, we measured cytoplasmic Ca2+ transient in paced control and puromycin-pretreated CM (Figure 2G). Neither the rising slope (0.0033 vs. 0.0032 ΔF/F0.ms−1; Figure 2H), nor the amplitude (0.2923 vs. 0.3221 ΔF/F0; Figure 2I), nor the rate of decay (0.0102 vs. 0.0105 ΔF/F0.ms−1; Figure 2J) of Ca2+ transients were modified by puromycin pretreatment compared to the control, which goes along the line of two independent Ca2+ stores.
In summary, our data illustrated that the well-known caffeine store cohabits with the brand new puromycin-sensitive store in primary mouse CM, which is in agreement with the work of Sleiman and colleagues [49], showing a dichotomy between cardiac endoplasmic reticulum (where protein synthesis takes place) and sarcoplasmic reticulum. Indeed, it would then be possible to have a fine [Ca2+]r modulation independently of RyR pathways and by extension without modifying the excitation–contraction coupling. In future studies, it would also be interesting to look closer at the perinuclear level, a particular region enriched in both IP3R and ribosomes, and discover how TLC activation modulates the nuclear Ca2+ concentration.
During ischemia, the decline of ATP synthesis impairs SERCA activity. The consequences are cytosolic Ca2+ oscillations due to transient release of Ca2+ from the reticulum. We thus investigated whether puromycin preconditioning could attenuate cytosolic Ca2+ overload occurring during hypoxia in non-paced cells (Figure 2K). The average increase in the cytosolic Ca2+ concentration over hypoxia was figured out as the integrate of erratic Ca2+ transients above the basal cytosolic Ca2+ concentration. First, we visualized autonomous but erratic Ca2+ rises in cytosol of CM during hypoxia. Second, as reported in Figure 2L, the average increase in the cytosolic Ca2+ concentration due to hypoxia was found to be about two times higher than the one induced by caffeine (0.7783 s−1 and 0.4199 s−1, respectively). Third, the increase in the cytosolic Ca2+ concentration over a 30 min hypoxia was lowered by ≈64% in CM pretreated with puromycin compared to control CM (0.2829 s−1 and 0.7783 s−1, respectively). Lastly, caffeine-dependent Ca2+ stores after the 30 min hypoxia were similar between control and puromycin-preconditioned CM (Figure 2K,L). In addition, steady-state caffeine-dependent Ca2+ fluxes, estimated by the average increase in the cytosolic Ca2+ concentration after caffeine treatment, were significantly increased after 30 min of hypoxia (Figure S4).
Taken together, our findings showed no effect of puromycin pretreatment on caffeine-dependent Ca2+ pool, nor, more importantly, on the excitation–contraction coupling. Furthermore, we demonstrated that the puromycin-mediated decrease in the Ca2+ stores was accompanied by a threefold lower increase in the cytosolic Ca2+ concentration during hypoxia. Finally, we found that the caffeine-sensitive Ca2+ store after hypoxia was similar in non-treated cells and in puromycin-treated CM, which substantiated our previous observations.

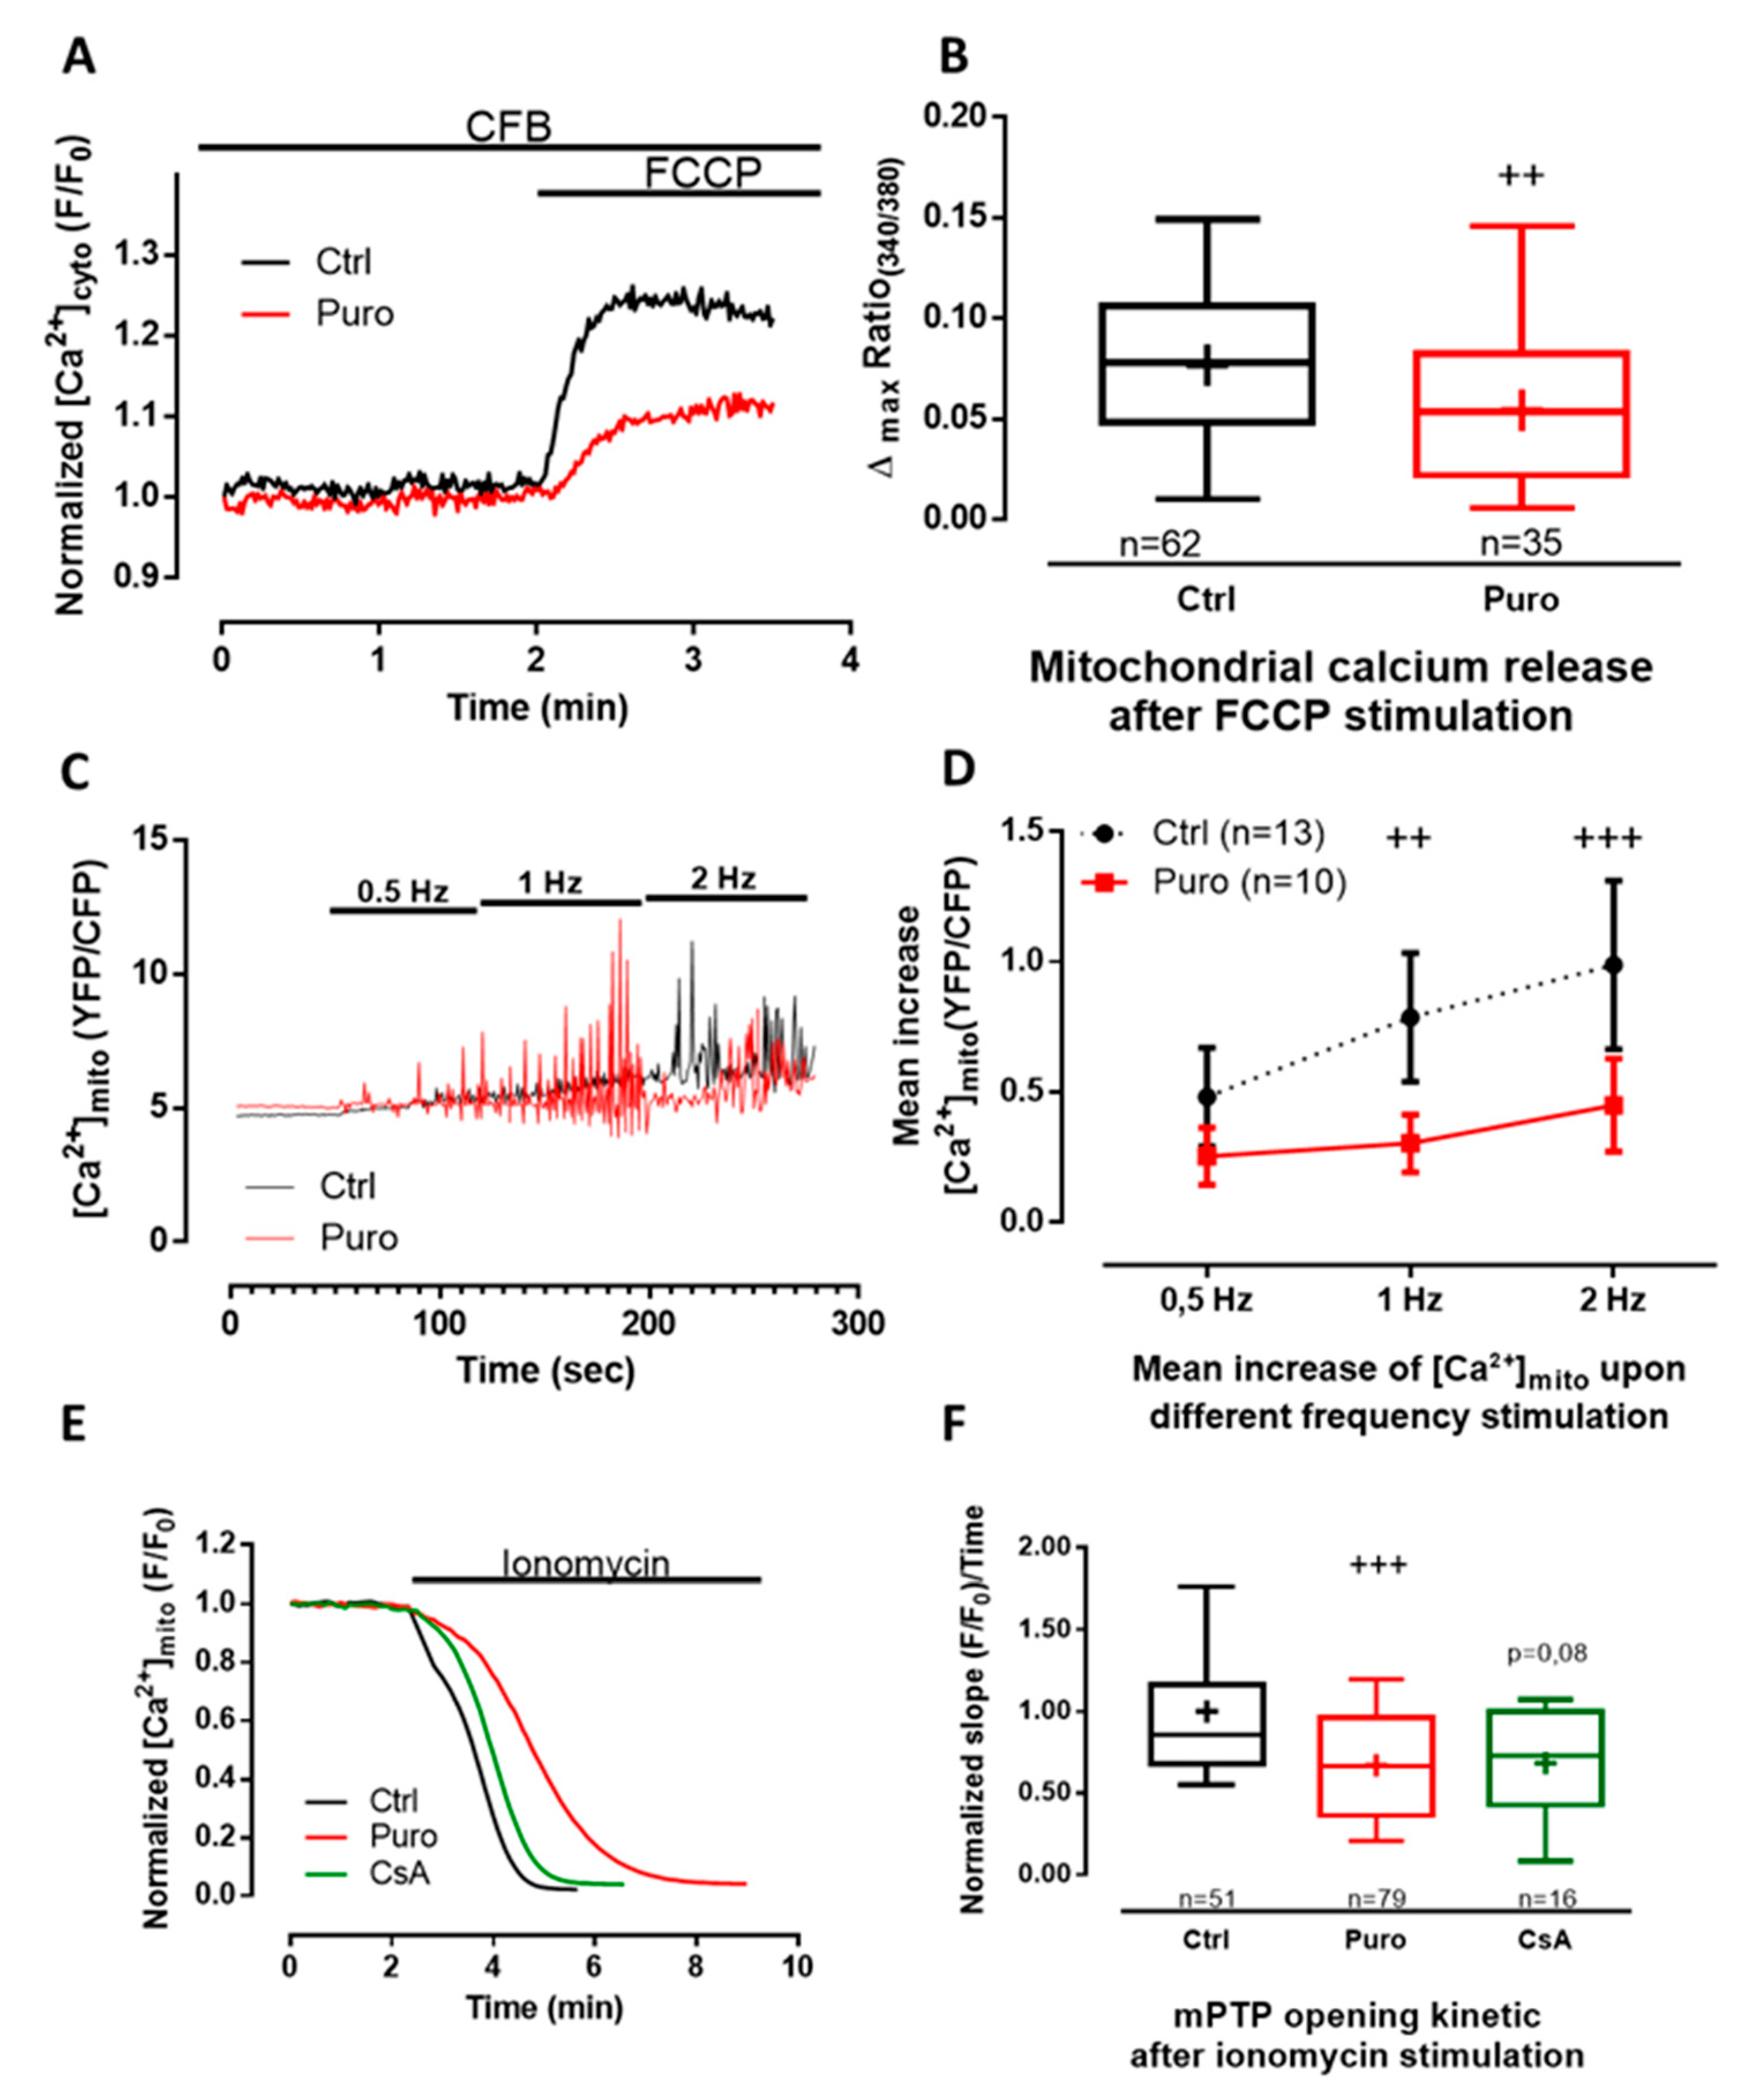
3.2. Pharmacological Modulation of TLC with Puromycin Pretreatment Affected Mitochondrial Ca2+ Content in Beating (But Not in Resting) CM and Slowed down the mPTP Opening

As mitochondria buffer cytoplasmic Ca2+ increase and as mitochondrial Ca2+ uptake is faster than its release [50], there is probably a progressive enhancement of Ca2+ into the matrix during ischemia because the threshold of mPTP opening is reached, leading to apoptosis. We then looked at whether TLC activation could modify mitochondrial Ca2+ homeostasis. We thus wondered whether the puromycin pretreatment could shift the steady-state Ca2+ content in mitochondria of CM expressing the 4mtD3cpv FRET-based sensor (Figure S5A,B). No difference could be detected when comparing the control and puromycin-pretreated CM in the resting mitochondrial Ca2+ concentration ([Ca2+]mito; fluorescent ratio: 5.185 vs. 5.087, p = 0.1436; Figure S5B). However, the small decrease in the ratio of fluorescence after ionomycin treatment in the absence of external Ca2+ (Figure S5C) revealed that the steady-state Ca2+ concentration was at the edge of the dynamic range of 4mtD3cpv biosensor (Kd = 0.6 µM). This could have impaired the detection of significant differences in the mitochondrial Ca2+ content in control and puromycin-treated CM. We therefore performed an indirect measurement of the mitochondrial Ca2+ content. FCCP, an ionophore used to decouple ATP synthesis from the mitochondrial respiratory chain, induced the leak of mitochondrial Ca2+ content, which was measured by the cytosolic fura2-AM probe (Kd = 140nM). Puromycin pretreatment significantly decreased mitochondrial Ca2+ stores by ≈31% (fluorescent ratio: 0.0536 vs. 0.0781; Figure 3A,B), highlighting the role of TLC in the modulation of Ca2+ exchange between the reticulum and mitochondria.
We then measured mitochondrial Ca2+ fluxes in paced CM and assessed the effect of a puromycin pre-treatment (Figure 3C,D). Quantitatively, the increase of the frequency of stimulation was correlated to a steady-state mitochondrial Ca2+ elevation both in control and in puromycin-pretreated CM (two-way ANOVA, frequency stimulation affected the results with a p-value < 0.0001). Moreover, although [Ca2+]mito rose with the pacing frequency in control CM, interestingly this rise was shifted to higher frequencies of pacing in CM treated with puromycin (two-way ANOVA, p = 0.0035; frequency–pretreatment interaction was F = 4.9, p = 0.0121). Because no difference could be detected in cytosol (Figure 2G–J), the apparent decrease in [Ca2+]mito in beating cells could be explained by a direct effect of puromycin decreasing Ca2+ influx from reticulum to mitochondria. To test this hypothesis, we performed a Ca2+ retention capacity assay (CRC is the amount of Ca2+ that can be sequestered by mitochondria until the permeability transition occurs) in isolated mitochondria of CM and did not find any effect of puromycin pretreatment on either the Ca2+ intake or mPTP opening (Figure S6). These results suggest that puromycin neither directly challenged Ca2+ intake by MCU nor directly opened mPTP.
We next questioned if the puromycin-mediated decrease in mitochondrial Ca2+ content could retard mPTP opening in living CM. We valued mPTP opening by the “calcein/cobalt” method (Figure 3E,F). Cyclosporin A (CsA), known for slowing down mPTP opening, was used as a positive control [51]. We found that mPTP opening was significantly delayed in puromycin-pretreated (0.6665 compared to control 0.8559), whereas we only observed a tendency in CsA-pretreated CM (0.7287; p = 0.08).
Jointly, our results point out that pharmaceutical activation of TLC enhances mitochondrial tolerance to handle Ca2+ by decreasing both steady-state mitochondrial Ca2+ content and the average Ca2+ level in mitochondria of beating CM. This may explain how puromycin pretreatment slowed down mPTP opening by decreasing reticular Ca2+ leak during ischemia and augmenting the tolerance to Ca2+ of mitochondria by reducing the average mitochondrial Ca2+ concentration. An enhanced tolerance of mitochondria to Ca2+ load has been revealed to be crucial to evade mPTP opening and in triggering cell death [51]. A similar proof-of-concept has been previously reported by Petrovski et al. [52], as they described the beneficial effects of thapsigargin (a SERCA pump inhibitor that induces reticular Ca2+ leak at low doses) in a preconditioning protocol in rats by decreasing infarct size and improving left ventricular function. However, it is obvious that SERCA inhibition will also lead to inhibition of CICR and thus prevent CM contraction [19].

3.3. Pharmacological Modulation of TLC with Puromycin Pretreatment Protected CM after In Vitro H/R, and Reduced Infarct Size in Mice Submitted to In Vivo I/R

To our knowledge, nothing is known about modulation of TLC activity during hypoxia or ischemia. First, one can assume that translation is reduced during hypoxia and it should be the same for the associated Ca2+ leak via TLC. Second, hypoxia triggers an increase in cytosolic Ca2+ concentration, partly due to a decline of ATP synthesis necessary for SERCA pumps to reuptake Ca2+ into the lumen. An interesting study characterized a calmoduline (CaM)-binding motif in Sec61α [36]. Using microsomes, the authors showed that CaM closes the channel in a Ca2+-dependent manner. Then, in the context of hypoxia, we may hypothesize that Ca2+ permeability of TLC is reduced.
In the following, we examined whether puromycin pretreatment (i.e., prior to hypoxia or ischemia) might be an effective cardioprotective strategy. CM death after hypoxia/reoxygenation (H/R) was appraised by a multilabeling flow cytometry analysis. Propidium iodide quantification was performed after 1 h 30 min hypoxia and 1 h reoxygenation with or without puromycin 200 µM pretreatment. Results highlighted a protective effect of puromycin by reducing cell mortality by ≈6% compared to control H/R (56% vs. 62%; Figure 4A,B). Concomitantly, CM were loaded with DilC1(5), MitoSOX Red, and MitoTracker Deep Red in order to respectively check the mitochondrial potential membrane, the production of ROS (reactive oxygen species), and the mitochondrial mass. No significant difference was observed between Ctrl and puromycin-treated cardiomyocytes submitted to H/R (Figure S7). This absence of effect on mitochondrial function meant that TLC activation did not worsen mitochondrial damage due to H/R but also did not improve it either, reinforcing our conclusions that TLC-conferred protection does not act directly on mitochondria but rather it is due to the modification of the reticular Ca2+ homeostasis.
Because TLC stimulation by puromycin enhanced cell survival when submitted to H/R, we assessed its putative protective action in an in vivo mouse model of myocardial I/R preconditioned or not with puromycin. In order to optimize the treatment efficiency, we performed dose–effect experiments. Infarct size estimation was figured out after 45 min ischemia and 24 h reperfusion (Figure 4C). Optimal preconditioning was obtained with a 0.8 mg/kg puromycin treatment and showed a reduction of ≈34.5% in infarct size compared to control mice (Figure 4D,E). Higher puromycin concentrations failed to protect mouse heart. It is important to notice that neither blood pressure nor heart frequency were modified at the optimal dose of 0.8 mg/kg puromycin (Figure S8).
In brief, these last results underlined the fact that CM death can be partly prevented during ischemia by a moderate reticular Ca2+ depletion via TLC activation, which in turn might decrease Ca2+ toxicity in both cytosol and mitochondria. One can easily imagine that TLC activation, prior to ischemia, increases the reticular Ca2+ leak. In turn, it might cause a mild ER stress, from which there is growing evidence that it contributes to protect CM from cell death [53].

4. Conclusions

Our results showed for the first time that the modulation of TLC-dependent reticular Ca2+ store is correlated with the modulation of several processes involved in cell fate—mitochondrial tolerance for cytoplasmic Ca2+ increase, mPTP opening, and tilting the cell balance on the side of cell survival. In fact, most studies on CM protection during ischemia/reperfusion relied on avoidance of mitochondria death and emphasized the concept of direct inhibition of mPTP. We believe that the multiple consequences of the decrease in reticular Ca2+ content could induce a robust cardioprotective effect, less prone to individual fluctuations. Even though our results rely on pre-activation of TLC, that is, I/R preconditioning, and cannot be used during myocardial infarction, this study opens new perspectives on Ca2+ modulation that could be useful for further investigations on postconditioning, thus broadening future therapeutic possibilities.

Supplementary Materials

The following are available online at https://www.mdpi.com/2073-4409/9/5/1319/s1, Figure S1: TLC expression in CM. Figure S2: TLC activation by puromycin did not modify the IP3R-dependant reticular Ca2+ stock. Figure S3: Similar effect for puromycin and pactamycin of cellular Ca2+ concentration. Figure S4: Cytosolic Ca2+ caffeine-induced release in control condition and after hypoxia. Figure S5: Mitochondrial Ca2+ concentration measured with 4mtD3cpv. Figure S6: CRC measurement. Figure S7: Puromycin pretreatment did not modify the mitochondrial function in CM after in vitro hypoxia/reoxygenation (H/R) protocol. Figure S8: Puromycin treatment at 0.8mg/kg had no effect on blood pressure and heart frequency.

Author Contributions

Conceptualization, R.A.-M., G.B., S.D., and F.V.C.; data curation, S.D. and F.V.C.; formal analysis, R.A.-M., M.D., N.T., B.P., Y.G., C.V., Z.H., A.P., C.C.D.S., G.B., and S.D.; funding acquisition, M.O. and F.V.C.; investigation R.A.-M., M.D., N.T., L.P., B.P., Y.G., Z.H., A.P., C.C.D.S., and S.D.; methodology, R.A.-M., M.D., N.T., S.D., and F.V.C.; project administration, S.D. and F.V.C.; resources, M.O.; supervision, M.O., G.B., S.D., and F.V.C.; validation, R.A.-M., M.D., N.T., S.D., and F.V.C.; visualization, S.D.; writing—original draft, R.A.-M., G.B., S.D., and F.V.C.; writing—review and editing, M.D., N.T., Y.G., and C.C.D.S. All authors have read and agreed to the published version of the manuscript.

Funding

The authors thank IDRS (Institut de Recherche Servier) Servier Laboratories and INSERM (Institut national de la santé et de la recherche médicale) for the financing of this project (132484/BR/VO-Réf INSERM: 131589A10). This study was supported by the IHU OPERA (ANR-10-IBHU-004) within the program “Investissements d’Avenir” of the French National Research Agency (ANR).

Acknowledgments

The authors address special thanks for Ludovic Gomez, Mélanie Paillard, Rania Harisseh, and Muhammad Rizwan Alam for their precious help and advice.

Conflicts of Interest

The authors declare no conflict of interest. The funders had no role in the design of the study; in the collection, analyses, or interpretation of data; in the writing of the manuscript; or in the decision to publish the results.

References

  1. Sztark, F.; Payen, J.F.; Piriou, V.; Rigoulet, M.; Ventura-Clapier, R.; Mazat, J.P.; Leverve, X.; Janvier, G. Cellular energy metabolism: Physiologic and pathologic aspects. Ann. Fr. D’anesthesie Reanim. 1999, 18, 261–269. [Google Scholar] [CrossRef]
  2. Nabel, E.G.; Braunwald, E. A tale of coronary artery disease and myocardial infarction. N. Engl. J. Med. 2012, 366, 54–63. [Google Scholar] [CrossRef] [PubMed] [Green Version]
  3. Chouchani, E.T.; Pell, V.R.; Gaude, E.; Aksentijević, D.; Sundier, S.Y.; Robb, E.L.; Logan, A.; Nadtochiy, S.M.; Ord, E.N.J.; Smith, A.C.; et al. Ischaemic accumulation of succinate controls reperfusion injury through mitochondrial ROS. Nature 2014, 515, 431–435. [Google Scholar] [CrossRef] [PubMed] [Green Version]
  4. Saini, H.K.; Dhalla, N.S. Defective calcium handling in cardiomyocytes isolated from hearts subjected to ischemia-reperfusion. Am. J. Physiol. Heart Circ. Physiol. 2005, 288, H2260–H2270. [Google Scholar] [CrossRef] [PubMed]
  5. Buja, L.M. Myocardial ischemia and reperfusion injury. Cardiovasc. Pathol. 2005, 14, 170–175. [Google Scholar] [CrossRef] [PubMed]
  6. Santulli, G.; Xie, W.; Reiken, S.R.; Marks, A.R. Mitochondrial calcium overload is a key determinant in heart failure. Proc. Natl. Acad. Sci. USA 2015, 112, 11389–11394. [Google Scholar] [CrossRef] [Green Version]
  7. Jennings, R.B.; Sommers, H.M.; Smyth, G.A.; Flack, H.A.; Linn, H. Myocardial necrosis induced by temporary occlusion of a coronary artery in the dog. Arch. Pathol. 1960, 70, 68–78. [Google Scholar]
  8. Ferdinandy, P.; Hausenloy, D.J.; Heusch, G.; Baxter, G.F.; Schulz, R. Interaction of risk factors, comorbidities, and comedications with ischemia/reperfusion injury and cardioprotection by preconditioning, postconditioning, and remote conditioning. Pharmacol. Rev. 2014, 66, 1142–1174. [Google Scholar] [CrossRef]
  9. Paillard, M.; Tubbs, E.; Thiebaut, P.-A.; Gomez, L.; Fauconnier, J.; Da Silva, C.C.; Teixeira, G.; Mewton, N.; Belaidi, E.; Durand, A.; et al. Depressing mitochondria-reticulum interactions protects cardiomyocytes from lethal hypoxia-reoxygenation injury. Circulation 2013, 128, 1555–1565. [Google Scholar] [CrossRef] [Green Version]
  10. Gomez, L.; Thiebaut, P.-A.; Paillard, M.; Ducreux, S.; Abrial, M.; Crola Da Silva, C.; Durand, A.; Alam, M.R.; Van Coppenolle, F.; Sheu, S.-S.; et al. The SR/ER-mitochondria calcium crosstalk is regulated by GSK3β during reperfusion injury. Cell Death Differ. 2016, 23, 313–322. [Google Scholar] [CrossRef] [Green Version]
  11. Schwaller, B. The Regulation of a Cell’s Ca2+ Signaling Toolkit: The Ca2+ Homeostasome. In Calcium Signaling; Islam, M.d.S., Ed.; Advances in Experimental Medicine and Biology; Springer: Dordrecht, The Netherlands, 2012; Volume 740, pp. 1–25. ISBN 978-94-007-2888-2. [Google Scholar]
  12. Sammels, E.; Parys, J.B.; Missiaen, L.; De Smedt, H.; Bultynck, G. Intracellular Ca2+ storage in health and disease: A dynamic equilibrium. Cell Calcium 2010, 47, 297–314. [Google Scholar] [CrossRef] [PubMed]
  13. Fearnley, C.J.; Roderick, H.L.; Bootman, M.D. Calcium Signaling in Cardiac Myocytes. Cold Spring Harb. Perspect. Biol. 2011, 3, a004242. [Google Scholar] [CrossRef] [PubMed] [Green Version]
  14. Hausenloy, D.J.; Barrabes, J.A.; Bøtker, H.E.; Davidson, S.M.; Di Lisa, F.; Downey, J.; Engstrom, T.; Ferdinandy, P.; Carbrera-Fuentes, H.A.; Heusch, G.; et al. Ischaemic conditioning and targeting reperfusion injury: A 30 year voyage of discovery. Basic Res. Cardiol. 2016, 111, 70. [Google Scholar] [CrossRef] [PubMed] [Green Version]
  15. Teixeira, G.; Chiari, P.; Fauconnier, J.; Abrial, M.; Couture-Lepetit, E.; Harisseh, R.; Pillot, B.; Lacampagne, A.; Tourneur, Y.; Gharib, A.; et al. Involvement of Cyclophilin D and Calcium in Isoflurane-induced Preconditioning. Anesthesiology 2015, 123, 1374–1384. [Google Scholar] [CrossRef] [Green Version]
  16. Hall, A.R.; Burke, N.; Dongworth, R.K.; Kalkhoran, S.B.; Dyson, A.; Vicencio, J.M.; Dorn, G.W.; Yellon, D.M.; Hausenloy, D.J. Hearts deficient in both Mfn1 and Mfn2 are protected against acute myocardial infarction. Cell Death Dis. 2016, 7, e2238. [Google Scholar] [CrossRef]
  17. Cung, T.-T.; Morel, O.; Cayla, G.; Rioufol, G.; Garcia-Dorado, D.; Angoulvant, D.; Bonnefoy-Cudraz, E.; Guérin, P.; Elbaz, M.; Delarche, N.; et al. Cyclosporine before PCI in Patients with Acute Myocardial Infarction. N. Engl. J. Med. 2015, 373, 1021–1031. [Google Scholar] [CrossRef]
  18. Lang, S.; Erdmann, F.; Jung, M.; Wagner, R.; Cavalie, A.; Zimmermann, R. Sec61 complexes form ubiquitous ER Ca2+ leak channels. Channels 2011, 5, 228–235. [Google Scholar] [CrossRef] [Green Version]
  19. Tyedmers, J.; Lerner, M.; Bies, C.; Dudek, J.; Skowronek, M.H.; Haas, I.G.; Heim, N.; Nastainczyk, W.; Volkmer, J.; Zimmermann, R. Homologs of the yeast Sec complex subunits Sec62p and Sec63p are abundant proteins in dog pancreas microsomes. Proc. Natl. Acad. Sci. USA 2000, 97, 7214–7219. [Google Scholar] [CrossRef] [Green Version]
  20. Hamman, B.D.; Chen, J.C.; Johnson, E.E.; Johnson, A.E. The aqueous pore through the translocon has a diameter of 40-60 A during cotranslational protein translocation at the ER membrane. Cell 1997, 89, 535–544. [Google Scholar] [CrossRef] [Green Version]
  21. Tinker, A.; Williams, A.J. Probing the structure of the conduction pathway of the sheep cardiac sarcoplasmic reticulum calcium-release channel with permeant and impermeant organic cations. J. Gen. Physiol. 1993, 102, 1107–1129. [Google Scholar] [CrossRef] [Green Version]
  22. Mead, F.; Williams, A.J. Block of the ryanodine receptor channel by neomycin is relieved at high holding potentials. Biophys. J. 2002, 82, 1953–1963. [Google Scholar] [CrossRef] [Green Version]
  23. Lindsay, A.R.; Manning, S.D.; Williams, A.J. Monovalent cation conductance in the ryanodine receptor-channel of sheep cardiac muscle sarcoplasmic reticulum. J. Physiol. 1991, 439, 463–480. [Google Scholar] [CrossRef] [PubMed] [Green Version]
  24. Alder, N.N.; Shen, Y.; Brodsky, J.L.; Hendershot, L.M.; Johnson, A.E. The molecular mechanisms underlying BiP-mediated gating of the Sec61 translocon of the endoplasmic reticulum. J. Cell Biol. 2005, 168, 389–399. [Google Scholar] [CrossRef] [PubMed]
  25. Hammadi, M.; Oulidi, A.; Gackière, F.; Katsogiannou, M.; Slomianny, C.; Roudbaraki, M.; Dewailly, E.; Delcourt, P.; Lepage, G.; Lotteau, S.; et al. Modulation of ER stress and apoptosis by endoplasmic reticulum calcium leak via translocon during unfolded protein response: Involvement of GRP78. FASEB J. 2013, 27, 1600–1609. [Google Scholar] [CrossRef]
  26. Ménétret, J.-F.; Hegde, R.S.; Aguiar, M.; Gygi, S.P.; Park, E.; Rapoport, T.A.; Akey, C.W. Single copies of Sec61 and TRAP associate with a non-translating mammalian ribosome. Structure 2008, 16, 1126–1137. [Google Scholar] [CrossRef] [Green Version]
  27. Becker, T.; Bhushan, S.; Jarasch, A.; Armache, J.-P.; Funes, S.; Jossinet, F.; Gumbart, J.; Mielke, T.; Berninghausen, O.; Schulten, K.; et al. Structure of Monomeric Yeast and Mammalian Sec61 Complexes Interacting with the Translating Ribosome. Science 2009, 326, 1369–1373. [Google Scholar] [CrossRef] [Green Version]
  28. Roy, A.; Wonderlin, W.F. The Permeability of the Endoplasmic Reticulum Is Dynamically Coupled to Protein Synthesis. J. Biol. Chem. 2003, 278, 4397–4403. [Google Scholar] [CrossRef] [Green Version]
  29. Lang, S.; Benedix, J.; Fedeles, S.V.; Schorr, S.; Schirra, C.; Schäuble, N.; Jalal, C.; Greiner, M.; Haßdenteufel, S.; Tatzelt, J.; et al. Different effects of Sec61α, Sec62 and Sec63 depletion on transport of polypeptides into the endoplasmic reticulum of mammalian cells. J. Cell Sci. 2012, 125, 1958–1969. [Google Scholar] [CrossRef] [Green Version]
  30. Lomax, R.B.; Camello, C.; Van Coppenolle, F.; Petersen, O.H.; Tepikin, A.V. Basal and physiological Ca2+ leak from the endoplasmic reticulum of pancreatic acinar cells. Second messenger-activated channels and translocons. J. Biol. Chem. 2002, 277, 26479–26485. [Google Scholar] [CrossRef] [Green Version]
  31. Coppenolle, F.V.; Abeele, F.V.; Slomianny, C.; Flourakis, M.; Hesketh, J.; Dewailly, E.; Prevarskaya, N. Ribosome-translocon complex mediates calcium leakage from endoplasmic reticulum stores. J. Cell Sci. 2004, 117, 4135–4142. [Google Scholar] [CrossRef] [Green Version]
  32. Flourakis, M.; Van Coppenolle, F.; Lehen’kyi, V.; Beck, B.; Skryma, R.; Prevarskaya, N. Passive calcium leak via translocon is a first step for iPLA2-pathway regulated store operated channels activation. FASEB J. 2006, 20, 1215–1217. [Google Scholar] [CrossRef] [PubMed]
  33. Paredes, R.M.; Bollo, M.; Holstein, D.; Lechleiter, J.D. Luminal Ca2+ depletion during the unfolded protein response in Xenopus oocytes: Cause and consequence. Cell Calcium 2013, 53, 286–296. [Google Scholar] [CrossRef] [PubMed] [Green Version]
  34. Layhadi, J.A.; Fountain, S.J. Influence of ER leak on resting cytoplasmic Ca2+ and receptor-mediated Ca2+ signalling in human macrophage. Biochem. Biophys. Res. Commun. 2017, 487, 633–639. [Google Scholar] [CrossRef] [PubMed] [Green Version]
  35. Giunti, R.; Gamberucci, A.; Fulceri, R.; Bánhegyi, G.; Benedetti, A. Both translocon and a cation channel are involved in the passive Ca2+ leak from the endoplasmic reticulum: A mechanistic study on rat liver microsomes. Arch. Biochem. Biophys. 2007, 462, 115–121. [Google Scholar] [CrossRef]
  36. Erdmann, F.; Schäuble, N.; Lang, S.; Jung, M.; Honigmann, A.; Ahmad, M.; Dudek, J.; Benedix, J.; Harsman, A.; Kopp, A.; et al. Interaction of calmodulin with Sec61α limits Ca2+ leakage from the endoplasmic reticulum. EMBO J. 2011, 30, 17–31. [Google Scholar] [CrossRef] [Green Version]
  37. Cassel, R.; Ducreux, S.; Alam, M.R.; Dingreville, F.; Berlé, C.; Burda-Jacob, K.; Chauvin, M.A.; Chikh, K.; Païta, L.; Al-Mawla, R.; et al. Protection of Human Pancreatic Islets from Lipotoxicity by Modulation of the Translocon. PLoS ONE 2016, 11, e0148686. [Google Scholar] [CrossRef]
  38. Linxweiler, M.; Schick, B.; Zimmermann, R. Let’s talk about Secs: Sec61, Sec62 and Sec63 in signal transduction, oncology and personalized medicine. Signal Transduct. Target. Ther. 2017, 2, 17002. [Google Scholar] [CrossRef]
  39. Linxweiler, M.; Schorr, S.; Schäuble, N.; Jung, M.; Linxweiler, J.; Langer, F.; Schäfers, H.-J.; Cavalié, A.; Zimmermann, R.; Greiner, M. Targeting cell migration and the endoplasmic reticulum stress response with calmodulin antagonists: A clinically tested small molecule phenocopy of SEC62 gene silencing in human tumor cells. BMC Cancer 2013, 13, 574. [Google Scholar] [CrossRef] [Green Version]
  40. Lu, Z.; Zhou, L.; Killela, P.; Rasheed, A.B.; Di, C.; Poe, W.E.; McLendon, R.E.; Bigner, D.D.; Nicchitta, C.; Yan, H. Glioblastoma Proto-Oncogene SEC61γ Is Required for Tumor Cell Survival and Response to Endoplasmic Reticulum Stress. Cancer Res. 2009, 69, 9105–9111. [Google Scholar] [CrossRef] [Green Version]
  41. Lang, S.; Pfeffer, S.; Lee, P.-H.; Cavalié, A.; Helms, V.; Förster, F.; Zimmermann, R. An Update on Sec61 Channel Functions, Mechanisms, and Related Diseases. Front. Physiol. 2017, 8. [Google Scholar] [CrossRef] [Green Version]
  42. Palmer, A.E.; Tsien, R.Y. Measuring calcium signaling using genetically targetable fluorescent indicators. Nat. Protoc. 2006, 1, 1057–1065. [Google Scholar] [CrossRef] [PubMed]
  43. Greensmith, D.J. Ca analysis: An Excel based program for the analysis of intracellular calcium transients including multiple, simultaneous regression analysis. Comput. Methods Programs Biomed. 2014, 113, 241–250. [Google Scholar] [CrossRef] [PubMed] [Green Version]
  44. Hom, J.R.; Quintanilla, R.A.; Hoffman, D.L.; de Mesy Bentley, K.L.; Molkentin, J.D.; Sheu, S.-S.; Porter, G.A. The permeability transition pore controls cardiac mitochondrial maturation and myocyte differentiation. Dev. Cell 2011, 21, 469–478. [Google Scholar] [CrossRef] [PubMed] [Green Version]
  45. Petronilli, V.; Miotto, G.; Canton, M.; Brini, M.; Colonna, R.; Bernardi, P.; Di Lisa, F. Transient and long-lasting openings of the mitochondrial permeability transition pore can be monitored directly in intact cells by changes in mitochondrial calcein fluorescence. Biophys. J. 1999, 76, 725–734. [Google Scholar] [CrossRef] [Green Version]
  46. Paccalet, A.; Tessier, N.; Paillard, M.; Païta, L.; Gomez, L.; Gallo-Bona, N.; Chouabe, C.; Léon, C.; Badawi, S.; Harhous, Z.; et al. An innovative sequence of hypoxia-reoxygenation on adult mouse cardiomyocytes in suspension to perform multilabeling analysis by flow cytometry. Am. J. Physiol. Cell Physiol. 2019, 318, C439–C447. [Google Scholar] [CrossRef]
  47. Amer, M.S.; Li, J.; O’Regan, D.J.; Steele, D.S.; Porter, K.E.; Sivaprasadarao, A.; Beech, D.J. Translocon closure to Ca2+ leak in proliferating vascular smooth muscle cells. Am. J. Physiol. Heart Circ. Physiol. 2009, 296, H910–H916. [Google Scholar] [CrossRef] [Green Version]
  48. Eisner, D.A.; Caldwell, J.L.; Kistamas, K.; Trafford, A.W. Calcium and Excitation-Contraction Coupling in the Heart. Circ. Res. 2017, 121, 181–195. [Google Scholar] [CrossRef]
  49. Sleiman, N.H.; McFarland, T.P.; Jones, L.R.; Cala, S.E. Transitions of protein traffic from cardiac ER to junctional SR. J. Mol. Cell. Cardiol. 2015, 81, 34–45. [Google Scholar] [CrossRef] [Green Version]
  50. Hajnóczky, G.; Csordás, G.; Madesh, M.; Pacher, P. The machinery of local Ca2+ signalling between sarco-endoplasmic reticulum and mitochondria. J. Physiol. 2000, 529, 69–81. [Google Scholar] [CrossRef]
  51. Bochaton, T.; Crola-Da-Silva, C.; Pillot, B.; Villedieu, C.; Ferreras, L.; Alam, M.R.; Thibault, H.; Strina, M.; Gharib, A.; Ovize, M.; et al. Inhibition of myocardial reperfusion injury by ischemic postconditioning requires sirtuin 3-mediated deacetylation of cyclophilin D. J. Mol. Cell. Cardiol. 2015, 84, 61–69. [Google Scholar] [CrossRef]
  52. Petrovski, G.; Das, S.; Juhasz, B.; Kertesz, A.; Tosaki, A.; Das, D.K. Cardioprotection by endoplasmic reticulum stress-induced autophagy. Antioxid. Redox Signal. 2011, 14, 2191–2200. [Google Scholar] [CrossRef] [PubMed]
  53. Liu, M.; Chen, Z.; Chen, L. Endoplasmic reticulum stress: A novel mechanism and therapeutic target for cardiovascular diseases. Acta Pharmacol. Sin. 2016, 37, 425–443. [Google Scholar] [CrossRef] [PubMed] [Green Version]
Figure 1. Translocon (TLC) activation by puromycin induces a decrease in reticular Ca2+ stock. (A) Illustration of the in vivo adenoviral strategy to express a reticular Ca2+ sensor, D4ER, in adult mouse cardiomyocytes, presenting a typical reticular pattern of the fluorescent sensor as displayed on the representative confocal image. Scale bar: 50 µm. (B) Graphical representation of the D4ER fluorescence ratio evolution with time in control condition (black line) and in response to 30 min of 200 µM puromycin treatment (red line), both stimulated with 5 mM caffeine; representative curve of reticular fluorescence evolution in control (Ctrl) condition and under puromycin treatment. (C) Scatter plots of reticular Ca2+ decreased at the end of 30 min perfusion with or without puromycin. (D) Scatter plots of the ryanodine receptor (RyR)-dependent reticular Ca2+ stock after puromycin or Ctrl treatment estimated by caffeine stimulation, calculated as difference between fluorescence level at stimulation time and final fluorescence. n = cell count. Statistics: ++ p < 0.01 vs. Ctrl.
Cells 09 01319 g001
Figure 2. The reticular puromycin-mediated Ca2+ stock release was independent of the one stimulated by caffeine and did not affect excitation–contraction (E-C) coupling. (A,D) Time traces showing cytosolic Ca2+ concentration assessed by fura2-AM (acetoxymethyl ester) cytosolic probe, in Ctrl condition and after 30 min of 200 µM puromycin pretreatment or 20 µM emetine +200µM puromycin pretreatment. Effect of puromycin and emetine + puromycin was measured after cardiomyocyte (CM) pretreatment in Ca2+-containing buffer (CCB) for 30 min (see the Materials and Methods section). Ca2+ content was figured out by the maximum amplitude of fura2-AM fluorescence ratio (∆max Ratio(340/380)) after the addition of different stimulations in a Ca2+-free buffer (CFB). (B) Box blots representing the steady-state cytosolic Ca2+ concentration and (C) total cell Ca2+ content assessed by 5 µM of ionomycin stimulation. (E) RyR2-dependent Ca2+ stores assessed by 10 mM of caffeine stimulation and (F) remaining cell Ca2+ content after caffeine stimulation assessed by ionomycin stimulation. (GJ) Cytoplasmic Ca2+ transients were recorded using fluo5-AM–loaded intact CM electrically stimulated at 1 Hz. (G) Representative cytoplasmic Ca2+ transients in the absence or after 30 min of puromycin pretreatment; ΔF/F0 = normalized change fluorescence. (H) Scatter blots representing cytoplasmic Ca2+ transients amplitude, (I) Ca2+ transients rising slope (calculated from the relative amplitude and time to peak of the electrical induced Ca2+ transient), and (J) Ca2+ transients rate of decay. (K) Time traces displaying cytosolic Ca2+ concentration (measured by the fura2-AM fluorescence ratio) in a Ctrl CM and in a 200 µM puromycin preconditioned CM subjected to a 30 min ischemia-like hypoxia. At the end of the 30 min, 10 mM caffeine was added to the medium. CCB means Ca2+-containing buffer. (L) Average increase in the cytosolic Ca2+ concentration [Ca2+]cyto was figured out as masses of fura2-AM fluorescence signal over time in CM treated as explained in (K). Data are from at least three independent experiments. n = cell count. Statistics: + p < 0.05, +++ p < 0.001, ++++ p < 0.0001 vs. Ctrl, * p < 0.05, **** p < 0.0001 vs. Puro (puromycin).
Cells 09 01319 g002
Figure 3. Puromycin pretreatment modified mitochondrial Ca2+ content in beating CM and delays mitochondrial permeability transition pore (mPTP) opening. (A) Representative time traces of mitochondrial Ca2+ concentration (expressed as the 340/380 fluorescent ratio of fura2-AM cytosolic probe)) from Ctrl and CM pretreated with 200 µM of puromycin for 30 min. (B) Boxplots represent mitochondrial calcium content assessed by 25 µM of FCCP (Carbonyl cyanide 4-(trifluoromethoxy)phenylhydrazone) stimulation (expressed by the delta max of the 340/380 fluorescent ratio of fura2-AM cytosolic probe) in Ctrl condition and after 30 min of 200 µM puromycin pretreatment. (C,D) Mitochondrial Ca2+ rises recorded in 4mtD3cpv-positive CM electrically stimulated successively at 0.5, 1, and 2 Hz. (C) Representative time traces of mitochondrial Ca2+ concentration in Ctrl and after 30 min of puromycin pretreatment, expressed as YFP/CFP fluorescent ratio with a time binning of 4 (every 2.12 sec). (D) Corresponding averaged mean increase of mitochondrial Ca2+ concentrations at the same range of stimulation frequencies. (E) Representative time traces of calcein fluorescence from Ctrl, and 1 µM cyclosporin A (CsA)-pretreated and puromycin-pretreated CM. (F) Boxplots representing the slope of the mitochondrial calcein fluorescence decay induced by ionomycin stimulation. Data are represented as medians (except in E, mean ± SEM) from at least three independent experiments. n = cell count. Statistics: ++ p < 0.01, +++ p < 0.001 vs. Ctrl.
Cells 09 01319 g003
Figure 4. In vitro and in vivo CM protection by puromycin pretreatment after ischemia/reperfusion. (A) Experimental design representing ischemia-like hypoxia/reoxygenation (H/R) protocols achieved in isolated adult mouse CM. (B) Scatter plots showing mortality of CM subjected to H/R (Ctrl H/R) or CM concomitantly subjected to H/R and a 200 µM puromycin pretreatment (puro H/R). Evaluation of CM mortality was assessed via propidium iodide (PI) staining. (C) Experimental design showing the I/R protocols performed in mice by a blind test comparing different concentration of puromycin. (D) Scatter plots representing individual I/R mouse by the percentage of necrosis area (AN) over area-at-risk (AR). n = number of animals. Statistics: + p < 0.05, ++ p < 0.01 vs. Ctrl H/R. (E) Representative images of Evan’s blue- and triphenyltetrazolium chloride (TTC)-stained hearts from Ctrl I/R and Puro I/R mice.
Cells 09 01319 g004

