Article

Comparative Analysis of FCGR Gene Polymorphism in Pulmonary Sarcoidosis and Tuberculosis

by
Marlena Typiak
1,†,
Bartłomiej Rękawiecki
2,†,
Krzysztof Rębała
3 and
Anna Dubaniewicz
2,*
1
Department of General and Medical Biochemistry, Faculty of Biology, University of Gdansk, 80-308 Gdansk, Poland
2
Department of Pulmonology, Medical University of Gdansk, 80-214 Gdansk, Poland
3
Department of Forensic Medicine, Medical University of Gdansk, 80-204 Gdansk, Poland
*
Author to whom correspondence should be addressed.
These authors contributed equally to this work.
Cells 2023, 12(9), 1221; https://doi.org/10.3390/cells12091221
Submission received: 15 March 2023 / Revised: 17 April 2023 / Accepted: 18 April 2023 / Published: 23 April 2023
(This article belongs to the Special Issue Immune Biomarkers of Chronic Lung Diseases and Lung Cancer)

Abstract

:
The clinical outcome of sarcoidosis (SA) is very similar to tuberculosis (TB); however, they are treated differently and should not be confused. In search for their biomarkers, we have previously revealed changes in the phagocytic activity of monocytes in sarcoidosis and tuberculosis. On these monocytes we found a higher expression of receptors for the Fc fragment of immunoglobulin G (FcγR) in SA and TB patients vs. healthy controls. FcγRs are responsible for the binding of immune complexes (ICs) to initiate an (auto)immune response and for ICs clearance. Surprisingly, our SA patients had a high blood level of ICs, despite the abundant presence of FcγRs. It pointed to FcγR disfunction, presumably caused by the polymorphism of their (FCGR) genes. Therefore, we present here an analysis of the occurrence of FCGR2A, FCGR2B, FCGR2C, FCGR3A and FCGR3B variants in Caucasian SA and TB patients, and healthy individuals with the use of polymerase chain reaction (PCR) and real-time PCR. The presented data point to a possibility of supporting the differential diagnosis of SA and TB by analyzing FCGR2C, FCGR3A and FCGR3B polymorphism, while for severe stages of SA also by studying FCGR2A variants. Additionally, the genotyping of FCGR2A and FCGR3B might serve as a marker of SA progression.

1. Introduction

Sarcoidosis (SA) is a granulomatous disease with an unknown aetiology. Genetics, environmental factors and autoimmunity are considered in the etiopathogenesis of SA [1,2,3,4,5]. Due to similar clinical, radiological and histopathological manifestations of SA and tuberculosis (TB), mycobacterial antigens have often been tested in sarcoidosis [1,2,3,5,6]. Because of these similarities between the two diseases, a misdiagnosis can occur. The differentiation between SA and TB is of great importance, since immunosuppressive treatment, used in sarcoidosis, can have very dangerous outcomes during active TB. Our team has also previously reported cases of patients, primarily diagnosed with sarcoidosis, who have developed TB after immunosuppressive treatment [1,4,5,6].
Our team has previously found a presence of M. tuberculosis heat shock proteins (Mtb-HSP70, Mtb-HSP65 and Mtb-HSP16) in the lymph nodes of patients diagnosed with sarcoidosis [7,8,9]. In the serum of the same SA patients, an increased level of immunoglobulin G (IgG)-based immune complexes (ICs) with Mtb-HSP was revealed. The most abundant Mtb-HSP protein in these ICs was Mtb-HSP16; a marker of a dormant stage of tuberculosis [7,8,10]. The immunocomplexemia in the blood of SA patients was especially present during the initial stages of the disease. Moreover, the level of ICs with Mtb-HSP16 was higher in SA patients than in patients suffering from tuberculosis [8,10].
Because immunocomplexemia can be a result of an abnormal function of the receptors for Fc fragment of IgG (FcγRs), especially receptors belonging to Class II and III, we evaluated the fraction of FcγRI+ (CD64), FcγRII+ (CD32) and FcγRIII+ (CD16) blood monocytes in the same patients with SA and TB [11]. The increased frequency of FcγRI+, FcγRII+ and FcγRIII+ monocytes was revealed in SA, whereas increase in the fraction of monocytes with FcγR Class II was found in TB [12,13,14].
Therefore, in the context of an abundant number of blood phagocytes possessing FcγRs, but not eliminating ICs from circulation, we hypothesised that there receptors in SA and TB had a possible malfunction. This aberrant function may be caused by a functional polymorphism of genes (FCGR genes) encoding FcγRs, which we have already shown in part regarding sarcoidosis versus healthy individuals [12,13]. The differences between FCGR gene polymorphism in SA and TB could help us understand the etiopathogeneses of both sarcoidosis and tuberculosis, pointing to their similarities and/or differences. Additionally, up to now, there have been no published studies on FCGR gene polymorphism in TB patients in the Caucasian ethnic group.
Therefore, the aim of this work was to assess, if certain functional polymorphisms of the genes that encode the activating FcγRs (FCGR2A encoding FcγRIIa, FCGR2C—FcγRIIc, FCGR3A—FcγRIIIa, FCGR3B—FcγRIIIb) and/or inhibiting FcγRIIb (FCGR2B gene) can predispose SA and TB development. In addition, this study could identify a molecular marker that may help differentiate between the two diseases and support the process of their diagnosis.

2. Materials and Methods

2.1. Characteristics of the Studied Groups

The material, for gene variants analysis, consisted of peripheral blood samples, collected from patients diagnosed with sarcoidosis, patients with tuberculosis and healthy volunteers. Individuals from northern Poland, of Caucasian ethnicity, were enrolled in the study. The characteristics (including clinical data) of the studied groups are presented in Table 1.

2.2. Patients with Sarcoidosis

The study enrolled 154 unrelated sarcoidosis patients, who were under the care of clinics for lung diseases, located in the Gdansk–Sopot–Gdynia city agglomeration (Poland) in the years 2013–2020. Confirmation of the diagnosis of sarcoidosis in these patients was made on the basis of clinical symptoms and radiological and histopathological examinations with confirmation of the presence of noncaseating epithelioid cell granulomas in the lymph node biopsy. The diagnosis was performed in accordance with criteria, stated jointly by the American Thoracic Society, the European Respiratory Society and the World Association of Sarcoidosis and Other Granulomatous Disorders [1]. Sputum and biopsy material taken from the patients did not reveal acid-fast bacilli (PCR, M. tuberculosis culture), fungal infection or atypical cells. An additional criterion for inclusion in the study for SA patients was a negative PPD skin test.
Some of the SA patients presented general (e.g., fever) and/or organ-specific symptoms for less than two years (acute form of SA), with of without symptom characteristic for Löfgren’s syndrome. Manifestations of Löfgren’s syndrome include: erythema nodosum (painful, large, reddened infiltrates in the subcutaneous tissue, localized mostly on the front side of the lower legs), hilar lymphadenopathy (enlargement of the lymph nodes in the cavities of the lungs), swelling of ankles and/or elevated temperature. Patients with SA symptoms, such as cough, weight loss, cardiopulmonary insufficiency or a malfunction of another organ due to granuloma formation, lasting more than two years from the time of the onset of the disease, were diagnosed with a chronic type of sarcoidosis [15]. Twelve patients with SA (8%) experienced a loss of body weight.
Five radiological stages of sarcoidosis have been differentiated on the basis of the Scadding system. Stage 0 of SA is equal to a normal chest radiograph, and points to the existence of extrapulmonary SA. In Stage I of SA, bilateral hilar lymphadenopathy is present with no changes in the lungs. In Stage II of SA, bilateral hilar lymphadenopathy is accompanied by early changes in the lung parenchyma. In Stage III of SA, nodules occur only in the parenchyma. The development of the disease to Stage IV is connected with irreversible pulmonary fibrosis and severe malfunction of the respiratory system [2]. The early stages (I or II) of pulmonary sarcoidosis can be followed by advanced stages (III or IV), in which only the lungs (and not the lymph nodes) are affected by the disease. The numbers of patients in particular stages of the disease are included in Table 2.

2.3. Patients with Tuberculosis

In the study, 179 unrelated patients with active pulmonary tuberculosis were included before the initiation of antituberculosis therapy in these individuals. The patients were hospitalized at the Pomeranian Center for Infectious Diseases and Tuberculosis in Gdansk (Poland) and in nearby facilities. The diagnosis of tuberculosis was made on the basis of the clinical, radiological picture and, above all, a positive bacteriological test result for the presence of Mycobacterium tuberculosis in the sputum (bacterioscopy and culture). A positive PPD skin test (reaction > 10 mm) was an additional criterion for inclusion in the study. Forty-eight patients with TB (27%) showed a loss of body weight due to the disease development.

2.4. Healthy Control

The reference group consisted of 148 healthy unrelated volunteers from northern Poland (Gdansk city and its close proximity) who had no family history of tuberculosis, sarcoidosis or other autoimmune diseases. The healthy controls did not experience a loss of body weight.

2.5. Sample Collection and DNA Isolation

Small (10 mL) peripheral blood samples were collected from the participants of the study, as previously described [12]. Genomic DNA was isolated from those samples, as described by Lahiri and Nurnberger [16].

2.6. Polymerase Chain Reaction with Sequence-Specific Primers

A polymerase chain reaction (PCR) with sequence-specific primers (PCR-SSP) was used to study the functional polymorphism of FCGR2A, FCGR2C, FCGR3A and FCGR3B genes. The designation of the exact polymorphic sites, that were analyzed, and the sequences of the used primers are shown in Table 3. A very detailed description of the used methods is presented in our previous articles, regarding the polymorphism of these genes in sarcoidosis, in comparison to healthy individuals [12,13].
Separate PCR reactions were performed for each (of the two) variants of FCGR2A, FCGR2C and FCGR3A genes, due to the exact same length of the PCR products corresponding to that variants. To exclude false negative results in these PCR reactions, an internal control of amplification was added to the PCR mixtures. Thus, primers for the human growth hormone (hGH) gene fragment were added to the PCR mixtures for the FCGR2A and FCGR2C gene variants, and primers for a fragment of the neurofibromin 1 (NF1) gene were added to the mixture for studying FCGR3A alleles (NF1 exon 4b for 158F allele; NF1 exon 22 for 158V allele). One joint PCR mixture was prepared for studying three alleles of the FCGR3B gene; it did not need an internal control of amplification.
The primer 3B-NA2/SH and 3B-gene used in the study are substrates for the creation of a product specific both to NA2 and the SH alleles (NA2/SH product) in the PCR reaction. Supplementing the PCR-SSP reaction with the primer 3B-SH allows us to obtain a product specific only to the SH allele, and distinguish between the NA1/NA2 and NA1/SH genotypes. In the case of the simultaneous presence of PCR products specific both to the NA2/SH and SH alleles; the method used cannot distinguish between NA2/SH and SH/SH genotypes. Due to the significantly lower occurrence of the SH allele than the NA2 allele in the Caucasian population (10% vs. 63%), the obtained result was interpreted as the presence of the NA2/SH genotype.

2.7. Real-Time Polymerase Chain Reaction

Due to a difficulty in studying the allelic variants of the FCGR2B gene, which is very similar in sequence to the FCGR2C gene, we have decided to use the real-time PCR method to study the polymorphism of FCGR2B. We have used a custom-made (Assays-by-Design service of Applied Biosystems, Foster City, USA) Custom Taqman SNP Genotyping Assay. The assay consisted of a TaqMan Genotyping Master Mix (2×) and TaqMan SNP Genotyping Assay (40×), which included primers for PCR reaction and two probes with different fluorescent dyes (VIC for 695T and FAM for 695C allele). The primers were common for both FCGR2B gene variants. The gene variants were differentiated based on the hybridisation of a variant-specific probe (Table 4). Experiments were performed with 7900HT Fast Real-Time PCR System (Applied Biosystems) in 384-well plates. In each test, a well 2 µL (5 ng/µL) DNA solution was placed and dried in room temperature. Subsequently, 5 µL of a reaction mix was added to the well. The reaction mix consisted of TaqMan Genotyping Master Mix and TaqMan SNP Genotyping Assay (both diluted in water to 1× concentration). The temperature profile of the reaction comprised of 10 min in 95 °C and 50 amplification cycles (15 s 95 °C, 1 min 60 °C).

2.8. Electrophoresis and DNA Staining

The electrophoresis and DNA staining within the polyacrylamide gel was performed as described before [13].

2.9. Statistical Analysis

The STATISTICA v.13 for Windows (StatSoft, Tulsa, OK, USA) programme was used to assess if the study groups were properly selected in terms of age and gender distribution and to analyse the obtained data. Datasets were checked for their adherence to the conditions of a normal distribution (Shapiro–Wilk test). The age of people in the study groups was compared using the Mann–Whitney U test. The Fisher test was implemented to compare the number of women and men, as well as allele and genotype frequencies in the studied groups. A significant result of comparison was considered for a p value lower than 0.05. Significant differences were presented in full form.
Odds ratios (OR) and their 95% confidence intervals (CIs) were calculated to assess the risk of developing SA and TB. ORs and CIs for certain alleles were calculated using the Vassar Stats program [22]. ORs and CIs for certain genotypes were calculated using the OR calculator OEGE program [23]. The Hardy–Weinberg equilibrium calculator program (developed by Rodriguez et al.) was used to verify the compatibility of the obtained genotype frequencies with the Hardy–Weinberg law [24].

3. Results

The studied groups were consistent in terms of age (SA vs. healthy control: p = 0.52; SA vs. TB: p = 0.57; TB vs. healthy control: p = 0.08) and sex (SA vs. healthy control: p = 0.97; SA vs. TB: p = 0.29; TB vs. healthy control: p = 0.97).
The comparison of the frequency of FCGR2A, FCGR2C, FCGR3A and FCGR3B gene variants in the same SA patient group and healthy individuals has been previously published by our team [12,13]. Thus, in the current work, we will present the comparison of the frequencies of these gene variants between SA and TB patients, as well as between TB patients and healthy controls, which has never been shown before for the Caucasian ethnic group.

3.1. FCGR2A Gene Polymorphism

The distribution of the number of certain genotypes of FCGR2A was consistent with the Hardy–Weinberg law in the group of patients with SA (p = 0.87), TB (p = 0.55) and in the group of healthy individuals (p < 0.99). The results of the FCGR2A polymorphism were established for 144 SA patients (36 in Stage I, 53—Stage II, 34—Stage III, 21—Stage IV of SA), 179 TB patients and 145 healthy individuals.
There was no statistical difference in the frequency of the presence of FCGR2A alleles or genotypes between the whole group of SA and TB patients, as well as between TB patients and the control group (p > 0.05). There were also no statistically significant differences in the percentage of FCGR2A alleles between patients in various stages of sarcoidosis and patients with pulmonary tuberculosis (p > 0.05). However, a significantly higher incidence of the 131HH genotype and a significantly lower incidence of the 131HR genotype in Stage III sarcoidosis compared to patients with TB were found (50% vs. 30%, respectively, p = 0.03, OR = 2.38, CIs 1.13–5.01, 26% vs. 52%, p = 0.008, OR = 0.33, CIs 0.15–0.75) (Figure 1). The detailed numbers and percentages of certain alleles and genotypes of the FCGR2A gene in the studied groups are presented in Tables S1 and S2.

3.2. FCGR2B Gene Polymorphism

The distribution of the number of certain genotypes of FCGR2B was consistent with the Hardy–Weinberg law in the group of patients with SA (p = 0.70) and TB (p = 0.20), and in the group of healthy individuals (p = 0.69). The results of the FCGR2B polymorphism were established for 134 SA patients (30 in Stage I, 49—Stage II, 34—Stage III, 21—Stage IV of SA), 97 TB patients and 101 healthy individuals.
There was no statistical difference in the frequency of the presence of FCGR2B alleles or genotypes between SA (whole SA group and certain stages of SA) and TB patients, as well as between TB patients and the control group (p > 0.05). The detailed numbers and percentages of certain alleles and genotypes of the FCGR2B gene are presented in Tables S3 and S4.

3.3. FCGR2C Gene Polymorphism

The distribution of the number of certain genotypes of FCGR2C was consistent with the Hardy–Weinberg law in the group of patients with SA (p = 0.11) and in healthy individuals (p = 0.59), but was not within the group of patients with TB (p = 0.001). The results of the FCGR2C polymorphism were established for 149 SA patients (37 in Stage I, 57—Stage II, 34—Stage III, 21—Stage IV of SA), 179 TB patients and 148 healthy individuals.

3.3.1. FCGR2C Polymorphism in the Whole SA Group vs. TB, and in TB vs. Control

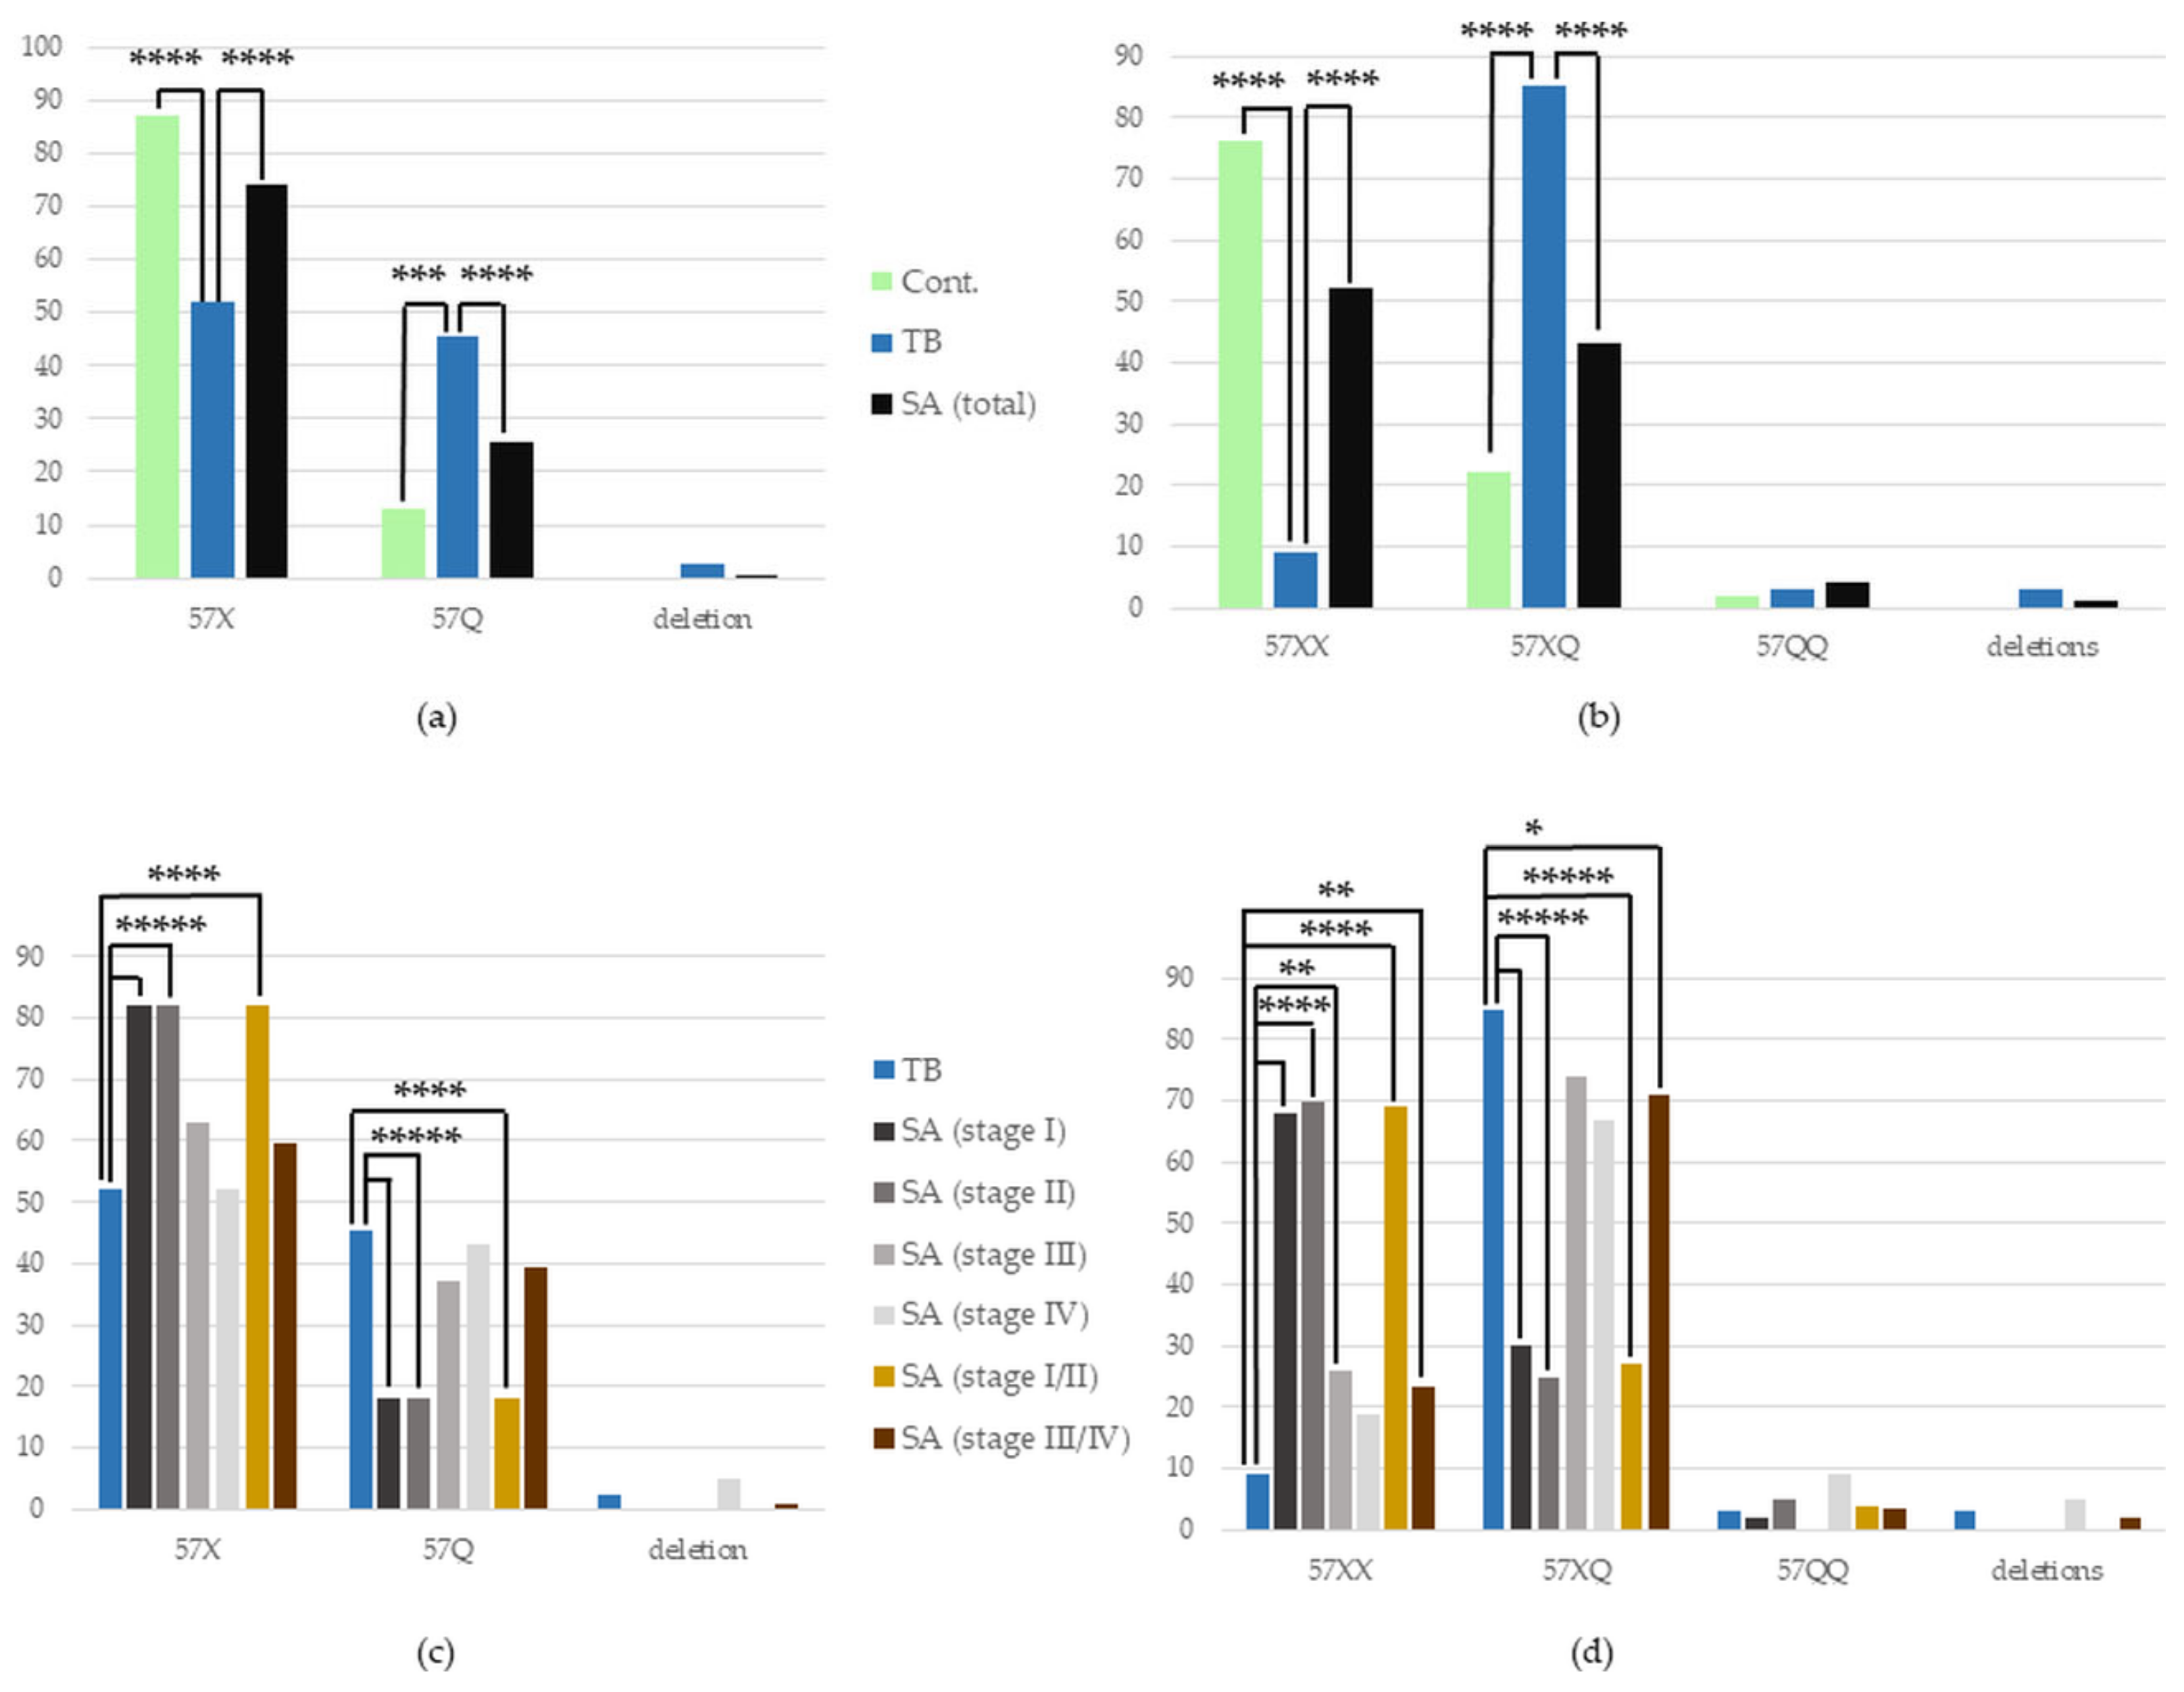
We have found a higher occurrence of the 57X in the patients with SA and in healthy individuals (Cont.) compared to those with TB (SA vs. TB: 74% vs. 52%, p < 0.0001, OR = 2.58, CIs 1.85–3.59, TB vs. Cont.: 52% vs. 87%, p < 0.0001, OR = 0.17, CIs 0.12–0.26). We have also found a lower frequency of the 57Q allele in SA patients and the control compared with TB patients (SA vs. TB—25.5% vs. 45.5%, p < 0.0001, OR = 0.41, CIs 0.29–0.57; TB vs. Cont.—45.5% vs. 13%, p < 0.001, OR = 5.74, CIs 3.86–8.54) (Figure 2). This aberration in the allele distribution of the FCGR2C gene also translated into the changed frequency of the FCGR2C genotypes.
The 57XX genotype occurred significantly more often in SA patients and healthy individuals than in the group of TB patients (SA vs. TB—52% vs. 9%, p < 0.0001, OR = 10.47, CIs 5.78–18.96, TB vs. Cont.—9% vs. 76%, p < 0.0001, OR = 0.03, CIs 0.02–0.06). There was also a less frequent occurrence of the 57XQ genotype in SA patients and healthy individuals than in TB patients (SA vs. TB: 43% vs. 85%, p < 0.0001, OR = 0.13, CIs 0.08–0.22; TB vs. Cont.: 85% vs. 22%, p < 0.0001, OR = 20.51, CIs 11.62–36.19) (Figure 2). The detailed numbers and percentages of certain alleles and genotypes of the FCGR2C gene in the studied groups are presented in Tables S5 and S6.

3.3.2. FCGR2C Polymorphism in Certain Stages of SA vs. TB

A significantly more frequent occurrence of the 57X allele was found in SA patients in Stages I and II of the disease, in comparison to TB patients (SA Stage I vs. TB: 82% vs. 52%, p < 0.00001, OR = 4.09, CIs 2.17–7.71; SA Stage II vs. TB: 82% vs. 52%, p < 0.00001, OR = 4.10, CIs 2.42–6.93). Complementary to this, there was a lower presence of the 57Q allele in the group of patients with SA in Stage I and II than in the TB group (SA Stage I vs. TB: 18% vs. 45.5%, p < 0.00001. OR = 0.24, CIs 0.13–0.46; SA Stage II vs. TB: 18% vs. 45.5%, p < 0.00001, OR = 0.24, CIs 0.14–0.41). In the joined group of patients with SA in Stage I or II (the initial stages of sarcoidosis) versus the TB group, these associations were repeated (57X allele: 82% vs. 52%, p < 0.0001, OR = 4.09, CIs 2.66–6.30; 57Q allele: 18% vs. 45.5%, p < 0.0001, OR = 0.24, CIs 0.16–0.38, respectively) (Figure 2).
Regarding the genotypes of the FCGR2C gene, there was a significant increase in the frequency of the 57XX genotype occurrence in patients with sarcoidosis in Stages I, II and III, in comparison to TB patients (68% vs. 9%, p < 0.00001, OR = 19.85, CIs 8.48–46.48; 70% vs. 9%, p < 0.0001, OR = 22.42, CIs 10.53–47.76; 26% vs. 9%, p = 0.01, OR = 3.43, CIs 1.38–8.53, respectively). We have also found a lower occurrence of the 57XQ genotype in patients with SA in Stages I and II compared with TB patients (30% vs. 85%, p < 0.00001, OR = 0.07, CIs 0.03–0.16; 25% vs. 85%, p < 0.00001, OR = 0.15, CIs 0.07–0,31, respectively). These associations were repeated in the joined group of patients with SA in Stages I or II versus the TB group (57XX allele: 69% vs. 9%, p < 0.0001, OR = 21.36, CIs 10.99–41.50; 57XQ allele: 27% vs. 85% p < 0.00001, OR = 0.06, CIs 0.03–0.11). Additionally, in the joint group of patients with more advanced stages of sarcoidosis (Stage III with IV), the 57XX genotype was more frequent, and 57XQ less frequent than in the TB group (24% vs. 9%, p = 0.01, OR = 2.95, CIs 1.33–6.55; 46% vs. 85%, p = 0.03, OR = 0.41, CIs 0.20–0.85, respectively). The detailed numbers and percentages of certain alleles and genotypes of the FCGR2C gene in the studied groups are presented in Tables S5 and S6.

3.4. FCGR3A Gene Polymorphism

The analysis of the FCGR3A gene polymorphism was the most promising for finding a distinction between the immune response mechanisms, present in sarcoidosis and tuberculosis, due to the previously revealed increase in the percentage of blood monocytes with FcγRIII in SA versus TB [25]. Monocytes have a FcγRIIIa receptor on their surface (encoded by FCGR3A), and not the other Class III Fc receptor—FcγRIIIb (encoded by FCGR3B) [14].
The distribution of the number of certain genotypes of FCGR3A was consistent with the Hardy–Weinberg law in the group of patients with SA (p = 0.11), TB (p = 0.45) and in healthy individuals (p = 0.59). The results of FCGR3A polymorphism were established for 120 SA patients (23 in Stage I, 54—Stage II, 23—Stage III, 20—Stage IV of SA), 179 TB patients and 148 healthy individuals.

3.4.1. FCGR3A Polymorphism in the Whole SA Group vs. TB, and in TB vs. Control

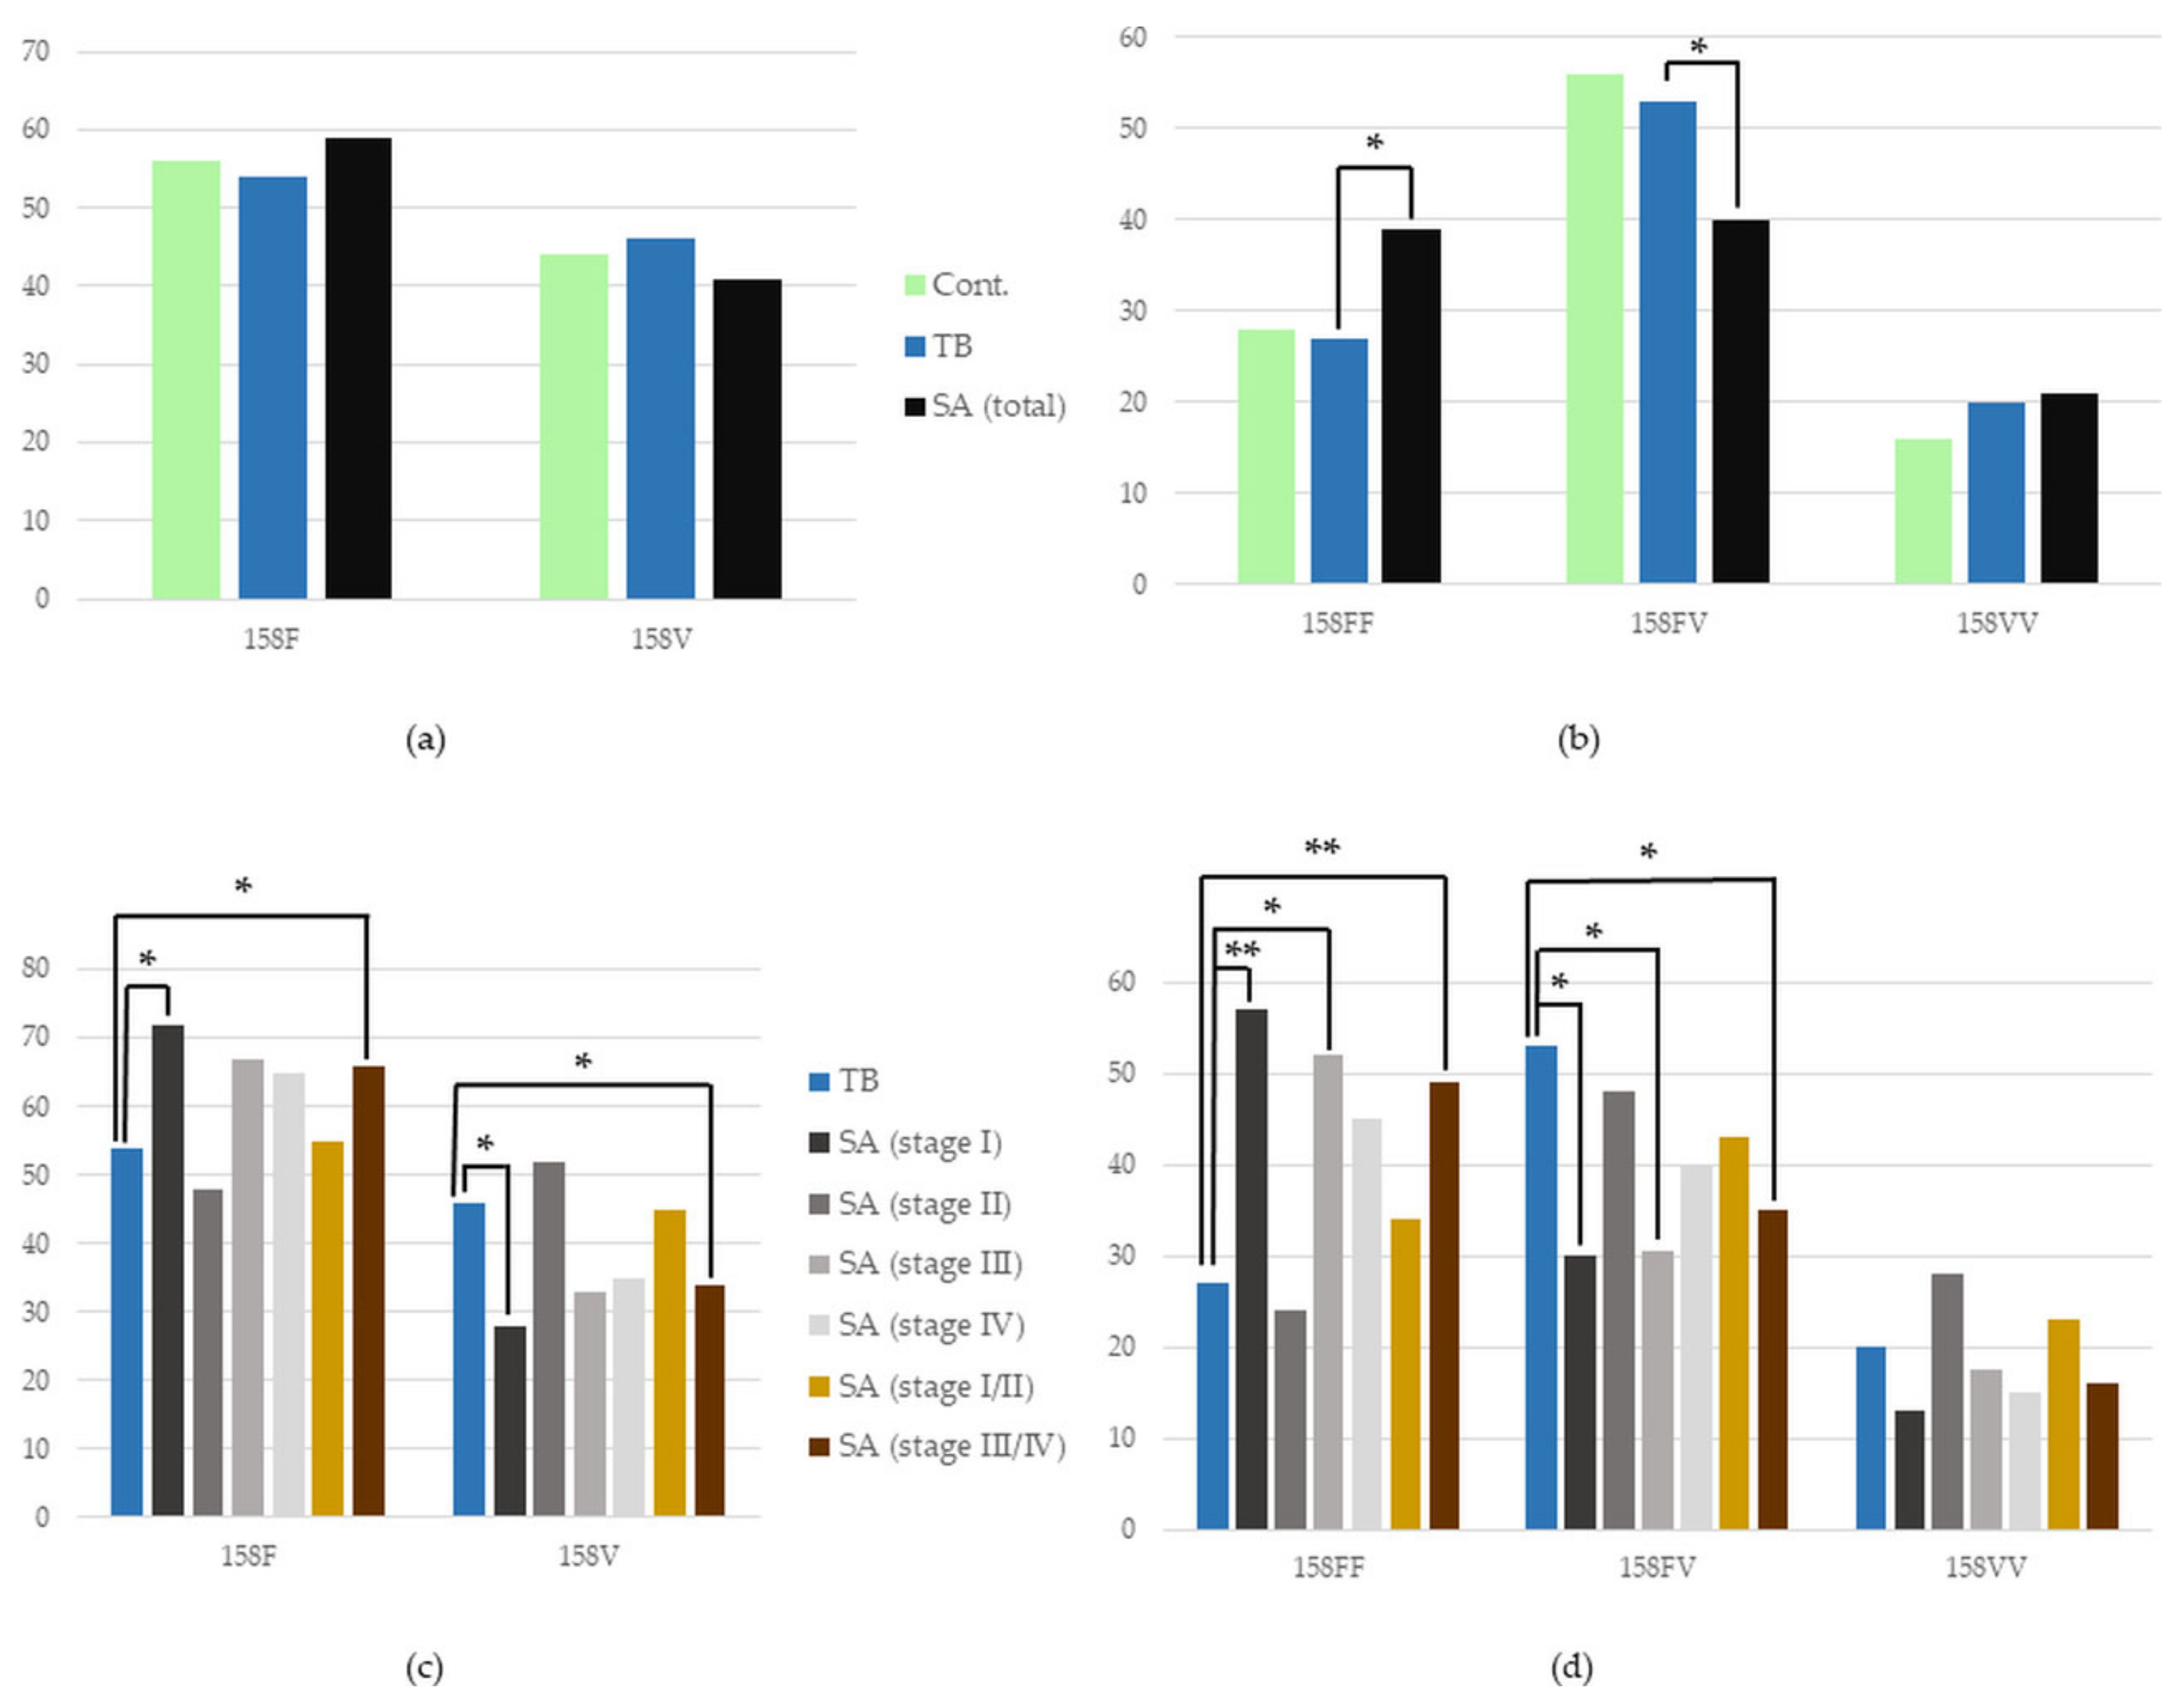
There was no statistical difference in the frequency of the presence of FCGR3A alleles between the whole group of SA and TB patients, as well as between TB patients and the control group (p > 0.05). However, we found a significant increase in the frequency of the 158FF genotype in the group of patients with SA in comparison to TB patients (39% vs. 27%, p = 0.04, OR = 1.71, CIs 1.04–2.79). Additionally, a lower occurrence of the 158FV genotype was shown in patients with SA versus those with TB (40% vs. 53%, p = 0.03, OR = 0.59, Cis 0.37–0.94) (Figure 3). The detailed numbers and percentages of certain alleles and genotypes of the FCGR3A gene in the studied groups are presented in Tables S7 and S8.

3.4.2. FCGR3A Polymorphism in Certain Stages of SA vs. TB

In the initial, Stage I, of pulmonary sarcoidosis, we showed a more frequent occurrence of 158F and a less frequent occurrence of the 158V allele, in comparison to TB patients (72% vs. 54%, p = 0.03, OR = 2.17, CIs 1.11–4.26; 28% vs. 46%, p = 0.03, OR = 0.46, CIs 0.23–0.90, respectively). In patients with this stage of SA (Stage I), as well as in patients with a more advanced stage, Stage III, versus in patience with TB, an increased presence of 158FF and a decreased presence of the 158FV genotype were found (158FF: 57% vs. 27%, p = 0.01, OR = 3.45, Cis 1.42–8.38; 52% vs. 27%, p = 0.03, OR = 2.89, Cis 1.20–6.99; 158FV: 30% vs. 53%, p = 0.048, OR = 0.39, Cis 0.15–0.99; 30.5% vs. 53%, p = 0.048, OR = 0.39, Cis 0.15–0.99, respectively).
In the joint group of patients in the most advanced stages of SA, Stages III and IV, we have also found an increased frequency of 158F and a lowered frequency of the 158V allele compared to patients suffering from TB (66% vs. 54%, p = 0.04, OR = 1.68, CIs 1.03–2.75; 34% vs. 46%, p = 0.04, OR = 0.60, CIs 0.36–0.97, respectively). It translated to a higher occurrence of 158FF and a lower presence of the 158FV genotype in this joint group of SA versus in TB patients (49% vs. 27%, p = 0.01, OR = 2.53, CIs 1.28–5.01; 35% vs. 53%, p = 0.02, OR = 0.47, CIs 0.24–0.95, respectively) (Figure 3). The detailed numbers and percentages of certain alleles and genotypes of the FCGR3A gene in the studied groups are presented in Tables S7 and S8.

3.5. FCGR3B Gene Polymorphism

The distribution of the number of certain genotypes of FCGR3B was consistent with the Hardy–Weinberg law in the group of patients with SA (p = 0.13) and in healthy individuals (p = 0.13), but not in TB patients (p < 0.05). The results of the FCGR3B polymorphism were established for 148 SA patients (38 in Stage I, 60—Stage II, 35—Stage III, 21—Stage IV of SA), 179 TB patients and 154 healthy individuals.

3.5.1. FCGR3B Polymorphism in the Whole SA Group vs. TB, and in TB vs. Control

A more frequent occurrence of the SH allele was found in SA patients and healthy controls than in TB patients (SA vs. TB: 4% vs. 0.5%, p = 0.001, OR = 15.73, CIs 2.05–120.97; TB vs. Cont.: 0.5% vs. 5.5%, p = 0.004, OR = 0.05, CIs 0.01–0.40). It translated into a higher occurrence of the NA1/SH genotype, possessing the SH allele in the SA group and healthy group versus the TB group (SA vs. TB: 6% vs. 0%, p = 0.001, OR = ∞, CIs 0–∞; TB vs. Cont.: 0% vs. 9%, p < 0.0001, OR = 0.03, CIs 0.002–0.44). Additionally, in the SA patient and healthy groups, versus the TB patient group, there was an increase in the NA2/NA2 presence, a genotype made from alleles identical by 83.5% with the SH allele (SA vs. TB: 34% vs. 22%, p = 0.03, OR = 1.77, CIs 1.09–2.88; TB vs. Cont.: 22% vs. 37%, p = 0.003, OR = 0.49, CIs 0.30–0.79). Supplementary to this, in SA patient and healthy groups, compared to TB patients, there was a decreased frequency of the NA1/NA2 genotype occurrence (SA vs. TB: 45.5% vs. 69%, p < 0.0001, OR = 0.37, CIs 0.24–0.58; TB vs. Cont.: 69% vs. 39%, p < 0.0001, OR = 3.60, CIs 2.28–5.69) (Figure 4).

3.5.2. FCGR3B Polymorphism in Certain Stages of SA vs. TB

A higher incidence of the SH allele was shown in SA patients in the initial stages, Stages I and II, of the disease, and in a joint group of patients in Stages I or II of SA, compared with TB patients (SA Stage I vs. TB: 8% vs. 0.5% p = 0.002, OR = 30.6, CIs 3.63–258.14; SA Stage II vs. TB: 6% vs. 0.5% p = 0.004, OR = 22.12, CIs 2.69–181.68; SA Stages I/II vs. TB: 7% vs. 0.5% p = 0.002, OR = 25.36, CIs 3.29–195.39). It was accompanied by a less frequent occurrence of the NA1 allele in patients with Stage II of SA, in comparison to TB patients (31.5% vs. 42.5%, p = 0.04, OR = 0.63, CIs 0.41–0.97).
This overrepresentation of the SH allele in the initial stages of SA is also visible as an increase in the NA1/SH genotype occurrence in patients with Stages I, II and joint Stage I/II of SA compared with TB (SA Stage I vs. TB: 11% vs. 0%, p = 0.01; SA Stage II vs. TB: 8.5% vs. 0%, p = 0.02; SA Stage I/II vs. TB: 10% vs. 0%, p = 0.01; for all comparisons OR = ∞, CIs 0–∞). In the joint group of SA patients with Stage I or II (I/II) and patients in Stage II of the disease, an increase in the NA2/NA2 genotype was found (vs. TB), comprising of NA2 alleles similar to the SH allele (SA Stage I/II vs. TB: 35% vs. 22%, p = 0.03, OR = 1.85, CIs 1.07–3.18; SA stage II vs. TB: 42% vs. 22%, p = 0.001, OR = 2.48, CIs 1.33–4.62). Complementary to this, a lower incidence of NA1/NA2 genotype presence was found in SA patients with Stages I, II or I/II of the disease compared with TB patients (SA Stage I vs. TB: 47% vs. 69%, p = 0.01, OR = 0.40, CIs 0.20–0.81; SA Stage II vs. TB: 38% vs. 69%, p < 0.0001, OR = 0.28, CIs 0.15–0.51; SA stage I/II vs. TB: 42% vs. 69%, p < 0.0001, OR = 0.32, CIs 0.19–0.53).
The lower frequency of the NA1/NA2 genotype was found also in SA patients in the more advanced Stages III and III/IV of the disease compared with the TB group (SA Stage III vs. TB: 49% vs. 69%, p = 0.03, OR = 0.42, CIs 0.20–0.87; SA Stage III/IV vs. TB: 52% vs. 69%, p = 0.02, OR = 0.48, CIs 0.26–0.88). However, it was accompanied, not by an increase in the genotypes made of SH or NA2 alleles, but with a higher frequency of the NA1/NA1 genotype occurrence in patients with Stage III SA, as opposed to TB patients (20% vs. 8%, p = 0.05, OR = 2.95, CIs 1.09–7.94).

4. Discussion

In our previous studies we have shown changes in the phagocytic activity of blood monocytes and neutrophils in SA and TB patients. We revealed the increased phagocytic activity of monocytes in both disorders, while an increased activity of neutrophils was shown in TB vs. SA [11,26]. The monocytes in SA patients (but not in TB) were resistant to apoptosis and present in high numbers in their blood [27]. We have also shown an increased expression of the FcγRI-III receptors on blood monocytes in SA patients vs. healthy individuals, and an increased fraction of monocytes with FcγRII receptors in TB patients [12,13,14]. The high phagocytic activity of these immune cells in SA, together with an increased expression of Fcγ receptors, responsible for immune complex binding and clearance, should have prevented immunocomplexemia in the blood of our SA patients. However, it did not [8,10]. We have found a high level of immune complexes, circulating in the blood, especially in SA patients with the initial stages of the disease [28]. Therefore, we hypothesised that there was a functional polymorphism of the FCGR2A, FCGR2B, FCGR2C, FCGR3A and/or FCGR3B genes, encoding Fcγ receptors responsible the for clearance of immune complexes and opsonised pathogens in SA and/or TB patients [14].
We had confirmed our assumptions about the differences in the frequency of FCGR gene variants in SA patients and healthy controls, which we have presented in our two previous articles [12,13]. In summary, in the initial stages of SA, Stages I and II, a lower level of 131HH and higher level of the 131HR genotype of FCGR2A compared to the more advanced stage of SA, Stage III, had previously been found, [12]. In our previous study, we have also found a decrease in the occurrence of the 57XQ genotype of the FCGR2C gene in SA patients in Stages I/II or II of the disease, compared to patients who have developed the more severe stages of SA, Stages III or III/IV [12]. We have also shown previously an increase in the frequency of the 158F and 158FF variants, and a decrease in the 158FV genotype of FCGR3A in SA patients in Stage I of the disease vs. healthy controls [13]. There was no difference in the frequency of the FCGR2B and FCGR3B gene variants between SA patients and healthy individuals [12].
Our current work broadens this analysis greatly. It not only presents for the first time the comparison of FCGR polymorphism in TB patients and healthy individuals, but also compares the frequency of the FCGR gene variants in SA and TB patients. Thus, the current work aims to find molecular biomarkers to support the differentiation between sarcoidosis and tuberculosis.
In agreement with our previous studies, we have found a significant decrease in the presence of the 57Q allele and 57XQ genotype of the FCGR2C gene in SA compared with the TB patient group. We have also found an increase in 158FF and a decrease in the 158FV genotype occurrence of the FCGR3A gene, especially in patients with Stage I of SA compared to TB patients. Although in our previous study on genetic predisposition to develop SA we showed no differences between SA patients and healthy controls regarding variants of FCGR3B gene, we have shown in this study significant differences between SA and TB patient groups. In the whole group of SA patients, as well as among patients with the initial stages of SA, Stages I and II, we have observed an increased frequency of FCGR3B variants (alleles and genotypes) with SH or NA2 alleles, in comparison to TB patients.
Therefore, in the current study we have shown a decrease in the occurrence of FCGR gene variants, responsible for more efficient binding of immune complexes in SA versus TB patients. It appeared as a lower presence of the 57Q allele and 57XQ genotype of FCGR2C, the 158FV genotype of FCGR3A, the NA1 variant and NA1/NA2 genotype of the FCGR3B gene (Table 5). We have also shown an increase in the frequency of alleles and genotypes responsible for a less efficient ICs binding in SA compared to TB patients (57X and 57XX of FCGR2C, 158FF of FCGR3A, SH, NA1/SH, NA2/NA2 of FCGR3B). This applied especially to the patients in the initial stages of sarcoidosis, Stages I and II, compared with TB patients.
This is in concordance with our previous studies on the phagocytic activity of neutrophils, which mostly have FcγRIIIb on their surface. Their phagocytic activity was significantly lower in SA patients in comparison to individuals suffering from TB [26].
All of these observations may be associated with a lower ability to bind and clear IgG-based immune complexes and the resulting immunocomplexemia, especially in patients developing the initial, less severe stages of SA compared with TB patients (Table 5) [12,13]. The polymorphism of the FCGR genes in patients who developed the initial stages of sarcoidosis, Stages I/II, may cause an aberrant function of Fcγ receptors, located at the surface of immune cells in the peripheral blood of these SA patients. The malfunctioned receptors bind immune complexes with lower affinity and do not clear the immune complexes effectively from circulation via phagocytosis [14]. Therefore, the immune complexes remain in the circulation on a high level. When the immune complexes are not phagocyted effectively, the antigen (bound in ICs) is not effectively processed and presented at the surface of immune cells to trigger immune response as massive as those in more advanced stages of SA (Stages III/IV) and in TB. This lower immune response in the initial stages of SA, Stages I/II, can promote the persistence of an environmental factor causing the disease, e.g., mycobacteria, which can spread its antigens, e.g., Mtb-HSPs, resembling human HSPs. This can subsequently lead to autoimmunisation (via molecular mimicry) and further binding these antigens by IgG to create more immune complexes in the blood of SA patients (reviewed in [29]).
In our previous study, we have revealed a higher frequency of 131HH and lower occurrence of the 131HR genotype of the FCGR2A gene in more the advanced stage of SA, Stage III, compared to healthy individuals. We have also found an increased occurrence of 131HH and a decreased occurrence of the 131HR genotype in SA patients with Stages III/IV of the disease in comparison with patients with less severe stages, Stages I/II [12]. We have presented a higher frequency of the 57Q and 57XQ genotypes, as well as a lower occurrence of the 57X allele and the 57XX genotype of FCGR2C in SA patients with advanced stages, Stages III and III/IV, compared with healthy individuals and SA patients in the initial stages, Stages I and II [12].
This is in agreement with the fact that we have shown an increase in the 131HH genetic variant of FcγRIIa in patients who have developed more severe stage of SA, Stage III (vs. TB patients). This genetic variant is responsible for more efficient ICs binding by FcγIIa, present in high numbers, especially on monocytes (Table 5). IC binding by this receptor can be followed by the increased phagocytic activity of monocytes, as it was found in our previous study [11]. It can subsequently lead to the processing of the ingested antigen and its presentation at the cell surface to activate a strong immune reaction, present in the advanced stages of SA [14,30].
Therefore, our study showed differences in the genetic background regarding FCGR polymorphism, which predisposes the development of sarcoidosis or tuberculosis. Moreover, one can notice differences in the presence of FCGR gene variants in the initial or advanced stages of SA, in comparison to TB, which can further support the prognosis of SA development.
An added value of the current study is the comparison of the frequencies of FCGR gene variants between TB patients and healthy individuals. This has never been achieved before for people from the Caucasian ethnic group. Additionally, there is only scarce information on the topic about other ethnic groups.
Among TB patients, in comparison to healthy individuals, we have found an increased occurrence of the 57Q allele and 57XQ genotype of FCGR2C, leading to an expression of a functional FcγRIIc receptor. We have also found an increase in the NA1/NA2 genotype and a decrease in the SH allele, NA1/SH and NA2/NA2 genotypes of the FCGR3B gene in TB patients vs. healthy controls. This points to the expression of a more IC-binding FcγRIIIb receptor in TB patients than in the control group.
The only other study on FCGR polymorphism in TB patients was conducted with a Moroccan population sample. In accordance with our findings within the Caucasian ethnic group, no difference was found in the frequency of FCGR2A or FCGR3A gene variants between TB patients and healthy individuals from the Moroccan population [31]. The cited study did not include an analysis of other FCGR genes. Information on FCGR polymorphism in TB patients is scarce and does not enable a broader comparison.
Our findings are in accordance with data on the important role of natural killer (NK) cells (possessing FcγRIIc) during the course of tuberculosis in immunocompromised individuals. Activated (e.g., by FcγRIIc) NK cells act towards the inhibition of M. tuberculosis growth and inform other immune cells, such as macrophages and monocytes, of the presence of tubercle bacilli [32]. This can be supported by the presented increase in the ability of IC binding by FcγRIIIb receptor in TB patients in comparison to healthy individuals. Neutrophils activated by IC-binding to FcγRIIIb can degranulate with bactericidal enzymes and α-defensins to kill bacilli. Activated neutrophils can also secrete many pro-inflammatory cytokines, e.g., IL-1-β, IL-8 and IFN-γ, in response to mycobacterial infection to inform other immune cells of the threat. They can also engulf bacilli in the process of FcγR-mediated phagocytosis and present mycobacterial antigens on their surface to activate other immune cells in the pursuit of fighting infection [33].
Thus, an increased ability of FcγRIIc and FcγRIIIb to bind immune complexes, including those with mycobacterial antigens, might subsequently translate into a strong inflammatory response, seen in active pulmonary TB, like in our patients.
To conclude, the presented data point to a possibility of supporting the differential diagnosis of SA and TB on the basis of recognition of the genetic variants of FCGR2C, FCGR3A and FCGR3B genes. Analysis of FCGR2A polymorphism can also be helpful in differentiating more severe forms of SA from TB. On the contrary, both in the current study and in our previous analyses of FCGR polymorphism in SA patients [34], there were no differences in the frequency of FCGR2B alleles or genotypes occurrence in the studied groups. This points to the more important role of regulating FcγRIIa, FcγRIIc, FcγRIIIa and FcγRIIIb activation, rather than FcγRIIb inhibition, during the development of sarcoidosis and tuberculosis.
Therefore, it could be highly beneficial to perform more studies on FCGR2C/3A/3B gene polymorphism in SA and TB patients to prove their usefulness as molecular biomarkers during the differential diagnosis of the two highly similar disorders.
Additionally, the presence of higher IC-binding variants of FCGR2A and FCGR3B genes in individuals with advanced stages of SA vs. TB patients, can help to predict if sarcoidosis will progress to a more severe disorder and serve as a marker of SA prognosis.
Table 5. The influence of FCGR gene polymorphism on immunoglobulin G-based immune complex binding by the receptors for Fc fragment of IgG (FcγR).
Location of ReceptorReceptorLocation of aa Change in the Receptor ProteinGeneGene Variant Responsible forReference
Higher
ICs Binding
Lower
ICs Binding
Mo, MΦ, N, less often on E, B, MCFcγRIIasecond extracellular domainFCGR2A131H131R[14,35,36,37,38]
Almost all types of leukocytes (including B cells and memory CD8+ T cells), minority of NK; liver and aorta cellsFcγRIIbtransmembrane
domain
FCGR2B232T *232I *[14,35,36,38,39,40,41]
NK, less often on Mo, MΦ,
N
FcγRIIcfirst extracellular
domain
FCGR2C57Q57X
(truncated, nonfunctional receptor)
[14,35,36,38,42]
NK, Mo, MΦ, N, T γδ cells, DC, MC, EFcγRIIIasecond extracellular domainFCGR3A158V158F[14,35,36,37,38]
N, less often on B, after induction on EFcγRIIIbfirst extracellular
domain
FCGR3BNA1NA2, SH[14,35,36,38,43]
aa—amino acid; ICs—immune complexes; IgG—immunoglobulin G; IgG1/2/3/4—subclasses of IgG; B—basophils; DC—dendritic cells; E—eosinophils; MC—mast cells; Mo—monocytes; MΦ—macrophages; N—neutrophils; NK—natural killer cells; Pl—platelets; * The presence of isoleucine in 232 position of the transmembrane domain of FcγRIIb receptor is associated with a better positioning of the receptor protein in the lipid rafts of the cellular membranes of immune cells in comparison to the presence of threonine in this position. Thus, the FcγRIIb receptor with the 232I variant enables for better regulation (inhibition) of other FcγRs activation.

Supplementary Materials

The following supporting information can be downloaded at: https://www.mdpi.com/article/10.3390/cells12091221/s1, Table S1: Frequency of the occurrence of individual FCGR2A alleles in the studied groups and subgroups; Table S2: Frequency of the occurrence of individual FCGR2A genotypes in the studied groups and subgroups; Table S3: Frequency of the occurrence of individual FCGR2B alleles in the studied groups and subgroups; Table S4: Frequency of the occurrence of individual FCGR2B genotypes in the studied groups and subgroups; Table S5: Frequency of the occurrence of individual FCGR2C alleles in the studied groups and subgroups; Table S6: Frequency of the occurrence of individual FCGR2C genotypes in the studied groups and subgroups; Table S7: Frequency of the occurrence of individual FCGR3A alleles in the studied groups and subgroups; Table S8: Frequency of the occurrence of individual FCGR3A genotypes in the studied groups and subgroups; Table S9: Frequency of the occurrence of individual FCGR3B alleles in the studied groups and subgroups; Table S10: Frequency of the occurrence of individual FCGR3B genotypes in the studied groups and subgroups.

Author Contributions

Conceptualization, A.D., M.T. and B.R.; methodology, M.T., K.R. and B.R.; validation, B.R., K.R., A.D. and M.T.; formal analysis, B.R., K.R. and M.T.; investigation, B.R. and K.R.; resources, A.D. and M.T.; writing—original draft preparation, M.T. and A.D.; writing—review and editing, A.D., B.R. and K.R.; visualization, M.T.; supervision, A.D.; project administration, A.D.; funding acquisition, A.D. and M.T. All authors have read and agreed to the published version of the manuscript.

Funding

This research was funded by the Ministry of Science and Higher Education and the National Science Centre in Poland, grant number 5160/B/P01/2010/39.

Institutional Review Board Statement

The study was conducted in accordance with the amended Declaration of Helsinki and with the consent of the Independent Bioethics Committee for Scientific Research at the Medical University of Gdansk, Poland (decision number NKBBN/363/2016).

Informed Consent Statement

Informed consent was obtained from all subjects involved in the study.

Data Availability Statement

The data presented in this study is available in the current article and Supplementary Materials.

Conflicts of Interest

The authors declare no conflict of interest.

References

  1. Statement on Sarcoidosis. Joint Statement of the American Thoracic Society (ATS), the European Respiratory Society (ERS) and the World Association of Sarcoidosis and Other Granulomatous Disorders (WASOG) adopted by the ATS Board of Directors and by the ERS Executive Committee, February 1999. Am. J. Respir. Crit. Care Med. 1999, 160, 736–755. [CrossRef]
  2. Sève, P.; Pacheco, Y.; Durupt, F.; Jamilloux, Y.; Gerfaud-Valentin, M.; Isaac, S.; Boussel, L.; Calender, A.; Androdias, G.; Valeyre, D.; et al. Sarcoidosis: A Clinical Overview from Symptoms to Diagnosis. Cells 2021, 10, 766. [Google Scholar] [CrossRef] [PubMed]
  3. Dubaniewicz, A.; Zimmermann, A.; Smigielska, M.; Dubaniewicz-Wybieralska, M.; Moszkowska, G.; Wysocka, J.; Adamczyk-Bak, K.; Slominski, J.M.; Deeg, P. Sarcoidosis and tuberculosis: A connection to the human leukocyte antigen system. Adv. Exp. Med. Biol. 2013, 756, 229–237. [Google Scholar] [CrossRef] [PubMed]
  4. Schupp, J.C.; Freitag-Wolf, S.; Bargagli, E.; Mihailović-Vučinić, V.; Rottoli, P.; Grubanovic, A.; Müller, A.; Jochens, A.; Tittmann, L.; Schnerch, J.; et al. Phenotypes of organ involvement in sarcoidosis. Eur. Respir. J. 2018, 51, 1700991. [Google Scholar] [CrossRef] [PubMed]
  5. Dubaniewicz, A.; Zimmermann, A.; Dudziak, M.; Typiak, M.; Skotarczak, M. Tuberculosis in the course of sarcoidosis treatment: Is genotyping necessary for personalized therapy? Expert Rev. Clin. Immunol. 2013, 9, 349–360. [Google Scholar] [CrossRef]
  6. Furin, J.; Cox, H.; Pai, M. Tuberculosis. Lancet 2019, 393, 1642–1656. [Google Scholar] [CrossRef]
  7. Dubaniewicz, A.; Dubaniewicz-Wybieralska, M.; Sternau, A.; Zwolska, Z.; Izycka-Swieszewska, E.; Augustynowicz-Kopec, E.; Skokowski, J.; Singh, M.; Zimnoch, L. Mycobacterium tuberculosis complex and mycobacterial heat shock proteins in lymph node tissue from patients with pulmonary sarcoidosis. J. Clin. Microbiol. 2006, 44, 3448–3451. [Google Scholar] [CrossRef]
  8. Dubaniewicz, A. Mycobacterium tuberculosis heat shock proteins and autoimmunity in sarcoidosis. Autoimmun. Rev. 2010, 9, 419–424. [Google Scholar] [CrossRef]
  9. Dubaniewicz, A. Microbial and human heat shock proteins as ’danger signals’ in sarcoidosis. Hum. Immunol. 2013, 74, 1550–1558. [Google Scholar] [CrossRef]
  10. Dubaniewicz, A.; Holownia, A.; Kalinowski, L.; Wybieralska, M.; Dobrucki, I.T.; Singh, M. Is mycobacterial heat shock protein 16 kDa, a marker of the dormant stage of Mycobacterium tuberculosis, a sarcoid antigen? Hum. Immunol. 2013, 74, 45–51. [Google Scholar] [CrossRef]
  11. Dubaniewicz, A.; Typiak, M.; Wybieralska, M.; Szadurska, M.; Nowakowski, S.; Staniewicz-Panasik, A.; Rogoza, K.; Sternau, A.; Deeg, P.; Trzonkowski, P. Changed phagocytic activity and pattern of Fcγ and complement receptors on blood monocytes in sarcoidosis. Hum. Immunol. 2012, 73, 788–794. [Google Scholar] [CrossRef]
  12. Typiak, M.; Rębała, K.; Dudziak, M.; Słomiński, J.M.; Dubaniewicz, A. Polymorphism of FCGR2A, FCGR2C, and FCGR3B Genes in the Pathogenesis of Sarcoidosis. Adv. Exp. Med. Biol. 2016, 905, 57–68. [Google Scholar] [CrossRef]
  13. Typiak, M.J.; Rębała, K.; Dudziak, M.; Dubaniewicz, A. Polymorphism of FCGR3A gene in sarcoidosis. Hum. Immunol. 2014, 75, 283–288. [Google Scholar] [CrossRef]
  14. Nimmerjahn, F.; Ravetch, J.V. Fcgamma receptors as regulators of immune responses. Nat. Rev. Immunol. 2008, 8, 34–47. [Google Scholar] [CrossRef]
  15. Iannuzzi, M.C.; Rybicki, B.A.; Teirstein, A.S. Sarcoidosis. N. Engl. J. Med. 2007, 357, 2153–2165. [Google Scholar] [CrossRef]
  16. Lahiri, D.K.; Nurnberger, J.I., Jr. A rapid non-enzymatic method for the preparation of HMW DNA from blood for RFLP studies. Nucleic Acids Res. 1991, 19, 5444. [Google Scholar] [CrossRef]
  17. Edberg, J.C.; Langefeld, C.D.; Wu, J.; Moser, K.L.; Kaufman, K.M.; Kelly, J.; Bansal, V.; Brown, W.M.; Salmon, J.E.; Rich, S.S.; et al. Genetic linkage and association of Fcgamma receptor IIIA (CD16A) on chromosome 1q23 with human systemic lupus erythematosus. Arthritis Rheum. 2002, 46, 2132–2140. [Google Scholar] [CrossRef]
  18. Su, K.; Wu, J.; Edberg, J.C.; McKenzie, S.E.; Kimberly, R.P. Genomic organization of classical human low-affinity Fcgamma receptor genes. Genes Immun. 2002, 3 (Suppl. 1), S51–S56. [Google Scholar] [CrossRef]
  19. Siriboonrit, U.; Tsuchiya, N.; Sirikong, M.; Kyogoku, C.; Bejrachandra, S.; Suthipinittharm, P.; Luangtrakool, K.; Srinak, D.; Thongpradit, R.; Fujiwara, K.; et al. Association of Fcgamma receptor IIb and IIIb polymorphisms with susceptibility to systemic lupus erythematosus in Thais. Tissue Antigens 2003, 61, 374–383. [Google Scholar] [CrossRef]
  20. Van Den Berg, L.; Myhr, K.M.; Kluge, B.; Vedeler, C.A. Fcgamma receptor polymorphisms in populations in Ethiopia and Norway. Immunology 2001, 104, 87–91. [Google Scholar] [CrossRef]
  21. Fahsold, R.; Hoffmeyer, S.; Mischung, C.; Gille, C.; Ehlers, C.; Kücükceylan, N.; Abdel-Nour, M.; Gewies, A.; Peters, H.; Kaufmann, D.; et al. Minor lesion mutational spectrum of the entire NF1 gene does not explain its high mutability but points to a functional domain upstream of the GAP-related domain. Am. J. Hum. Genet. 2000, 66, 790–818. [Google Scholar] [CrossRef] [PubMed]
  22. VassarStats. Vassar Stats Program; Lowry, R., Ed.; Vassar College: Poughkeepsie, NY, USA, 2022; Volume 2022, Available online: http://www.vassarstats.net/ (accessed on 23 February 2023).
  23. OEGE Software Organization. Odds Ratio Calculator. 2021. Available online: www.oege.org/software/orcalc.html (accessed on 15 December 2021).
  24. Rodriguez, S.; Gaunt, T.R.; Day, I.N. Hardy-Weinberg equilibrium testing of biological ascertainment for Mendelian randomization studies. Am. J. Epidemiol. 2009, 169, 505–514. [Google Scholar] [CrossRef] [PubMed]
  25. Dubaniewicz, A.; Wybieralska, M.; Rogoza, K.; Typiak, M.; Sternau, A.; Slominski, J.M.; Trzonkowski, P. Phagocytosis by blood monocytes in differentiation between sarcoidosis and tuberculosis. Eur. Respir. J. 2012, 40, P2635. [Google Scholar]
  26. Dubaniewicz, A.; Rękawiecki, B.; Piprek, M.; Skotarczak, M.; Dubaniewicz-Wybieralska, M. Monocyte/neutrophil phagocytic activity ratio in differentiating tuberculosis from sarcoidosis. Eur. Respir. J. 2019, 54, PA1378. [Google Scholar] [CrossRef]
  27. Dubaniewicz, A.; Trzonkowski, P.; Dubaniewicz-Wybieralska, M.; Singh, M.; Myśliwski, A. Comparative analysis of mycobacterial heat shock proteins-induced apoptosis of peripheral blood mononuclear cells in sarcoidosis and tuberculosis. J. Clin. Immunol. 2006, 26, 243–250. [Google Scholar] [CrossRef]
  28. Dubaniewicz, A. Frequency of occurrence of circulating immune complexes in sera of patients with pulmonary sarcoidosis; preliminary report. Vestnik MCDC 2004, 3, 108–113. [Google Scholar]
  29. Dubaniewicz, A. Mycobacterial Heat Shock Proteins in Sarcoidosis and Tuberculosis. Int. J. Mol. Sci. 2023, 24, 5084. [Google Scholar] [CrossRef]
  30. Nimmerjahn, F.; Gordan, S.; Lux, A. FcγR dependent mechanisms of cytotoxic, agonistic, and neutralizing antibody activities. Trends Immunol. 2015, 36, 325–336. [Google Scholar] [CrossRef]
  31. Sadki, K.; Lamsyah, H.; Rueda, B.; Akil, E.; Sadak, A.; Martin, J.; El Aouad, R. Analysis of MIF, FCGR2A and FCGR3A gene polymorphisms with susceptibility to pulmonary tuberculosis in Moroccan population. J. Genet. Genom. 2010, 37, 257–264. [Google Scholar] [CrossRef]
  32. Allen, M.; Bailey, C.; Cahatol, I.; Dodge, L.; Yim, J.; Kassissa, C.; Luong, J.; Kasko, S.; Pandya, S.; Venketaraman, V. Mechanisms of Control of Mycobacterium tuberculosis by NK Cells: Role of Glutathione. Front. Immunol. 2015, 6, 508. [Google Scholar] [CrossRef]
  33. Hilda, J.N.; Das, S.; Tripathy, S.P.; Hanna, L.E. Role of neutrophils in tuberculosis: A bird’s eye view. Innate Immun. 2020, 26, 240–247. [Google Scholar] [CrossRef]
  34. Typiak, M.; Rębała, K.; Haraś, A.; Skotarczak, M.; Słomiński, J.M.; Dubaniewicz, A. Copy number variation of FCGR genes in etiopathogenesis of sarcoidosis. PLoS ONE 2017, 12, e0177194. [Google Scholar] [CrossRef]
  35. Bournazos, S.; Woof, J.M.; Hart, S.P.; Dransfield, I. Functional and clinical consequences of Fc receptor polymorphic and copy number variants. Clin. Exp. Immunol. 2009, 157, 244–254. [Google Scholar] [CrossRef]
  36. Li, X.; Ptacek, T.S.; Brown, E.E.; Edberg, J.C. Fcgamma receptors: Structure, function and role as genetic risk factors in SLE. Genes Immun. 2009, 10, 380–389. [Google Scholar] [CrossRef]
  37. Spector, W.G.; Heesom, N. The production of granulomata by antigen-antibody complexes. J. Pathol. 1969, 98, 31–39. [Google Scholar] [CrossRef]
  38. Hogarth, P.M.; Pietersz, G.A. Fc receptor-targeted therapies for the treatment of inflammation, cancer and beyond. Nat. Rev. Drug. Discov. 2012, 11, 311–331. [Google Scholar] [CrossRef]
  39. Takai, T. Fc receptors and their role in immune regulation and autoimmunity. J. Clin. Immunol. 2005, 25, 1–18. [Google Scholar] [CrossRef]
  40. Anderson, C.L.; Ganesan, L.P.; Robinson, J.M. The biology of the classical Fcγ receptors in non-hematopoietic cells. Immunol. Rev. 2015, 268, 236–240. [Google Scholar] [CrossRef]
  41. Starbeck-Miller, G.R.; Badovinac, V.P.; Barber, D.L.; Harty, J.T. Cutting edge: Expression of FcγRIIB tempers memory CD8 T cell function in vivo. J. Immunol. 2014, 192, 35–39. [Google Scholar] [CrossRef]
  42. Breunis, W.B.; van Mirre, E.; Bruin, M.; Geissler, J.; de Boer, M.; Peters, M.; Roos, D.; de Haas, M.; Koene, H.R.; Kuijpers, T.W. Copy number variation of the activating FCGR2C gene predisposes to idiopathic thrombocytopenic purpura. Blood 2008, 111, 1029–1038. [Google Scholar] [CrossRef]
  43. Adu, B.; Dodoo, D.; Adukpo, S.; Hedley, P.L.; Arthur, F.K.; Gerds, T.A.; Larsen, S.O.; Christiansen, M.; Theisen, M. Fc γ receptor IIIB (FcγRIIIB) polymorphisms are associated with clinical malaria in Ghanaian children. PLoS ONE 2012, 7, e46197. [Google Scholar] [CrossRef] [PubMed]
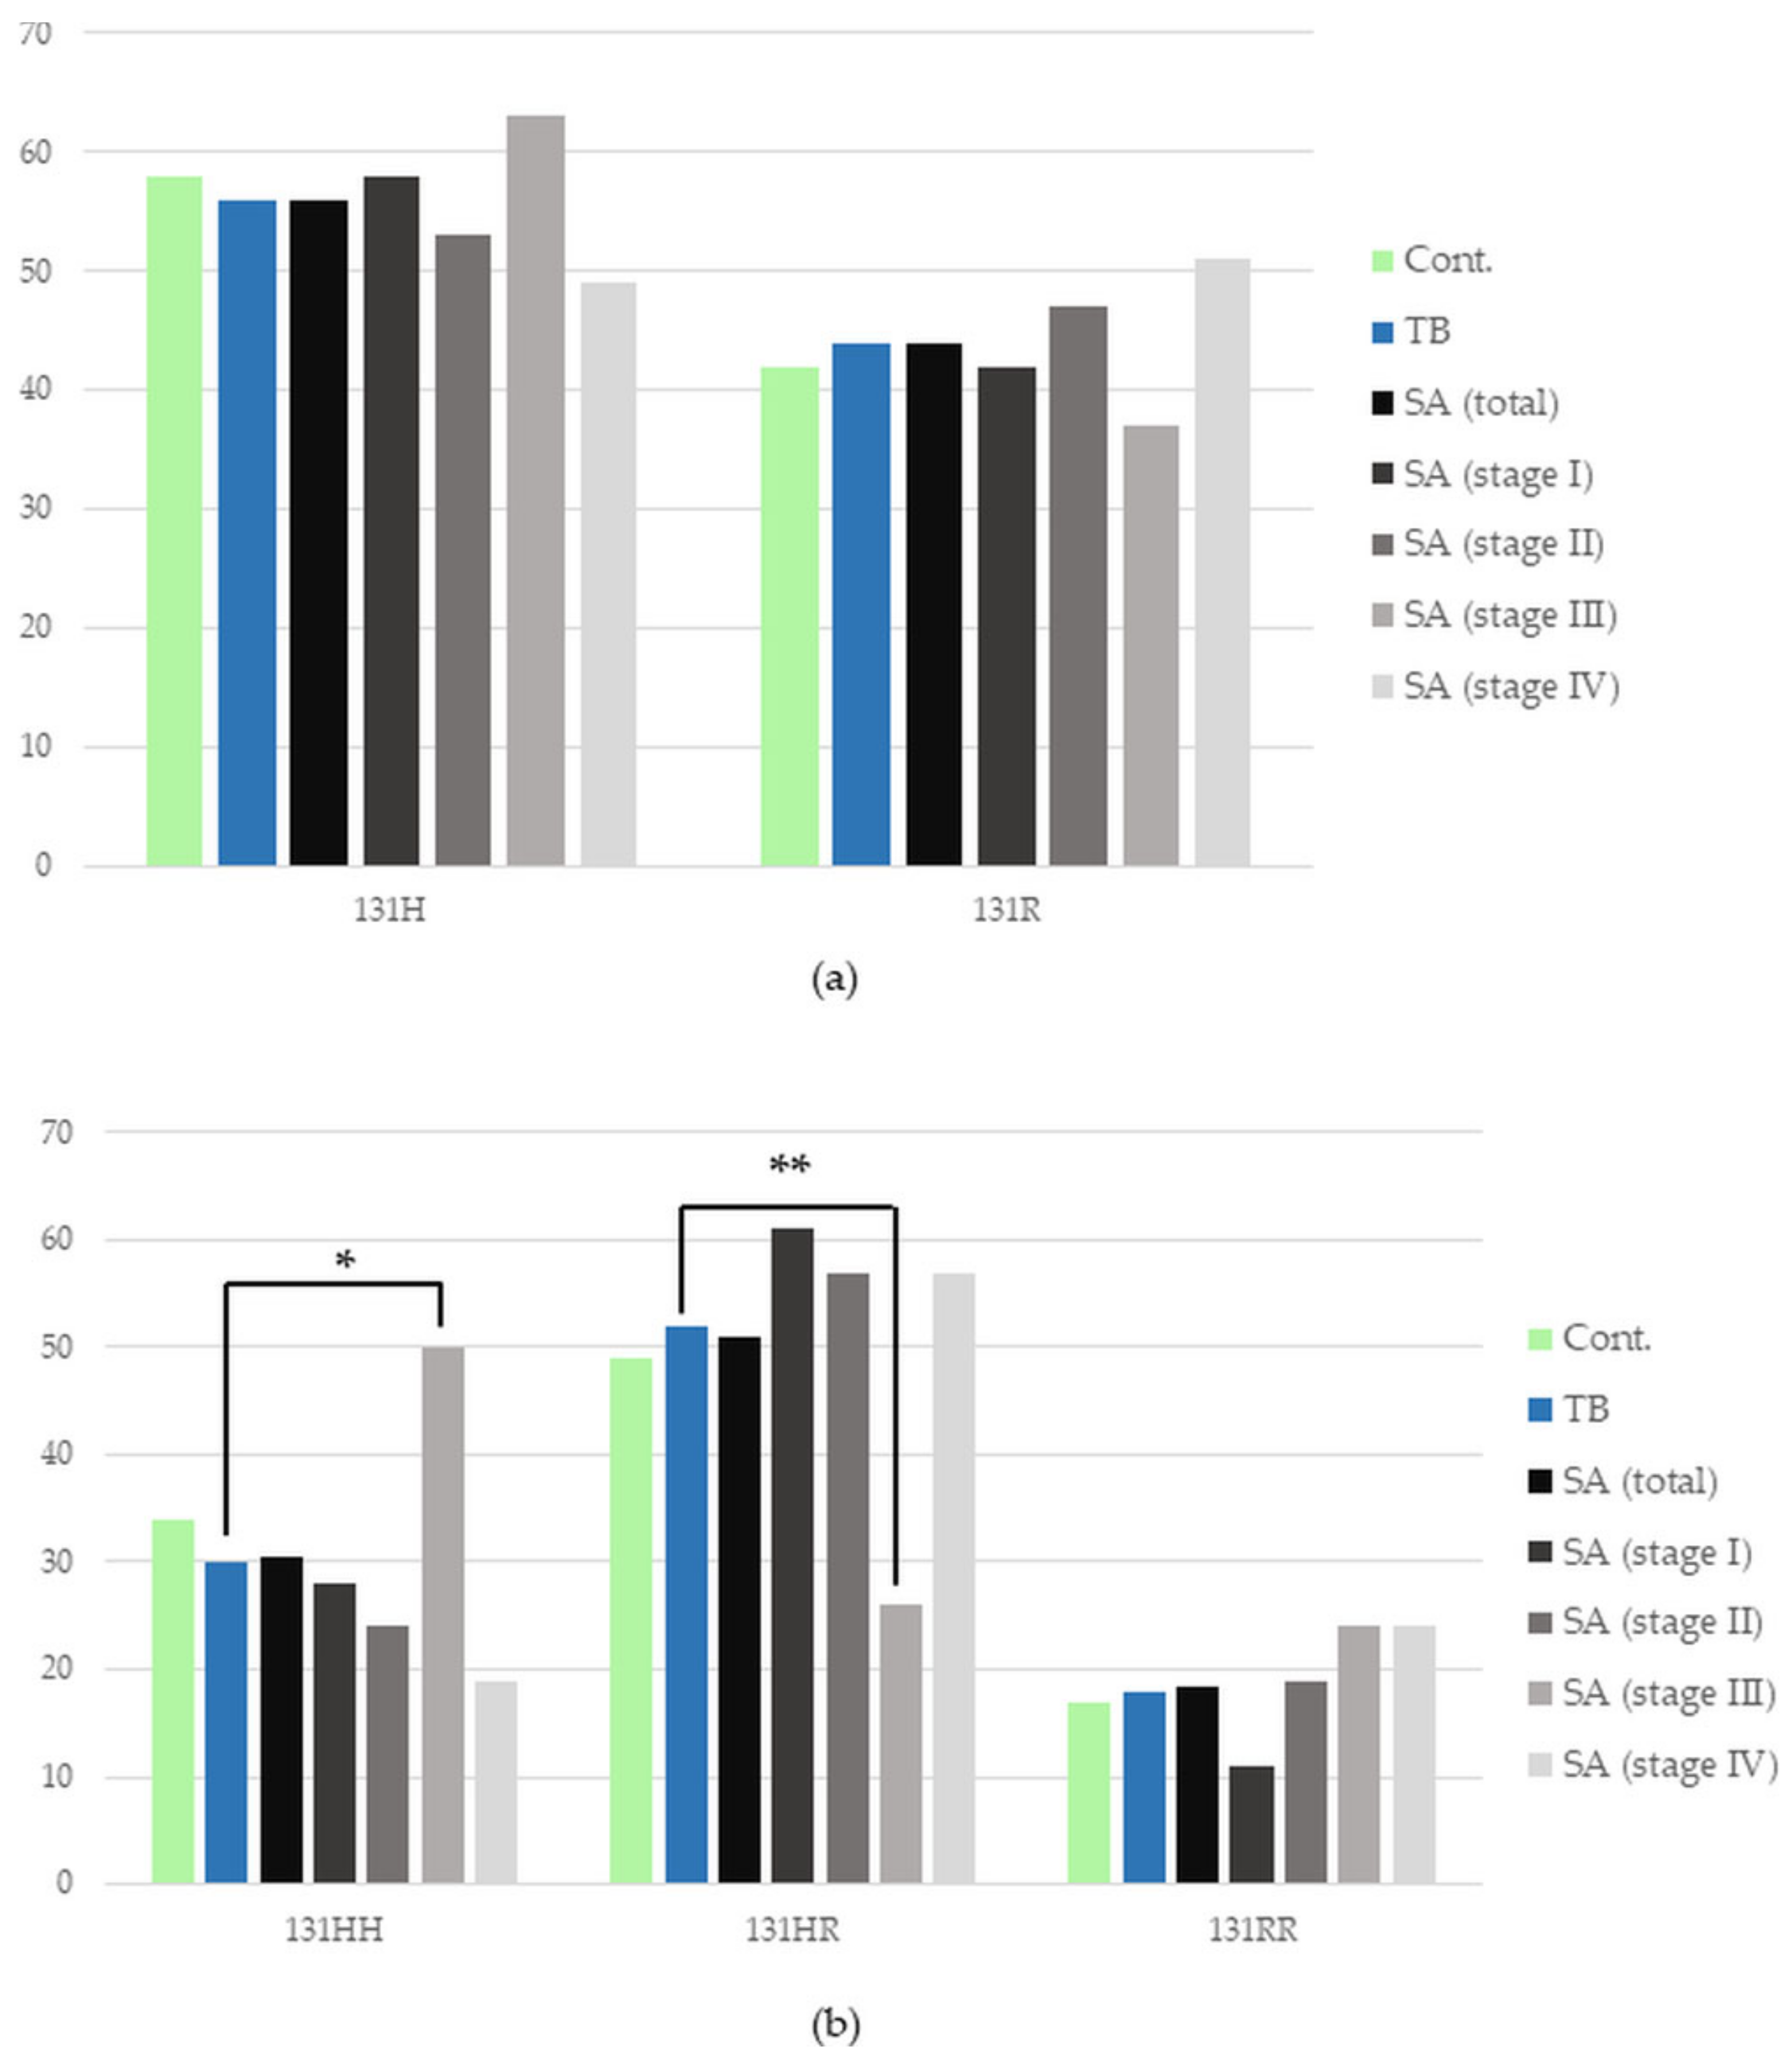
Figure 1. Frequency of the occurrence of individual (a) alleles and (b) genotypes of the FCGR2A gene in the studied groups and subgroups. Cont.—healthy control; SA—group of patients with sarcoidosis; TB—group of patients with tuberculosis; * p = 0.03; ** p = 0.008.
Cells 12 01221 g001
Figure 2. Frequency of the occurrence of individual (a,c) alleles and (b,d) genotypes of the FCGR2C gene in the studied (a,b) groups and (c,d) subgroups. Cont.—healthy control; SA—group of patients with sarcoidosis; TB—group of patients with tuberculosis; * p < 0.05, ** p < 0.01, *** p < 0.001, **** p < 0.0001, ***** p < 0.00001.
Cells 12 01221 g002
Figure 3. Frequency of the occurrence of individual (a,c) alleles and (b,d) genotypes of the FCGR3A gene in the studied (a,b) groups and (c,d) subgroups. Cont.—healthy control; SA—group of patients with sarcoidosis; TB—group of patients with tuberculosis; * p < 0.05, ** p ≤ 0.01.
Cells 12 01221 g003
Figure 4. Frequency of the occurrence of individual (a,c) alleles and (b,d,e) genotypes of the FCGR3B gene in the studied (a,b) groups and (c,d,e) subgroups. Cont.—healthy control; SA—group of patients with sarcoidosis; TB—group of patients with tuberculosis; * p ≤ 0.05, ** p ≤ 0.01, *** p ≤ 0.001, **** p ≤ 0.0001.
Cells 12 01221 g004
Table 1. Clinical characteristics of patients with sarcoidosis (SA), pulmonary tuberculosis (TB) and healthy volunteers (C). The percentages (%) of individuals with a certain characteristic are given in parentheses.
SA
n = 154 (%)
TB
n = 179 (%)
C
n = 148 (%)
Age (years)Mean ± SD44 ± 1346 ± 1542 ± 10
Median444540
Range21–8920–8018–79
SexFemale70 (46)75 (42)67 (45)
Male84 (54)104 (58)81 (55)
Smokers 90 (58)145 (81)80 (54)
BCG vaccinated 154 (100)179 (100)148 (100)
Positive PPD skin test 0179 (100)0
Löfgren’s syndrome 28 (18)00
Relapse 000
SymptomsCough71 (46)161 (90)0
Dyspnea81 (53)45 (25)0
Increased body temperature21 (14)116 (65)0
Night sweats2 (<1)90 (50)0
BCG—Bacillus Calmette–Guérin vaccine against tuberculosis; SD—standard deviation; a purified protein derivative (PPD) skin test is a method used to diagnose TB infection.
Table 2. Number of patients at specific stages of sarcoidosis (SA) with certain characteristics of the disease. The percentages (%) of individuals with a certain characteristic are given in parentheses.
Stage of SAIIIIIIIV
Total38603521
with Löfgren’s syndrome131020
with the duration of SA > 2 y14 (37)42 (70)35 (100)21 (100)
y—years.
Table 3. Designation of the studied genes and their polymorphism; sequences of the primers used to study it with PCR-SSP method.
Gene NameNCBI Reference Gene SequenceMutation in DNA with dbSNP IDAmino Acid ChangePrimer Names and Sequences for PCR-SSP (5′ to 3′)Product Length (bp)Reference
FCGR2ANG_012066.2A519G, rs1801274H131R2A-gene: * TCAAAGTGAAACAACAGCCTGACT
2A-519A: GGAAAATCCCAGAAATTCACACA
2A-519G: GGAAAATCCCAGAAATTCACACG
371[17]
FCGR2CNG_011982.1T202C, rs10917661X57Q2C-gene: GAGATTCCCATTGTGGACCTACG
2C-202T: GGCTGTGCTGAAACTGGAGACCT
2C-202C: GGCTGTGCTGAAACTGGAGCCAC
124[18]
FCGR3ANG_009066.1T559G, rs396991V158F3A-gene: AGTTCATCATAATTCTGACTCCT
3A-559T: TGAAGACACATTTCTACTCCCTAA
3A-559G: TGAAGACACATTTCTACTCCCTAC
100[17]
FCGR3BNG_032926.2NA1/NA2 differences:
C147T, rs447536
G141C, rs403016
A227G, rs448740
G277A, rs428888
G349A, rs2290834

SH/NA2 difference:
C266A, rs5030738

L38L
R36S
N65S
D82N
V106I
A78D
3B-gene: ATGGACTTCTAGCTGCAC
3B-NA1: CAGTGGTTTCACAATGAGAA
3B-NA2/SH: CAATGGTACAGCGTGCTT
3B-SH: TCGAGCTACTTCATTGACGA

NA1: 140
NA2/SH: 219
SH: 102
[19]
hGHNC_000017.11--hGH-F: CAGTGCCTTCCCAACCATTCCCTTA
hGH-R: ATCCACTCACGGATTTCTGTTGTGTTTC
439[20]
NF1NG_009018.1--NF1-exon4b-F: CTGTCCCCTAATACTTAATT
NF1-exon4b-R: AATACTAGTTTTTGACCCAGT

NF1-exon22-F: TCTTTAGCTTCCTACCTAAGAA
NF1-exon22-R: AACACACATACACACAAAATGAA
209

262
[21]
bp—base pairs; db SNP ID—identification number in database of single nucleotide polymorphism; F—forward primer; NA1/NA2/SH—variants of FCGR3B gene; NCBI—the National Center for Biotechnology Information; PCR-SSP—polymerase chain reaction with sequence-specific primers; R—reverse primer; * primers with ‘gene’ designation are gene-specific, and were coupled with one of the allele-specific primers in a PCR reaction.
Table 4. Designation of the polymorphism, sequences of the primers and probes used to study the variants of FCGR2B gene (reference gene sequence according to the National Center for Biotechnology Information: NG_023318.2) with the use of a real-time PCR method. Sequences of the primers and probes were designed within the applied biosystems company service.
Mutation in DNA with dbSNP IDAmino Acid ChangePrimer Names and Sequences (5′ to 3′)Fluorescent ProbesProduct Length (bp)
T695C, rs1050501I232T2B-SNP_F: CCTAGCTCCCAGCTCTTCAC
2B-SNP_R: CCACTACAGCAGCAACAATGG
2B-SNP_695T-VIC: TCACTGGGATTGCTG
2B-SNP_695C-FAM: TCACTGGGACTGCTG
36
bp—base pairs; db SNP ID—identification number in database of single nucleotide polymorphism; F—forward primer; R—reverse primer; VIC and FAM—fluorescent dyes enabling to differentiate between the two variants of FCGR2B gene.
Disclaimer/Publisher’s Note: The statements, opinions and data contained in all publications are solely those of the individual author(s) and contributor(s) and not of MDPI and/or the editor(s). MDPI and/or the editor(s) disclaim responsibility for any injury to people or property resulting from any ideas, methods, instructions or products referred to in the content.