

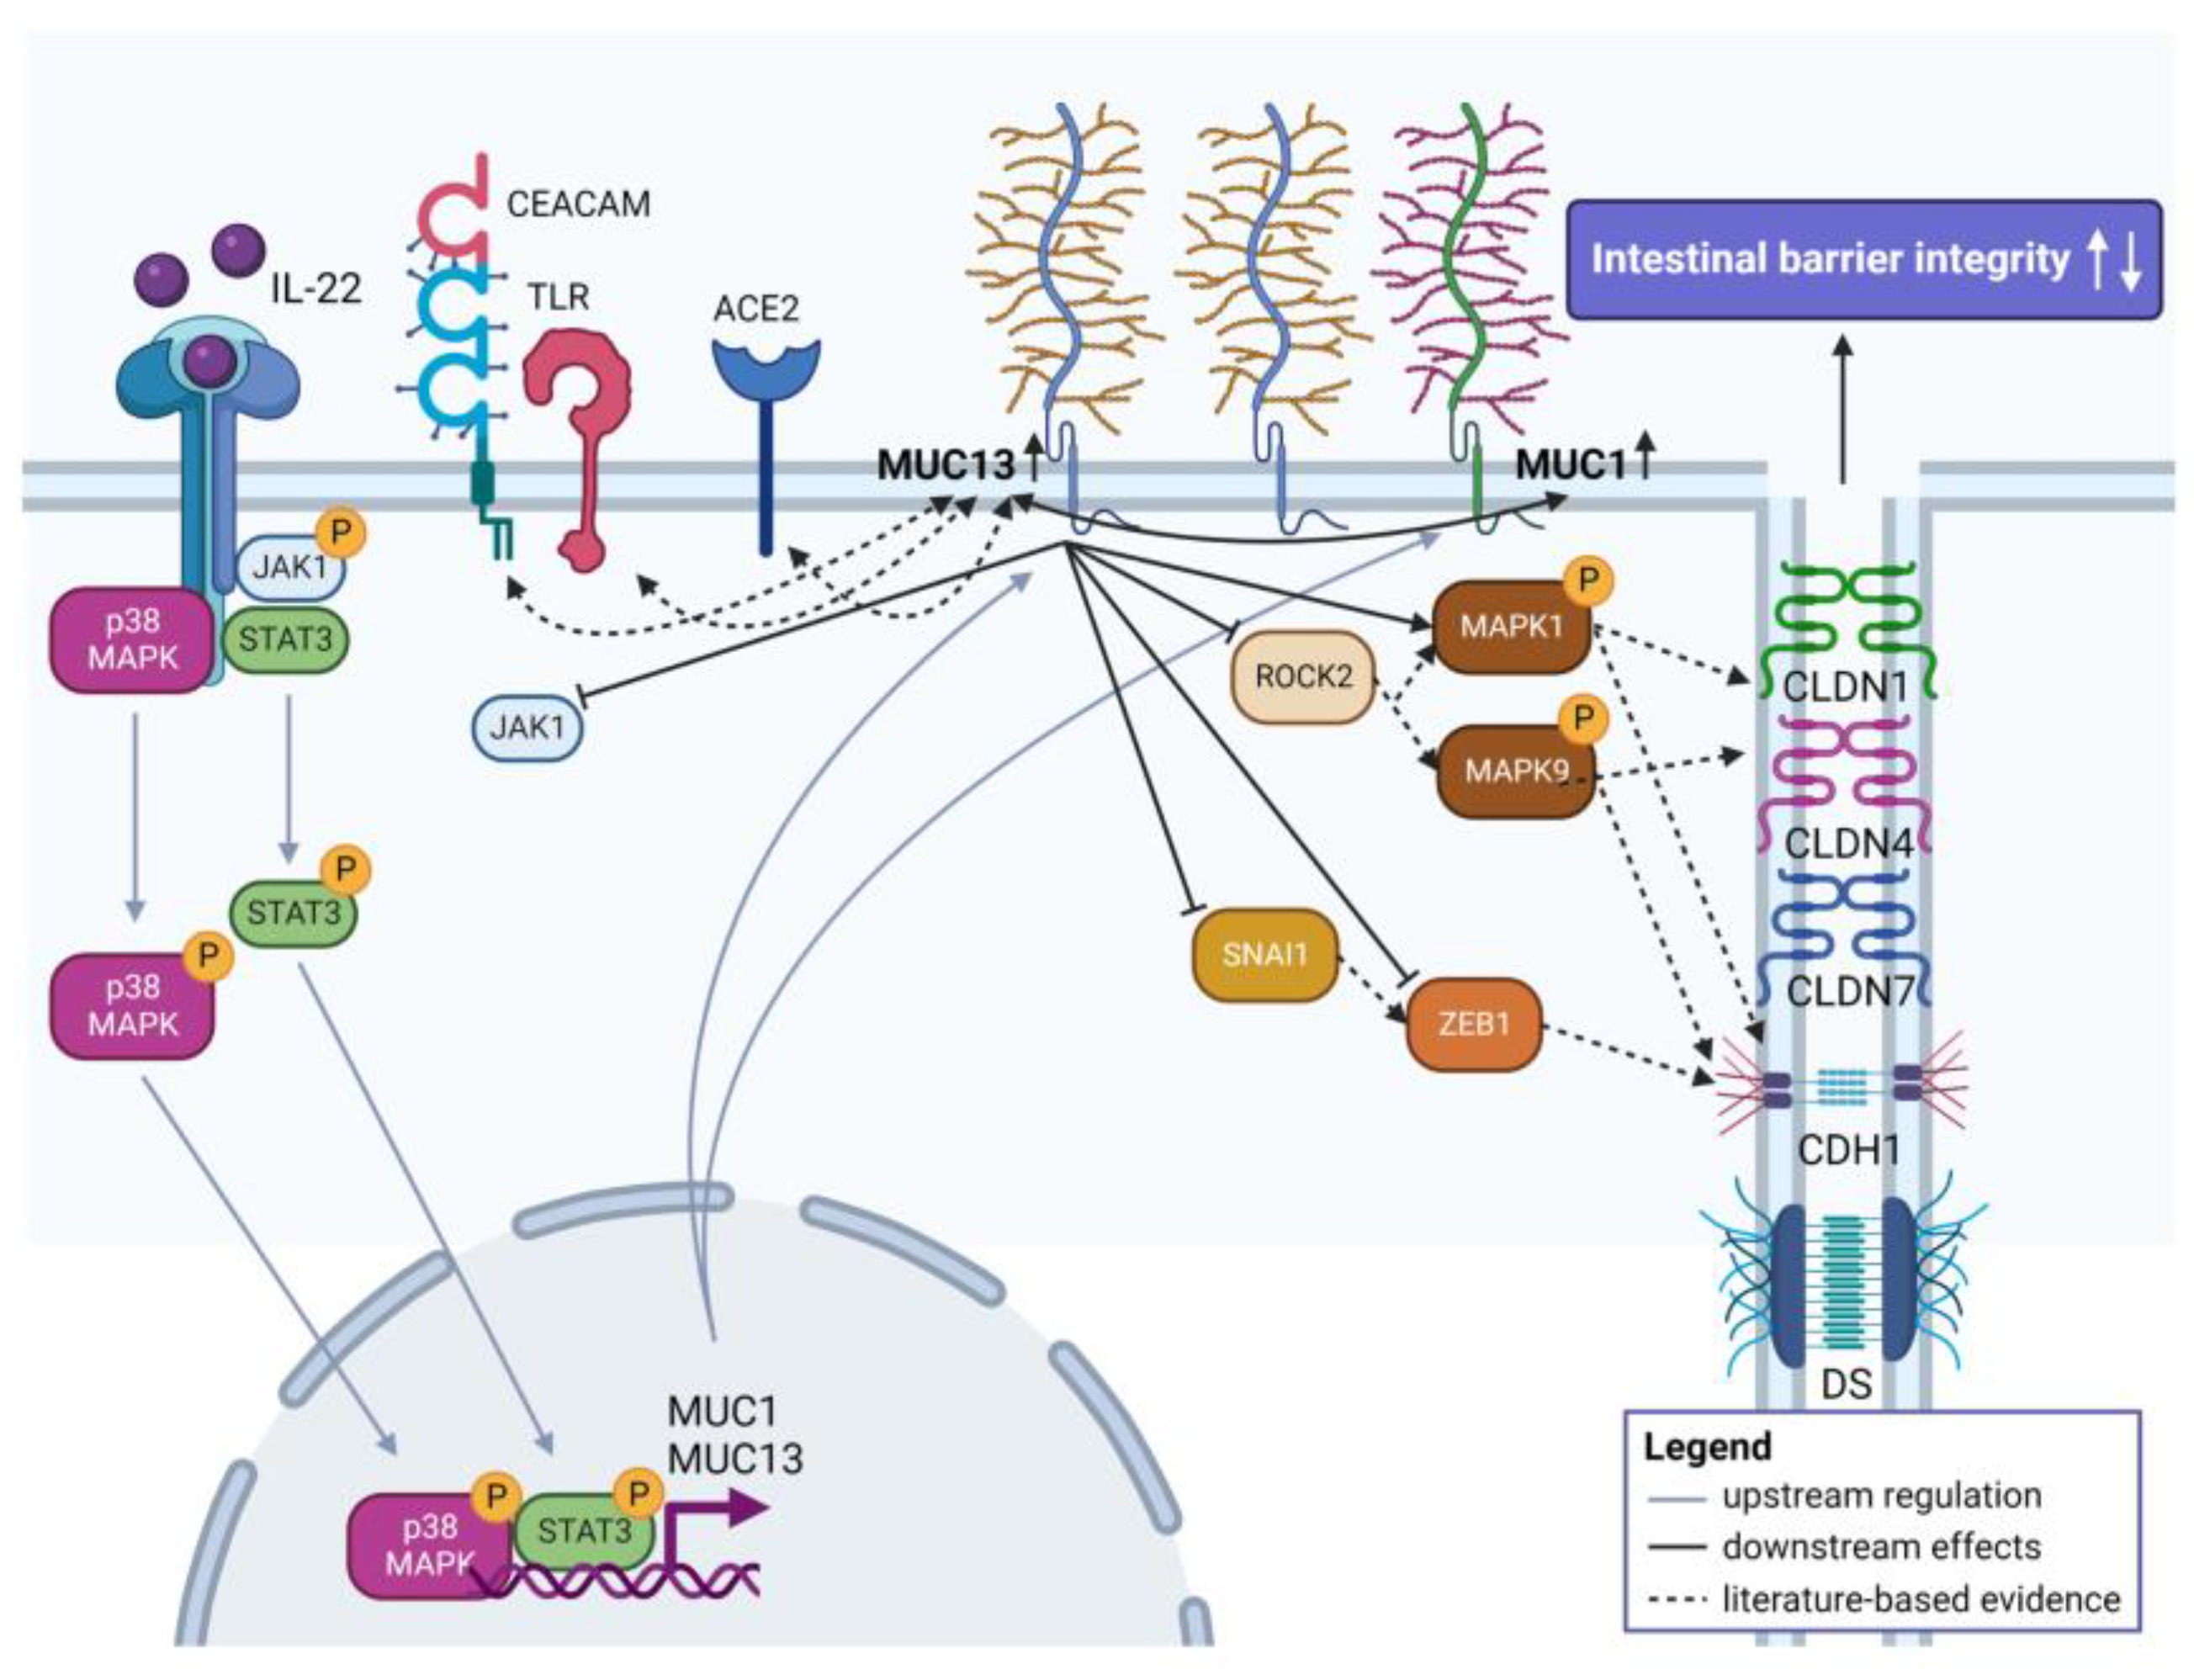
IL-22-Activated MUC13 Impacts on Colonic Barrier Function through JAK1/STAT3, SNAI1/ZEB1 and ROCK2/MAPK Signaling

 , ,
, ,  , , and
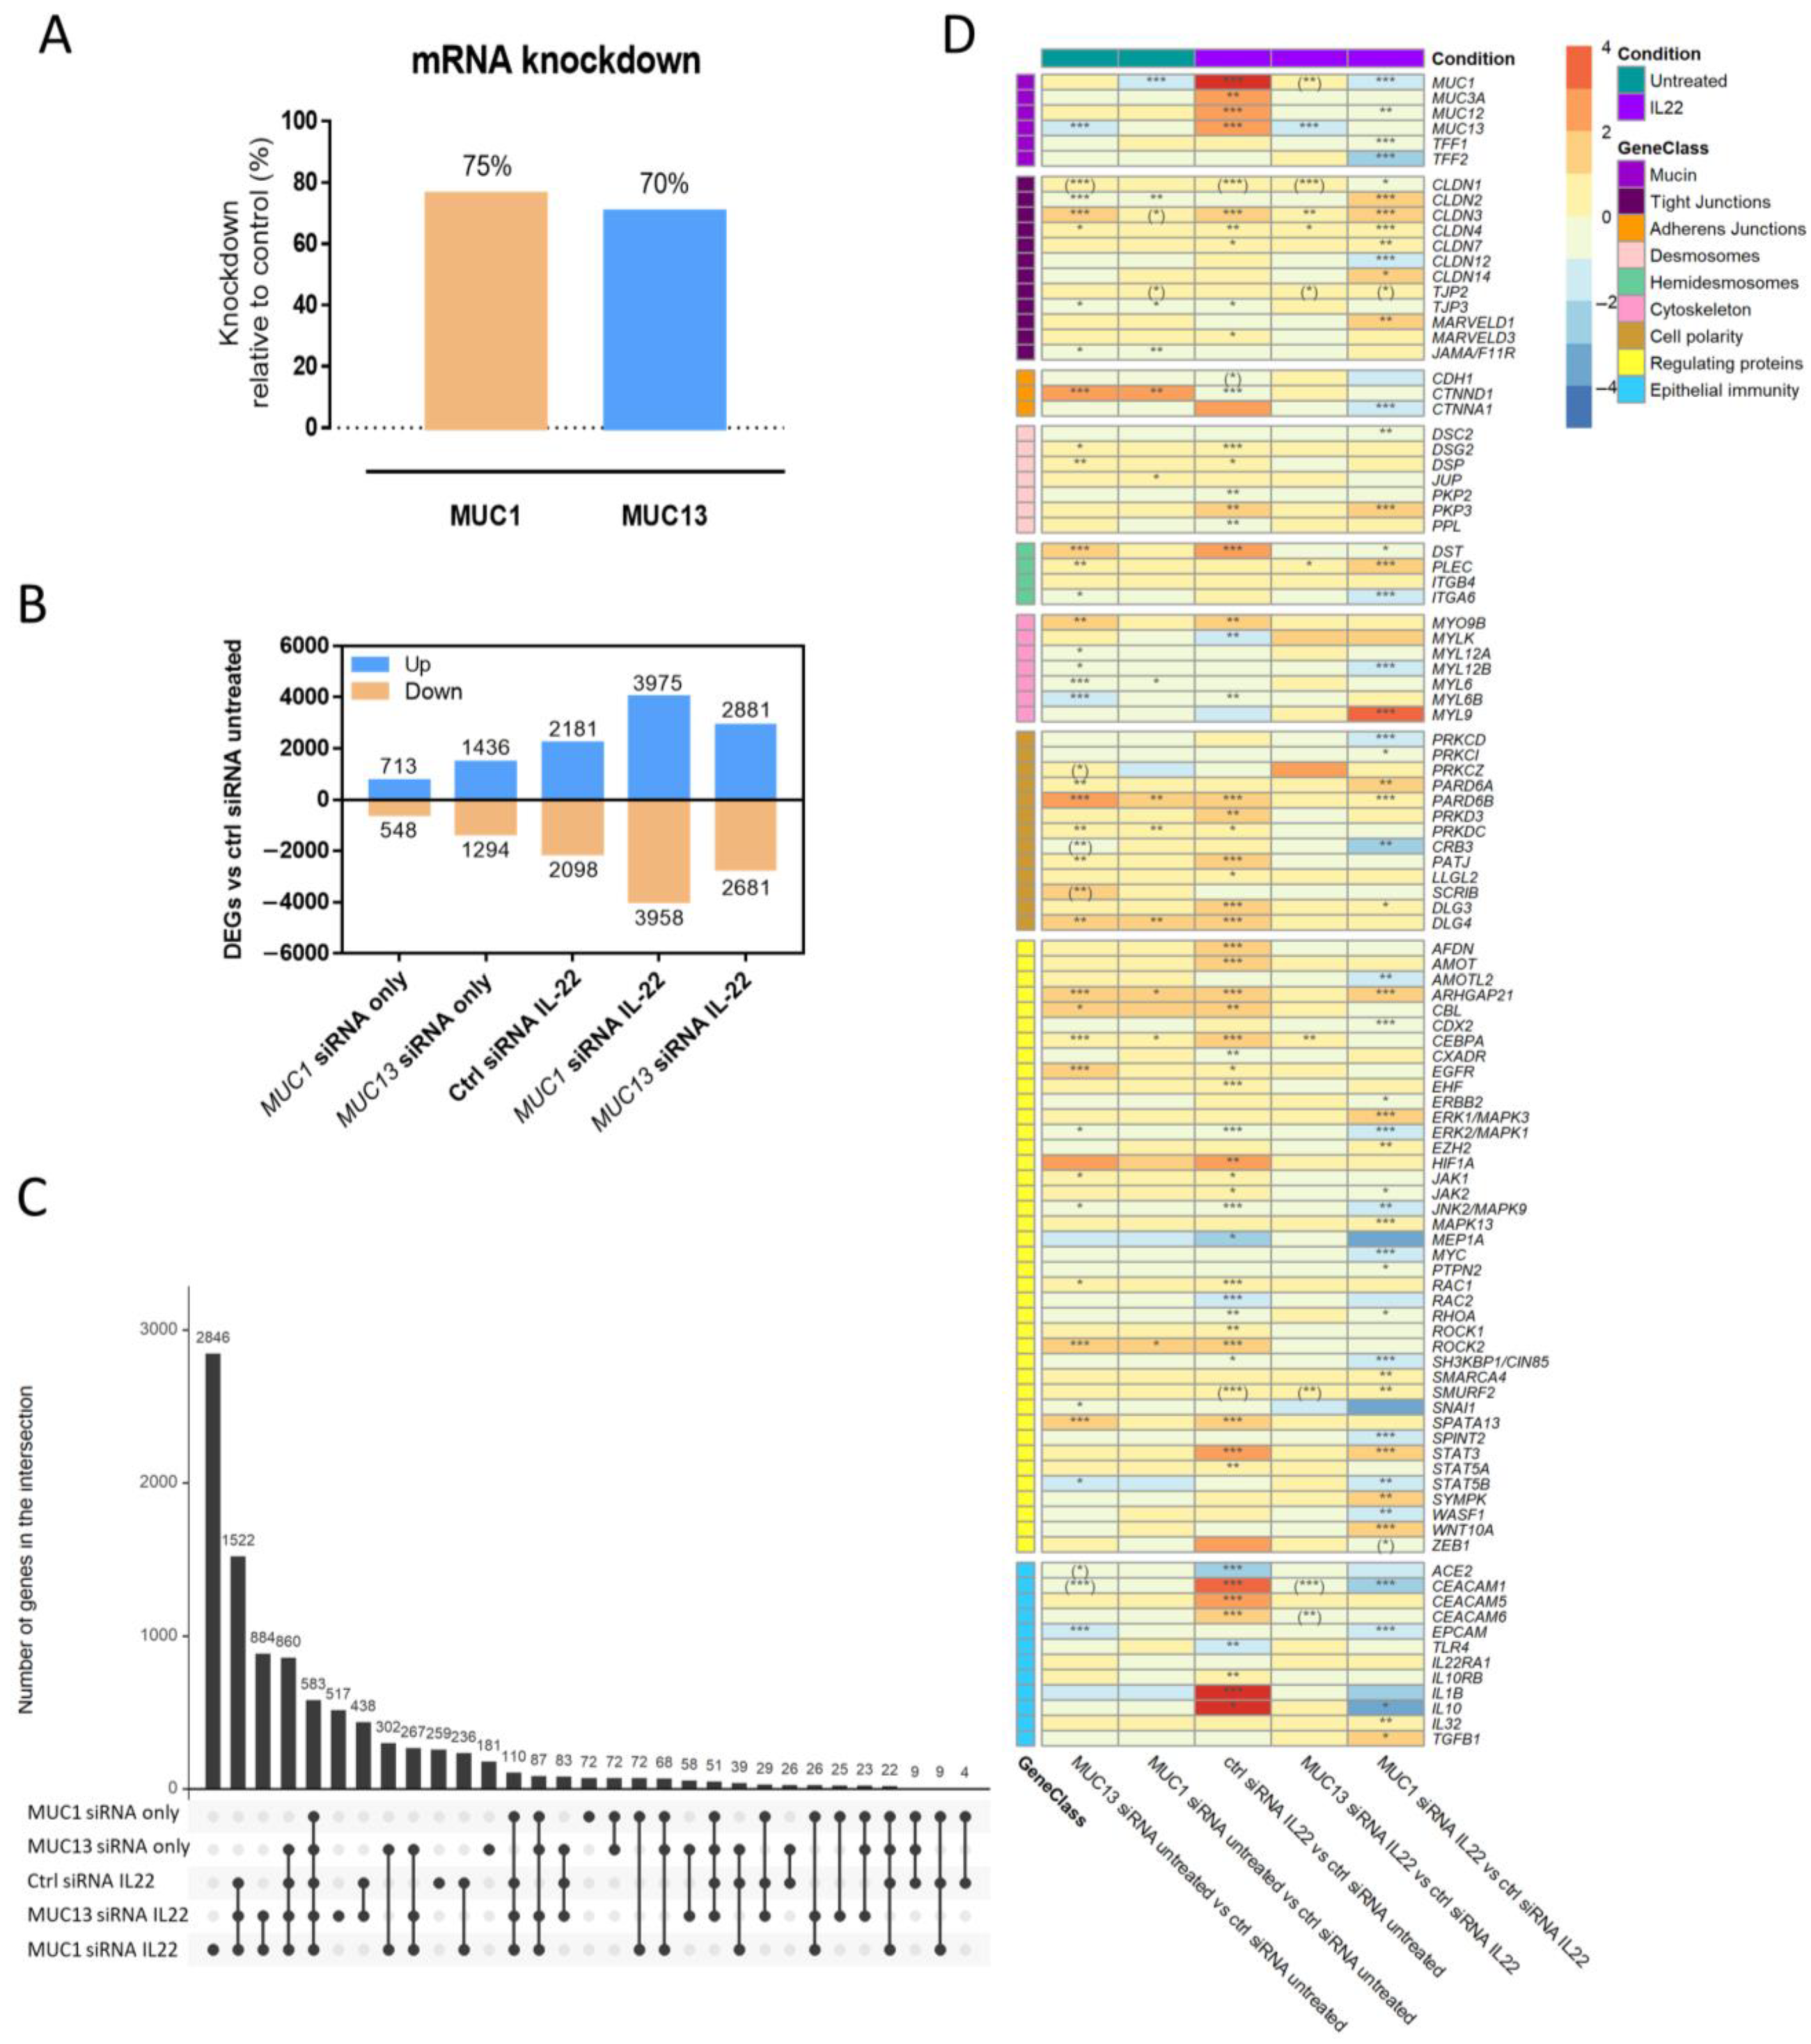
Abstract
1. Introduction
2. Material and Methods
2.1. Cell Lines
2.2. siRNA Transfection Experiments
2.3. Transwell Intestinal Permeability Assays
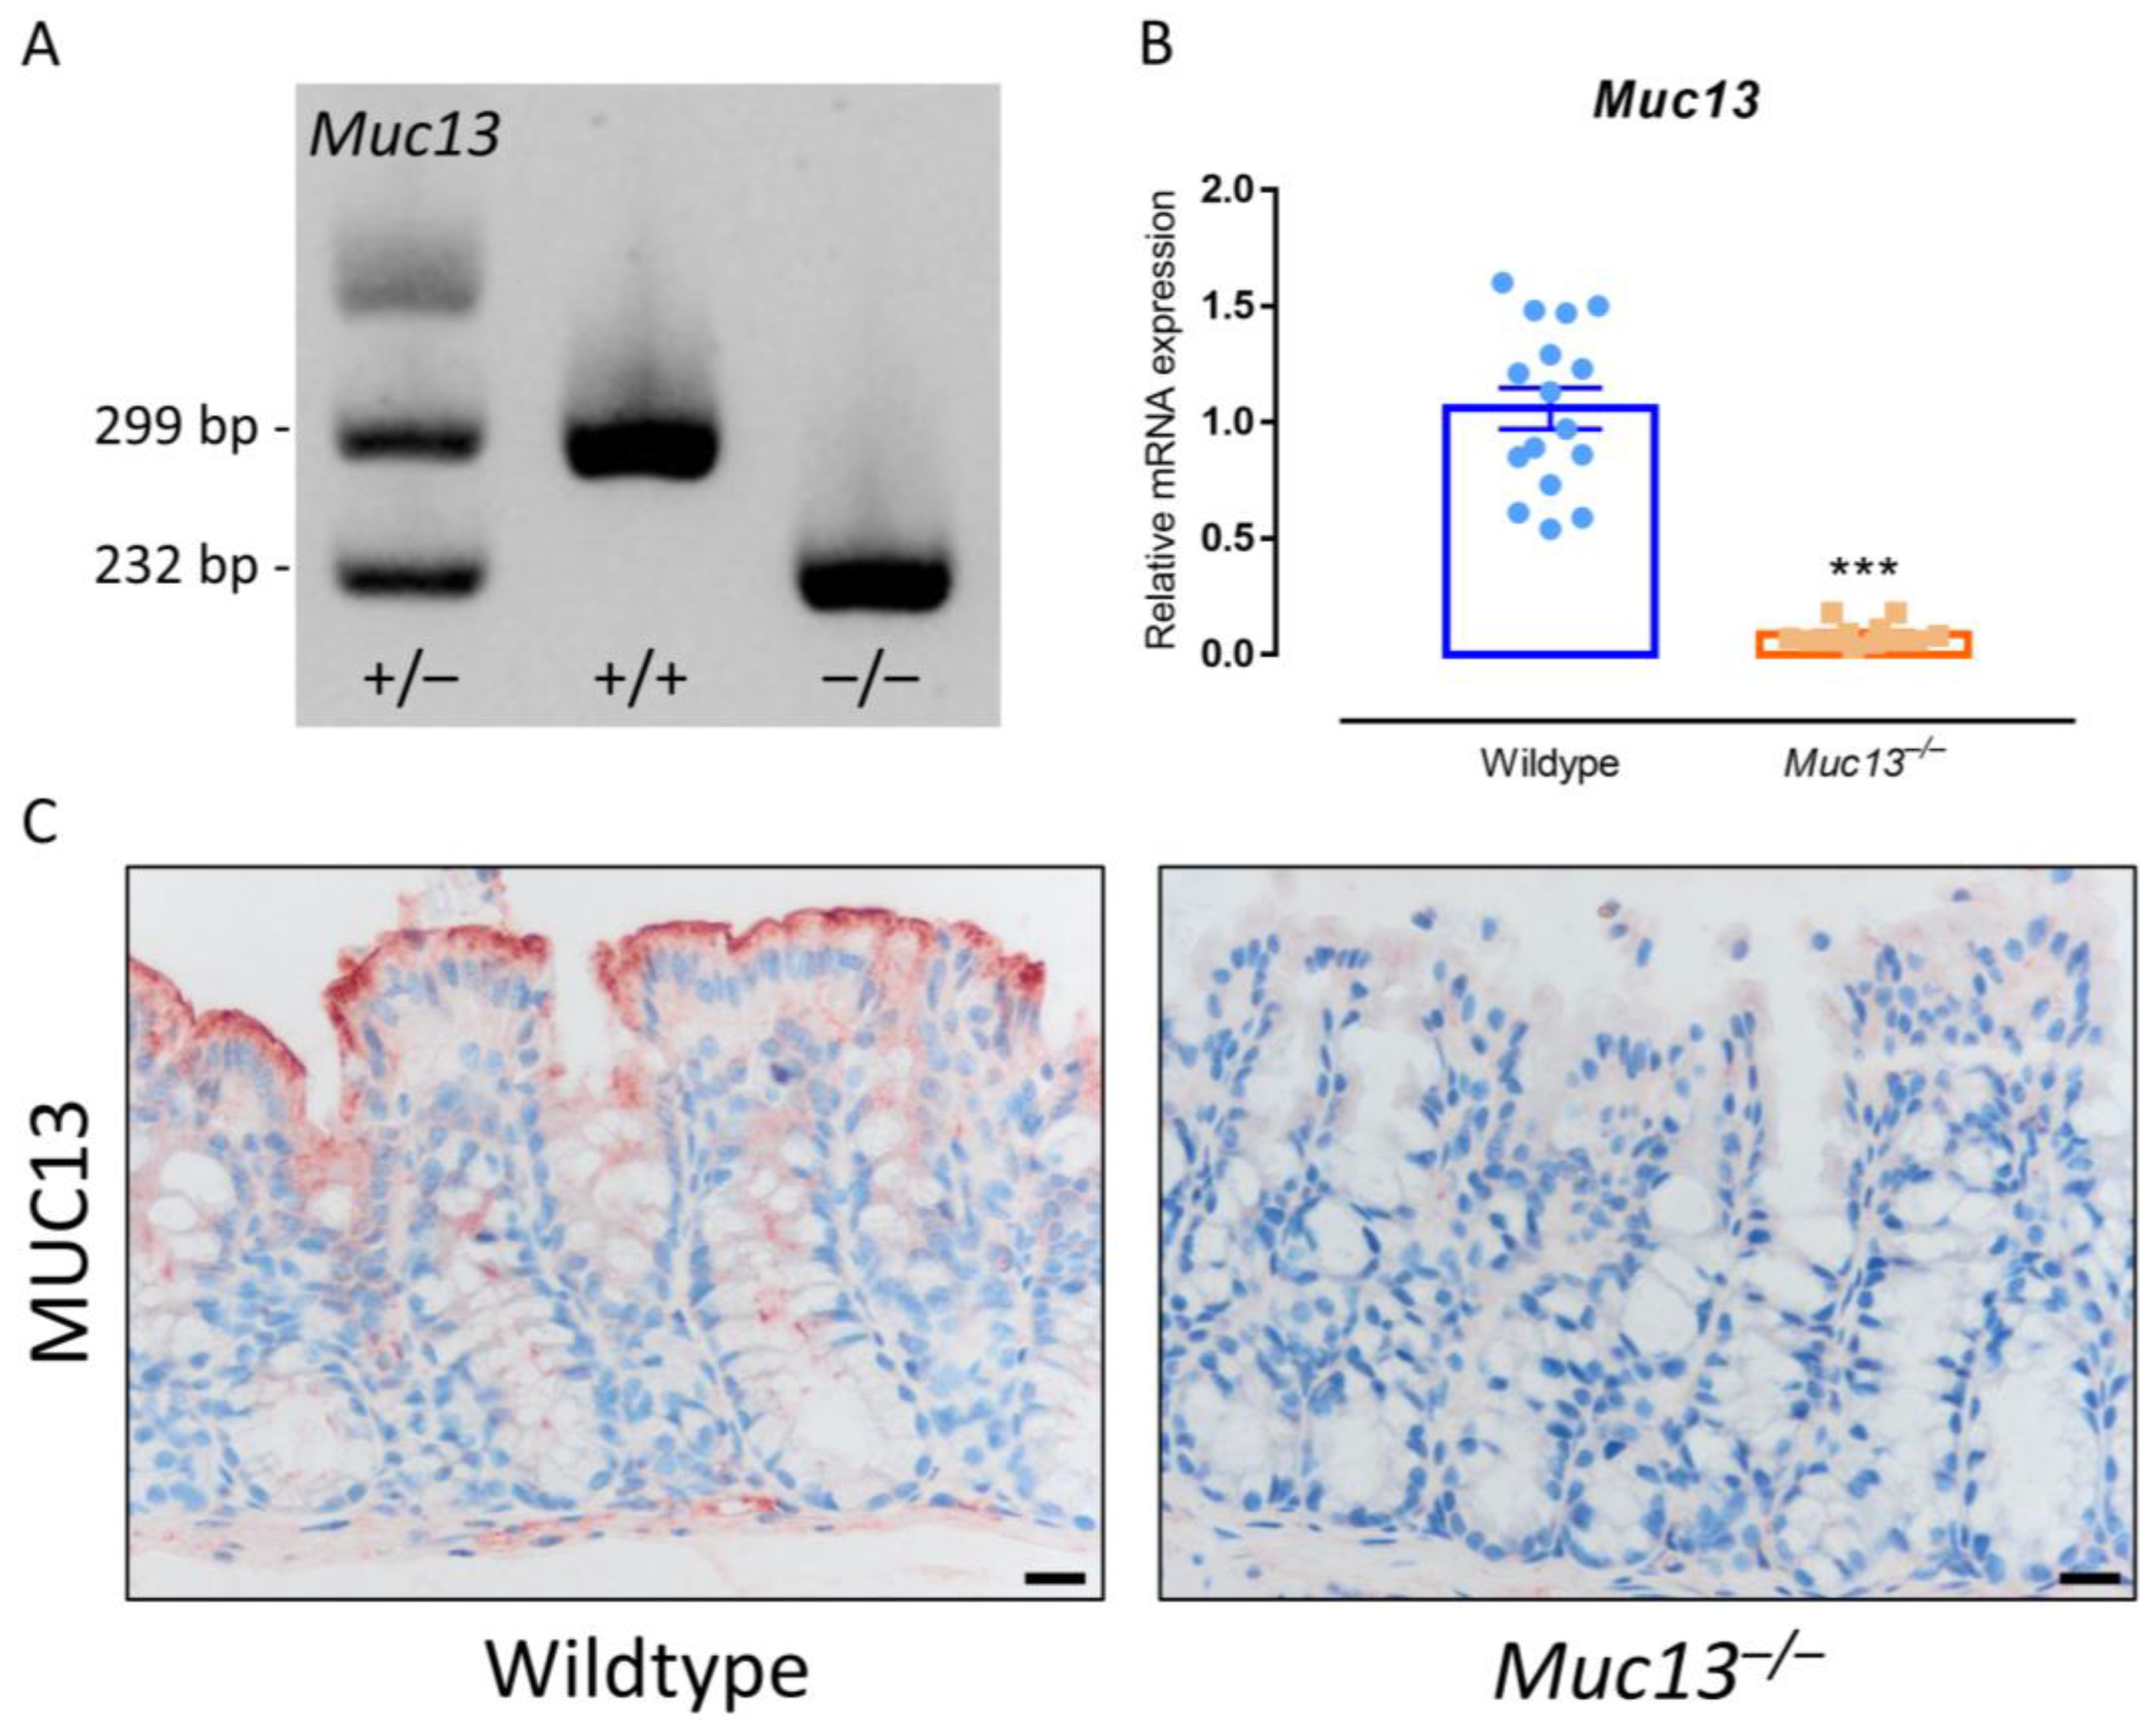
2.4. Generation of Muc13-Deficient Mice
2.5. Induction of Murine DSS-Induced Colitis and Assessment of Clinical Disease Activity
2.6. Quantification of In Vivo Intestinal Permeability in Mice
2.7. Assessment of Intestinal MPO Activity and Cytokine Levels in Mice
2.8. Patients and Clinical Specimens
2.9. RNA Extraction and RT-qPCR for Gene Expression
2.10. Illumina Short-Read Transcriptome Sequencing and Data Analysis
2.11. Western Blotting and ELISA for the Quantification of Human Intestinal Barrier Mediators
2.12. Immunohistochemistry of Human and Murine Colonic Samples
2.13. Statistics
3. Results
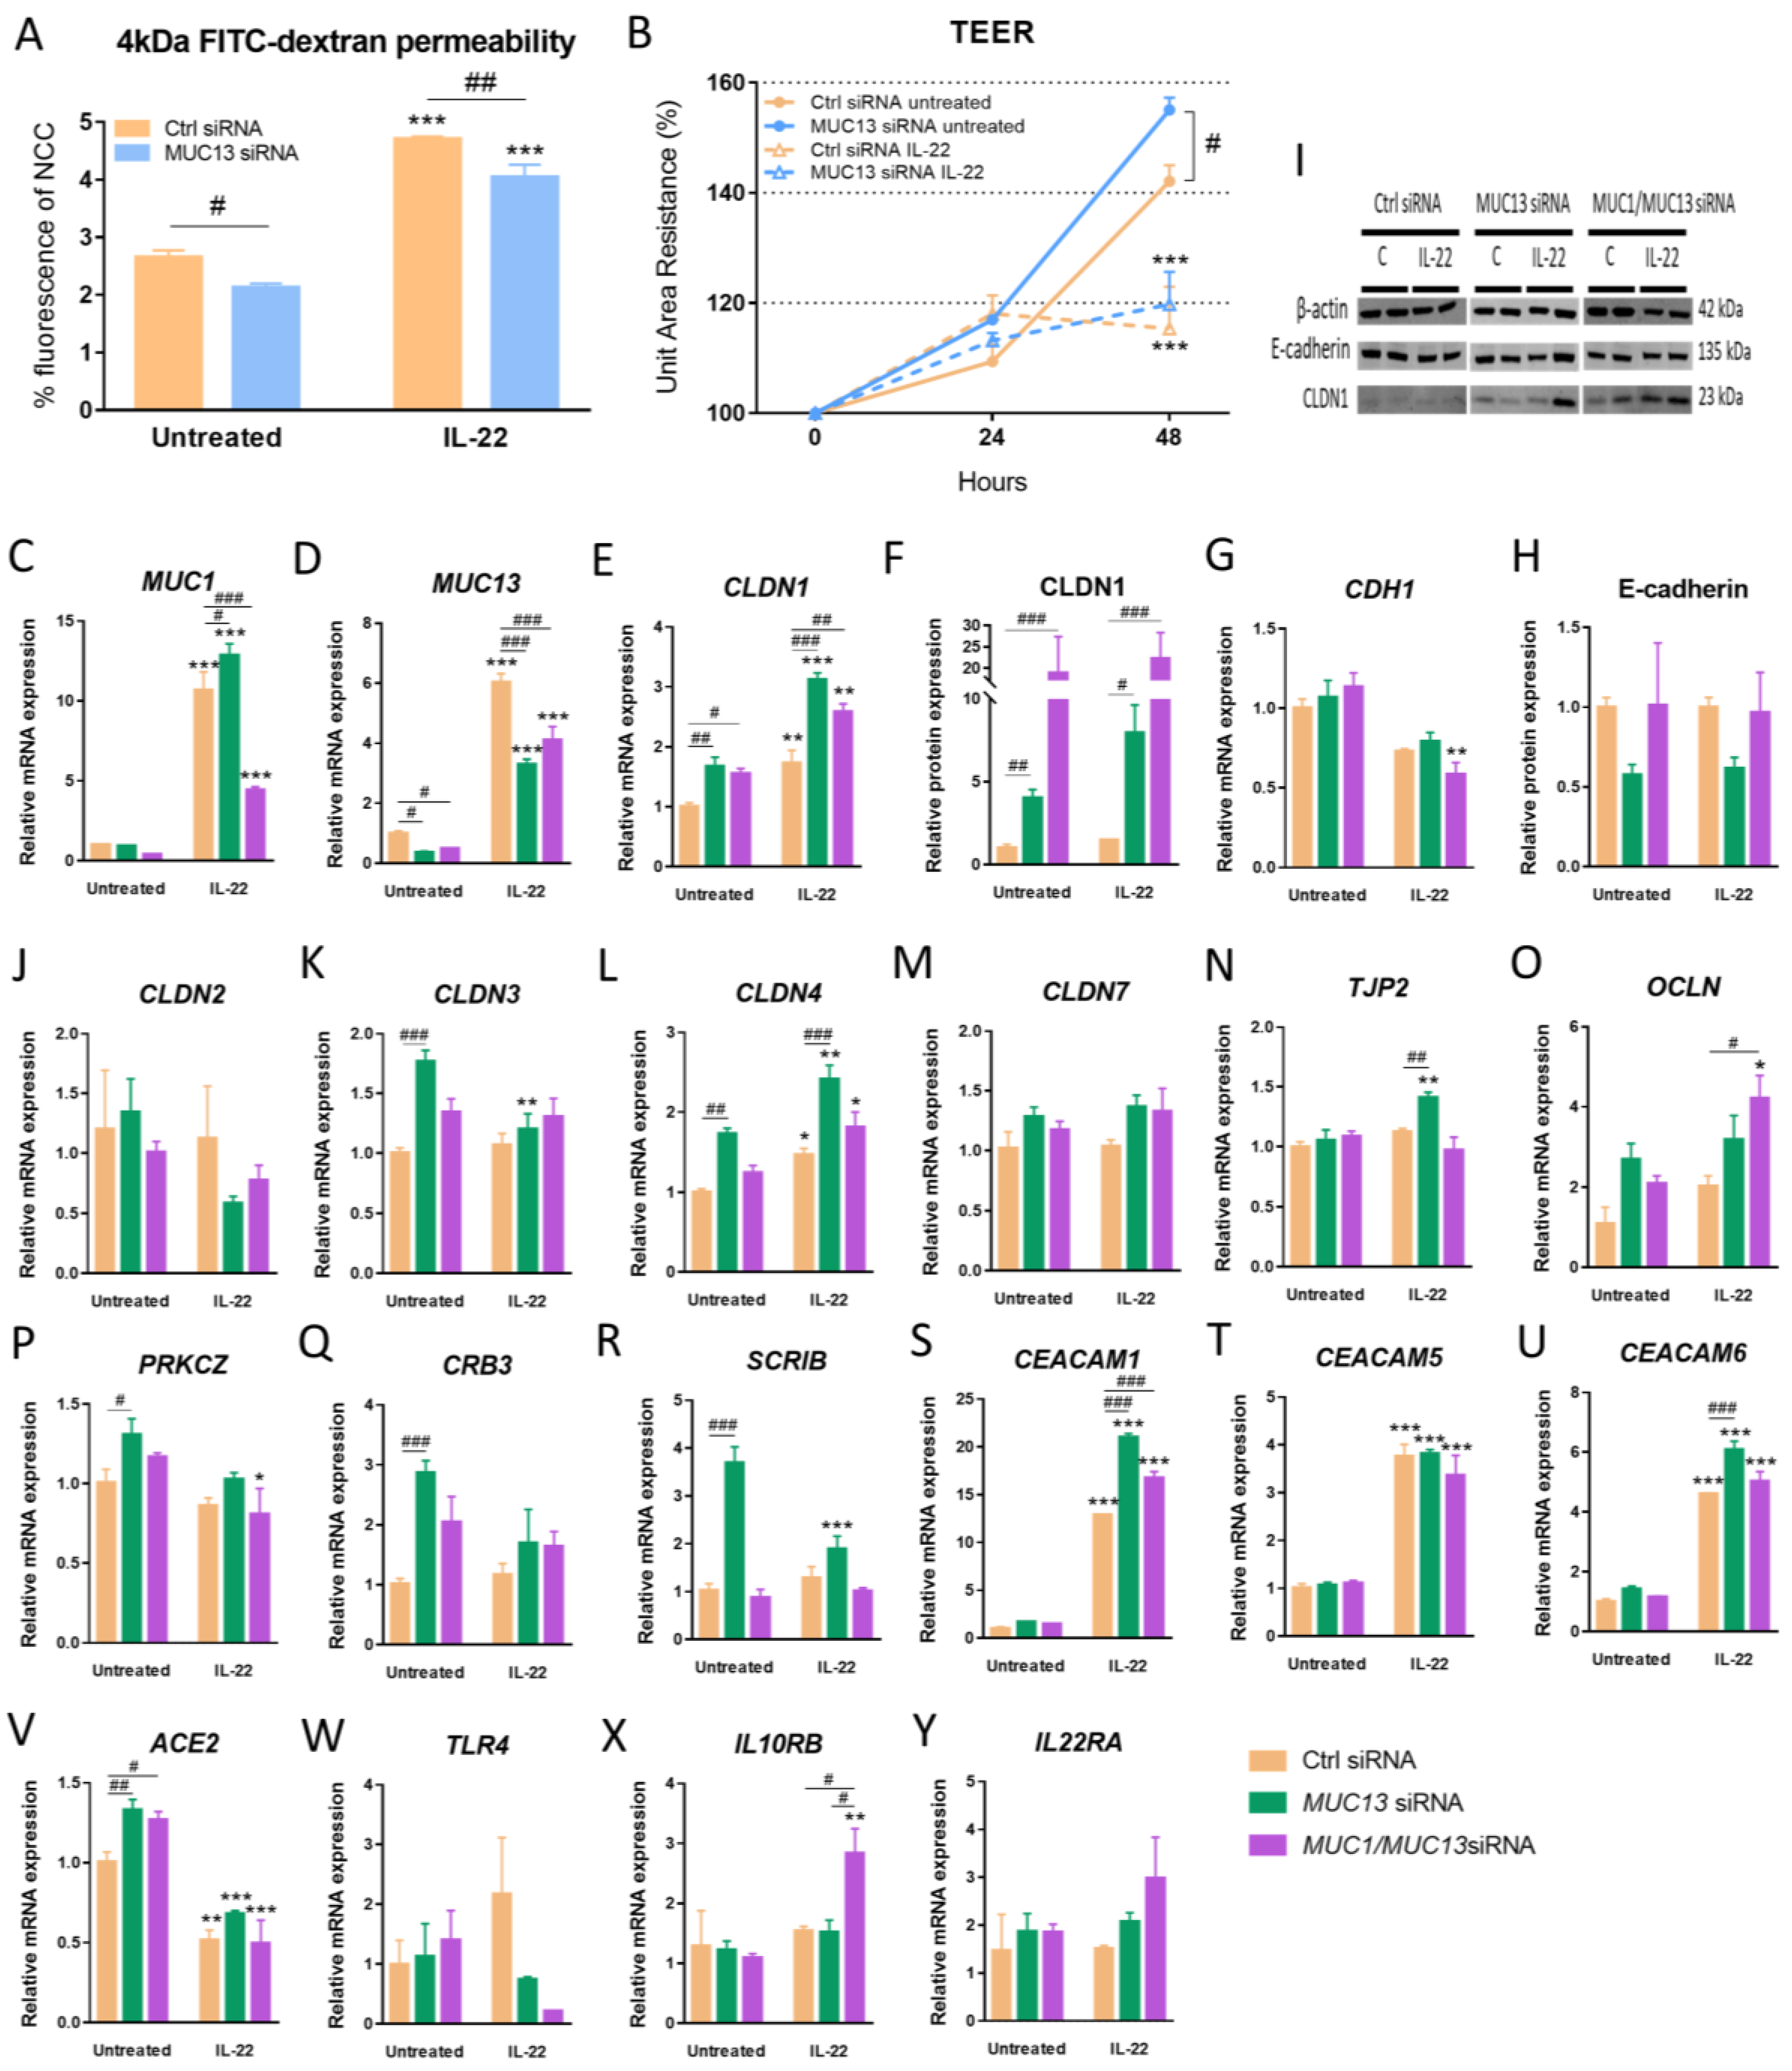
3.1. Silencing of MUC1 and MUC13 mRNA Expression Alters the Gene Expression of Several Intestinal Epithelial Barrier Mediators in the Presence/Absence of Inflammation
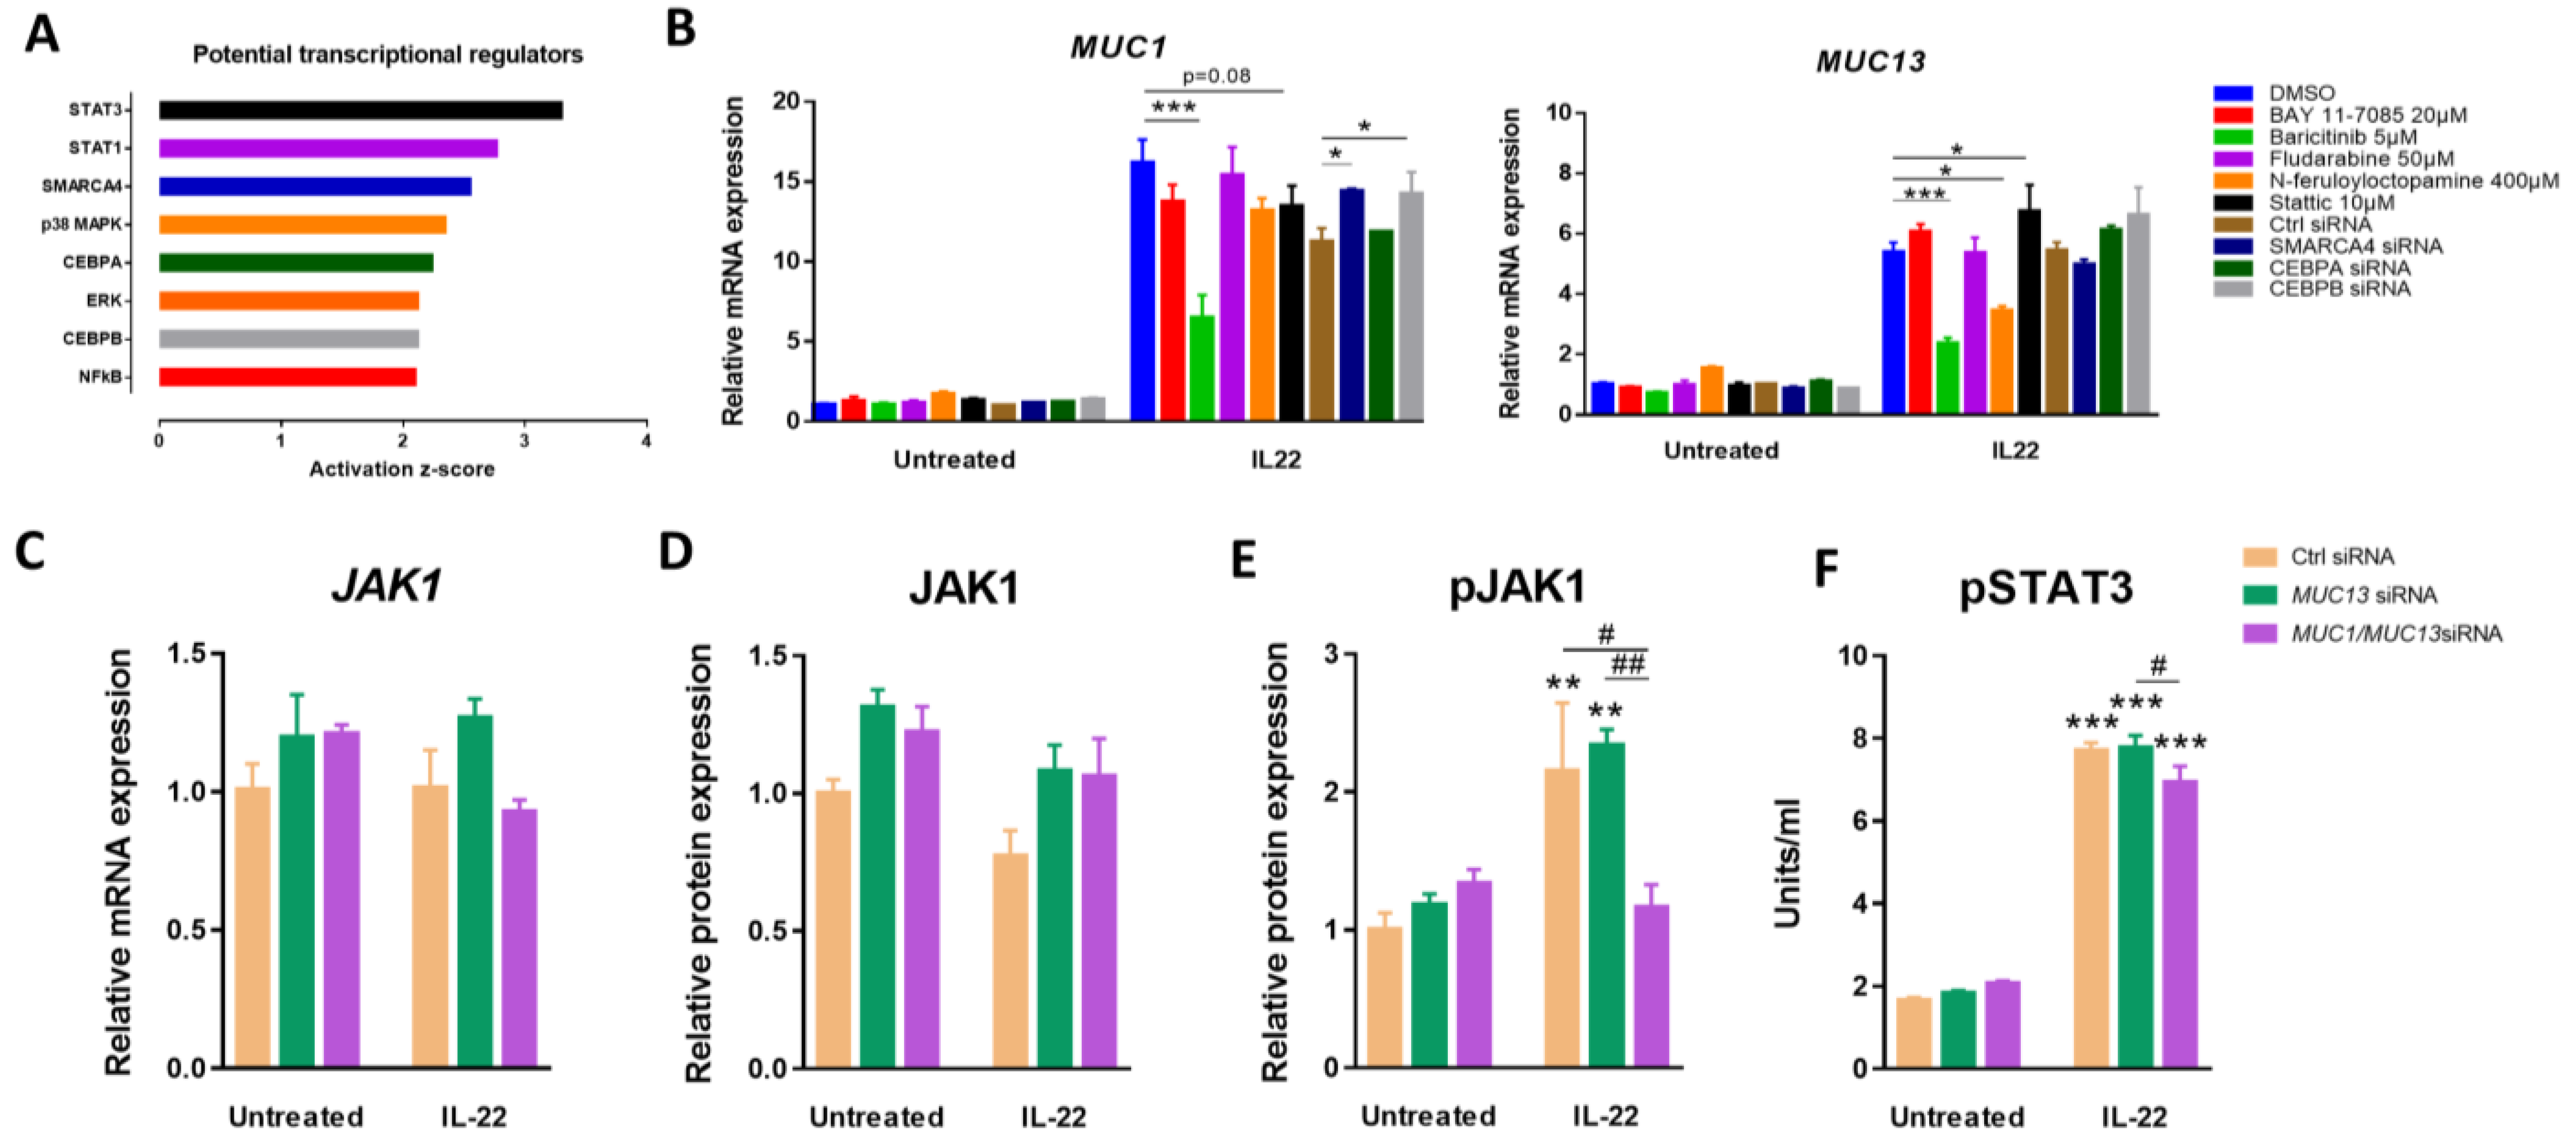
3.2. Aberrant Expression of MUC1 and MUC13 Is Mainly Regulated by the JAK1/STAT3 Pathway upon IL-22 Activation
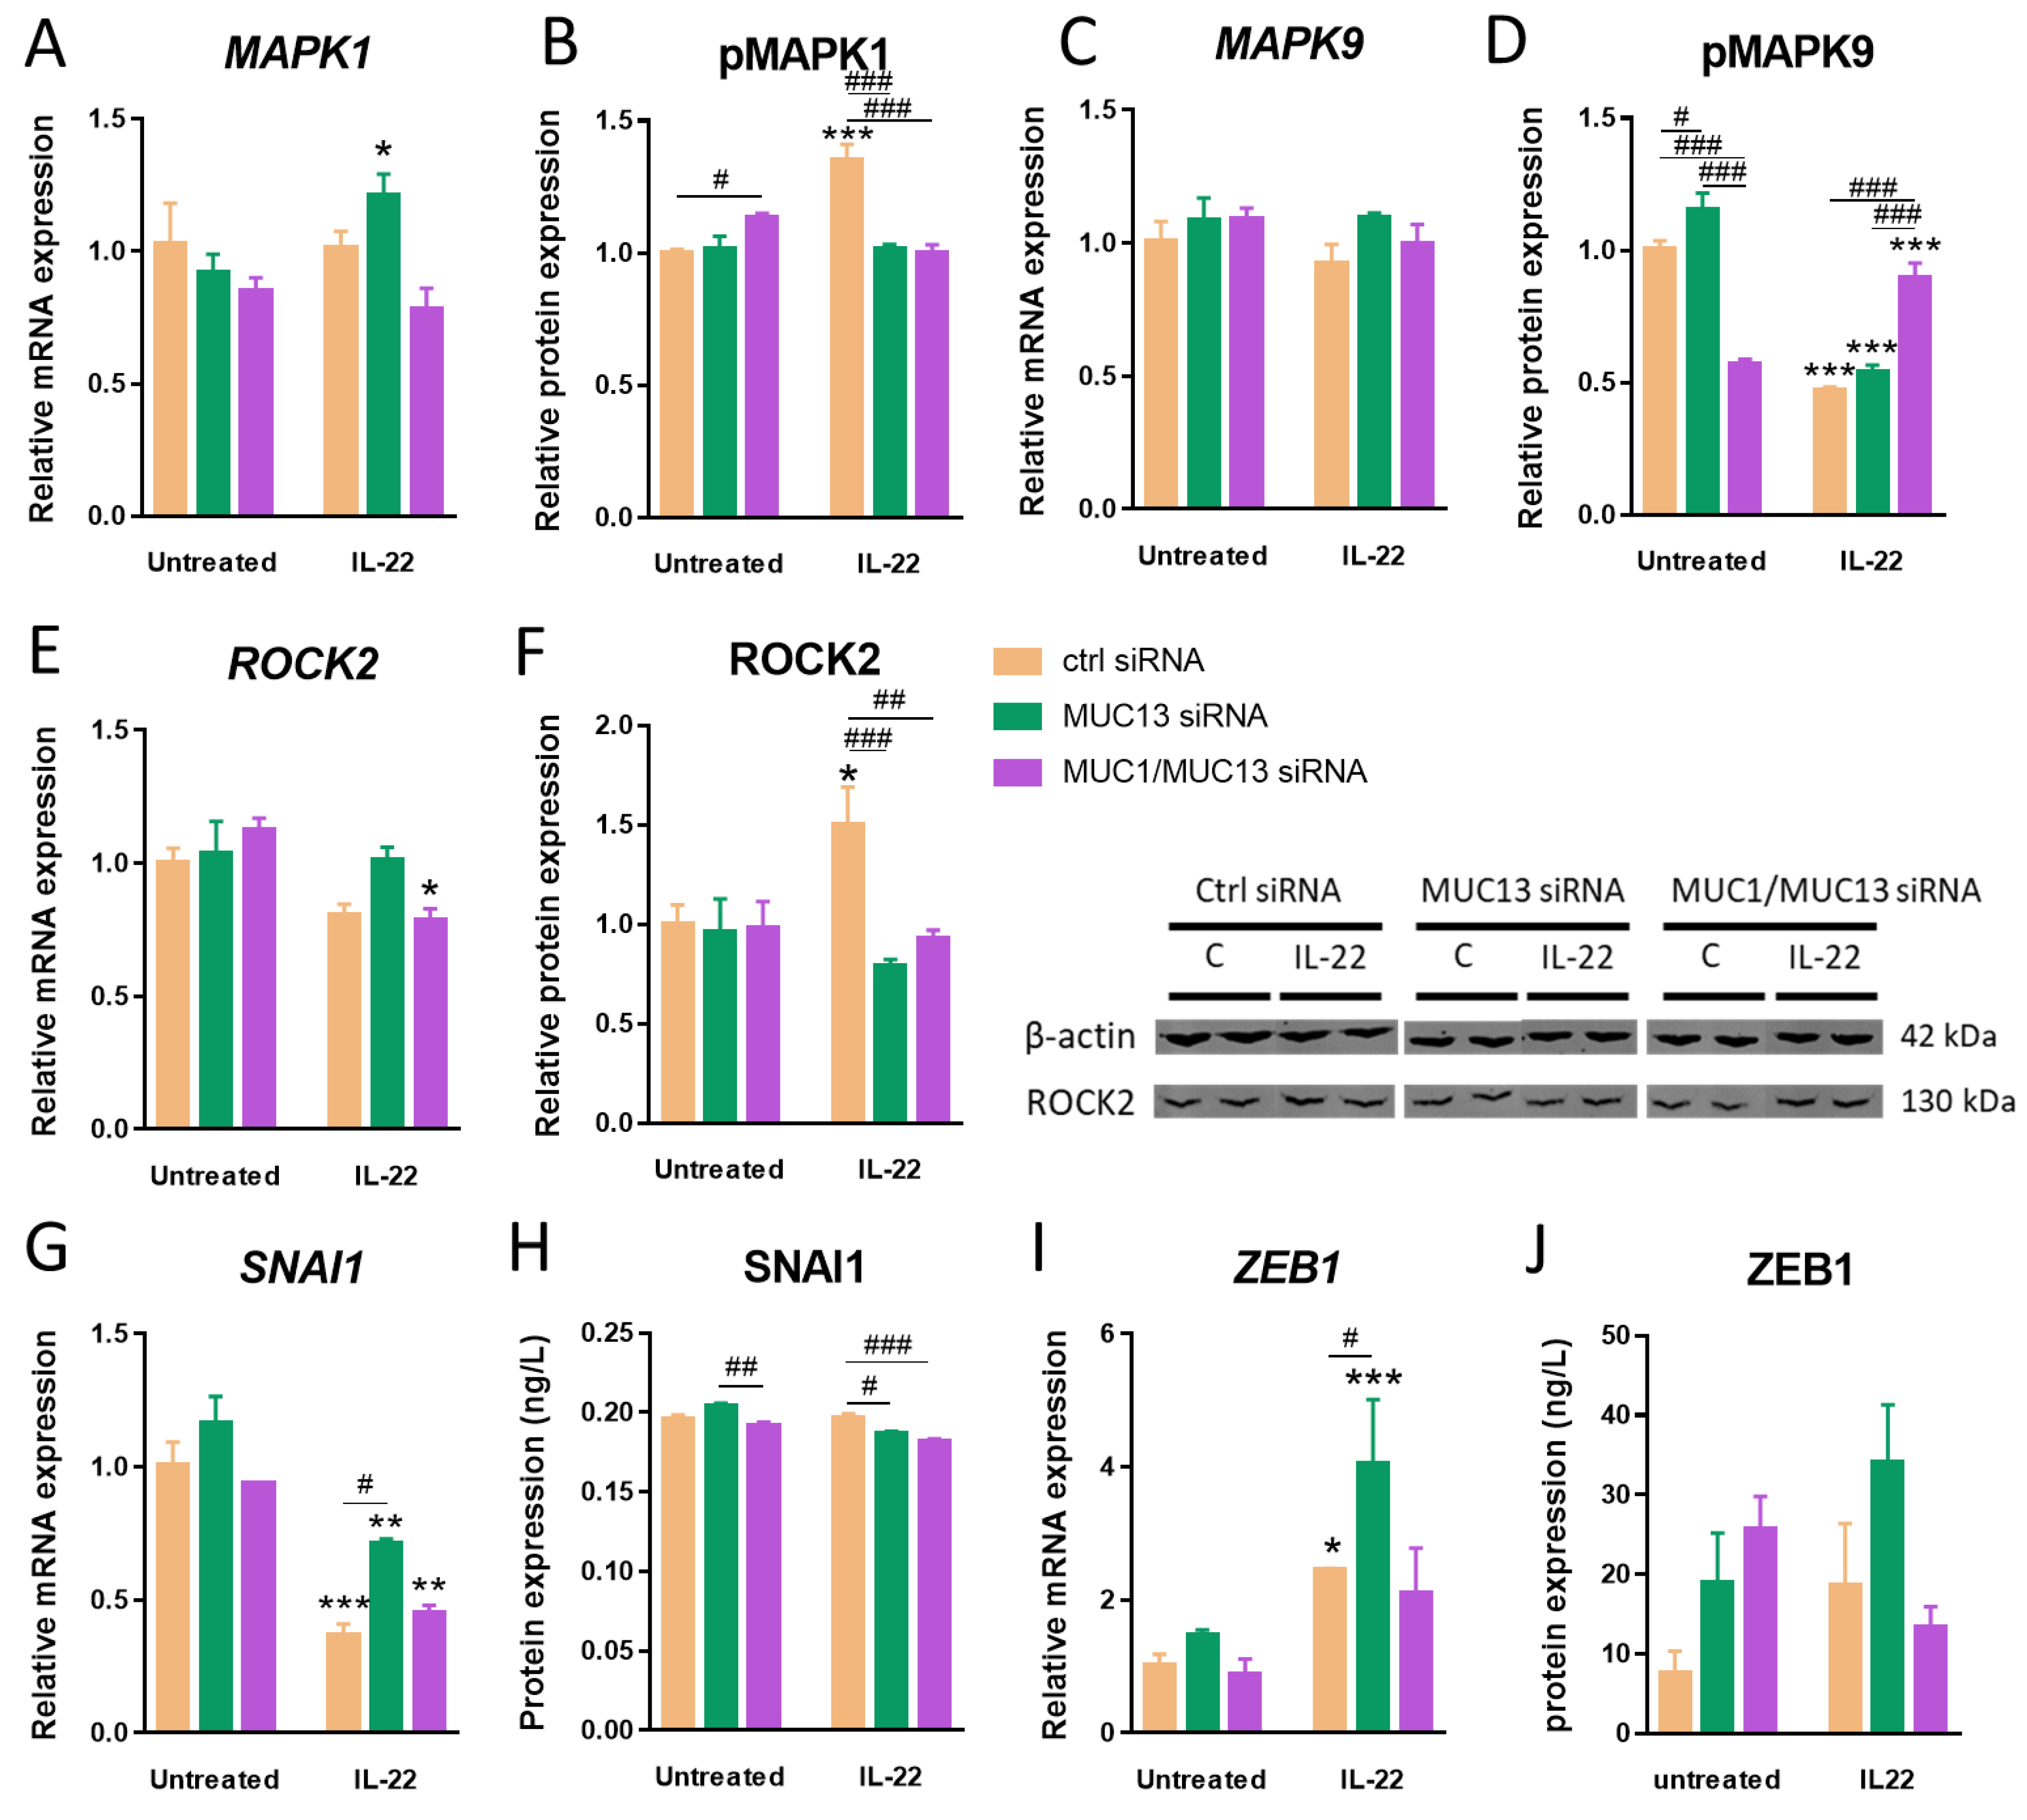
3.3. Aberrant MUC13 Expression Might Affect Intercellular Junctions in IECs via SNAI1/ZEB1 and ROCK2/MAPK Signaling Pathways upon IL-22 Activation
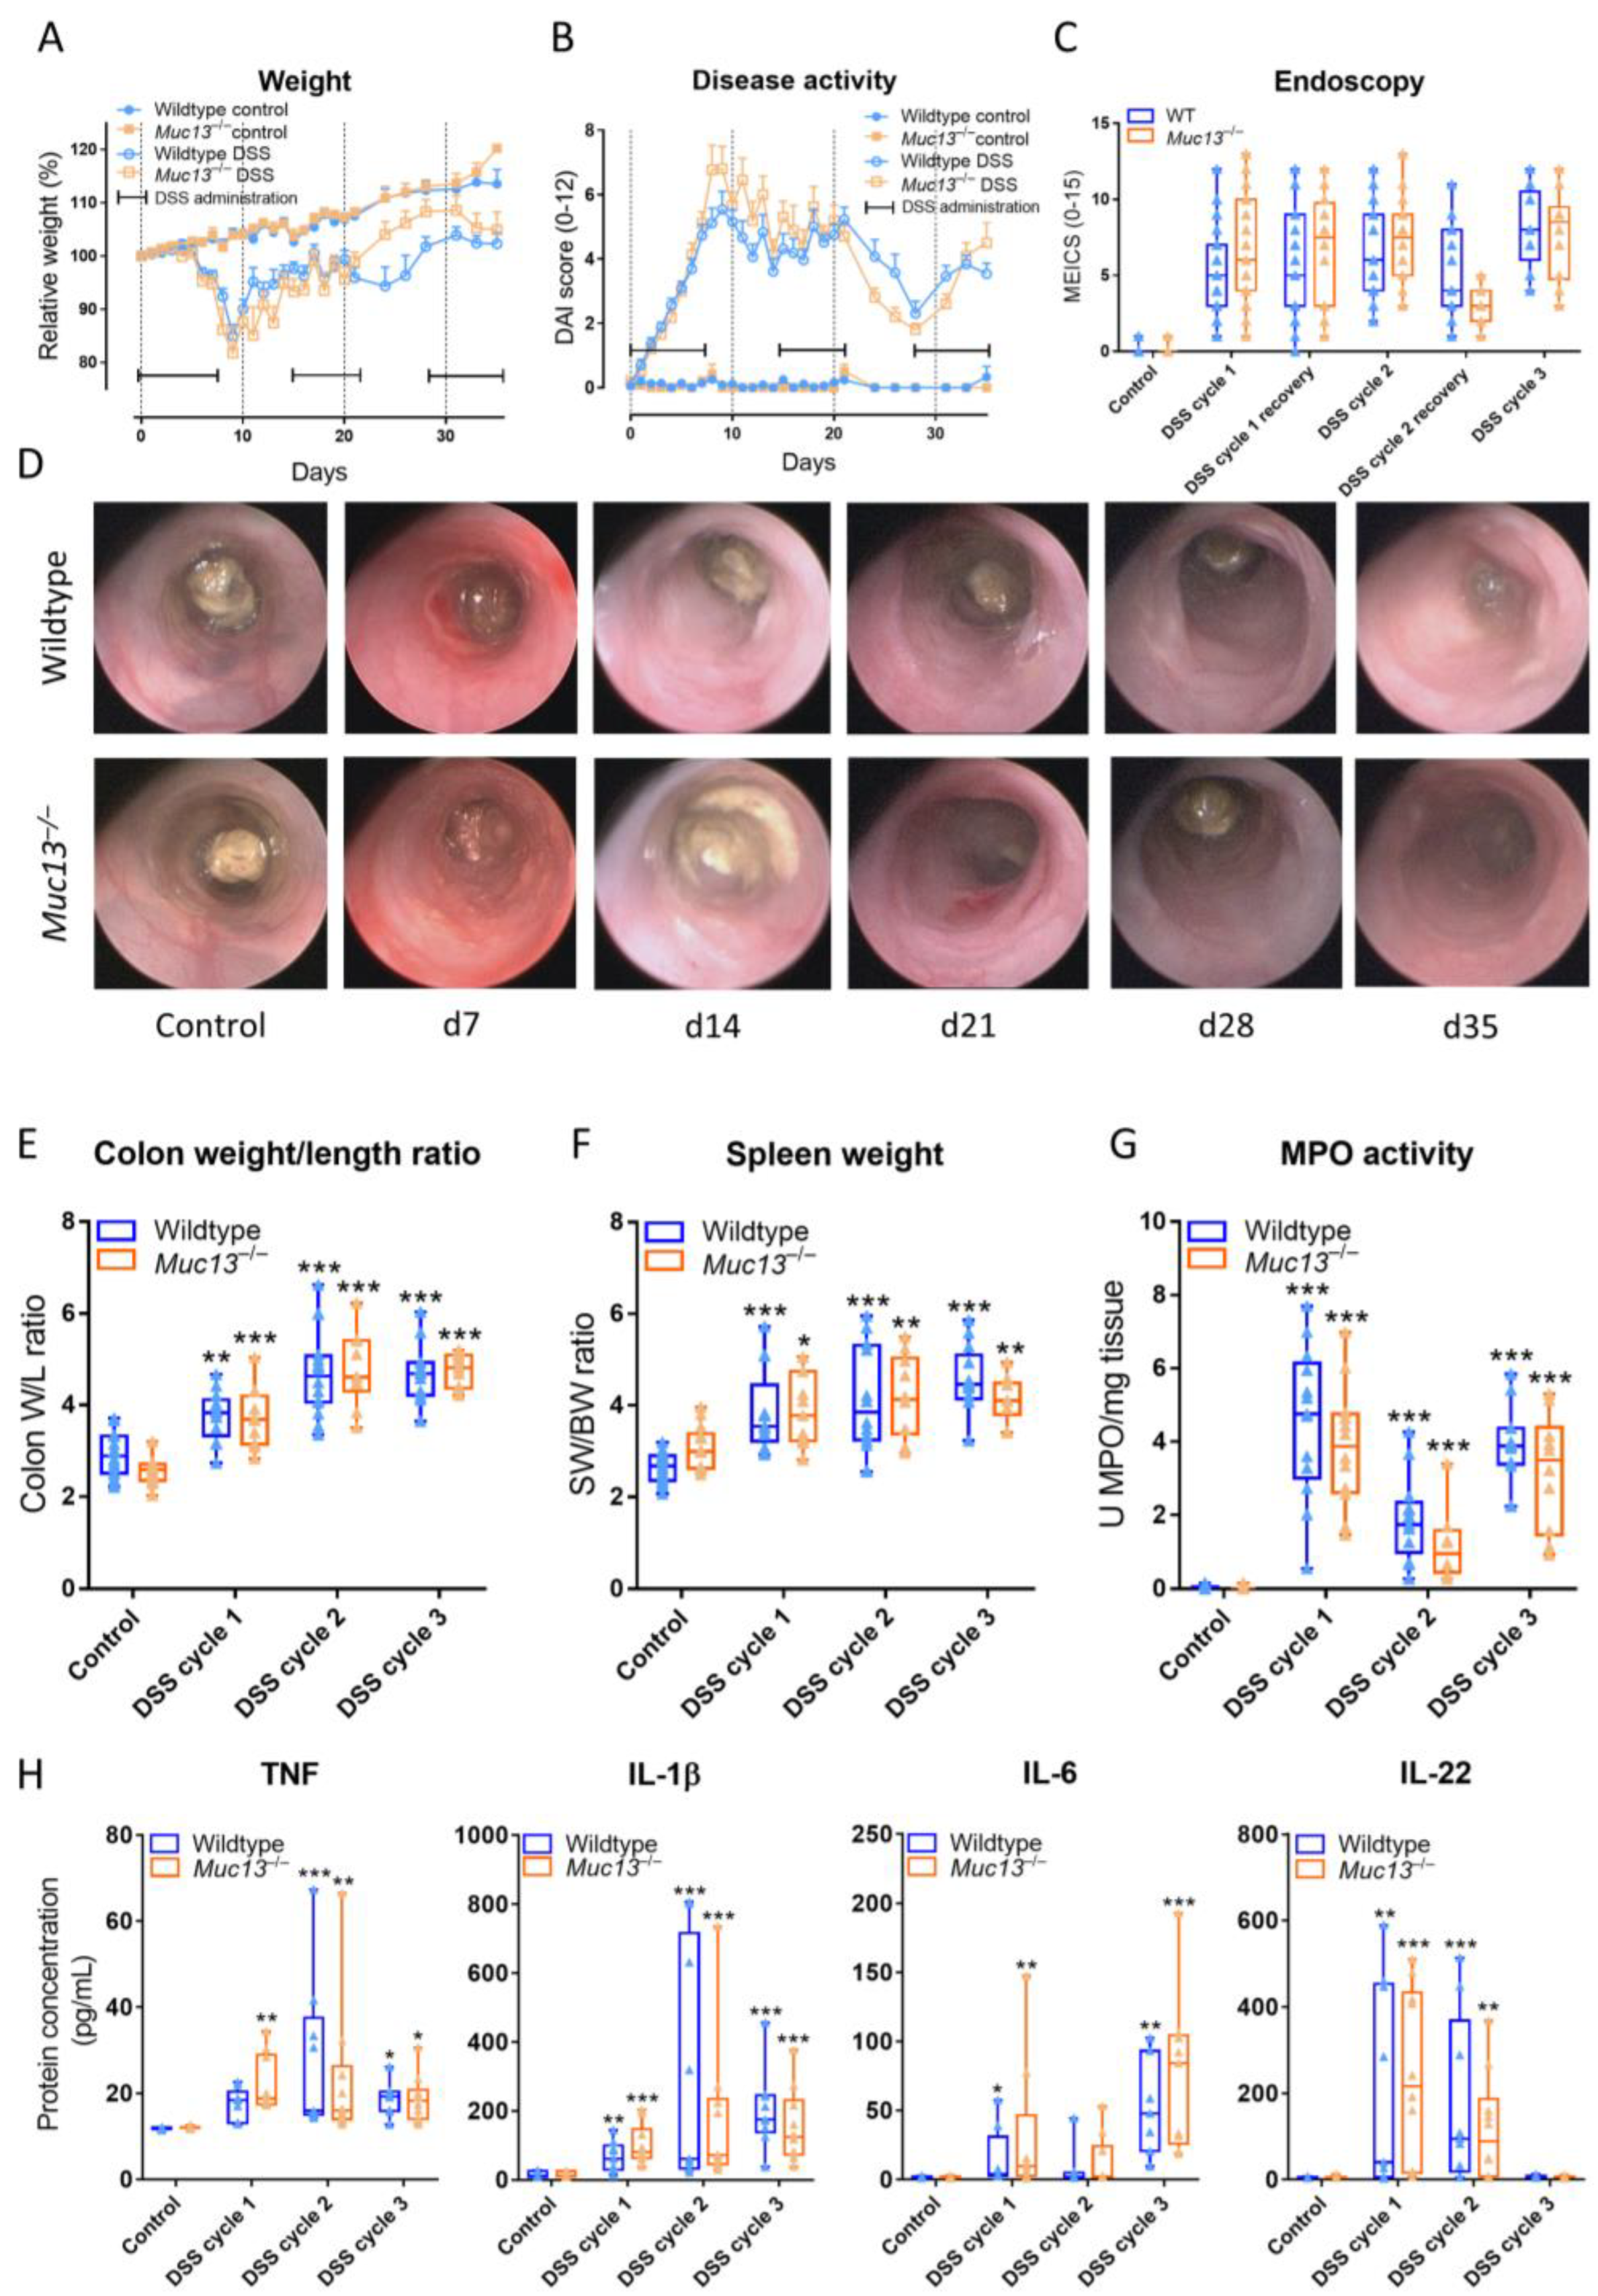
3.4. Muc13−/− Mice Show a Differential Response to DSS-Incuded Colitis
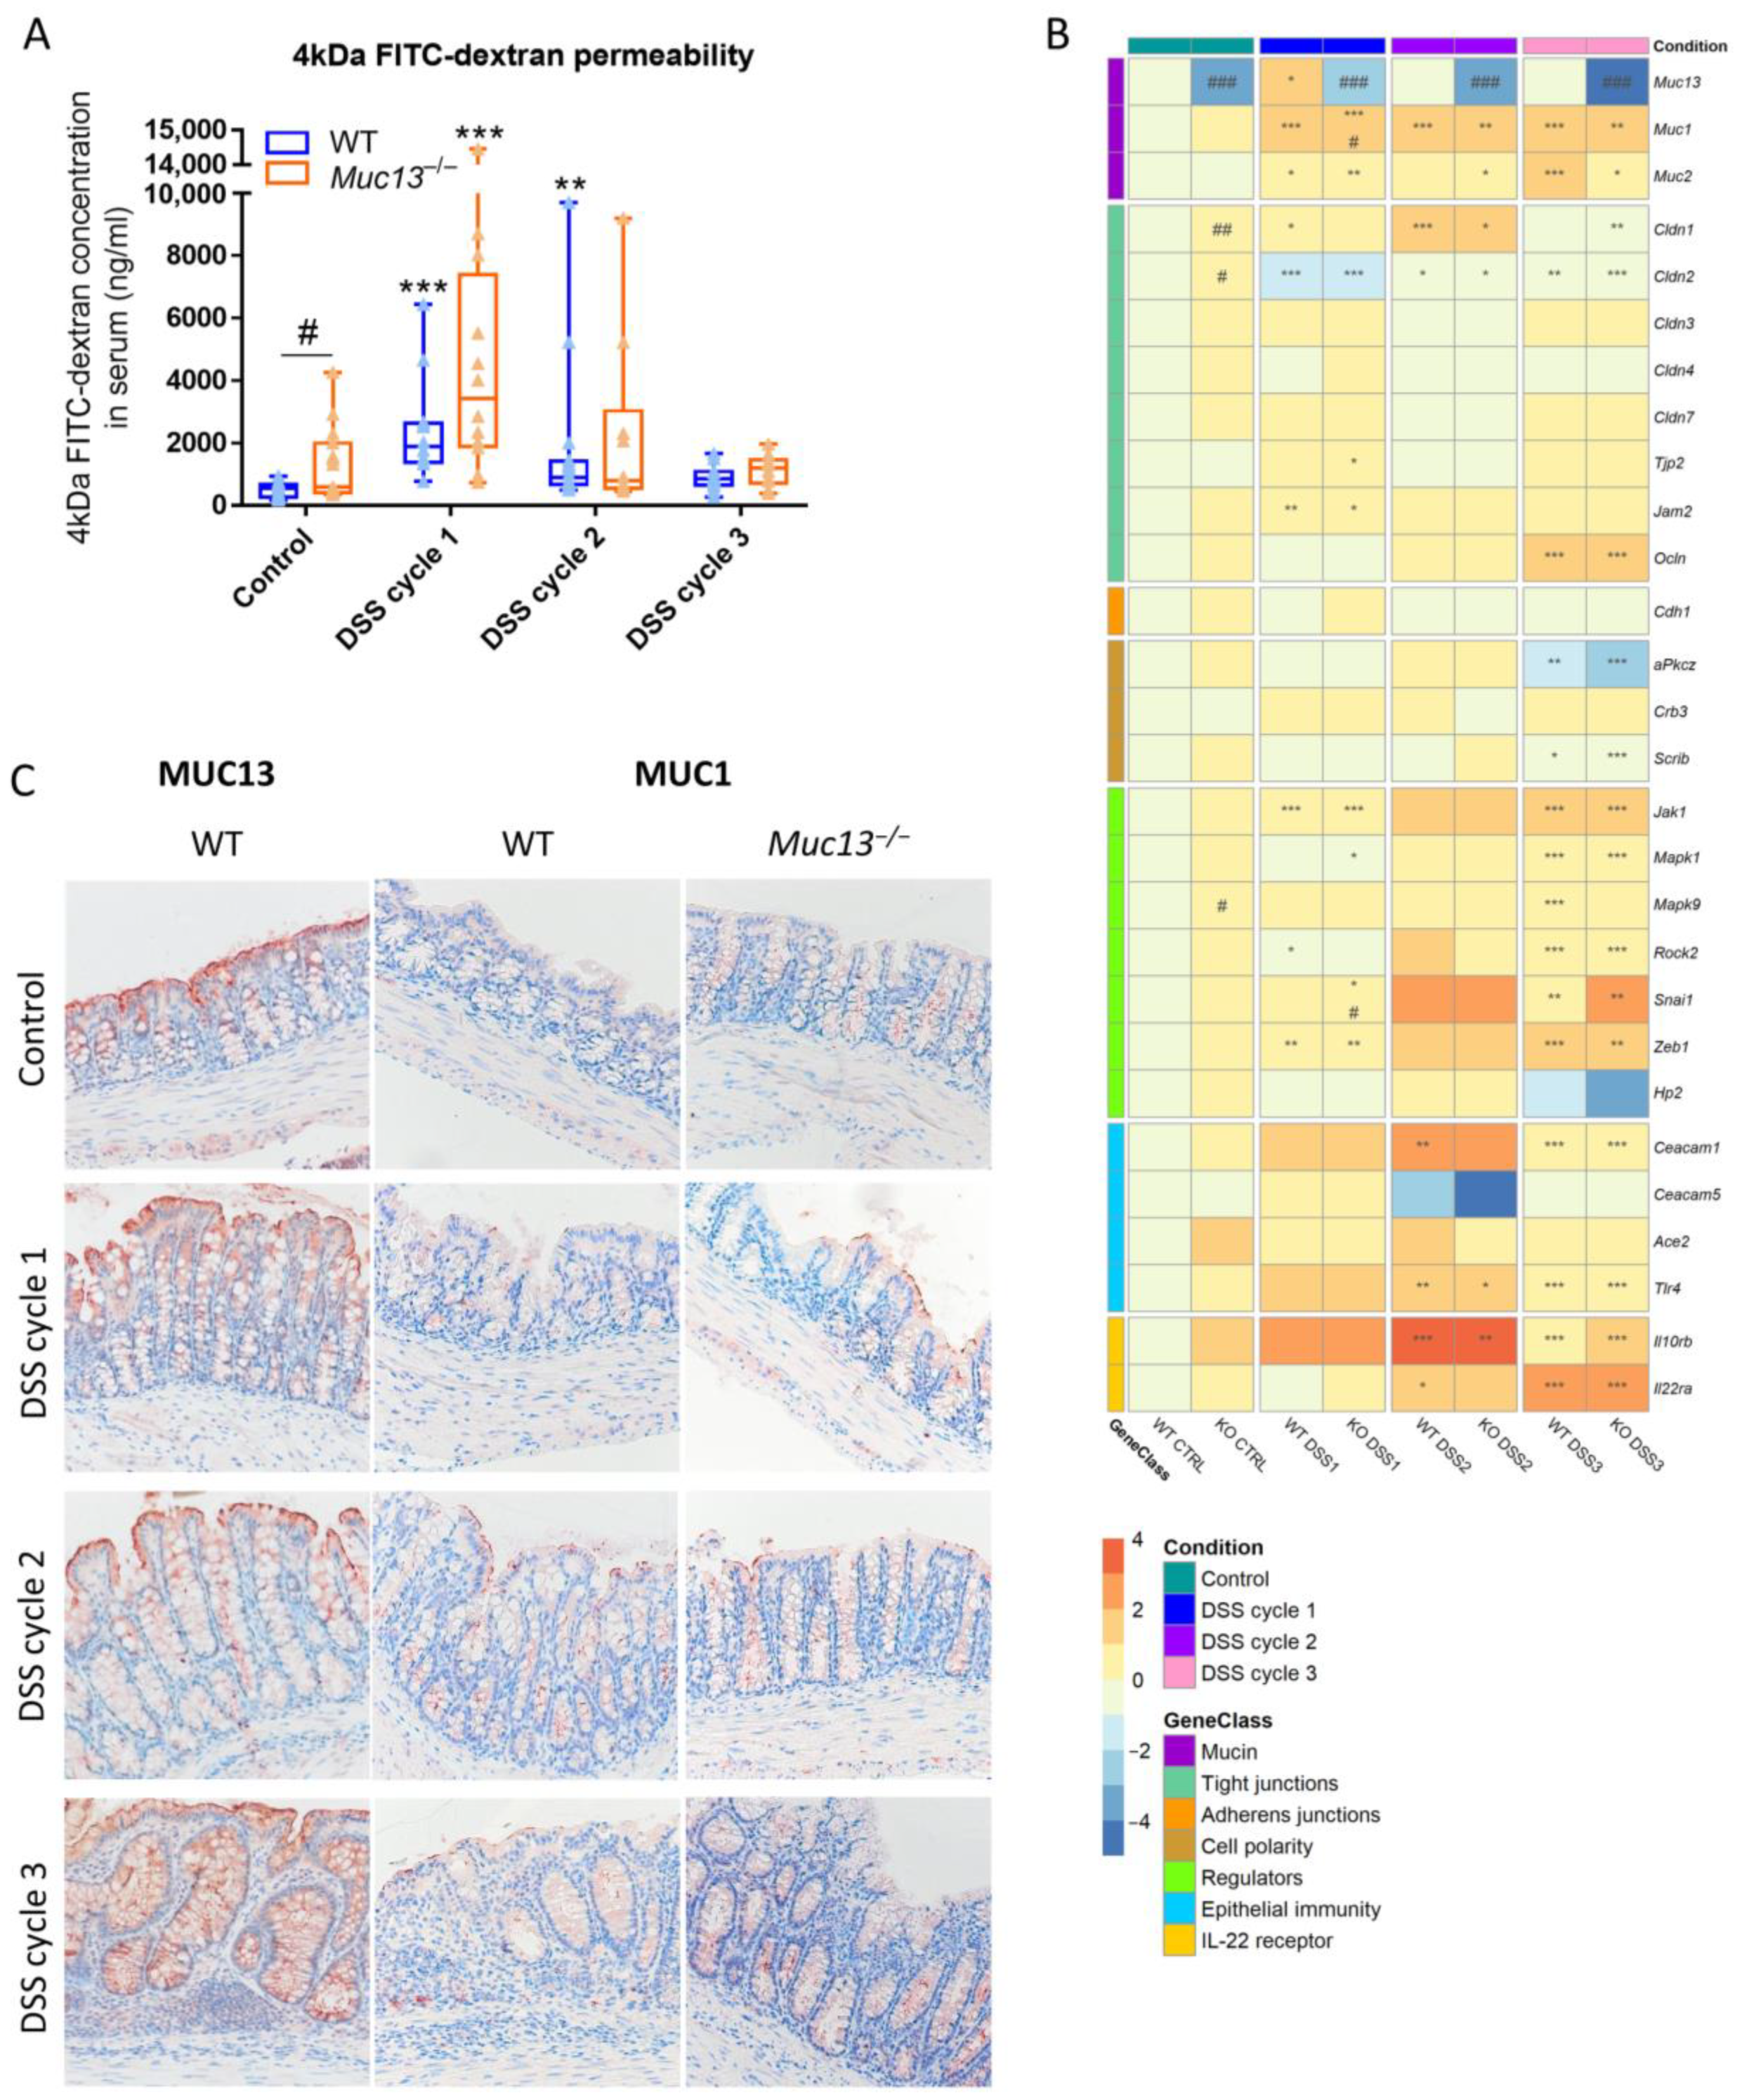
3.5. Aberrant Muc13 Expression Affects Intestinal Barrier Function in DSS-Treated Mice
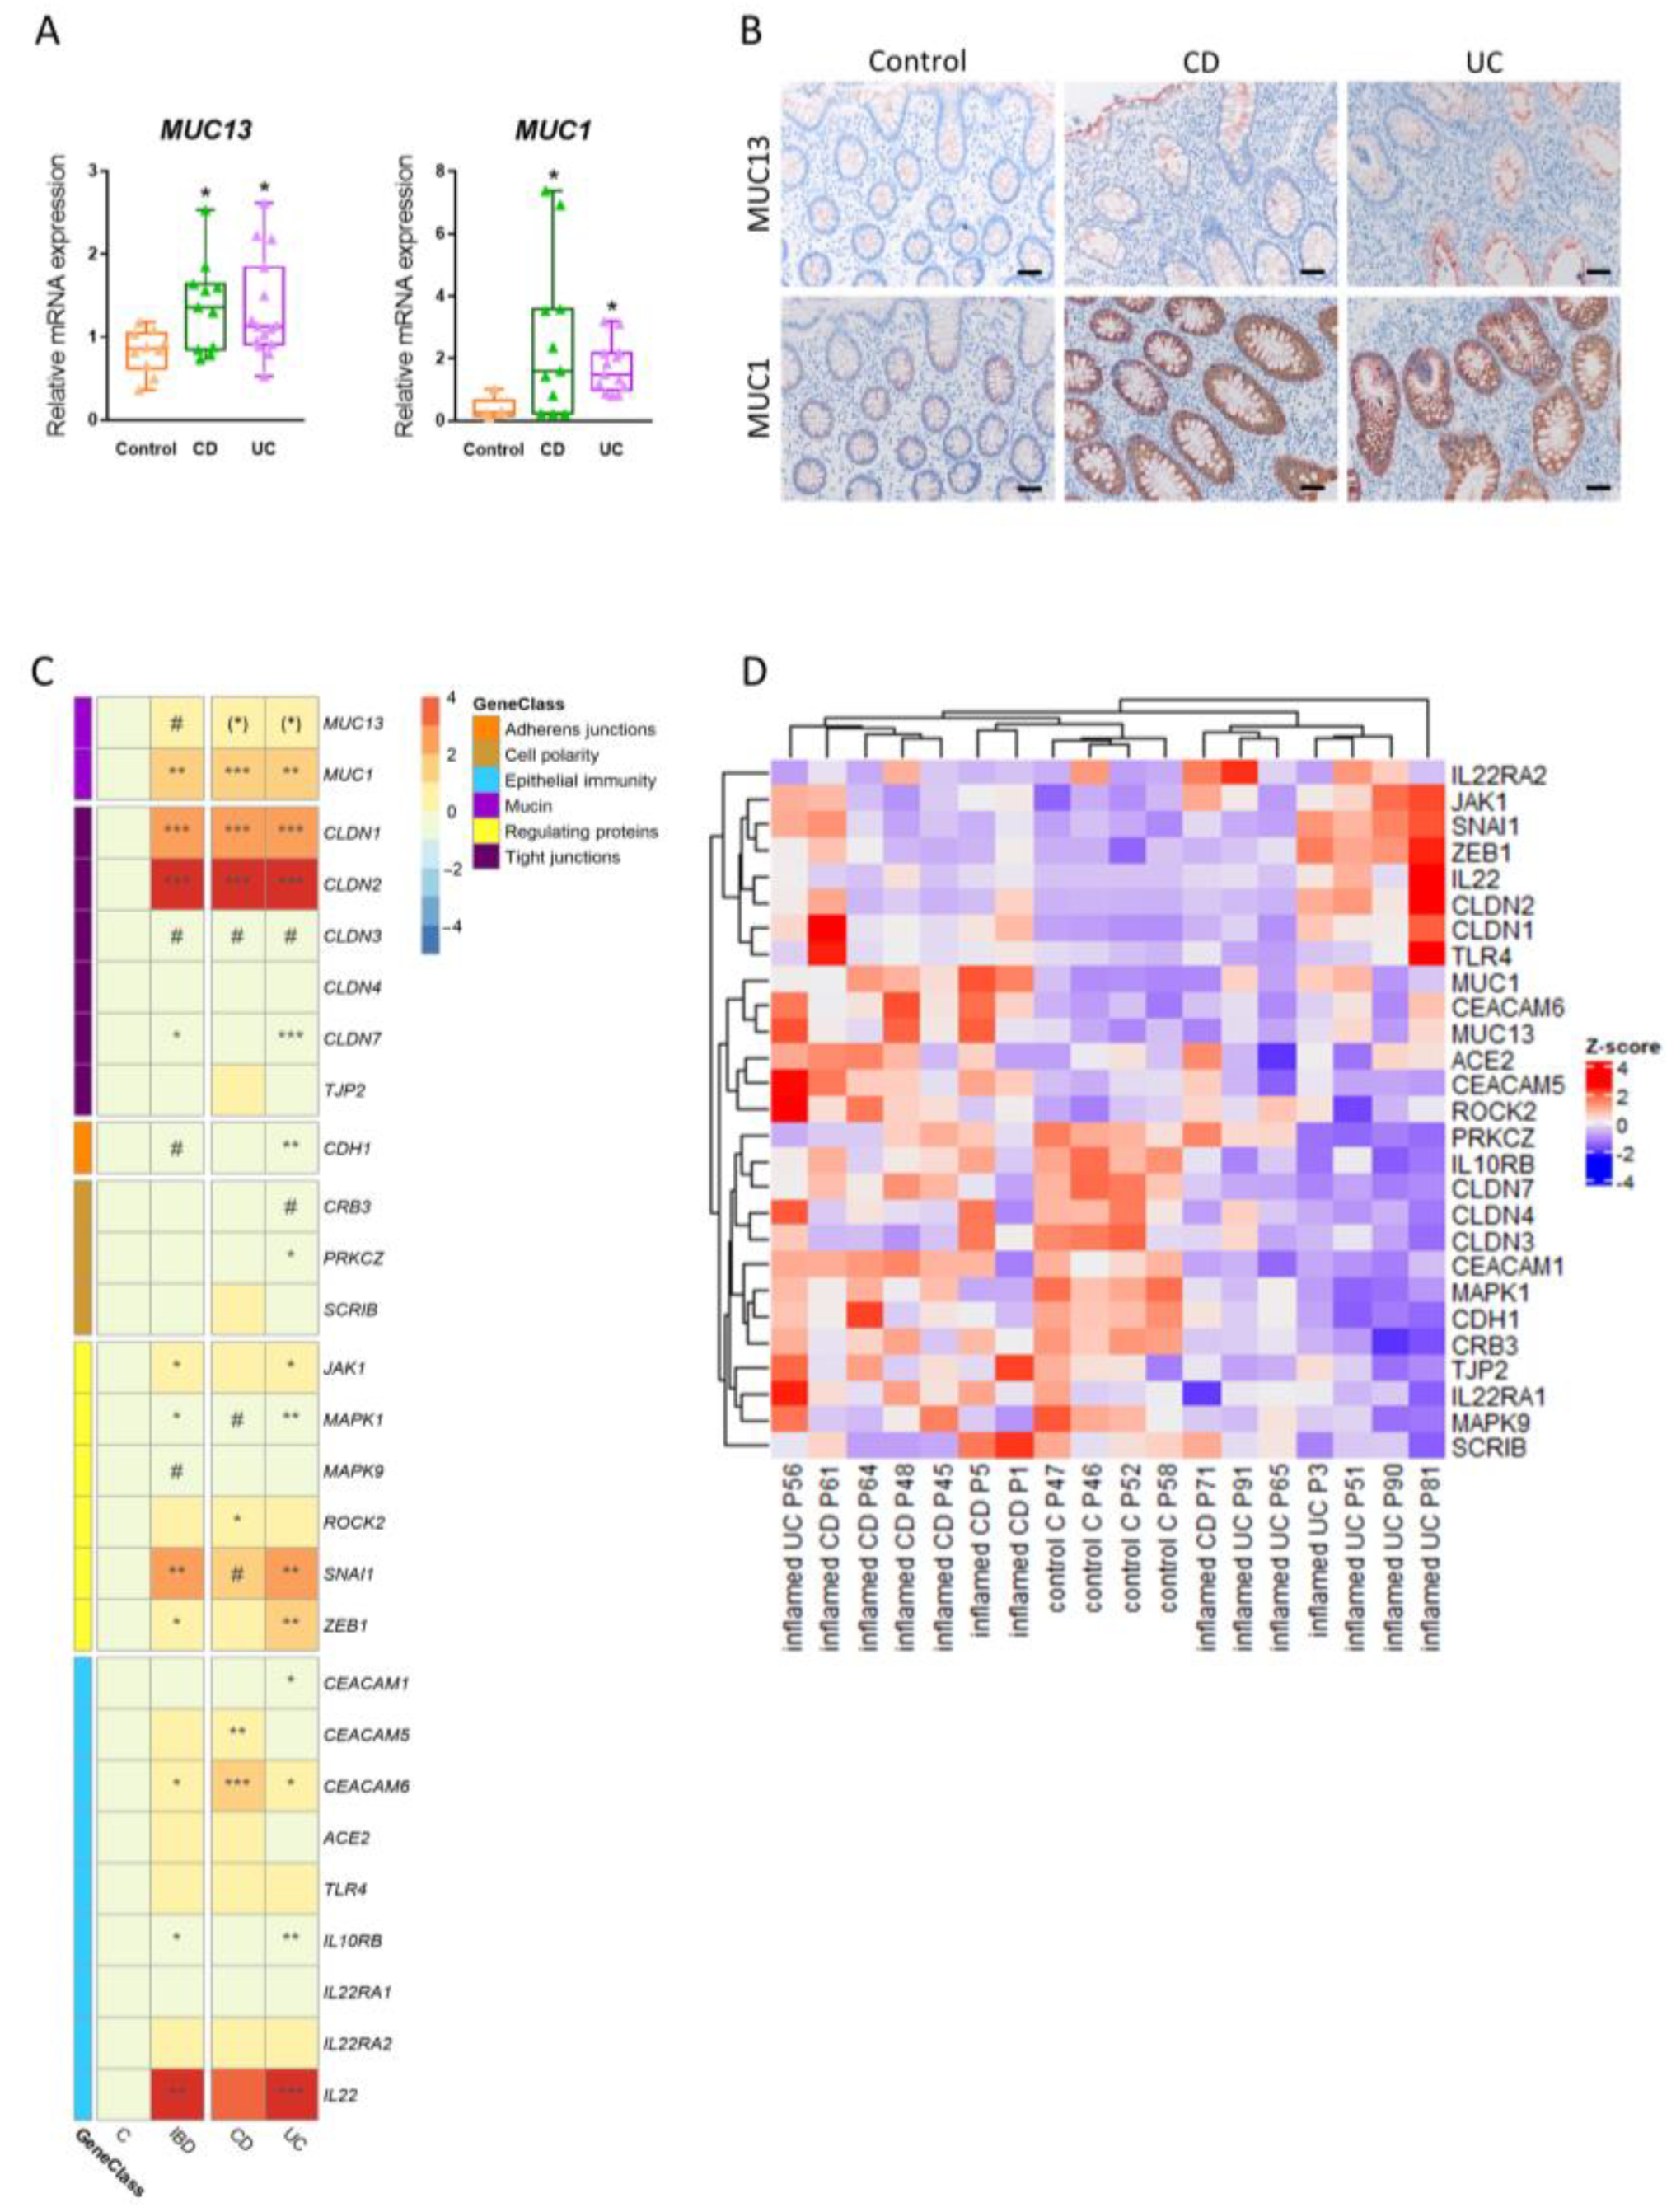
3.6. Expression of Intestinal MUC13 and Its Barrier Mediators Alters upon Inflammation in IBD
4. Discussion
Supplementary Materials
Author Contributions
Funding
Institutional Review Board Statement
Informed Consent Statement
Data Availability Statement
Acknowledgments
Conflicts of Interest
References
- Podolsky, D.K. Inflammatory Bowel Disease. N. Engl. J. Med. 2002, 347, 417–429. [Google Scholar] [CrossRef]
- McGuckin, M.A.; Eri, R.; Simms, L.A.; Florin, T.H.; Radford-Smith, G. Intestinal barrier dysfunction in inflammatory bowel diseases. Inflamm. Bowel. Dis. 2009, 15, 100–113. [Google Scholar] [CrossRef] [PubMed]
- Odenwald, M.A.; Turner, J.R. The intestinal epithelial barrier: A therapeutic target? Nat. Rev. Gastroenterol. Hepatol. 2017, 14, 9–21. [Google Scholar] [CrossRef]
- Breugelmans, T.; Oosterlinck, B.; Arras, W.; Ceuleers, H.; De Man, J.; Hold, G.L.; De Winter, B.Y.; Smet, A. The role of mucins in gastrointestinal barrier function during health and disease. Lancet Gastroenterol. Hepatol. 2022, 7, 455–471. [Google Scholar] [CrossRef]
- Luissint, A.C.; Parkos, C.A.; Nusrat, A. Inflammation and the Intestinal Barrier: Leukocyte-Epithelial Cell Interactions, Cell Junction Remodeling, and Mucosal Repair. Gastroenterology 2016, 151, 616–632. [Google Scholar] [CrossRef]
- Vancamelbeke, M.; Vanuytsel, T.; Farré, R.; Verstockt, S.; Ferrante, M.; Van Assche, G.; Rutgeerts, P.; Schuit, F.; Vermeire, S.; Arijs, I.; et al. Genetic and Transcriptomic Bases of Intestinal Epithelial Barrier Dysfunction in Inflammatory Bowel Disease. Inflamm. Bowel. Dis. 2017, 23, 1718–1729. [Google Scholar] [CrossRef] [PubMed]
- Breugelmans, T.; Van Spaendonk, H.; De Man, J.G.; De Schepper, H.U.; Jauregui-Amezaga, A.; Macken, E.; Lindén, S.K.; Pintelon, I.; Timmermans, J.P.; De Winter, B.Y.; et al. In-Depth Study of Transmembrane Mucins in Association with Intestinal Barrier Dysfunction During the Course of T Cell Transfer and DSS-Induced Colitis. J. Crohns. Colitis. 2020, 14, 974–994. [Google Scholar] [CrossRef]
- Sheng, Y.H.; Lourie, R.; Lindén, S.K.; Jeffery, P.L.; Roche, D.; Tran, T.V.; Png, C.W.; Waterhouse, N.; Sutton, P.; Florin, T.H.; et al. The MUC13 cell-surface mucin protects against intestinal inflammation by inhibiting epithelial cell apoptosis. Gut 2011, 60, 1661–1670. [Google Scholar] [CrossRef]
- Van der Sluis, M.; De Koning, B.A.; De Bruijn, A.C.; Velcich, A.; Meijerink, J.P.; Van Goudoever, J.B.; Büller, H.A.; Dekker, J.; Van Seuningen, I.; Renes, I.B.; et al. Muc2-Deficient Mice Spontaneously Develop Colitis, Indicating That MUC2 Is Critical for Colonic Protection. Gastroenterology 2006, 131, 117–129. [Google Scholar] [CrossRef] [PubMed]
- van Putten, J.P.M.; Strijbis, K. Transmembrane Mucins: Signaling Receptors at the Intersection of Inflammation and Cancer. J. Innate. Immun. 2017, 9, 281–299. [Google Scholar] [CrossRef]
- Sheng, Y.H.; Triyana, S.; Wang, R.; Das, I.; Gerloff, K.; Florin, T.H.; Sutton, P.; McGuckin, M.A. MUC1 and MUC13 differentially regulate epithelial inflammation in response to inflammatory and infectious stimuli. Mucosal. Immunol. 2012, 6, 557–568. [Google Scholar] [CrossRef] [PubMed]
- Petersson, J.; Schreiber, O.; Hansson, G.C.; Gendler, S.J.; Velcich, A.; Lundberg, J.O.; Roos, S.; Holm, L.; Phillipson, M. Importance and regulation of the colonic mucus barrier in a mouse model of colitis. Am. J. Physiol.-Gastrointest. Liver Physiol. 2011, 300, G327–G333. [Google Scholar] [CrossRef]
- McAuley, J.; Linden, S.K.; Png, C.W.; King, R.M.; Pennington, H.L.; Gendler, S.J.; Florin, T.H.; Hill, G.R.; Korolik, V.; McGuckin, M.A. MUC1 cell surface mucin is a critical element of the mucosal barrier to infection. J. Clin. Investig. 2007, 117, 2313–2324. [Google Scholar] [CrossRef] [PubMed]
- McGuckin, M.A.; Every, A.L.; Skene, C.D.; Linden, S.K.; Chionh, Y.T.; Swierczak, A.; McAuley, J.; Harbour, S.; Kaparakis, M.; Ferrero, R.; et al. Muc1 Mucin Limits Both Helicobacter pylori Colonization of the Murine Gastric Mucosa and Associated Gastritis. Gastroenterology 2007, 133, 1210–1218. [Google Scholar] [CrossRef]
- Sheng, Y.H.; Wong, K.Y.; Seim, I.; Wang, R.; He, Y.; Wu, A.; Patrick, M.; Lourie, R.; Schreiber, V.; Giri, R.; et al. MUC13 promotes the development of colitis-associated colorectal tumors via β-catenin activity. Oncogene 2019, 38, 7294–7310. [Google Scholar] [CrossRef]
- Li, W.; Zhang, N.; Jin, C.; Long, M.D.; Rajabi, H.; Yasumizu, Y.; Fushimi, A.; Yamashita, N.; Hagiwara, M.; Zheng, R.; et al. MUC1-C drives stemness in progression of colitis to colorectal cancer. JCI Insight 2020, 5, e137112. [Google Scholar] [CrossRef] [PubMed]
- Maher, D.M.; Gupta, B.K.; Nagata, S.; Jaggi, M.; Chauhan, S.C. Mucin 13: Structure, Function, and Potential Roles in Cancer Pathogenesis. Mol. Cancer Res. 2011, 9, 531–537. [Google Scholar] [CrossRef] [PubMed]
- Keir, M.E.; Yi, Y.; Lu, T.; Ghilardi, N. The role of IL-22 in intestinal health and disease. J. Exp. Med. 2020, 217, e20192195. [Google Scholar] [CrossRef] [PubMed]
- Wang, Y.; Mumm, J.B.; Herbst, R.; Kolbeck, R.; Wang, Y. IL-22 Increases Permeability of Intestinal Epithelial Tight Junctions by Enhancing Claudin-2 Expression. J. Immunol. 2017, 199, 3316–3325. [Google Scholar] [CrossRef]
- Arshad, T.; Mansur, F.; Palek, R.; Manzoor, S.; Liska, V. A Double Edged Sword Role of Interleukin-22 in Wound Healing and Tissue Regeneration. Front. Immunol. 2020, 11, 2148. [Google Scholar] [CrossRef]
- Breugelmans, T.; Arras, W.; Boen, L.-E.; Borms, E.; Kamperdijk, L.; de Man, J.; van de Vijver, E.; van Gils, A.; de Winter, B.Y.; Moes, N.; et al. Aberrant Mucin Expression Profiles Associate with Pediatric Inflammatory Bowel Disease Presentation and Activity. Inflamm. Bowel. Dis. 2022, 29, 589–601. [Google Scholar] [CrossRef]
- Gupta, J.; Nebreda, A. Analysis of Intestinal Permeability in Mice. Bio-Protocol 2014, 4, e1289. [Google Scholar] [CrossRef]
- Bolger, A.M.; Lohse, M.; Usadel, B. Trimmomatic: A flexible trimmer for Illumina sequence data. Bioinformatics 2014, 30, 2114–2120. [Google Scholar] [CrossRef]
- Dobin, A.; Davis, C.A.; Schlesinger, F.; Drenkow, J.; Zaleski, C.; Jha, S.; Batut, P.; Chaisson, M.; Gingeras, T.R. STAR: Ultrafast universal RNA-seq aligner. Bioinformatics 2013, 29, 15. [Google Scholar] [CrossRef]
- Liao, Y.; Smyth, G.K.; Shi, W. Featurecounts: An efficient general purpose program for assigning sequence reads to genomic features. Bioinformatics 2014, 30, 923–930. [Google Scholar] [CrossRef] [PubMed]
- Love, M.I.; Huber, W.; Anders, S. Moderated estimation of fold change and dispersion for RNA-seq data with DESeq2. Genome Biol. 2014, 15, 550. [Google Scholar] [CrossRef] [PubMed]
- Lei, H.; Crawford, M.S.; McCole, D.F. JAK-STAT Pathway Regulation of Intestinal Permeability: Pathogenic Roles and Therapeutic Opportunities in Inflammatory Bowel Disease. Pharmaceuticals 2021, 14, 840. [Google Scholar] [CrossRef]
- Dave, N.; Guaita-Esteruelas, S.; Gutarra, S.; Frias, À.; Beltran, M.; Peiró, S.; García De Herreros, A. Functional Cooperation between Snail1 and Twist in the Regulation of ZEB1 Expression during Epithelial to Mesenchymal Transition. J. Biol. Chem. 2011, 286, 12024. [Google Scholar] [CrossRef]
- Shi, J.; Wu, X.; Surma, M.; Vemula, S.; Zhang, L.; Yang, Y.; Kapur, R.; Wei, L. Distinct roles for ROCK1 and ROCK2 in the regulation of cell detachment. Cell Death Dis. 2013, 4, e483. [Google Scholar] [CrossRef]
- Landy, J.; Ronde, E.; English, N.; Clark, S.K.; Hart, A.L.; Knight, S.C.; Ciclitira, P.J.; Al-Hassi, H.O. Tight junctions in inflammatory bowel diseases and inflammatory bowel disease associated colorectal cancer. World J. Gastroenterol. 2016, 22, 3117–3126. [Google Scholar] [CrossRef]
- Pope, J.L.; Bhat, A.A.; Sharma, A.; Ahmad, R.; Krishnan, M.; Washington, M.K.; Beauchamp, R.D.; Singh, A.B.; Dhawan, P. Claudin-1 Regulates Intestinal Epithelial Homeostasis through the Modulation of Notch Signaling. Gut 2014, 63, 622. [Google Scholar] [CrossRef] [PubMed]
- Muise, A.M.; Walters, T.D.; Glowacka, W.K.; Griffiths, A.M.; Ngan, B.Y.; Lan, H.; Xu, W.; Silverberg, M.S.; Rotin, D. Polymorphisms in E-cadherin (CDH1) result in a mis-localised cytoplasmic protein that is associated with Crohn’s disease. Gut 2009, 58, 1121–1127. [Google Scholar] [CrossRef]
- Grill, J.I.; Neumann, J.; Hiltwein, F.; Kolligs, F.T.; Schneider, M.R. Intestinal E-cadherin Deficiency Aggravates Dextran Sodium Sulfate-Induced Colitis. Dig. Dis. Sci. 2015, 60, 895–902. [Google Scholar] [CrossRef] [PubMed]
- Saiz-Gonzalo, G.; Hanrahan, N.; Rossini, V.; Singh, R.; Ahern, M.; Kelleher, M.; Hill, S.; O’Sullivan, R.; Fanning, A.; Walsh, P.T.; et al. Regulation of CEACAM Family Members by IBD-Associated Triggers in Intestinal Epithelial Cells, Their Correlation to Inflammation and Relevance to IBD Pathogenesis. Front. Immunol. 2021, 12, 2986. [Google Scholar] [CrossRef] [PubMed]
- Li, X.Z.; Qiu, Y.; Jeffery, L.; Liu, F.; Feng, R.; He, J.S.; Tan, J.Y.; Ye, Z.Y.; Lin, S.N.; Ghosh, S.; et al. Down-Regulation of Colonic ACE2 Expression in Patients with Inflammatory Bowel Disease Responding to Anti-TNF Therapy: Implications for COVID-19. Front. Med. 2021, 7, 613475. [Google Scholar] [CrossRef]
- Hashimoto, T.; Perlot, T.; Rehman, A.; Trichereau, J.; Ishiguro, H.; Paolino, M.; Sigl, V.; Hanada, T.; Hanada, R.; Lipinski, S.; et al. ACE2 links amino acid malnutrition to microbial ecology and intestinal inflammation. Nature 2012, 487, 477–481. [Google Scholar] [CrossRef] [PubMed]
- Yu, W.; Ou, X.; Liu, X.; Zhang, S.; Gao, X.; Cheng, H.; Zhu, B.; Yan, J. ACE2 contributes to the maintenance of mouse epithelial barrier function. Biochem. Biophys. Res. Commun. 2020, 533, 1276. [Google Scholar] [CrossRef]
- Richard, D.; Muthuirulan, P.; Aguiar, J.; Doxey, A.C.; Banerjee, A.; Mossman, K.; Hirota, J.; Capellini, T.D. Intronic regulation of SARS-CoV-2 receptor (ACE2) expression mediated by immune signaling and oxidative stress pathways. iScience 2022, 25, 104614. [Google Scholar] [CrossRef]
- Lee, H.J.; Nam, K.T.; Park, H.S.; Kim, M.A.; LaFleur, B.J.; Aburatani, H.; Yang, H.K.; Kim, W.H.; Goldenring, J.R. Gene Expression Profiling of Metaplastic Lineages Identifies CDH17 as a Prognostic Marker in Early Stage Gastric Cancer. Gastroenterology 2010, 139, 213. [Google Scholar] [CrossRef]
- Sheng, Y.H.; Ng, G.Z.; Summers, K.M.; Every, A.L.; Price, G.; Hasnain, S.Z.; Sutton, P.; McGuckin, M.A. Influence of the MUC1 Cell Surface Mucin on Gastric Mucosal Gene Expression Profiles in Response to Helicobacter pylori Infection in Mice. Front. Cell Infect. Microbiol. 2020, 10, 343. [Google Scholar] [CrossRef]
- Burgueño, J.F.; Abreu, M.T. Epithelial Toll-like receptors and their role in gut homeostasis and disease. Nat. Rev. Gastroenterol. Hepatol. 2020, 17, 263–278. [Google Scholar] [CrossRef] [PubMed]
- Kelleher, M.; Singh, R.; O’Driscoll, C.M.; Melgar, S. Carcinoembryonic antigen (CEACAM) family members and Inflammatory Bowel Disease. Cytokine Growth Factor. Rev. 2019, 47, 21–31. [Google Scholar] [CrossRef] [PubMed]
- Breugelmans, T.; De Winter, B.Y.; Smet, A. The microbiota-gut-brain axis in gastrointestinal inflammation and neurological comorbidities. Microbiota Heal. Dis. 2019, 2, e201. [Google Scholar]
- Dheer, R.; Santaolalla, R.; Davies, J.M.; Lang, J.K.; Phillips, M.C.; Pastorini, C.; Vazquez-Pertejo, M.T.; Abreu, M.T. Intestinal Epithelial Toll-Like Receptor 4 Signaling Affects Epithelial Function and Colonic Microbiota and Promotes a Risk for Transmissible Colitis. Infect. Immun. 2016, 84, 798–810. [Google Scholar] [CrossRef] [PubMed]
- Xie, M.H.; Aggarwal, S.; Ho, W.-H.; Foster, J.; Zhang, Z.; Stinson, J.; Wood, W.I.; Goddard, A.D.; Gurney, A.L. Interleukin (IL)-22, a Novel Human Cytokine That Signals through the Interferon Receptor-related Proteins CRF2–4 and IL-22R. J. Biol. Chem. 2000, 275, 31335–31339. [Google Scholar] [CrossRef]
- Kotenko, S.V.; Izotova, L.S.; Mirochnitchenko, O.V.; Esterova, E.; Dickensheets, H.; Donnelly, R.P.; Pestka, S. Identification of the Functional Interleukin-22 (IL-22) Receptor Complex. J. Biol. Chem. 2001, 276, 2725–2732. [Google Scholar] [CrossRef]
- Mizoguchi, A.; Yano, A.; Himuro, H.; Ezaki, Y.; Sadanaga, T.; Mizoguchi, E. Clinical importance of IL-22 cascade in IBD. J. Gastroenterol. 2018, 53, 465. [Google Scholar] [CrossRef]
- Feng, Y.J.; Li, Y.Y. The role of p38 mitogen-activated protein kinase in the pathogenesis of inflammatory bowel disease. J. Dig. Dis. 2011, 12, 327–332. [Google Scholar] [CrossRef]
- Zheng, H.; Kang, Y. Multilayer control of the EMT master regulators. Oncogene 2014, 33, 1755–1763. [Google Scholar] [CrossRef]
- Wei, M.; Ma, Y.; Shen, L.; Xu, Y.; Liu, L.; Bu, X.; Guo, Z.; Qin, H.; Li, Z.; Wang, Z.; et al. NDRG2 regulates adherens junction integrity to restrict colitis and tumourigenesis. eBioMedicine 2020, 61, 103068. [Google Scholar] [CrossRef]
- Elamin, E.; Masclee, A.; Troost, F.; Dekker, J.; Jonkers, D. Activation of the epithelial-to-mesenchymal transition factor snail mediates acetaldehyde-induced intestinal epithelial barrier disruption. Alcohol. Clin. Exp. Res. 2014, 38, 344–353. [Google Scholar] [CrossRef]
- Xiong, H.; Hong, J.; Du, W.; Lin, Y.W.; Ren, L.L.; Wang, Y.C.; Su, W.Y.; Wang, J.L.; Cui, Y.; Wang, Z.H.; et al. Roles of STAT3 and ZEB1 Proteins in E-cadherin Down-regulation and Human Colorectal Cancer Epithelial-Mesenchymal Transition. J. Biol. Chem. 2012, 287, 5819. [Google Scholar] [CrossRef] [PubMed]
- Bhat, A.A.; Pope, J.L.; Smith, J.J.; Ahmad, R.; Chen, X.; Washington, M.K.; Beauchamp, R.D.; Singh, A.B.; Dhawan, P. Claudin-7 expression induces mesenchymal to epithelial transformation (MET) to inhibit colon tumorigenesis. Oncogene 2015, 34, 4570. [Google Scholar] [CrossRef] [PubMed]
- Bhat, A.A.; Ahmad, R.; Uppada, S.B.; Singh, A.B.; Dhawan, P. Claudin-1 promotes TNF-α-induced epithelial-mesenchymal transition and migration in colorectal adenocarcinoma cells. Exp. Cell Res. 2016, 349, 119–127. [Google Scholar] [CrossRef]
- Ueda, J.; Semba, S.; Chiba, H.; Sawada, N.; Seo, Y.; Kasuga, M.; Yokozaki, H. Heterogeneous Expression of Claudin-4 in Human Colorectal Cancer: Decreased Claudin-4 Expression at the Invasive Front Correlates Cancer Invasion and Metastasis. Pathobiology 2007, 74, 32–41. [Google Scholar] [CrossRef] [PubMed]
- Ran, X.; Li, Y.; Chen, G.; Fu, S.; He, D.; Huang, B.; Wei, L.; Lin, Y.; Guo, Y.; Hu, G. Farrerol Ameliorates TNBS-Induced Colonic Inflammation by Inhibiting ERK1/2, JNK1/2, and NF-κB Signaling Pathway. Int. J. Mol. Sci. 2018, 19, 2037. [Google Scholar] [CrossRef] [PubMed]
- Zhang, Z.; Zhang, Q.; Li, F.; Xin, Y.; Duan, Z. Contributions of HO-1-Dependent MAPK to Regulating Intestinal Barrier Disruption. Biomol. Ther. 2021, 29, 175. [Google Scholar] [CrossRef]
- Zou, Y.; Ma, L.; Zhao, Y.; Zhang, S.; Zhou, C.; Cai, Y. Inhibition of Rho kinase protects against colitis in mice by attenuating intestinal epithelial barrier dysfunction via MLC and the NF-κB pathway. Int. J. Mol. Med. 2017, 41, 430–438. [Google Scholar] [CrossRef]
- Elamin, E.; Masclee, A.; Dekker, J.; Jonkers, D. Ethanol disrupts intestinal epithelial tight junction integrity through intracellular calcium-mediated Rho/ROCK activation. Am. J. Physiol. Liver Physiol. 2014, 306, G677–G685. [Google Scholar] [CrossRef]
- Li, Z.; Gao, M.; Yang, B.; Zhang, H.; Wang, K.; Liu, Z.; Xiao, X.; Yang, M. Naringin attenuates MLC phosphorylation and NF-κB activation to protect sepsis-induced intestinal injury via RhoA/ROCK pathway. Biomed. Pharmacother. 2018, 103, 50–58. [Google Scholar] [CrossRef]
- Kwon, J.; Kim, N.-H.; Choi, I. ROCK activity regulates functional tight junction assembly during blastocyst formation in porcine parthenogenetic embryos. PeerJ 2016, 4, e1914. [Google Scholar] [CrossRef] [PubMed]
- Jiang, Y.; Song, J.; Xu, Y.; Liu, C.; Qian, W.; Bai, T.; Hou, X. Piezo1 regulates intestinal epithelial function by affecting the tight junction protein claudin-1 via the ROCK pathway. Life Sci. 2021, 275, 119254. [Google Scholar] [CrossRef] [PubMed]
- Escher, T.E.; Lui, A.J.; Geanes, E.S.; Walter, K.R.; Tawfik, O.; Hagan, C.R.; Lewis-Wambi, J. Interaction between MUC1 and STAT1 drives IFITM1 overexpression in aromatase inhibitor-resistant breast cancer cells and mediates estrogen-induced apoptosis. Mol. Cancer Res. 2019, 17, 1180. [Google Scholar] [CrossRef]
- Damera, G.; Xia, B.; Sachdev, G.P. IL-4 induced MUC4 enhancement in respiratory epithelial cells in vitro is mediated through JAK-3 selective signaling. Respir. Res. 2006, 7, 39. [Google Scholar] [CrossRef] [PubMed]
- Smet, A.; Breugelmans, T.; Michiels, J.; Lamote, K.; Arras, W.; de Man, J.G.; Heyndrickx, L.; Hauner, A.; Huizing, M.; Malhotra-Kumar, S.; et al. A dynamic mucin mRNA signature associates with COVID-19 disease presentation and severity. JCI Insight 2021, 6, e151777. [Google Scholar] [CrossRef] [PubMed]
- Mishra, J.; Verma, R.K.; Alpini, G.; Meng, F.; Kumar, N. Role of Janus Kinase 3 in Mucosal Differentiation and Predisposition to Colitis. J. Biol. Chem. 2013, 288, 31795. [Google Scholar] [CrossRef]
- Chen, H.; Li, M.; Sanchez, E.; Soof, C.M.; Bujarski, S.; Ng, N.; Cao, J.; Hekmati, T.; Zahab, B.; Nosrati, J.D.; et al. JAK1/2 pathway inhibition suppresses M2 polarization and overcomes resistance of myeloma to lenalidomide by reducing TRIB1, MUC1, CD44, CXCL12, and CXCR4 expression. Br. J. Haematol. 2020, 188, 283–294. [Google Scholar] [CrossRef]


Disclaimer/Publisher’s Note: The statements, opinions and data contained in all publications are solely those of the individual author(s) and contributor(s) and not of MDPI and/or the editor(s). MDPI and/or the editor(s) disclaim responsibility for any injury to people or property resulting from any ideas, methods, instructions or products referred to in the content. |
© 2023 by the authors. Licensee MDPI, Basel, Switzerland. This article is an open access article distributed under the terms and conditions of the Creative Commons Attribution (CC BY) license (https://creativecommons.org/licenses/by/4.0/).
Share and Cite
Breugelmans, T.; Arras, W.; Oosterlinck, B.; Jauregui-Amezaga, A.; Somers, M.; Cuypers, B.; Laukens, K.; De Man, J.G.; De Schepper, H.U.; De Winter, B.Y.; et al. IL-22-Activated MUC13 Impacts on Colonic Barrier Function through JAK1/STAT3, SNAI1/ZEB1 and ROCK2/MAPK Signaling. Cells 2023, 12, 1224. https://doi.org/10.3390/cells12091224
Breugelmans T, Arras W, Oosterlinck B, Jauregui-Amezaga A, Somers M, Cuypers B, Laukens K, De Man JG, De Schepper HU, De Winter BY, et al. IL-22-Activated MUC13 Impacts on Colonic Barrier Function through JAK1/STAT3, SNAI1/ZEB1 and ROCK2/MAPK Signaling. Cells. 2023; 12(9):1224. https://doi.org/10.3390/cells12091224
Chicago/Turabian StyleBreugelmans, Tom, Wout Arras, Baptiste Oosterlinck, Aranzazu Jauregui-Amezaga, Michaël Somers, Bart Cuypers, Kris Laukens, Joris G. De Man, Heiko U. De Schepper, Benedicte Y. De Winter, and et al. 2023. "IL-22-Activated MUC13 Impacts on Colonic Barrier Function through JAK1/STAT3, SNAI1/ZEB1 and ROCK2/MAPK Signaling" Cells 12, no. 9: 1224. https://doi.org/10.3390/cells12091224
APA StyleBreugelmans, T., Arras, W., Oosterlinck, B., Jauregui-Amezaga, A., Somers, M., Cuypers, B., Laukens, K., De Man, J. G., De Schepper, H. U., De Winter, B. Y., & Smet, A. (2023). IL-22-Activated MUC13 Impacts on Colonic Barrier Function through JAK1/STAT3, SNAI1/ZEB1 and ROCK2/MAPK Signaling. Cells, 12(9), 1224. https://doi.org/10.3390/cells12091224