
A Thia-Analogous Indirubin N-Glycoside Disrupts Mitochondrial Function and Causes the Death of Human Melanoma and Cutaneous Squamous Cell Carcinoma Cells

 , and
, and 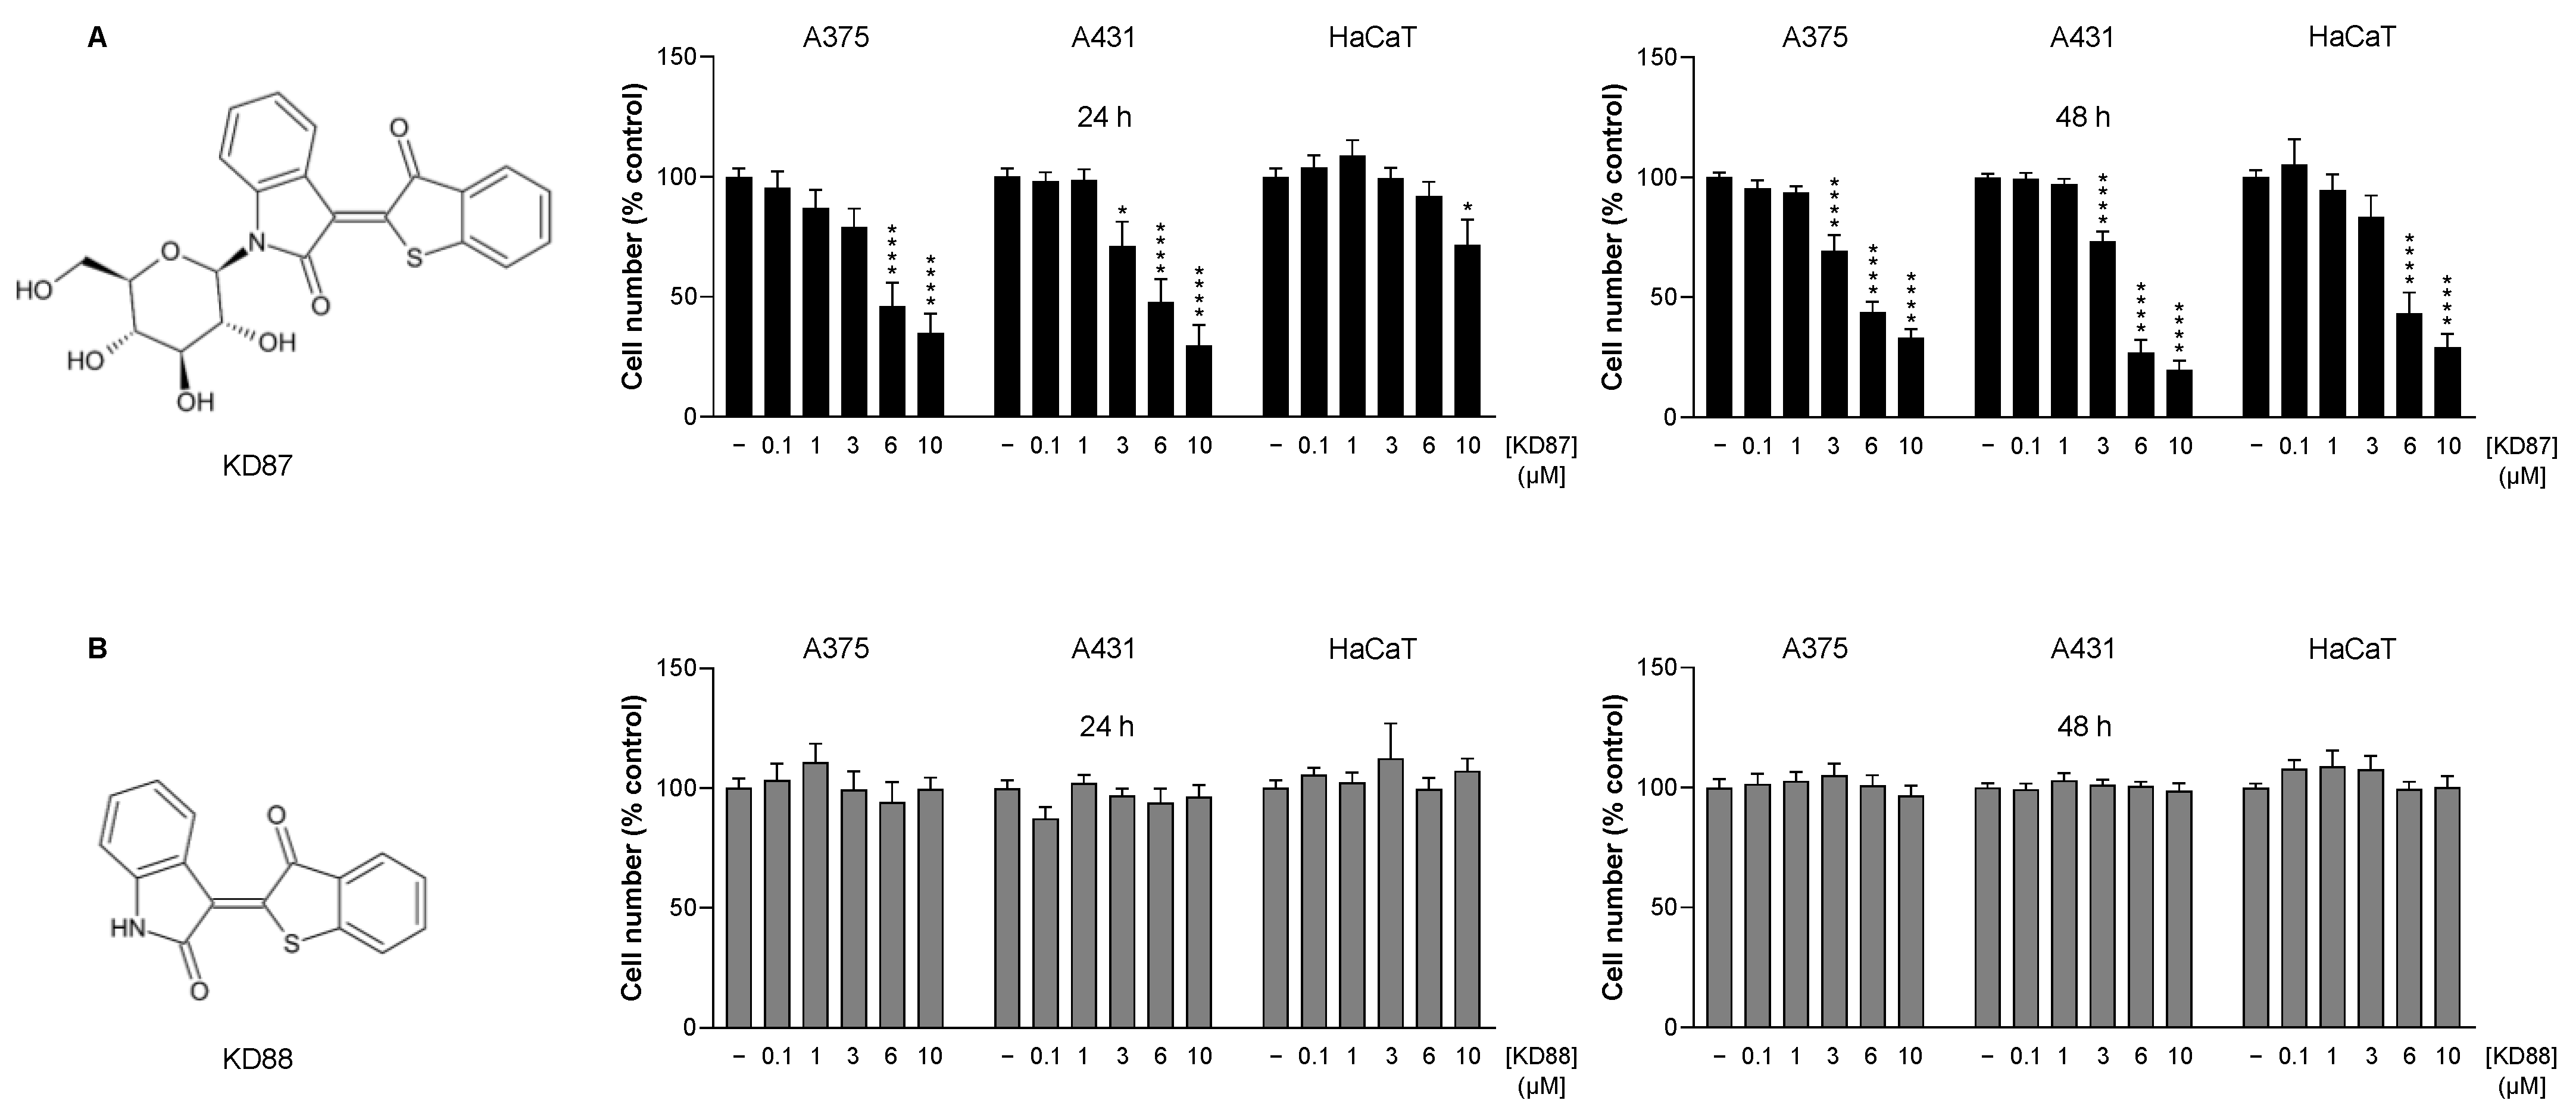
Abstract
1. Introduction
2. Materials and Methods
2.1. Materials
2.2. Cell Culture
2.3. Metabolic-Activity and Cell-Death Assay
2.4. Caspase Assay
2.5. Colony Formation Assay
2.6. Cell Invasion and Migration
2.7. Seahorse XFe Analysis
2.8. Total Cellular Protein Isolation
2.9. Mitochondrial Protein Isolation
2.10. Western Blot Analysis
2.11. Quantitative Reverse Transcriptase Polymerase Chain Reaction (RT-PCR)
2.12. Electron Microscopy
2.13. Statistics
3. Results
3.1. The Thia-Analogous Indirubin N-Glycoside Derivative KD87, but Not Its Non-Glycosylated Structural Analogue KD88, Causes the Concentration-Dependent Death of Human Melanoma (A375) and Human Cutaneous Squamous Carcinoma Cells (A431)
3.2. KD87 Induces Biochemical Features of Apoptosis in A375 and A431 Cells
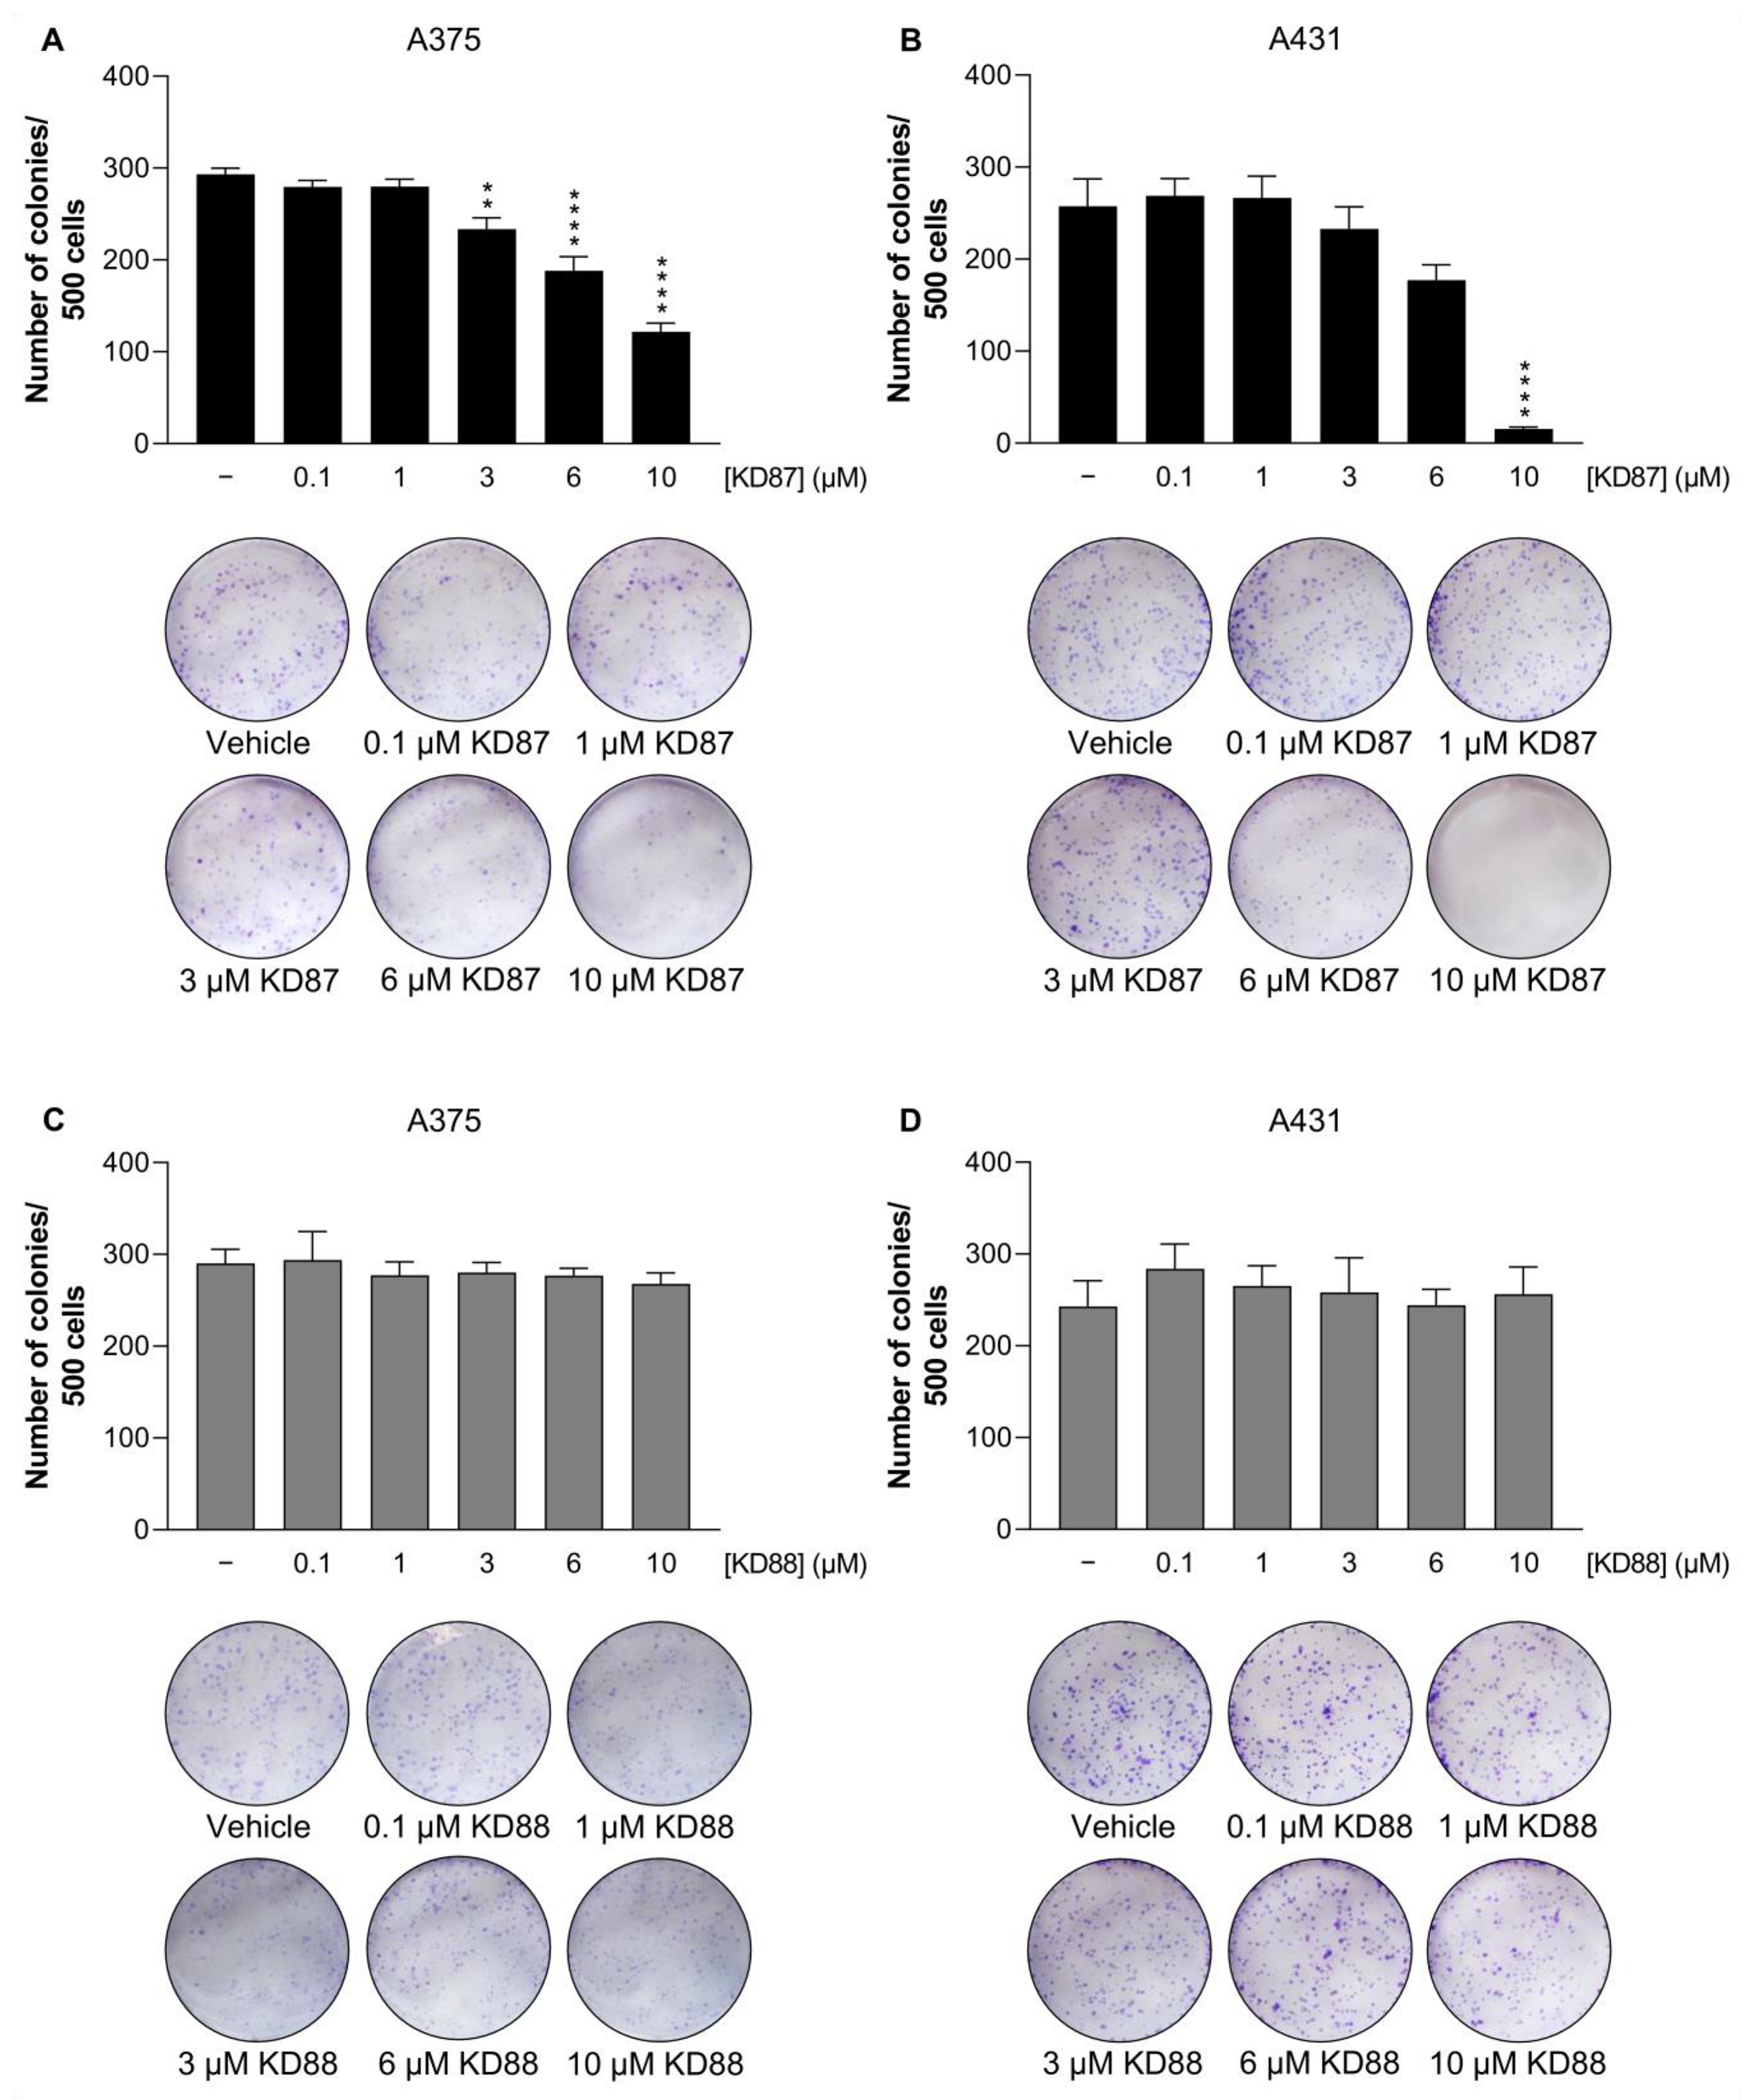
3.3. KD87 Inhibits Colony Formation of A375 and A431 Cells
3.4. KD87 Does Not Inhibit Invasion and Migration of A375 Cells
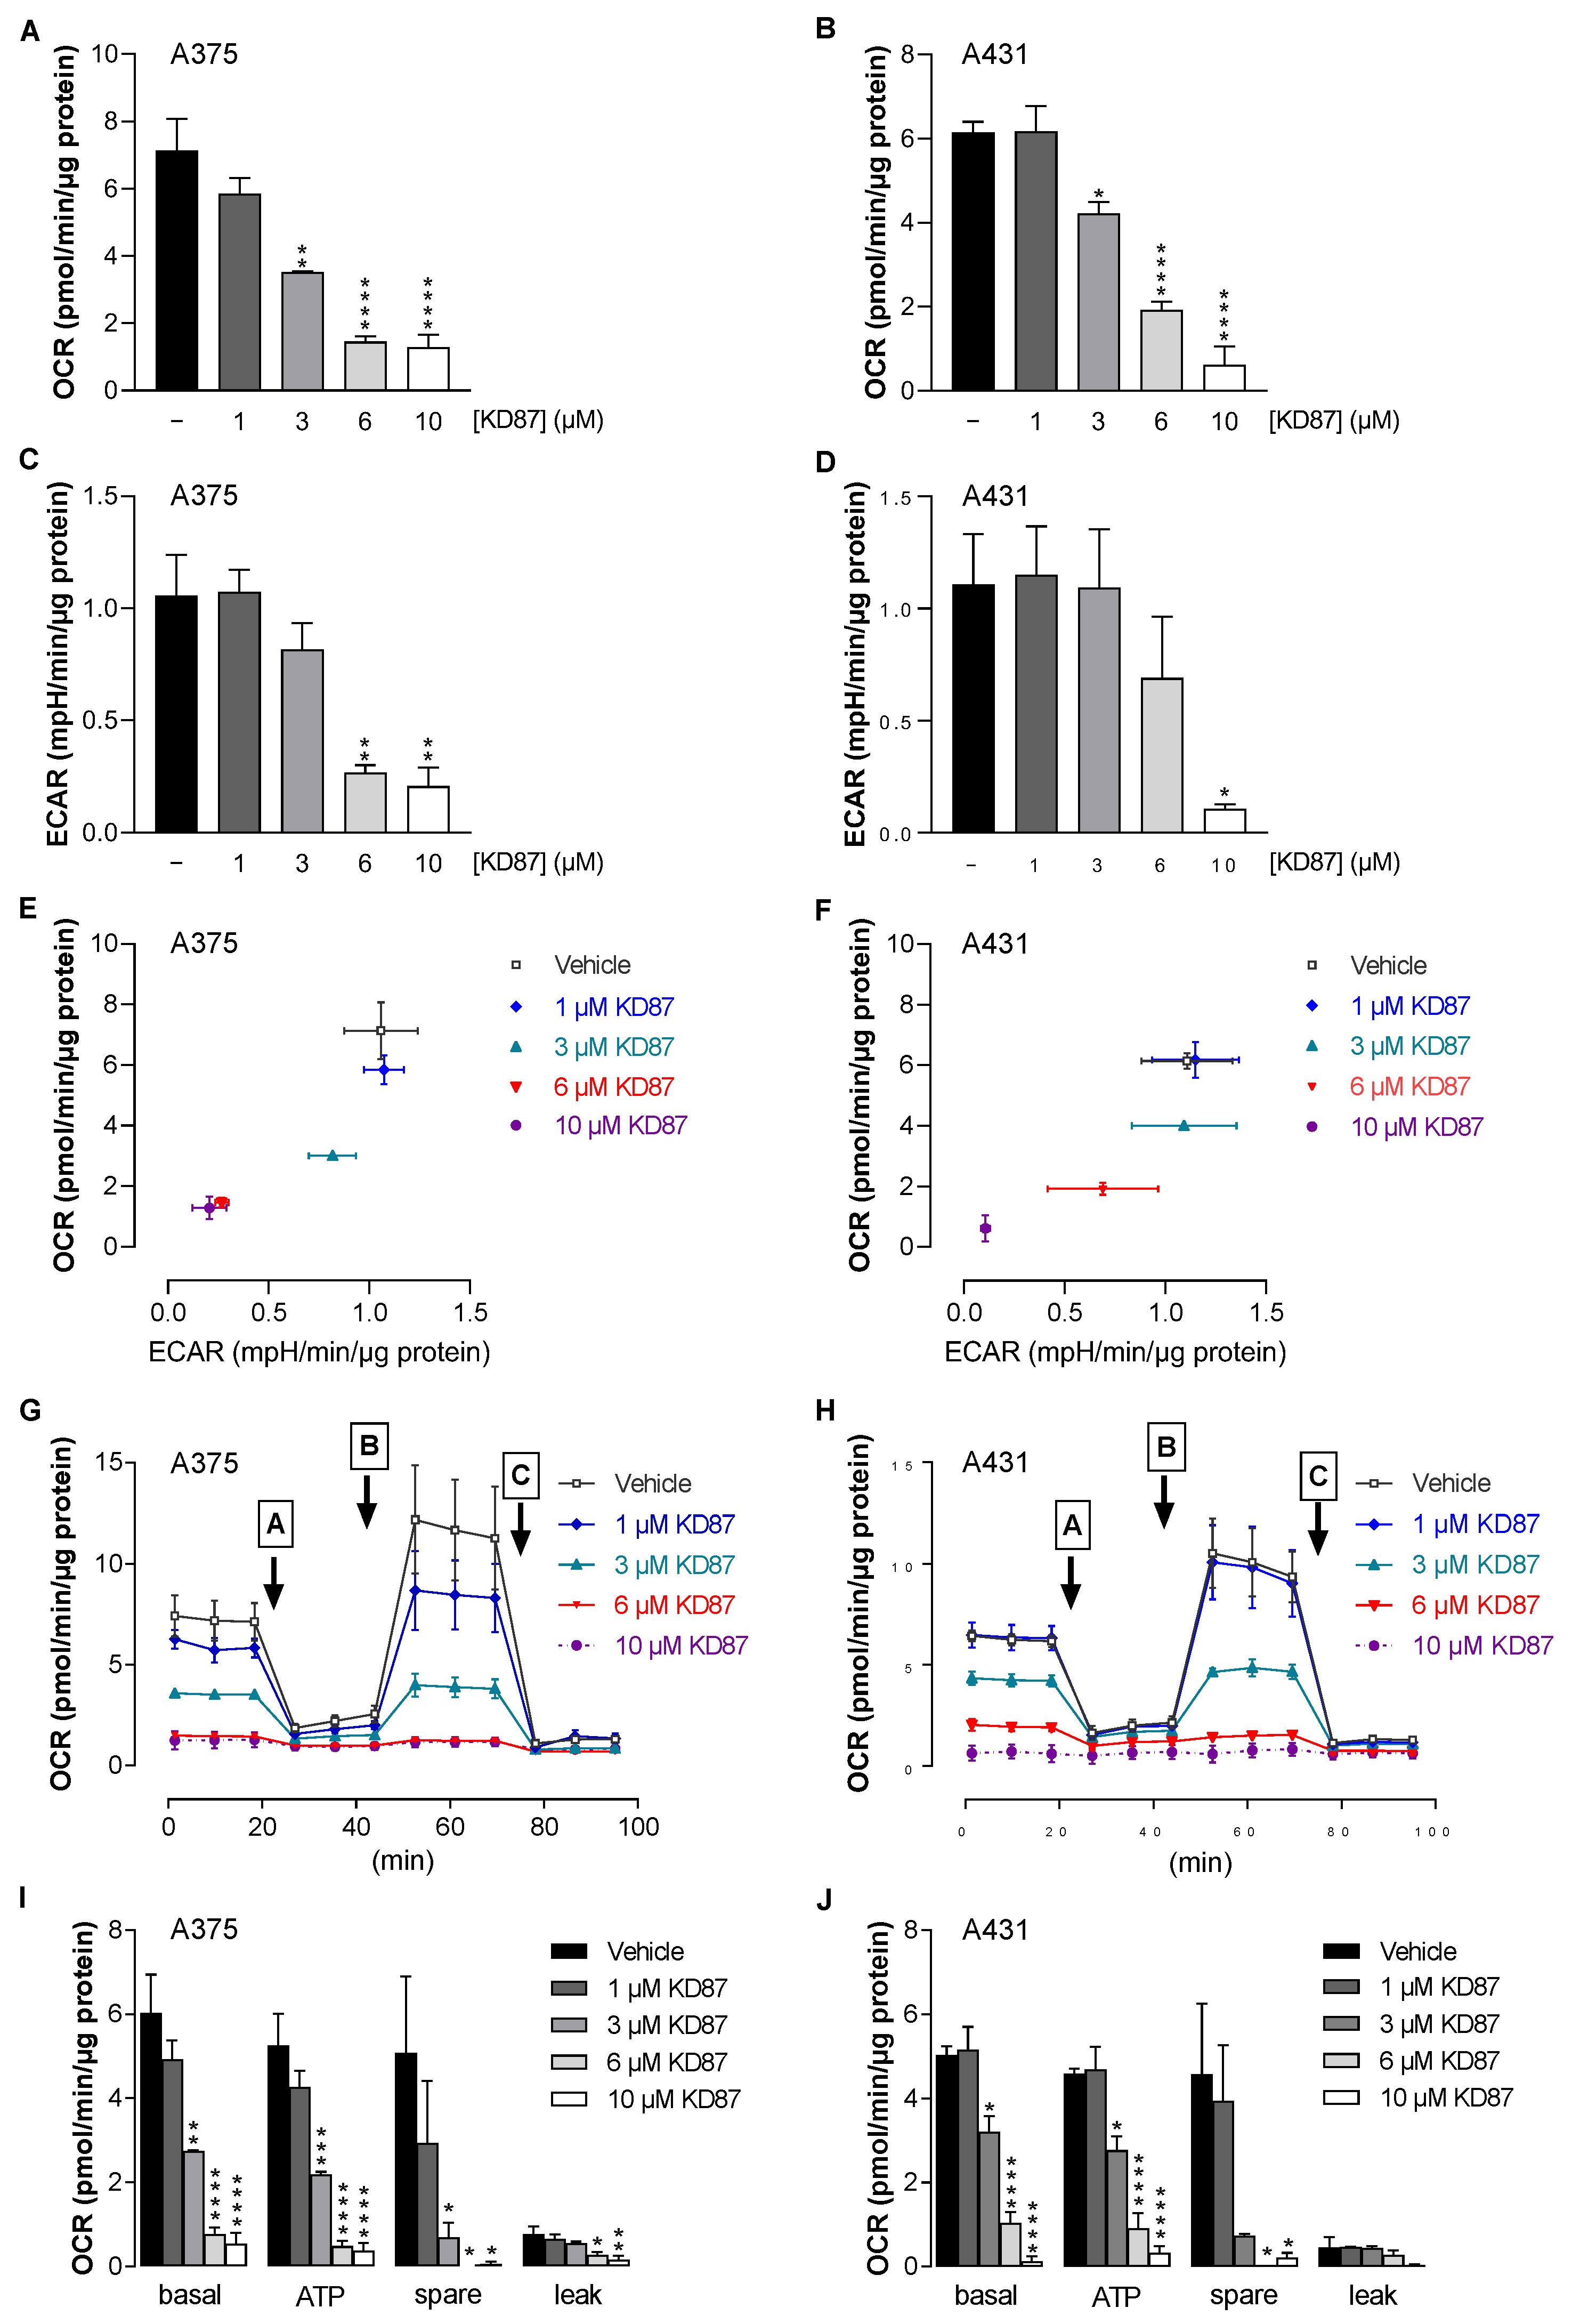
3.5. KD87 Causes Inhibition of Mitochondrial Respiration in A375 and A431 Cells
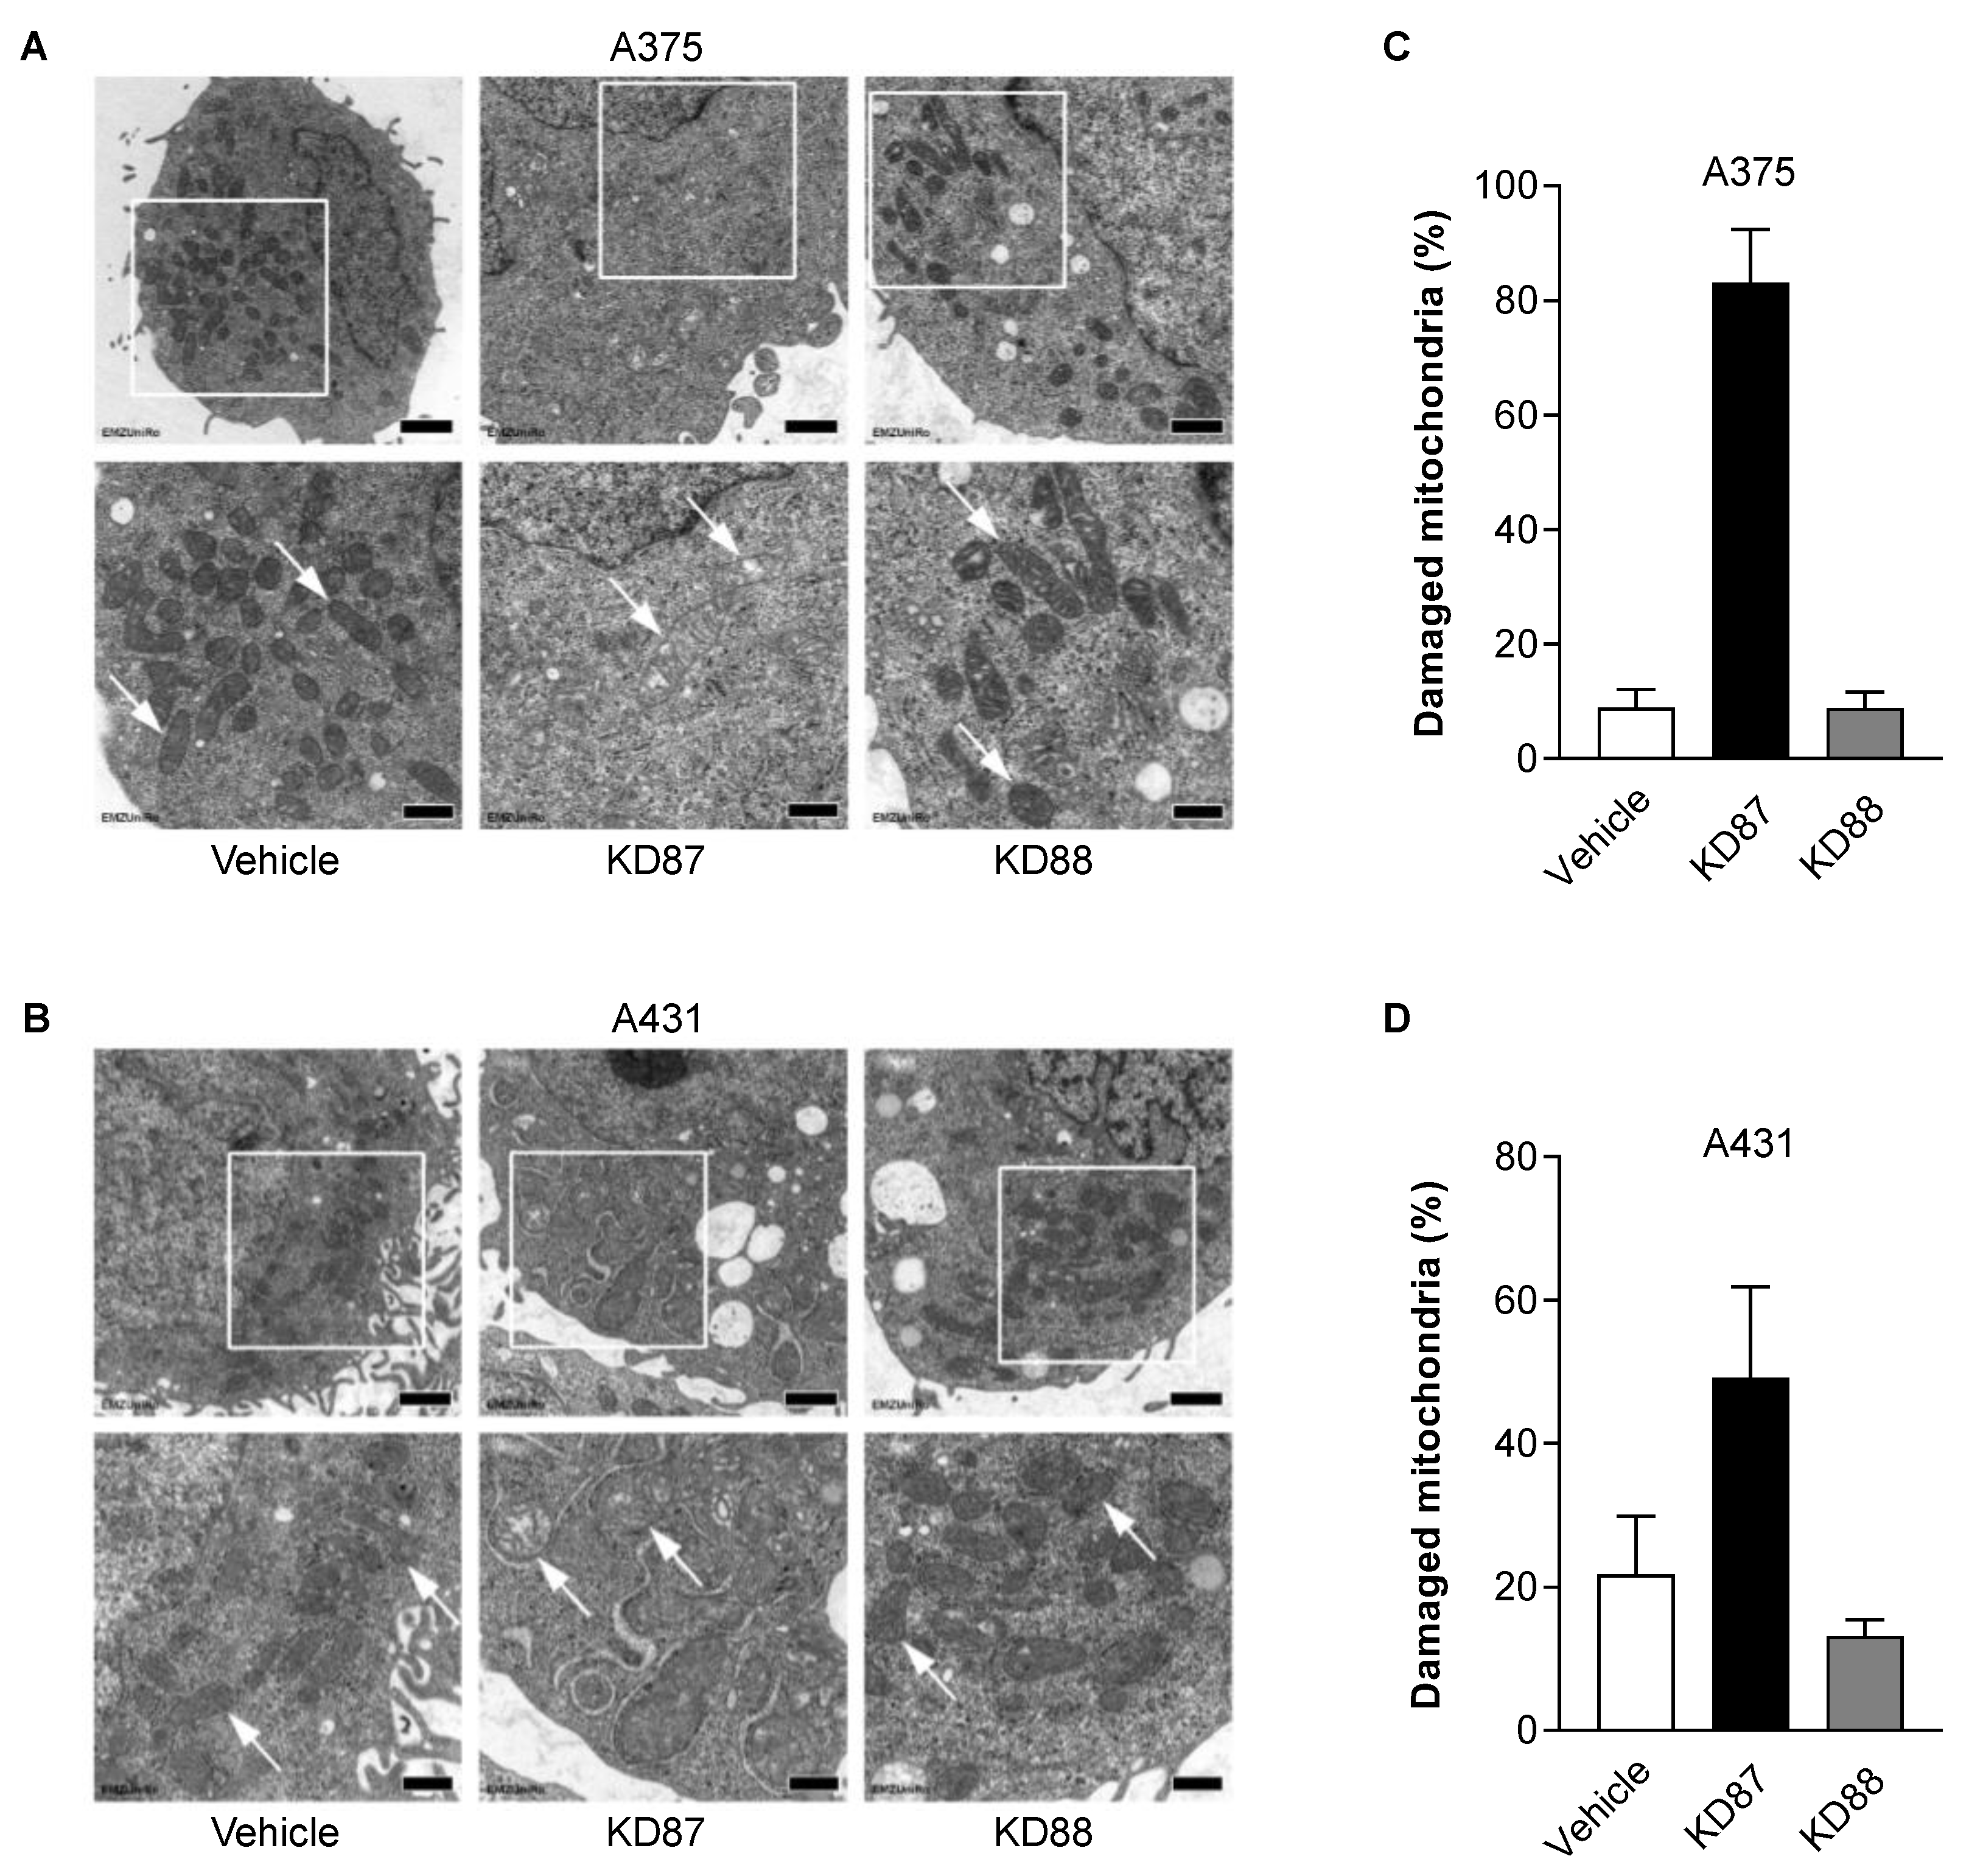
3.6. KD87 Confers Structural Mitochondrial Changes in A375 and A431 Cells
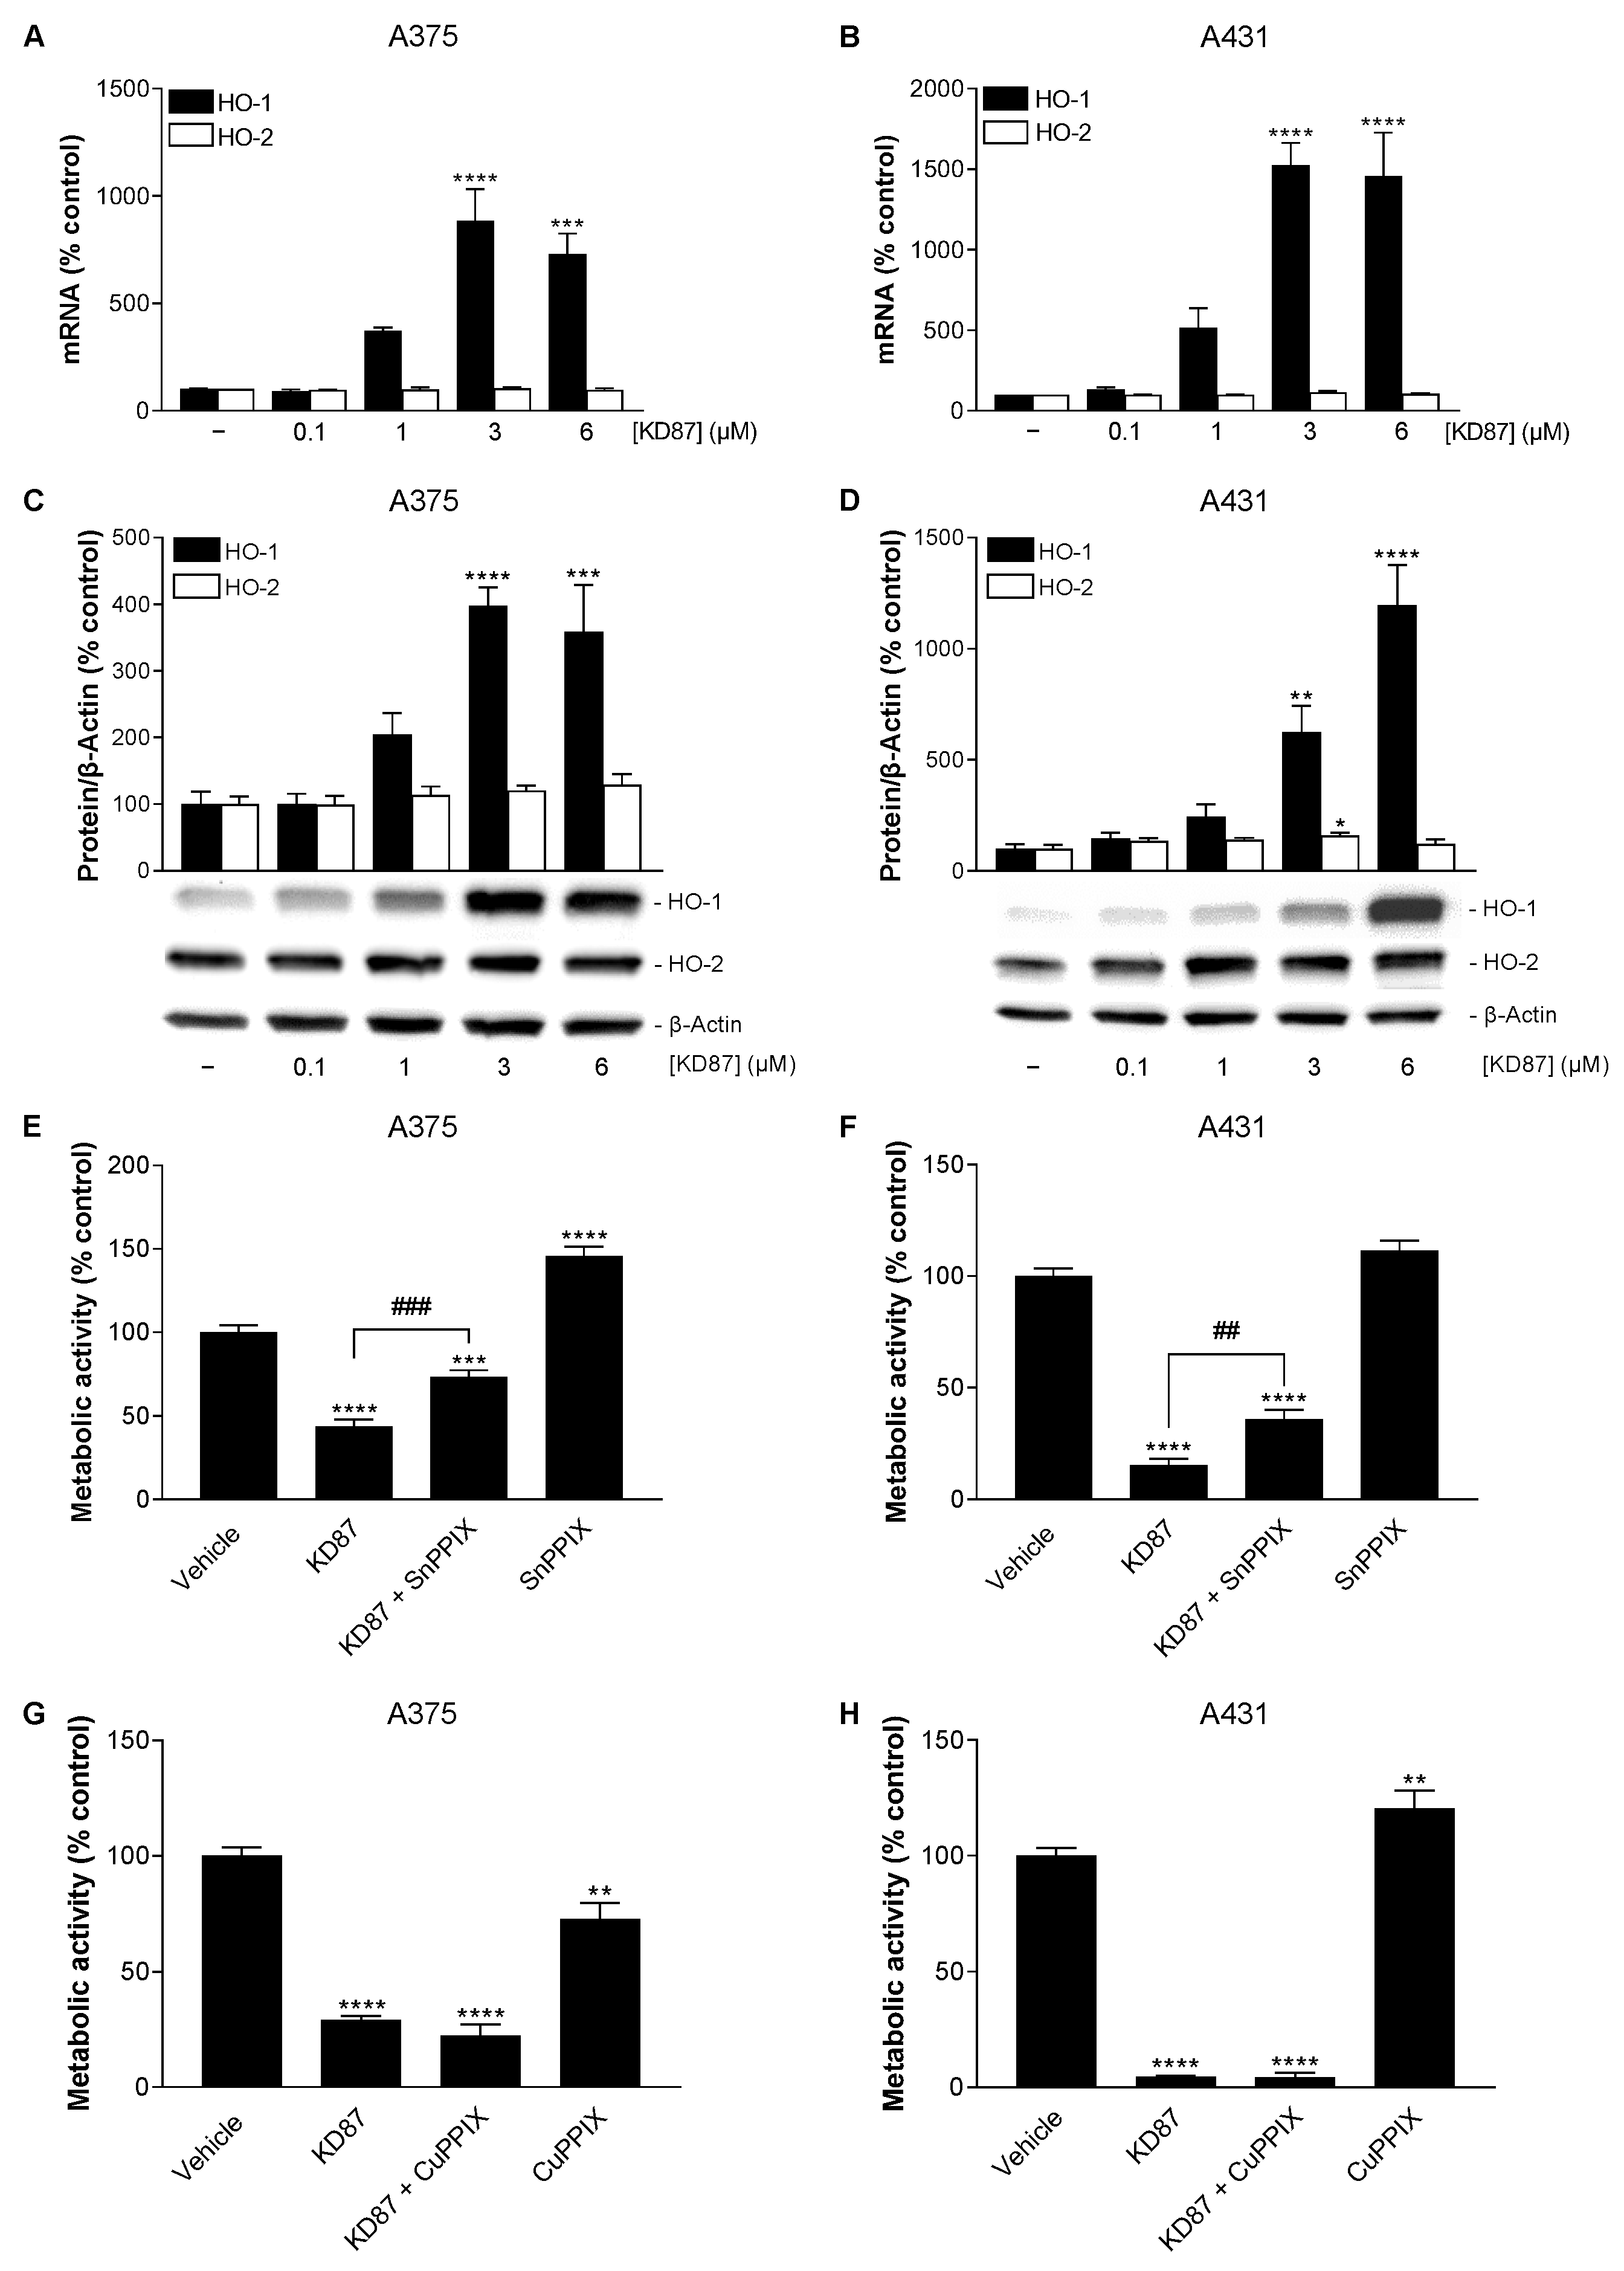
3.7. KD87 Induces HO-1 Expression, Whose Inhibition Leads to a Partial Restoration of the Decreased Metabolic Activity of A375 and A431 Cells Caused by KD87
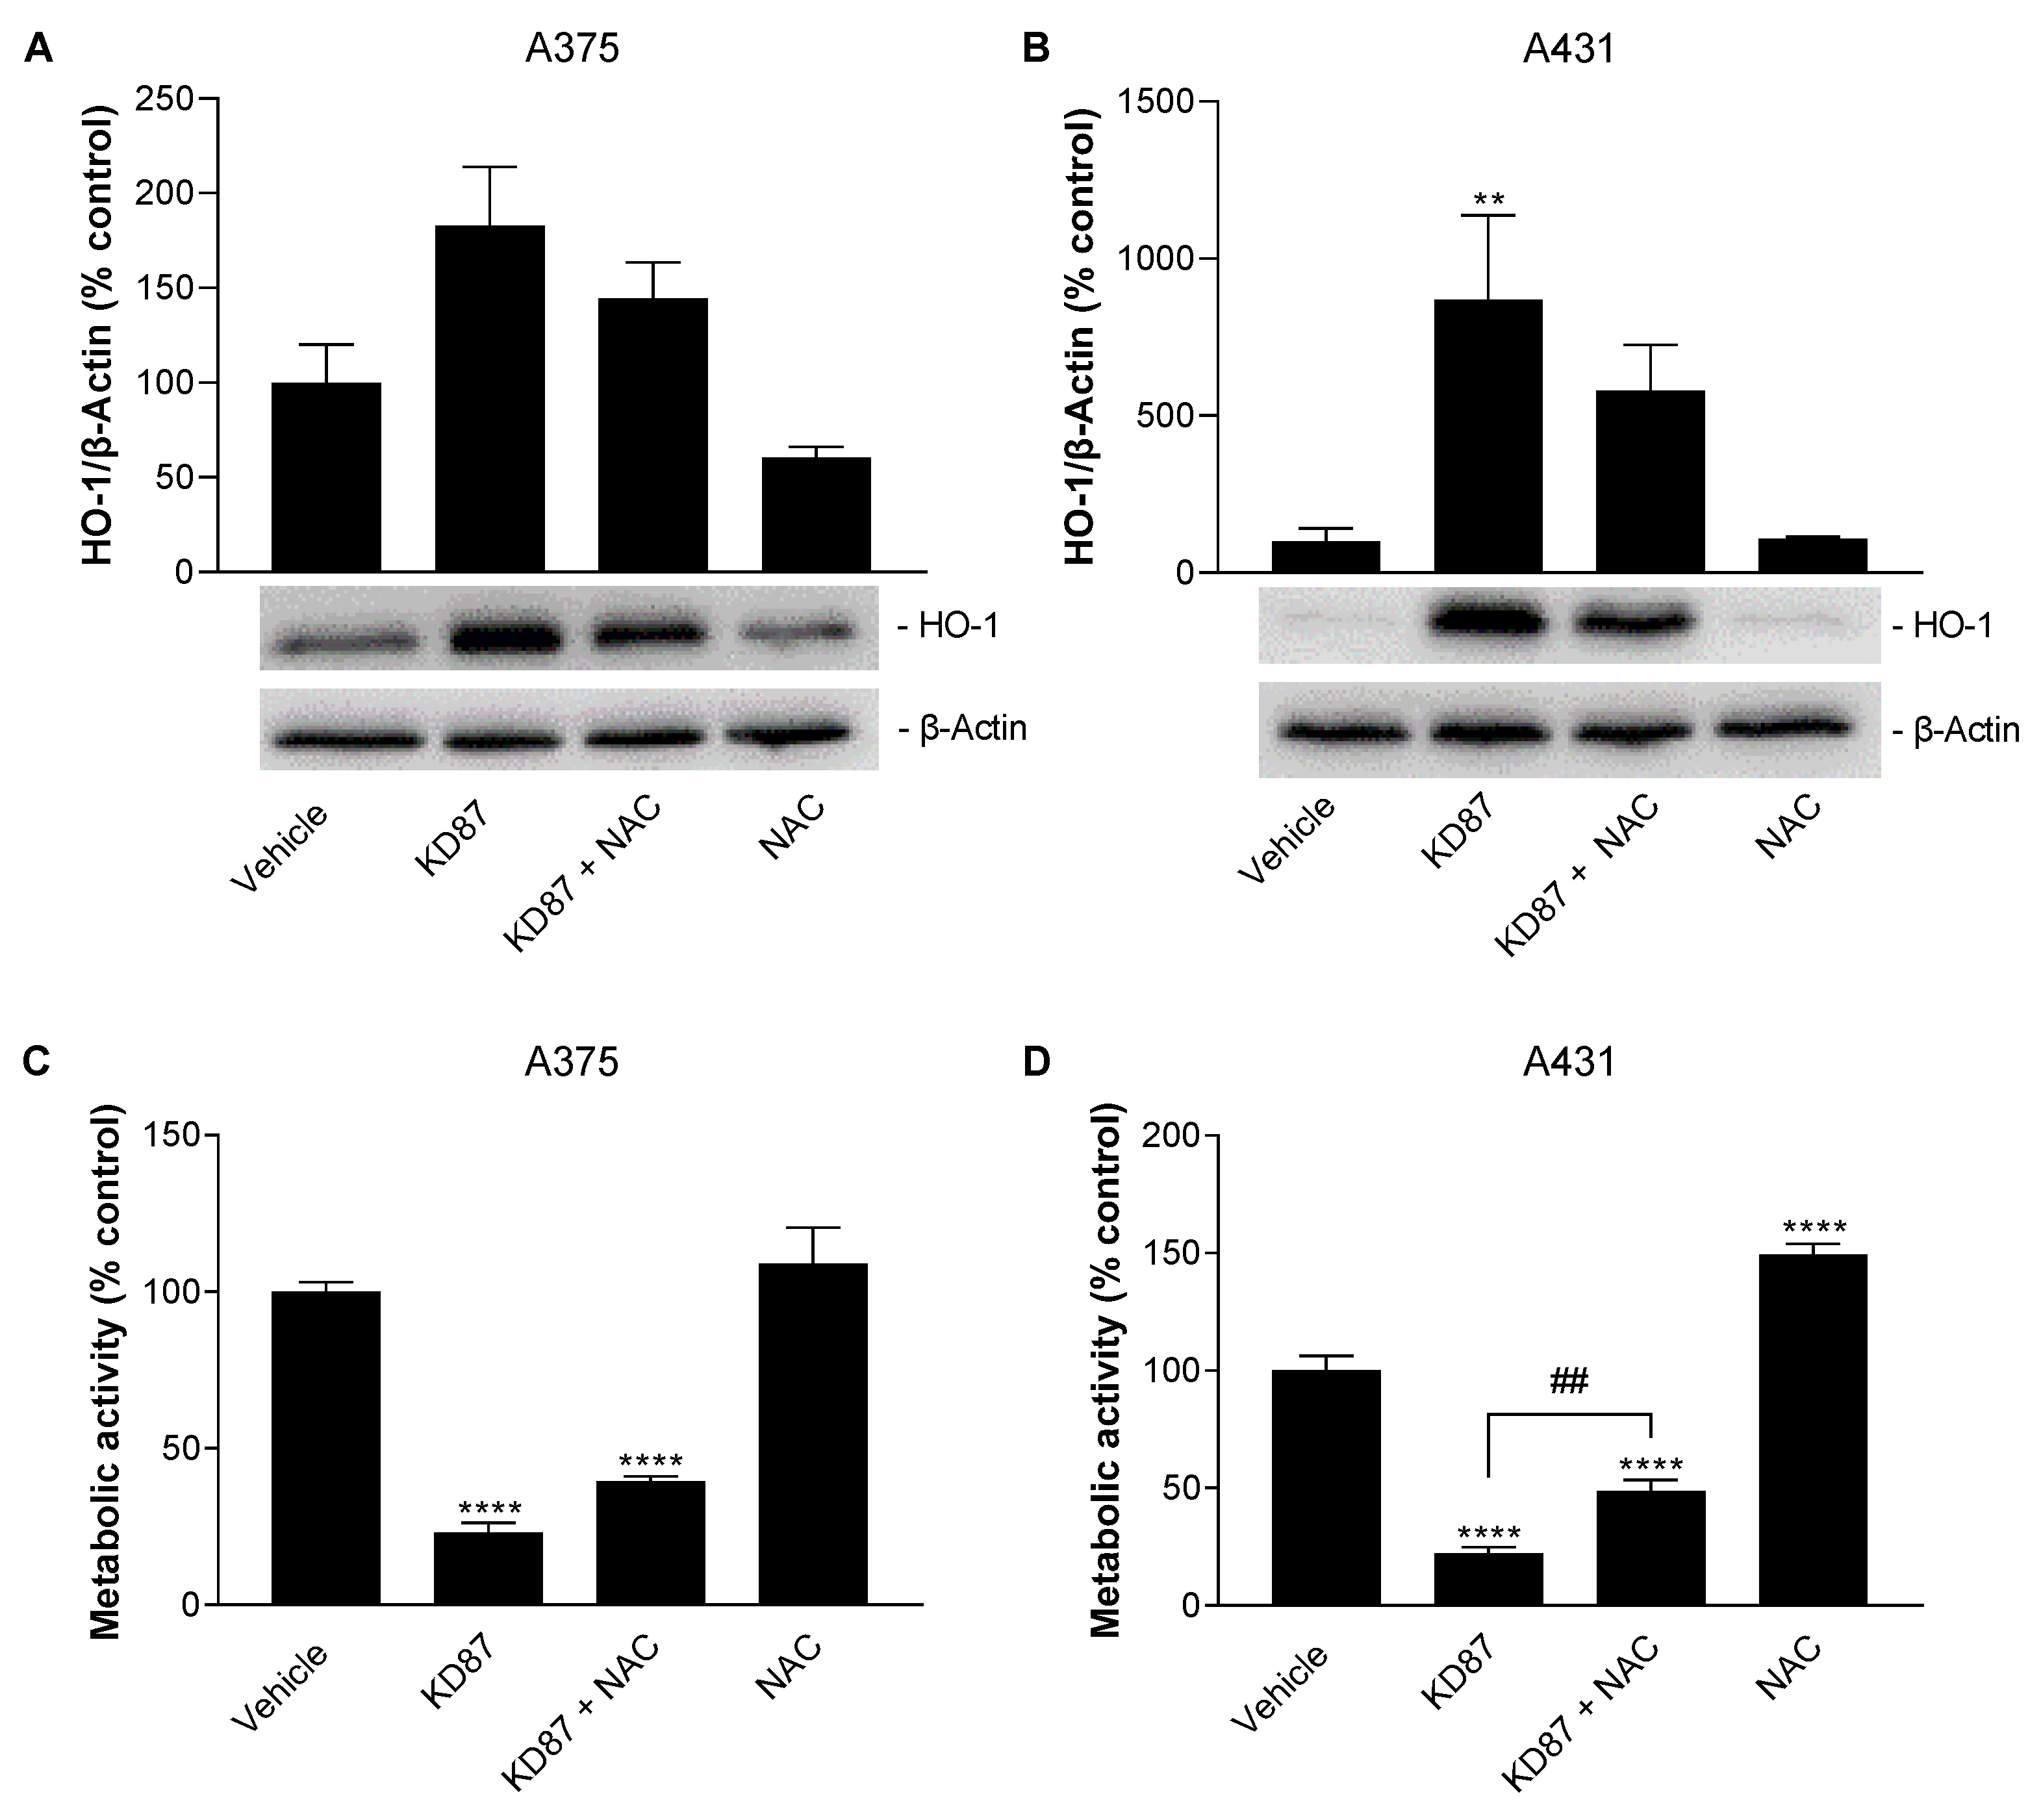
3.8. N-Acetyl-L-Cysteine Attenuates the Metabolic-Activity-Reducing and HO-1-Upregulating Effect of KD87 on A375 and A431 Cells
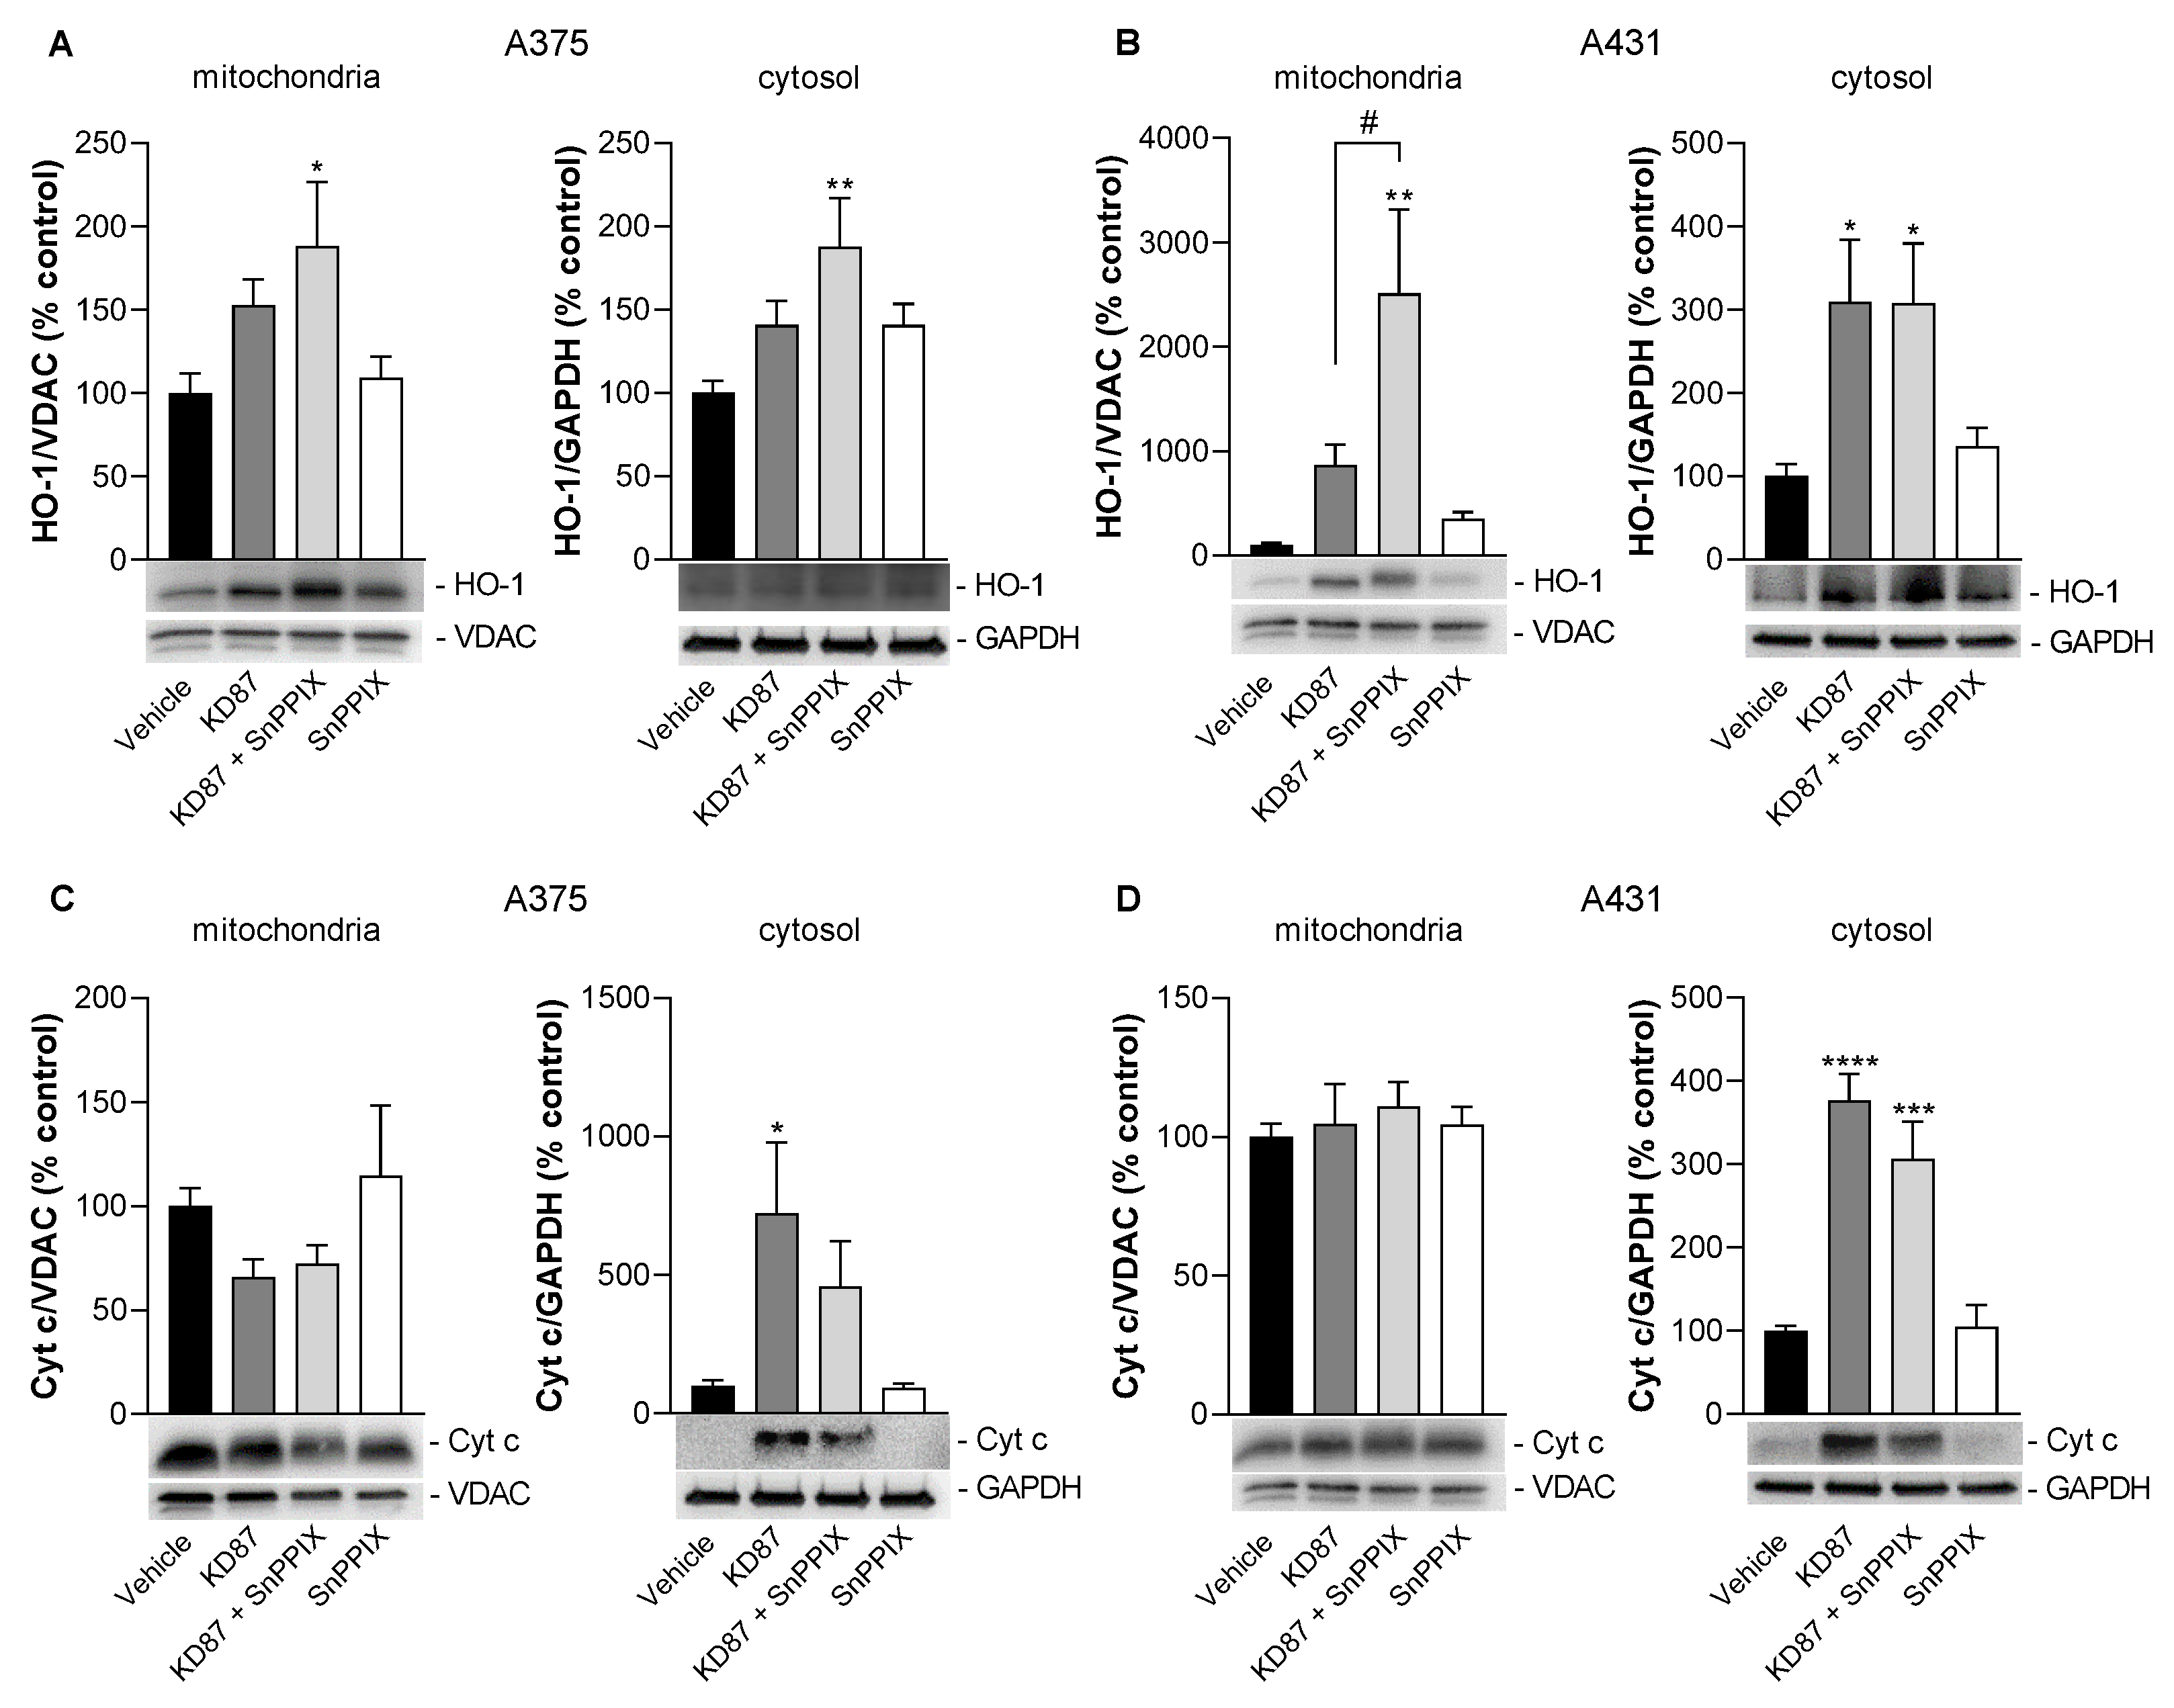
3.9. Inhibition of HO-1 Causes a Partial but Not Significant Inhibition of KD87-Induced Release of Mitochondrial Cytochrome c in A375 and A431 Cells
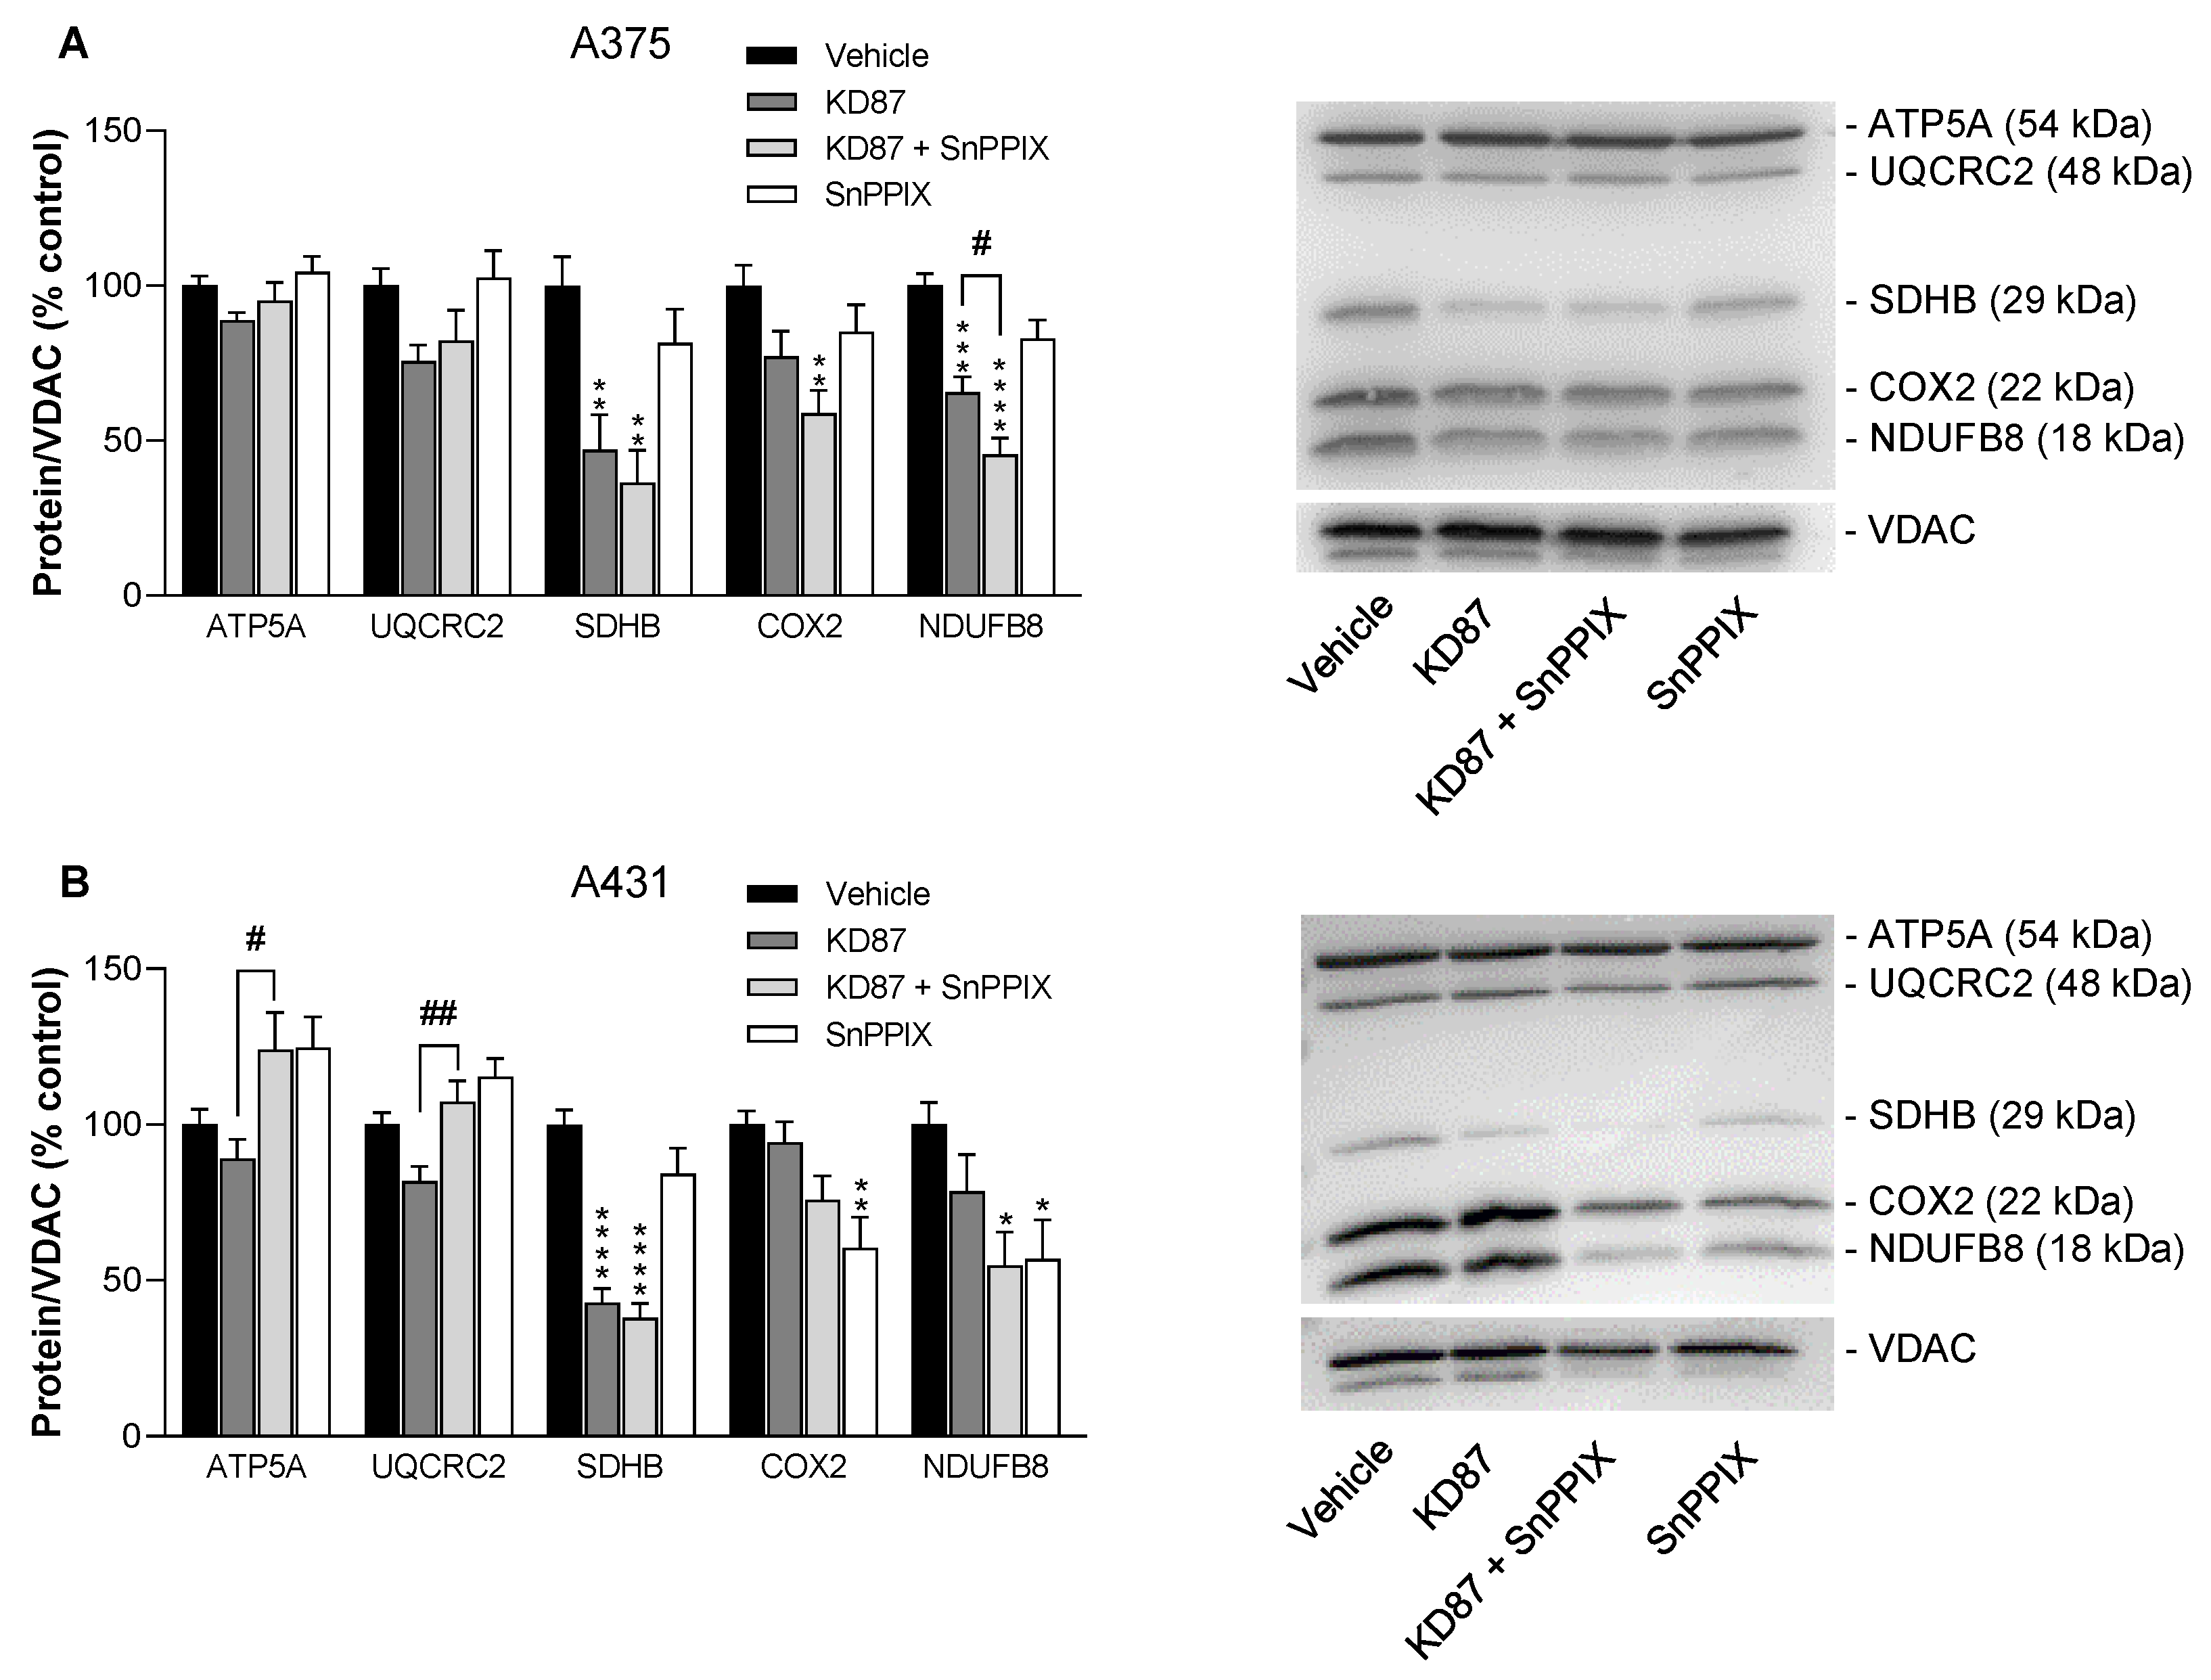
3.10. KD87 Leads to the Downregulation of Certain Subunits of the Respiratory Chain Complex in A375 and A431 Cells
4. Discussion
Supplementary Materials
Author Contributions
Funding
Institutional Review Board Statement
Informed Consent Statement
Data Availability Statement
Acknowledgments
Conflicts of Interest
References
- Eddy, K.; Shah, R.; Chen, S. Decoding Melanoma Development and Progression: Identification of Therapeutic Vulnerabilities. Front. Oncol. 2020, 10, 626129. [Google Scholar] [CrossRef]
- Schäfer, M.; Semmler, M.L.; Bernhardt, T.; Fischer, T.; Kakkassery, V.; Ramer, R.; Hein, M.; Bekeschus, S.; Langer, P.; Hinz, B.; et al. Small Molecules in the Treatment of Squamous Cell Carcinomas: Focus on Indirubins. Cancers 2021, 13, 1770. [Google Scholar] [CrossRef]
- Siegel, R.L.; Miller, K.D.; Fuchs, H.E.; Jemal, A. Cancer Statistics, 2021. CA Cancer J. Clin. 2021, 71, 7–33, Erratum in: CA Cancer J. Clin. 2021, 71, 359. [Google Scholar] [CrossRef]
- Sung, H.; Ferlay, J.; Siegel, R.L.; Laversanne, M.; Soerjomataram, I.; Jemal, A.; Bray, F. Global Cancer Statistics 2020: GLOBOCAN Estimates of Incidence and Mortality Worldwide for 36 Cancers in 185 Countries. CA Cancer J. Clin. 2021, 71, 209–249. [Google Scholar] [CrossRef] [PubMed]
- Ramer, R.; Wendt, F.; Wittig, F.; Schäfer, M.; Boeckmann, L.; Emmert, S.; Hinz, B. Impact of Cannabinoid Compounds on Skin Cancer. Cancers 2022, 14, 1769. [Google Scholar] [CrossRef] [PubMed]
- Cooperative Group of Clinical Therapy of Indirubin. Clinical studies of 314 cases of CML treated with indirubin. Chin. J. Intern. Med. 1980, 1, 132–135. [Google Scholar]
- Xiao, Z.; Hao, Y.; Liu, B.; Qian, L. Indirubin and meisoindigo in the treatment of chronic myelogenous leukemia in China. Leuk. Lymphoma 2002, 43, 1763–1768. [Google Scholar] [CrossRef]
- Eisenbrand, G.; Hippe, F.; Jakobs, S.; Muehlbeyer, S. Molecular mechanisms of indirubin and its derivatives: Novel anticancer molecules with their origin in traditional Chinese phytomedicine. J. Cancer Res. Clin. Oncol. 2004, 130, 627–635. [Google Scholar] [CrossRef]
- Co-operative Group of Phase III CT. Phase III clinical trial on meisoindico in the treatment of chronic myelogenous leukemia. Zhonghua Xue Ye Xue Za Zhi 1997, 18, 69–72. [Google Scholar]
- Xiao, Z.; Qian, L.; Liu, B.; Hao, Y. Meisoindigo for the treatment of chronic myelogenous leukaemia. Br. J. Haematol. 2000, 111, 711–712. [Google Scholar]
- Hoessel, R.; Leclerc, S.; Endicott, J.A.; Nobel, M.E.; Lawrie, A.; Tunnah, P.; Leost, M.; Damiens, E.; Marie, D.; Marko, D.; et al. Indirubin, the active constituent of a Chinese antileukaemia medicine, inhibits cyclin-dependent kinases. Nat. Cell Biol. 1999, 1, 60–67. [Google Scholar] [CrossRef]
- Marko, D.; Schätzle, S.; Friedel, A.; Genzlinger, A.; Zankl, H.; Meijer, L.; Eisenbrand, G. Inhibition of cyclin-dependent kinase 1 (CDK1) by indirubin derivatives in human tumour cells. Br. J. Cancer 2001, 84, 283–289. [Google Scholar] [CrossRef]
- Meijer, L.; Skaltsounis, A.-L.; Magiatis, P.; Polychronopoulos, P.; Knockaert, M.; Leost, M.; Ryan, X.P.; Vonica, C.A.; Brivanlou, A.; Dajani, R.; et al. GSK-3-selective inhibitors derived from Tyrian purple indirubins. Chem. Biol. 2003, 10, 1255–1266. [Google Scholar] [CrossRef]
- Nam, S.; Buettner, R.; Turkson, J.; Kim, D.; Cheng, J.Q.; Muehlbeyer, S.; Hippe, F.; Vatter, S.; Merz, K.-H.; Eisenbrand, G.; et al. Indirubin derivatives inhibit Stat3 signaling and induce apoptosis in human cancer cells. Proc. Natl. Acad. Sci. USA 2005, 102, 5998–6003. [Google Scholar] [CrossRef] [PubMed]
- Zhang, Y.; Du, Z.; Zhuang, Z.; Wang, Y.; Wang, F.; Liu, S.; Wang, H.; Feng, H.; Li, H.; Wang, L.; et al. E804 induces growth arrest, differentiation and apoptosis of glioblastoma cells by blocking Stat3 signaling. J. Neurooncol. 2015, 125, 265–275. [Google Scholar] [CrossRef]
- Maskey, R.P.; Grün-Wollny, I.; Fiebig, H.H.; Laatsch, H. Akashins A, B, and C: Novel Chlorinated Indigoglycosides from Streptomyces sp. GW 48/1497. Angew. Chem. Int. Ed. 2002, 41, 597–599. [Google Scholar] [CrossRef]
- Libnow, S.; Methling, K.; Hein, M.; Michalik, D.; Harms, M.; Wende, K.; Flemming, A.; Köckerling, M.; Reinke, H.; Bednarski, P.J.; et al. Synthesis of indirubin-N′-glycosides and their anti-proliferative activity against human cancer cell lines. Bioorg. Med. Chem. 2008, 16, 5570–5583. [Google Scholar] [CrossRef] [PubMed]
- Kunz, M.; Driller, K.M.; Hein, M.; Libnow, S.; Hohensee, I.; Ramer, R.; Hinz, B.; Berger, A.; Eberle, J.; Langer, P. Synthesis of thia-analogous indirubin N-Glycosides and their influence on melanoma cell growth and apoptosis. ChemMedChem 2010, 5, 534–539. [Google Scholar] [CrossRef]
- Berger, A.; Quast, S.-A.; Plötz, M.; Hein, M.; Kunz, M.; Langer, P.; Eberle, J. Sensitization of melanoma cells for death ligand-induced apoptosis by an indirubin derivative—Enhancement of both extrinsic and intrinsic apoptosis pathways. Biochem. Pharmacol. 2011, 81, 71–81. [Google Scholar] [CrossRef]
- Fischle, A.; Schwarz, R.; Wendt, F.; Kordt, M.; Ramer, R.; Boeckmann, L.; Hein, M.; Langer, P.; Emmert, S.; Vollmar, B.; et al. A Sensitive LC-MS/MS Method for the Simultaneous Determination of Two Thia-Analogous Indirubin N-Glycosides and Indirubin-3′-Monoxime in Plasma and Cell Culture Medium. Molecules 2022, 27, 3031. [Google Scholar] [CrossRef]
- Rebl, H.; Sawade, M.; Hein, M.; Bergemann, C.; Wende, M.; Lalk, M.; Langer, P.; Emmert, S.; Nebe, B. Synergistic effect of plasma-activated medium and novel indirubin derivatives on human skin cancer cells by activation of the AhR pathway. Sci. Rep. 2022, 12, 2528, Erratum in: Sci. Rep. 2022, 12, 4341. [Google Scholar] [CrossRef] [PubMed]
- Kleeblatt, D.; Becker, M.; Plötz, M.; Schönherr, M.; Villinger, A.; Hein, M.; Eberle, J.; Kunz, M.; Rahman, Q.; Langer, P. Synthesis and bioactivity of N-glycosylated 3-(2-oxo-2-arylethylidene)-indolin-2-ones. RSC Adv. 2015, 5, 20769–20782. [Google Scholar] [CrossRef]
- Soltan, M.Y.; Sumarni, U.; Assaf, C.; Langer, P.; Reidel, U.; Eberle, J. Key Role of Reactive Oxygen Species (ROS) in Indirubin Derivative-Induced Cell Death in Cutaneous T-Cell Lymphoma Cells. Int. J. Mol. Sci. 2019, 20, 1158. [Google Scholar] [CrossRef]
- Zhivkova, V.; Kiecker, F.; Langer, P.; Eberle, J. Crucial role of reactive oxygen species (ROS) for the proapoptotic effects of indirubin derivative DKP-073 in melanoma cells. Mol. Carcinog. 2019, 58, 258–269. [Google Scholar] [CrossRef] [PubMed]
- MacDonald, M.L.; Lamerdin, J.; Owens, S.; Keon, B.H.; Bilter, G.K.; Shang, Z.; Huang, Z.; Yu, H.; Dias, J.; Minami, T.; et al. Identifying off-target effects and hidden phenotypes of drugs in human cells. Nat. Chem. Biol. 2006, 2, 329–337. [Google Scholar] [CrossRef]
- Song, J.H.; Lee, J.-E.; Cho, K.-M.; Park, S.-H.; Kim, H.-J.; Kim, Y.-C.; Kim, T.S. 5-diphenylacetamido-indirubin-3′-oxime as a novel mitochondria-targeting agent with anti-leukemic activities. Mol. Carcinog. 2016, 55, 611–621. [Google Scholar] [CrossRef]
- Prüser, J.L.; Ramer, R.; Wittig, F.; Ivanov, I.; Merkord, J.; Hinz, B. The Monoacylglycerol Lipase Inhibitor JZL184 Inhibits Lung Cancer Cell Invasion and Metastasis via the CB1 Cannabinoid Receptor. Mol. Cancer Ther. 2021, 20, 787–802. [Google Scholar] [CrossRef]
- Puck, T.T.; Marcus, P.I. Action of x-rays on mammalian cells. J. Exp. Med. 1956, 103, 653–666. [Google Scholar] [CrossRef]
- Franken, N.A.; Rodermond, H.M.; Stap, J.; Haveman, J.; van Bree, C. Clonogenic assay of cells in vitro. Nat. Protoc. 2006, 1, 2315–2319. [Google Scholar] [CrossRef]
- Schummer, P.; Schilling, B.; Gesierich, A. Long-Term Outcomes in BRAF-Mutated Melanoma Treated with Combined Targeted Therapy or Immune Checkpoint Blockade: Are We Approaching a True Cure? Am. J. Clin. Dermatol. 2020, 21, 493–504. [Google Scholar] [CrossRef]
- Ramer, R.; Hinz, B. Inhibition of cancer cell invasion by cannabinoids via increased expression of tissue inhibitor of matrix metalloproteinases-1. J. Natl. Cancer Inst. 2008, 100, 59–69. [Google Scholar] [CrossRef]
- Ramer, R.; Merkord, J.; Rohde, H.; Hinz, B. Cannabidiol inhibits cancer cell invasion via upregulation of tissue inhibitor of matrix metalloproteinases-1. Biochem. Pharmacol. 2010, 79, 955–966. [Google Scholar] [CrossRef] [PubMed]
- Ramer, R.; Bublitz, K.; Freimuth, N.; Merkord, J.; Rohde, H.; Haustein, M.; Borchert, P.; Schmuhl, E.; Linnebacher, M.; Hinz, B. Cannabidiol inhibits lung cancer cell invasion and metastasis via intercellular adhesion molecule-1. FASEB J. 2012, 26, 1535–1548. [Google Scholar] [CrossRef] [PubMed]
- Winkler, K.; Ramer, R.; Dithmer, S.; Ivanov, I.; Merkord, J.; Hinz, B. Fatty acid amide hydrolase inhibitors confer anti-invasive and antimetastatic effects on lung cancer cells. Oncotarget 2016, 7, 15047–15064. [Google Scholar] [CrossRef]
- Converso, D.P.; Taillé, C.; Carreras, M.C.; Jaitovich, A.; Poderoso, J.J.; Boczkowski, J. HO-1 is located in liver mitochondria and modulates mitochondrial heme content and metabolism. FASEB J. 2006, 20, 1236–1238. [Google Scholar] [CrossRef]
- Suliman, H.B.; Carraway, M.S.; Ali, A.S.; Reynolds, C.M.; Welty-Wolf, K.E.; Piantadosi, C.A. The CO/HO system reverses inhibition of mitochondrial biogenesis and prevents murine doxorubicin cardiomyopathy. J. Clin. Investig. 2007, 117, 3730–3741. [Google Scholar] [CrossRef] [PubMed]
- Bolisetty, S.; Traylor, A.; Zarjou, A.; Johnson, M.S.; Benavides, G.A.; Ricart, K.; Boddu, R.; Moore, R.D.; Landar, A.; Barnes, S.; et al. Mitochondria-targeted heme oxygenase-1 decreases oxidative stress in renal epithelial cells. Am. J. Physiol. Ren. Physiol. 2013, 305, F255–F264. [Google Scholar] [CrossRef] [PubMed]
- Rayamajhi, N.; Kim, S.-K.; Go, H.; Joe, Y.; Callaway, Z.; Kang, J.-G.; Ryter, S.W.; Chung, H.T. Quercetin induces mitochondrial biogenesis through activation of HO-1 in HepG2 cells. Oxid. Med. Cell. Longev. 2013, 2013, 154279. [Google Scholar] [CrossRef]
- Bansal, S.; Biswas, G.; Avadhani, N.G. Mitochondria-targeted heme oxygenase-1 induces oxidative stress and mitochondrial dysfunction in macrophages, kidney fibroblasts and in chronic alcohol hepatotoxicity. Redox Biol. 2014, 2, 273–283. [Google Scholar] [CrossRef]
- Hull, T.D.; Boddu, R.; Guo, L.; Tisher, C.C.; Traylor, A.M.; Patel, B.; Joseph, R.; Prabhu, S.D.; Suliman, H.B.; Piantadosi, C.A.; et al. Heme oxygenase-1 regulates mitochondrial quality control in the heart. JCI Insight 2016, 1, e85817. [Google Scholar] [CrossRef]
- Meyer, N.; Zielke, S.; Michaelis, J.B.; Linder, B.; Warnsmann, V.; Rakel, S.; Osiewacz, H.D.; Fulda, S.; Mittelbronn, M.; Münch, C.; et al. AT 101 induces early mitochondrial dysfunction and HMOX1 (heme oxygenase 1) to trigger mitophagic cell death in glioma cells. Autophagy 2018, 14, 1693–1709. [Google Scholar] [CrossRef]
- Wu, M.-S.; Chien, C.-C.; Chang, J.; Chen, Y.-C. Pro-apoptotic effect of haem oxygenase-1 in human colorectal carcinoma cells via endoplasmic reticular stress. J. Cell. Mol. Med. 2019, 23, 5692–5704. [Google Scholar] [CrossRef] [PubMed]
- Chien, M.-H.; Yang, W.-E.; Yang, Y.-C.; Ku, C.-C.; Lee, W.-J.; Tsai, M.-Y.; Lin, C.-W.; Yang, S.-F. Dual Targeting of the p38 MAPK-HO-1 Axis and cIAP1/XIAP by Demethoxycurcumin Triggers Caspase-Mediated Apoptotic Cell Death in Oral Squamous Cell Carcinoma Cells. Cancers 2020, 12, 703. [Google Scholar] [CrossRef] [PubMed]
- Hsieh, M.-J.; Lin, C.-C.; Lo, Y.-S.; Chuang, Y.-C.; Ho, H.-Y.; Chen, M.-K. Chrysosplenol D Triggers Apoptosis through Heme Oxygenase-1 and Mitogen-Activated Protein Kinase Signaling in Oral Squamous Cell Carcinoma. Cancers 2021, 13, 4327. [Google Scholar] [CrossRef] [PubMed]
- Liang, M.; Croatt, A.J.; Nath, K.A. Mechanisms underlying induction of heme oxygenase-1 by nitric oxide in renal tubular epithelial cells. Am. J. Physiol. Ren. Physiol. 2000, 279, F728–F735. [Google Scholar] [CrossRef]
- Chang, S.-H.; Garcia, J.; Melendez, J.A.; Kilberg, M.S.; Agarwal, A. Haem oxygenase 1 gene induction by glucose deprivation is mediated by reactive oxygen species via the mitochondrial electron-transport chain. Biochem. J. 2003, 371, 877–885. [Google Scholar] [CrossRef]
- Schwartz, M.; Böckmann, S.; Hinz, B. Up-regulation of heme oxygenase-1 expression and inhibition of disease-associated features by cannabidiol in vascular smooth muscle cells. Oncotarget 2018, 9, 34595–34616. [Google Scholar] [CrossRef]
- Böckmann, S.; Hinz, B. Cannabidiol Promotes Endothelial Cell Survival by Heme Oxygenase-1-Mediated Autophagy. Cells 2020, 9, 1703. [Google Scholar] [CrossRef]
- Sardana, M.K.; Kappas, A. Dual control mechanism for heme oxygenase: Tin(IV)-protoporphyrin potently inhibits enzyme activity while markedly increasing content of enzyme protein in liver. Proc. Natl. Acad. Sci. USA 1987, 84, 2464–2468. [Google Scholar] [CrossRef]
- Chang, T.; Wu, L.; Wang, R. Inhibition of vascular smooth muscle cell proliferation by chronic hemin treatment. Am. J. Physiol. Heart Circ. Physiol. 2008, 295, H999–H1007. [Google Scholar] [CrossRef]
- Ichimaru, Y.; Sano, M.; Kajiwara, I.; Tobe, T.; Yoshioka, H.; Hayashi, K.; Ijichi, H.; Miyairi, S. Indirubin 3′-Oxime Inhibits Migration, Invasion, and Metastasis InVivo in Mice Bearing Spontaneously Occurring Pancreatic Cancer via Blocking the RAF/ERK, AKT, and SAPK/JNK Pathways. Transl. Oncol. 2019, 12, 1574–1582. [Google Scholar] [CrossRef]
- Lo, W.Y.; Chang, N.W. An indirubin derivative, indirubin-3′-monoxime suppresses oral cancer tumorigenesis through the downregulation of survivin. PLoS ONE 2013, 8, e70198. [Google Scholar] [CrossRef] [PubMed]
- Liu, K.; Li, J.; Wu, X.; Chen, M.; Luo, F.; Li, J. GSK-3β inhibitor 6-bromo-indirubin-3′-oxime promotes both adhesive activity and drug resistance in colorectal cancer cells. Int. J. Oncol. 2017, 51, 1821–1830. [Google Scholar] [CrossRef]
- Braig, S.; Kressirer, C.A.; Liebl, J.; Bischoff, F.; Zahler, S.; Meijer, L.; Vollmar, A.M. Indirubin derivative 6BIO suppresses metastasis. Cancer Res. 2013, 73, 6004–6012. [Google Scholar] [CrossRef] [PubMed]
- Moon, M.J.; Lee, S.K.; Lee, J.-W.; Song, W.K.; Kim, S.W.; Kim, J.I.; Cho, C.; Choi, S.J.; Kim, Y.-C. Synthesis and structure-activity relationships of novel indirubin derivatives as potent anti-proliferative agents with CDK2 inhibitory activities. Bioorg. Med. Chem. 2006, 14, 237–246. [Google Scholar] [CrossRef] [PubMed]
- Zheng, Q.T.; Qi, S.B.; Cheng, Z.Y. Pharmacological studies of indirubin. Absorption, distribution and excretion of 3H-indirubin. Comm. Chin. Herb. Med. 1979, 10, 19–21. [Google Scholar]
- Chiang, S.-K.; Chen, S.-E.; Chang, L.-C. The Role of HO-1 and Its Crosstalk with Oxidative Stress in Cancer Cell Survival. Cells 2021, 10, 2401. [Google Scholar] [CrossRef] [PubMed]
- Mascaró, M.; Alonso, E.N.; Alonso, E.G.; Lacunza, E.; Curino, A.C.; Facchinetti, M.M. Nuclear Localization of Heme Oxygenase-1 in Pathophysiological Conditions: Does It Explain the Dual Role in Cancer? Antioxidants 2021, 10, 87. [Google Scholar] [CrossRef]
- Slebos, D.-J.; Ryter, S.W.; van der Toorn, M.; Liu, F.; Guo, F.; Baty, C.J.; Karlsson, J.M.; Watkins, S.C.; Kim, H.P.; Wang, X.; et al. Mitochondrial localization and function of heme oxygenase-1 in cigarette smoke-induced cell death. Am. J. Respir. Cell Mol. Biol. 2007, 36, 409–417. [Google Scholar] [CrossRef]
- Zhang, L.; Zhang, J.; Ye, Z.; Manevich, Y.; Ball, L.E.; Bethard, J.R.; Jiang, Y.-L.; Broome, A.-M.; Dalton, A.C.; Wang, G.Y.; et al. Isoflavone ME-344 Disrupts Redox Homeostasis and Mitochondrial Function by Targeting Heme Oxygenase 1. Cancer Res. 2019, 79, 4072–4085. [Google Scholar] [CrossRef]
- Chang, L.-C.; Chiang, S.-K.; Chen, S.-E.; Yu, Y.-L.; Chou, R.-H.; Chang, W.-C. Heme oxygenase-1 mediates BAY 11-7085 induced ferroptosis. Cancer Lett. 2018, 416, 124–137. [Google Scholar] [CrossRef]
- Chen, Y.-T.; Lin, C.-W.; Su, C.-W.; Yang, W.-E.; Chuang, C.-Y.; Su, S.-C.; Hsieh, M.-J.; Yang, S.-F. Magnolol Triggers Caspase-Mediated Apoptotic Cell Death in Human Oral Cancer Cells through JNK1/2 and p38 Pathways. Biomedicines 2021, 9, 1295. [Google Scholar] [CrossRef] [PubMed]
- Su, C.-W.; Chuang, C.-Y.; Chen, Y.-T.; Yang, W.-E.; Pan, Y.-P.; Lin, C.-W.; Yang, S.-F. FLLL32 Triggers Caspase-Mediated Apoptotic Cell Death in Human Oral Cancer Cells by Regulating the p38 Pathway. Int. J. Mol. Sci. 2021, 22, 11860. [Google Scholar] [CrossRef] [PubMed]
- Chuang, C.-Y.; Lin, C.-W.; Su, C.-W.; Chen, Y.-T.; Yang, W.-E.; Yang, S.-F.; Su, S.-C. Deoxyshikonin Mediates Heme Oxygenase-1 Induction and Apoptotic Response via p38 Signaling in Tongue Cancer Cell Lines. Int. J. Mol. Sci. 2022, 23, 7115. [Google Scholar] [CrossRef]
- Nitti, M.; Piras, S.; Marinari, U.M.; Moretta, L.; Pronzato, M.A.; Furfaro, A.L. HO-1 Induction in Cancer Progression: A Matter of Cell Adaptation. Antioxidants 2017, 6, 29. [Google Scholar] [CrossRef]
- Chiang, S.-K.; Chen, S.-E.; Chang, L.-C. A Dual Role of Heme Oxygenase-1 in Cancer Cells. Int. J. Mol. Sci. 2018, 20, 39. [Google Scholar] [CrossRef] [PubMed]
- Sunamura, M.; Duda, D.G.; Ghattas, M.H.; Lozonschi, L.; Motoi, F.; Yamauchi, J.-I.; Matsuno, S.; Shibahara, S.; Abraham, N.G. Heme oxygenase-1 accelerates tumor angiogenesis of human pancreatic cancer. Angiogenesis 2003, 6, 15–24. [Google Scholar] [CrossRef]
- Suliman, H.B.; Piantadosi, C.A. Mitochondrial Quality Control as a Therapeutic Target. Pharmacol. Rev. 2016, 68, 20–48. [Google Scholar] [CrossRef] [PubMed]
- George, V.C.; Naveen Kumar, D.R.; Suresh, P.K.; Kumar, S.; Kumar, R.A. Comparative studies to evaluate relative in vitro potency of luteolin in inducing cell cycle arrest and apoptosis in HaCaT and A375 cells. Asian Pac. J. Cancer Prev. 2013, 14, 631–637. [Google Scholar] [CrossRef]
- Mantso, T.; Trafalis, D.T.; Botaitis, S.; Franco, R.; Pappa, A.; Rupasinghe, H.P.V.; Panayiotidis, M.I. Novel Docosahexaenoic Acid Ester of Phloridzin Inhibits Proliferation and Triggers Apoptosis in an In Vitro Model of Skin Cancer. Antioxidants 2018, 7, 188. [Google Scholar] [CrossRef]
- Olivan-Viguera, A.; Garcia-Otin, A.L.; Lozano-Gerona, J.; Abarca-Lachen, E.; Garcia-Malinis, A.J.; Hamilton, K.L.; Gilaberte, Y.; Pueyo, E.; Köhler, R. Pharmacological activation of TRPV4 produces immediate cell damage and induction of apoptosis in human melanoma cells and HaCaT keratinocytes. PLoS ONE 2018, 13, e0190307. [Google Scholar] [CrossRef] [PubMed]
- Liu, S.G.; Luo, G.P.; Qu, Y.B.; Chen, Y.F. Indirubin inhibits Wnt/β-catenin signal pathway via promoter demethylation of WIF-1. BMC Complement. Med. Ther. 2020, 20, 250. [Google Scholar] [CrossRef] [PubMed]
- Nguyen, L.T.H.; Oh, T.-W.; Choi, M.-J.; Yang, I.-J.; Shin, H.-M. Anti-Psoriatic Effects and IL-22 Targeting Mechanism of Indirubin by Suppressing Keratinocyte Inflammation and Proliferation. Appl. Sci. 2021, 11, 11599. [Google Scholar] [CrossRef]
- Clemen, R.; Heirman, P.; Lin, A.; Bogaerts, A.; Bekeschus, S. Physical Plasma-Treated Skin Cancer Cells Amplify Tumor Cytotoxicity of Human Natural Killer (NK) Cells. Cancers 2020, 12, 3575. [Google Scholar] [CrossRef]
- Li, H.; Liu, L.; Zhuang, J.; Liu, C.; Zhou, C.; Yang, J.; Gao, C.; Liu, G.; Sun, C. Deciphering the mechanism of Indirubin and its derivatives in the inhibition of Imatinib resistance using a “drug target prediction-gene microarray analysis-protein network construction” strategy. BMC Complement. Altern. Med. 2019, 19, 75. [Google Scholar] [CrossRef] [PubMed]
- Baas, J.; Bieringer, S.; Frias, C.; Frias, J.; Soehnchen, C.; Urmann, C.; Ritter, S.; Riepl, H.; Prokop, A. Dihydroxyquingdainone Induces Apoptosis in Leukaemia and Lymphoma Cells via the Mitochondrial Pathway in a Bcl-2- and Caspase-3-Dependent Manner and Overcomes Resistance to Cytostatic Drugs In Vitro. Molecules 2022, 27, 5038. [Google Scholar] [CrossRef]
- Yu, Z.; Wei, X.; Liu, L.; Sun, H.; Fang, T.; Wang, L.; Li, Y.; Sui, W.; Wang, K.; He, Y.; et al. Indirubin-3′-monoxime acts as proteasome inhibitor: Therapeutic application in multiple myeloma. EBioMedicine 2022, 78, 103950. [Google Scholar] [CrossRef]


Disclaimer/Publisher’s Note: The statements, opinions and data contained in all publications are solely those of the individual author(s) and contributor(s) and not of MDPI and/or the editor(s). MDPI and/or the editor(s) disclaim responsibility for any injury to people or property resulting from any ideas, methods, instructions or products referred to in the content. |
© 2023 by the authors. Licensee MDPI, Basel, Switzerland. This article is an open access article distributed under the terms and conditions of the Creative Commons Attribution (CC BY) license (https://creativecommons.org/licenses/by/4.0/).
Share and Cite
Wendt, F.; Wittig, F.; Rupprecht, A.; Ramer, R.; Langer, P.; Emmert, S.; Frank, M.; Hinz, B. A Thia-Analogous Indirubin N-Glycoside Disrupts Mitochondrial Function and Causes the Death of Human Melanoma and Cutaneous Squamous Cell Carcinoma Cells. Cells 2023, 12, 2409. https://doi.org/10.3390/cells12192409
Wendt F, Wittig F, Rupprecht A, Ramer R, Langer P, Emmert S, Frank M, Hinz B. A Thia-Analogous Indirubin N-Glycoside Disrupts Mitochondrial Function and Causes the Death of Human Melanoma and Cutaneous Squamous Cell Carcinoma Cells. Cells. 2023; 12(19):2409. https://doi.org/10.3390/cells12192409
Chicago/Turabian StyleWendt, Franziska, Felix Wittig, Anne Rupprecht, Robert Ramer, Peter Langer, Steffen Emmert, Marcus Frank, and Burkhard Hinz. 2023. "A Thia-Analogous Indirubin N-Glycoside Disrupts Mitochondrial Function and Causes the Death of Human Melanoma and Cutaneous Squamous Cell Carcinoma Cells" Cells 12, no. 19: 2409. https://doi.org/10.3390/cells12192409
APA StyleWendt, F., Wittig, F., Rupprecht, A., Ramer, R., Langer, P., Emmert, S., Frank, M., & Hinz, B. (2023). A Thia-Analogous Indirubin N-Glycoside Disrupts Mitochondrial Function and Causes the Death of Human Melanoma and Cutaneous Squamous Cell Carcinoma Cells. Cells, 12(19), 2409. https://doi.org/10.3390/cells12192409