
Schwann Cells Promote Myogenic Differentiation of Myoblasts and Adipogenic Mesenchymal Stromal Cells on Poly-ɛ-Caprolactone-Collagen I-Nanofibers

 ,
,  , ,
, ,  and
and 
Abstract
: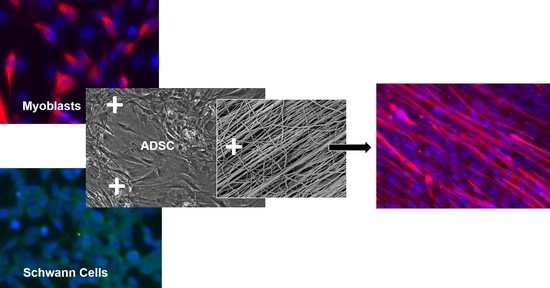
1. Introduction
2. Materials and Methods
2.1. Cell Isolation and Culture
2.2. 2D Myogenic Differentiation of Mb/ADSC and Mb/ADSC/SC
2.3. Electrospinning of PCL-Collagen I-Nanofibers and 3D Cell Seeding
2.4. RNA Isolation and Quantitative PCR Analysis
2.5. Cell Viability on PCL-Collagen I-Nanoscaffolds
2.6. Immunofluorescence
2.7. Statistical Analysis
3. Results
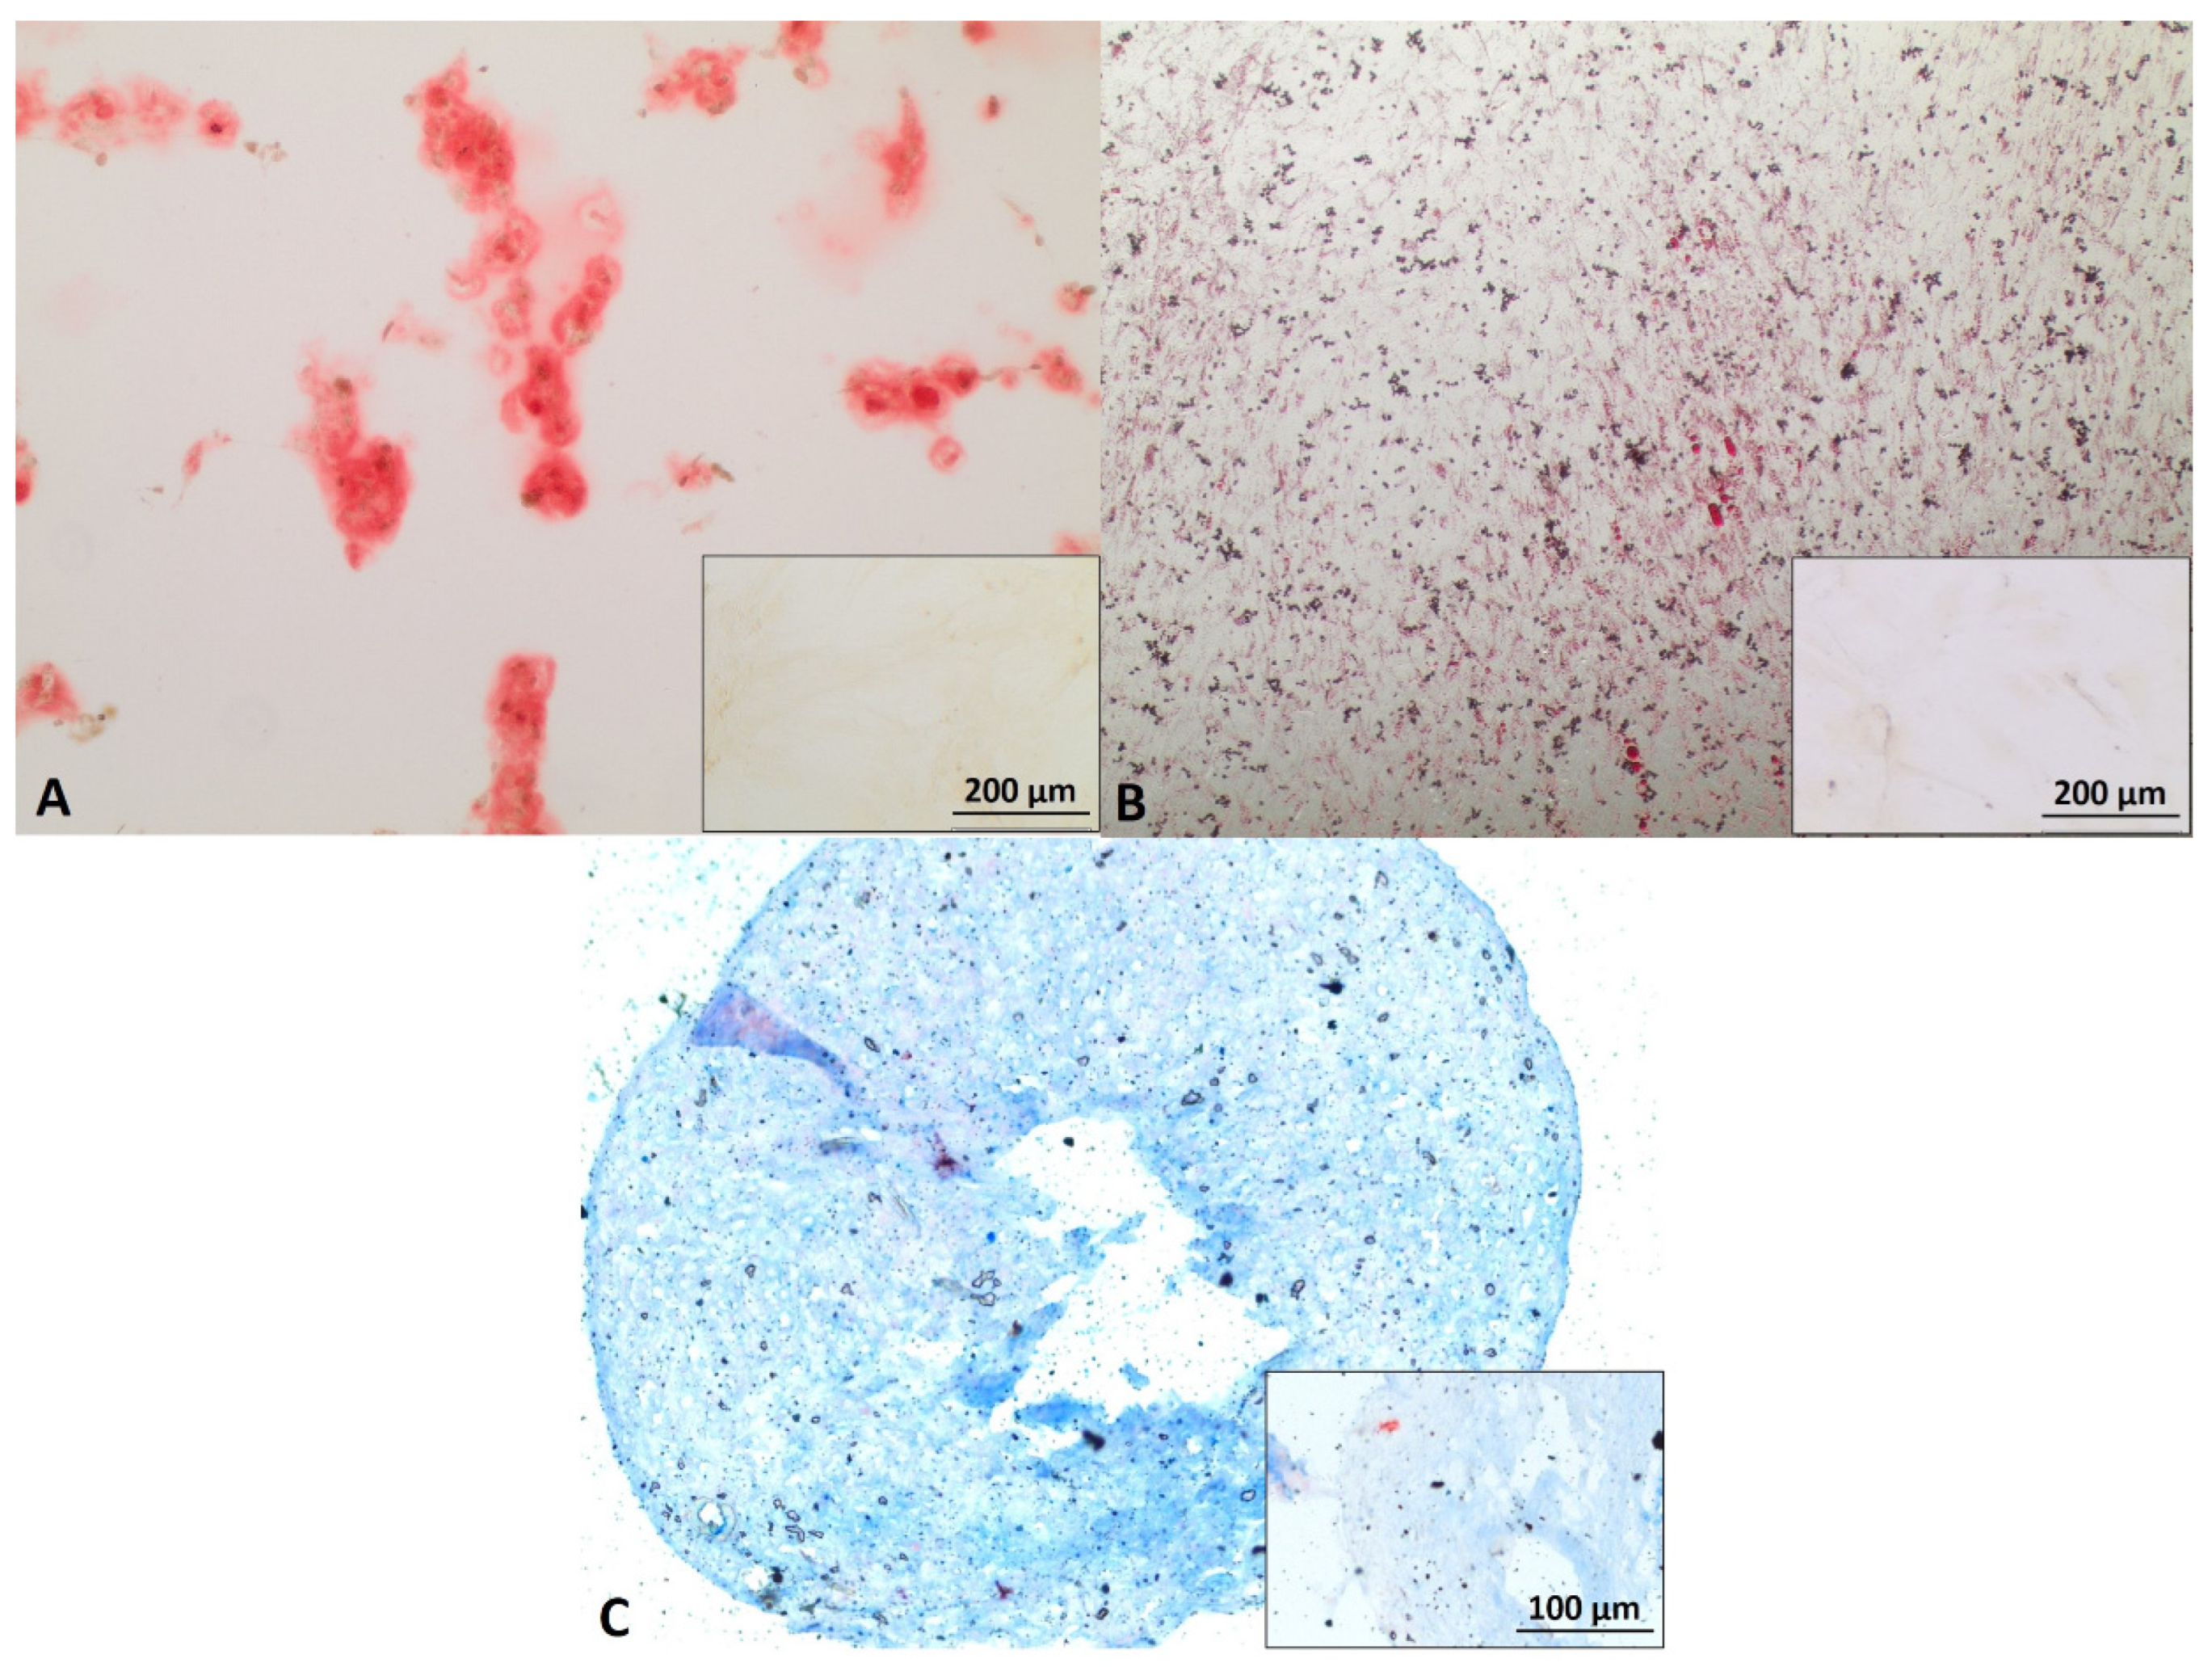
3.1. Myoblast, ADSC, and Schwann Cell Characterization
3.2. Optimal Cell Ratio of Mb/ADSC/SC
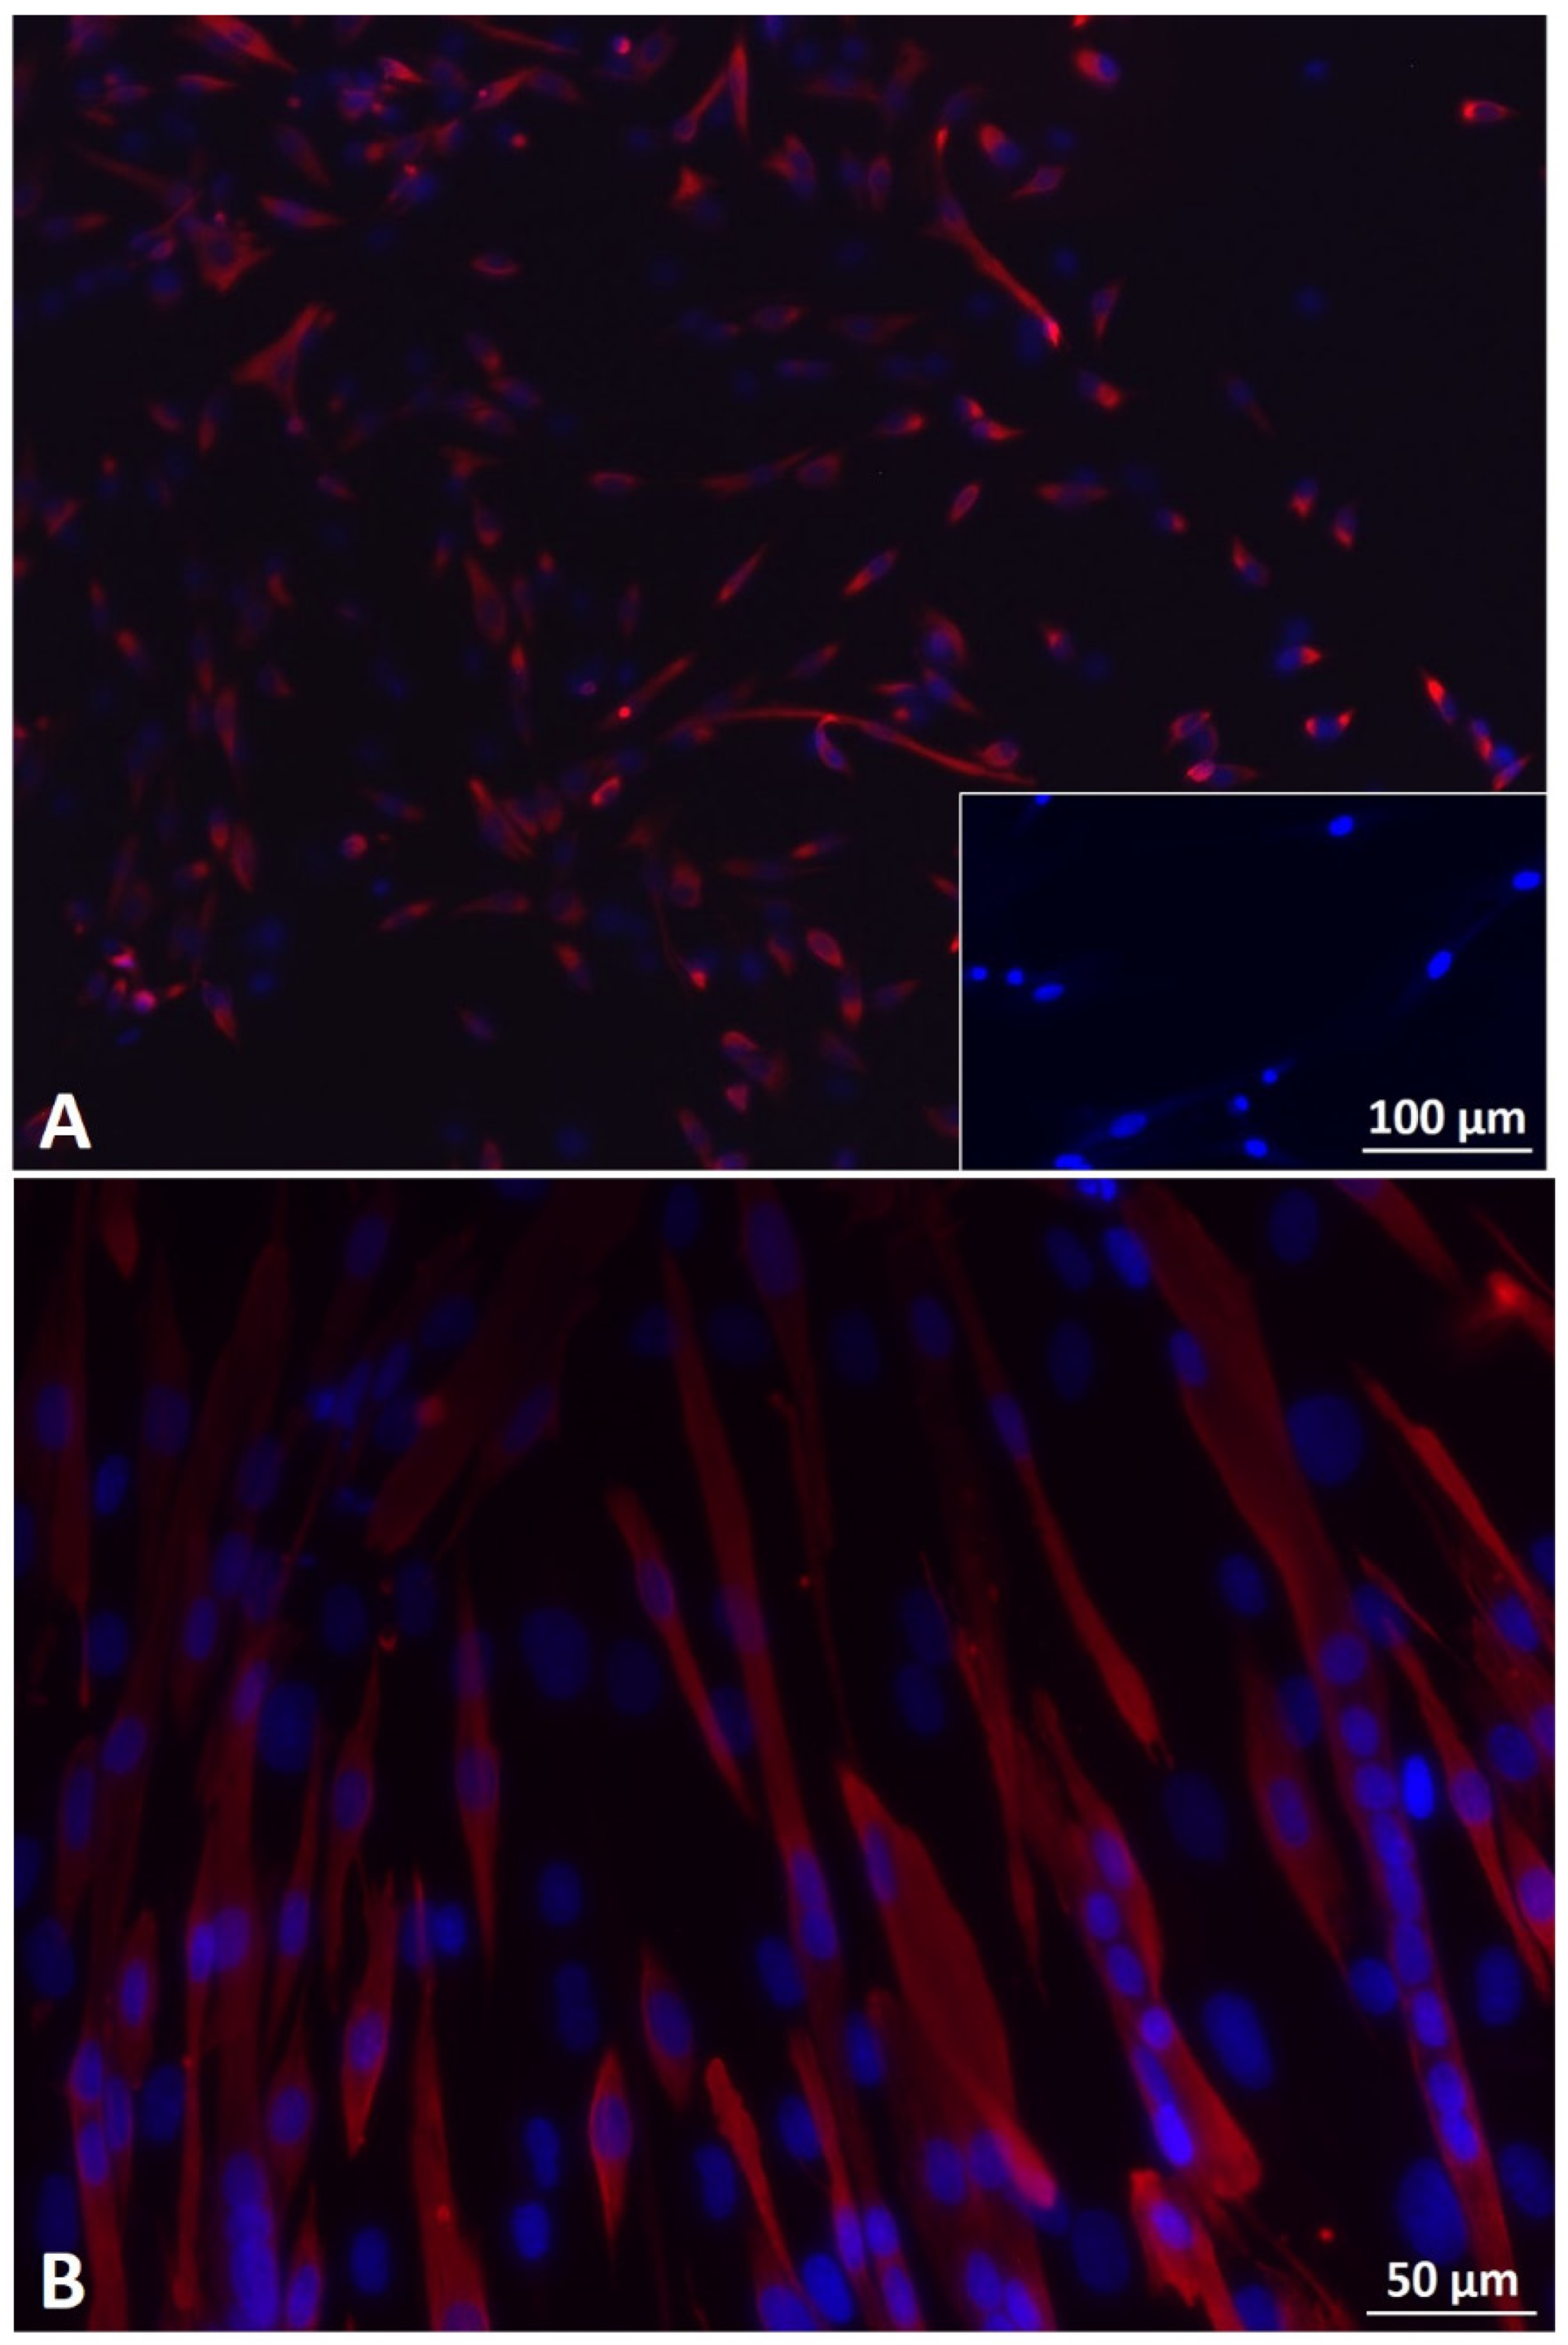
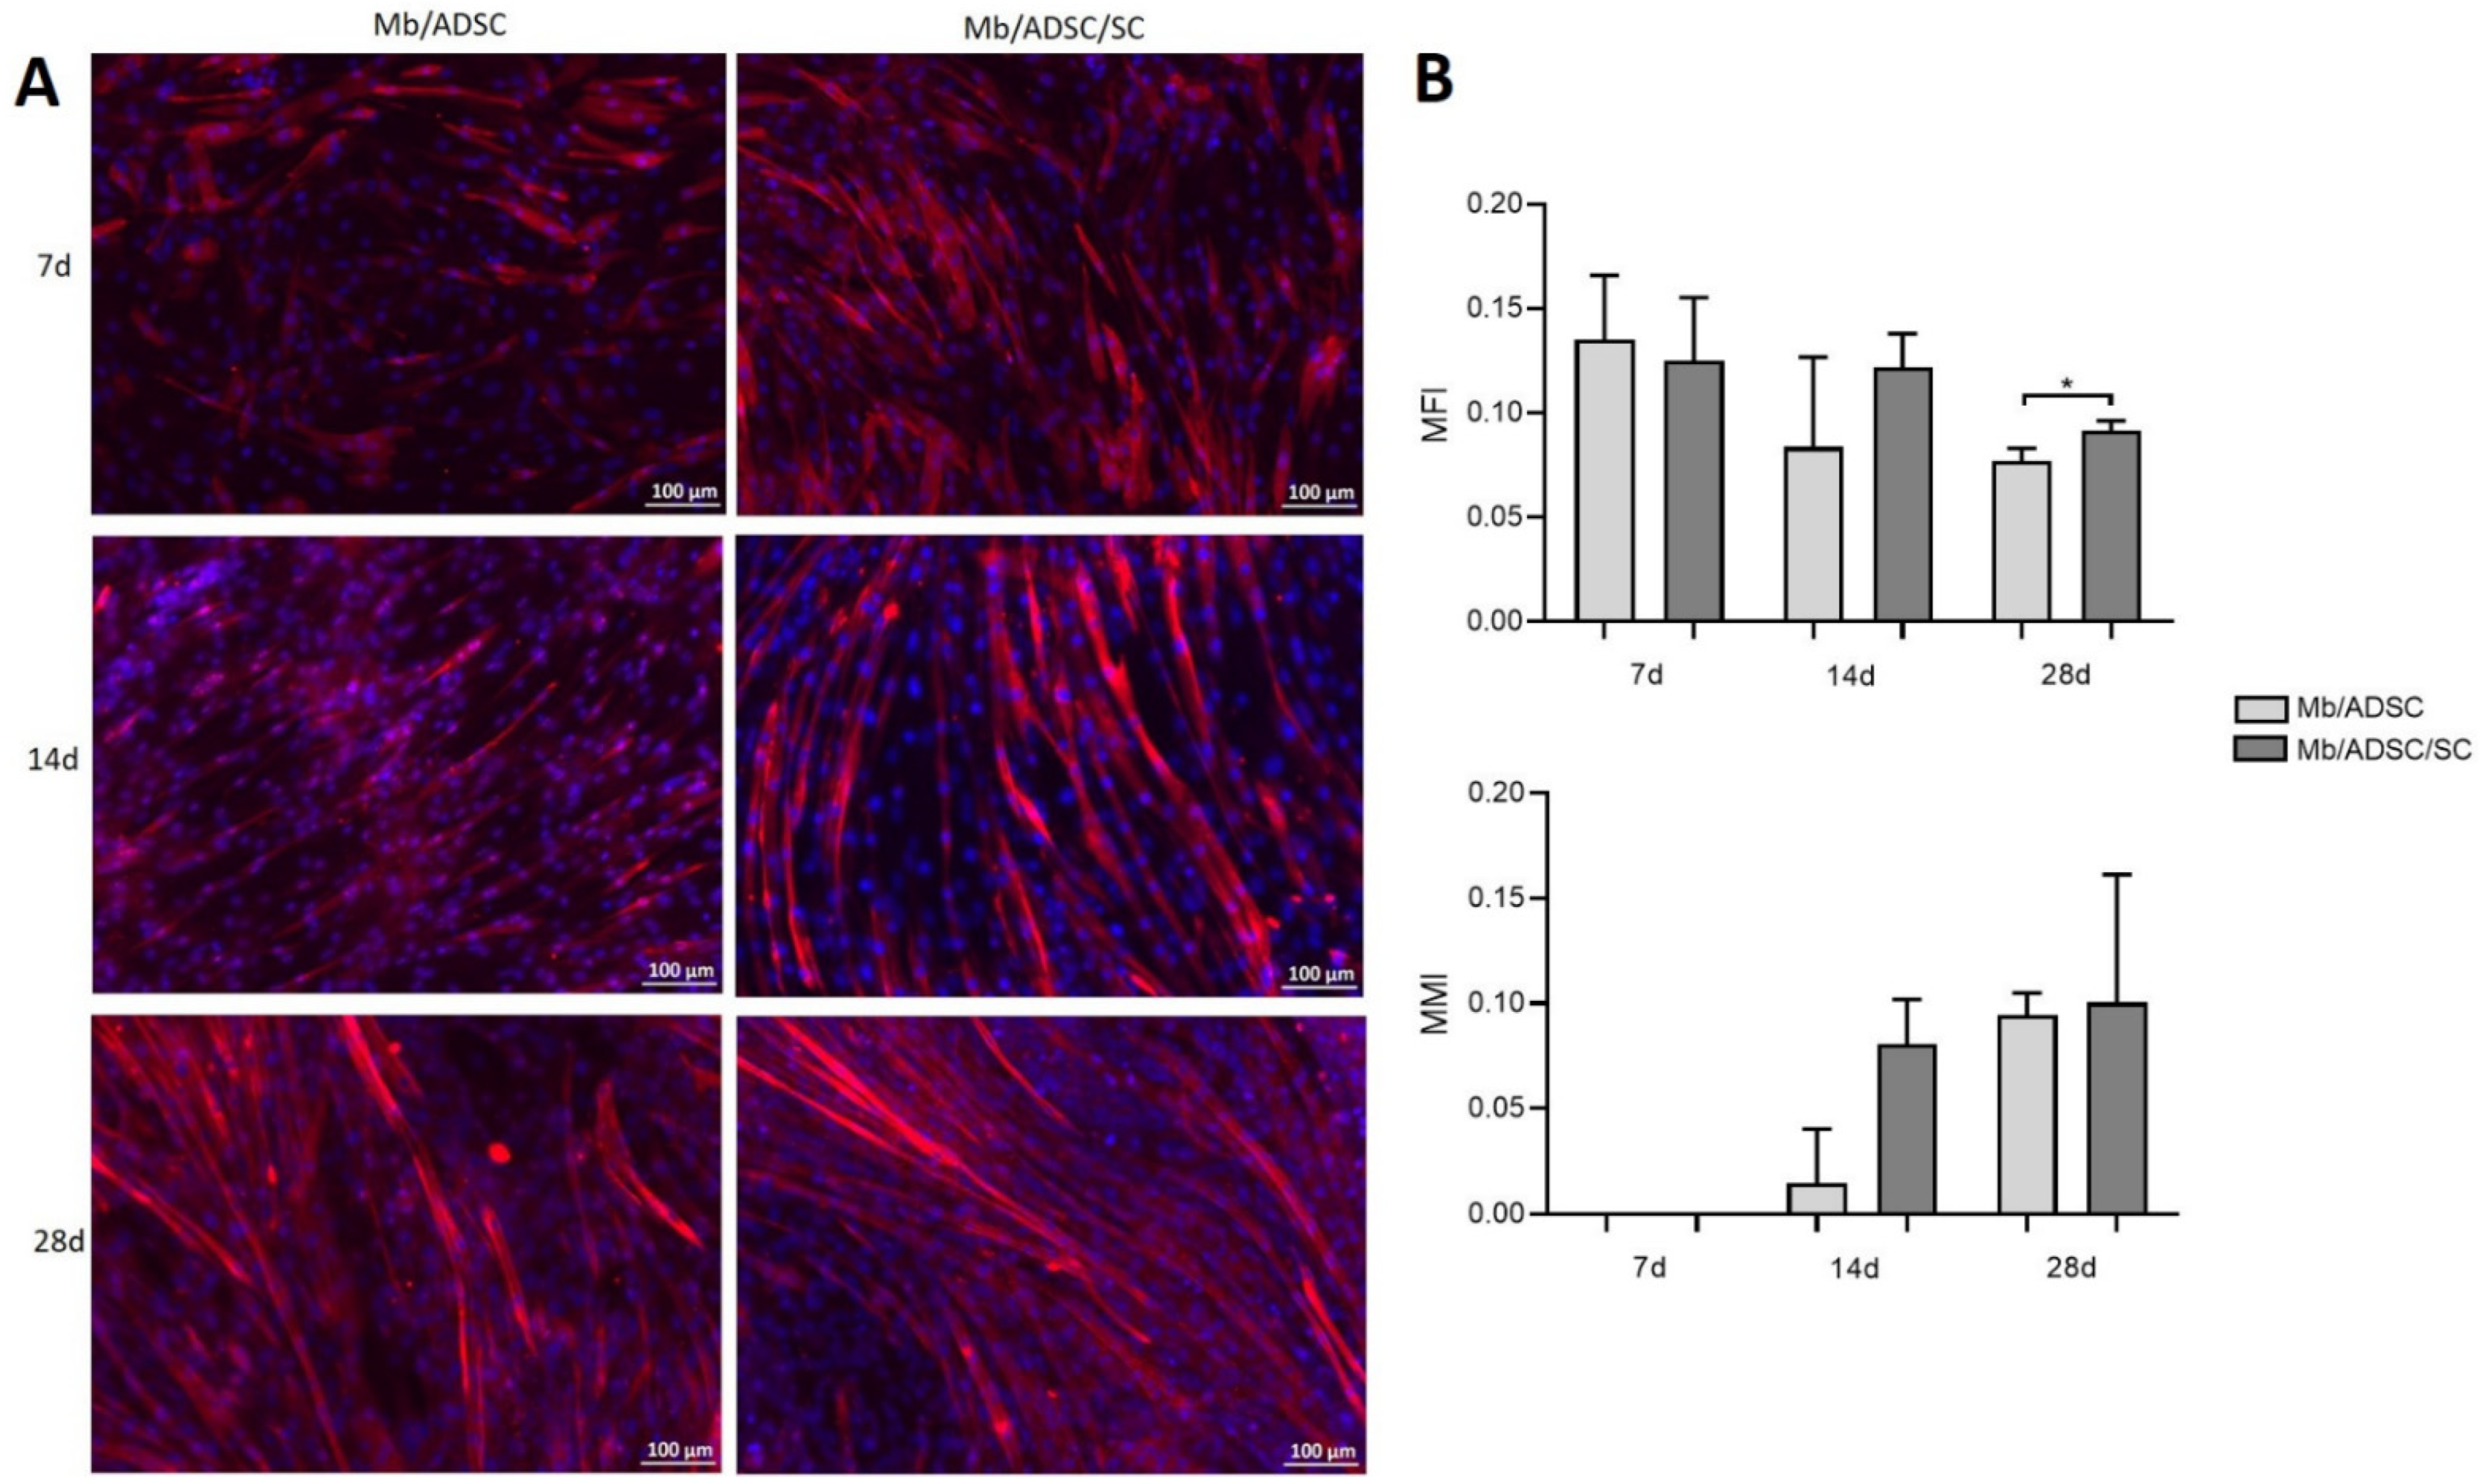
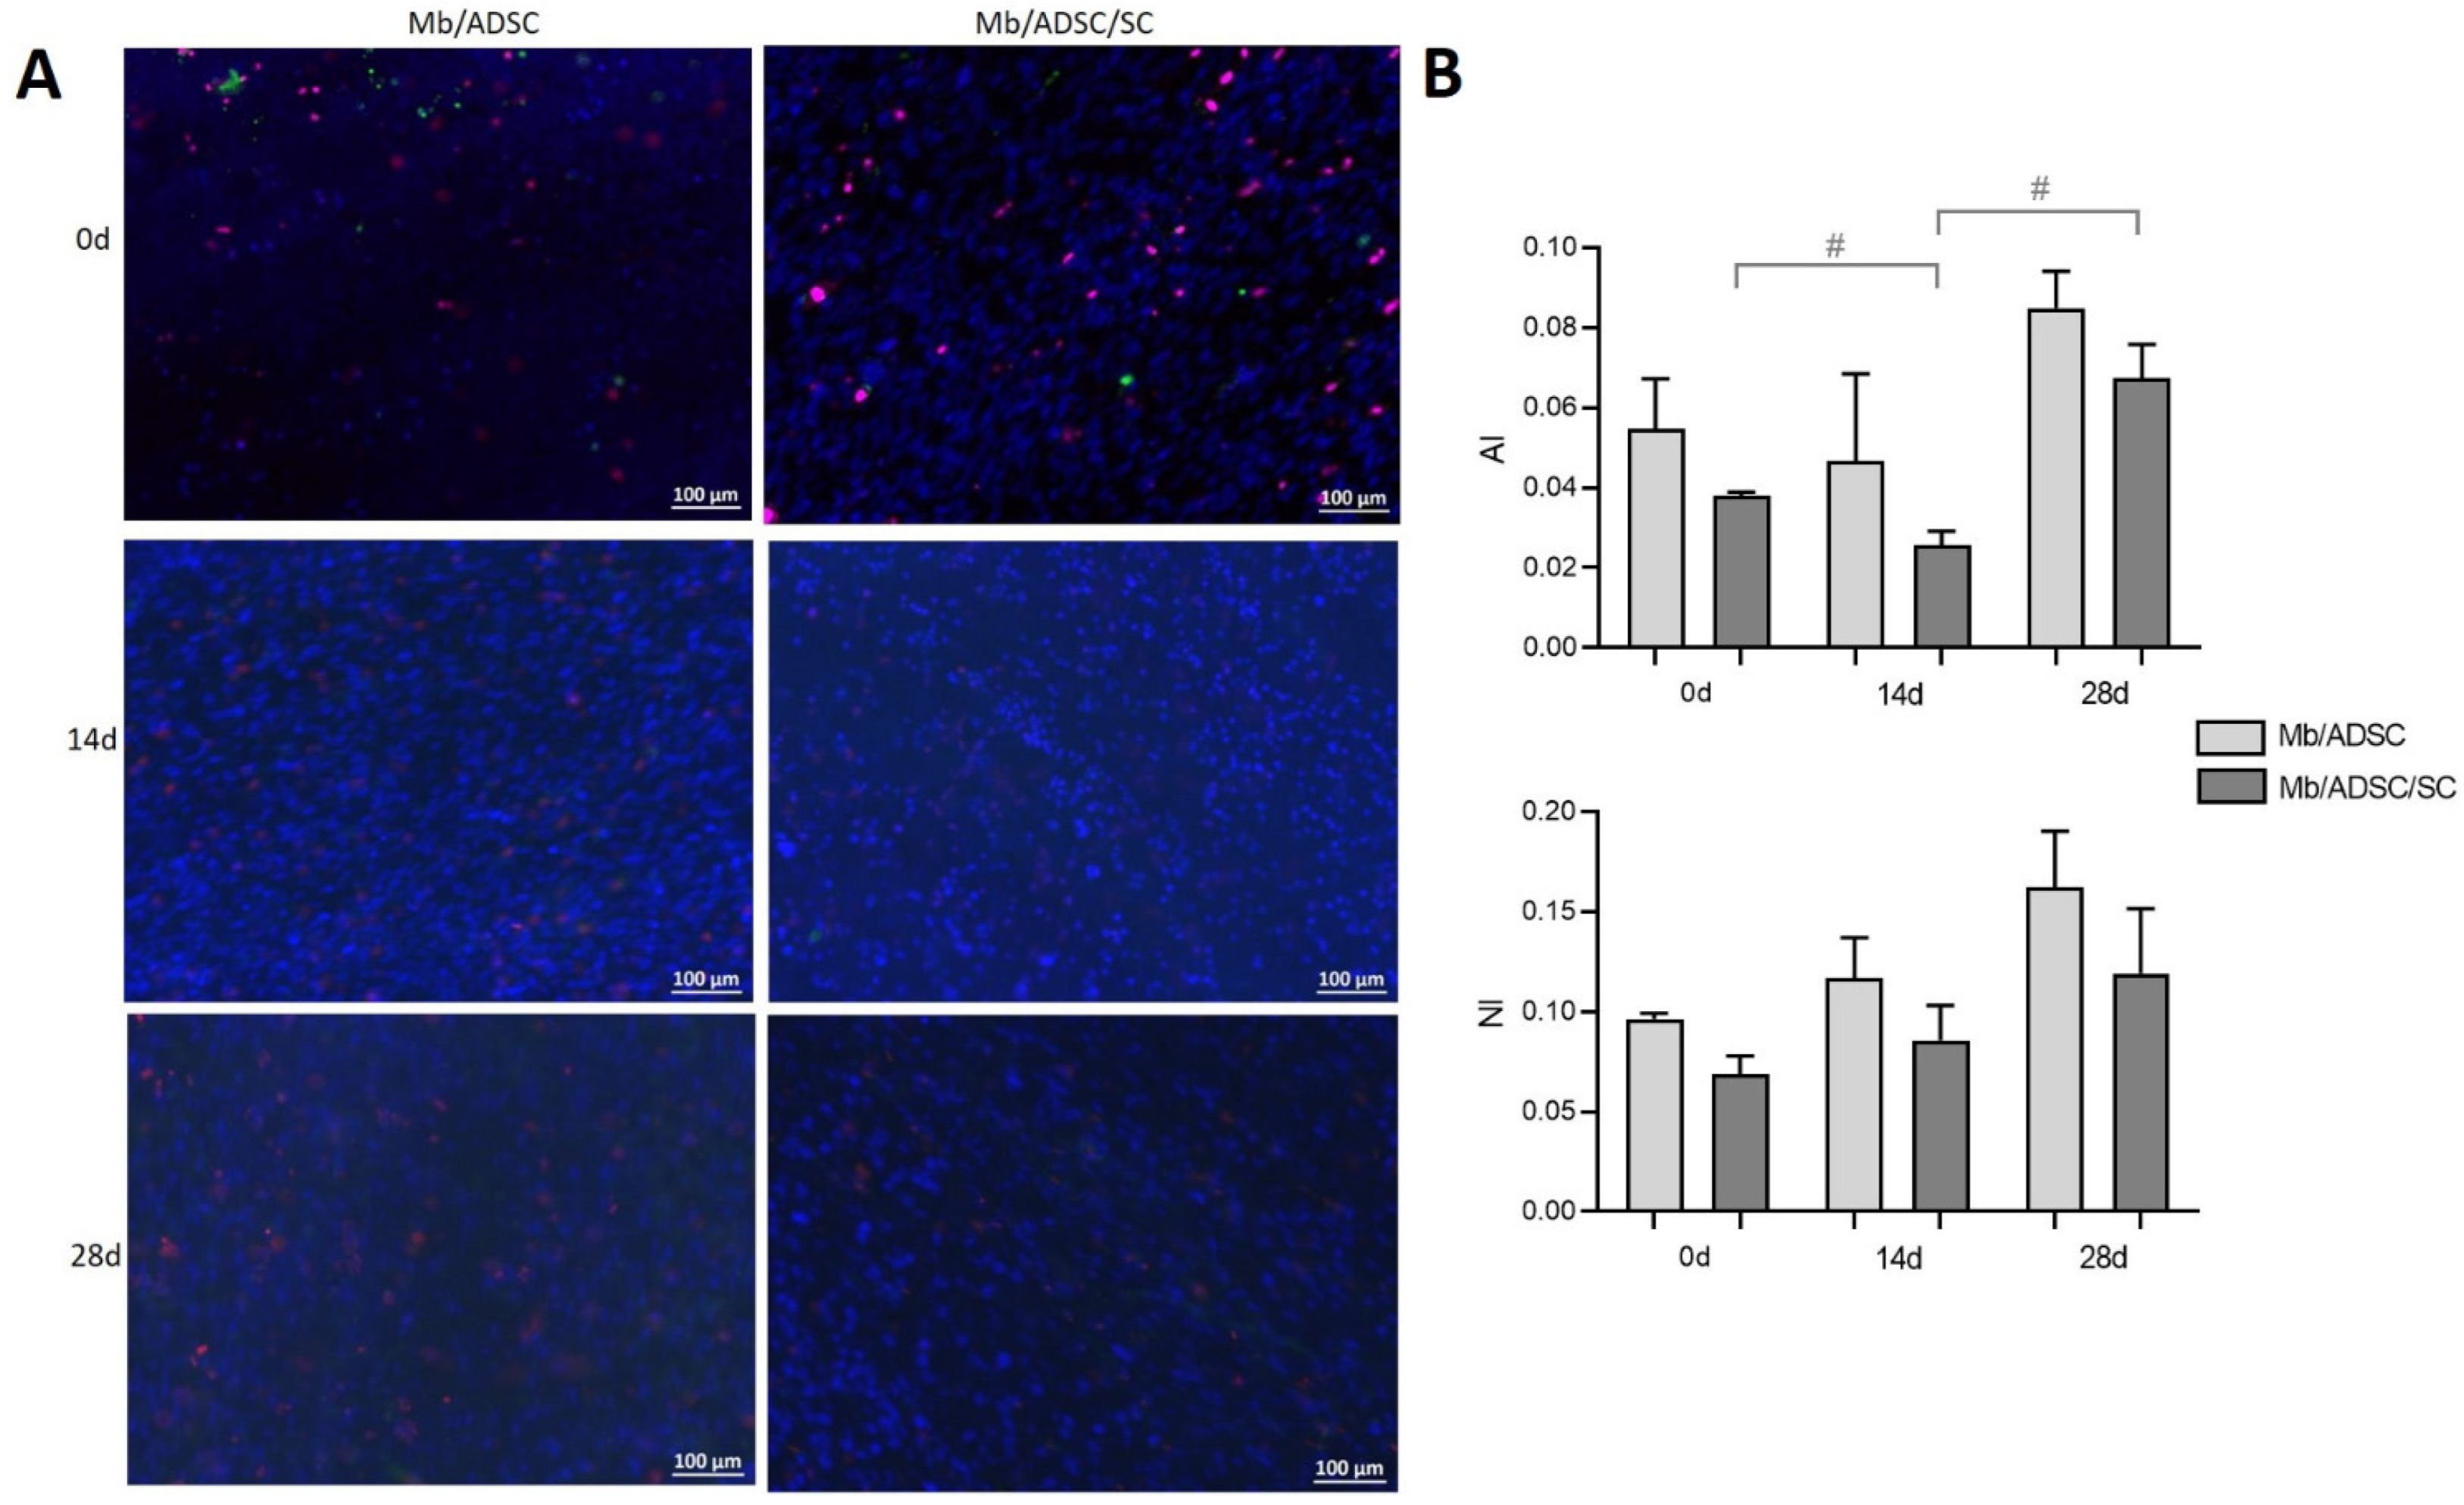
3.3. 2D Myogenic Differentiation of Mb/ADSC vs. Mb/ADSC/SC
3.4. Cell Viability on PCL-Collagen I-Nanoscaffolds
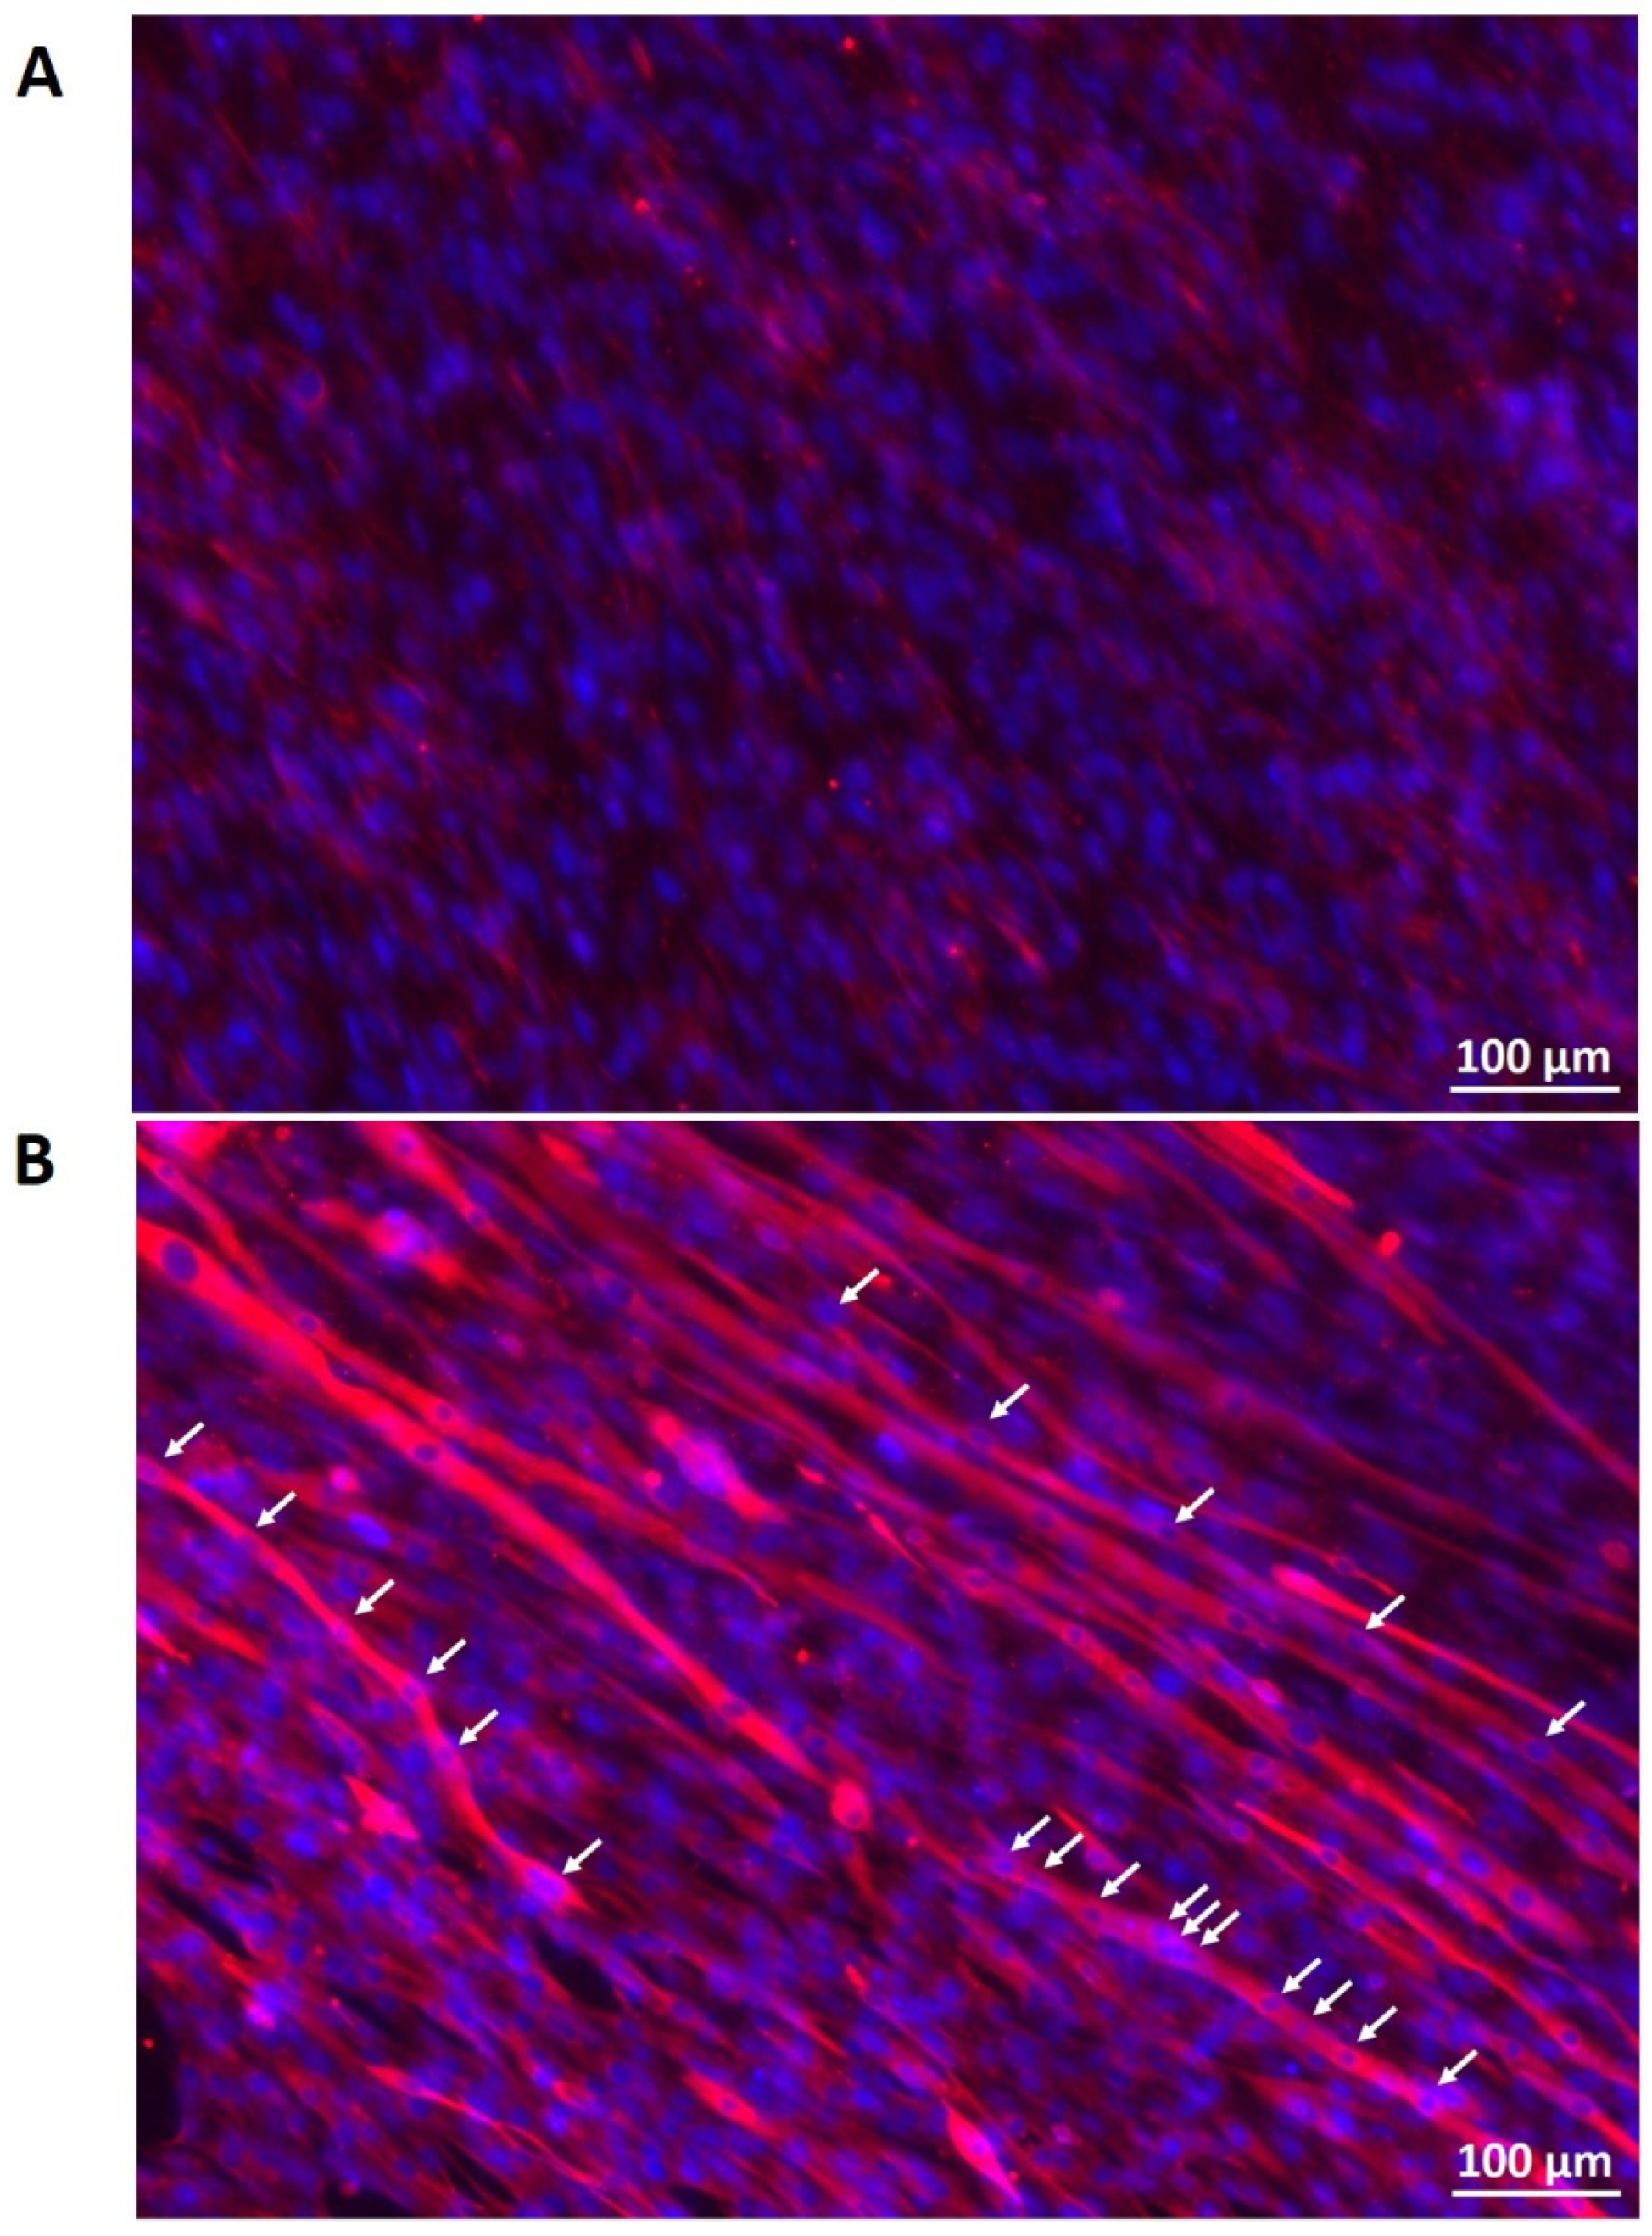
3.5. Myogenic Differentiation on PCL-Collagen I-Nanoscaffolds
4. Discussion
5. Conclusions
Supplementary Materials
Author Contributions
Funding
Institutional Review Board Statement
Informed Consent Statement
Data Availability Statement
Acknowledgments
Conflicts of Interest
References
- Knox, A.D.C.; Ho, A.L.; Leung, L.; Tashakkor, A.Y.; Lennox, P.A.; Van Laeken, N.; Macadam, S.A. Comparison of Outcomes following Autologous Breast Reconstruction Using the DIEP and Pedicled TRAM Flaps: A 12-Year Clinical Retrospective Study and Literature Review. Plast. Reconstr. Surg. 2016, 138, 16–28. [Google Scholar] [CrossRef] [PubMed]
- Cittadella Vigodarzere, G.; Mantero, S. Skeletal muscle tissue engineering: Strategies for volumetric constructs. Front. Physiol. 2014, 5, 362. [Google Scholar] [CrossRef] [PubMed] [Green Version]
- Mertens, J.P.; Sugg, K.B.; Lee, J.D.; Larkin, L.M. Engineering muscle constructs for the creation of functional engineered musculoskeletal tissue. Regen. Med. 2014, 9, 89–100. [Google Scholar] [CrossRef] [PubMed] [Green Version]
- Horch, R.E.; Weigand, A.; Wajant, H.; Groll, J.; Boccaccini, A.R.; Arkudas, A. Biofabrication: New approaches for tissue regeneration. Handchir. Mikrochir. Plast. Chir. 2018, 50, 93–100. [Google Scholar] [CrossRef]
- Jones, A.E.; Price, F.D.; Le Grand, F.; Soleimani, V.D.; Dick, S.A.; Megeney, L.A.; Rudnicki, M.A. Wnt/beta-catenin controls follistatin signalling to regulate satellite cell myogenic potential. Skelet. Muscle 2015, 5, 14. [Google Scholar] [CrossRef] [Green Version]
- Brown, C.; McKee, C.; Bakshi, S.; Walker, K.; Hakman, E.; Halassy, S.; Svinarich, D.; Dodds, R.; Govind, C.K.; Chaudhry, G.R. Mesenchymal stem cells: Cell therapy and regeneration potential. J. Tissue Eng. Regen. Med. 2019, 13, 1738–1755. [Google Scholar] [CrossRef]
- Strioga, M.; Viswanathan, S.; Darinskas, A.; Slaby, O.; Michalek, J. Same or not the same? Comparison of adipose tissue-derived versus bone marrow-derived mesenchymal stem and stromal cells. Stem. Cells Dev. 2012, 21, 2724–2752. [Google Scholar] [CrossRef]
- Nieto-Nicolau, N.; Martinez-Conesa, E.M.; Fuentes-Julian, S.; Arnalich-Montiel, F.; Garcia-Tunon, I.; De Miguel, M.P.; Casaroli-Marano, R.P. Priming human adipose-derived mesenchymal stem cells for corneal surface regeneration. J. Cell Mol. Med. 2021, 25, 5124–5137. [Google Scholar] [CrossRef]
- Xie, A.; Peng, Y.; Yao, Z.; Lu, L.; Ni, T. Effect of a subset of adipose-derived stem cells isolated with liposome magnetic beads to promote cartilage repair. J. Cell Mol. Med. 2021, 25, 4204–4215. [Google Scholar] [CrossRef]
- Witt, R.; Weigand, A.; Boos, A.M.; Cai, A.; Dippold, D.; Boccaccini, A.R.; Schubert, D.W.; Hardt, M.; Lange, C.; Arkudas, A.; et al. Mesenchymal stem cells and myoblast differentiation under HGF and IGF-1 stimulation for 3D skeletal muscle tissue engineering. BMC Cell Biol. 2017, 18, 15. [Google Scholar] [CrossRef] [Green Version]
- Politi, S.; Carotenuto, F.; Rinaldi, A.; Di Nardo, P.; Manzari, V.; Albertini, M.C.; Araneo, R.; Ramakrishna, S.; Teodori, L. Smart ECM-Based Electrospun Biomaterials for Skeletal Muscle Regeneration. Nanomaterials 2020, 10, 1781. [Google Scholar] [CrossRef] [PubMed]
- Cai, A.; Hardt, M.; Schneider, P.; Schmid, R.; Lange, C.; Dippold, D.; Schubert, D.W.; Boos, A.M.; Weigand, A.; Arkudas, A.; et al. Myogenic differentiation of primary myoblasts and mesenchymal stromal cells under serum-free conditions on PCL-collagen I-nanoscaffolds. BMC Biotechnol. 2018, 18, 75. [Google Scholar] [CrossRef] [PubMed]
- Dippold, D.; Cai, A.; Hardt, M.; Boccaccini, A.R.; Horch, R.; Beier, J.P.; Schubert, D.W. Novel approach towards aligned PCL-Collagen nanofibrous constructs from a benign solvent system. Mater. Sci. Eng. C Mater. Biol. Appl. 2017, 72, 278–283. [Google Scholar] [CrossRef] [PubMed]
- Martin, N.R.; Passey, S.L.; Player, D.J.; Mudera, V.; Baar, K.; Greensmith, L.; Lewis, M.P. Neuromuscular Junction Formation in Tissue-Engineered Skeletal Muscle Augments Contractile Function and Improves Cytoskeletal Organization. Tissue Eng. Part A 2015, 21, 2595–2604. [Google Scholar] [CrossRef] [Green Version]
- Arifuzzaman, M.; Ito, A.; Ikeda, K.; Kawabe, Y.; Kamihira, M. Fabricating Muscle-Neuron Constructs with Improved Contractile Force Generation. Tissue Eng. Part A 2019, 25, 563–574. [Google Scholar] [CrossRef]
- Bach, A.D.; Beier, J.P.; Stark, G.B. Expression of Trisk 51, agrin and nicotinic-acetycholine receptor epsilon-subunit during muscle development in a novel three-dimensional muscle-neuronal co-culture system. Cell Tissue Res. 2003, 314, 263–274. [Google Scholar] [CrossRef]
- Li, L.; Xiong, W.C.; Mei, L. Neuromuscular Junction Formation, Aging, and Disorders. Annu. Rev. Physiol. 2018, 80, 159–188. [Google Scholar] [CrossRef]
- Weng, J.; Wang, Y.H.; Li, M.; Zhang, D.Y.; Jiang, B.G. GSK3beta inhibitor promotes myelination and mitigates muscle atrophy after peripheral nerve injury. Neural Regen. Res. 2018, 13, 324–330. [Google Scholar] [CrossRef]
- Cui, W.; Liu, C.X.; Wang, J.; Zhang, Y.C.; Shen, Q.; Feng, Z.H.; Wu, J.; Li, J.X. An oleanolic acid derivative reduces denervation-induced muscle atrophy via activation of CNTF-mediated JAK2/STAT3 signaling pathway. Eur. J. Pharmacol. 2019, 861, 172612. [Google Scholar] [CrossRef]
- Singh, T.; Vazquez, M. Time-Dependent Addition of Neuronal and Schwann Cells Increase Myotube Viability and Length in an In Vitro Tri-Culture Model of the Neuromuscular Junction. Regen. Eng. Transl. Med. 2019, 5, 402–413. [Google Scholar] [CrossRef]
- Horner, S.J.; Couturier, N.; Bruch, R.; Koch, P.; Hafner, M.; Rudolf, R. hiPSC-Derived Schwann Cells Influence Myogenic Differentiation in Neuromuscular Cocultures. Cells 2021, 10, 3292. [Google Scholar] [CrossRef] [PubMed]
- Li, K.; Kong, Y.; Zhang, M.; Xie, F.; Liu, P.; Xu, S. Differentiation of pluripotent stem cells for regenerative medicine. Biochem. Biophys. Res. Commun. 2016, 471, 1–4. [Google Scholar] [CrossRef] [PubMed]
- Mora, C.; Serzanti, M.; Consiglio, A.; Memo, M.; Dell’Era, P. Clinical potentials of human pluripotent stem cells. Cell Biol. Toxicol. 2017, 33, 351–360. [Google Scholar] [CrossRef] [PubMed] [Green Version]
- Gharaibeh, B.; Lu, A.; Tebbets, J.; Zheng, B.; Feduska, J.; Crisan, M.; Peault, B.; Cummins, J.; Huard, J. Isolation of a slowly adhering cell fraction containing stem cells from murine skeletal muscle by the preplate technique. Nat. Protoc. 2008, 3, 1501–1509. [Google Scholar] [CrossRef]
- Weigand, A.; Boos, A.M.; Tasbihi, K.; Beier, J.P.; Dalton, P.D.; Schrauder, M.; Horch, R.E.; Beckmann, M.W.; Strissel, P.L.; Strick, R. Selective isolation and characterization of primary cells from normal breast and tumors reveal plasticity of adipose derived stem cells. Breast Cancer Res. 2016, 18, 32. [Google Scholar] [CrossRef] [Green Version]
- Bajaj, P.; Reddy, B., Jr.; Millet, L.; Wei, C.; Zorlutuna, P.; Bao, G.; Bashir, R. Patterning the differentiation of C2C12 skeletal myoblasts. Integr. Biol. 2011, 3, 897–909. [Google Scholar] [CrossRef]
- Schubert, D.W. Revealing Novel Power Laws and Quantization in Electrospinning Considering Jet Splitting—Toward Predicting Fiber Diameter and Its Distribution. Macromol. Theory Simul. 2019, 28, 1900006. [Google Scholar] [CrossRef]
- Mesquita-Ferrari, R.A.; Alves, A.N.; de Oliveira Cardoso, V.; Artilheiro, P.P.; Bussadori, S.K.; Rocha, L.A.; Nunes, F.D.; Fernandes, K.P. Low-level laser irradiation modulates cell viability and creatine kinase activity in C2C12 muscle cells during the differentiation process. Lasers Med. Sci. 2015, 30, 2209–2213. [Google Scholar] [CrossRef]
- Chamberlain, J.S.; Jaynes, J.B.; Hauschka, S.D. Regulation of creatine kinase induction in differentiating mouse myoblasts. Mol. Cell Biol. 1985, 5, 484–492. [Google Scholar] [CrossRef]
- Wedhas, N.; Klamut, H.J.; Dogra, C.; Srivastava, A.K.; Mohan, S.; Kumar, A. Inhibition of mechanosensitive cation channels inhibits myogenic differentiation by suppressing the expression of myogenic regulatory factors and caspase-3 activity. FASEB J. 2005, 19, 1986–1997. [Google Scholar] [CrossRef] [Green Version]
- Seo, E.; Kang, H.; Lim, O.K.; Jun, H.S. Supplementation with IL-6 and Muscle Cell Culture Conditioned Media Enhances Myogenic Differentiation of Adipose Tissue-Derived Stem Cells through STAT3 Activation. Int. J. Mol. Sci. 2018, 19, 1557. [Google Scholar] [CrossRef] [PubMed] [Green Version]
- Ansari, S.; Chen, C.; Xu, X.; Annabi, N.; Zadeh, H.H.; Wu, B.M.; Khademhosseini, A.; Shi, S.; Moshaverinia, A. Muscle Tissue Engineering Using Gingival Mesenchymal Stem Cells Encapsulated in Alginate Hydrogels Containing Multiple Growth Factors. Ann. Biomed Eng. 2016, 44, 1908–1920. [Google Scholar] [CrossRef] [PubMed] [Green Version]
- Zammit, P.S. Function of the myogenic regulatory factors Myf5, MyoD, Myogenin and MRF4 in skeletal muscle, satellite cells and regenerative myogenesis. Semin. Cell Dev. Biol. 2017, 72, 19–32. [Google Scholar] [CrossRef] [PubMed]
- Teraoka, M.; Hato, N.; Takahashi, H.; Komobuchi, H.; Sawai, N.; Okada, M.; Hakuba, N. Myogenin expression in facial muscle following damage to the facial nerve. Acta Otolaryngol. 2012, 132, 783–787. [Google Scholar] [CrossRef]
- Ostrovidov, S.; Ahadian, S.; Ramon-Azcon, J.; Hosseini, V.; Fujie, T.; Parthiban, S.P.; Shiku, H.; Matsue, T.; Kaji, H.; Ramalingam, M.; et al. Three-dimensional co-culture of C2C12/PC12 cells improves skeletal muscle tissue formation and function. J. Tissue Eng. Regen. Med. 2017, 11, 582–595. [Google Scholar] [CrossRef]
- Larkin, L.M.; Van der Meulen, J.H.; Dennis, R.G.; Kennedy, J.B. Functional evaluation of nerve-skeletal muscle constructs engineered in vitro. Vitr. Cell. Dev. Biol. Anim. 2006, 42, 75–82. [Google Scholar] [CrossRef]
- Kaur, G.; Dufour, J.M. Cell lines: Valuable tools or useless artifacts. Spermatogenesis 2012, 2, 1–5. [Google Scholar] [CrossRef] [Green Version]
- Yalvac, M.E.; Amornvit, J.; Chen, L.; Shontz, K.M.; Lewis, S.; Sahenk, Z. AAV1.NT-3 gene therapy increases muscle fiber diameter through activation of mTOR pathway and metabolic remodeling in a CMT mouse model. Gene Ther. 2018, 25, 129–138. [Google Scholar] [CrossRef]
- Stratton, J.A.; Kumar, R.; Sinha, S.; Shah, P.; Stykel, M.; Shapira, Y.; Midha, R.; Biernaskie, J. Purification and Characterization of Schwann Cells from Adult Human Skin and Nerve. eNeuro 2017, 4. [Google Scholar] [CrossRef] [Green Version]
- Bitto, F.F.; Klumpp, D.; Lange, C.; Boos, A.M.; Arkudas, A.; Bleiziffer, O.; Horch, R.E.; Kneser, U.; Beier, J.P. Myogenic differentiation of mesenchymal stem cells in a newly developed neurotised AV-loop model. BioMed Res. Int. 2013, 2013, 935046. [Google Scholar] [CrossRef]
- Weigand, A.; Horch, R.E.; Boos, A.M.; Beier, J.P.; Arkudas, A. The Arteriovenous Loop: Engineering of Axially Vascularized Tissue. Eur. Surg. Res. 2018, 59, 286–299. [Google Scholar] [CrossRef] [PubMed] [Green Version]


| Forward Primer | Reverse Primer | |
|---|---|---|
| MYOG | TGCCATCCAGTACATCGAGC | TGTGAGAGCTGCATTCGCTG |
| MYH2 | GGGCCTTTCAAGAGGGACAC | TGCGCTCCCTTTCAGACTTT |
| ACTA1 | CACAATGTGCGACGAAGACG | CTCTCTTGCTCTGAGCCTCG |
| GAPDH | TCCACCCATGGCAAATTCCA | TTCCCGTTCTCAGCCTTGAC |
Publisher’s Note: MDPI stays neutral with regard to jurisdictional claims in published maps and institutional affiliations. |
© 2022 by the authors. Licensee MDPI, Basel, Switzerland. This article is an open access article distributed under the terms and conditions of the Creative Commons Attribution (CC BY) license (https://creativecommons.org/licenses/by/4.0/).
Share and Cite
Cai, A.; Zheng, Z.-M.; Himmler, M.; Schubert, D.W.; Fuchsluger, T.A.; Weisbach, V.; Horch, R.E.; Arkudas, A. Schwann Cells Promote Myogenic Differentiation of Myoblasts and Adipogenic Mesenchymal Stromal Cells on Poly-ɛ-Caprolactone-Collagen I-Nanofibers. Cells 2022, 11, 1436. https://doi.org/10.3390/cells11091436
Cai A, Zheng Z-M, Himmler M, Schubert DW, Fuchsluger TA, Weisbach V, Horch RE, Arkudas A. Schwann Cells Promote Myogenic Differentiation of Myoblasts and Adipogenic Mesenchymal Stromal Cells on Poly-ɛ-Caprolactone-Collagen I-Nanofibers. Cells. 2022; 11(9):1436. https://doi.org/10.3390/cells11091436
Chicago/Turabian StyleCai, Aijia, Zeng-Ming Zheng, Marcus Himmler, Dirk W. Schubert, Thomas A. Fuchsluger, Volker Weisbach, Raymund E. Horch, and Andreas Arkudas. 2022. "Schwann Cells Promote Myogenic Differentiation of Myoblasts and Adipogenic Mesenchymal Stromal Cells on Poly-ɛ-Caprolactone-Collagen I-Nanofibers" Cells 11, no. 9: 1436. https://doi.org/10.3390/cells11091436
APA StyleCai, A., Zheng, Z.-M., Himmler, M., Schubert, D. W., Fuchsluger, T. A., Weisbach, V., Horch, R. E., & Arkudas, A. (2022). Schwann Cells Promote Myogenic Differentiation of Myoblasts and Adipogenic Mesenchymal Stromal Cells on Poly-ɛ-Caprolactone-Collagen I-Nanofibers. Cells, 11(9), 1436. https://doi.org/10.3390/cells11091436