
Cell Wall Properties Determine Genotype-Specific Response to Cold in Miscanthus × giganteus Plants

 , , , , , ,
  and
and 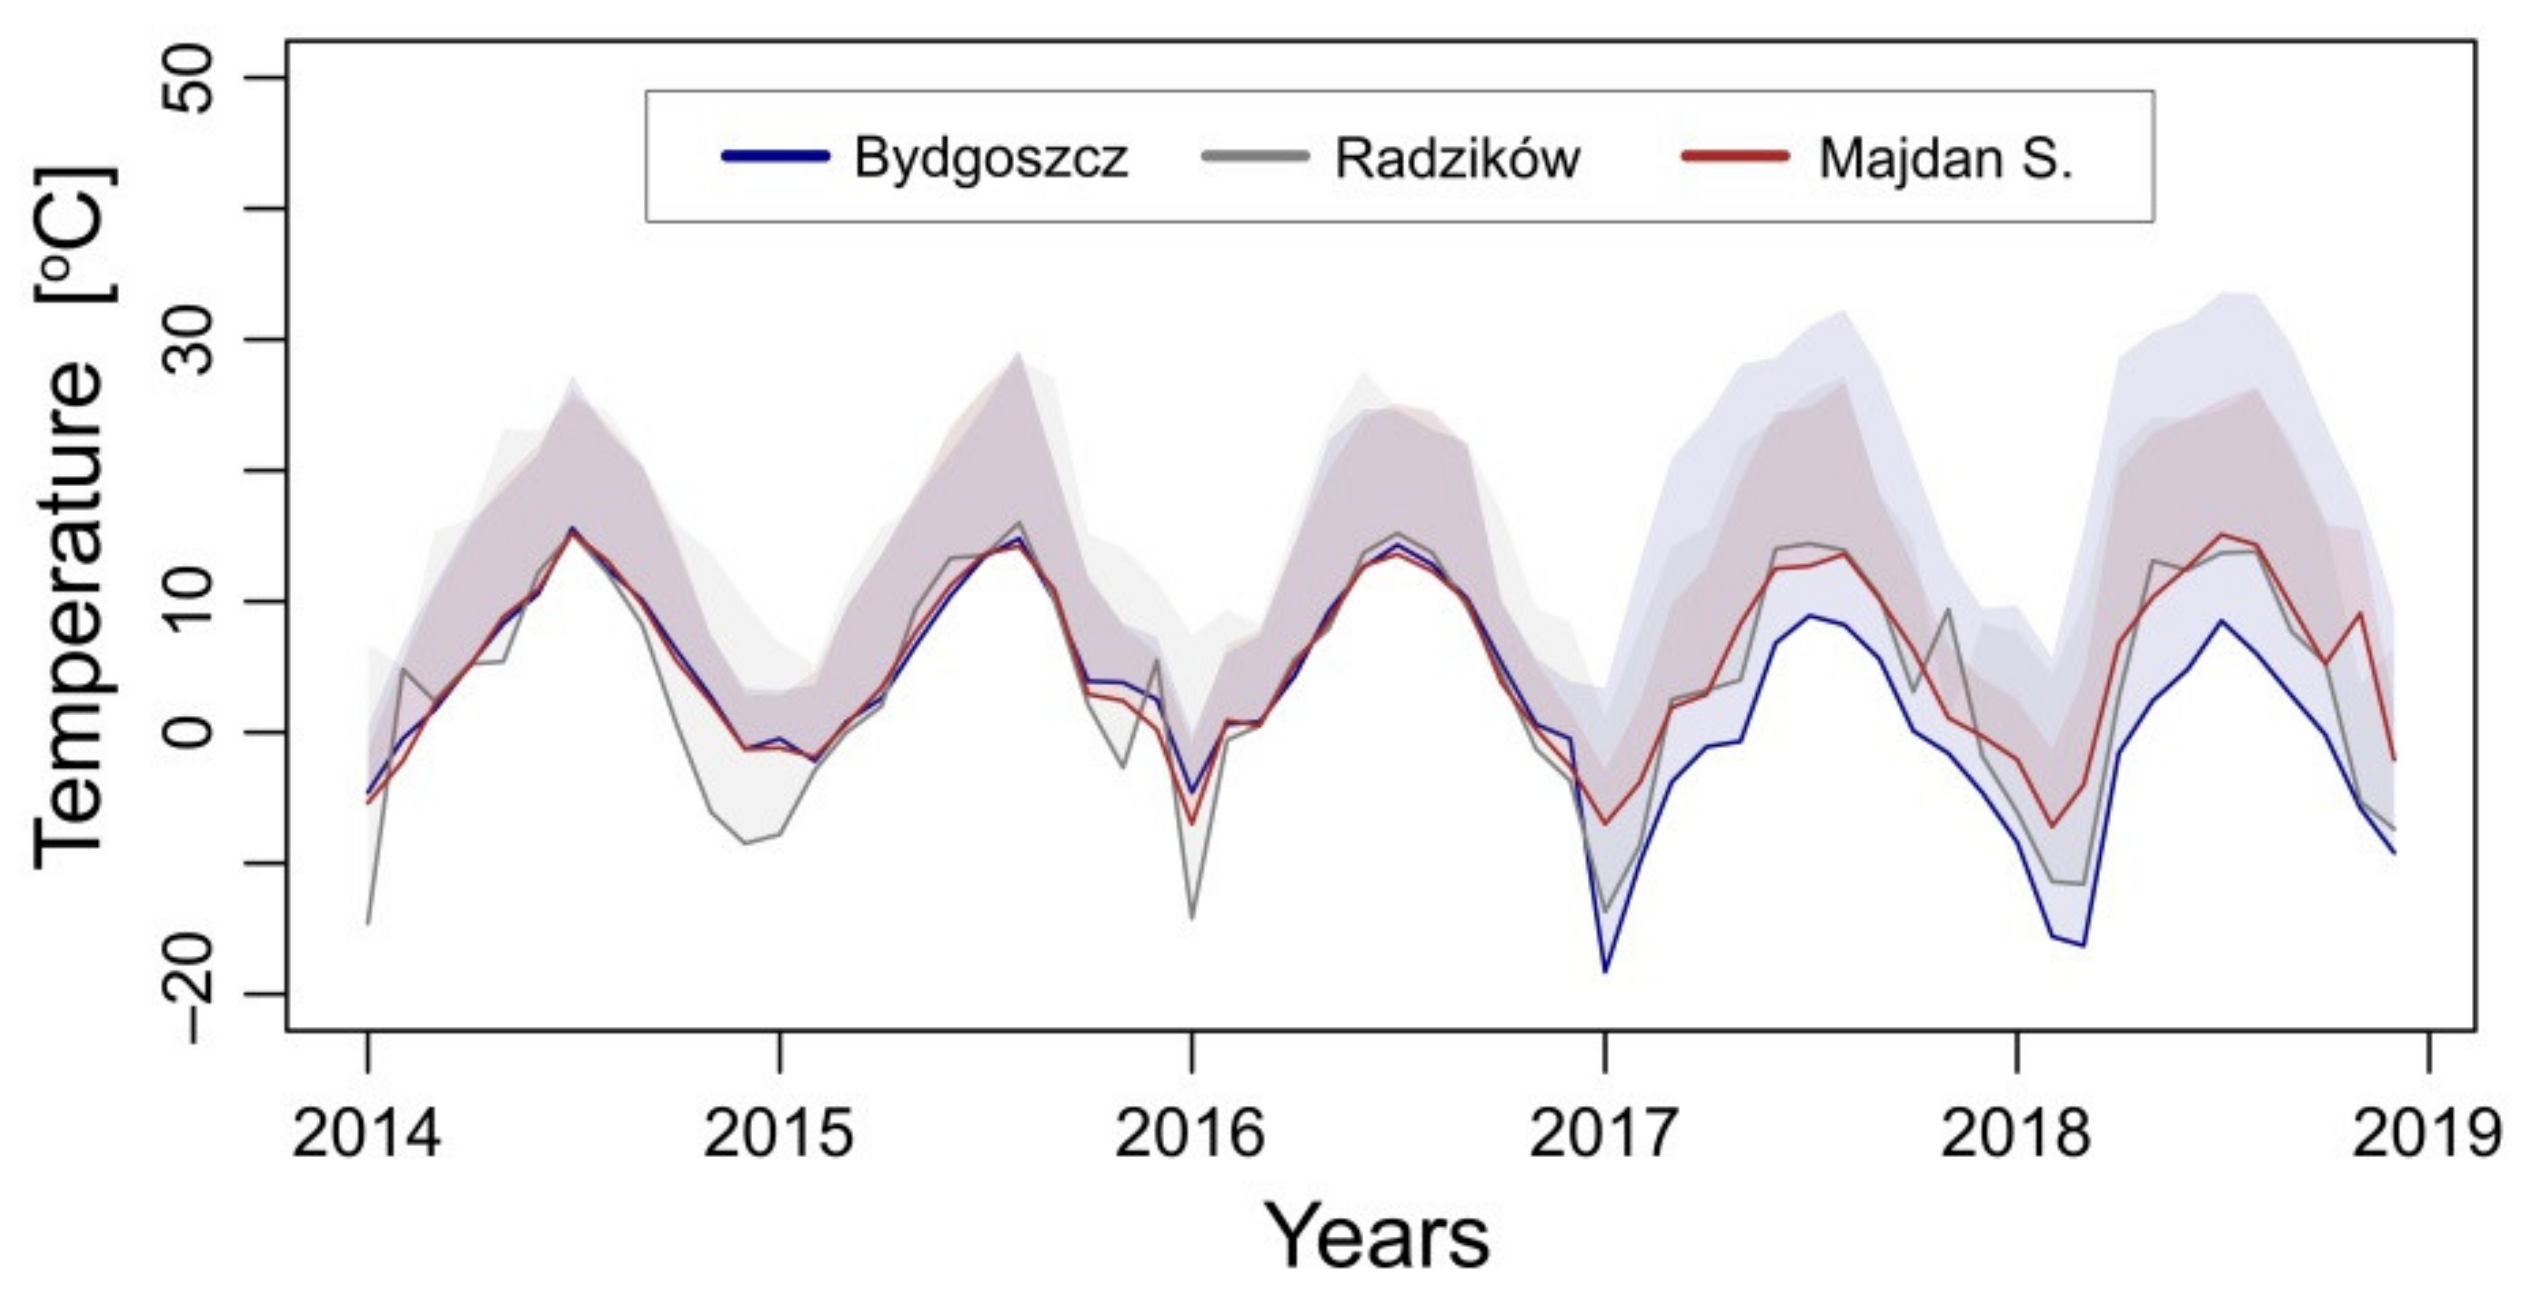
Abstract
1. Introduction
2. Materials and Methods
2.1. Plant Material and Growth Conditions
2.2. Temperature Data
2.3. DNA Extraction and ISSR PCR
2.4. Photosynthetic Parameters Measurements
2.5. Tensile Mechanical Tests
2.6. Infrared Spectroscopy
2.7. Ultrastructure of Plasmodesmata
2.8. Statistical Analysis
3. Results
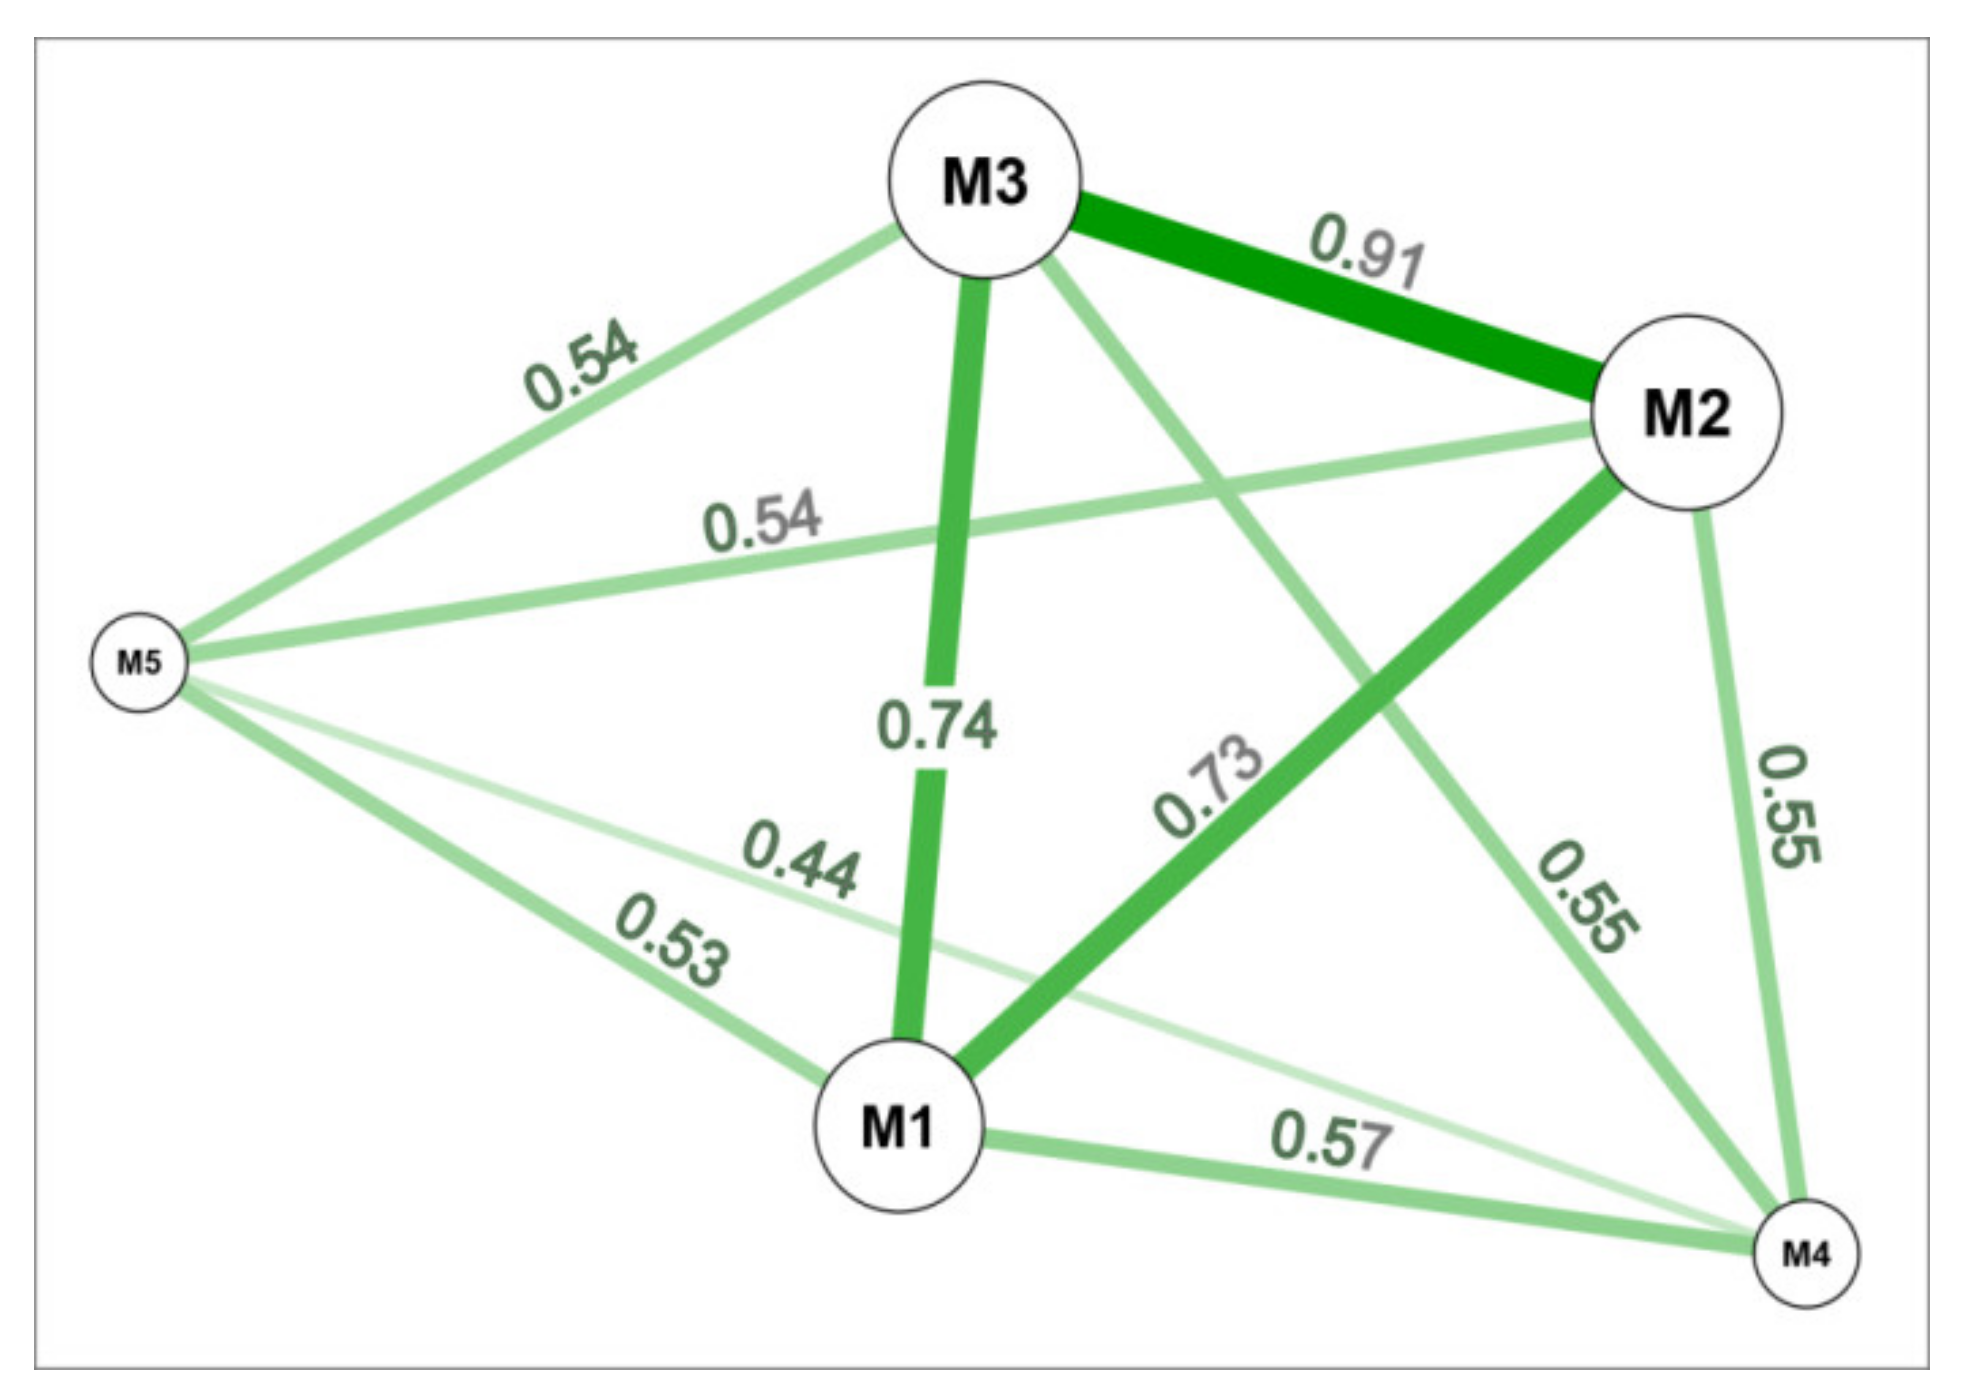
3.1. Genetic Similarity
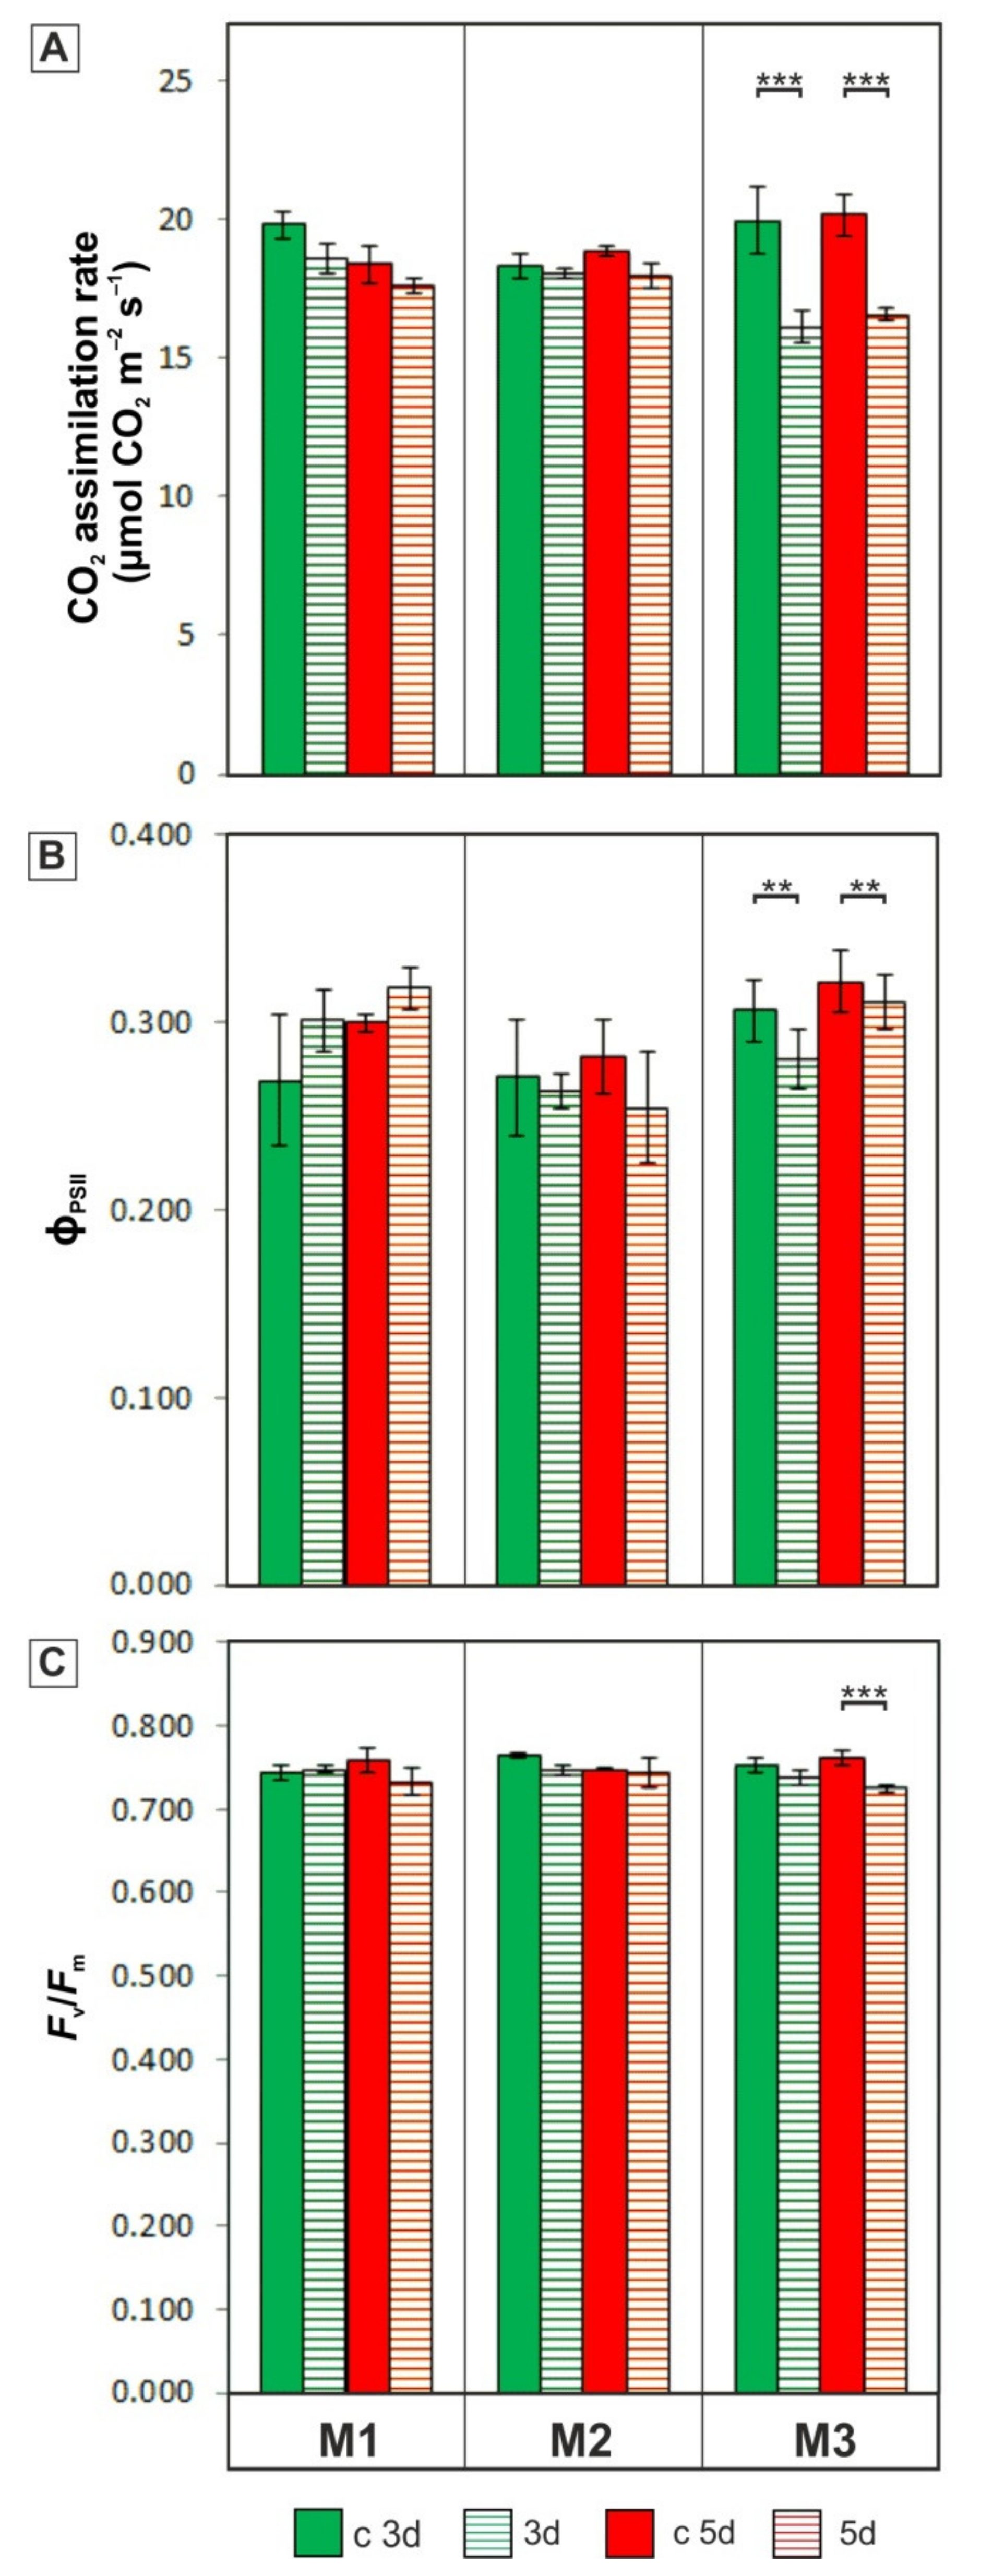
3.2. Photosynthetic Activity
3.3. Biomechanical Tests
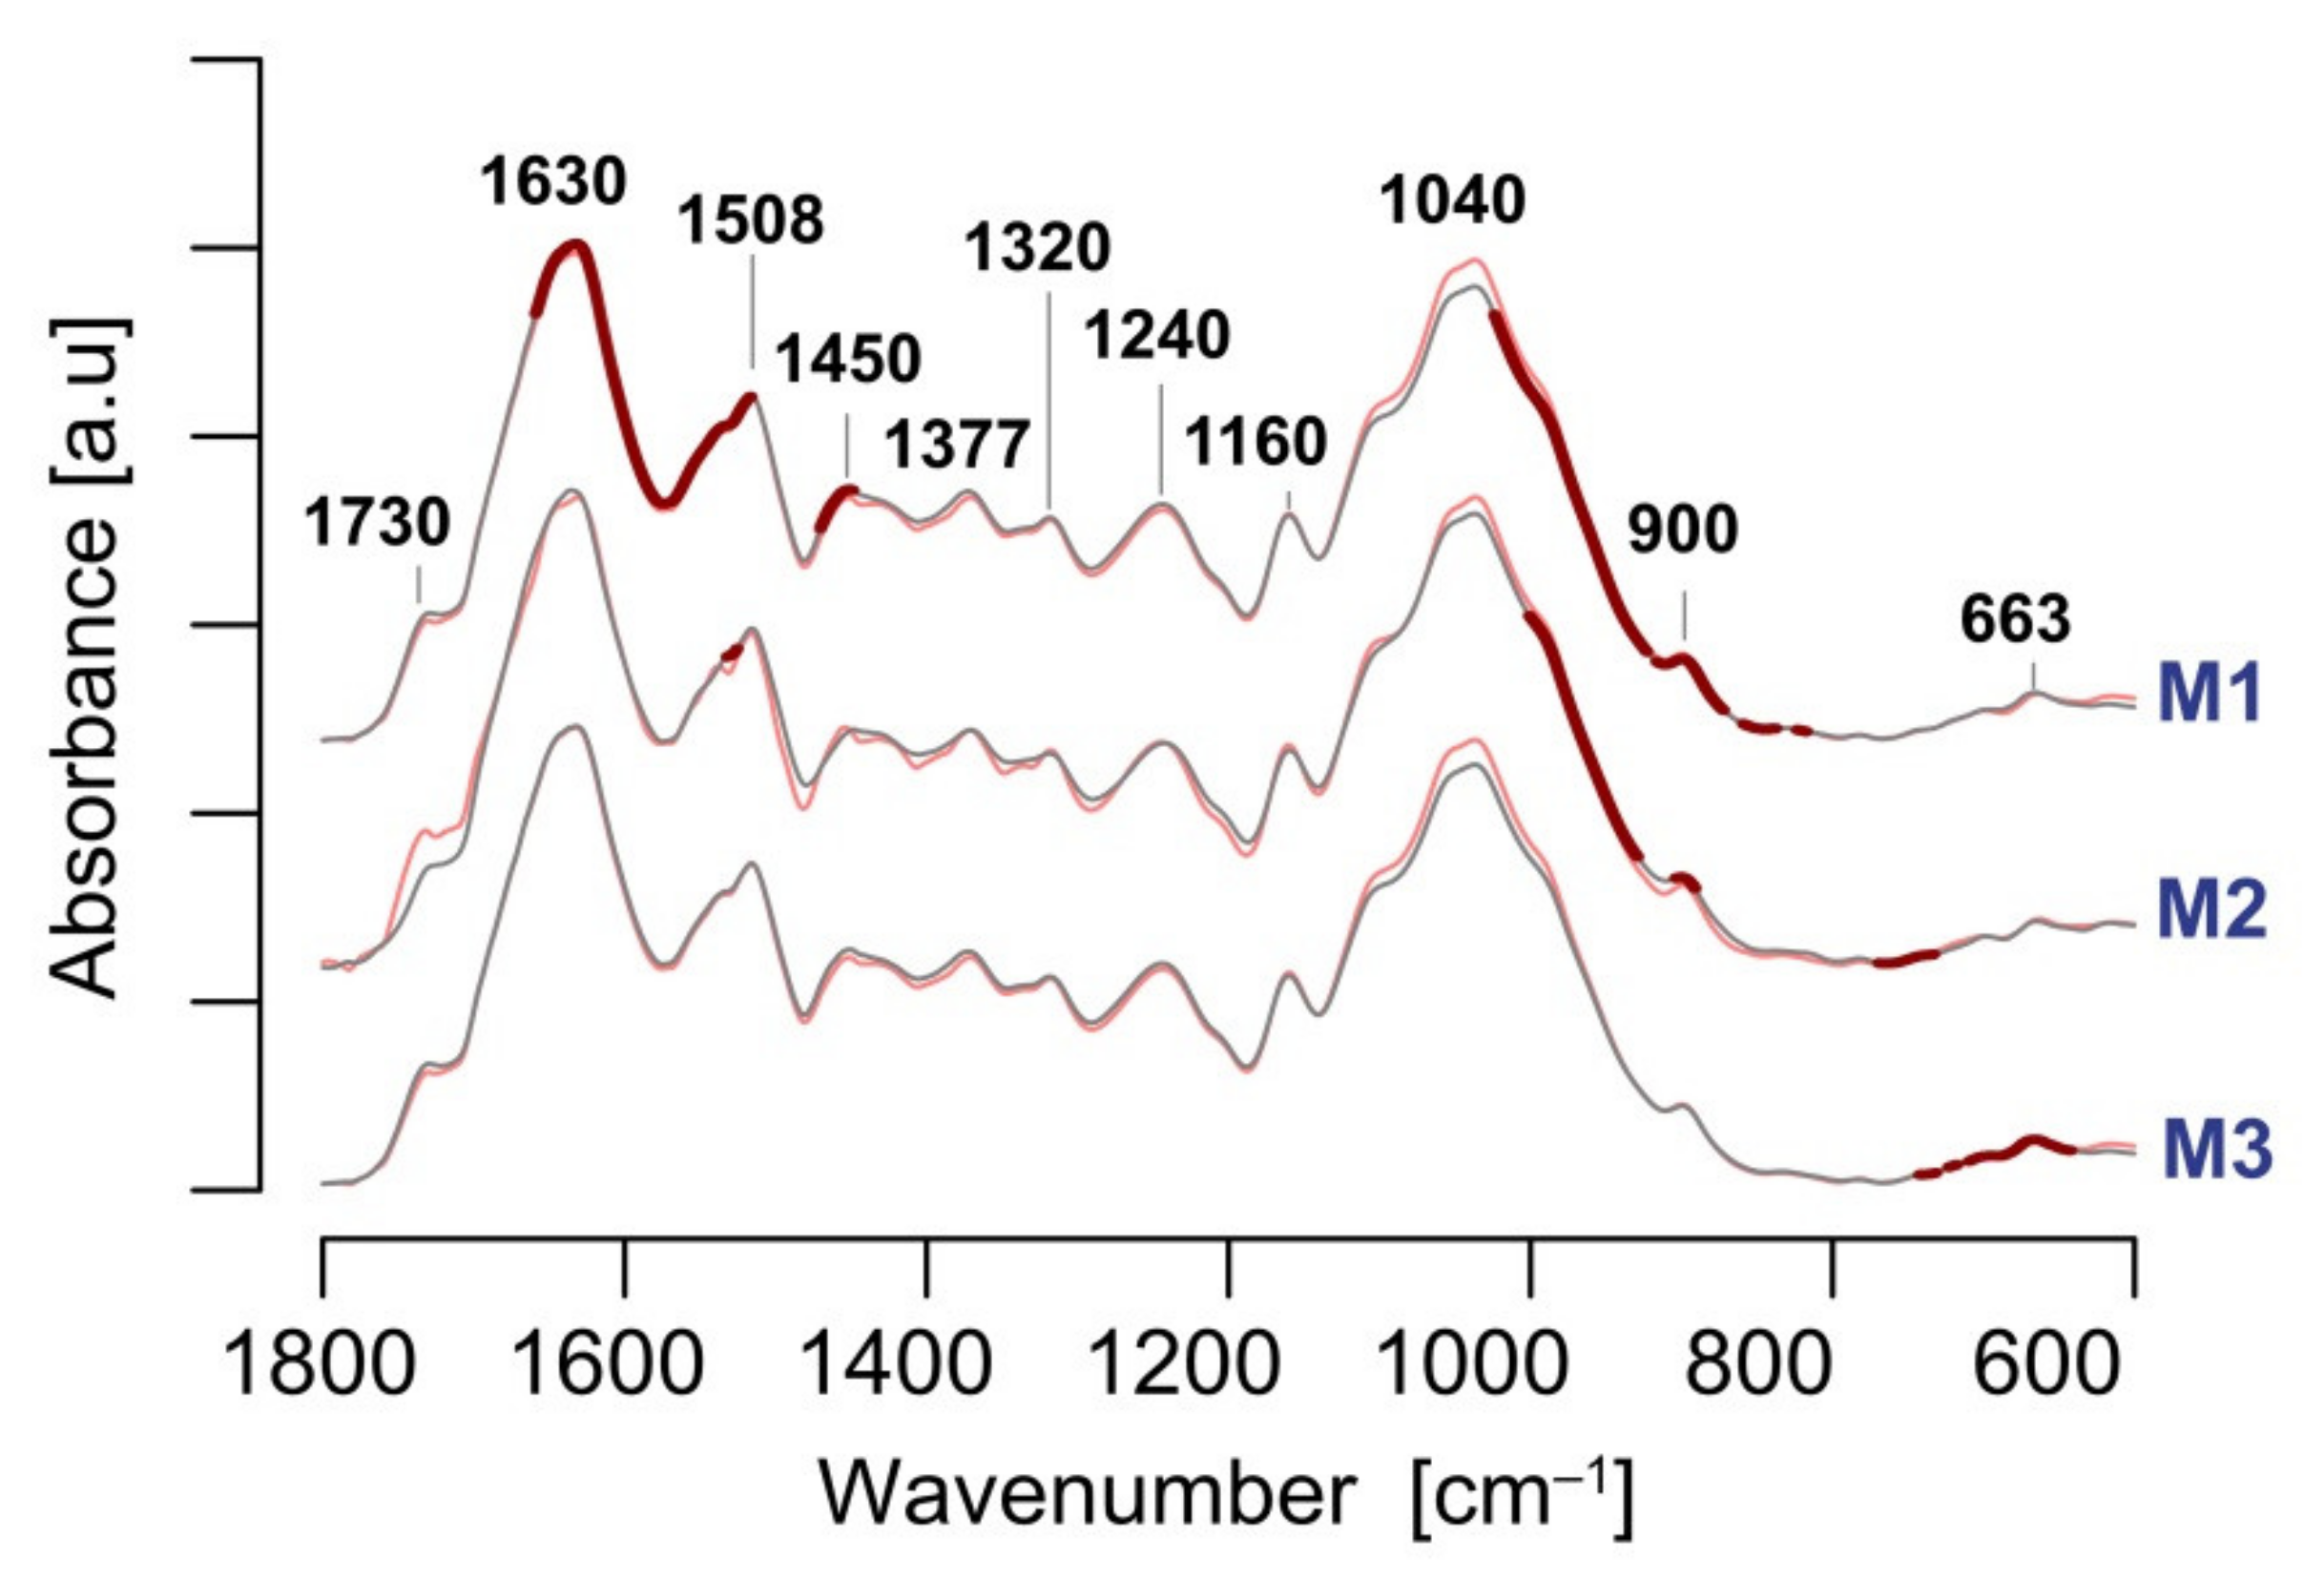
3.4. Infrared Spectroscopy
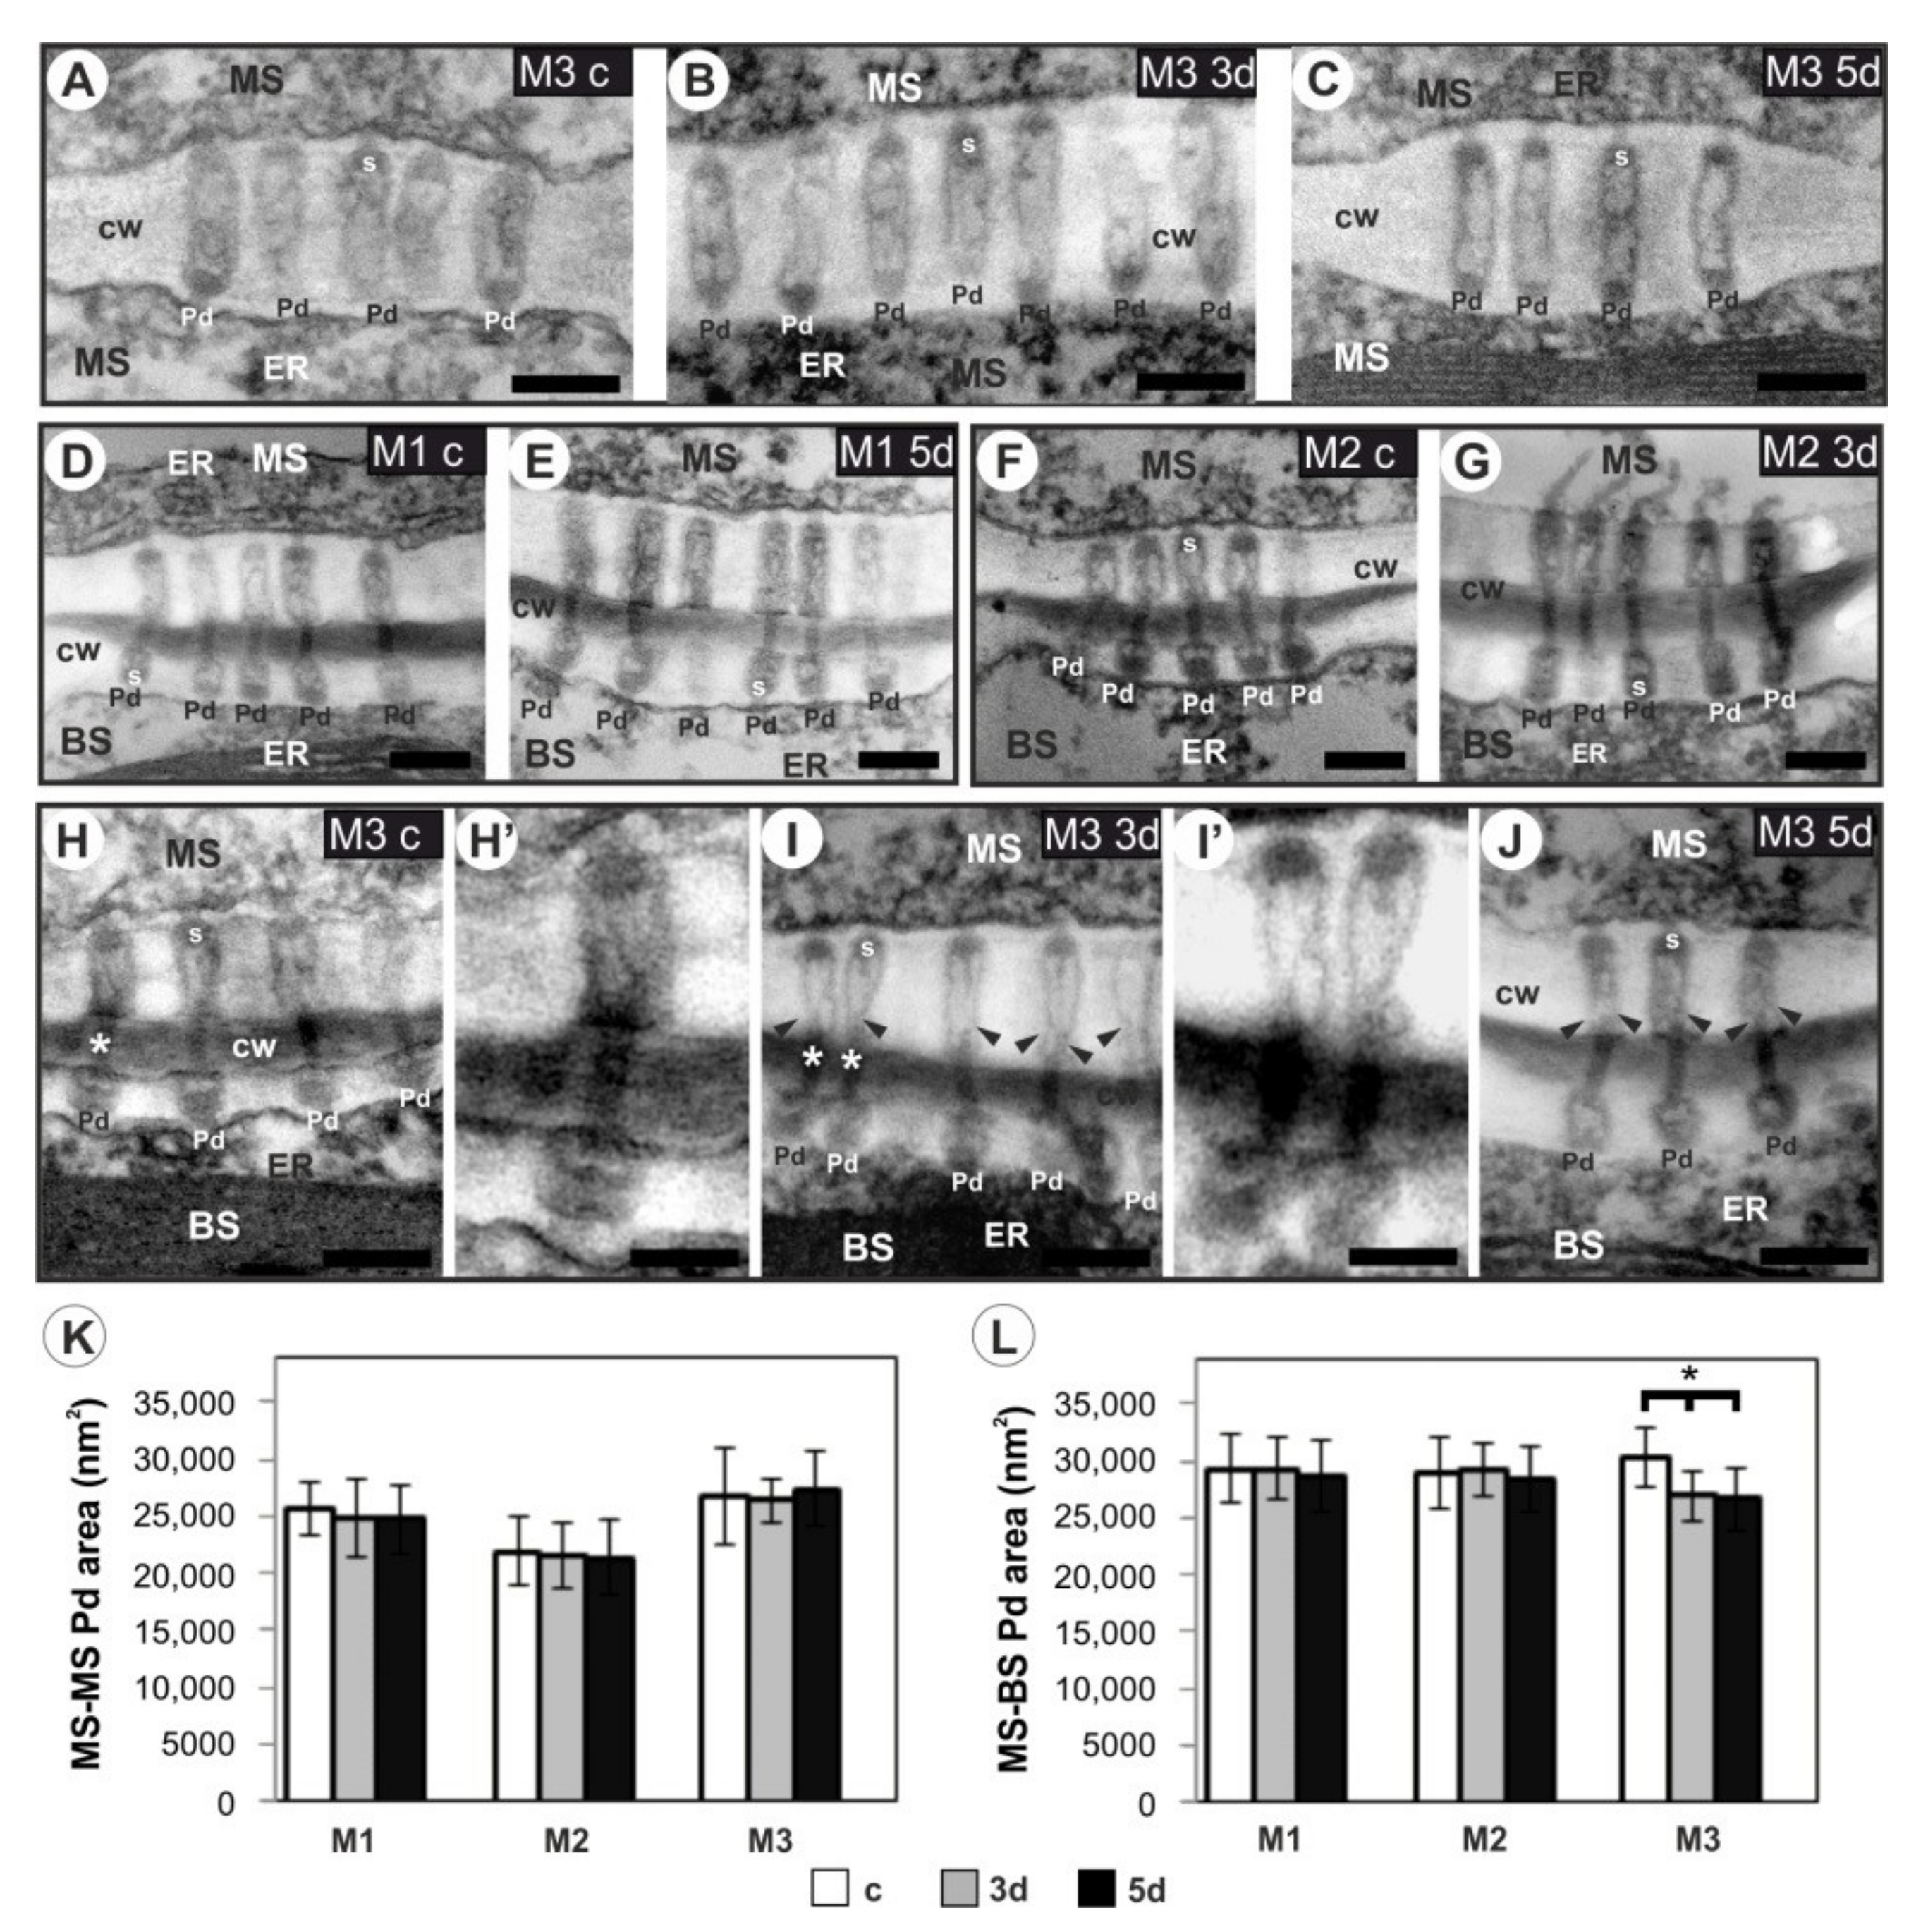
3.5. Plasmodesmata Ultrastructure
4. Discussion
4.1. (Micro)Climatic Conditions of Plantations versus the Adaptability of Photosynthetic Activity of M. giganteus Genotypes to Low Temperature
4.2. Are Cold-Induced Disturbances in Photosynthetic Activity Related to the Plasmodesmata Ultrastructure?
4.3. The Possible Relationship between Photosynthetic Response to Stress and the Leaf Biomechanics
4.4. Cold-Induced Alteration in Biochemical Profile of the Cell Wall Is Temporary and Genotype Dependent
5. Conclusions
Supplementary Materials
Author Contributions
Funding
Institutional Review Board Statement
Informed Consent Statement
Data Availability Statement
Acknowledgments
Conflicts of Interest
References
- Anderson, C.T.; Kieber, J.J. Dynamic Construction, Perception, and Remodeling of Plant Cell Walls. Annu. Rev. Plant Biol. 2020, 71, 39–69. [Google Scholar] [CrossRef]
- Cosgrove, D.J. Plant cell wall extensibility: Connecting plant cell growth with cell wall structure, mechanics, and the action of wall-modifying enzymes. J. Exp. Bot. 2015, 67, 463–476. [Google Scholar] [CrossRef] [PubMed]
- Gall, H.L.; Philippe, F.; Domon, J.-M.; Gillet, F.; Pelloux, J.; Rayon, C. Cell wall metabolism in response to abiotic stress. Plants 2015, 4, 112–166. [Google Scholar] [CrossRef] [PubMed]
- Houston, K.; Tucker, M.R.; Chowdhury, J.; Shirley, N.; Little, A. The Plant Cell Wall: A Complex and Dynamic Structure As Revealed by the Responses of Genes under Stress Conditions. Front. Plant Sci. 2016, 7, 984. [Google Scholar] [CrossRef]
- Zhang, B.; Gao, Y.; Zhang, L.; Zhou, Y. The plant cell wall: Biosynthesis, construction, and functions. J. Integr. Plant Biol. 2021, 63, 251–272. [Google Scholar] [CrossRef]
- Tenhaken, R. Cell wall remodeling under abiotic stress. Front. Plant Sci. 2015, 5, 771. [Google Scholar] [CrossRef]
- Kubacka-Zębalska, M.; Kacperska, A. Low temperature-induced modifications of cell wall content and polysaccharide composition in leaves of winter oilseed rape (Brassica napus L. var. oleifera L.). Plant Sci. 1999, 148, 59–67. [Google Scholar] [CrossRef]
- Parrotta, L.; Faleri, C.; Guerriero, G.; Cai, G. Cold stress affects cell wall deposition and growth pattern in tobacco pollen tubes. Plant Sci. 2019, 283, 329–342. [Google Scholar] [CrossRef]
- Xu, Y.; Hu, D.; Hou, X.; Shen, J.; Liu, J.; Cen, X.; Fu, J.; Li, X.; Hu, H.; Xiong, L. OsTMF attenuates cold tolerance by affecting cell wall properties in rice. New Phytol. 2020, 227, 498–512. [Google Scholar] [CrossRef]
- Zabotin, A.I.; Barisheva, T.S.; Zabotina, O.A.; Larskaya, I.A.; Lozovaya, V.V.; Beldman, G.; Voragen, A.G.J. Alterations in cell walls of winter wheat roots during low temperature acclimation. J. Plant Physiol. 1998, 152, 473–479. [Google Scholar] [CrossRef]
- Solecka, D.; Żebrowski, J.; Kacperska, A. Are pectins involved in cold acclimation and de-acclimation of winter oil-seed rape plants? Ann. Bot. 2008, 101, 521–530. [Google Scholar] [CrossRef]
- Domon, J.M.; Baldwin, L.; Acket, S.; Caudeville, E.; Arnoult, S.; Zub, H.; Gillet, F.; Lejeune-Hénaut, I.; Brancourt-Hulmel, M.; Pelloux, J.; et al. Cell wall compositional modifications of Miscanthus ecotypes in response to cold acclimation. Phytochemistry 2013, 85, 51–61. [Google Scholar] [CrossRef]
- Malinská, H.A.; Vaněk, M.; Nebeská, D.; Šubrt, D.; Brestič, M.; Trögl, J. Plant priming changes physiological properties and lignin content in Miscanthus × Giganteus. Ind. Crops Prod. 2021, 174, 114185. [Google Scholar] [CrossRef]
- Bilska-Kos, A.; Panek, P.; Szulc-Głaz, A.; Ochodzki, P.; Cisło, A.; Zebrowski, J. Chilling-induced physiological, anatomical and biochemical responses in the leaves of Miscanthus × giganteus and maize (Zea mays L.). J. Plant Physiol. 2018, 228, 178–188. [Google Scholar] [CrossRef]
- Solecka, D.; Boudet, A.-M.; Kacperska, A. Phenylpropanoid and anthocyanin changes in low-temperature treated winter oilseed rape leaves. Plant Physiol. Biochem. 1999, 37, 491–496. [Google Scholar] [CrossRef]
- Olenichenko, N.A.; Zagoskina, N.V. Response of Winter Wheat to Cold: Production of Phenolic Compounds and L-Phenylalanine Ammonia Lyase Activity. Appl. Biochem. Microbiol. 2005, 41, 600–603. [Google Scholar] [CrossRef]
- Gong, S.Y.; Huang, G.Q.; Sun, X.; Li, P.; Zhao, L.L.; Zhang, D.J.; Li, X.B. GhAGP31, a cotton non-classical arabinogalactan protein, is involved in response to cold stress during early seedling development. Plant Biol. 2012, 14, 447–457. [Google Scholar] [CrossRef]
- Gothandam, K.M.; Nalini, E.; Karthikeyan, S.; Shin, J. OsPRP3, a flower specific proline-rich protein of rice, determines extracellular matrix structure of floral organs and its overexpression confers cold-tolerance. Plant Mol. Biol. 2010, 72, 125–135. [Google Scholar] [CrossRef]
- Pinski, A.; Betekhtin, A.; Sala, K.; Godel-Jedrychowska, K.; Kurczynska, E.; Hasterok, R. Hydroxyproline-Rich Glycoproteins as Markers of Temperature Stress in the Leaves of Brachypodium distachyon. Int. J. Mol. Sci. 2019, 20, 2571. [Google Scholar] [CrossRef]
- Dohleman, F.G.; Long, S.P. More productive than maize in the midwest: How does Miscanthus do it? Plant Physiol. 2009, 150, 2104–2115. [Google Scholar] [CrossRef]
- Głowacka, K.; Adhikari, S.; Peng, J.; Gifford, J.; Juvik, J.A.; Long, S.P.; Sacks, E.J. Variation in chilling tolerance for photosynthesis and leaf extension growth among genotypes related to the C4 grass Miscanthus × giganteus. J. Exp. Bot. 2014, 65, 5267–5278. [Google Scholar] [CrossRef]
- Fonteyne, S.; Muylle, H.; Lootens, P.; Kerchev, P.; Van den Ende, W.; Staelens, A.; Reheul, D.; Roldan-Ruiz, I. Physiological basis of chilling tolerance and early-season growth in miscanthus. Ann. Bot. 2018, 121, 281–295. [Google Scholar] [CrossRef]
- Beale, C.V.; Bint, D.A.; Long, S.P. Leaf photosynthesis in the C4-grass Miscanthus × giganteus, growing in the cool temperate climate of southern England. J. Exp. Bot. 1996, 47, 267–273. [Google Scholar] [CrossRef]
- Farage, P.K.; Blowers, D.; Long, S.P.; Baker, N.R. Low growth temperatures modify the efficiency of light use by photosystem II for CO2 assimilation in leaves of two chilling-tolerant C4 species, Cyperus longus L. and Miscanthus × giganteus. Plant Cell Environ. 2006, 29, 720–728. [Google Scholar] [CrossRef]
- Głowacka, K.; Jørgensen, U.; Kjeldsen, J.B.; Kørup, K.; Spitz, I.; Sacks, E.J.; Long, S.P. Can the exceptional chilling tolerance of C4 photosynthesis found in Miscanthus × giganteus be exceeded? Screening of a novel Miscanthus Japanese germplasm collection. Ann. Bot. 2015, 115, 981–990. [Google Scholar] [CrossRef]
- Naidu, S.; Long, S. Potential mechanisms of low-temperature tolerance of C4 photosynthesis in Miscanthus × giganteus: An in vivo analysis. Planta 2004, 220, 145–155. [Google Scholar] [CrossRef]
- Naidu, S.L.; Moose, S.P.; AL-Shoaibi, A.K.; Raines, C.A.; Long, S.P. Cold tolerance of C4 photosynthesis in Miscanthus × giganteus: Adaptation in amounts and sequence of C4 photosynthetic enzymes. Plant Physiol. 2003, 132, 1688–1697. [Google Scholar] [CrossRef]
- Wang, D.; Naidu, S.L.; Portis, A.R.; Moose, S.P.; Long, S.P. Can the cold tolerance of C4 photosynthesis in Miscanthus × giganteus relative to Zea mays be explained by differences in activities and thermal properties of Rubisco? J. Exp. Bot. 2008, 59, 1779–1787. [Google Scholar] [CrossRef]
- Wang, D.; Portis, A.R.; Moose, S.P.; Long, S.P. Cool C4 photosynthesis: Pyruvate Pi dikinase expression and activity corresponds to the exceptional cold tolerance of carbon assimilation in Miscanthus × giganteus. Plant Physiol. 2008, 148, 557–567. [Google Scholar] [CrossRef]
- Fonteyne, S.; Lootens, P.; Muylle, H.; van den Ende, W.; de Swaef, T.; Reheul, D.; Roldan-Ruiz, I. Chilling tolerance and early vigour-related characteristics evaluated in two Miscanthus genotypes. Photosynthetica 2016, 54, 295–306. [Google Scholar] [CrossRef]
- Friesen, P.C.; Peixoto, M.M.; Busch, F.A.; Johnson, D.C.; Sage, R.F. Chilling and frost tolerance in Miscanthus and Saccharum genotypes bred for cool temperate climates. J. Exp. Bot. 2014, 65, 3749–3758. [Google Scholar] [CrossRef]
- Bilska-Kos, A.; Mytych, J.; Suski, S.; Magoń, J.; Ochodzki, P.; Zebrowski, J. Sucrose phosphate synthase (SPS), sucrose synthase (SUS) and their products in the leaves of Miscanthus × giganteus and Zea mays at low temperature. Planta 2020, 252, 23. [Google Scholar] [CrossRef]
- Botha, C.E.J. Plasmodesmatal distribution, structure and frequency in relation to assimilation in C3 and C4 grasses in southern Africa. Planta 1992, 187, 348–358. [Google Scholar] [CrossRef]
- Evert, R.F.; Russin, W.A.; Bosabalidis, M. Anatomical and ultrastructural changes associated with sink-to-source transition in developing maize leaves. Int. J. Plant Sci. 1996, 157, 247–261. [Google Scholar] [CrossRef]
- Bilska, A.; Sowiński, P. Closure of plasmodesmata in maize (Zea mays) at low temperature: A new mechanism for inhibition of photosynthesis. Ann. Bot. 2010, 106, 675–686. [Google Scholar] [CrossRef]
- Bilska, A. Regulation of intercellular transport through plasmodesmata under abiotic stresses. In Symplasmic Transport in Vascular Plants; Sokołowska, K., Sowiński, P., Eds.; Springer: New York, NY, USA, 2013; pp. 83–100. [Google Scholar] [CrossRef]
- Read, J.; Stokes, A. Plant biomechanics in an ecological context. Am. J. Bot. 2006, 93, 1546–1565. [Google Scholar] [CrossRef]
- Largo-Gosens, A.; Hernández-Altamirano, M.; García-Calvo, L.; Alonso-Simón, A.; Álvarez, J.; Acebes, J.L. Fourier transform mid infrared spectroscopy applications for monitoring the structural plasticity of plant cell walls. Front. Plant Sci. 2014, 5, 303. [Google Scholar] [CrossRef]
- Niklas, K.J. Plant Biomechanics: An Engineering Approach to Plant Form and Function; The University of Chicago Press: Chicago, IL, USA; London, UK, 1992; p. 607. [Google Scholar]
- Bidhendi, A.J.; Geitmann, A. Relating the mechanics of the primary plant cell wall to morphogenesis. J. Exp. Bot. 2015, 67, 449–461. [Google Scholar] [CrossRef]
- Cosgrove, D.J. Growth of the plant cell wall. Nat. Rev. Mol. Cell Biol. 2005, 6, 850–861. [Google Scholar] [CrossRef]
- Braidwood, L.; Breuer, C.; Sugimoto, K. My body is a cage: Mechanisms and modulation of plant cell growth. New Phytol. 2014, 201, 388–402. [Google Scholar] [CrossRef]
- Peaucelle, A.; Braybrook, S.; Höfte, H. Cell wall mechanics and growth control in plants: The role of pectins revisited. Front. Plant Sci. 2012, 3, 121. [Google Scholar] [CrossRef]
- Podgórska, A.; Burian, M.; Gieczewska, K.; Ostaszewska-Bugajska, M.; Zebrowski, J.; Solecka, D.; Szal, B. Altered cell wall plasticity can restrict plant growth under ammonium nutrition. Front. Plant Sci. 2017, 8, 1344. [Google Scholar] [CrossRef]
- Loades, K.W.; Bengough, A.G.; Bransby, M.F.; Hallett, P.D. Effect of root age on the biomechanics of seminal and nodal roots of barley (Hordeum vulgare L.) in contrasting soil environments. Plant Soil 2015, 395, 253–261. [Google Scholar] [CrossRef]
- Liu, S.; Liu, H.; Jiao, J.; Yin, J.; Lu, T.J.; Xu, F. Biomechanics in plant resistance to drought. Acta Mech. Sin. 2020, 36, 1142–1157. [Google Scholar] [CrossRef]
- Yamamoto, T.; Nakamura, A.; Iwai, H.; Ishii, T.; Ma, J.F.; Yokoyama, R.; Nishitani, K.; Satoh, S.; Furukawa, J. Effect of silicon deficiency on secondary cell wall synthesis in rice leaf. J. Plant Res. 2012, 125, 771–779. [Google Scholar] [CrossRef]
- Hedderson, N.; Balsamo, R.A.; Cooper, K.; Farrant, J.M. Leaf tensile properties of resurrection plants differ among species in their response to drying. S. Afr. J. Bot. 2009, 75, 8–16. [Google Scholar] [CrossRef]
- Cichorz, S.; Gośka, M.; Litwiniec, A. Miscanthus: Genetic diversity and genotype identification using ISSR and RAPD markers. Mol. Biotechnol. 2014, 56, 911–924. [Google Scholar] [CrossRef][Green Version]
- Greef, J.M.; Deuter, M.; Jung, C.; Schondelmaier, J. Genetic diversity of European Miscanthus species revealed by AFLP fingerprinting. Genet. Resour. Crop Evol. 1997, 44, 185–195. [Google Scholar] [CrossRef]
- Clifton-Brown, J.C.; Lewandowski, I.; Andersson, B.; Basch, G.; Christian, D.G.; Kjeldsen, J.B.; Jørgensen, U.; Mortensen, J.V.; Riche, A.B.; Schwarz, K.-U.; et al. Performance of 15 Miscanthus genotypes at five sites in Europe. Agron. J. 2001, 93, 1013–1019. [Google Scholar] [CrossRef]
- Farrell, A.D.; Clifton-Brown, J.C.; Lewandowski, I.; Jones, M.B. Genotypic variation in cold tolerance influences the yield of Miscanthus. Ann. Appl. Biol. 2006, 149, 337–345. [Google Scholar] [CrossRef]
- Murray, M.G.; Thompson, W.F. Rapid isolation of high molecular weight plant DNA. Nucleic Acids Res. 1980, 8, 4321–4325. [Google Scholar] [CrossRef]
- Jaccard, P. Nouvelles recherches sur la distribution florale. Bul. Soc. Vaudoise Sci. Nat. 1908, 44, 223–270. [Google Scholar]
- Benito, B.M. Distantia: Assessing Dissimilarity Between Multivariate Time Series. 2019. Available online: https://CRAN.R-project.org/package=distantia (accessed on 29 October 2019).
- Hanson, B.A. ChemoSpec: Exploratory Chemometrics for Spectroscopy. R Package Version 4.4.97; DePauw University: Greencastle, IN, USA, 2017; Available online: https://CRAN.R-project.org/package=ChemoSpec (accessed on 12 December 2017).
- R Core Team. R. A Language and Environment for Statistical Computing; R Foundation for Statistical Computing: Vienna, Austria, 2021; Available online: http://www.R-project.org (accessed on 31 March 2021).
- Lenth, R.; Singmann, H.; Love, J.; Buerkner, P.; Herve, M. em-means: Estimated Marginal Means, aka Least-Squares Means. 2020. Available online: https://cran.r-project.org/web/packages/emmeans/emmeans (accessed on 8 September 2019).
- Benito, B.M.; Birks, H.J.B. distantia: An open-source toolset to quantify dissimilarity between multivariate ecological time-series. Ecography 2020, 43, 660–667. [Google Scholar] [CrossRef]
- Schopfer, P. Hydroxyl radical-induced cell-wall loosening in vitro and in vivo: Implications for the control of elongation growth. Plant J. 2001, 28, 679–688. [Google Scholar] [CrossRef]
- Faix, O. Classification of lignins from different botanical origins by FTIR spectroscopy. Holzforschung 1991, 45, 21–27. [Google Scholar] [CrossRef]
- Rana, R.; Langenfeld-Heyser, R.; Finkeldey, R.; Polle, A. FTIR spectroscopy, chemical and histochemical characterisation of wood and lignin of five tropical timber wood species of the family of Dipterocarpaceae. Wood Sci. Technol. 2010, 44, 225–242. [Google Scholar] [CrossRef]
- Pandey, K.K. A study of chemical structure of soft and hardwood and wood polymers by FTIR spectroscopy. J. Appl. Polym. Sci. 1999, 71, 1969–1975. [Google Scholar] [CrossRef]
- Abidi, N.; Cabrales, L.; Haigler, C.H. Changes in the cell wall and cellulose content of developing cotton fibers investigated by FTIR spectroscopy. Carbohydr. Polym. 2014, 100, 9–16. [Google Scholar] [CrossRef]
- Cao, C.; Yang, Z.; Han, L.; Jiang, X.; Ji, G. Study on in situ analysis of cellulose, hemicelluloses and lignin distribution linked to tissue structure of crop stalk internodal transverse section based on FTIR microspectroscopic imaging. Cellulose 2015, 22, 139–149. [Google Scholar] [CrossRef]
- Poletto, M.; Zattera, A.J.; Santana, R.M.C. Structural differences between wood species: Evidence from chemical composition, FTIR spectroscopy, and thermogravimetric analysis. J. Appl. Polym. Sci. 2012, 126, E337–E344. [Google Scholar] [CrossRef]
- Danila, F.R.; Quick, W.P.; White, R.G.; Furbank, R.T.; von Caemmerer, S. The metabolite pathway between bundle sheath and mesophyll: Quantification of plasmodesmata in leaves of C3 and C4 monocots. Plant Cell 2016, 28, 1461–1471. [Google Scholar] [CrossRef] [PubMed]
- Evert, R.F.; Eschrich, W.; Heyser, W. Distribution and structure of the plasmodesmata in mesophyll and bundle-sheath cells of Zea mays L. Planta 1977, 136, 77–89. [Google Scholar] [CrossRef] [PubMed]
- Botha, C.E.J.; Cross, R.H.M.; Liu, L. Comparative structure of specialised monocotyledonous leaf blade plasmodesmata. In Plasmodesmata; Oparka, K.J., Ed.; Blackwell Publishing Ltd.: Oxford, UK, 2005; pp. 73–89. [Google Scholar] [CrossRef]
- Hodkinson, T.R.; Chase, M.W.; Renvoize, S.A. Characterization of a Genetic Resource Collection for Miscanthus (Saccharinae, Andropogoneae, Poaceae) using AFLP and ISSR PCR. Ann. Bot. 2002, 89, 627–636. [Google Scholar] [CrossRef] [PubMed]
- Głowacka, K.; Clark, L.V.; Adhikari, S.; Peng, J.; Stewart, J.R.; Nishiwaki, A.; Yamada, T.; Jørgensen, U.; Hodkinson, T.R.; Gifford, J.; et al. Genetic variation in Miscanthus × giganteus and the importance of estimating genetic distance thresholds for differentiating clones. GCB Bioenergy 2015, 7, 386–404. [Google Scholar] [CrossRef]
- Clifton-Brown, J.C.; Lewandowski, I. Overwintering problems of newly established Miscanthus plantations can be overcome by identifying genotypes with improved rhizome cold tolerance. New Phytol. 2000, 148, 287–294. [Google Scholar] [CrossRef]
- Clifton-Brown, J.; Schwarz, K.-U.; Awty-Carroll, D.; Iurato, A.; Meyer, H.; Greef, J.; Gwyn, J.; Mos, M.; Ashman, C.; Hayes, C.; et al. Breeding Strategies to Improve Miscanthus as a Sustainable Source of Biomass for Bioenergy and Biorenewable Products. Agronomy 2019, 9, 673. [Google Scholar] [CrossRef]
- Spyroglou, I.; Rybka, K.; Maldonado Rodriguez, R.; Stefański, P.; Valasevich, N.M. Quantitative estimation of water status in field-grown wheat using beta mixed regression modelling based on fast chlorophyll fluorescence transients: A method for drought tolerance estimation. J. Agro. Crop. Sci. 2021, 207, 1–17. [Google Scholar] [CrossRef]
- Zhang, L.; Xing, D. Rapid determination of the damage to photosynthesis caused by salt and osmotic stresses using delayed fluorescence of chloroplasts. Photochem. Photobiol. Sci. 2008, 7, 352–360. [Google Scholar] [CrossRef]
- Grzybowski, M.; Adamczyk, J.; Jończyk, M.; Sobkowiak, A.; Szczepanik, J.; Frankiewicz, K.; Fronk, J.; Sowiński, P. Increased photosensitivity at early growth as a possible mechanism of maize adaptation to cold springs. J. Exp. Bot. 2019, 70, 2887–2904. [Google Scholar] [CrossRef]
- Shan, X.; Wang, X.; Yang, G.; Wu, Y.; Su, S.; Li, S.; Liu, H.; Yuan, Y. Analysis of the DNA methylation of maize (Zea mays L.) in response to cold stress based on methylation-sensitive amplified polymorphisms. J. Plant Biol. 2013, 56, 32–38. [Google Scholar] [CrossRef]
- Guo, H.; Wu, T.; Li, S.; He, Q.; Yang, Z.; Zhang, W.; Gan, Y.; Sun, P.; Xiang, G.; Zhang, H.; et al. The Methylation Patterns and Transcriptional Responses to Chilling Stress at the Seedling Stage in Rice. Int. J. Mol. Sci. 2019, 20, 5089. [Google Scholar] [CrossRef] [PubMed]
- Park, J.; Lim, C.J.; Shen, M.; Park, H.J.; Cha, J.-Y.; Iniesto, E.; Rubio, V.; Mengiste, T.; Zhu, J.-K.; Bressan, R.A.; et al. Epigenetic switch from repressive to permissive chromatin in response to cold stress. Proc. Natl. Acad. Sci. USA 2018, 115, E5400–E5409. [Google Scholar] [CrossRef] [PubMed]
- Orłowska, R.; Machczyńska, J.; Oleszczuk, S.; Zimny, J.; Bednarek, P.T. DNA methylation changes and TE activity induced in tissue cultures of barley (Hordeum vulgare L.). J. Biol. Res. 2016, 23, 19. [Google Scholar] [CrossRef]
- Zhu, J.; Dong, C.-H.; Zhu, J.-K. Interplay between cold-responsive gene regulation, metabolism and RNA processing during plant cold acclimation. Curr. Opin. Plant Biol. 2007, 10, 290–295. [Google Scholar] [CrossRef]
- Kalinina, O.; Nunn, C.; Sanderson, R.; Hastings, A.F.S.; van der Weijde, T.; Özgüven, M.; Tarakanov, I.; Schüle, H.; Trindade, L.M.; Dolstra, O.; et al. Extending Miscanthus Cultivation with Novel Germplasm at Six Contrasting Sites. Front. Plant Sci. 2017, 8. [Google Scholar] [CrossRef] [PubMed]
- Long, S.P. C4 photosynthesis at low temperatures. Plant Cell Environ. 1983, 6, 345–363. [Google Scholar] [CrossRef]
- Sowiński, P.; Dalbiak, A.; Tadeusiak, J.; Ochodzki, P. Relations between carbohydrate accumulation in leaves, sucrose phosphate synthase activity and photoassimilate transport in chilling treated maize seedlings. Acta Physiol. Plant. 1999, 21, 375–381. [Google Scholar] [CrossRef]
- Baluška, F.; Šamaj, J.; Napier, R.; Volkmann, D. Maize calreticulin localizes preferentially to plasmodesmata in root apex. Plant J. 1999, 19, 481–488. [Google Scholar] [CrossRef]
- Hajihashemi, S.; Brestic, M.; Landi, M.; Skalicky, M. Resistance of Fritillaria imperialis to freezing stress through gene expression, osmotic adjustment and antioxidants. Sci. Rep. 2020, 10, 10427. [Google Scholar] [CrossRef]
- Nadal, M.; Flexas, J.; Gulías, J. Possible link between photosynthesis and leaf modulus of elasticity among vascular plants: A new player in leaf traits relationships? Ecol. Lett. 2018, 21, 1372–1379. [Google Scholar] [CrossRef]
- Onoda, Y.; Wright, I.J.; Evans, J.R.; Hikosaka, K.; Kitajima, K.; Niinemets, Ü.; Poorter, H.; Tosens, T.; Westoby, M. Physiological and structural tradeoffs underlying the leaf economics spectrum. New Phytol. 2017, 214, 1447–1463. [Google Scholar] [CrossRef] [PubMed]
- Terashima, I.; Hanba, Y.T.; Tholen, D.; Niinemets, Ü. Leaf functional anatomy in relation to photosynthesis. Plant Physiol. 2011, 155, 108–116. [Google Scholar] [CrossRef] [PubMed]
- Boczkowska, M.; Zebrowski, J.; Nowosielski, J.; Kordulasińska, I.; Nowosielska, D.; Podyma, W. Environmentally-related genotypic, phenotypic and metabolic diversity of oat (Avena sativa L.) landraces based on 67 Polish accessions. Genet. Resour. Crop Evol. 2017, 64, 1829–1840. [Google Scholar] [CrossRef]
- Castro, R.I.; Morales-Quintana, L. Study of the cell wall components produced during different ripening stages through thermogravimetric analysis. Cellulose 2019, 26, 3009–3020. [Google Scholar] [CrossRef]
- da Silva Leite, R.; Hernandéz-Navarro, S.; do Nascimento, M.N.; Potosme, N.M.R.; Carrión-Prieto, P.; dos Santos Souza, E. Nitrogen fertilization affects Fourier Transform Infrared spectra (FTIR) in Physalis L. species. Comput. Electron. Agric. 2018, 150, 411–417. [Google Scholar] [CrossRef]
- Pongrac, P.; Castillo-Michel, H.; Reyes-Herrera, J.; Hancock, R.D.; Fischer, S.; Kelemen, M.; Thompson, J.A.; Wright, G.; Likar, M.; Broadley, M.R.; et al. Effect of phosphorus supply on root traits of two Brassica oleracea L. genotypes. BMC Plant Biol. 2020, 20, 368. [Google Scholar] [CrossRef] [PubMed]
- Szyjanowicz, P.M.J.; McKinnon, I.; Taylor, N.G.; Gardiner, J.; Jarvis, M.C.; Turner, S.R. The irregular xylem 2 mutant is an allele of korrigan that affects the secondary cell wall of Arabidopsis thaliana. Plant J. 2004, 37, 730–740. [Google Scholar] [CrossRef]
- Brown, C.; Martin, A.P.; Grof, C.P.L. The application of Fourier transform mid-infrared (FTIR) spectroscopy to identify variation in cell wall composition of Setaria italica ecotypes. J. Integr. Agric. 2017, 16, 1256–1267. [Google Scholar] [CrossRef]
- da Costa, R.M.F.; Lee, S.J.; Allison, G.G.; Hazen, S.P.; Winters, A.; Bosch, M. Genotype, development and tissue-derived variation of cell-wall properties in the lignocellulosic energy crop Miscanthus. Ann. Bot. 2014, 114, 1265–1277. [Google Scholar] [CrossRef]
- Bergs, M.; Völkering, G.; Kraska, T.; Pude, R.; Do, X.T.; Kusch, P.; Monakhova, Y.; Konow, C.; Schulze, M. Miscanthus × giganteus stem versus leaf-derived lignins differing in monolignol ratio and linkage. Int. J. Mol. Sci. 2019, 20, 1200. [Google Scholar] [CrossRef]
- Su, X.-J.; Zhang, C.-Y.; Li, W.-J.; Wang, F.; Wang, K.-Q.; Liu, Y.; Li, Q.-M. Radiation-Induced Structural Changes of Miscanthus Biomass. Appl. Sci. 2020, 10, 1130. [Google Scholar] [CrossRef]
- Bergs, M.; Do, X.T.; Rumpf, J.; Kusch, P.; Monakhova, Y.; Konow, C.; Völkering, G.; Pude, R.; Schulze, M. Comparing chemical composition and lignin structure of Miscanthus × giganteus and Miscanthus nagara harvested in autumn and spring and separated into stems and leaves. RSC Adv. 2020, 10, 10740–10751. [Google Scholar] [CrossRef]
- Boakye-Boaten, N.A.; Xiu, S.; Shahbazi, A.; Wang, L.; Li, R.; Mims, M.; Schimmel, K. Effects of fertilizer application and dry/wet processing of Miscanthus × giganteus on bioethanol production. Bioresour. Technol. 2016, 204, 98–105. [Google Scholar] [CrossRef] [PubMed]
- Auxenfans, T.; Crônier, D.; Chabbert, B.; Paës, G. Understanding the structural and chemical changes of plant biomass following steam explosion pretreatment. Biotechnol. Biofuels 2017, 10, 36. [Google Scholar] [CrossRef]


Publisher’s Note: MDPI stays neutral with regard to jurisdictional claims in published maps and institutional affiliations. |
© 2022 by the authors. Licensee MDPI, Basel, Switzerland. This article is an open access article distributed under the terms and conditions of the Creative Commons Attribution (CC BY) license (https://creativecommons.org/licenses/by/4.0/).
Share and Cite
Bilska-Kos, A.; Pietrusińska, A.; Suski, S.; Niedziela, A.; Linkiewicz, A.M.; Majtkowski, W.; Żurek, G.; Zebrowski, J. Cell Wall Properties Determine Genotype-Specific Response to Cold in Miscanthus × giganteus Plants. Cells 2022, 11, 547. https://doi.org/10.3390/cells11030547
Bilska-Kos A, Pietrusińska A, Suski S, Niedziela A, Linkiewicz AM, Majtkowski W, Żurek G, Zebrowski J. Cell Wall Properties Determine Genotype-Specific Response to Cold in Miscanthus × giganteus Plants. Cells. 2022; 11(3):547. https://doi.org/10.3390/cells11030547
Chicago/Turabian StyleBilska-Kos, Anna, Aleksandra Pietrusińska, Szymon Suski, Agnieszka Niedziela, Anna M. Linkiewicz, Włodzimierz Majtkowski, Grzegorz Żurek, and Jacek Zebrowski. 2022. "Cell Wall Properties Determine Genotype-Specific Response to Cold in Miscanthus × giganteus Plants" Cells 11, no. 3: 547. https://doi.org/10.3390/cells11030547
APA StyleBilska-Kos, A., Pietrusińska, A., Suski, S., Niedziela, A., Linkiewicz, A. M., Majtkowski, W., Żurek, G., & Zebrowski, J. (2022). Cell Wall Properties Determine Genotype-Specific Response to Cold in Miscanthus × giganteus Plants. Cells, 11(3), 547. https://doi.org/10.3390/cells11030547