
Deltamethrin-Evoked ER Stress Promotes Neuroinflammation in the Adult Mouse Hippocampus


Abstract
:1. Introduction
2. Materials and Methods
2.1. Animals
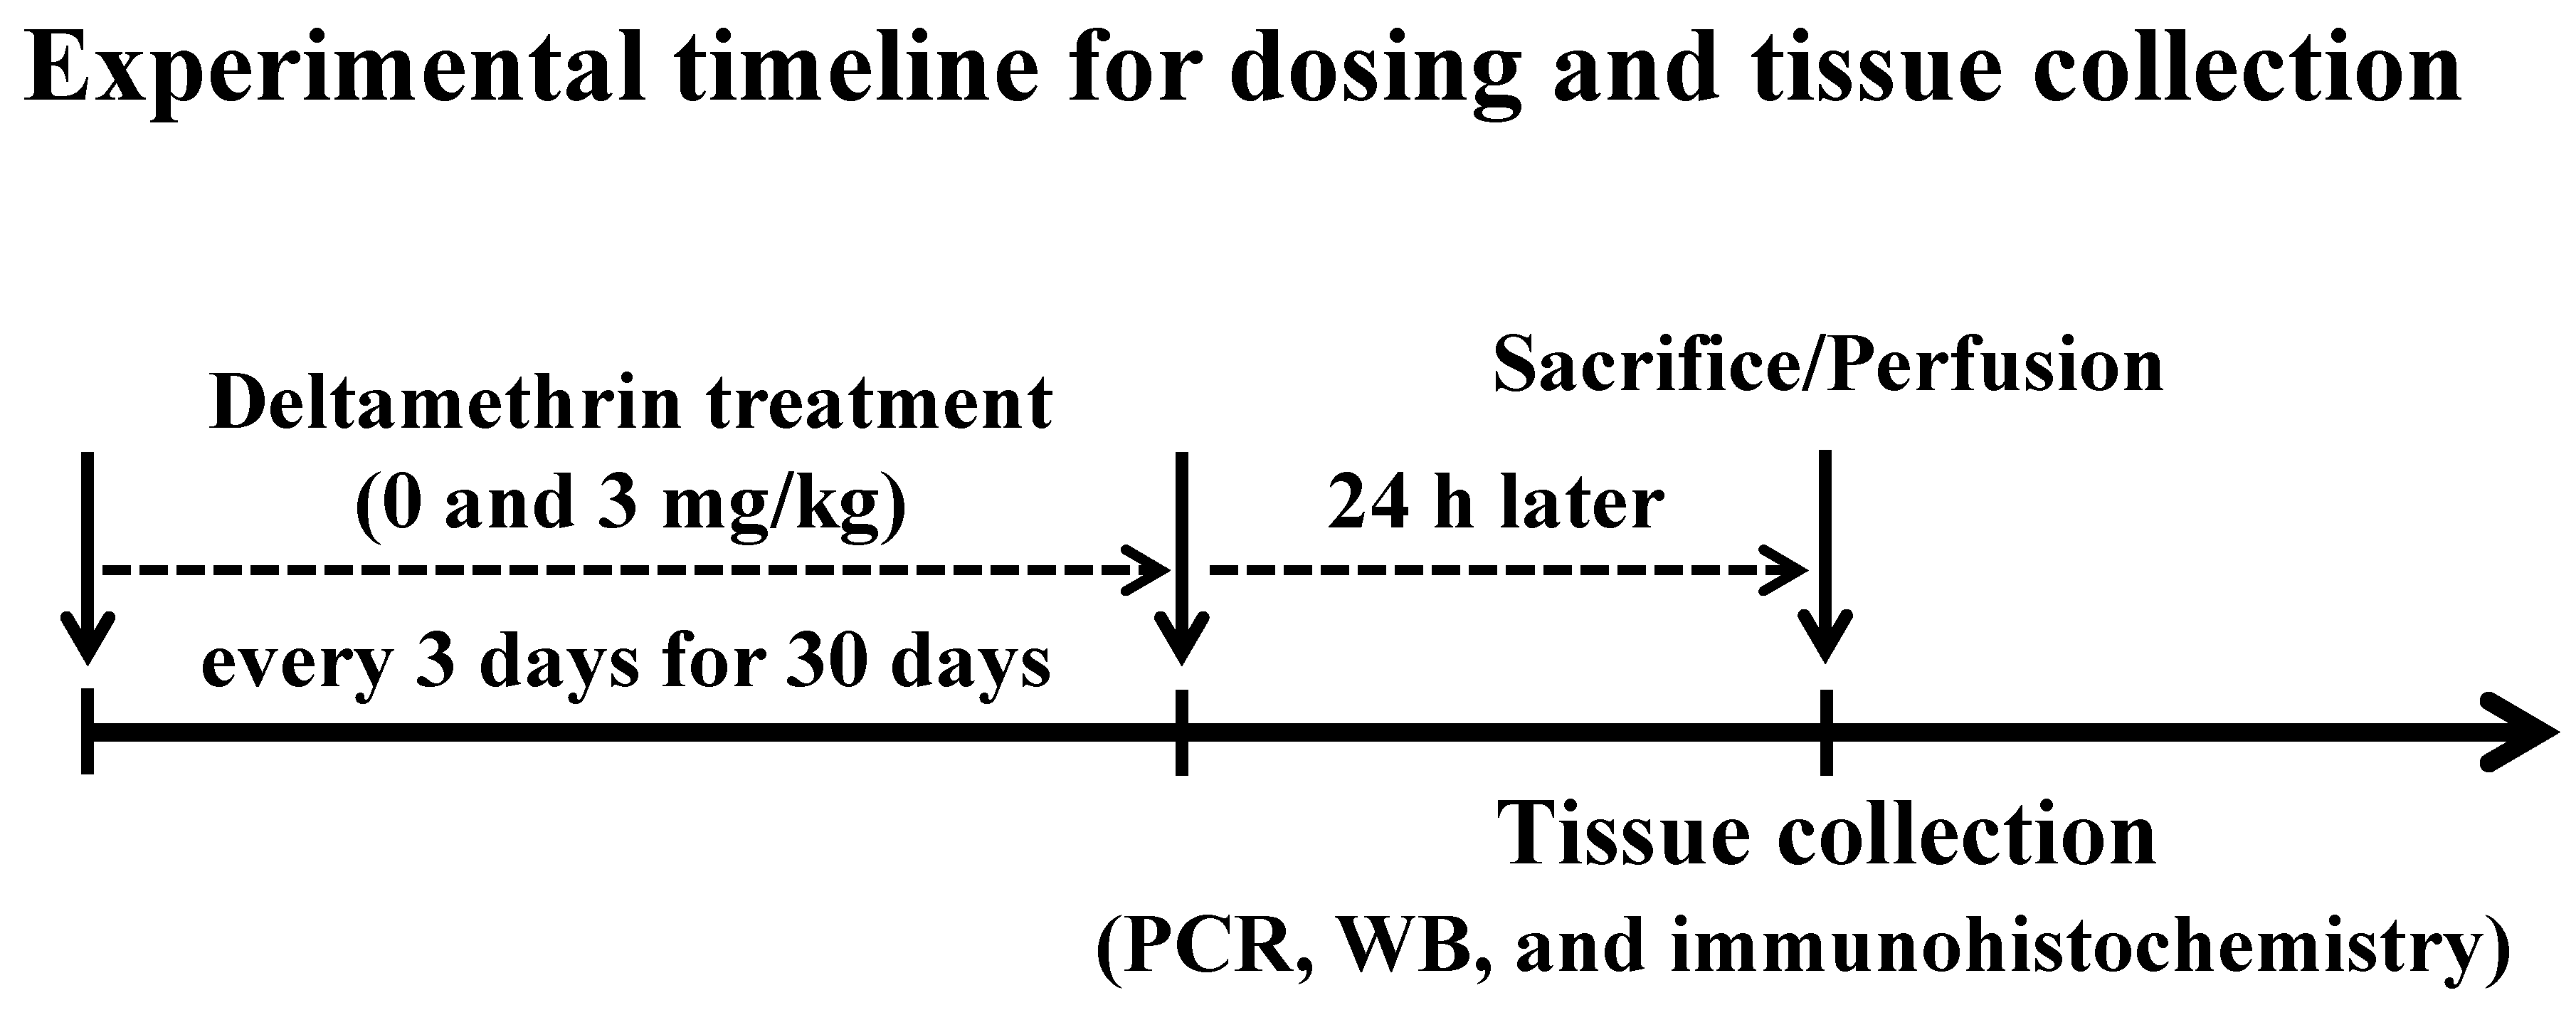
2.2. Treatment
2.3. Cell Culture
2.4. Reactive Oxygen Species (ROS) Assay
2.5. Intracellular Glutathione (GSH) Assay
2.6. RNA Isolation and Real-Time Quantitative Polymerase Chain Reaction (qPCR)
2.7. Western Blot Analysis
2.8. Immunohistochemistry and Immunocytochemistry
2.9. Statistical Analysis
3. Results
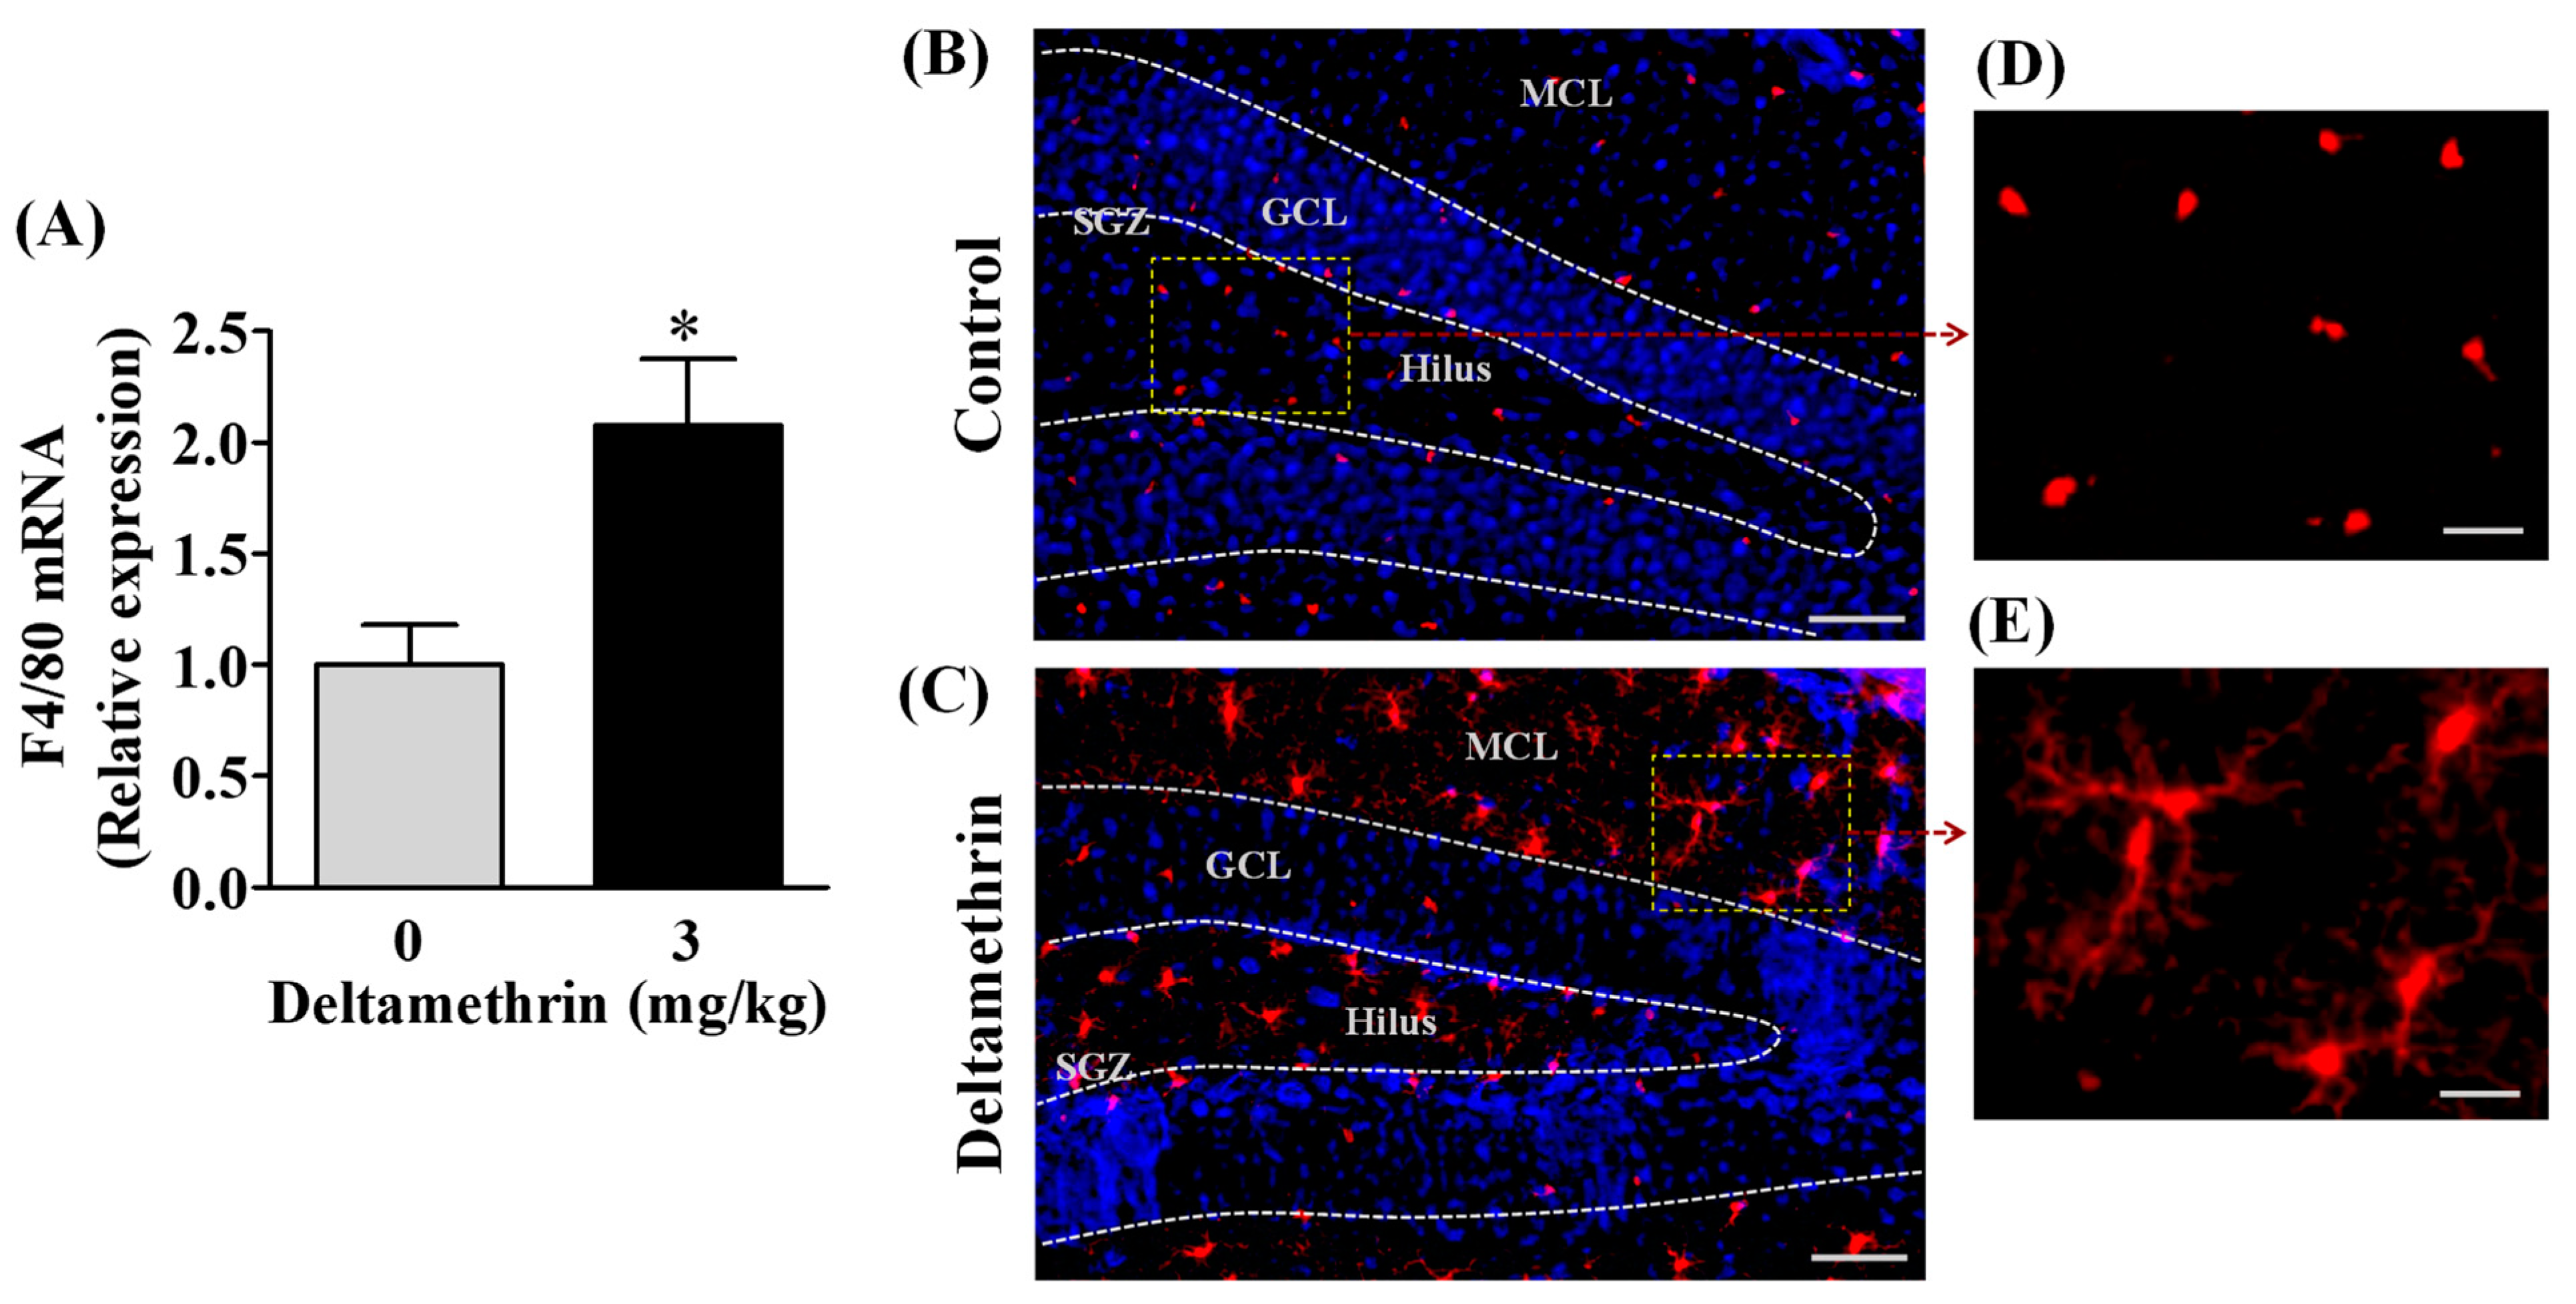
3.1. Repeated Exposure to Deltamethrin Increases F4/80 mRNA Expression and Activates Microglia in the Hippocampus of Adult Mice
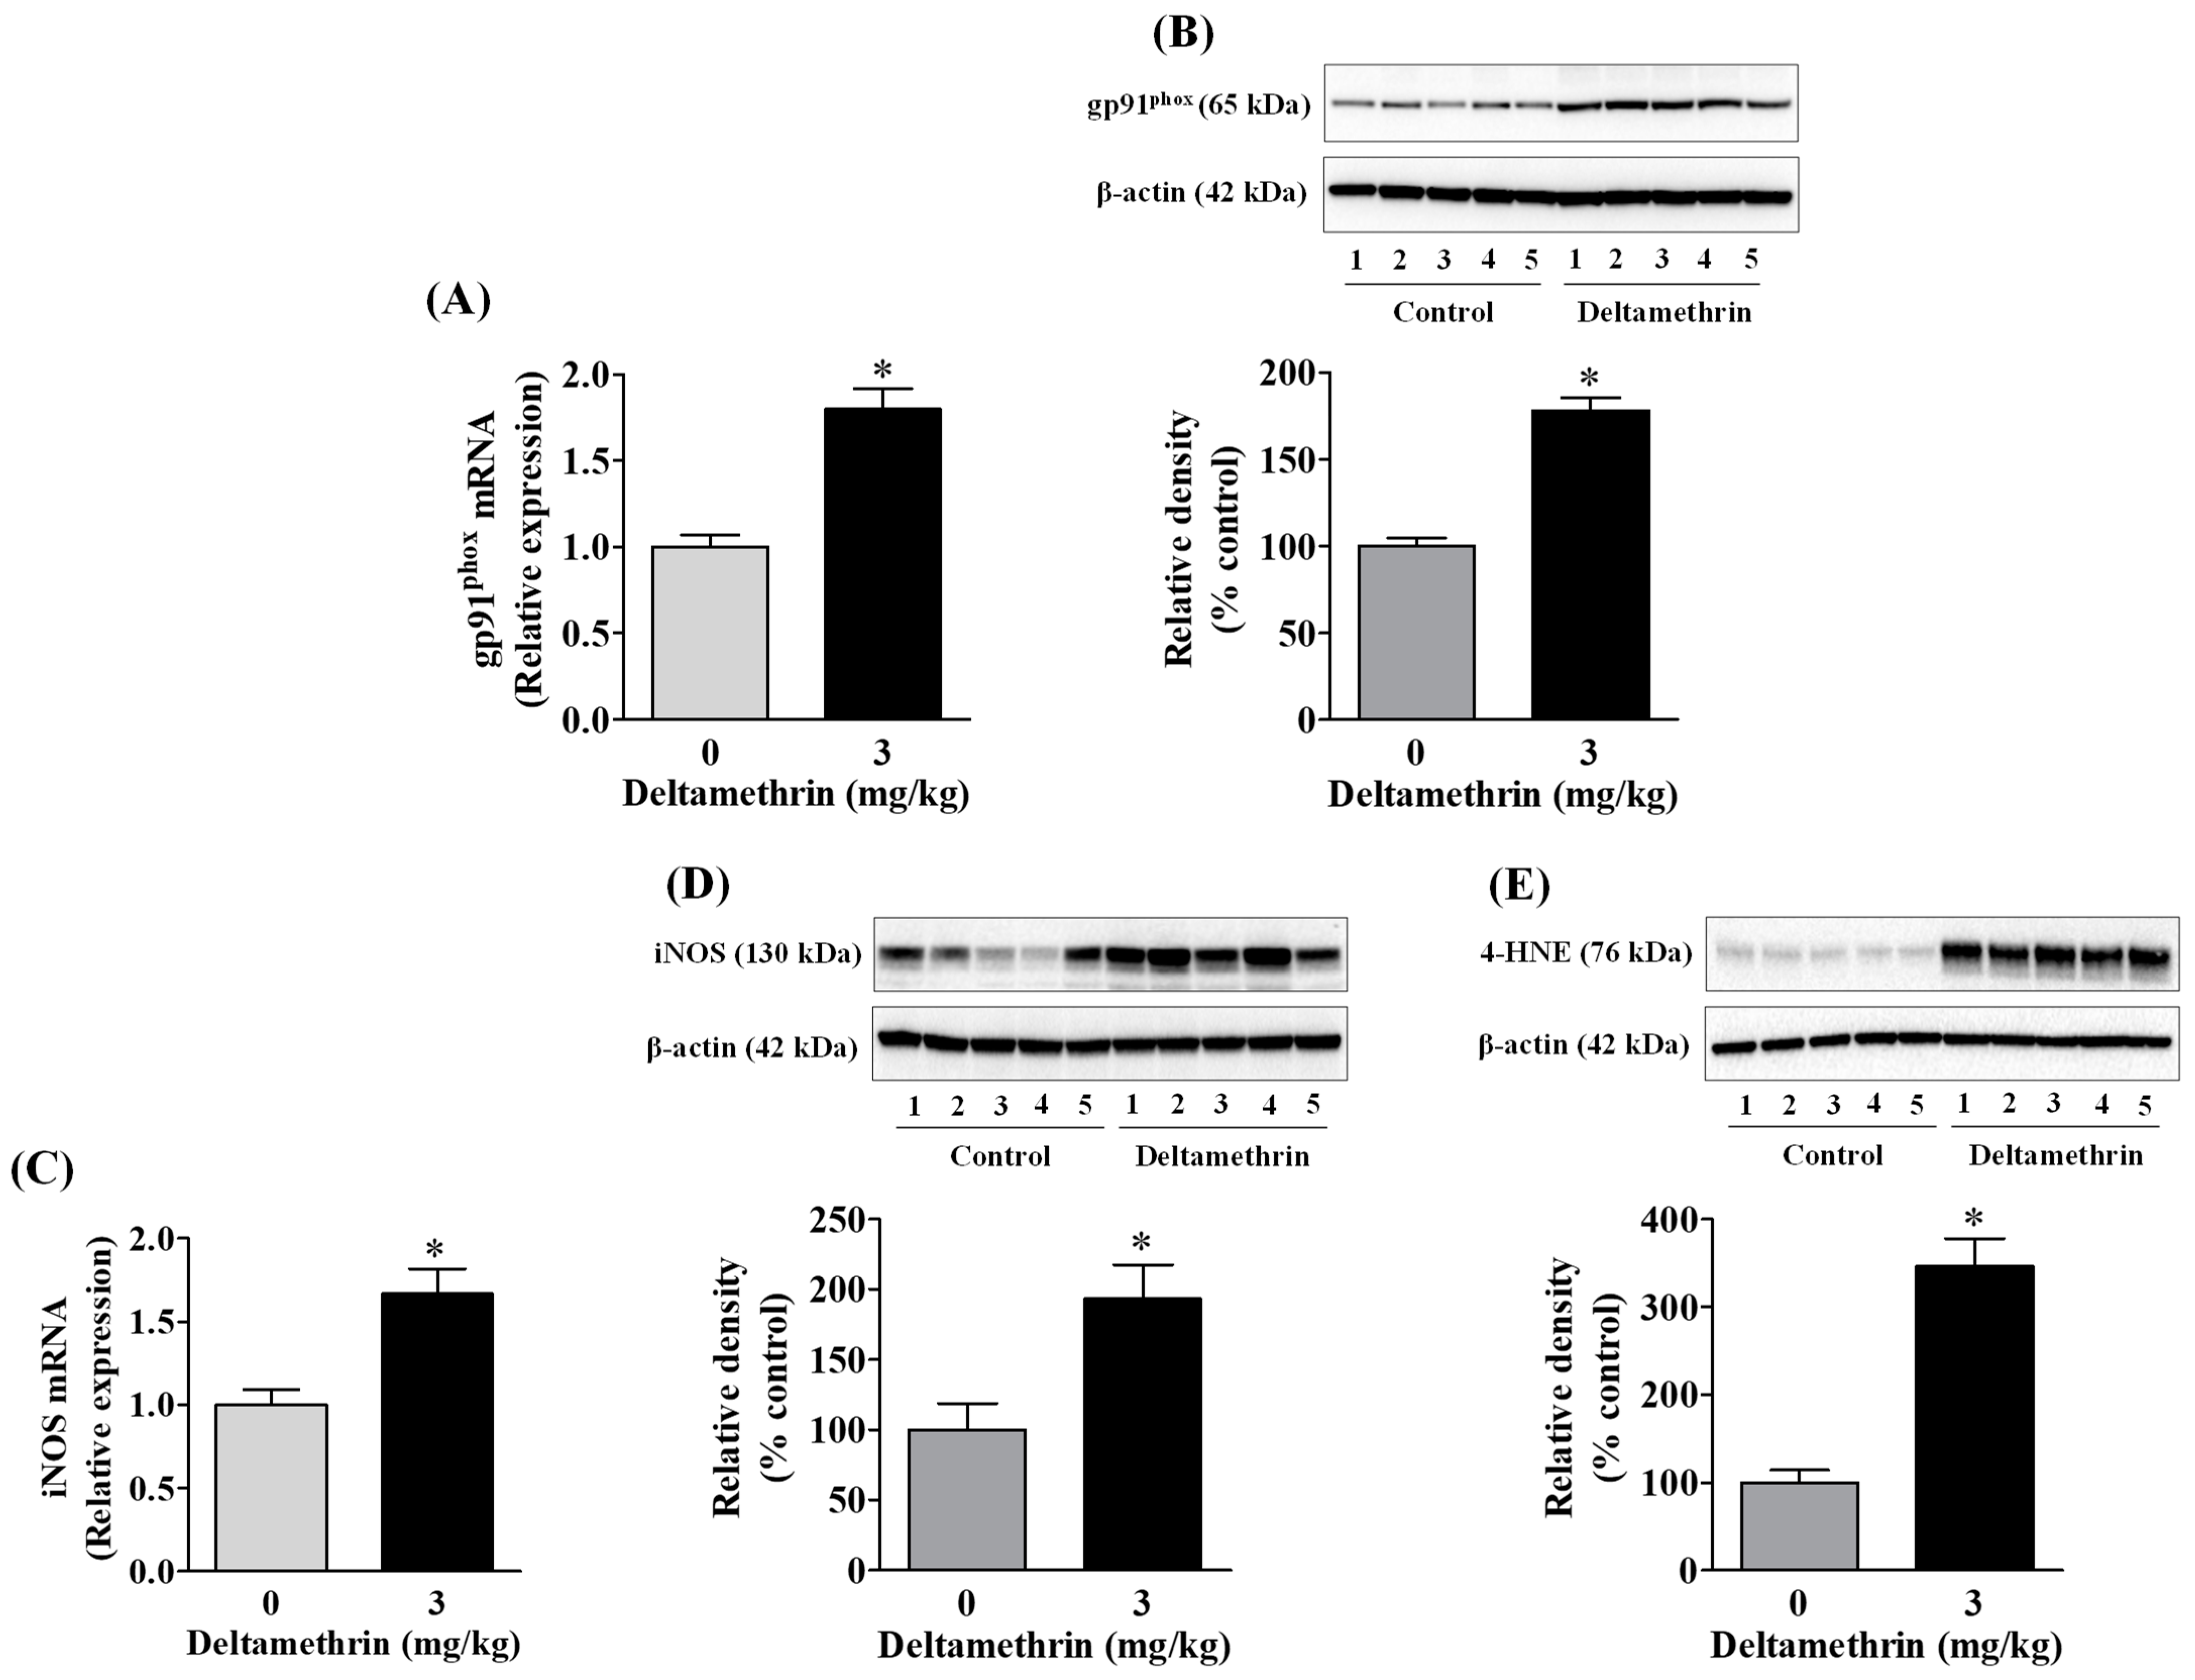
3.2. Deltamethrin Increases Oxidative and Nitrosative Enzymes in the Mouse Hippocampus
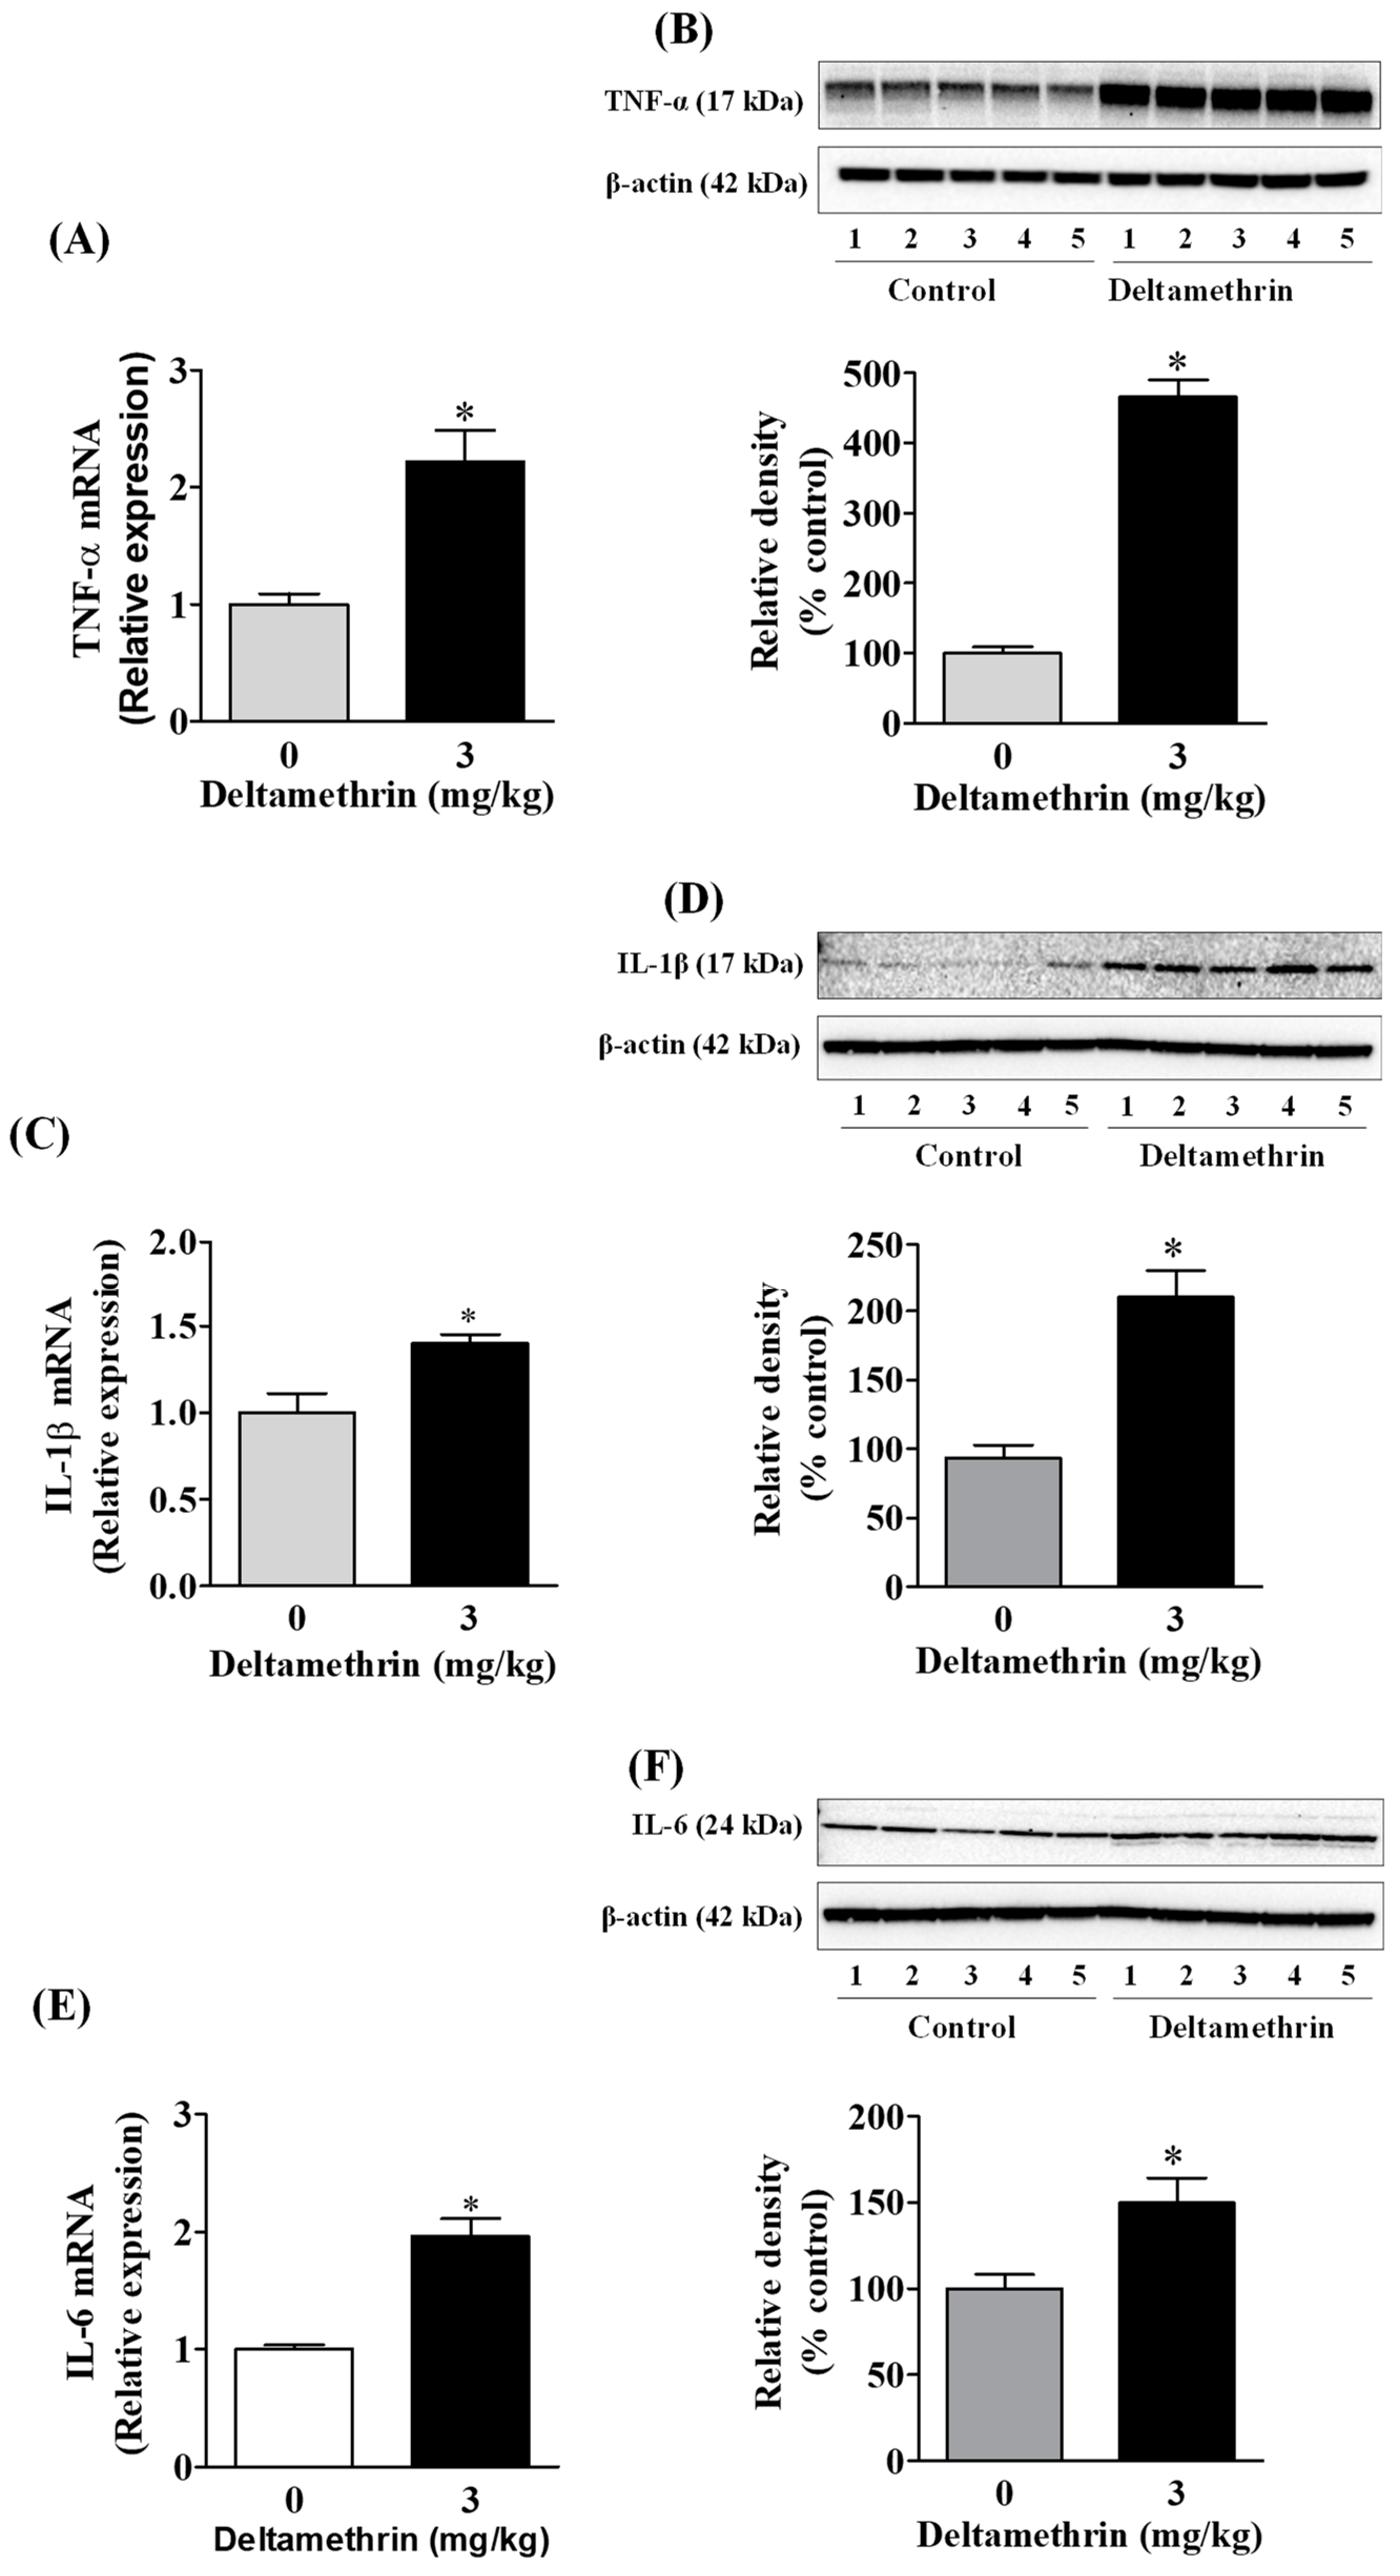
3.3. Deltamethrin Exposure Induces Neuroinflammation in the Mouse Hippocampus
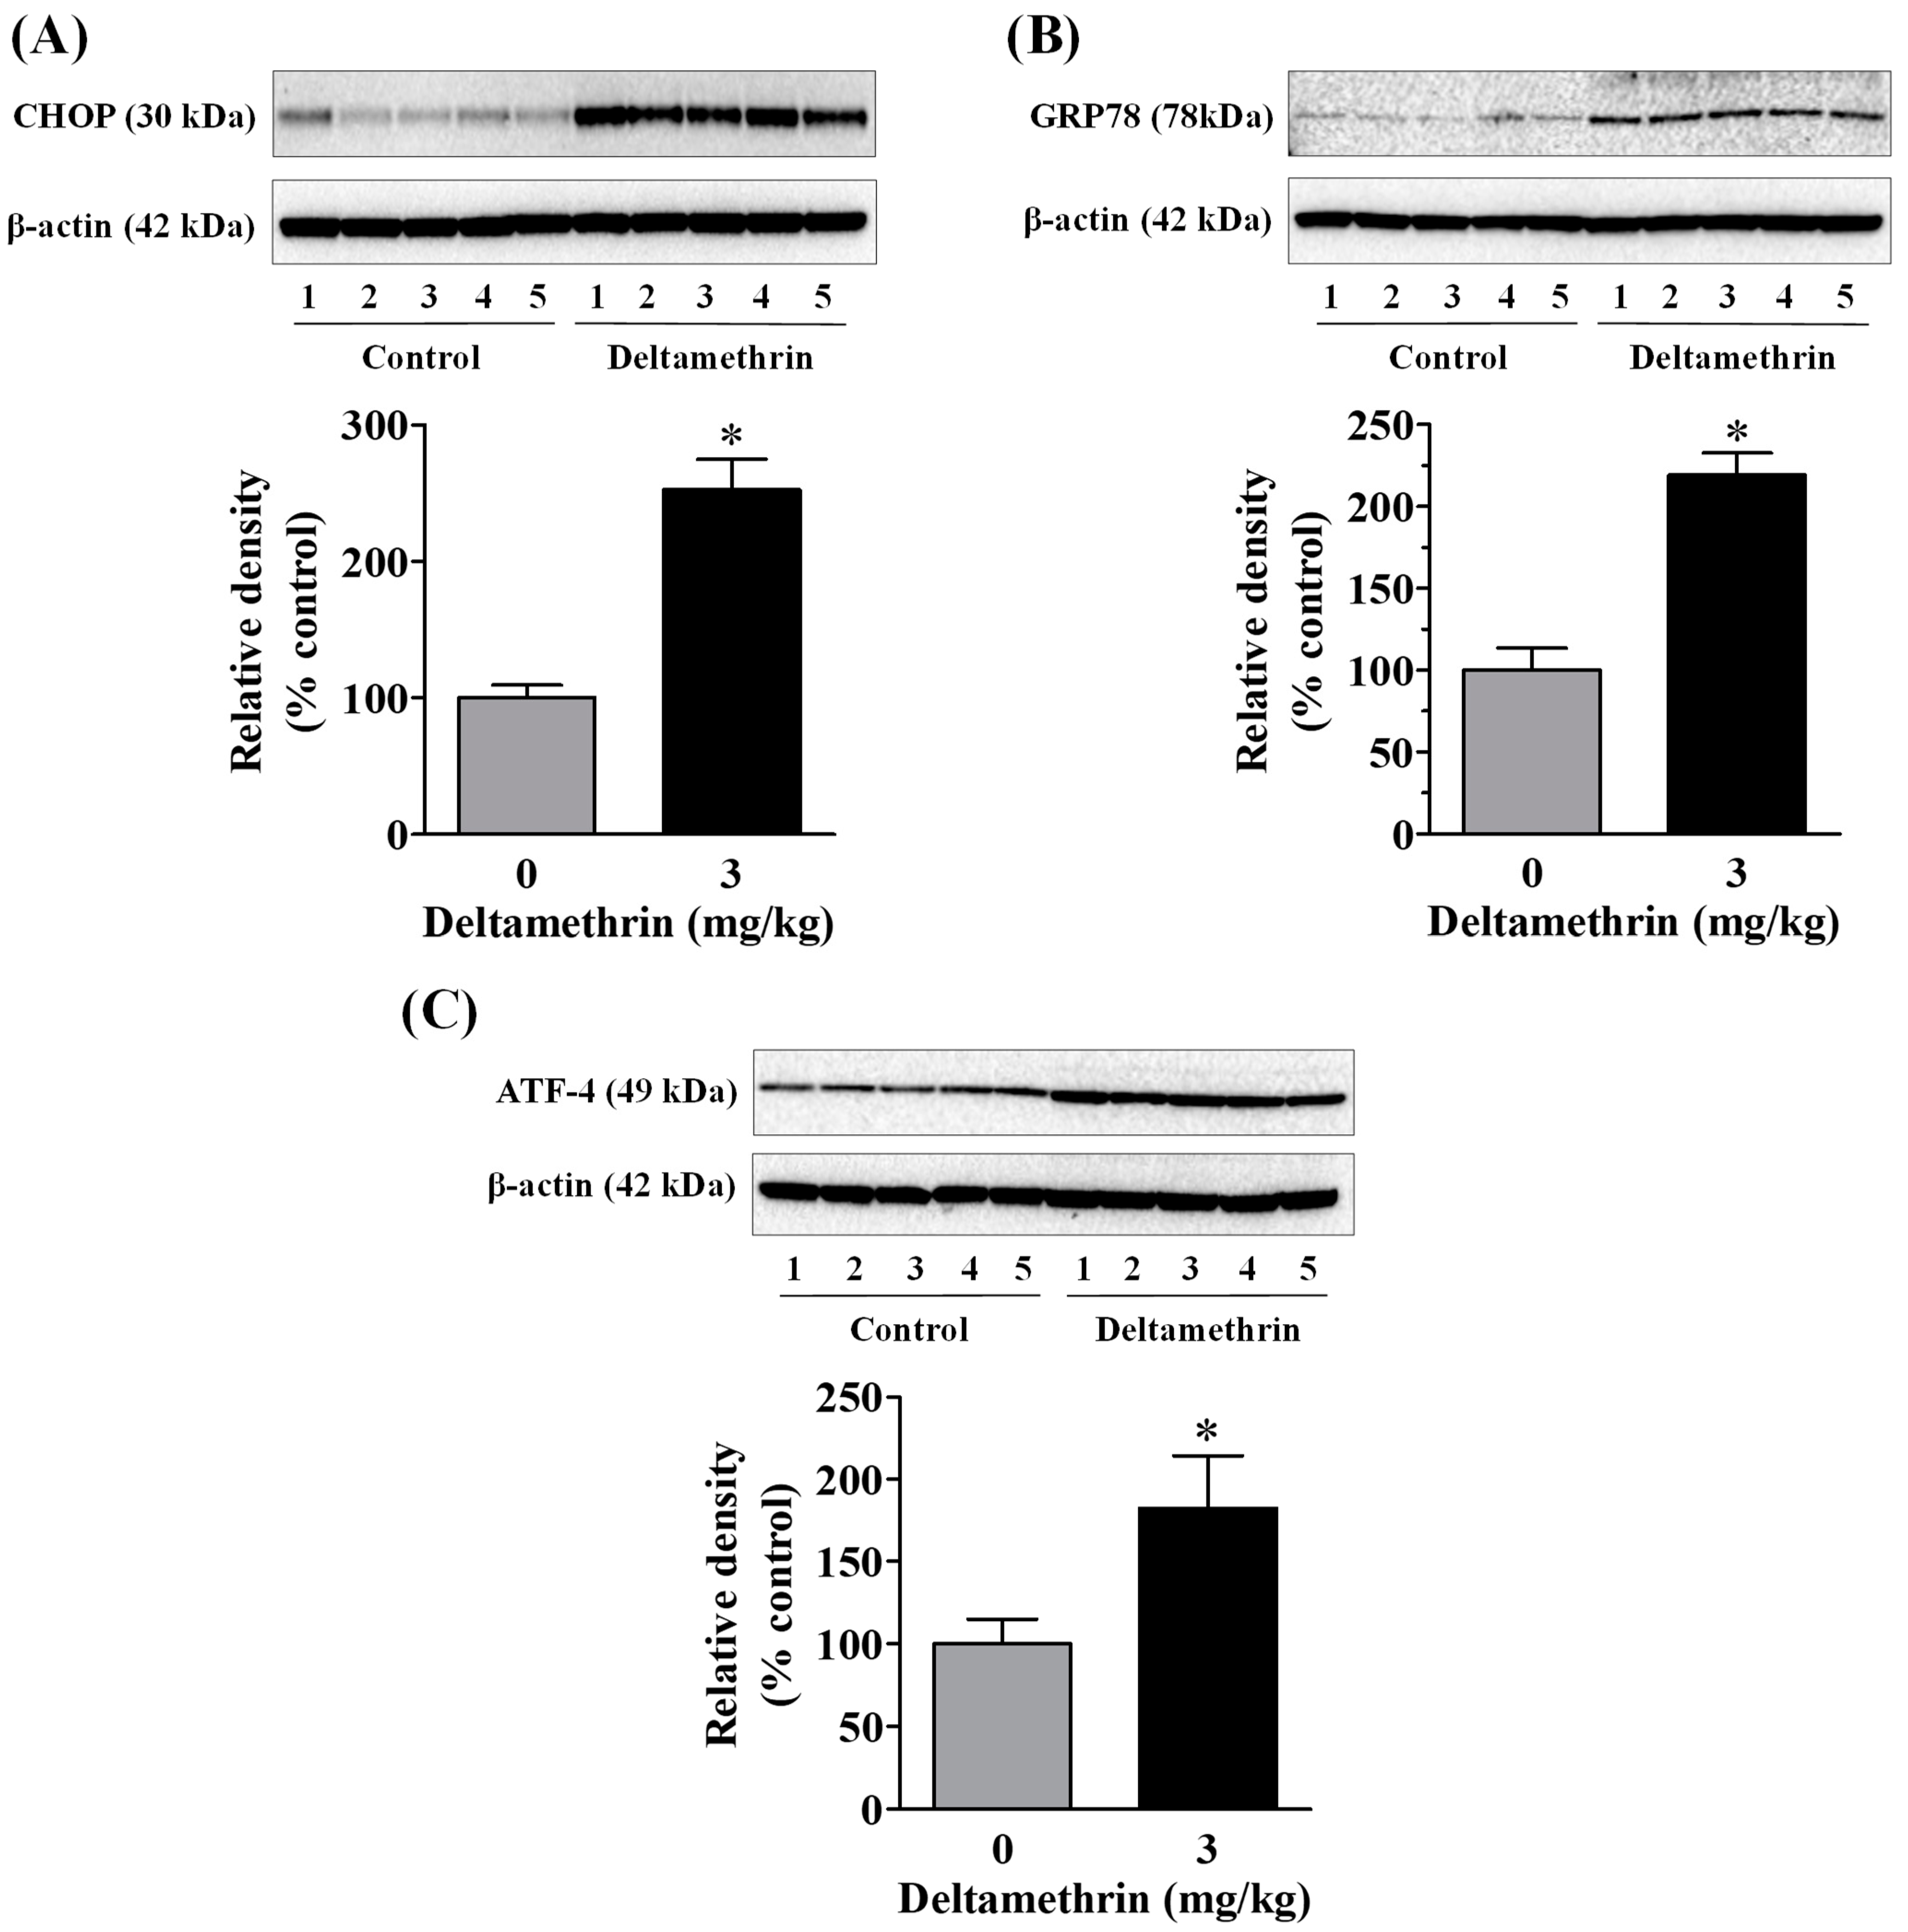
3.4. Exposure to Deltamethrin Causes Hippocampal ER Stress in Mice
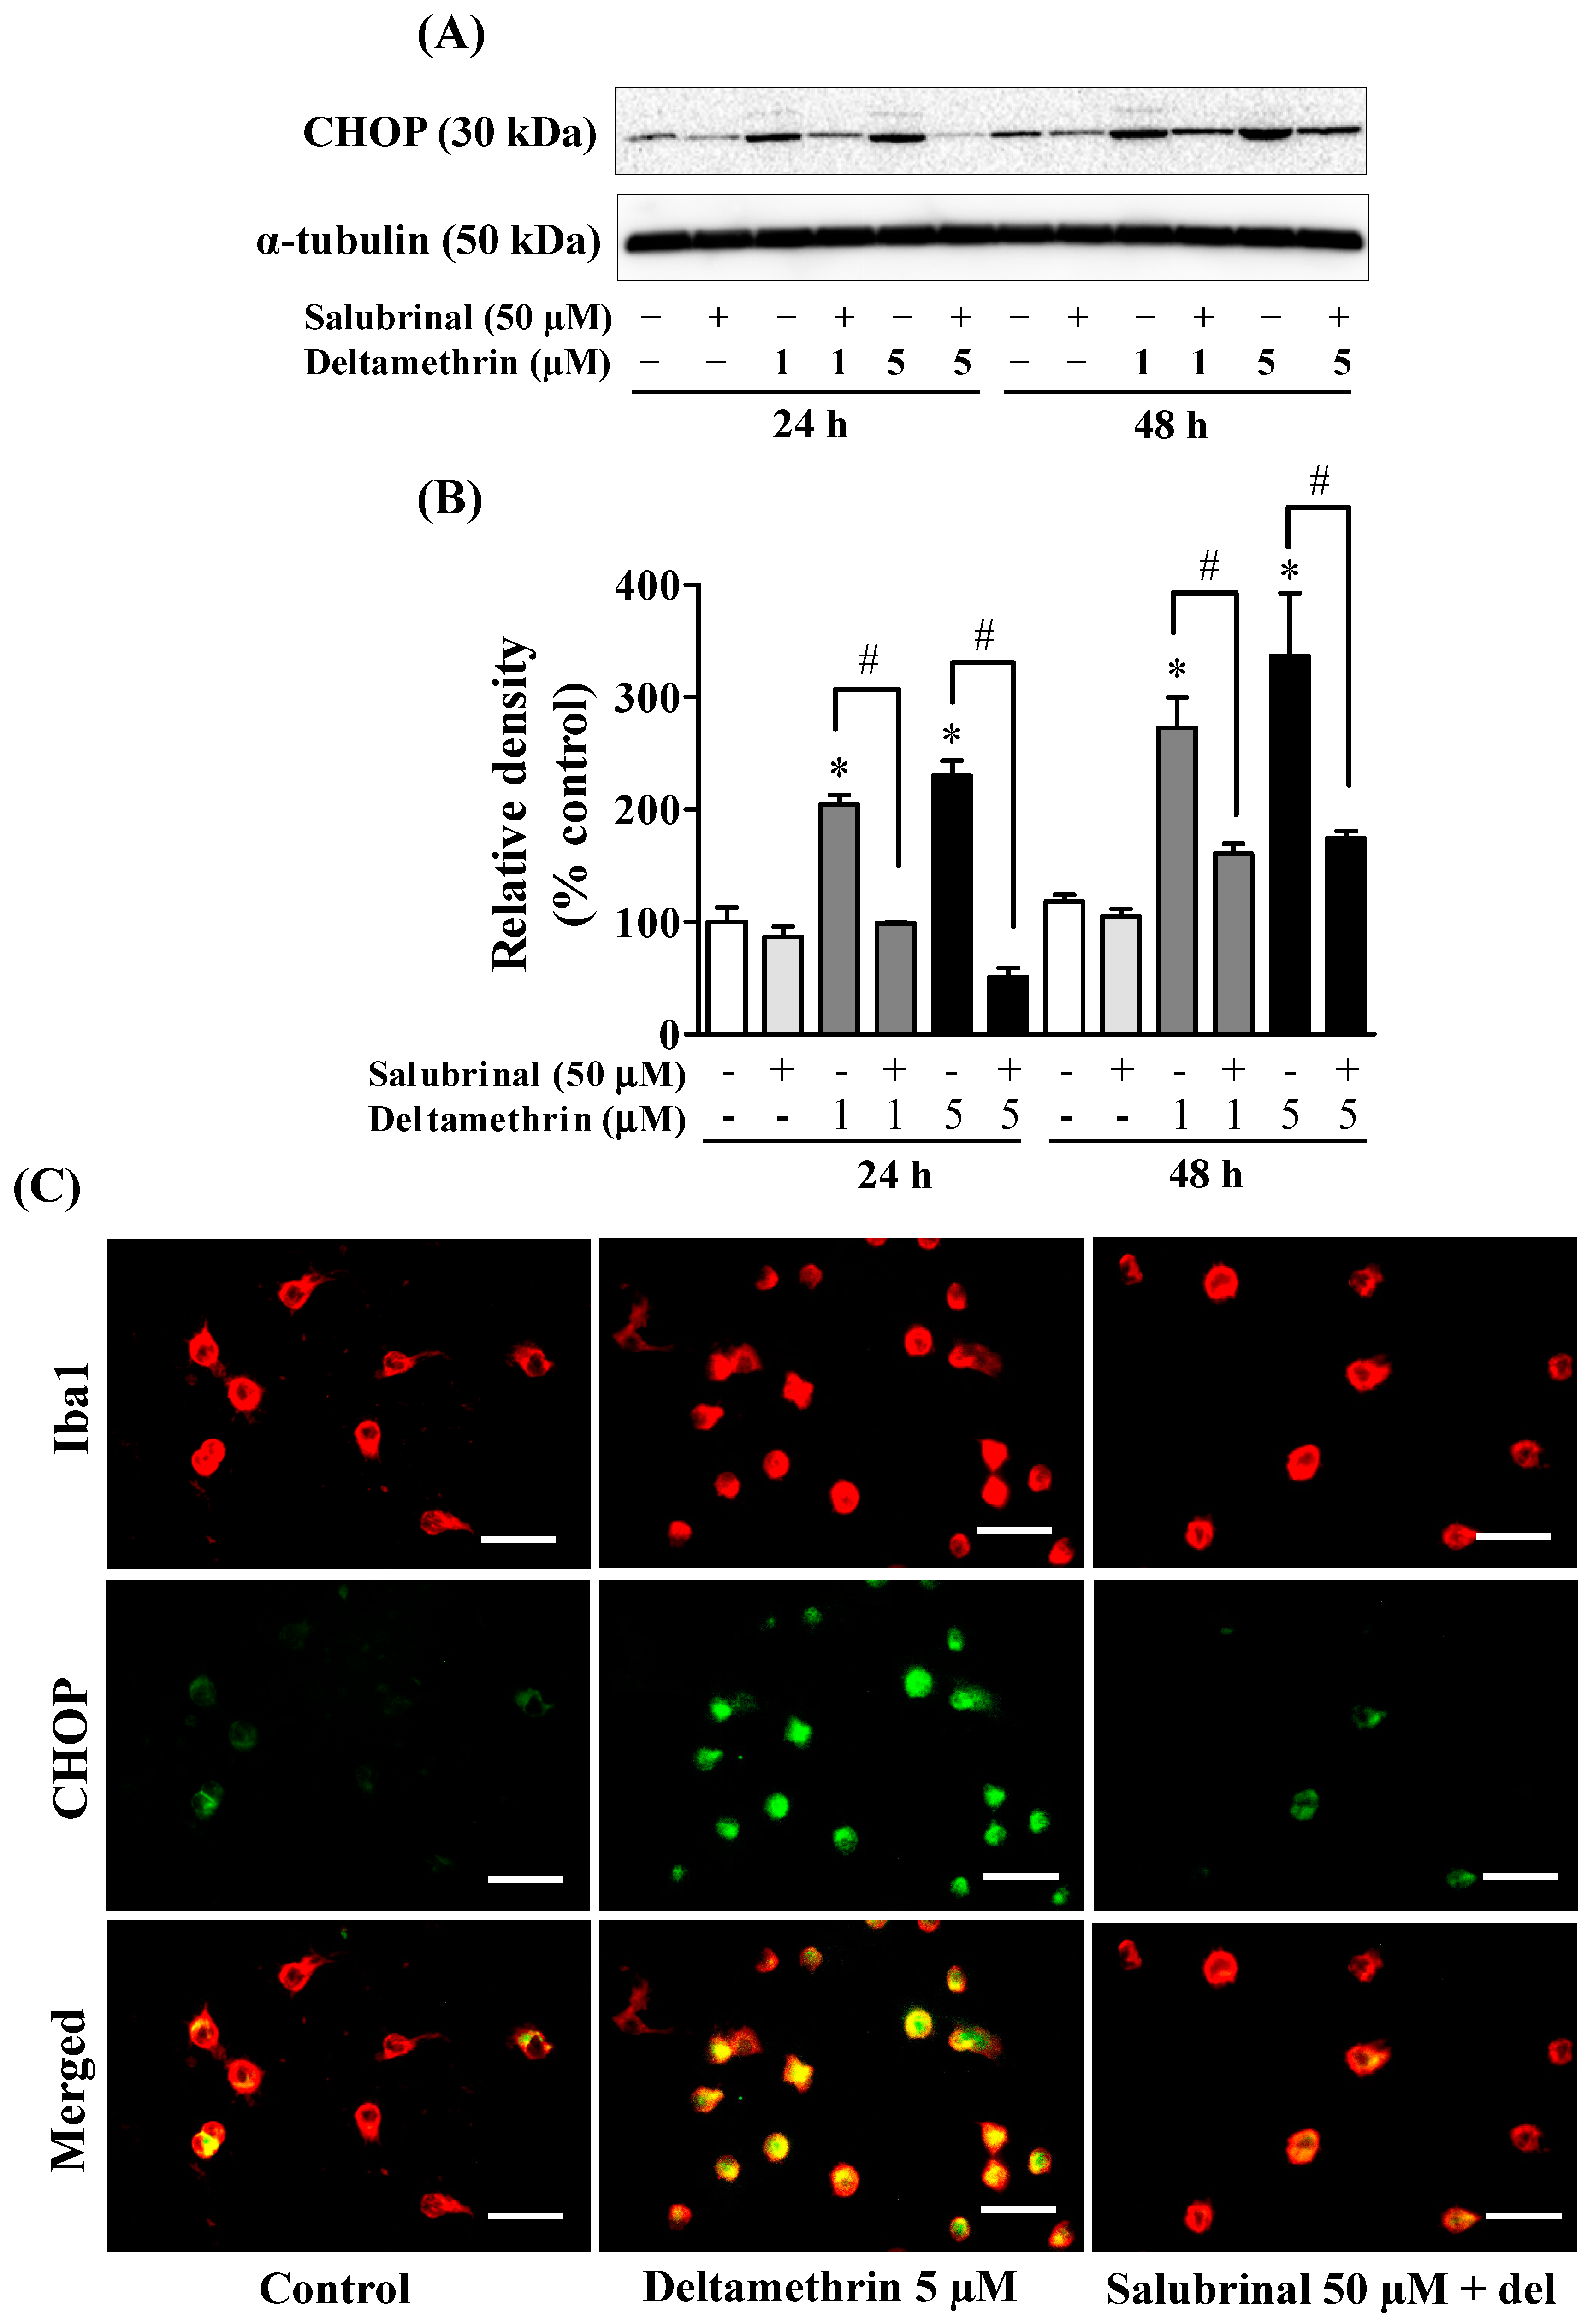
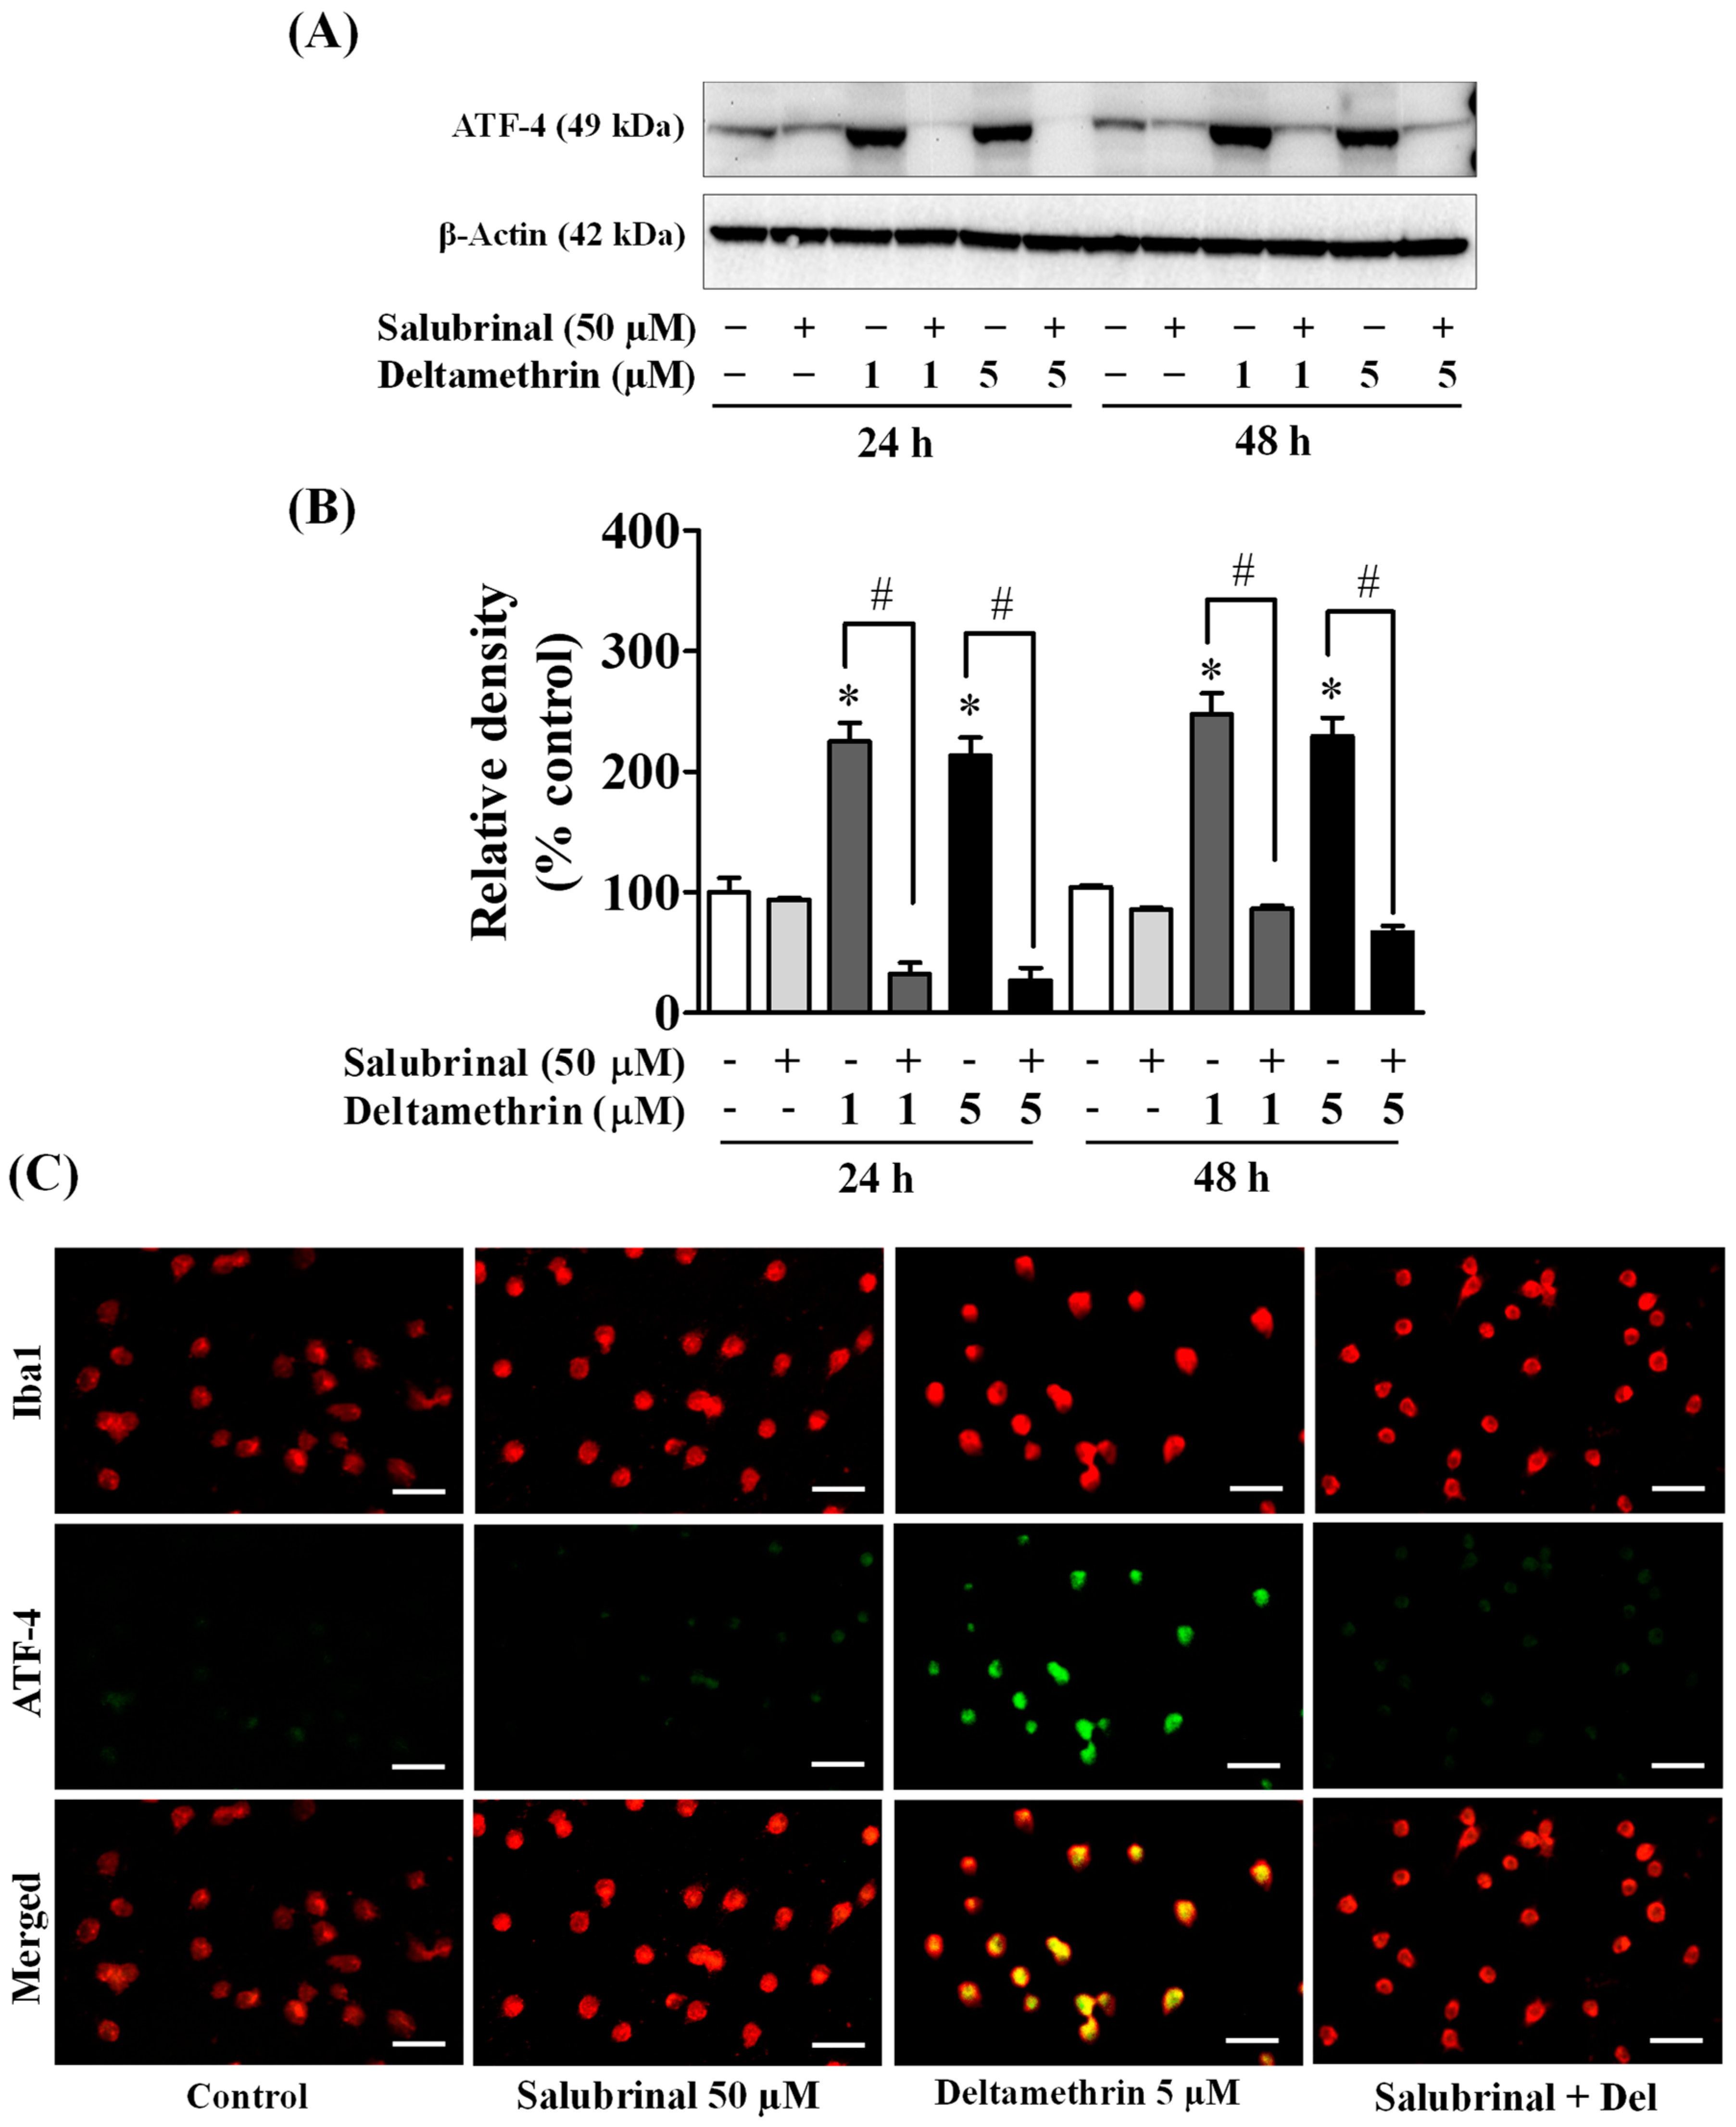
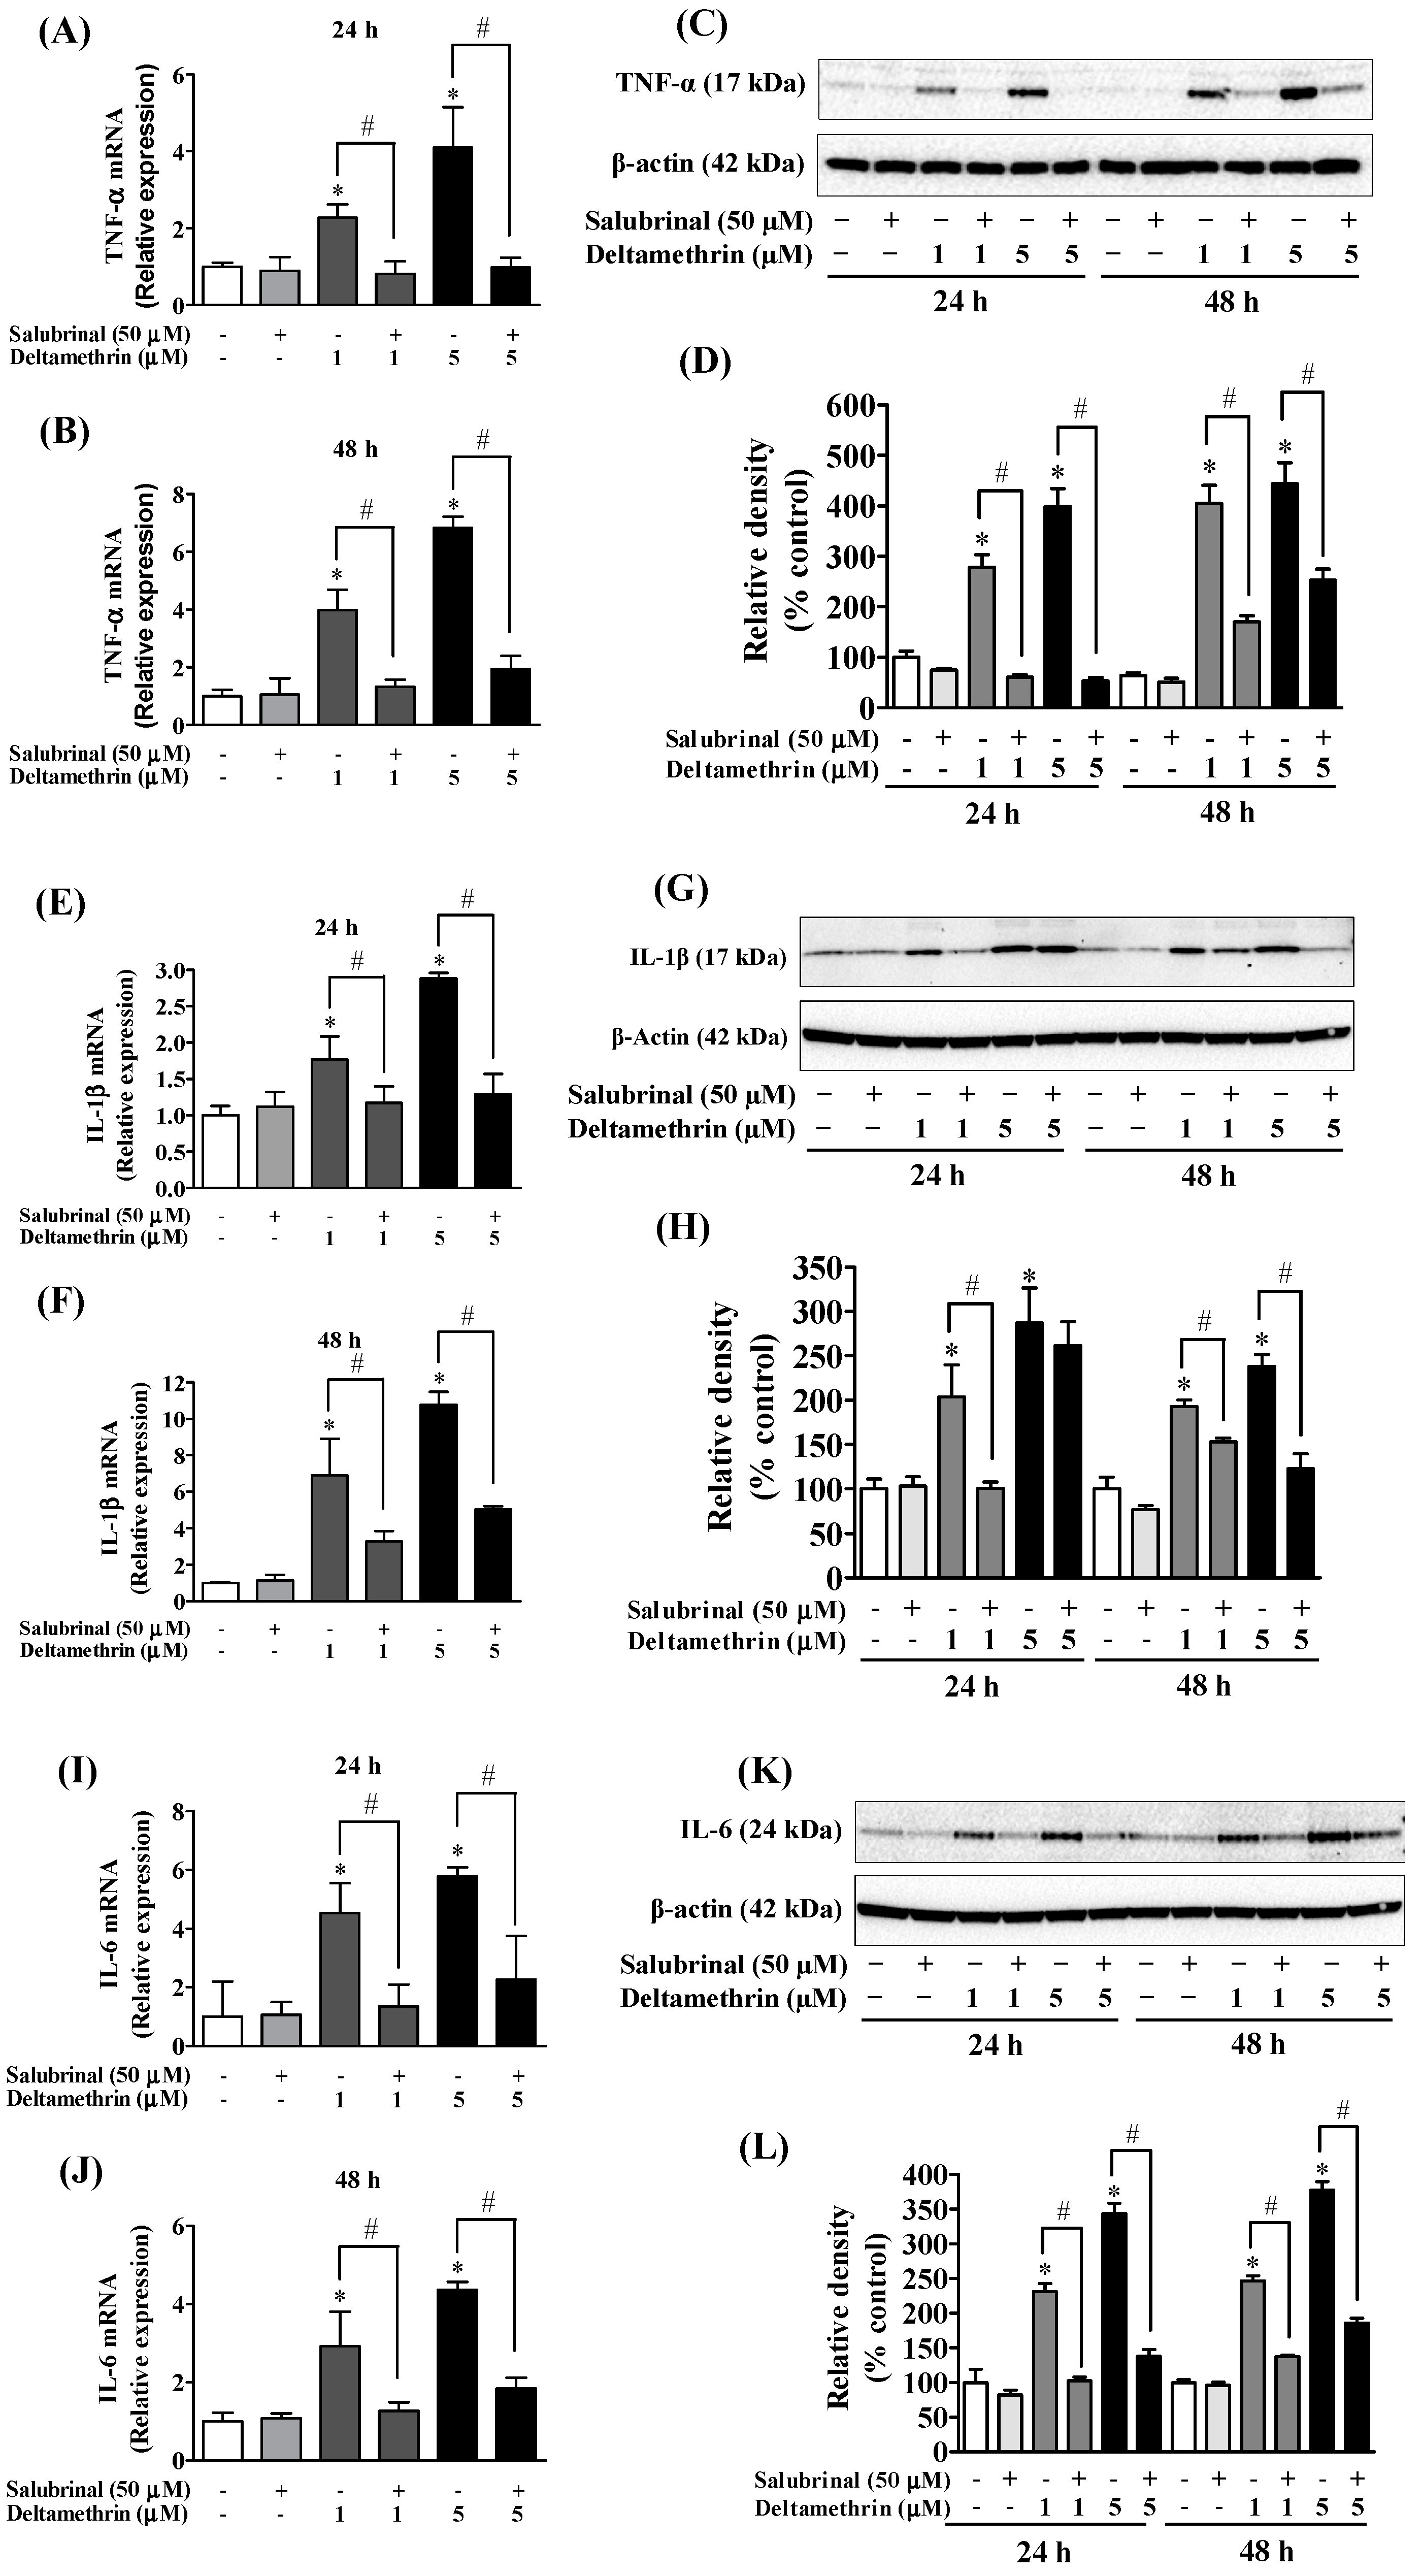
3.5. ER Stress Promotes Neuroinflammation in MMCs following Deltamethrin Exposure
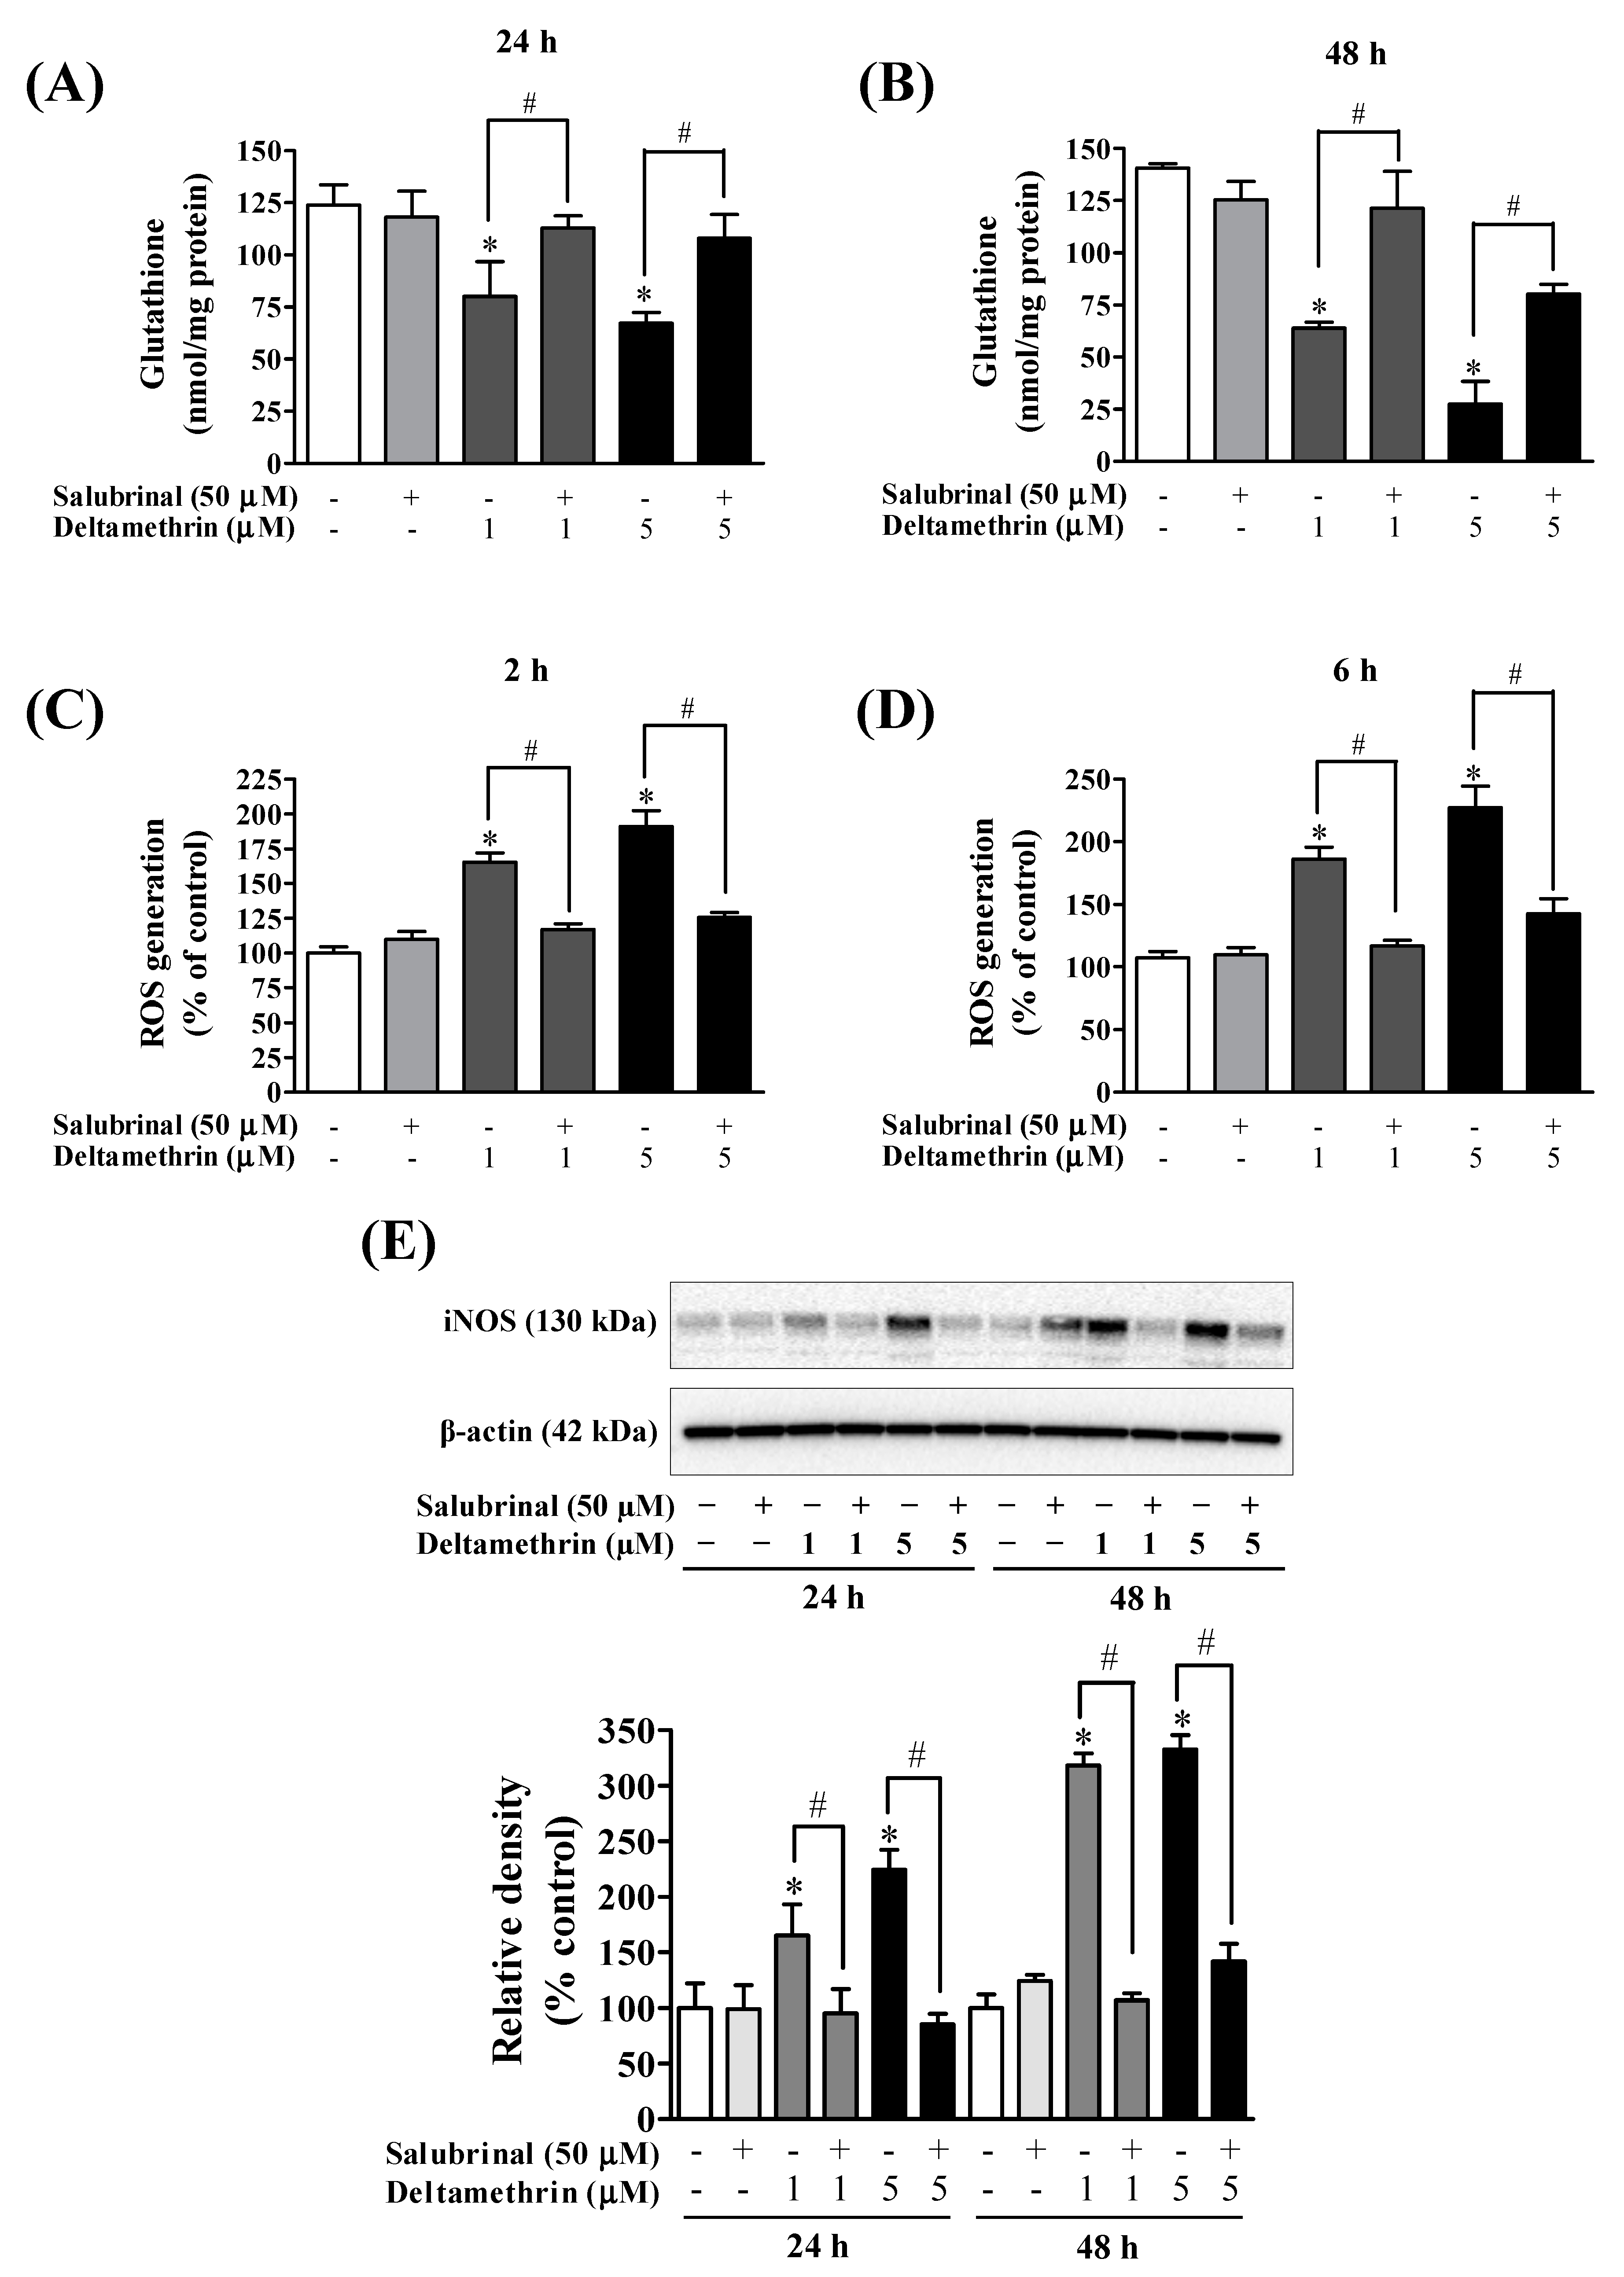
3.6. Inhibition of ER Stress with Salubrinal Attenuates Deltamethrin-Induced Depletion of Antioxidant Levels and Induction of Oxidative Stress
4. Discussion
Supplementary Materials
Author Contributions
Funding
Intuitional Review Board Statement
Informed Consent Statement
Data Availability Statement
Acknowledgments
Conflicts of Interest
References
- Lin, J.H.; Walter, P.; Yen, T.S. Endoplasmic reticulum stress in disease pathogenesis. Annu. Rev. Pathol. 2008, 3, 399–425. [Google Scholar] [CrossRef] [PubMed]
- Lindholm, D.; Wootz, H.; Korhonen, L. ER stress and neurodegenerative diseases. Cell Death Differ. 2006, 13, 385–392. [Google Scholar] [CrossRef] [PubMed]
- Hossain, M.M.; Liu, J.; Richardson, J.R. Pyrethroid Insecticides Directly Activate Microglia Through Interaction With Voltage-Gated Sodium Channels. Toxicol. Sci. 2017, 155, 112–123. [Google Scholar] [CrossRef] [PubMed]
- Kania, E.; Pajak, B.; Orzechowski, A. Calcium homeostasis and ER stress in control of autophagy in cancer cells. BioMed Res. Int. 2015, 2015, 352794. [Google Scholar] [CrossRef] [Green Version]
- Hossain, M.M.; Sivaram, G.; Richardson, J.R. Regional Susceptibility to ER Stress and Protection by Salubrinal Following a Single Exposure to Deltamethrin. Toxicol. Sci. 2019, 167, 249–257. [Google Scholar] [CrossRef] [Green Version]
- Sprenkle, N.T.; Sims, S.G.; Sanchez, C.L.; Meares, G.P. Endoplasmic reticulum stress and inflammation in the central nervous system. Mol. Neurodegener. 2017, 12, 42. [Google Scholar] [CrossRef] [Green Version]
- Lee, A.S. The ER chaperone and signaling regulator GRP78/BiP as a monitor of endoplasmic reticulum stress. Methods 2005, 35, 373–381. [Google Scholar] [CrossRef]
- Nishitoh, H. CHOP is a multifunctional transcription factor in the ER stress response. J. Biochem. 2012, 151, 217–219. [Google Scholar] [CrossRef] [Green Version]
- Rahman, M.A.; Hannan, M.A.; Uddin, M.J.; Rahman, M.S.; Rashid, M.M.; Kim, B. Exposure to Environmental Arsenic and Emerging Risk of Alzheimer’s Disease: Perspective Mechanisms, Management Strategy, and Future Directions. Toxics 2021, 9, 188. [Google Scholar] [CrossRef]
- Hossain, M.M.; DiCicco-Bloom, E.; Richardson, J.R. Hippocampal ER stress and learning deficits following repeated pyrethroid exposure. Toxicol. Sci. 2015, 143, 220–228. [Google Scholar] [CrossRef]
- Bao, W.; Liu, B.; Simonsen, D.W.; Lehmler, H.J. Association Between Exposure to Pyrethroid Insecticides and Risk of All-Cause and Cause-Specific Mortality in the General US Adult Population. JAMA Intern. Med. 2020, 180, 367–374. [Google Scholar] [CrossRef] [PubMed]
- Soderlund, D.M. Molecular mechanisms of pyrethroid insecticide neurotoxicity: Recent advances. Arch. Toxicol. 2012, 86, 165–181. [Google Scholar] [CrossRef] [PubMed] [Green Version]
- Lehmler, H.J.; Simonsen, D.; Liu, B.; Bao, W. Environmental exposure to pyrethroid pesticides in a nationally representative sample of U.S. adults and children: The National Health and Nutrition Examination Survey 2007–2012. Environ. Pollut. 2020, 267, 115489. [Google Scholar] [CrossRef] [PubMed]
- Mostafalou, S.; Abdollahi, M. Pesticides: An update of human exposure and toxicity. Arch. Toxicol. 2017, 91, 549–599. [Google Scholar] [CrossRef] [PubMed]
- Nasuti, C.; Cantalamessa, F.; Falcioni, G.; Gabbianelli, R. Different effects of Type I and Type II pyrethroids on erythrocyte plasma membrane properties and enzymatic activity in rats. Toxicology 2003, 191, 233–244. [Google Scholar] [CrossRef]
- Crow, J.A.; Borazjani, A.; Potter, P.M.; Ross, M.K. Hydrolysis of pyrethroids by human and rat tissues: Examination of intestinal, liver and serum carboxylesterases. Toxicol. Appl. Pharmacol. 2007, 221, 1–12. [Google Scholar] [CrossRef] [Green Version]
- Kumar, A.; Sasmal, D.; Bhaskar, A.; Mukhopadhyay, K.; Thakur, A.; Sharma, N. Deltamethrin-induced oxidative stress and mitochondrial caspase-dependent signaling pathways in murine splenocytes. Environ. Toxicol. 2016, 31, 808–819. [Google Scholar] [CrossRef]
- Hossain, M.M.; Richardson, J.R. Mechanism of pyrethroid pesticide-induced apoptosis: Role of calpain and the ER stress pathway. Toxicol. Sci. 2011, 122, 512–525. [Google Scholar] [CrossRef]
- Hossain, M.M.; Richardson, J.R. Nerve Growth Factor Protects Against Pyrethroid-Induced Endoplasmic Reticulum (ER) Stress in Primary Hippocampal Neurons. Toxicol. Sci. 2020, 174, 147–158. [Google Scholar] [CrossRef]
- Godin, S.J.; DeVito, M.J.; Hughes, M.F.; Ross, D.G.; Scollon, E.J.; Starr, J.M.; Setzer, R.W.; Conolly, R.B.; Tornero-Velez, R. Physiologically based pharmacokinetic modeling of deltamethrin: Development of a rat and human diffusion-limited model. Toxicol. Sci. 2010, 115, 330–343. [Google Scholar] [CrossRef]
- Sarkar, S.; Malovic, E.; Sarda, D.; Lawana, V.; Rokad, D.; Jin, H.; Anantharam, V.; Kanthasamy, A.; Kanthasamy, A.G. Characterization and comparative analysis of a new mouse microglial cell model for studying neuroinflammatory mechanisms during neurotoxic insults. Neurotoxicology 2018, 67, 129–140. [Google Scholar] [CrossRef] [PubMed]
- Hossain, M.M.; Sonsalla, P.K.; Richardson, J.R. Coordinated role of voltage-gated sodium channels and the Na+/H+ exchanger in sustaining microglial activation during inflammation. Toxicol. Appl. Pharmacol. 2013, 273, 355–364. [Google Scholar] [CrossRef] [PubMed] [Green Version]
- Richardson, J.R.; Caudle, W.M.; Wang, M.; Dean, E.D.; Pennell, K.D.; Miller, G.W. Developmental exposure to the pesticide dieldrin alters the dopamine system and increases neurotoxicity in an animal model of Parkinson’s disease. FASEB J. 2006, 20, 1695–1697. [Google Scholar] [CrossRef] [PubMed]
- Fortin, M.C.; Aleksunes, L.M.; Richardson, J.R. Alteration of the expression of pesticide-metabolizing enzymes in pregnant mice: Potential role in the increased vulnerability of the developing brain. Drug Metab. Dispos. 2013, 41, 326–331. [Google Scholar] [CrossRef] [PubMed] [Green Version]
- Dohi, K.; Ohtaki, H.; Nakamachi, T.; Yofu, S.; Satoh, K.; Miyamoto, K.; Song, D.; Tsunawaki, S.; Shioda, S.; Aruga, T. Gp91phox (NOX2) in classically activated microglia exacerbates traumatic brain injury. J. Neuroinflamm. 2010, 7, 41. [Google Scholar] [CrossRef] [Green Version]
- Reus, G.Z.; Fries, G.R.; Stertz, L.; Badawy, M.; Passos, I.C.; Barichello, T.; Kapczinski, F.; Quevedo, J. The role of inflammation and microglial activation in the pathophysiology of psychiatric disorders. Neuroscience 2015, 300, 141–154. [Google Scholar] [CrossRef]
- Kempuraj, D.; Thangavel, R.; Natteru, P.A.; Selvakumar, G.P.; Saeed, D.; Zahoor, H.; Zaheer, S.; Iyer, S.S.; Zaheer, A. Neuroinflammation Induces Neurodegeneration. J. Neurol. Neurosurg. Spine 2016, 1, 1003. [Google Scholar]
- Deslauriers, A.M.; Afkhami-Goli, A.; Paul, A.M.; Bhat, R.K.; Acharjee, S.; Ellestad, K.K.; Noorbakhsh, F.; Michalak, M.; Power, C. Neuroinflammation and endoplasmic reticulum stress are coregulated by crocin to prevent demyelination and neurodegeneration. J. Immunol. 2011, 187, 4788–4799. [Google Scholar] [CrossRef] [Green Version]
- Bellezza, I.; Grottelli, S.; Mierla, A.L.; Cacciatore, I.; Fornasari, E.; Roscini, L.; Cardinali, G.; Minelli, A. Neuroinflammation and endoplasmic reticulum stress are coregulated by cyclo(His-Pro) to prevent LPS neurotoxicity. Int. J. Biochem. Cell Biol. 2014, 51, 159–169. [Google Scholar] [CrossRef]
- Parron, T.; Requena, M.; Hernandez, A.F.; Alarcon, R. Association between environmental exposure to pesticides and neurodegenerative diseases. Toxicol. Appl. Pharmacol. 2011, 256, 379–385. [Google Scholar] [CrossRef]
- Chin-Chan, M.; Navarro-Yepes, J.; Quintanilla-Vega, B. Environmental pollutants as risk factors for neurodegenerative disorders: Alzheimer and Parkinson diseases. Front. Cell. Neurosci. 2015, 9, 124. [Google Scholar] [CrossRef] [PubMed] [Green Version]
- Cannon, J.R.; Greenamyre, J.T. The role of environmental exposures in neurodegeneration and neurodegenerative diseases. Toxicol. Sci. 2011, 124, 225–250. [Google Scholar] [CrossRef] [PubMed]
- Cabral-Miranda, F.; Hetz, C. ER Stress and Neurodegenerative Disease: A Cause or Effect Relationship? Curr. Top. Microbiol. Immunol. 2018, 414, 131–157. [Google Scholar] [CrossRef]
- Gerakis, Y.; Hetz, C. Emerging roles of ER stress in the etiology and pathogenesis of Alzheimer’s disease. FEBS J. 2018, 285, 995–1011. [Google Scholar] [CrossRef] [PubMed] [Green Version]
- Oyadomari, S.; Mori, M. Roles of CHOP/GADD153 in endoplasmic reticulum stress. Cell Death Differ. 2004, 11, 381–389. [Google Scholar] [CrossRef] [Green Version]
- Zheng, Y.Z.; Cao, Z.G.; Hu, X.; Shao, Z.M. The endoplasmic reticulum stress markers GRP78 and CHOP predict disease-free survival and responsiveness to chemotherapy in breast cancer. Breast Cancer Res. Treat. 2014, 145, 349–358. [Google Scholar] [CrossRef]
- Wan, X.S.; Lu, X.H.; Xiao, Y.C.; Lin, Y.; Zhu, H.; Ding, T.; Yang, Y.; Huang, Y.; Zhang, Y.; Liu, Y.L.; et al. ATF4- and CHOP-dependent induction of FGF21 through endoplasmic reticulum stress. BioMed Res. Int. 2014, 2014, 807874. [Google Scholar] [CrossRef]
- Hu, H.; Tian, M.; Ding, C.; Yu, S. The C/EBP Homologous Protein (CHOP) Transcription Factor Functions in Endoplasmic Reticulum Stress-Induced Apoptosis and Microbial Infection. Front. Immunol. 2018, 9, 3083. [Google Scholar] [CrossRef] [Green Version]
- Averous, J.; Bruhat, A.; Jousse, C.; Carraro, V.; Thiel, G.; Fafournoux, P. Induction of CHOP expression by amino acid limitation requires both ATF4 expression and ATF2 phosphorylation. J. Biol. Chem. 2004, 279, 5288–5297. [Google Scholar] [CrossRef] [Green Version]
- Chang, C.-C.; Wang, Y.-H.; Chern, C.-M.; Liou, K.-T.; Hou, Y.-C.; Peng, Y.-T.; Shen, Y.-C. Prodigiosin inhibits gp91phox and iNOS expression to protect mice against the oxidative/nitrosative brain injury induced by hypoxia–ischemia. Toxicol. Appl. Pharmacol. 2011, 257, 137–147. [Google Scholar] [CrossRef]
- Meares, G.P.; Liu, Y.; Rajbhandari, R.; Qin, H.; Nozell, S.E.; Mobley, J.A.; Corbett, J.A.; Benveniste, E.N. PERK-dependent activation of JAK1 and STAT3 contributes to endoplasmic reticulum stress-induced inflammation. Mol. Cell. Biol. 2014, 34, 3911–3925. [Google Scholar] [CrossRef] [PubMed] [Green Version]
- Schiavon, E.; Smalley, J.L.; Newton, S.; Greig, N.H.; Forsythe, I.D. Neuroinflammation and ER-stress are key mechanisms of acute bilirubin toxicity and hearing loss in a mouse model. PLoS ONE 2018, 13, e0201022. [Google Scholar] [CrossRef] [PubMed]
- Gomez-Nicola, D.; Boche, D. Post-mortem analysis of neuroinflammatory changes in human Alzheimer’s disease. Alzheimer’s Res. Ther. 2015, 7, 42. [Google Scholar] [CrossRef] [PubMed] [Green Version]
- Du, S.H.; Tan, X.H.; Zhao, R.; Zhao, D.; Xue, Y.; Wang, H.J.; Xie, X.L.; Wang, Q. Molecular pathology of cerebral TNF-alpha, IL-1beta, iNOS and Nrf2 in forensic autopsy cases with special regard to deaths due to environmental hazards and intoxication. Forensic Sci. Med. Pathol. 2017, 13, 409–416. [Google Scholar] [CrossRef] [PubMed]
- Jenner, P.; Olanow, C.W. Oxidative stress and the pathogenesis of Parkinson’s disease. Neurology 1996, 47, S161–S170. [Google Scholar] [CrossRef]
- Hossain, M.M.; Weig, B.; Reuhl, K.; Gearing, M.; Wu, L.J.; Richardson, J.R. The anti-parkinsonian drug zonisamide reduces neuroinflammation: Role of microglial Nav 1.6. Exp. Neurol. 2018, 308, 111–119. [Google Scholar] [CrossRef]
- Enache, D.; Pariante, C.M.; Mondelli, V. Markers of central inflammation in major depressive disorder: A systematic review and meta-analysis of studies examining cerebrospinal fluid, positron emission tomography and post-mortem brain tissue. Brain Behav. Immun. 2019, 81, 24–40. [Google Scholar] [CrossRef]
- Chen, S.; Dong, Z.; Cheng, M.; Zhao, Y.; Wang, M.; Sai, N.; Wang, X.; Liu, H.; Huang, G.; Zhang, X. Homocysteine exaggerates microglia activation and neuroinflammation through microglia localized STAT3 overactivation following ischemic stroke. J. Neuroinflamm. 2017, 14, 187. [Google Scholar] [CrossRef] [Green Version]
- Zhou, M.; Wang, C.M.; Yang, W.L.; Wang, P. Microglial CD14 activated by iNOS contributes to neuroinflammation in cerebral ischemia. Brain Res. 2013, 1506, 105–114. [Google Scholar] [CrossRef] [Green Version]
- Wu, L.; Xiong, X.; Wu, X.; Ye, Y.; Jian, Z.; Zhi, Z.; Gu, L. Targeting Oxidative Stress and Inflammation to Prevent Ischemia-Reperfusion Injury. Front. Mol. Neurosci. 2020, 13, 28. [Google Scholar] [CrossRef] [Green Version]
- Liu, F.; Yang, X.; Ma, J.; Yang, Y.; Xie, C.; Tuerhong, M.; Jin, D.Q.; Xu, J.; Lee, D.; Ohizumi, Y.; et al. Nitric oxide inhibitory daphnane diterpenoids as potential anti-neuroinflammatory agents for AD from the twigs of Trigonostemon thyrsoideus. Bioorg. Chem. 2017, 75, 149–156. [Google Scholar] [CrossRef] [PubMed]
- Yeo, I.J.; Yun, J.; Son, D.J.; Han, S.B.; Hong, J.T. Antifungal drug miconazole ameliorated memory deficits in a mouse model of LPS-induced memory loss through targeting iNOS. Cell Death Dis. 2020, 11, 623. [Google Scholar] [CrossRef] [PubMed]
- Simpson, D.S.A.; Oliver, P.L. ROS Generation in Microglia: Understanding Oxidative Stress and Inflammation in Neurodegenerative Disease. Antioxidants 2020, 9, 743. [Google Scholar] [CrossRef] [PubMed]
- Qin, L.; Crews, F.T. NADPH oxidase and reactive oxygen species contribute to alcohol-induced microglial activation and neurodegeneration. J. Neuroinflamm. 2012, 9, 5. [Google Scholar] [CrossRef] [Green Version]
- Shahraz, A.; Wissfeld, J.; Ginolhac, A.; Mathews, M.; Sinkkonen, L.; Neumann, H. Phagocytosis-related NADPH oxidase 2 subunit gp91phox contributes to neurodegeneration after repeated systemic challenge with lipopolysaccharides. Glia 2021, 69, 137–150. [Google Scholar] [CrossRef]
- Ma, M.W.; Wang, J.; Zhang, Q.; Wang, R.; Dhandapani, K.M.; Vadlamudi, R.K.; Brann, D.W. NADPH oxidase in brain injury and neurodegenerative disorders. Mol. Neurodegener. 2017, 12, 7. [Google Scholar] [CrossRef] [Green Version]
- Gao, H.M.; Liu, B.; Zhang, W.; Hong, J.S. Synergistic dopaminergic neurotoxicity of MPTP and inflammogen lipopolysaccharide: Relevance to the etiology of Parkinson’s disease. FASEB J. 2003, 17, 1957–1959. [Google Scholar] [CrossRef]
- Ghosh, A.; Kanthasamy, A.; Joseph, J.; Anantharam, V.; Srivastava, P.; Dranka, B.P.; Kalyanaraman, B.; Kanthasamy, A.G. Anti-inflammatory and neuroprotective effects of an orally active apocynin derivative in pre-clinical models of Parkinson’s disease. J. Neuroinflamm. 2012, 9, 241. [Google Scholar] [CrossRef] [Green Version]
- Wu, D.C.; Teismann, P.; Tieu, K.; Vila, M.; Jackson-Lewis, V.; Ischiropoulos, H.; Przedborski, S. NADPH oxidase mediates oxidative stress in the 1-methyl-4-phenyl-1,2,3,6-tetrahydropyridine model of Parkinson’s disease. Proc. Natl. Acad. Sci. USA 2003, 100, 6145–6150. [Google Scholar] [CrossRef] [Green Version]
- Barrett, J.P.; Henry, R.J.; Villapol, S.; Stoica, B.A.; Kumar, A.; Burns, M.P.; Faden, A.I.; Loane, D.J. NOX2 deficiency alters macrophage phenotype through an IL-10/STAT3 dependent mechanism: Implications for traumatic brain injury. J. Neuroinflamm. 2017, 14, 65. [Google Scholar] [CrossRef] [Green Version]
- Qin, L.; Liu, Y.; Wang, T.; Wei, S.J.; Block, M.L.; Wilson, B.; Liu, B.; Hong, J.S. NADPH oxidase mediates lipopolysaccharide-induced neurotoxicity and proinflammatory gene expression in activated microglia. J. Biol. Chem. 2004, 279, 1415–1421. [Google Scholar] [CrossRef] [PubMed] [Green Version]
- Palpagama, T.H.; Waldvogel, H.J.; Faull, R.L.M.; Kwakowsky, A. The Role of Microglia and Astrocytes in Huntington’s Disease. Front. Mol. Neurosci. 2019, 12, 258. [Google Scholar] [CrossRef] [PubMed] [Green Version]
- Harry, G.J.; Kraft, A.D. Neuroinflammation and microglia: Considerations and approaches for neurotoxicity assessment. Expert Opin. Drug Metab. Toxicol. 2008, 4, 1265–1277. [Google Scholar] [CrossRef] [PubMed]
- Hickman, S.; Izzy, S.; Sen, P.; Morsett, L.; El Khoury, J. Microglia in neurodegeneration. Nat. Neurosci. 2018, 21, 1359–1369. [Google Scholar] [CrossRef]
- Perry, V.H.; Nicoll, J.A.; Holmes, C. Microglia in neurodegenerative disease. Nat. Rev. Neurol. 2010, 6, 193–201. [Google Scholar] [CrossRef]
- Stoll, G.; Jander, S.; Schroeter, M. Detrimental and beneficial effects of injury-induced inflammation and cytokine expression in the nervous system. Adv. Exp. Med. Biol. 2002, 513, 87–113. [Google Scholar] [CrossRef]
- Pang, X.; Panee, J. Roles of glutathione in antioxidant defense, inflammation, and neuron differentiation in the thalamus of HIV-1 transgenic rats. J. Neuroimmune Pharmacol. 2014, 9, 413–423. [Google Scholar] [CrossRef]
- Ribas, V.; Garcia-Ruiz, C.; Fernandez-Checa, J.C. Glutathione and mitochondria. Front. Pharmacol. 2014, 5, 151. [Google Scholar] [CrossRef] [Green Version]
- Iskusnykh, I.Y.; Zakharova, A.A.; Pathak, D. Glutathione in Brain Disorders and Aging. Molecules 2022, 27, 324. [Google Scholar] [CrossRef]
- Aoyama, K. Glutathione in the Brain. Int. J. Mol. Sci. 2021, 22, 5010. [Google Scholar] [CrossRef]
- Bradley, M.A.; Xiong-Fister, S.; Markesbery, W.R.; Lovell, M.A. Elevated 4-hydroxyhexenal in Alzheimer’s disease (AD) progression. Neurobiol. Aging 2012, 33, 1034–1044. [Google Scholar] [CrossRef] [PubMed] [Green Version]
- Hsieh, H.L.; Yang, C.M. Role of redox signaling in neuroinflammation and neurodegenerative diseases. BioMed Res. Int. 2013, 2013, 484613. [Google Scholar] [CrossRef] [PubMed]
- Yang, B.; Li, R.; Michael Greenlief, C.; Fritsche, K.L.; Gu, Z.; Cui, J.; Lee, J.C.; Beversdorf, D.Q.; Sun, G.Y. Unveiling anti-oxidative and anti-inflammatory effects of docosahexaenoic acid and its lipid peroxidation product on lipopolysaccharide-stimulated BV-2 microglial cells. J. Neuroinflamm. 2018, 15, 202. [Google Scholar] [CrossRef] [Green Version]
- Wang, Y.; Wang, W.; Yang, H.; Shao, D.; Zhao, X.; Zhang, G. Intraperitoneal injection of 4-hydroxynonenal (4-HNE), a lipid peroxidation product, exacerbates colonic inflammation through activation of Toll-like receptor 4 signaling. Free Radic. Biol. Med. 2019, 131, 237–242. [Google Scholar] [CrossRef]
- Cumaoglu, A.; Agkaya, A.O.; Ozkul, Z. Effect of the Lipid Peroxidation Product 4-Hydroxynonenal on Neuroinflammation in Microglial Cells: Protective Role of Quercetin and Monochloropivaloylquercetin. Turk. J. Pharm. Sci. 2019, 16, 54–61. [Google Scholar] [CrossRef] [PubMed]
- Liu, T.; Zhang, L.; Joo, D.; Sun, S.C. NF-kappaB signaling in inflammation. Signal. Transduct. Target. Ther. 2017, 2, 17023. [Google Scholar] [CrossRef] [PubMed] [Green Version]
- Tam, A.B.; Mercado, E.L.; Hoffmann, A.; Niwa, M. ER stress activates NF-kappaB by integrating functions of basal IKK activity, IRE1 and PERK. PLoS ONE 2012, 7, e45078. [Google Scholar] [CrossRef] [Green Version]
- Oeckinghaus, A.; Ghosh, S. The NF-kappaB family of transcription factors and its regulation. Cold Spring Harb. Perspect. Biol. 2009, 1, a000034. [Google Scholar] [CrossRef]
- Kaser, A.; Lee, A.H.; Franke, A.; Glickman, J.N.; Zeissig, S.; Tilg, H.; Nieuwenhuis, E.E.; Higgins, D.E.; Schreiber, S.; Glimcher, L.H.; et al. XBP1 links ER stress to intestinal inflammation and confers genetic risk for human inflammatory bowel disease. Cell 2008, 134, 743–756. [Google Scholar] [CrossRef] [Green Version]


| Primers | Forward | Reverse |
|---|---|---|
| F4/80 | 5′-TCCAGCACATCCAGCCAAAGCA-3′ | 5′-CGTAAGCTCCCCAGAAGCCATGA-3′ |
| TNF-α | 5′-TAGCCCACGTCGTAGCAAA-3′ | 5′-CCTTGAAGAGAACCTGGGAGT-3′ |
| IL-1β | 5′-CTTGTGCAAGTGTCTGAAGCA-3′ | 5′-TGCGAGATTTGAAGCTGGATG-3′ |
| IL-6 | 5′-TCCTCTCTGCAAGAGACTTCC-3′ | 5′-TCCACGATTTCCCAGAGAACA-3′ |
| gp91phox | 5′-TCCTGCTGCCAGTGTGTCGAAA-3′ | 5′-TGCAATTGTGTGGATGGCGGTG-3′ |
| iNOS | 5′-CCAGTGCCCTGCTTTGTGCG-3′ | 5′-TGCAATTGTGTGGATGGCGGTG-3′ |
| GAPDH | 5′-GGGCTGGCATTGCTCTCAATGAC-3′ | 5′-TCTTGCTCAGTGTCCTTGCTGGG-3′ |
Publisher’s Note: MDPI stays neutral with regard to jurisdictional claims in published maps and institutional affiliations. |
© 2022 by the authors. Licensee MDPI, Basel, Switzerland. This article is an open access article distributed under the terms and conditions of the Creative Commons Attribution (CC BY) license (https://creativecommons.org/licenses/by/4.0/).
Share and Cite
Hossain, M.M.; Toltin, A.C.; Gamba, L.M.; Molina, M.A. Deltamethrin-Evoked ER Stress Promotes Neuroinflammation in the Adult Mouse Hippocampus. Cells 2022, 11, 1961. https://doi.org/10.3390/cells11121961
Hossain MM, Toltin AC, Gamba LM, Molina MA. Deltamethrin-Evoked ER Stress Promotes Neuroinflammation in the Adult Mouse Hippocampus. Cells. 2022; 11(12):1961. https://doi.org/10.3390/cells11121961
Chicago/Turabian StyleHossain, Muhammad M., Abigail C. Toltin, Laura M. Gamba, and Maria A. Molina. 2022. "Deltamethrin-Evoked ER Stress Promotes Neuroinflammation in the Adult Mouse Hippocampus" Cells 11, no. 12: 1961. https://doi.org/10.3390/cells11121961
APA StyleHossain, M. M., Toltin, A. C., Gamba, L. M., & Molina, M. A. (2022). Deltamethrin-Evoked ER Stress Promotes Neuroinflammation in the Adult Mouse Hippocampus. Cells, 11(12), 1961. https://doi.org/10.3390/cells11121961