
Changes in Cell Morphology and Actin Organization in Embryonic Stem Cells Cultured under Different Conditions

 , , and
Abstract
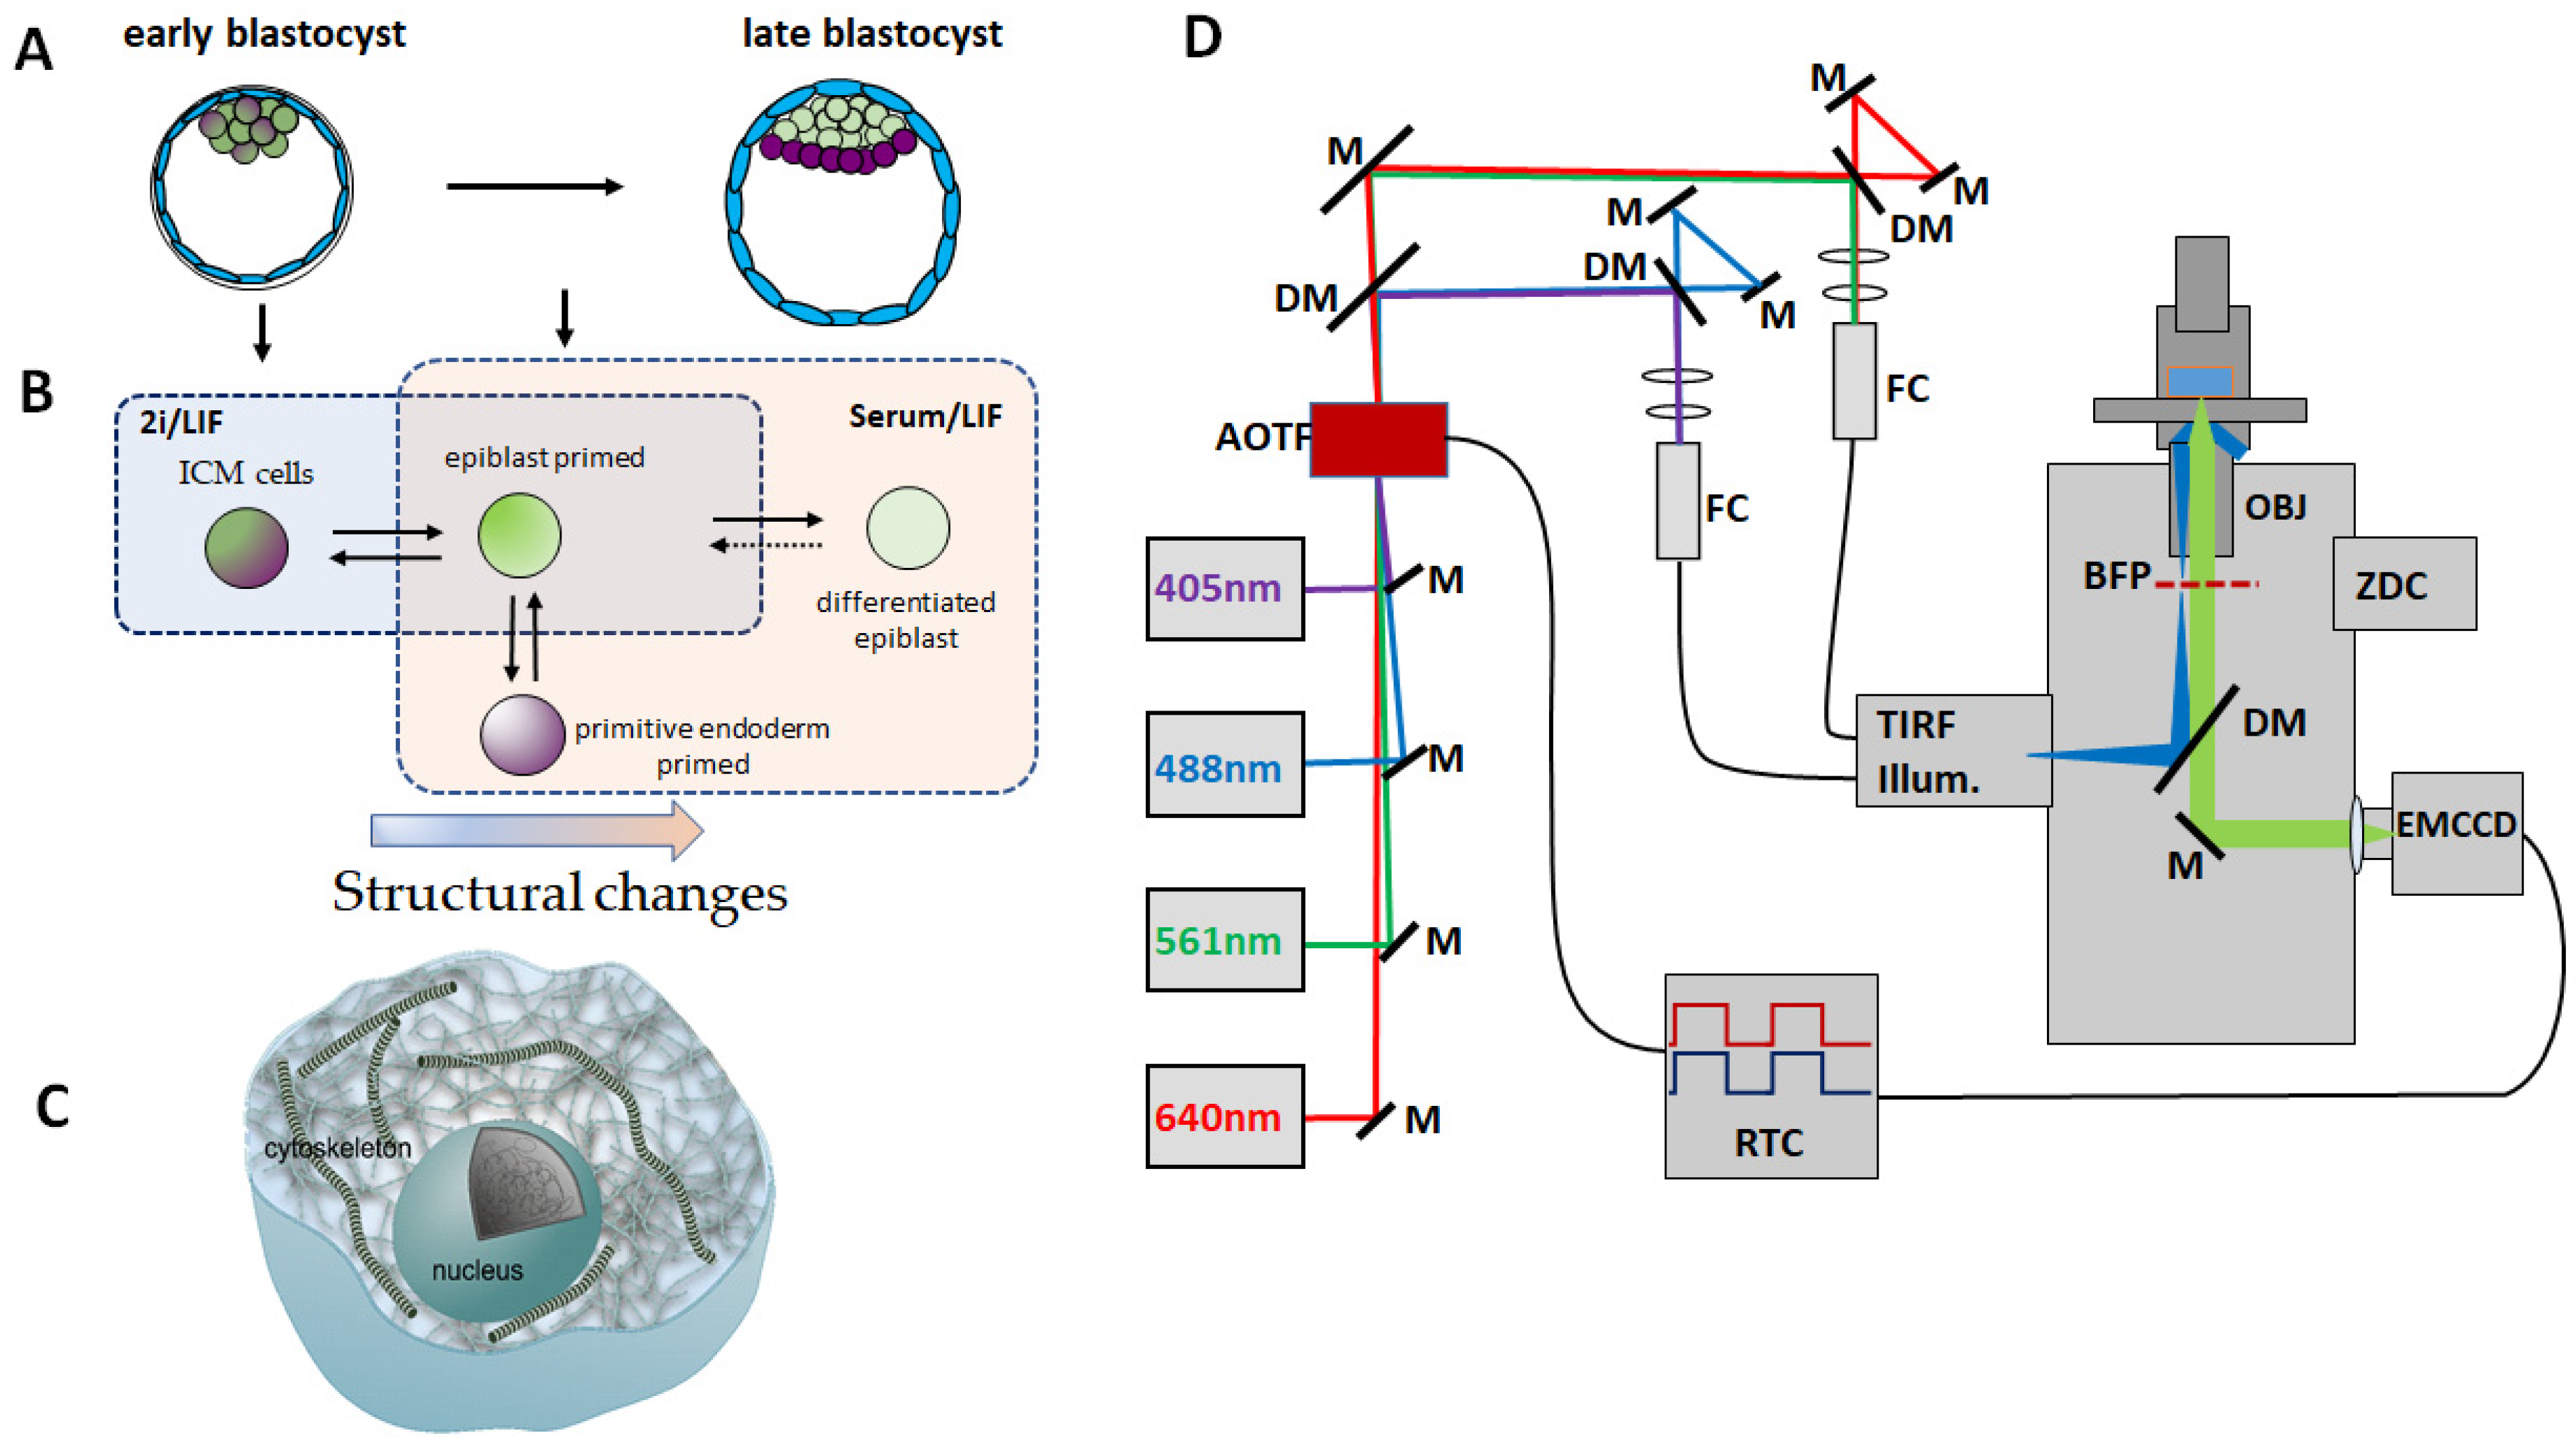
:1. Introduction
2. Materials and Methods
2.1. Cell Culture
2.2. Cell Fixation and Staining
2.3. Confocal Microscopy
2.4. Micro-Rheology
2.5. STORM Imaging and Analysis
2.6. 3D STORM Imaging
2.7. Image Analysis
2.8. Real-Time Deformability Cytometry
3. Results
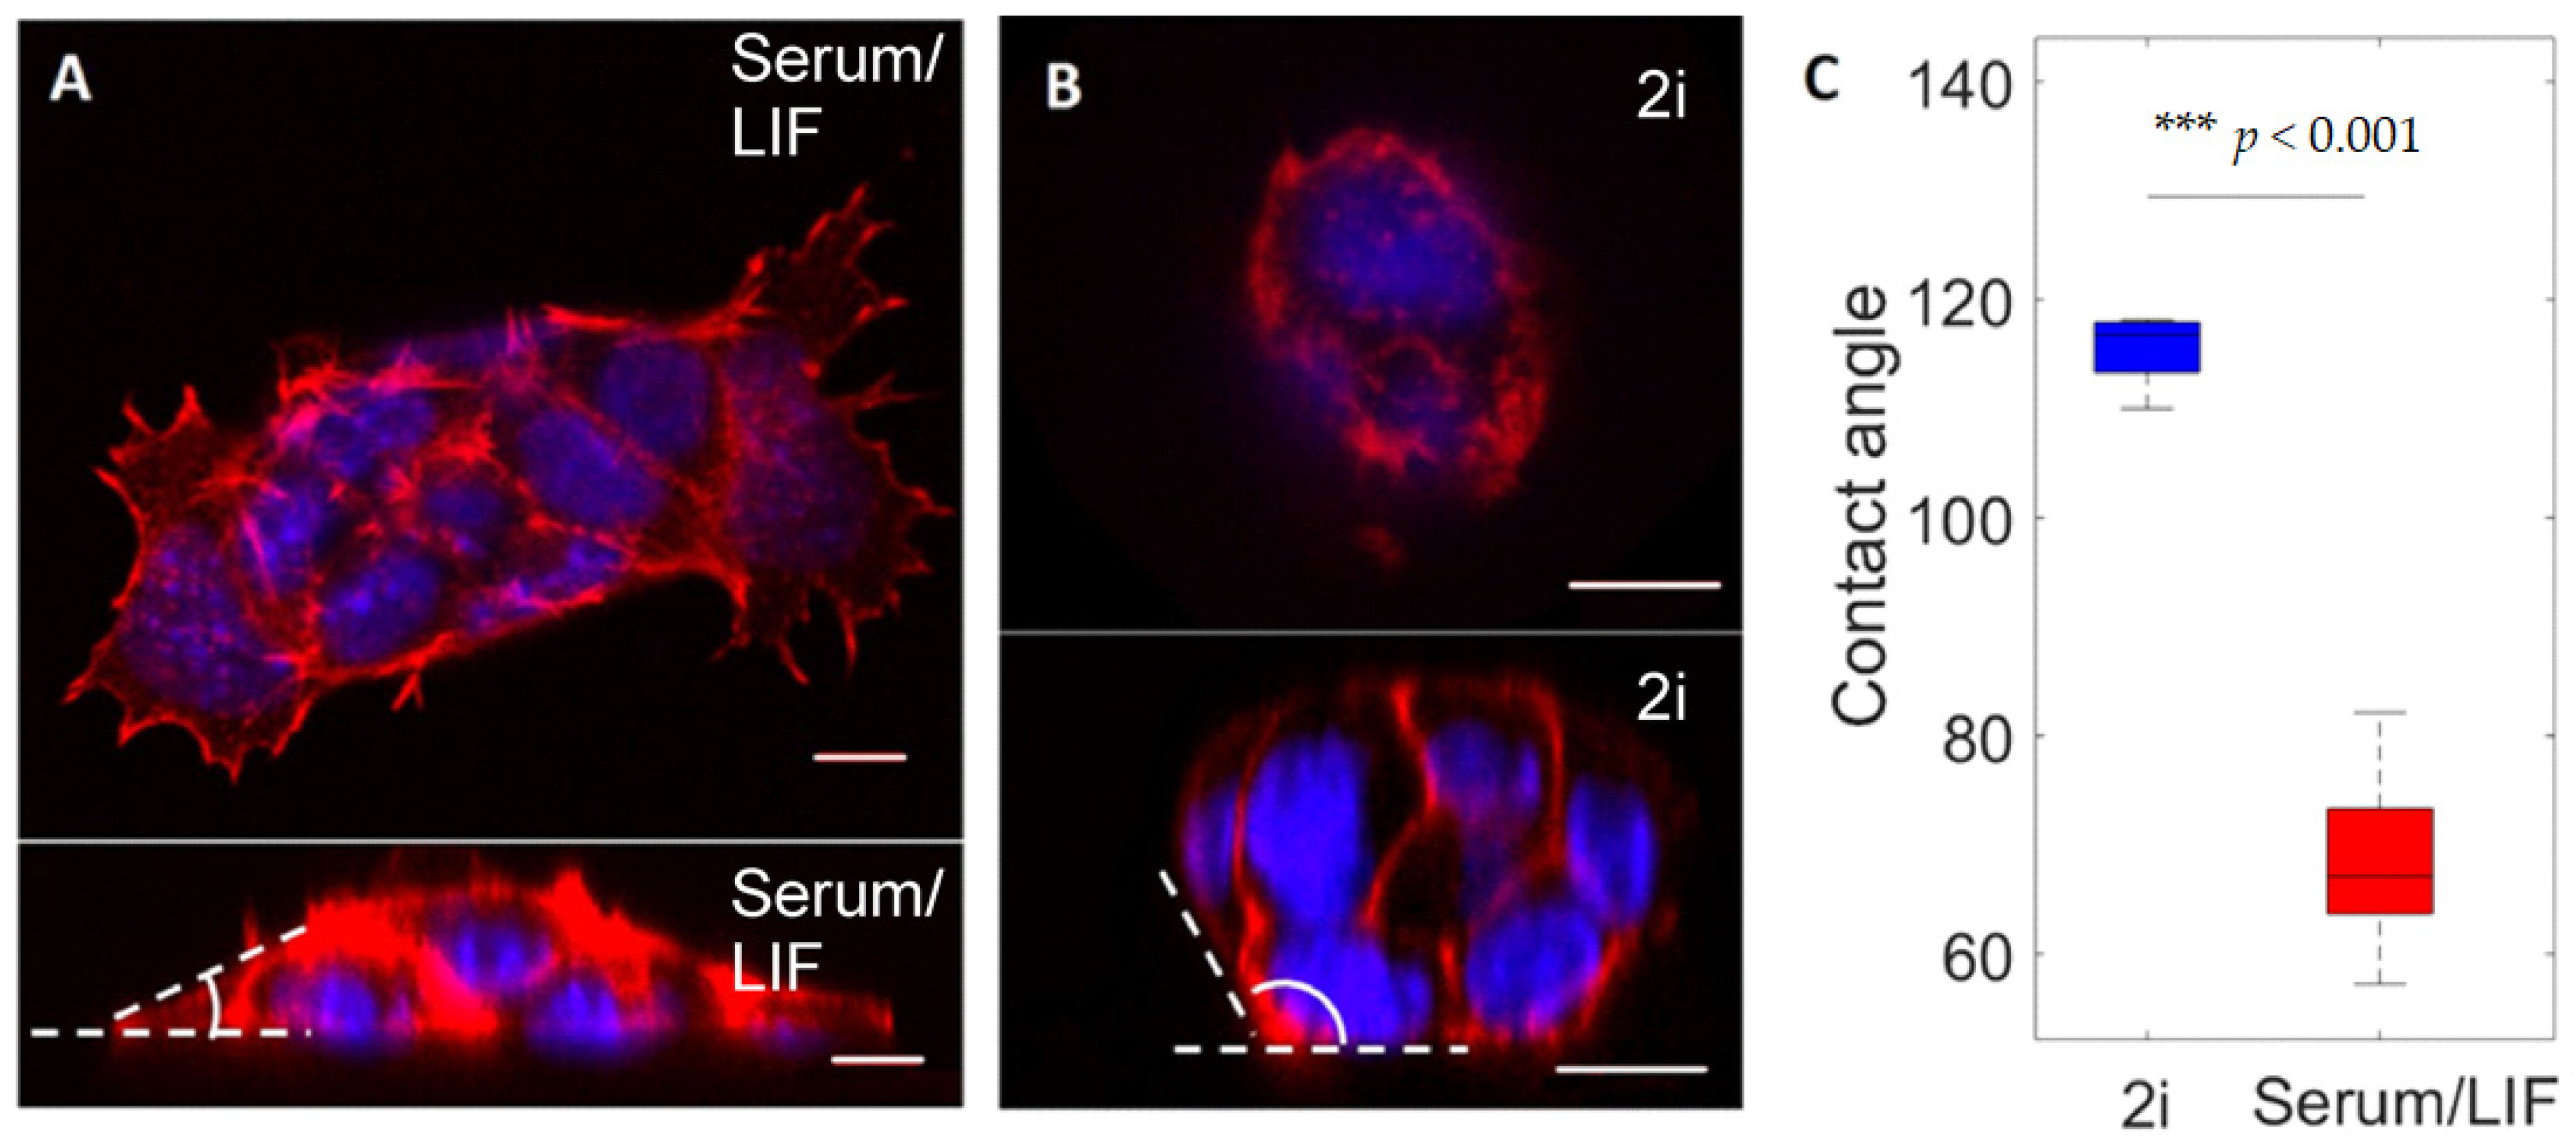
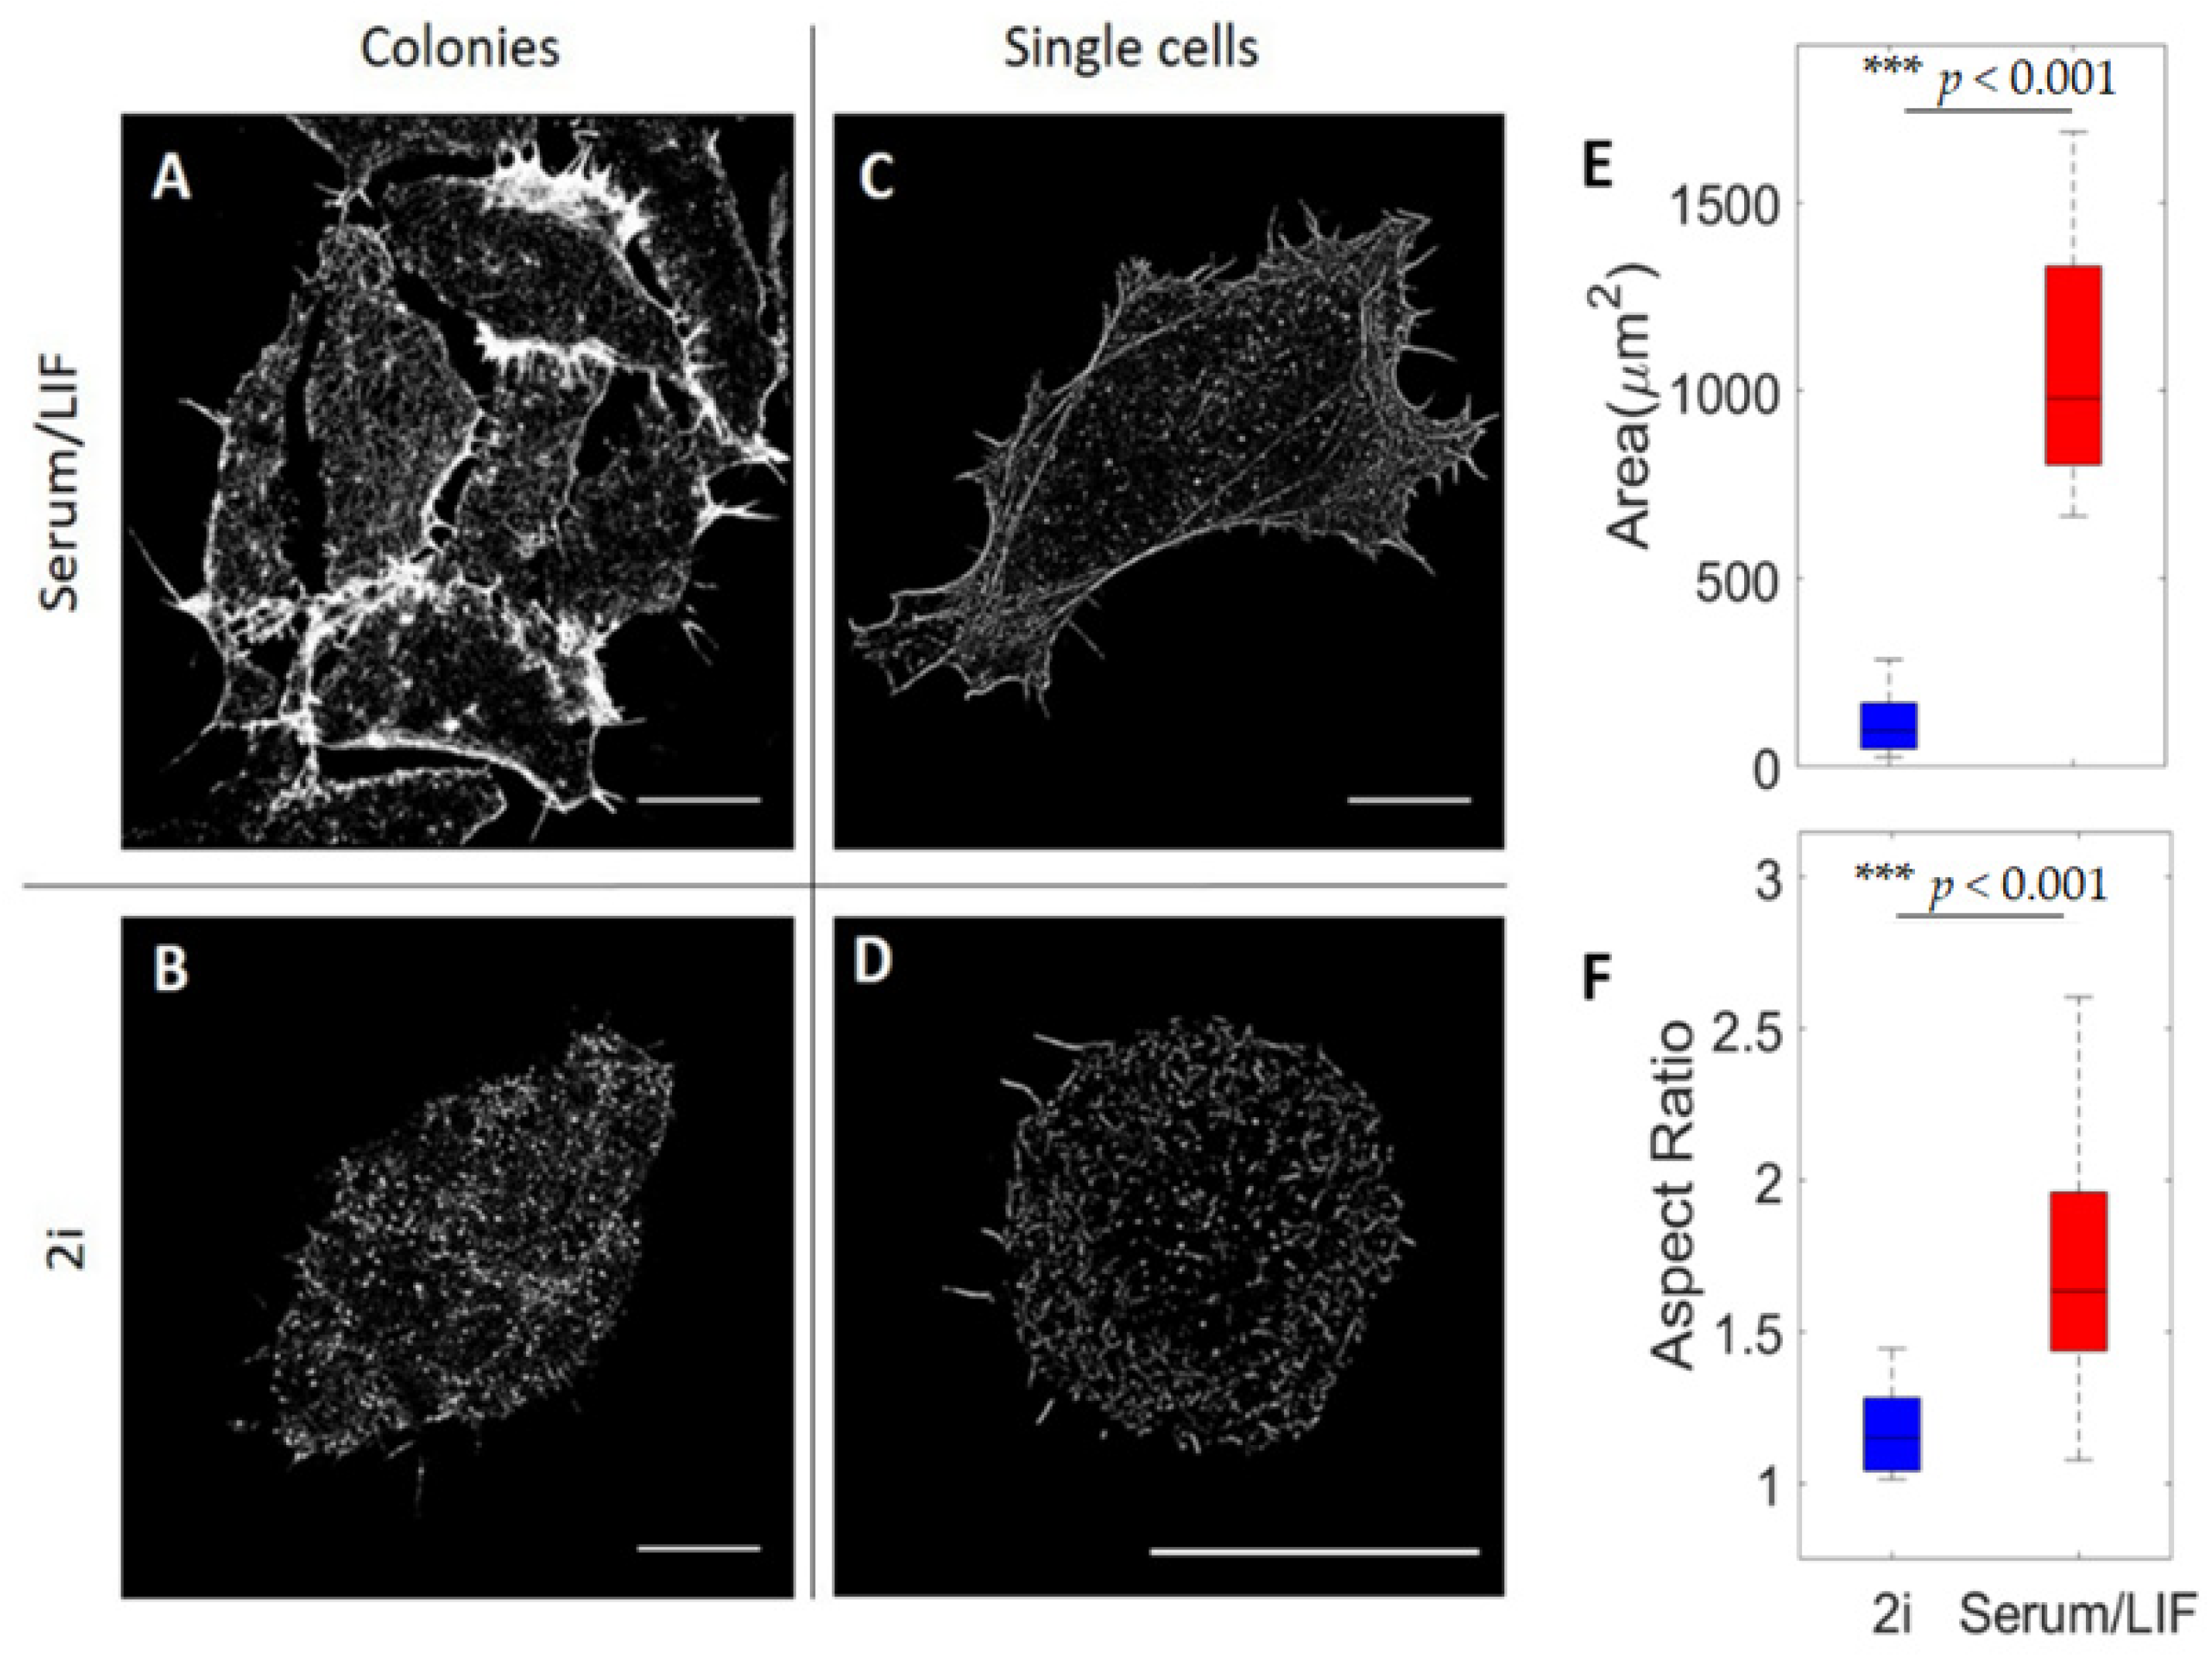
3.1. Geometry of Stem Cell Colonies Depend on Culture Condition
3.2. Nanoscale Architecture of Actin Depends on Culture Condition
3.3. Nanoscale Organization of Actin at the Surface Depends on Media Conditions
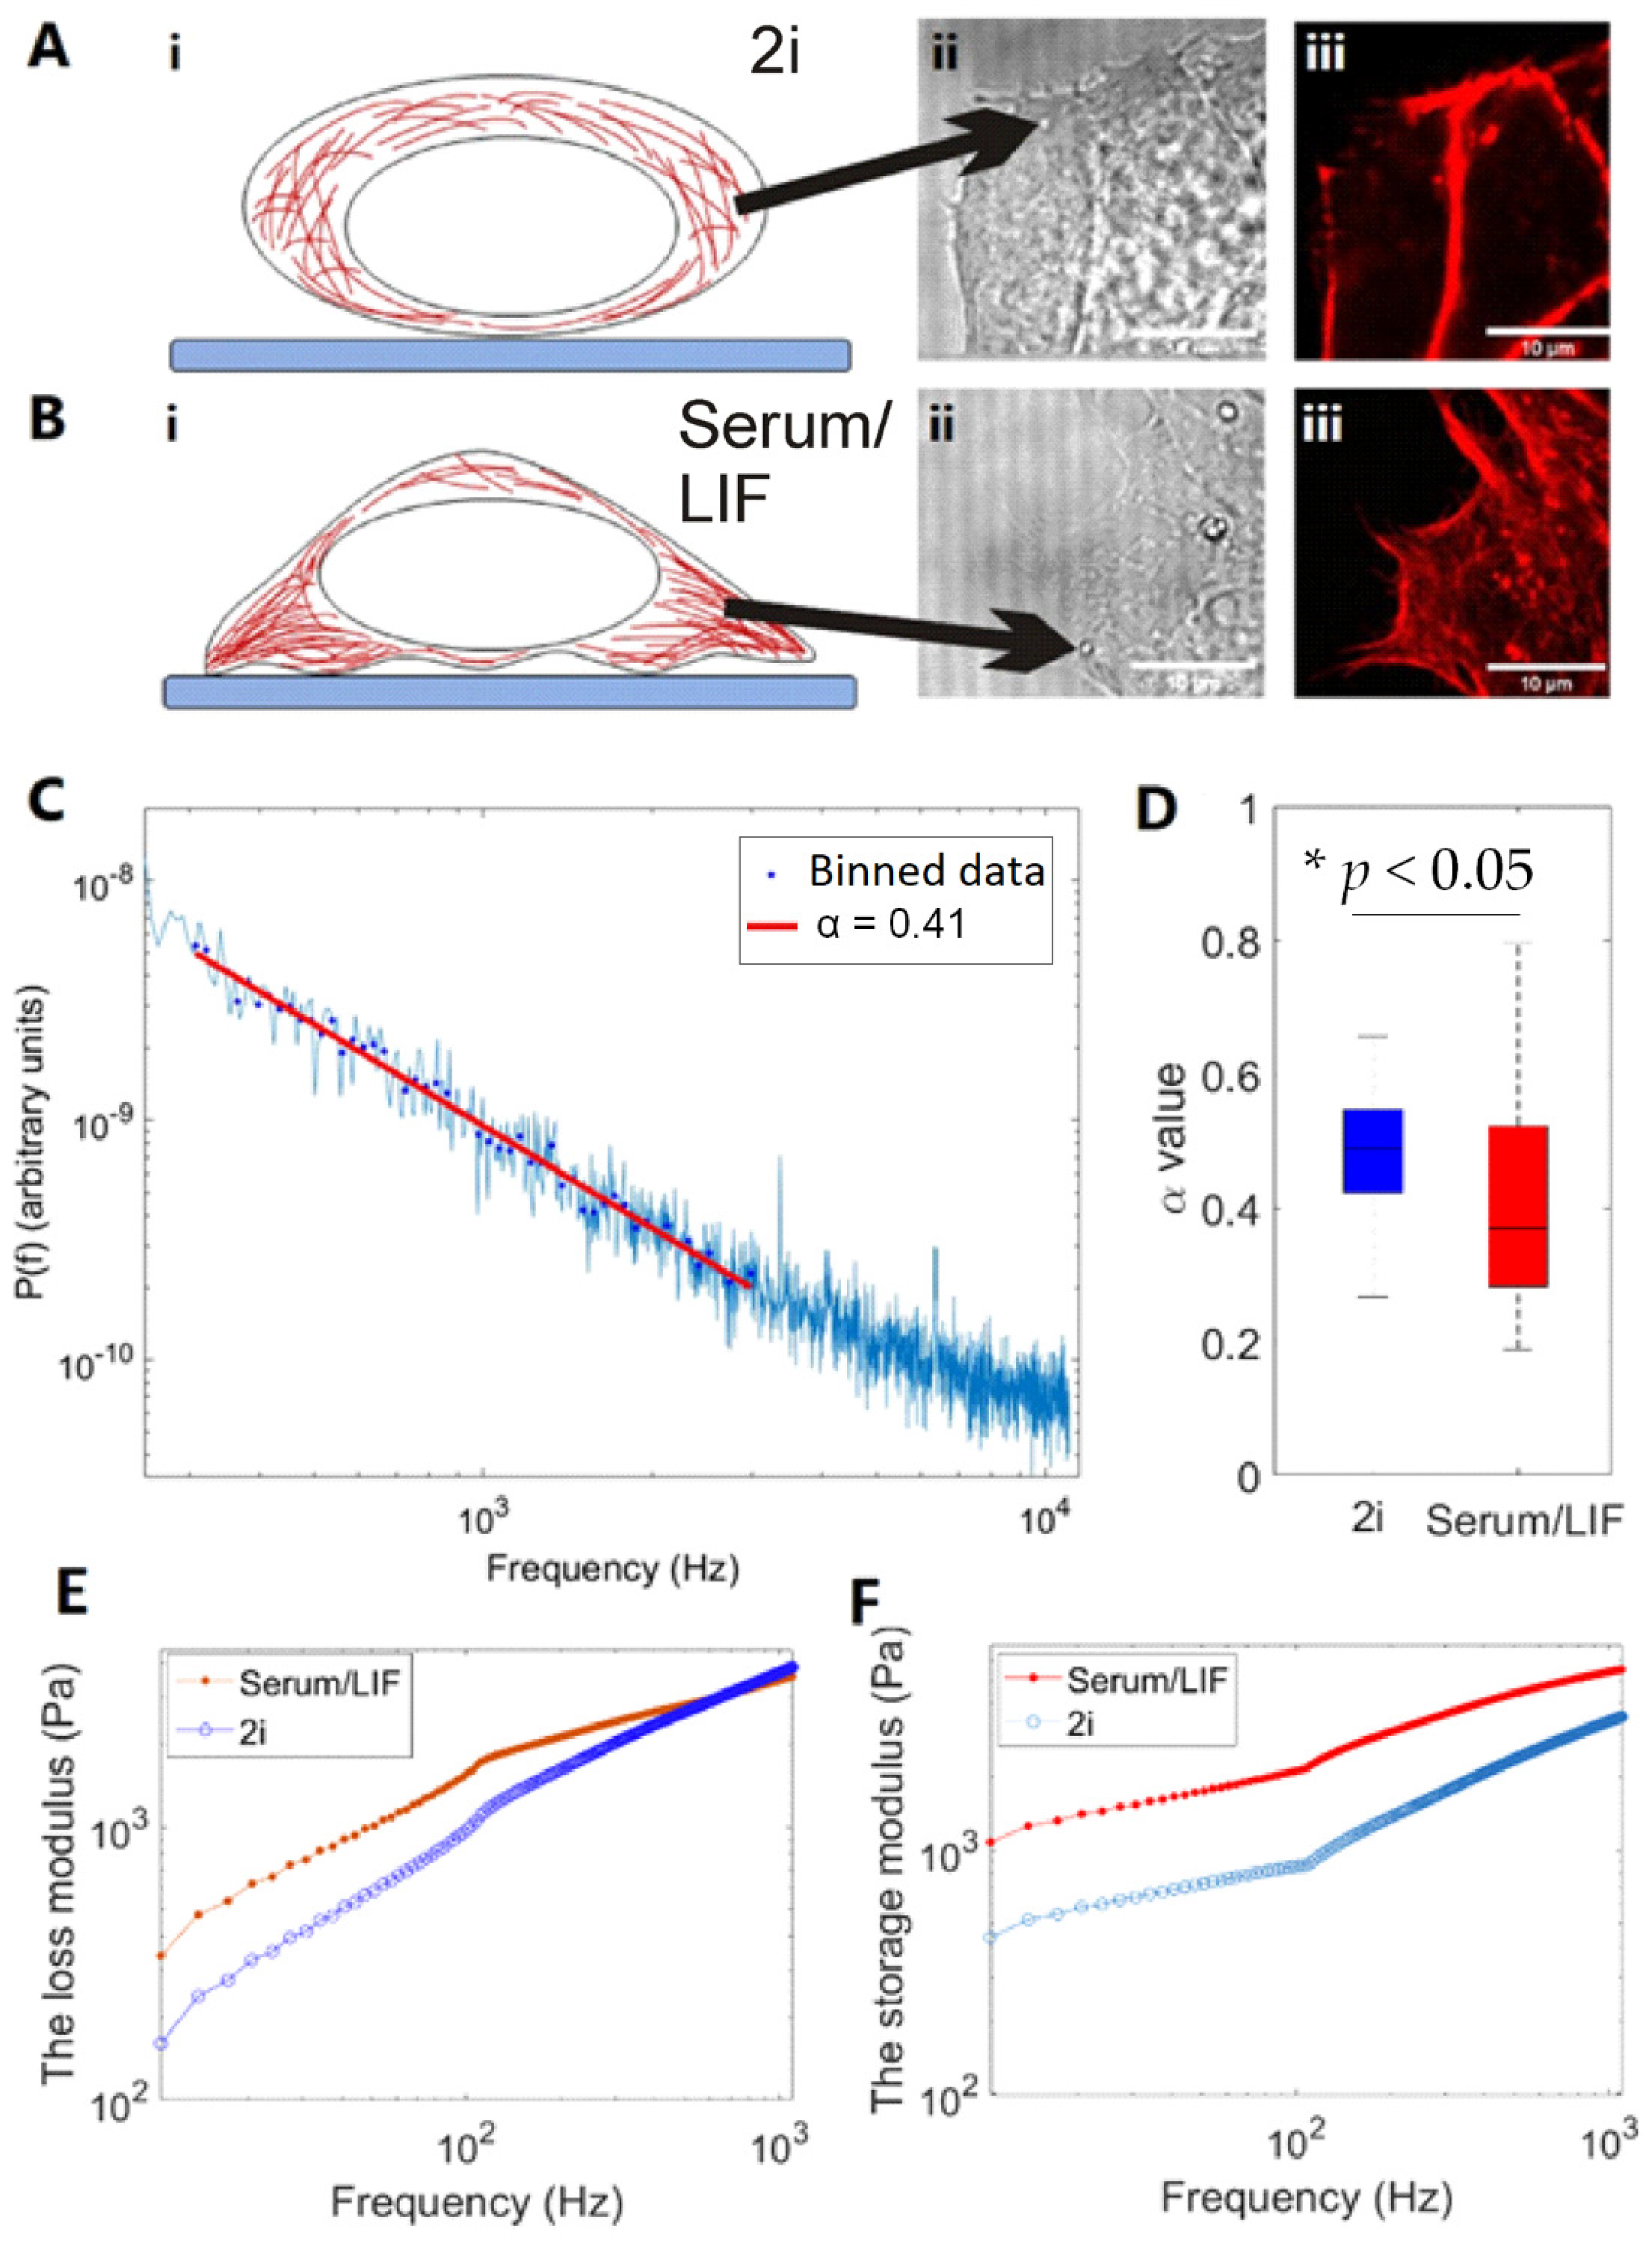
3.4. Viscoelastic Properties of Cells under Different Culturing Conditions
4. Discussion
5. Conclusions
Supplementary Materials
Author Contributions
Funding
Institutional Review Board Statement
Informed Consent Statement
Data Availability Statement
Conflicts of Interest
References
- Bongiorno, T.; Gura, J.; Talwar, P.; Chambers, D.; Young, K.M.; Arafat, D.; Wang, G.; Jackson-Holmes, E.L.; Qiu, P.; McDevitt, T.C.; et al. Biophysical subsets of embryonic stem cells display distinct phenotypic and morphological signatures. PLoS ONE 2018, 13, e0192631. [Google Scholar] [CrossRef] [Green Version]
- Urbanska, M.; Winzi, M.; Neumann, K.; Abuhattum, S.; Rosendahl, P.; Muller, P.; Taubenberger, A.; Anastassiadis, K.; Guck, J. Single-cell mechanical phenotype is an intrinsic marker of reprogramming and differentiation along the mouse neural lineage. Development 2017, 144, 4313–4321. [Google Scholar] [CrossRef] [Green Version]
- Engler, A.J.; Sen, S.; Sweeney, H.L.; Discher, D.E. Matrix elasticity directs stem cell lineage specification. Cell 2006, 126, 677–689. [Google Scholar] [CrossRef] [Green Version]
- Han, Y.L.; Pegoraro, A.F.; Li, H.; Li, K.; Yuan, Y.; Xu, G.; Gu, Z.; Sun, J.; Hao, Y.; Gupta, S.K.; et al. Cell swelling, softening and invasion in a three-dimensional breast cancer model. Nat. Phys. 2020, 16, 101–108. [Google Scholar] [CrossRef]
- Wullkopf, L.; West, A.K.V.; Leijnse, N.; Cox, T.R.; Madsen, C.D.; Oddershede, L.B.; Erler, J.T. Cancer cells’ ability to mechanically adjust to extracellular matrix stiffness correlates with their invasive potential. Mol. Biol. Cell 2018, 29, 2378–2385. [Google Scholar] [CrossRef]
- Xu, K.; Babcock, H.P.; Zhuang, X. Dual-objective STORM reveals three-dimensional filament organization in the actin cytoskeleton. Nat. Methods 2012, 9, 185–188. [Google Scholar] [CrossRef]
- Han, B.; Zhou, R.; Xia, C.; Zhuang, X. Structural organization of the actin-spectrin–based membrane skeleton in dendrites and soma of neurons. Proc. Natl. Acad. Sci. USA 2017, 114, E6678. [Google Scholar] [CrossRef] [PubMed] [Green Version]
- Xia, S.; Lim, Y.B.; Zhang, Z.; Wang, Y.; Zhang, S.; Lim, C.T.; Yim, E.K.F.; Kanchanawong, P. Nanoscale architecture of the cortical actin cytoskeleton in embryonic stem cells. Cell Rep. 2019, 28, 1251–1267.e7. [Google Scholar] [CrossRef] [Green Version]
- Svitkina, T.M. Actin cell cortex: Structure and molecular organization. Trends Cell Biol. 2020, 30, 556–565. [Google Scholar] [CrossRef] [PubMed]
- Anderson, K.G.V.; Hamilton, W.B.; Roske, F.V.; Azad, A.; Knudsen, T.E.; Canham, M.A.; Forrester, L.M.; Brickman, J.M. Insulin fine-tunes self-renewal pathways governing naive pluripotency and extra-embryonic endoderm. Nat. Cell Biol. 2017, 19, 1164–1177. [Google Scholar] [CrossRef] [PubMed]
- Martin Gonzalez, J.; Morgani, S.M.; Bone, R.A.; Bonderup, K.; Abelchian, S.; Brakebusch, C.; Brickman, J.M. Embryonic stem cell culture conditions support distinct states associated with different developmental stages and potency stem. Cell Rep. 2016, 7, 177–191. [Google Scholar] [CrossRef] [PubMed] [Green Version]
- Morgani, S.M.; Canham, M.A.; Nichols, J.; Sharov, A.A.; Migueles, R.P.; Ko, M.S.; Brickman, J.M. Totipotent embryonic stem cells arise in ground-state culture conditions. Cell Rep. 2013, 3, 1945–1957. [Google Scholar] [CrossRef] [PubMed] [Green Version]
- Canham, M.A.; Sharov, A.A.; Ko, M.S.; Brickman, J.M. Functional heterogeneity of embryonic stem cells revealed through translational amplification of an early endodermal transcript. PLoS Biol. 2010, 8, e1000379. [Google Scholar] [CrossRef] [PubMed]
- Nichols, J.; Smith, A. Naive and primed pluripotent states. Cell Stem Cell 2009, 4, 487–492. [Google Scholar] [CrossRef] [PubMed] [Green Version]
- Ying, Q.-L.; Wray, J.; Nichols, J.; Batlle-Morera, L.; Doble, B.; Woodgett, J.; Cohen, P.; Smith, A. The ground state of embryonic stem cell self-renewal. Nature 2008, 453, 519–523. [Google Scholar] [CrossRef] [PubMed] [Green Version]
- Sim, Y.J.; Kim, M.S.; Nayfeh, A.; Yun, Y.J.; Kim, S.J.; Park, K.T.; Kim, C.H.; Kim, K.S. 2i maintains a naive ground state in ESCS through two distinct epigenetic mechanisms stem. Cell Rep. 2017, 8, 1312–1328. [Google Scholar] [CrossRef] [PubMed] [Green Version]
- Tosolini, M.; Jouneau, A. Acquiring ground state pluripotency: Switching mouse embryonic stem cells from serum/LIF medium to 2i/LIF medium. Methods Mol. Biol. 2016, 1341, 41–48. [Google Scholar]
- Navarro, P. 2i, or not 2i: The soliloquy of nanog-negative mouse embryonic stem cells. Stem Cell Rep. 2018, 11, 1–3. [Google Scholar] [CrossRef] [Green Version]
- Morgani, S.M.; Brickman, J.M. LIF supports primitive endoderm expansion during pre-implantation development. Development 2015, 142, 3488–3499. [Google Scholar] [CrossRef] [Green Version]
- Betzig, E.; Patterson, G.H.; Sougrat, R.; Lindwasser, O.W.; Olenych, S.; Bonifacino, J.S.; Davidson, M.W.; Lippincott-Schwartz, J.; Hess, H.F. Imaging intracellular fluorescent proteins at nanometer resolution. Science 2006, 313, 1642–1645. [Google Scholar] [CrossRef] [Green Version]
- Rust, M.J.; Bates, M.; Zhuang, X. Sub-diffraction-limit imaging by stochastic optical reconstruction microscopy (STORM). Nat. Methods 2006, 3, 793–796. [Google Scholar] [CrossRef] [Green Version]
- Heilemann, M.; van de Linde, S.; Schuttpelz, M.; Kasper, R.; Seefeldt, B.; Mukherjee, A.; Tinnefeld, P.; Sauer, M. Subdiffraction-resolution fluorescence imaging with conventional fluorescent probes. Angew. Chem. Int. Ed. Engl. 2008, 47, 6172–6176. [Google Scholar] [CrossRef]
- van de Linde, S.; Loschberger, A.; Klein, T.; Heidbreder, M.; Wolter, S.; Heilemann, M.; Sauer, M. Direct stochastic optical reconstruction microscopy with standard fluorescent probes. Nat. Protoc. 2011, 6, 991–1009. [Google Scholar] [CrossRef]
- Andersen, T.; Bahadori, A.; Ott, D.; Kyrsting, A.; Reihani, S.N.; Bendix, P.M. Nanoscale phase behavior on flat and curved membranes. Nanotechnology 2014, 25, 505101. [Google Scholar] [CrossRef]
- Tolić-Nørrelykke, I.M.; Munteanu, E.-L.; Thon, G.; Oddershede, L.; Berg-Sørensen, K. Anomalous diffusion in living yeast cells. Phys. Rev. Lett. 2004, 93, 078102. [Google Scholar] [CrossRef] [PubMed] [Green Version]
- Selhuber-Unkel, C.; Yde, P.; Berg-Sørensen, K.; Oddershede, L.B. Variety in intracellular diffusion during the cell cycle. Phys. Biol. 2009, 6, 025015. [Google Scholar] [CrossRef] [PubMed]
- Hansen, P.M.; Tolic-Nørrelykke, I.M.; Flyvbjerg, H.; Berg-Sørensen, K. Tweezercalib 2.1.: Faster version of MatLab package for precise calibration of optical tweezers. Comput. Phys. Commun. 2006, 175, 572–573. [Google Scholar] [CrossRef]
- Wessel Alok, D.; Gumalla, M.; Grosshans, J.; Schmidt, C.F. The mechanical properties of early drosophila embryos measured by high-speed video microrheology. Biophys. J. 2015, 108, 1899–1907. [Google Scholar] [CrossRef] [Green Version]
- Norregaard, K.; Metzler, R.; Ritter, C.M.; Berg-Sorensen, K.; Oddershede, L.B. Manipulation and motion of organelles and single molecules in living cells. Chem. Rev. 2017, 117, 4342–4375. [Google Scholar] [CrossRef] [Green Version]
- Schnurr, B.; Gittes, F.; MacKintosh, F.C.; Schmidt, C.F. Determining microscopic viscoelasticity in flexible and semiflexible polymer networks from thermal fluctuations. Macromolecules 1997, 30, 7781–7792. [Google Scholar] [CrossRef] [Green Version]
- Gittes, F.; Schnurr, B.; Olmsted, P.D.; MacKintosh, F.C.; Schmidt, C.F. Microscopic Viscoelasticity: Shear moduli of soft materials determined from thermal fluctuations. Phys. Rev. Lett. 1997, 79, 3286–3289. [Google Scholar] [CrossRef] [Green Version]
- Chim, Y.H.; Mason, L.M.; Rath, N.; Olson, M.F.; Tassieri, M.; Yin, H. A one-step procedure to probe the viscoelastic properties of cells by Atomic Force Microscopy. Sci. Rep. 2018, 8, 14462. [Google Scholar] [CrossRef] [Green Version]
- Pesce, G.; Luca, A.C.D.; Rusciano, G.; Netti, P.A.; Fusco, S.; Sasso, A. Microrheology of complex fluids using optical tweezers: A comparison with macrorheological measurements. J. Opt. A Pure Appl. Opt. 2009, 11, 034016. [Google Scholar] [CrossRef]
- Nishi, K.; Kilfoil, M.L.; Schmidt, C.F.; MacKintosh, F.C. A symmetrical method to obtain shear moduli from microrheology. Soft Matter 2018, 14, 3716–3723. [Google Scholar] [CrossRef] [PubMed] [Green Version]
- Ovesny, M.; Krizek, P.; Borkovec, J.; Svindrych, Z.; Hagen, G.M. ThunderSTORM: A comprehensive ImageJ plug-in for PALM and STORM data analysis and super-resolution imaging. Bioinformatics 2014, 30, 2389–2390. [Google Scholar] [CrossRef] [PubMed]
- Schindelin, J.; Arganda-Carreras, I.; Frise, E.; Kaynig, V.; Longair, M.; Pietzsch, T.; Preibisch, S.; Rueden, C.; Saalfeld, S.; Schmid, B.; et al. Fiji: An open-source platform for biological-image analysis. Nat. Methods 2012, 9, 676–682. [Google Scholar] [CrossRef] [Green Version]
- Huang, B.; Wang, W.; Bates, M.; Zhuang, X. Three-dimensional super-resolution imaging by stochastic optical reconstruction microscopy. Science 2008, 319, 810–813. [Google Scholar] [CrossRef] [Green Version]
- Dai, P.; Luo, H.; Sheng, H.; Zhao, Y.; Li, L.; Wu, J.; Zhao, Y.; Suzuki, K. A new approach to segment both main and peripheral retinal vessels based on gray-voting and gaussian mixture model. PLoS ONE 2015, 10, e0127748. [Google Scholar] [CrossRef]
- Hendargo, H.C.; Estrada, R.; Chiu, S.J.; Tomasi, C.; Farsiu, S.; Izatt, J.A. Automated non-rigid registration and mosaicing for robust imaging of distinct retinal capillary beds using speckle variance optical coherence tomography. Biomed. Opt. Express 2013, 4, 803–821. [Google Scholar] [CrossRef] [Green Version]
- Rezakhaniha, R.; Agianniotis, A.; Schrauwen, J.T.C.; Griffa, A.; Sage, D.; Bouten, C.V.C.; van de Vosse, F.N.; Unser, M.; Stergiopulos, N. Experimental investigation of collagen waviness and orientation in the arterial adventitia using confocal laser scanning microscopy. Biomech. Modeling Mechanobiol. 2012, 11, 461–473. [Google Scholar] [CrossRef] [Green Version]
- Püspöki, Z.; Storath, M.; Sage, D.; Unser, M. Transforms and Operators for Directional Bioimage Analysis: A Survey. Focus on Bio-Image Informatics; de Vos, W.H., Munck, S., Timmermans, J.-P., Eds.; Springer International Publishing: Cham, Switzerland, 2016; pp. 69–93. [Google Scholar]
- Inoue, S.; Frank, V.; Horning, M.; Kaufmann, S.; Yoshikawa, H.Y.; Madsen, J.P.; Lewis, A.L.; Armes, S.P.; Tanaka, M. Live cell tracking of symmetry break in actin cytoskeleton triggered by abrupt changes in micromechanical environments. Biomater. Sci. 2015, 3, 1539–1544. [Google Scholar] [CrossRef] [Green Version]
- Gupta, M.; Sarangi, B.R.; Deschamps, J.; Nematbakhsh, Y.; Callan-Jones, A.; Margadant, F.; Mège, R.-M.; Lim, C.T.; Voituriez, R.; Ladoux, B. Adaptive rheology and ordering of cell cytoskeleton govern matrix rigidity sensing. Nat. Commun. 2015, 6, 7525. [Google Scholar] [CrossRef]
- Otto, O.; Rosendahl, P.; Mietke, A.; Golfier, S.; Herold, C.; Klaue, D.; Girardo, S.; Pagliara, S.; Ekpenyong, A.; Jacobi, A.; et al. Real-time deformability cytometry: On-the-fly cell mechanical phenotyping. Nat. Methods 2015, 12, 199–202. [Google Scholar] [CrossRef]
- Mietke, A.; Otto, O.; Girardo, S.; Rosendahl, P.; Taubenberger, A.; Golfier, S.; Ulbricht, E.; Aland, S.; Guck, J.; Fischer-Friedrich, E. Extracting cell stiffness from real-time deformability cytometry: Theory and experiment. Biophys. J. 2015, 109, 2023–2036. [Google Scholar] [CrossRef] [Green Version]
- Chalut, K.J.; Paluch, E.K. The actin cortex: A bridge between cell shape and function. Dev. Cell 2016, 38, 571–573. [Google Scholar] [CrossRef] [PubMed] [Green Version]
- Tojkander, S.; Gateva, G.; Lappalainen, P. Actin stress fibers–assembly, dynamics and biological roles. J. Cell Sci. 2012, 125, 1855–1864. [Google Scholar] [CrossRef] [PubMed] [Green Version]
- Naumanen, P.; Lappalainen, P.; Hotulainen, P. Mechanisms of actin stress fibre assembly. J. Microsc. 2008, 231, 446–454. [Google Scholar] [CrossRef] [PubMed]
- Perez-Gonzalez, C.; Alert, R.; Blanch-Mercader, C.; Gomez-Gonzalez, M.; Kolodziej, T.; Bazellieres, E.; Casademunt, J.; Trepat, X. Active wetting of epithelial tissues. Nat. Phys. 2019, 15, 79–88. [Google Scholar] [CrossRef]
- De Belly, H.; Stubb, A.; Yanagida, A.; Labouesse, C.; Jones, P.H.; Paluch, E.K.; Chalut, K.J. Membrane tension gates ERK-mediated regulation of pluripotent cell fate. Cell Stem Cell 2021, 28, 273–284.e6. [Google Scholar] [CrossRef]
- Bergert, M.; Lembo, S.; Sharma, S.; Russo, L.; Milovanovic, D.; Gretarsson, K.H.; Bormel, M.; Neveu, P.A.; Hackett, J.A.; Petsalaki, E.; et al. Cell surface mechanics gate embryonic stem cell differentiation. Cell Stem Cell 2021, 28, 209–216.e4. [Google Scholar] [CrossRef]
- Fierro-Gonzalez, J.C.; White, M.D.; Silva, J.C.; Plachta, N. Cadherin-dependent filopodia control preimplantation embryo compaction. Nat. Cell Biol. 2013, 15, 1424–1433. [Google Scholar] [CrossRef]
- Maitre, J.L.; Berthoumieux, H.; Krens, S.F.; Salbreux, G.; Julicher, F.; Paluch, E.; Heisenberg, C.P. Adhesion functions in cell sorting by mechanically coupling the cortices of adhering cells. Science 2012, 338, 253–256. [Google Scholar] [CrossRef] [PubMed]


Publisher’s Note: MDPI stays neutral with regard to jurisdictional claims in published maps and institutional affiliations. |
© 2021 by the authors. Licensee MDPI, Basel, Switzerland. This article is an open access article distributed under the terms and conditions of the Creative Commons Attribution (CC BY) license (https://creativecommons.org/licenses/by/4.0/).
Share and Cite
Barooji, Y.F.; Hvid, K.G.; Petitjean, I.I.; Brickman, J.M.; Oddershede, L.B.; Bendix, P.M. Changes in Cell Morphology and Actin Organization in Embryonic Stem Cells Cultured under Different Conditions. Cells 2021, 10, 2859. https://doi.org/10.3390/cells10112859
Barooji YF, Hvid KG, Petitjean II, Brickman JM, Oddershede LB, Bendix PM. Changes in Cell Morphology and Actin Organization in Embryonic Stem Cells Cultured under Different Conditions. Cells. 2021; 10(11):2859. https://doi.org/10.3390/cells10112859
Chicago/Turabian StyleBarooji, Younes F., Kasper G. Hvid, Irene Istúriz Petitjean, Joshua M. Brickman, Lene B. Oddershede, and Poul M. Bendix. 2021. "Changes in Cell Morphology and Actin Organization in Embryonic Stem Cells Cultured under Different Conditions" Cells 10, no. 11: 2859. https://doi.org/10.3390/cells10112859
APA StyleBarooji, Y. F., Hvid, K. G., Petitjean, I. I., Brickman, J. M., Oddershede, L. B., & Bendix, P. M. (2021). Changes in Cell Morphology and Actin Organization in Embryonic Stem Cells Cultured under Different Conditions. Cells, 10(11), 2859. https://doi.org/10.3390/cells10112859