1. Introduction
Postnatal mesenchymal stem cell populations have been found in most healthy and non-healthy oral tissues. Among the most studied dental stem cell populations are the ones derived from the dental pulp of both permanent (DPSCs) and deciduous teeth (SHEDs). These populations are easily accessible and can be effortlessly isolated from routinely extracted premolars and 3rd molars or from exfoliating deciduous teeth [
1,
2]. Both SHEDs and/or DPSCs can be used to treat dental and non-dental conditions in preclinical studies [
3,
4,
5] and to have higher proliferative rates [
1] and higher regenerative capacity [
6] than mesenchymal stem cells (MSCs) derived from the bone marrow. These characteristics facilitate their ex vivo expansion in sufficient numbers [
7,
8] making them excellent candidates for cell therapies and tissue engineering. Interestingly, the dental pulp and bone marrow are both highly vascularized innervated soft tissues, encircled by cells capable of forming mineral tissue [
9]. In a living organism, cells reside within 100–200 µm of a capillary as they cannot survive outside of this range simply by diffusion [
10]. In tissue engineering, the absence of a vascular network capable of distributing nutrients and oxygen is a major limiting factor [
11]. In this regard, dental pulp stem cells (SHEDs and DPSCs) can specifically differentiate into vasculogenic endothelial cells both in vitro and in vivo [
12,
13,
14], anastomize with the host vasculature [
15] and have higher angiogenic activity than bone marrow MSCs [
5]. Nevertheless, the precise cellular and molecular mechanisms by which dental pulp stem cells form functional blood vessels remain mostly unclear.
We previously have shown that VEGF (Vascular Endothelial Growth Factor) induces vasculogenic differentiation of dental pulp stem cells (DPSCs and SHEDs) via activation of the canonical Wnt/b-catenin signaling pathway [
14]. Wnt alone can induce this differentiation while silencing Wnt blocks this process. Thus, dental pulp stem cells can be induced to differentiate into blood vessels in a process that resembles the embryonic vasculogenesis [
14]. VEGF signals through VEGFR1 to activate MEK1/ERK signaling and inhibit STAT3 transcriptional activity resulting in endothelial differentiation of pulp stem cells [
13]. A crosstalk between endothelial cells and stem cells within the perivascular niche is required for the maintenance of stem cell pools in dental pulps. Confocal microscopy showed that ALDH1
high and Bmi-1
high stem cells are preferentially localized in close proximity to blood vessels in physiological human dental pulps. In contrast, transplantation of dental pulp stem cells stably transduced with short hairpin RNA (shRNA)-STAT3 into immunodeficient mice revealed a decrease in the number of blood vessels surrounded by ALDH1
high or Bmi-1
high cells (perivascular niches) compared to tissues formed by control stem cells [
16]. More recently, we showed that after a brief induction with VEGF, DPSCs start to express VEGFR2 [
15].
Dental pulp stem cells are composed of different sub-populations and contain at least one unique subset of stem cells characterized by high VEGFR1 expression that are primed for vasculogenic differentiation. This sub-population of cells corresponds to 10–20% of DPSC cells that can differentiate into endothelial cells [
17]. In addition, p53/p21 functioning through Bmi-1 can prevent the vasculogenic differentiation of DPSC cells. Thus, the regulation of the stemness state is also an important factor that can influence the capacity to undergo vasculogenic differentiation besides the percentage of stem cells that are “primed” to differentiate into vascular endothelial cells [
18].
Lineage tracing is the identification of all progenies of a single cell and a powerful tool to understand complex biological processes that involve different cell hierarchies and multiple cell types [
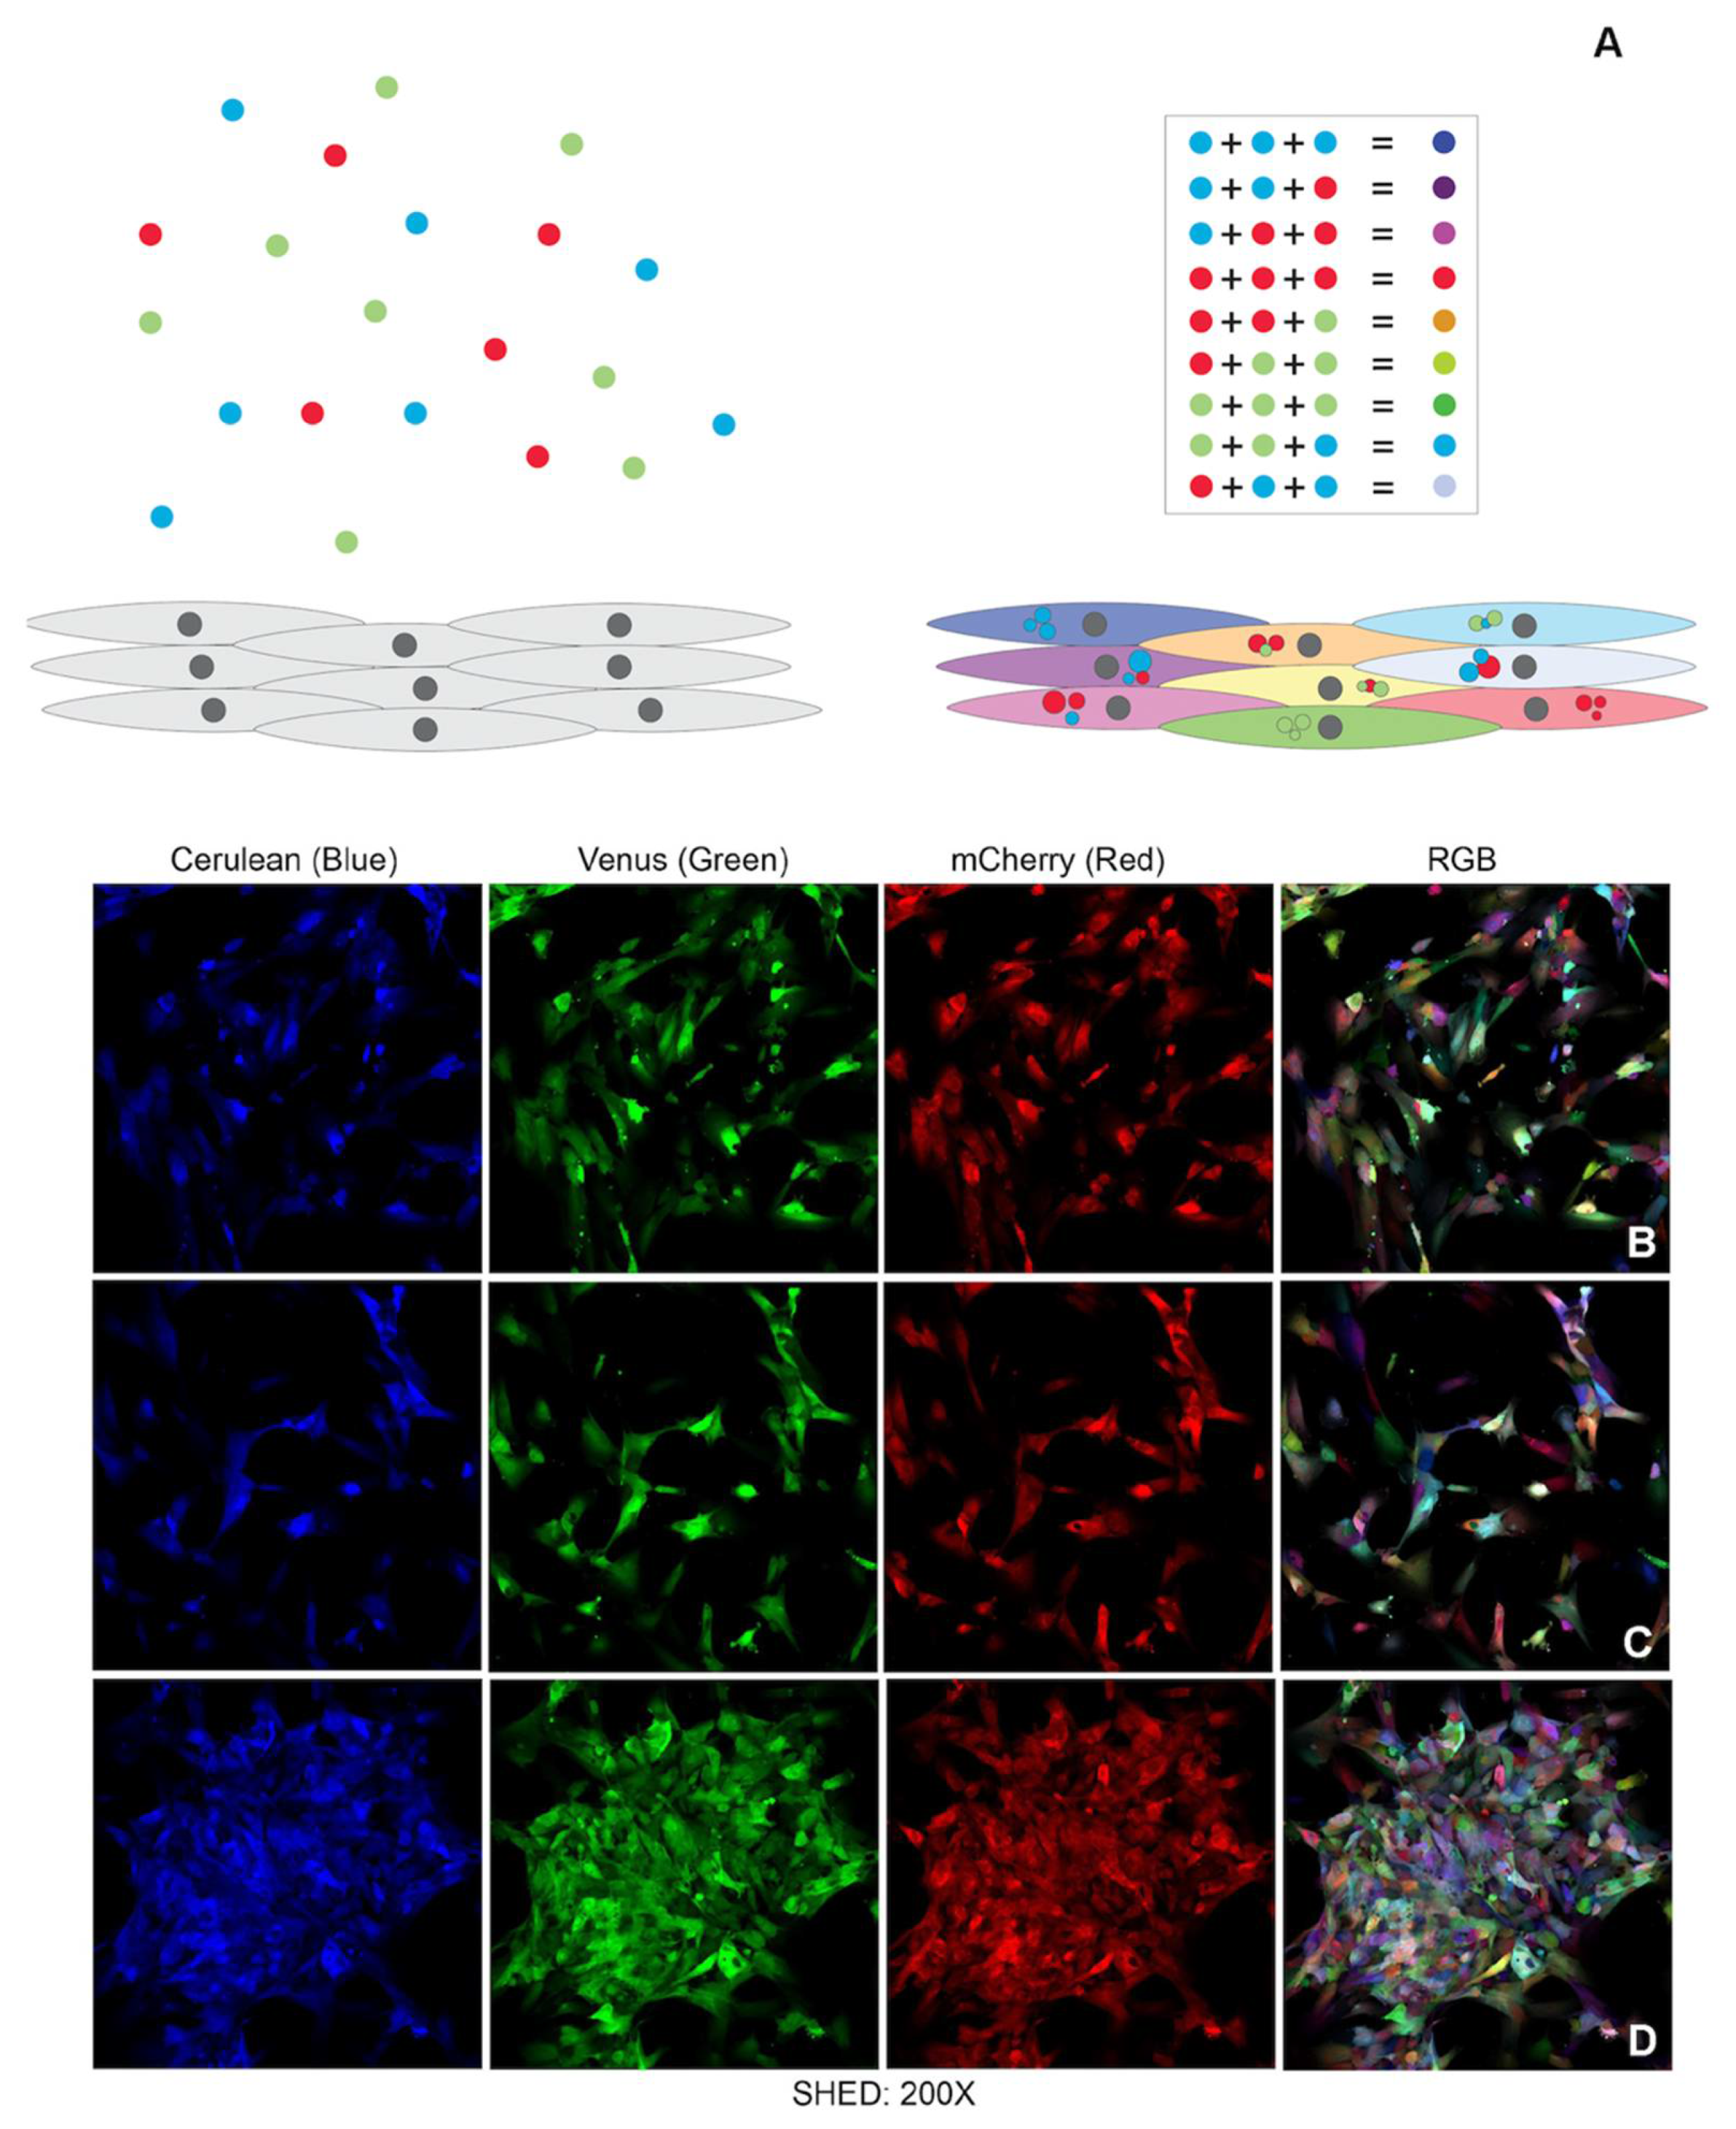
19], such as vasculogenesis. One of the most elegant lineage tracing strategies is the brainbow which uses the Cre-lox recombination system to insert multiple copies of a transgenic construct carrying three different main hues (RGB—red, blue and green) into the genome of a mouse. As a result, mouse brain cells express randomly different ratios of fluorescent proteins and exhibit a variety of colorful hues known as the rainbow effect [
20,
21]. Brainbow-like strategies are now used to create similar colorful cellular identification tags [
22] in cultured cells. Instead of using Cre-recombination techniques, cells in culture can be transduced with lentiviral vectors (LeGo vectors—Lentiviral Gene Ontology Vectors) that encode RGB fluorescent proteins. The random combination of these three basic colors into the cells’ genome will also result in the whole spectrum of rainbow colors [
22]. Herein we used the LeGo vectors to create the pulpbow and used this system to track dental pulp stem cell fate while they undergo vasculogenic differentiation and form blood vessels. We aimed to analyze how stem cells from permanent and deciduous pulp tissues contributed to tissue vascularization using 3D models in in vitro, ex vivo and in vivo assays.
2. Materials and Methods
2.1. Pulpbow
Prior to the creation of the pulpbow, DPSCs and SHED were cultured in growth medium composed of α-minimum essential medium (α-MEM; Invitrogen; Waltham, MA, USA) supplemented with 20% fetal bovine serum (FBS; Invitrogen), 1% antibiotic-antimycotic (Invitrogen) and 20 µg/mL Plasmocin (InVivogen; San Diego, CA, USA). Cells were passed according to the cellular metabolism and before reaching 80% confluency. SHED cells were developed and characterized according to the protocol previously published by the Songtao Shi laboratory [
2].
To create the pulpbow, DPSCs I and II (Lonza; Basel, Switzerland) and SHED (gift from Songtao Shi) were transduced with LeGO vectors (Lentiviral Gene Ontology), as described by Weber and colleagues [
22]. The plasmids used were commercially available lentiviral vectors constructed under the SFFV promoter (Addgene; Watertown, MA, USA): LeGO-Cer 2 (Cerulean34, blue, cat# 27338), LeGO-C2 (mCherry35, red, cat# 27339) and LeGO-V2 (Venus36, green, cat# 27340). For the transfection, a cocktail composed of 2 M CaCl
2, 2× HBS (Hepes Buffered Saline), double distilled water and a DNA mixture of 10 ug of psPAX2, 5 ug of pMD2.G and 3 µg of each 3 LeGo lentiviral particles was added to a 10 cm culture dish containing 2 × 10
6 of HEK-292T cells. The DNA mixture was maintained in the cell culture for 6–8 h. Cell culture medium, i.e., Dulbecco Minimum Essential Medium (DMEM; Invitrogen, Carlsbad, CA, USA) was changed and cells were allowed to grow for 24 h at 37 °C in a humidified incubator in an atmosphere of 5–7% CO
2. The medium was collected, filtered with 0.4 µm filter and supernatants were centrifuged at 3000×
g, at 4 °C, for 10 min. Supernatant aliquots were frozen at −80 °C. One batch of DPCS and two of SHED cells were used for the transduction with lentivirus supernatant at early passages. A solution containing 2 mL of the supernatant, 6 mL of alpha-Minimum Essential Medium (α-MEM; Invitrogen, Carlsbad, CA, USA) and 4 µg/mL of polybrene (Sigma-Aldrich, St Louis, MO, USA) was added to the plated cells for 30 h. The efficiency of the transduction was checked using a standard fluorescent microscope followed by a confocal microscope (Leica inverted SP5—Leica microsystems; Wentzler, Germany) to check for the rainbow effect. The lineages created after the transduction were named by adding the word RGB after the initial name of the primary cell culture.
For color analysis, cells platted in coverslips were left for 30 min in a fixative solution containing 80 µL of 25% glutaraldehyde (Fisher Scientific; Waltham, MA, USA), 540 µL of 37% formaldehyde (Fisher Scientific, Waltham, MA, USA) and PBS (Invitrogen, Carlsbad, CA, USA) to top 10 mL. Coverslips were mounted on top of histological slides with Vectashield without DAPI (Vector Laboratories, San Francisco, CA, USA). Imaging was achieved using an inverted Leica SP5 confocal microscope (Leica microsystems, Wentzler, Germany). The 405 nm laser and the tunable white light laser were used for imaging cells which was sufficient to excite fluorescence in all three channels (red, blue and green). The detectors range were established as following: red channel spectral range was from 585–620 nm bandpass; green channel, a filter with 535–565 nm bandpass; blue channel, a filter with 465–500 nm. Each channel was acquired sequentially between lines. Images were recorded in 1024 × 1024 format and scanning speed was set to 100 Hz in bidirectional mode. The zoom factor varied according to the area analyzed, with the line average set to 4. Pinhole size was set to 50 µm.
2.2. Sprouting Formation and Morphology
DPSC-RGB I at passage 14 and 15, DPSC-RGBII at passage 10 and 11 and SHED nor-RGB at passage 8 and 9 and were used in all experiments, including independent repetitions. Sprouts were created by platting 1.5 × 10
4 SHED-RGB or DPSC-RGBII into 350 μL/well (of 24 well plates) of growth factor reduced Matrigel (BD Biosciences; Franklyn, NJ, USA). For each experiment two wells per cell-line per time of analysis were seeded. Growth medium (α-MEM) supplemented with 15% fetal bovine serum (FBS, Invitrogen, Carlsbad, CA, USA) and 1% penicillin/streptomycin (Invitrogen) was used for the first 24 h. After that, it was changed into vasculogenic medium, i.e., Endothelial Growth Medium-2 for microvascular cells (EGM2-MV; Lonza) supplemented with 5% FBS (Invitrogen) and 1% penicillin/streptomycin (Invitrogen), as described [
13]. Cells were allowed to grow and form sprouts for 7–11 days. As a control of the differentiation system, human dermal microvascular endothelial cells (HDMEC; PromoCell, Heidelberg, Germany) were used in the same experimental conditions. However, sprouts were already formed by 24 h in vitro with HDMEC. For the statistical analysis of sprouting numbers, five random areas/wells were marked on the plate using a previously created template. Photomicrographs of these areas were taken using microscope (Olympus; Tokyo, Japan) and Image Pro Plus software (version 5.1.2.59; Media Cybernetics Inc., Rockville, MD, USA) at 100×. The number of elongated capillary-like sprouts was counted per microscopic field. Two wells were used per time of analysis (7, 9 and 11 days) resulting in a total of 10 random fields counted per time-point and cell type. SPSS (IBM—Armonk, NY, USA) was used for statistical analysis. Data were presented as mean ± standard deviation. The t-test and two-way ANOVA, followed by the Bonferroni Test, were performed for comparing sprouting counts.
p < 0.05 was considered statistically significant.
2.3. Imaging 3D Sprouts In Vitro
Custom-made chambers (2 mm thick) were created using a histological slide and a coverslip with a wax spacer to enable confocal imaging of sprouts (
Supplemental Figure S1A). The coverslip size was used according to the need of the experiment and was sealed using warmed wax in three (out of four) sides leaving one open side for access (
Supplemental Figure S1B). After transferring the matrigel containing sprouts to the chamber containing culture medium, the fourth side was also sealed with wax (
Supplemental Figure S3C). Samples were analyzed using an inverted confocal microscope with coverslip turned down (
Supplemental Figure S1D) within 48 h.
For imaging after 7–11 days of vasculogenic induction, sprouts generated by SHED-RGB cells were left for 2 h in a fixative solution containing 80 µL of 25% glutaraldehyde (Fisher Scientific), 540 µL of 37% formaldehyde (Fisher Scientific, Waltham, MA, USA) and PBS (Invitrogen, Carlsbad, CA, USA) to top 10 mL. Matrigel containing sprouts were transferred to custom slide chambers and one or two drops of Vectashield without DAPI (Vector Laboratories, Sao Francisco, CA, USA) was added before the chambers were sealed. Imaging for pictures was achieved using an inverted Leica SP5 confocal microscope (Leica microsystems, Wentzler, Germany). The microscope configuration was the same as described for the analysis of RGB populations. However, the pinhole size was set to 200 µm and Z-stack pictures were taken in selected areas.
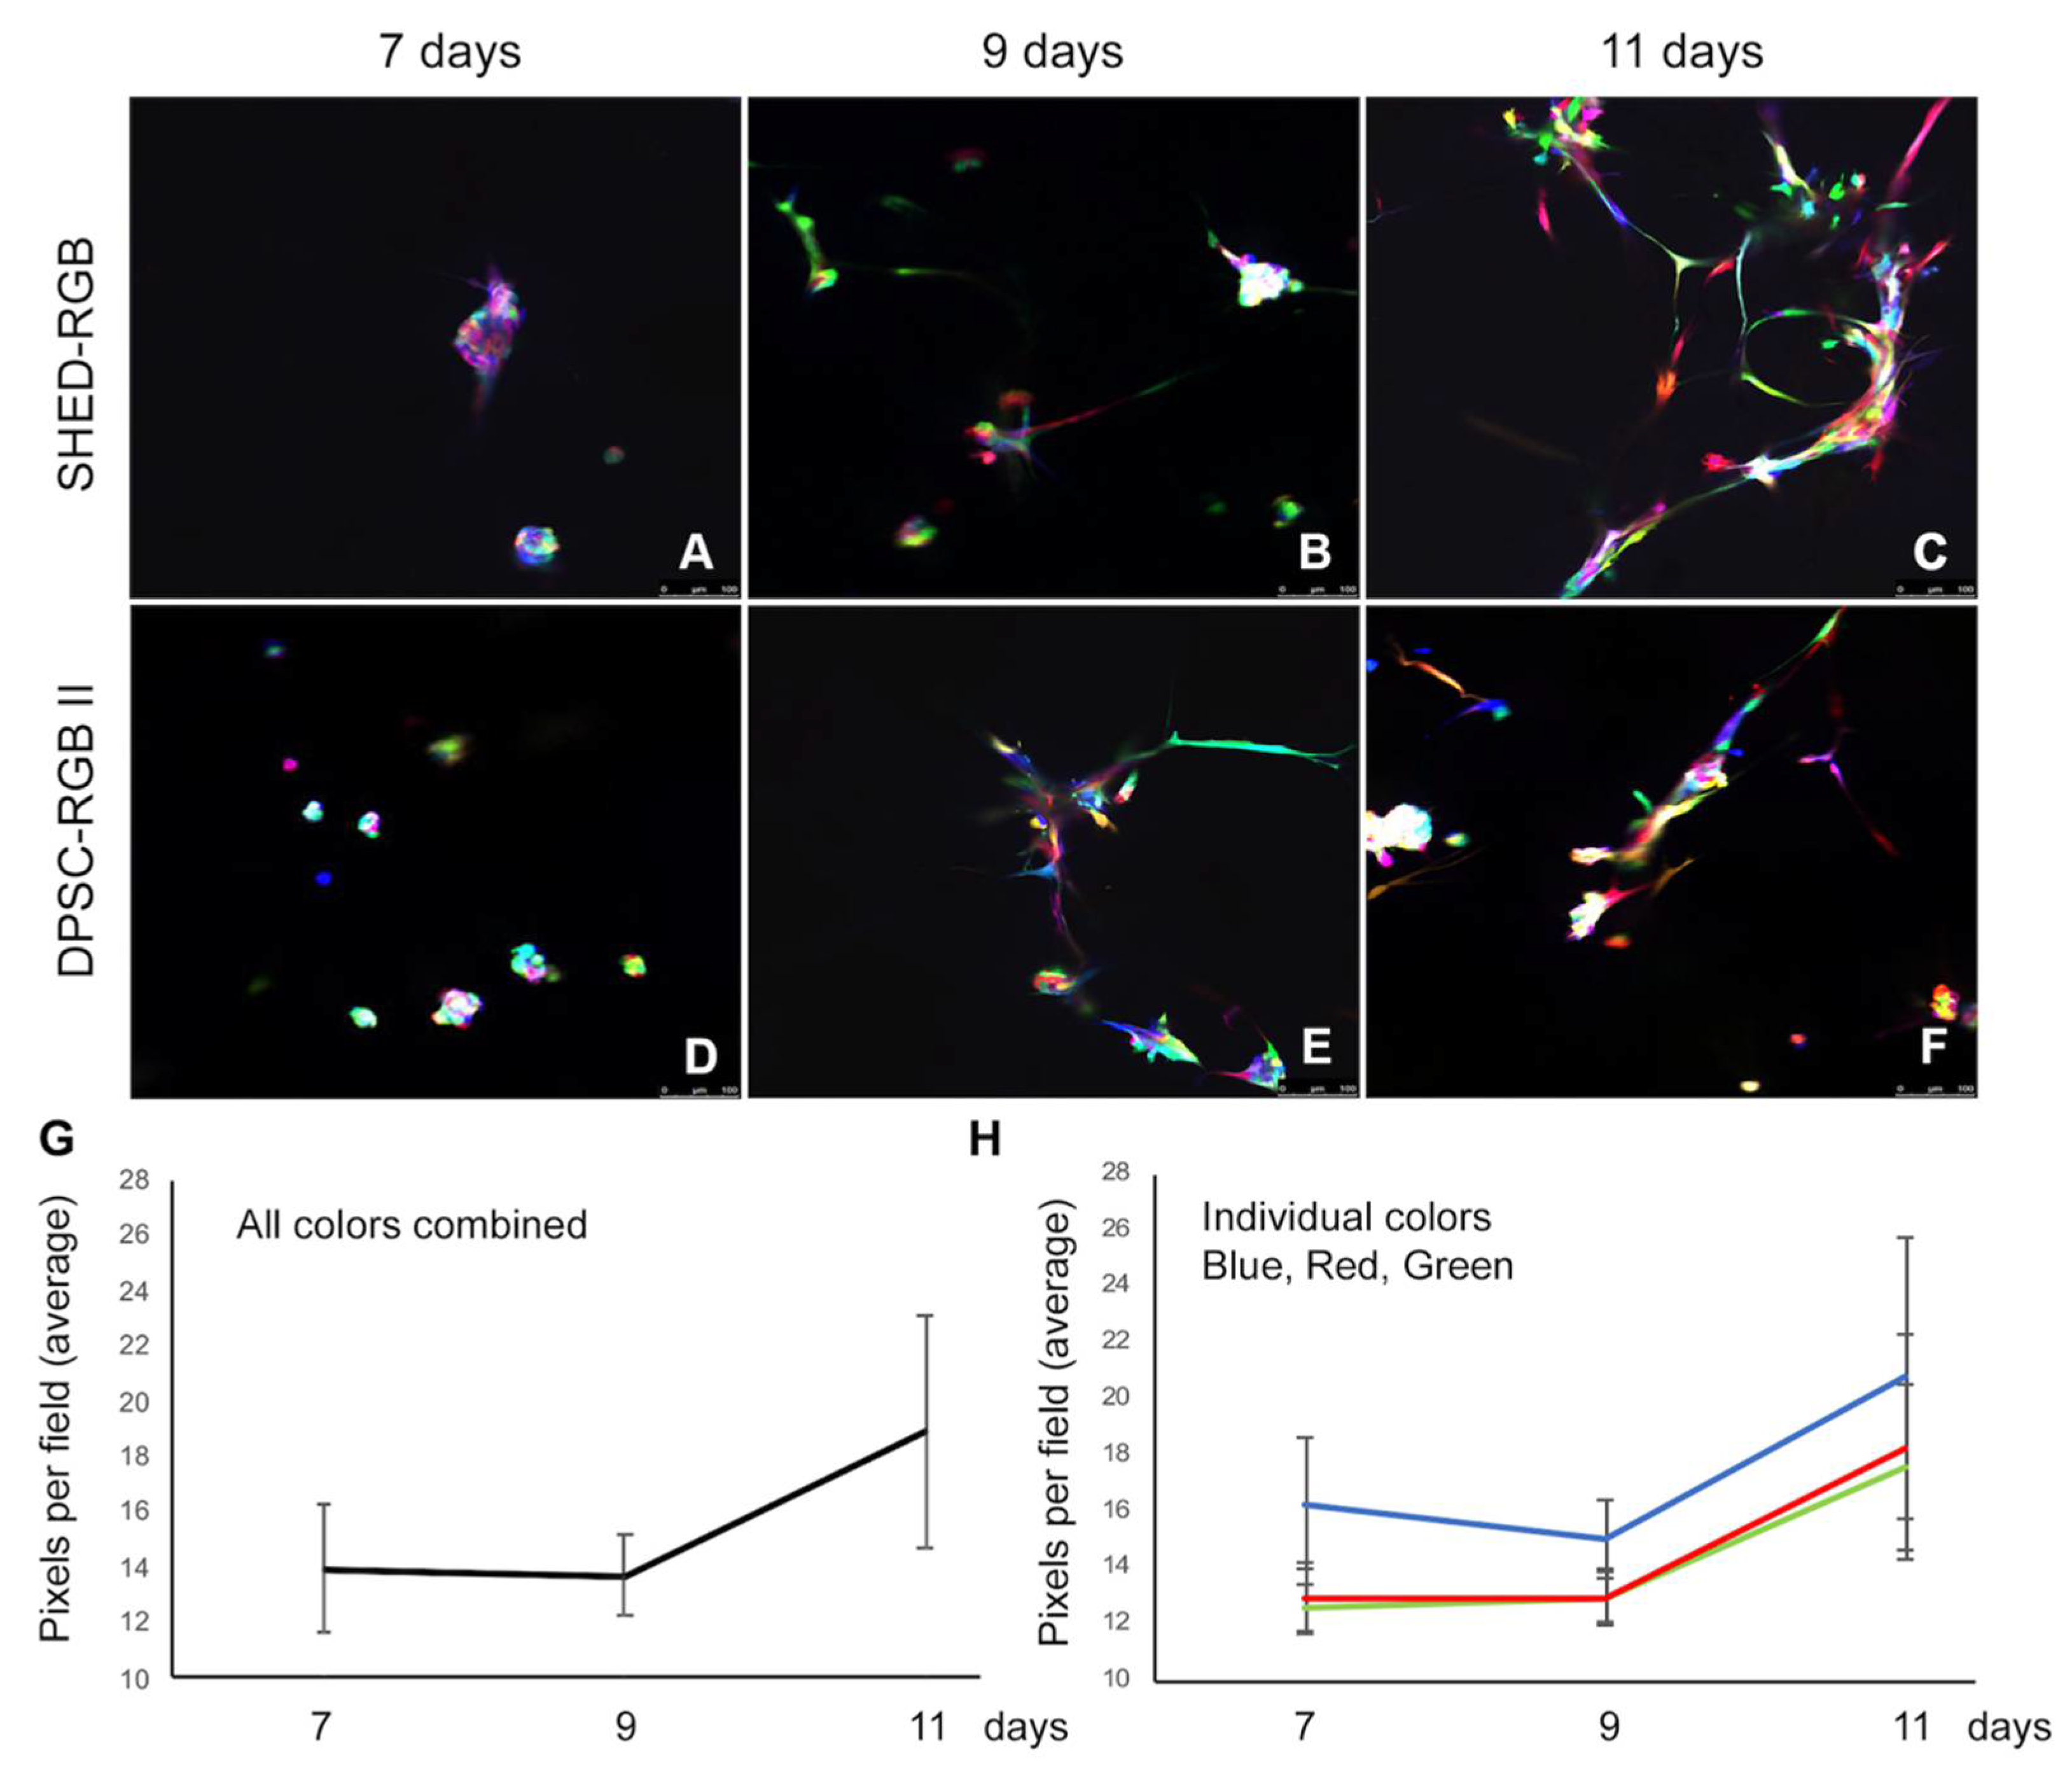
For the statistical analysis of the color pattern pictures taken of sprouts fixed at 7–11 days were used. Thirty images were used for each experimental time. This number was established by power calculation (data not shown). The images were taken in the Leica SP5 inverted confocal microscope (Leica microsystems, Wentzler, Germany) with the same settings for all the images, only the focus was adjusted. Each image was subsequently opened in Fiji (public domain Java image processing program; NIH, Bethesda, MD, USA) and the colors were separated as red, green and blue greyscale pixel channels. The pixels per area of each channel was read separately and a number that designated the mean intensity of that specific channel was calculated by the software. The mean intensity is the grey scale value in that area divided by the total number of pixels. The areas of all images were the same, thus, the number of pixels of each channel was the only changeable variable. For the analysis of how colors changed over time (7, 9 and 11 days) univariate Anova followed by Tuckey test analysis was used. Pearson’s correlation tests were used to compare each color to the others, at the specific time points. SPSS (IBM—Armonk, NY, USA) was used for statistical analysis.
Imaging for movies created from Z-stack reconstructions of fixed sprouts at 7–11 days was performed using an inverted Nikon A1 confocal microscope (Nikon Corporation; Tokyo, Japan). The 405 nm, 488 diode and 561 diode lasers were sufficient to excite fluorescence in all three channels (Red, blue and green). Emission filters were fixed according to the microscope specification, as follows: red channel, a filter with 585–620 nm bandpass; green channel, a filter with 535–565 nm bandpass; blue channel, a filter with 465–500 nm bandpass. Each channel was acquired sequentially between lines. Images were recorded in 1024 × 1024-pixel format. The zoom factor varied according to the area analyzed, with the line average set to 4. Pinhole size was set to one airy unit.
Live cell tracking imaging was performed using SHED-RGB cells. Single areas and colors were obtained on time-lapse movies over a period of 2 days and 15 min of images taken every 1 h (49 cycles—from day 7.5 to day 9.5 after platting) and 43 sprouts were analyzed in total. Aligned time-lapse movies were used to manually identify cell gain or loss events, and cells were followed for movement in the sprout. Live imaging was performed using an upright Leica DMI6000 inverted fluorescence microscope (Leica Wentzler, Germany) fitted with Tokai Hit stage top incubator (INU series, D35-200F; Tokai Hit Co; Shizuoka-ken, Japan). An argon lamp fitted with filter cubes was used to excite fluorescence in all three channels (RGB). The filter cubes used were established as following: red channel (N3), a filter cube with 546/12 excitation and 565–620 nm bandpass; green channel (L5), 480/40 excitation and a filter with 505–565 nm bandpass; blue channel (I3), with excitation at 436/20 and a filter with 480/40 nm bandpass. Channels were acquired simultaneously.
2.4. In Vivo Transplantation and Treatment
All animal work was done under an UCUCA approved protocol using SHED-RGB cells. Male C57 SCID (Charles River; Boston, MA, USA) mice aged approximately 6 weeks old were used. The animals were divided into two groups. Group 1 (
n = 6) was euthanized after 1 week of treatment and Group 2 (
n = 6) after 2 weeks. Treatment started 2 weeks after cell’s transplantation plated into PLLA scaffolds and consisted of intra-peritoneal administration of 5 mg/kg Bevacizumab (Avastin; Genentech, San Francisco, CA, USA) every other day. Half of the animals were treated, and the other half were control and received only injections of saline solution. For transplantation, highly porous, poly-L-lactic acid (PLLA) scaffolds were prepared as described [
23], cut into 6 × 6 × 1 mm squares and sterilized in 1 h cycles of ethanol 100% and 70%. For in vivo transplantation, 1 × 10
6 cells resuspended in 10 µL of cell medium and 10 µL of Matrigel (BD Biosciences; Franklyn Lakes, NJ, USA) were seeded in each PLLA scaffold. After 30 min, scaffolds were transplanted into the subcutaneous space of the mice. When the experimental time was completed, the mice were euthanized, scaffolds containing cells were retrieved and fixed overnight at room temperature. For each group, two scaffolds were fixed for cryosection analysis and one for H&E staining. Two independent repetitions were done to verify reproducibility of the data. For cryosections, samples were mounted in OCT (Fisher Healthcare; Waltham, MA, USA), sectioned into 15 µm slides and analyzed by confocal microscopy as previously described. Samples were maintained protected from light all time.
4. Discussion
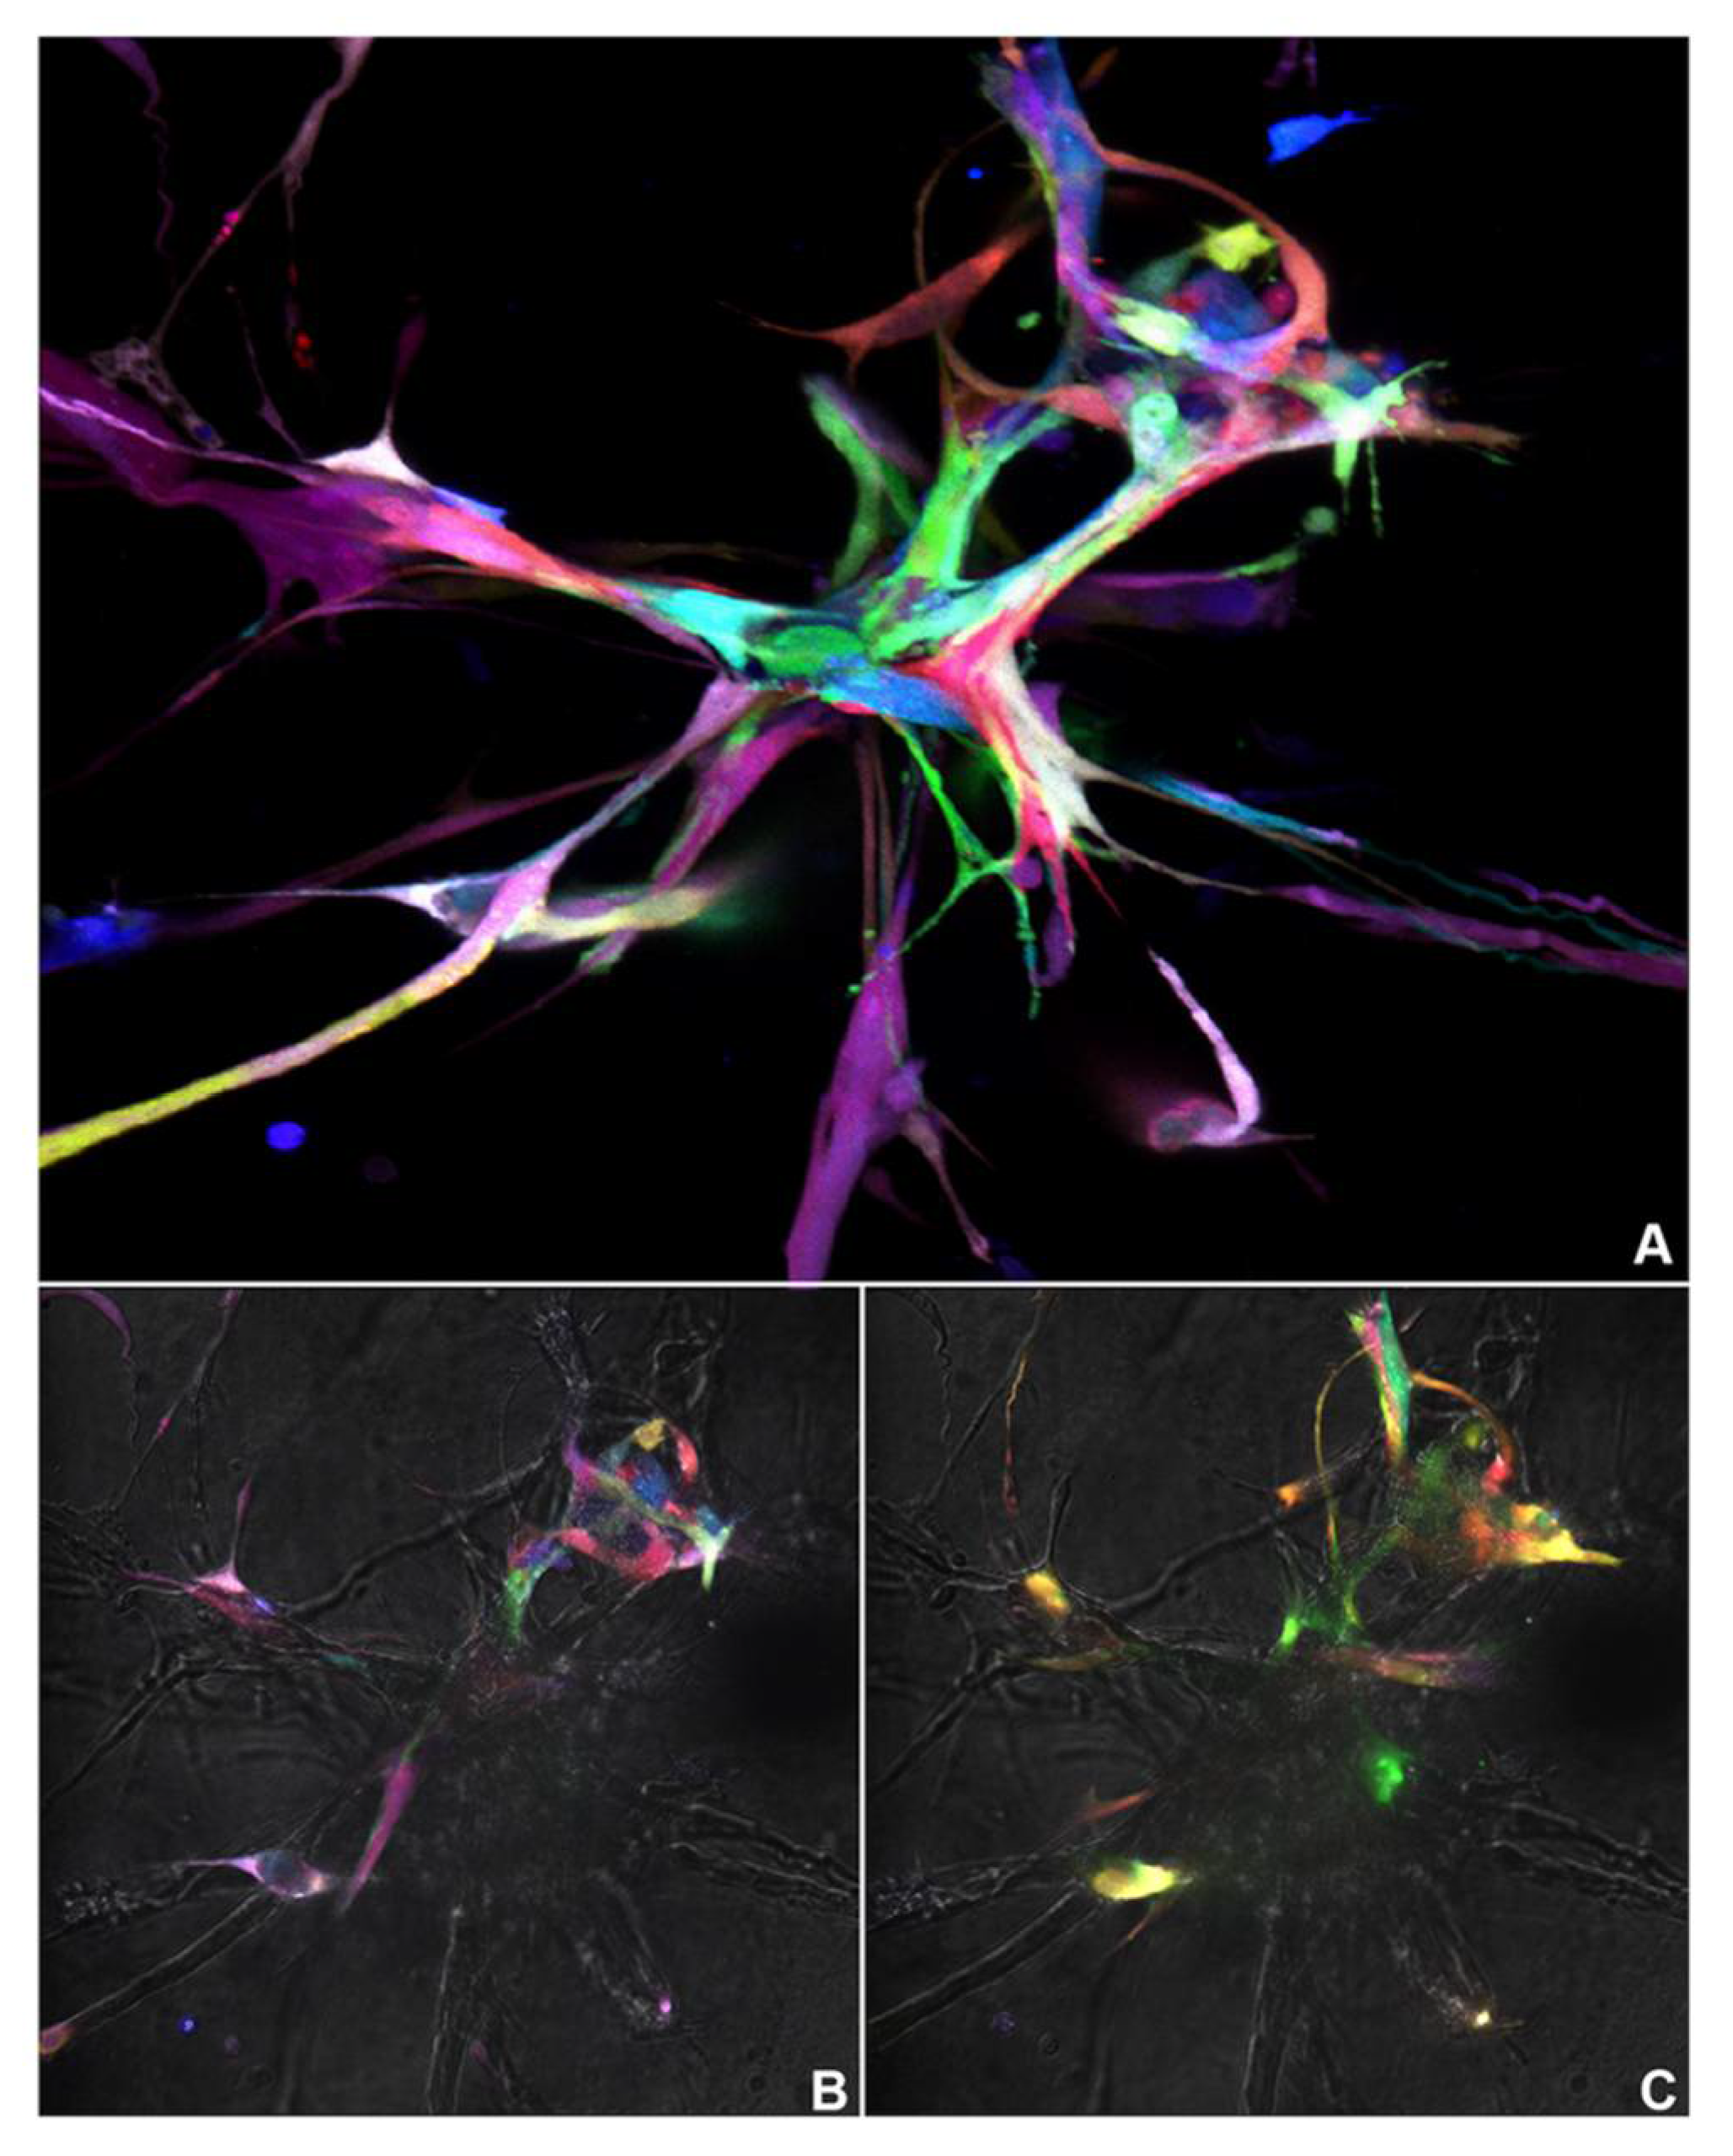
We developed a new effective tool to study the biology of dental pulp stem cells that allowed us to follow multiple individual or groups of cells over time: The Pulpbow. In addition, we used pulpbow populations derived from permanent (DPSC-RGB II) and deciduous teeth (SHED-RGB) to improve our understanding of mechanisms involved in vasculogenic differentiation of dental pulp stem cells in 3 dimensions (3D) over time. These populations were used in multiple experimental conditions and an assorted combination of methods, but always resulted in capillary-like sprouts formed by a wide and relatively random array of colored tagged cells. No experimental condition or method resulted in a single-colored sprout formation. Thus, it is reasonable to suppose that sprout formation mediated by dental pulp stem cells is a multicellular and likely a polyclonal process.
In attempt to further investigate if there was a pattern of color organization, we performed a study in which we focused on the analysis of the blue, red or green color that surprisingly showed blue as a predominant hue. Color perception is complex but blue is usually harder to see than colors of longer wavelengths such as red and green [
24] and blue sensing cones comprise only 10% of the color sensitive cells [
25]. This may explain why visually we could not perceive the higher frequency of blue cells when analyzing our results. In addition, even though blue was more prevalent, it was only one part of the final color that a cell was showing up, making it difficult for our eyes to distinguish only this wavelength. Pearson’s correlation analysis showed that there was statistically significant correlation comparing any two sets of color in any time point of the analysis (7, 9 or 11 days). This may be the result of high transduction efficiency of the lentiviral vectors leading to virtually all cells formed by all three colors.
Capillary sprout assays over time (7, 9 and 11 days) showed that not all cells formed sprouts, demonstrating that at least in the initial phases of dental pulp stem cell-mediated vasculogenesis, some cells or a population of cells is more genotypically and/or phenotypically primed for endothelial cell differentiation. At 7 days, we could find several single cells not involved in sprout formation. These cells were rarer at 9 days and nearly absent at 11 days. Further investigation is necessary to understand the characteristics of the cells that respond earlier compared to the ones that respond later. However, morphologically, it seems that with the persistency of vasculogenic stimuli, many individual dental pulp stem cells are capable to respond to the vasculogenic differentiating stimuli.
Our results also showed that sprout formation mediated by dental pulp stem cells is a continuous process that started with formation clusters of cells (mostly seen at 7 days) that subsequentially formed elongations from the cell clusters (seen at 9 and 11 days). The clusters and elongations eventually increased in size and numbers and showed multiple layers of cells eventually resulting in inter-communicating sprouts (mostly seen at 11 days). As stated, this process took multiple days from cell’s plating day 0 to the first signs of differentiation. In contrast, when we used primary human endothelial cells (HDMEC) as controls, it took less than 24 h to form capillary-like sprouts. We hypothesize that the reason for this delay is that dental pulp stem cells needed to be induced to first differentiate into vasculogenic endothelial cells to form the capillary-like sprouts, while HDMEC cells are already differentiated endothelial cells.
The need for differentiation before function show that these cells are forming sprouts through vasculogenesis (not angiogenesis). In this regard, our data corroborates with Teper and colleagues (2005) that used an ischemic model of angiogenesis to recruit circulating bone marrow endothelial progenitors from the blood to ischemic areas. Cells initially proliferated in clusters. By day 14, these clusters coalesced into vascular cords and became functional vessels by day 21. According to the authors, the sequence of recruitment, proliferation and differentiation of mesenchymal stem cells corresponds to vasculogenesis, is markedly different from the events that characterize angiogenesis, and is similar to the events that happen during inflammatory response [
26].
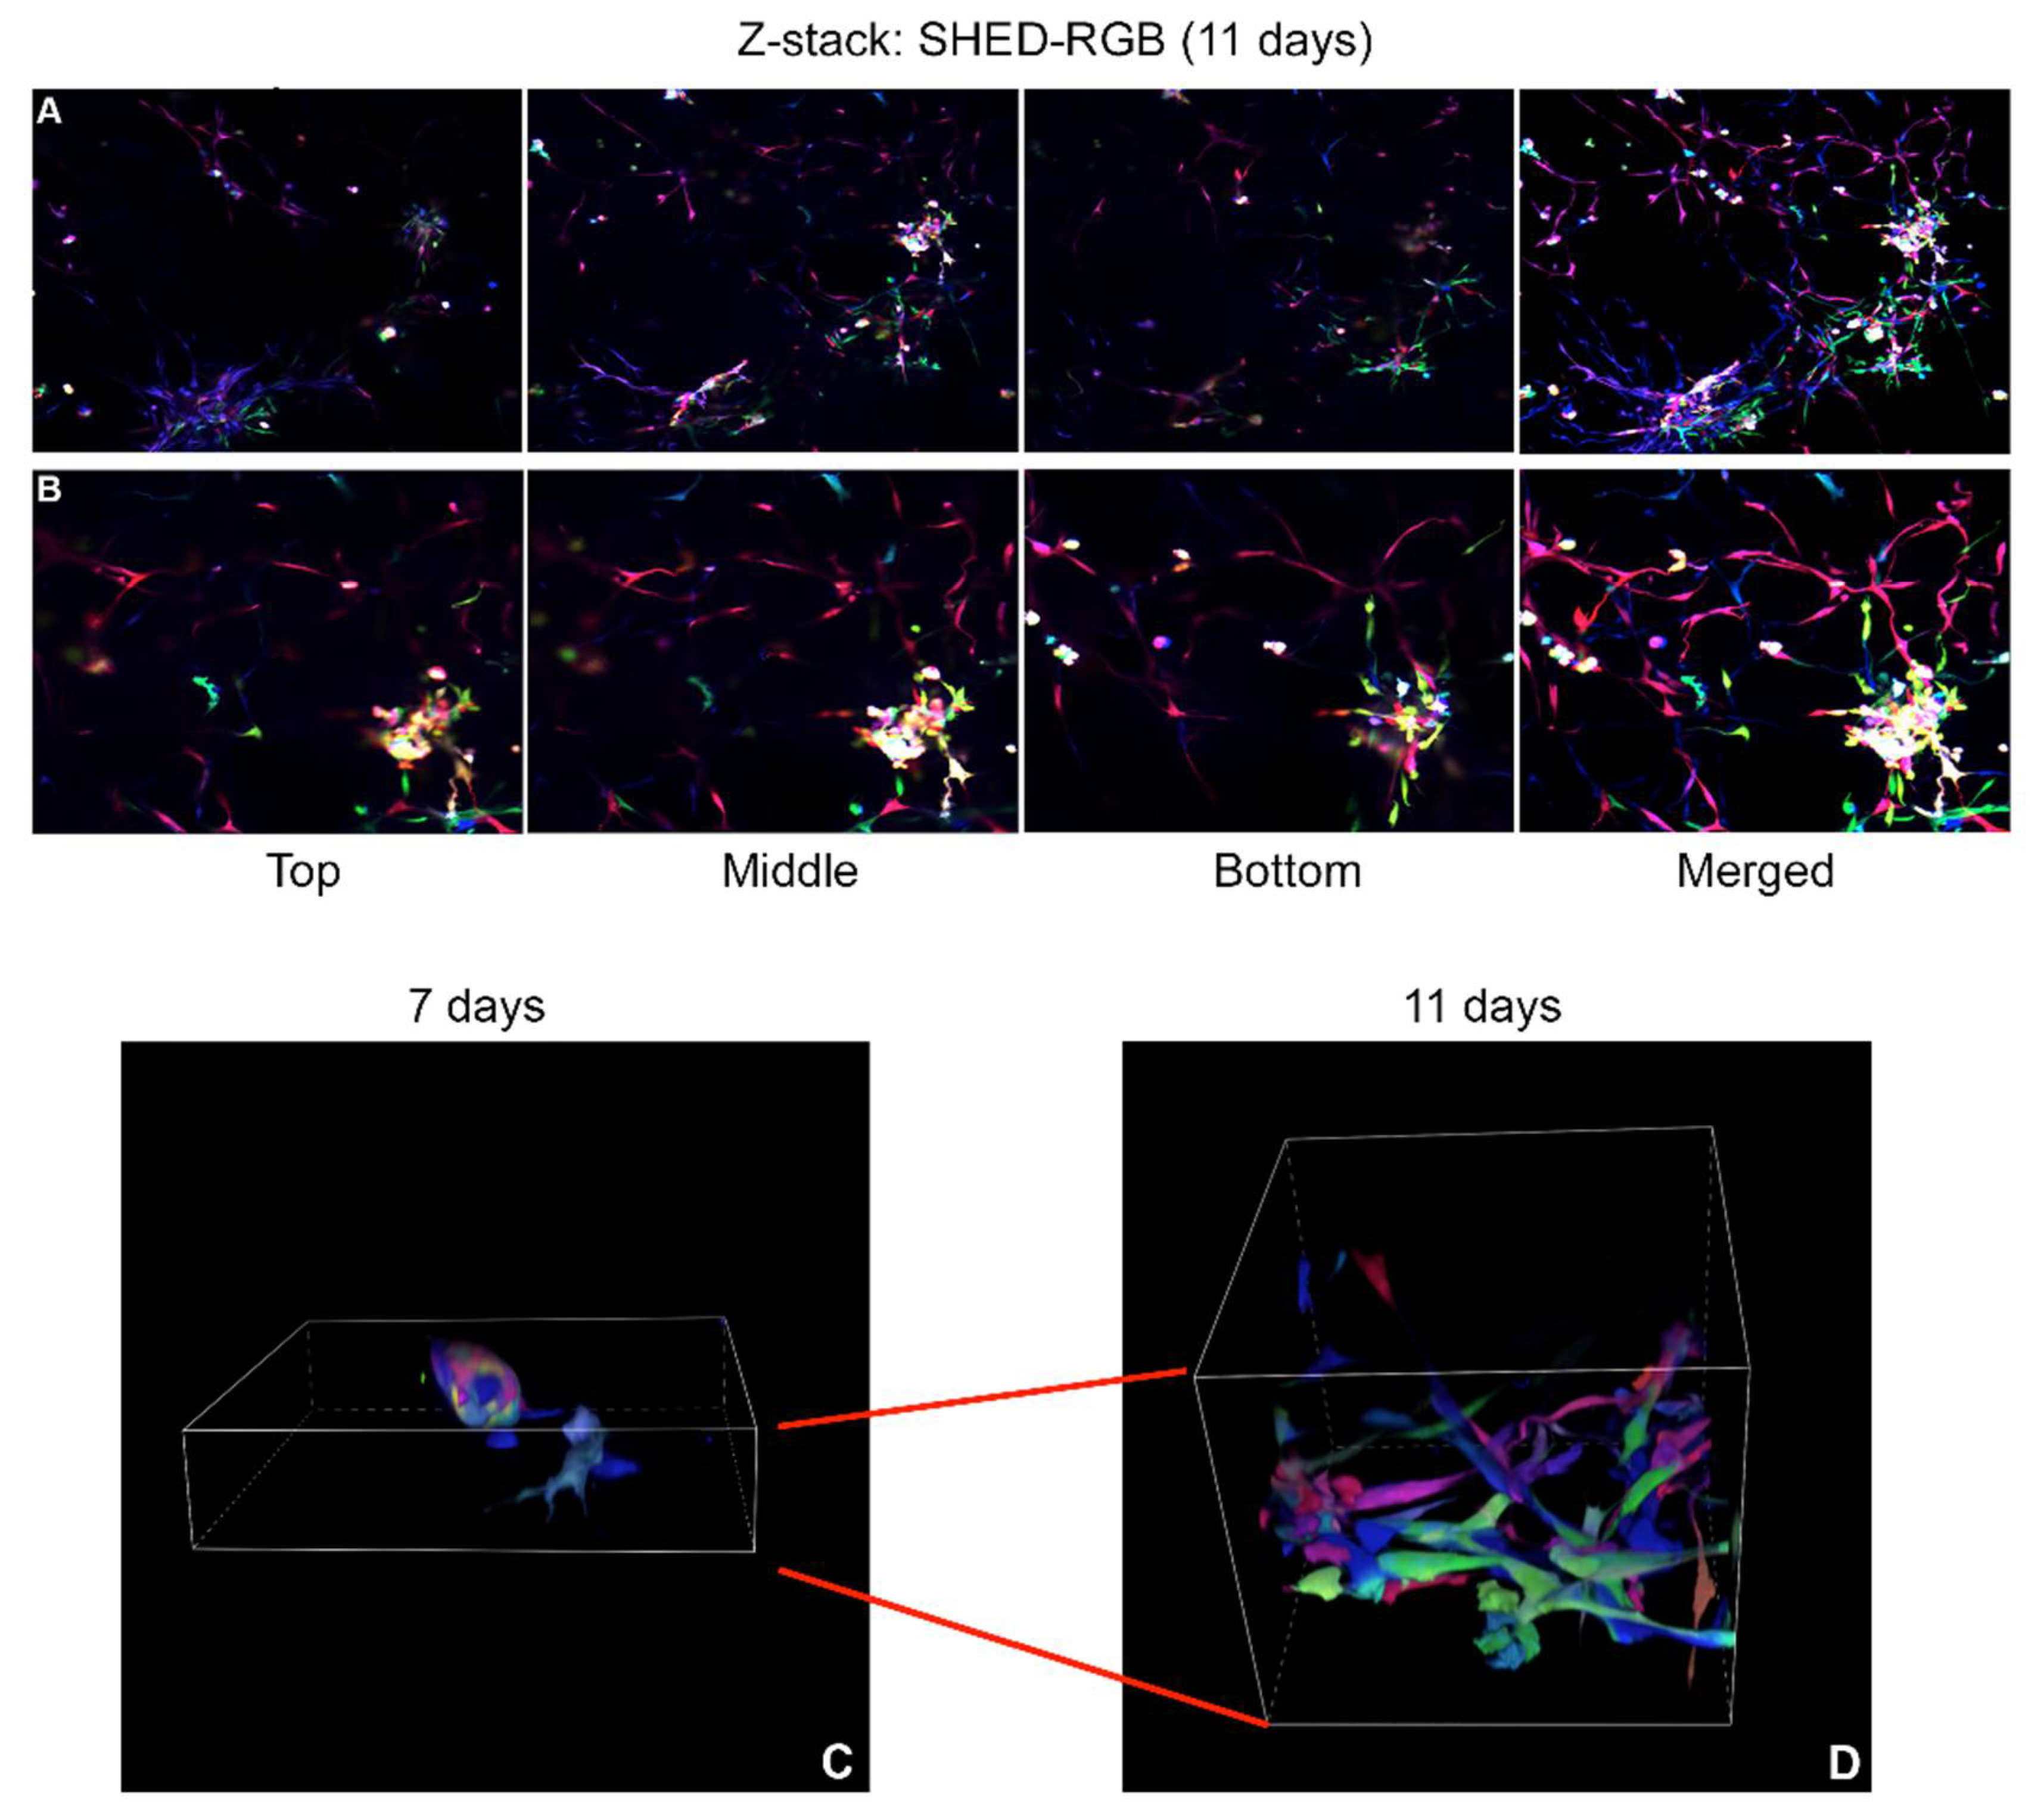
Movies obtained from three-dimensional (3D) z-stack reconstructions of SHED-RGB derived sprouts at 7, 9 and 11 days after the initial induction showed that different cell colors could be found in similar focal planes of the Matrigel pointing out to a pattern of organization by proximity. This result was confirmed by the 3D reconstructions obtained from robust sprout areas fixed at 11 days that showed the organization by proximity but also showed multiple groups of same color cells located in small areas, indicating that the initial organization is followed by a clonal expansion. Time lapse movies following SHED-RGB cells for 2 days (from 7.5 to 9.5 day) showed intense movement of cells in different directions. Even though the movies followed cells for 2 days, in several movies just after a few hours, there were no cells left in the focal plane as they moved away from it. Interestingly, as seen in the movies obtained from 3D (Z-stack) reconstructions from sprouts fixed at 7, 9 and 11 days, the time-lapse movies also showed areas of same-colored cells touching each other or in the same focal plane.
The Pulpbow cells that initially responded by intense migration towards the sprouts seen in our results, might be cells primed to vascular differentiation such as the VEGFR1-positive population described by Bergamo and colleagues [
17]. We hypothesize that once the primed cells undergo vasculogenic differentiation and others might be necessary to continue the blood vessel formation, local clonal proliferation such as seen in our study may respond to the cell demand. Further research is necessary to confirm this hypothesis.
Dental pulp stem cells have been previously associated with pericytes but the extent that pericytes act as MScs has long been a contentious issue. Previous in vitro and in vivo studies have shown that dental pulp stem cells often express protein markers shared by pericytes [
1,
2]. This makes sense from an evolutionary perspective since the location of stem cells in proximity to blood vessels can facilitate migration and response to injury. However, when genetic labeling and lineage tracing strategies were used to investigate pericytes as MSCs, a dual origin (one pericyte and other non-pericyte) was found in dental tissues [
27]. Endothelial cells and pericytes are closely associated. DPSCs treated with TGF-β1 can differentiate into functional pericyte-like cells after induction and vessels formed by these cells maintain stability through Ang1/Tie2 and VEGF/VEGFR2 signaling [
28]. Culture conditions can also modulate expression of pericyte markers in DPSCs as well as influence their capacity to stabilize sprouts. DPSC cells cultured in standard conditions expressed MSC markers (CD44, CD90, CD105 and CD73) and contained a population of NG2 positive pericytes with low sprouting capacity. When the same cells were cultured in vasculogenic medium, the NG2 population was up-regulated and the sprouting capacity increased [
29]. It is important to note that in our in vitro experiments, cells were cultured in vasculogenic medium and thus, we predict that our sprout-forming population was enriched with pericytes.
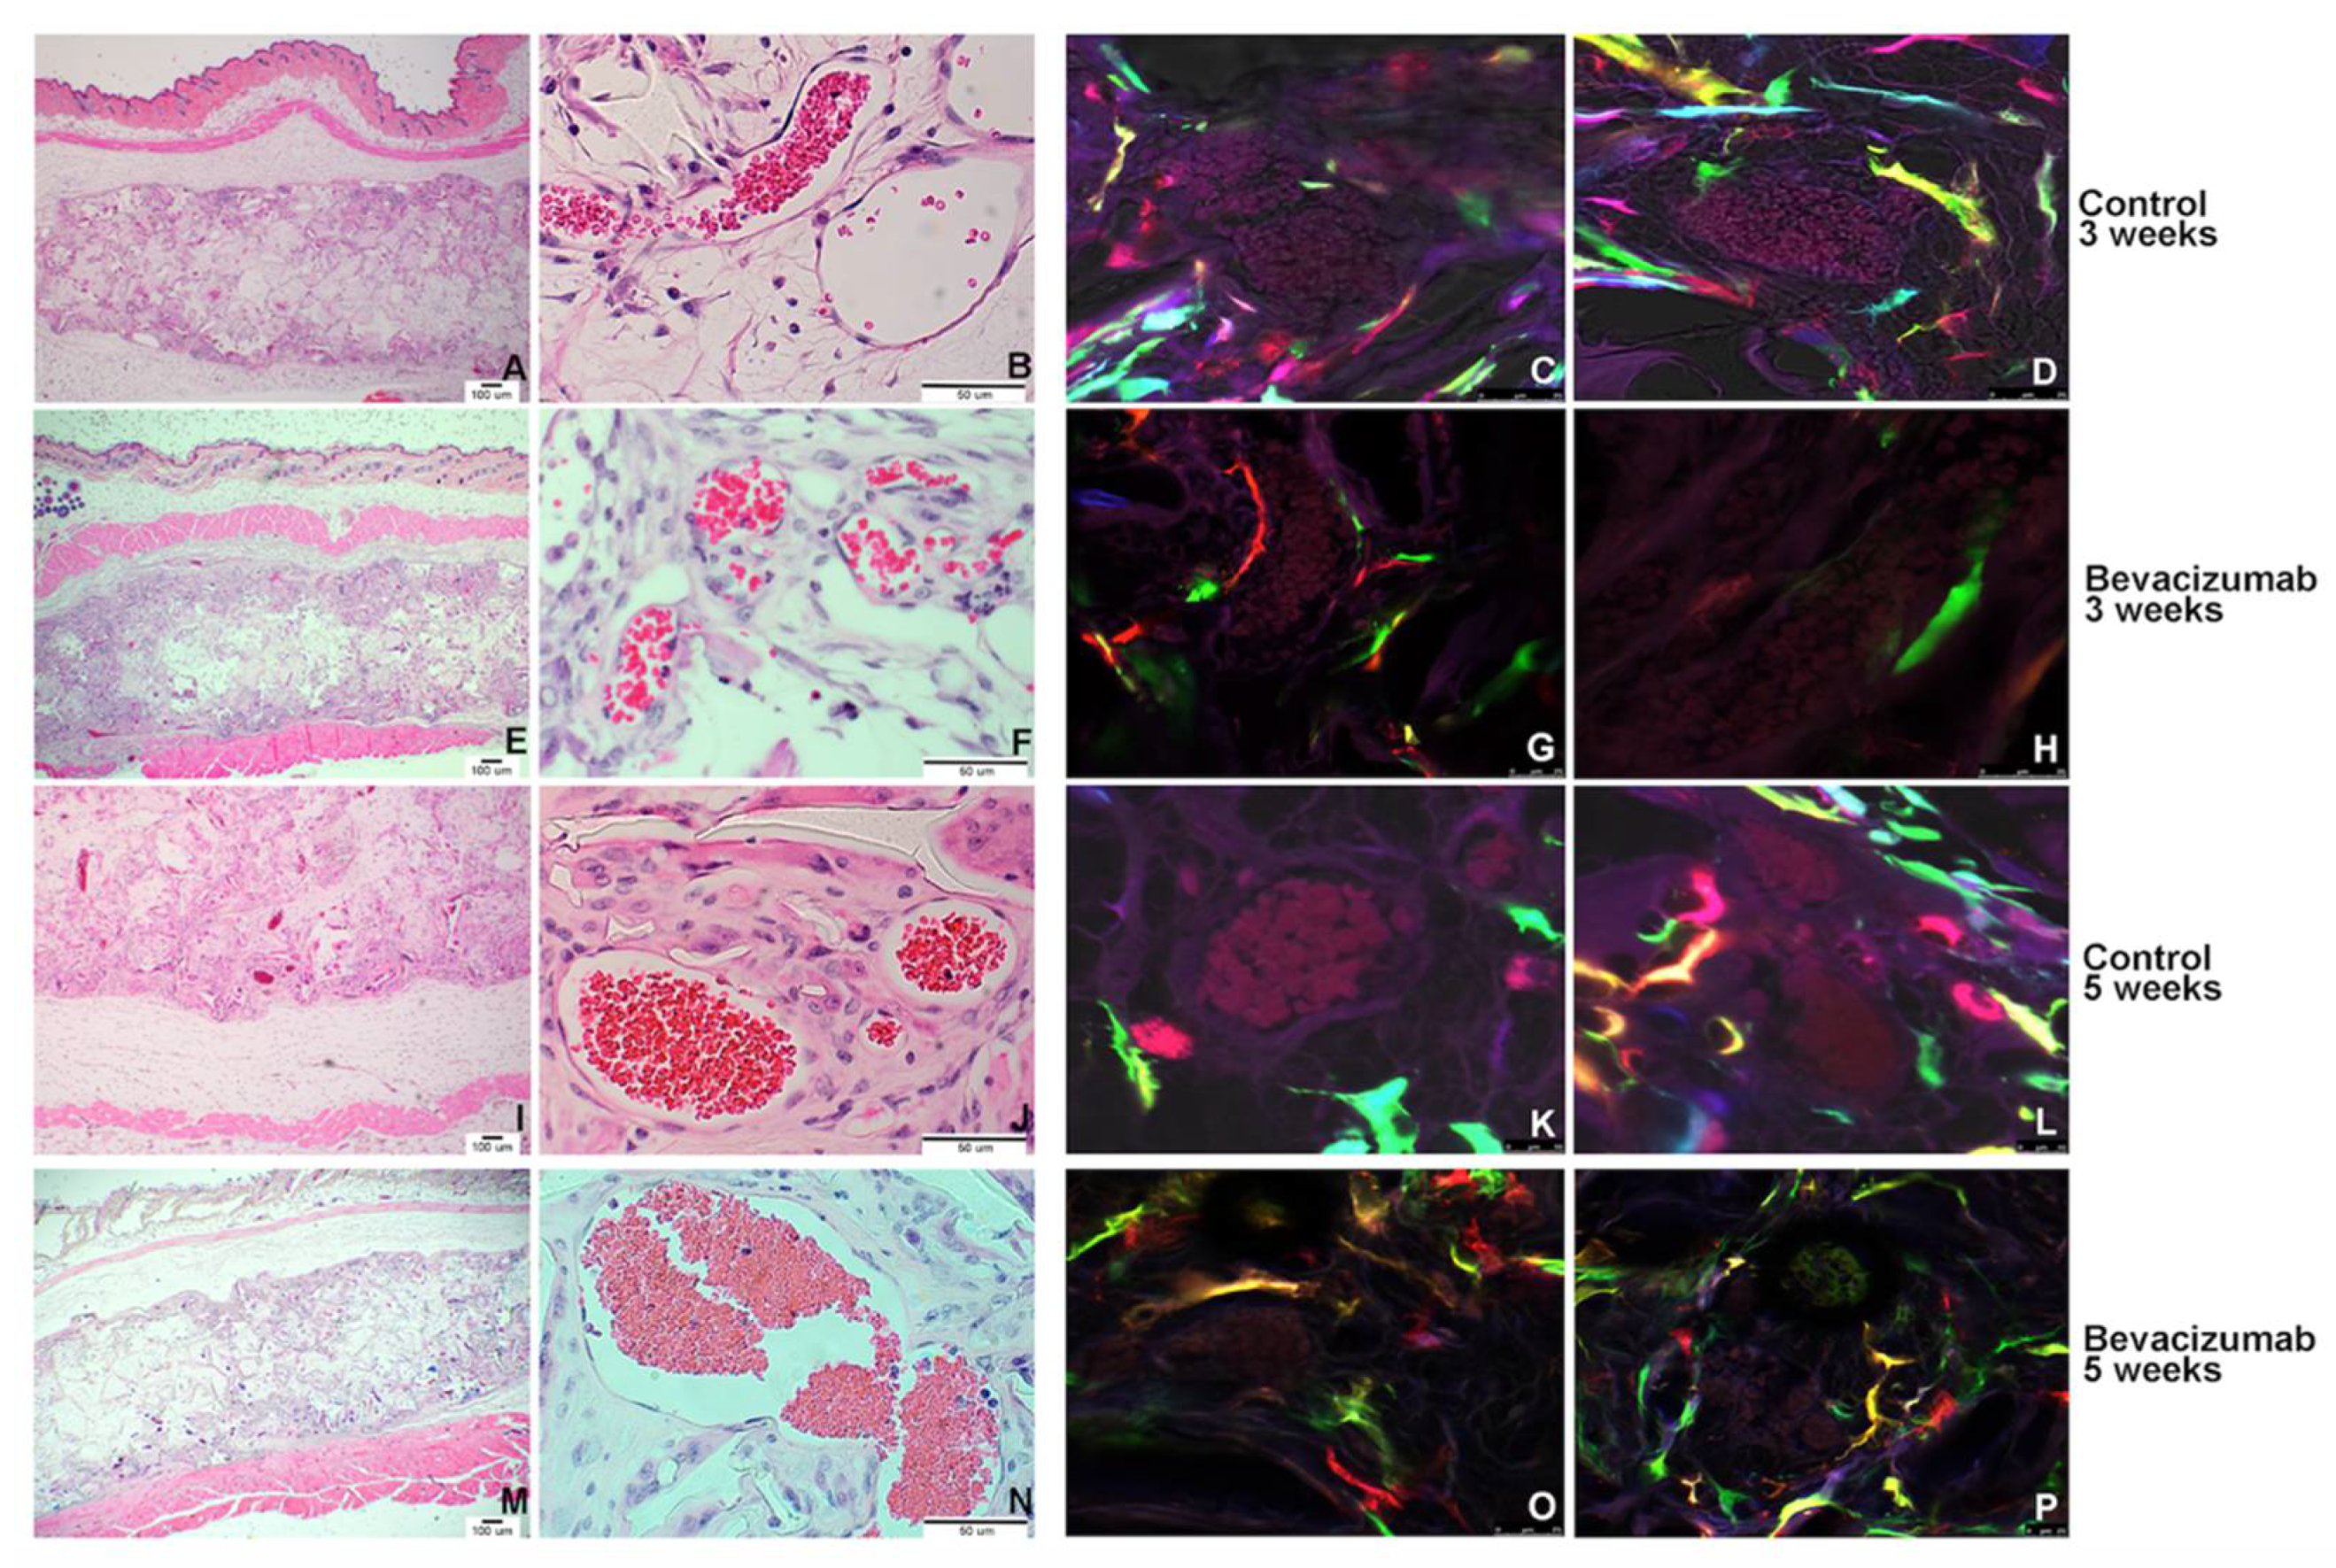
Finally, we used our pulpbow system (SHED-RGB) for in vivo transplantation. Even though our focus was blood vessels, we could see again a wide and random array of colored cells occupying the whole transplanted scaffold. Color-tagged cells could also be found surrounding blood vessels as the first layer of cells assuming an endothelial-like morphology or the second layer of cells with pericyte appearance. In both cases, different cell colors were found even when a VEGF inhibitor (Bevacizumab) was used to block the VEGF signaling pathway. This result once more point out to a “plasticity” capacity as several types of cells could be induced to form blood vessels even in impaired conditions.
Due to the easily accessible nature and high proliferative rates, dental pulp stem cells are excellent sources of multipotent MSCs both for research purposes and future uses in tissue engineering. Mesenchymal stem cells from different origins show similar basic characteristics and behaviors when induced in vitro even though their origins and functions in vivo may be different. Moreover, the circulatory system is unique in the body meaning that blood vessels formed in a tooth or other parts of the body follow the same mechanisms. Consequently, we expect that our results may likely be true in other human tissues and mesenchymal stem cell populations.
As with any new technology, there are limitations to the labeling process since it cannot be fully controlled. Even when cell numbers are controlled before viral transduction, we cannot control the number of viral particles that will enter each cell and the integration sites inside the cell’s DNA. Thus, after transduction with the LeGO vectors, we don’t know the initial number of cells of particular color and if the initial population was formed by equal proportions of hues (colors). The lack of control of how the RGB viruses integrate into the cells may also result in the same progenitors being marked with different colors. In this case, different colored cells would have the same origin and multicolored sprouts could still be monoclonal. Furthermore, when passing the RGB cells, we cannot predict if we are selecting a determined color over the others. To try to minimize all these limitations, before starting this research project, cells were expanded immediately after the transduction to create the same pool of cells for all experiments.
Collectively, dental pulp stem cell-derived vasculogenesis is completed by cells showing a vast array of colors (multicellular process, possibly polyclonal), that start with an initial period of differentiation that takes around 5–7 days until an initial morphological structure (clusters of cells) can be seen. This period is followed by the formation of cell elongations in a phase characterized by intense cell mobility to and from the cell clusters. Further movement is noticed until more robust sprout structures are formed, and individual cells start to proliferate locally showing same-colored cells organized by proximity (local clonal expansion).


 ,
, 