Article

The Effects of Root Aeration and Different Soil Conditioners on the Nutritional Values, Yield, and Water Productivity of Potato in Clay Loam Soil

by
Mohamed E. Abuarab
1,
Mohamed M. El-Mogy
2,*,
Ahmed M. Hassan
1,
Emad A. Abdeldaym
2,
Noha H. Abdelkader
3 and
Mohamed B. I. El-Sawy
4
1
Agricultural Engineering Department, Faculty of Agriculture, Cairo University, PO box 12613 Giza, Egypt
2
Vegetable Crops Department, Faculty of Agriculture, Cairo University, PO box 12613 Giza, Egypt
3
Soil Department, Faculty of Agriculture, Cairo University, PO box 12613 Giza, Egypt
4
Department of Horticulture, Faculty of Agriculture, Kafrelsheikh University, P.O. Box 33516 Kafrelsheikh, Egypt
*
Author to whom correspondence should be addressed.
Agronomy 2019, 9(8), 418; https://doi.org/10.3390/agronomy9080418
Submission received: 1 July 2019 / Revised: 26 July 2019 / Accepted: 27 July 2019 / Published: 30 July 2019
(This article belongs to the Section Water Use and Irrigation)

Abstract

:
A field study was conducted in 2016–2017 and 2017–2018 to evaluate the effects of air injection into an irrigation stream during the subsurface drip irrigation (SDI) process on the nutritional values and productivity of potato grown in clay loam soil. Two irrigation treatments (non-aerated and aerated) and six fertilizer applications (chicken, cow, rabbit, compost, mineral, and chicken + biochar) were compared. In the first growing season, the maximum yield occurred under aerated treatment with cow fertilizer (36.25 ton ha−1), while the minimum yield occurred under non-aerated treatment with chicken fertilizer (24.00 ton ha−1). On the other hand, the maximum and minimum yields in the second growing season were 35.00 and 24.74 ton ha−1 under aerated and non-aerated treatments with cow fertilizer, respectively. Maximum water productivity was achieved under aerated treatment with cow fertilizer (10.04 and 9.13 kg m−3 for the first and second growing seasons, respectively), while minimum water productivity was achieved under the non-aerated treatment with chicken + biochar fertilizer (5.91 and 5.26 kg m−3 for the first and second growing seasons, respectively). Fertilization using aerated treatment yielded the best results and the highest coupling after air injection, compared with the traditional methods of adding soil fertilizer without aeration. The plant growth parameters significantly increased following aeration relative to non-aerated treatments for all fertilizer applications in both growing seasons. Air injection into the soil for potatoes, unsurprisingly, not only benefitted the crop by increasing the soil–air exchange rate but also promoted water infiltration rates and nutrient absorption and reduced drainage water, thus increasing water productivity and reducing the overall irrigation requirements.

1. Introduction

Potato (Solanum tuberosum L.) is the world’s fourth most prevalent agricultural crop after rice, wheat, and maize [1]. The harvested area worldwide was 19.25 million ha with 376.83 million tons of potato produced in 2016 [2]. However, agricultural farming systems that rely on the continual use of heavy equipment lead to soil compaction and poor ventilation, which adversely affects the growth of crops [3].
Air injection at the root zone to increase oxygen availability, and thereby improve soil ventilation, is critical for increasing plant performance in vertisols [4]. Air injection into the soil through a subsurface drip irrigation (SDI) system is an easy and effective way to increase the oxygen ratio in the root zone and reverse the negative effects of hypoxia on plant growth [5,6].
Mineral fertilizers containing nitrogen (N) and phosphorus (P) enhance vegetative growth and photosynthesis, respectively [7,8]. A lack of soil aeration is one of the most important reasons behind the inability of a plant to absorb the important elements of fertilizers, such as N, P, K, Ca, and Mg, and thus results in low productivity [9].
Potato production depends mainly on soil nutrients, which can be enhanced by adding organic fertilizers to the soil. The required percentage of soil organic matter content for potato production is 4%. However, 60% of cultivable lands have an organic matter content of only 1% or less [10].
Soil aeration has an indirect effect on deep percolation reduction. Soil aeration helps to improve the growth and spread of roots, thus increasing the ability of the plant to benefit from the added irrigation water, thus reducing the amount of water lost due to deep percolation, and thus further improving the water productivity of SDI. Bhattarai et al. [11] reported that water productivity over the course of the growing season was significantly higher when aeration was applied, increasing the crop yield by 11% (39.1 vs. 35.2 g L−1) in tomatoes, and by 70% (3.65 vs. 2.15 g L−1) in soybeans. In addition, cotton grown in heavy clay soil was increased by 18% (0.45 vs. 0.38 g L−1). Abuarab et al. [12] found that water productivity for maize in sandy clay loam soil increased by 36% under aerated treatment compared with non-aerated treatment (1.463 vs. 0.937 kg m−3).
Studies of maize, tomato, soybean, and other crops have verified the effectiveness of aerated treatment after irrigation [13,14]. However, most studies have focused on the effects of aeration through SDI on yield and plant growth parameters, and few studies have reported the nutritional values, fertilizers absorption and utilization under organic fertilizers with aerated irrigation.
The major goal of this study was to evaluate the technical feasibility of ambient air injection into a subsurface trickle irrigation tape as a best management practice for improving the growth characteristics, yield, and water productivity of potato.

2. Materials and Methods

2.1. Location and Soil of the Experimental Field Plot

A field study was conducted from 21 October 2016 to 5 March 2017 and from 15 October 2017 to 28 February 2018 at the Research Unit of Faculty of Agriculture, Cairo University, Giza, Egypt (latitude: 30.05 N; longitude: 31.21 E; mean altitude: 70 m above sea level). The field experiment was done under well-drained soil conditions in a deep soil profile. Three samples were taken for each treatment from the beginning, center, and end points of the plot. Soil samples were collected at a depth of 0–60 cm at 20 cm intervals. The samples were collected according to the method described by Klute [15].
The soils were clay loam with 32% sand, 33% silt, and 35% clay. The soil reaction (pH) was measured in 1:2.5 (soil/water) suspension in accordance with Jackson [16]. The soil bulk density and the bulk density of the mixture between soil and organic manures were determined using cylindrical, sharp-edged samples. Each cylinder was pressed gently into the soil to the desired depth to obtain a known volume of undisturbed soil. Samples were oven-dried at 105 °C, and the bulk density was calculated in g cm−3 [17]. The field capacity (θFC) and permanent wilting point (θPWP) were determined by using the pressure membrane method (desorption) at 0.33 and 15 atm, respectively [18] (Table 1).
Organic carbon (OC) was measured in accordance with Walkley and Black, and total nitrogen (N) was determined via the Kjeldahl method [19]. Electrical conductivity (EC) was determined in a 1:2.5 soil:water extract [20]. Available phosphorus (P) was extracted with a 0.50 M HCO3 solution in accordance with Olsen et al. [21]. Available micronutrients (Fe and Mn) were extracted according to the Lindsay and Norvell [22] method and determined using atomic absorption spectrophotometry (Unicam 767, Amsterdam, Netherland).
On average, the chemical soil properties were as follows: organic N, 15.34 mg kg−1; N, 35.72 mg kg−1; P, 53.17 mg kg−1; high available potassium (K), 494.63 mg kg−1; pH: 7.81 (Table 2). Irrigation water was obtained from a deep well (60 m from the soil surface) located in the experimental area with a pH of 7.2 and an average electrical conductivity of 0.83 dS m−1.

2.2. Weather Conditions

The field experiment location was characterized by an arid climate with a cool winter and humid summer. The following climatic variables were recorded daily during both growing seasons: the maximum air temperature, minimum air temperature, average air temperature, relative air humidity, and number of sunshine hours. During the growing season (from October to March), the maximum air temperature ranged from 19 to 30 °C in 2016–2017 and from 18 to 29 °C in 2017–2018, while the minimum air temperature ranged from 6 to 16 °C and from 8 to 17 °C in the first and second growing seasons, respectively. The total rainfall in each year was negligible (<20 mm) (Table 3). Therefore, soil water availability was mainly determined by the irrigation process.

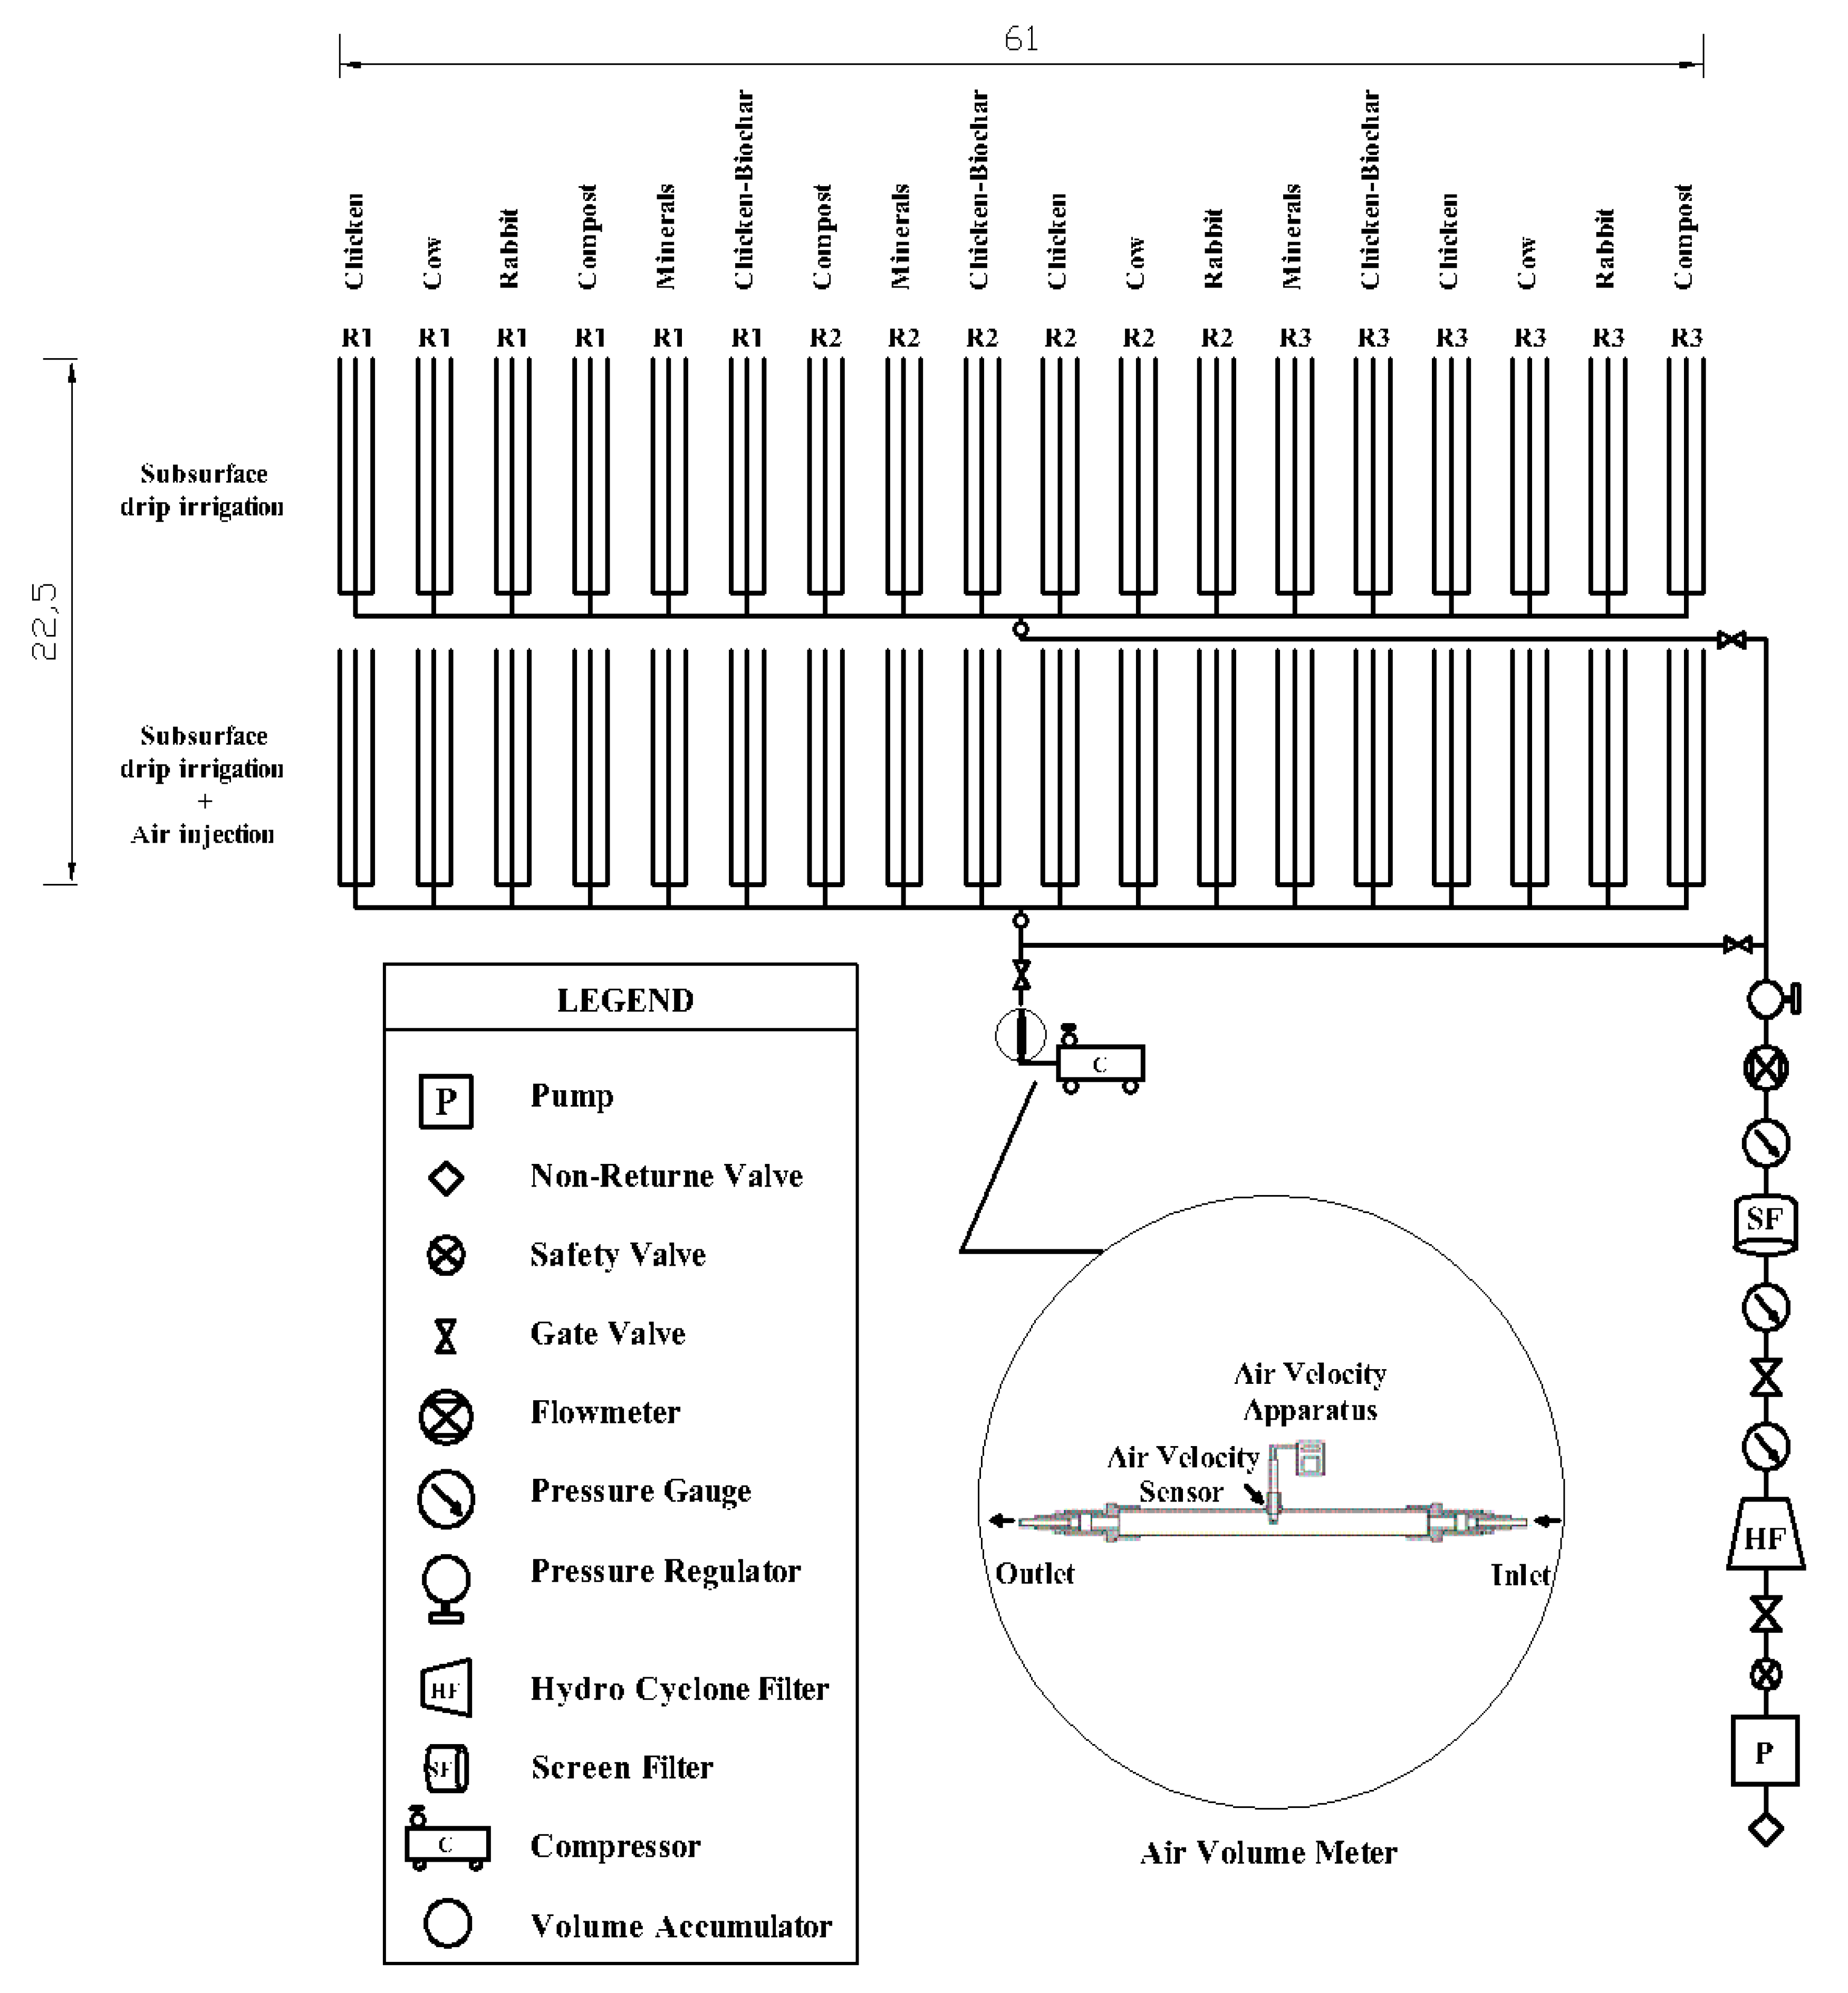
2.3. System Installation and Experimental Treatments

A field plot of 61 × 22.5 m was selected for the experimental studies. The field plot was divided into 36 equal plots of 1.5 × 10 m. Each plot included three rows 0.75 cm apart and represented a single treatment. The experiment was laid out following a randomized plot design with two irrigation treatments: non-aerated treatment (applying only water through SDI) and aerated treatment (applying air injection under SDI) and six fertilizer applications (chicken, cow, rabbit, compost, mineral, and chicken + biochar). Each treatment condition was repeated in triplicate (R1, R2, and R3; Figure 1). Installation of the SDI system commenced in October 2016 in a controlled facility, which included a hydro cyclone filter, a screen filter, backflush mechanisms, and a fertilizer injection system, i.e., the Venturi effect. Trickle tape was carefully placed straight in the ridges, and the tape strips had openings on their upper sides.
Potato tubers (var. Diamont) were sown at a depth of 10 cm in the raised ridges prepared in the third week of October at a tuber and ridge spacing of 20 × 75 cm. The base width and height of the ridges were kept at 60 and 30 cm, respectively.
When the subsurface drip lateral lines were laid at a depth of 5 cm from the soil surface, the chimney effect emerged, where air moved up and away from the root propagation area. This led to the air injection in the soil becoming ineffective. On the other hand, deeper laying of lateral lines has proved to be effective. Specifically, Goorahoo et al. [23] and Heuberger et al. [24] reported that benefits were achieved when air was injected with buried lateral lines at depths ranging from 12 to 15 cm, while Bhattarai et al. [25] found that the benefits of air injection were fully obtained with lateral lines depths of 0 to 25–30 cm. In accordance with the above findings, in the current study, lateral lines were laid at a depth of 20 cm to maximize the benefits that can be obtained from soil aeration. As a result, aerated treatment, compared with non-aerated treatment, showed higher maximum yields and higher vegetative parameters.
One-millimeter-thick trickle tubes (Toro DL2000™ Series Subsurface Dripline, Anaheim, CA, USA) were buried manually at a depth of 20 cm in the middle of the ridges formed for the sowing of potato under different treatments. The installed trickle system had drippers spaced 30 cm apart, each with an application rate of 3.8 lph/dripper. Two 50 mm gated valves were installed for aerated and non-aerated treatments, and 36 ball valves (16 mm) were installed for fertilizer applications to control the amount of irrigation water applied for each plot.
Time domain reflectometry (three-pin borehole probe + adapter, Eijkelkamp Agri-research Equipment, Netherland) was used for the determination of soil water content. Three access tubes, one at the middle of the ridge and two at 15.0 and 30.0 cm away from the middle of the ridge, were installed. Access tubes were placed at the middle of the row up to a depth of 0.60 m, and the water content (volumetric) was measured in all treatments. The soil moisture content of the root zone was calculated for each treatment based on the difference between the field capacity and measured soil moisture content. For the whole growing season, the irrigation depth was found to replenish 100% of the available plant water in the root zone.

2.4. Nutrient Management

Mineral treatment consisted of 180 kg ha−1 nitrogen, 100 kg ha−1 phosphorus pentoxide, and 150 kg ha−1 potassium oxide. The potassium was applied at two time points (half at planting and half at ridging). This practice yields better results than if entire doses were applied at planting [26]. Following this recommended practice of fertilizer application; nitrogen (N) was applied in two split doses (one-third at planting and two-thirds at the crop emergence stage). The amount of organic manure used was 10 ton ha−1 for chicken manure, 15 ton ha−1 for cow manure, 10 ton ha−1 for rabbit manure, 20 ton ha−1 for compost, and 10 and 1 ton ha−1 for chicken manure + biochar, respectively. Fertilizers were added and mixed uniformly with the soil for all treatments (Table 4).

2.5. Air Injection

An air compressor and an air volume meter, installed in the sub-main line, which leads directly to the SDI lines after the gate valve, were used to inject the air into the soil. The air volume meter consisted of a 1 m long tube used to convert a turbulent flow to a laminar flow. The air speed sensor was installed at the center of the tube, where it was used to measure the average air velocity (Figure 1). In this way, it was possible to control the amount of air injected into the irrigation line (12% of the air in terms of water volume). Aerated water was added through the drippers buried beneath the surface of the soil. The water flow was decreased when the air was injected, and the irrigation time was then increased to compensate for the decrement in water.

2.6. Data Recording

On the final harvest day, 12 March (102 days after planting), 18 plants were harvested from each plot, taking six plants from the beginning, middle, and end points of the plot, respectively, for yield mass determination. The total fresh weight of the tubers (kg per plant) was determined, and the tubers were dried at 75 °C for 24 h to determine the carbohydrate and sugar contents, both soluble and non-soluble. Sixty-five days after sowing, five plants per plot were randomly harvested for the determination of shoot fresh weight (g), dry shoot weight, number of branches, plant height, leaf area, fresh root weight, and dry root weight (g). The water productivity (kg m−3) is generally defined as grain yield per cubic meter of irrigation water applied, and it was computed using Equation (1), as given by Bhushan et al. [27]:
Water   productivity   ( kg   m 3 ) = Grain   Yield   ( kg   ha 1 ) Irrigation   Water   Applied   ( m 3 ha 1 )

2.7. Statistical Analyses

Analysis of all data was carried out using a split block design, where the vertical block was the irrigation factor (aerated and non-aerated), the horizontal block was the fertilizer factor (mineral, chicken, cow, rabbit, compost, and chicken + biochar), and the replications were the error terms. Experimental data are expressed as the mean ± standard error (SD) of three replicates. SPSS 19.0 software [28] was applied to compare the treatment means by the least significant difference (LSD) test, as given by Snedecor and Cochran [29], with significance defined as p < 0.05.

3. Results and Discussion

3.1. Soil Physical Characteristics

Table 5 shows a significant increase in field capacity and wilting point for all organic manure treatments compared with the mineral fertilizer treatment in both seasons under non-aerated and aerated treatments. The highest soil moisture content at field capacity and wilting point was observed with the chicken manure + biochar and rabbit manure treatments. On the other hand, for aerated treatments, there was an increment in the ratio of the field capacity to wilting point for all organic manure treatments. The decrement occurred because the use of organic manures improved soil porosity, which allowed the movement of water, thus increasing the soil moisture content. However, the addition of organic manure improved the soil’s physical properties due to a decrease in the bulk density and an increase in the hydraulic conductivity (H.C) for both seasons (Table 5). The bulk densities were lower under aerated treatments than under non-aerated treatments for all organic manures. The declining percentages of bulk densities as an average for both growing seasons were 1.545%, 4.32%, 5.08%, 3.18%, 1.18% and 2.04% for minerals, chicken, cow, rabbit, compost, and chicken + biochar treatments, respectively.
The use of soil amendments improves soil structure and increases air porosity. Amendments are aimed at ameliorating the effects of compaction, salinity, and sodicity through an increase in porosity and, therefore, in soil aeration. In heavy and compacted soils, where roots require greater amounts of energy to elongate, the oxygen requirement for root growth is high [30]. This exacerbates the negative impact of the inherently low soil oxygen content in such compacted soils. Irrespective of soil type, soil amendment by incorporating materials such as peat moss, bark, vermiculite, compost, organic mulch, rocks, and perlite increases the porosity in the soil and improves aeration status. Appropriately, SDI irrigated soil allows greater oxygen diffusion into the rhizosphere.
Hypoxic conditions inhibit root transport of nutrients, ions. Decreased permeability and growth of roots under hypoxia [31,32] constrain the capacity of root systems to meet the mineral and water requirements of the shoot [32]. Anoxia-induced reduction of root hydraulic conductivity is related to the occlusion of xylem vessels and restricted axial water movement through roots [33].

3.2. Effect of Irrigation with Organic Fertlizer on Yield

The characteristics of water use and yield demonstrated a nonsignificant contrast between both growing seasons, 2016–2017 and 2017–2018. However, there was a noteworthy contrast between aerated and non-aerated irrigation for all fertilizer applications (Table 6).
For the first growing season, the highest water consumption was detected under non-aerated treatment with chicken manure + biochar (4681.11 m3 ha−1), while the lowest irrigation water consumption was registered under aerated treatment with chicken manure (3462.84 m3 ha−1). On the other hand, for the second growing season, the highest and lowest irrigation water consumption levels (5032.20 and 3674.08 m3 ha−1, respectively) were detected under the same treatment. In both growing seasons, the aerated treatment used less water than the non-aerated treatment, which involved daily irrigation, since core aeration not only benefits the crop by increasing air exchange but also enhances water infiltration, thereby increasing water productivity and reducing total irrigation requirements [34].
The amount of irrigation water applied for the aerated treatment was lower compared with the non-aerated treatment in both growing seasons and for all organic manures. The decreasing percentages of applied irrigation water for the aerated treatment compared with the non-aerated treatment for the first growing season were 6.59%, 7.95%, 7.65%, 6.9%, 8.1%, and 7.51% for chicken, cow, rabbit, compost, mineral, and chicken + biochar treatments, respectively. For the second growing season, the decreasing percentages were 7.59%, 8.9%, 8.6%, 7.85%, 9%, and 8.45% for chicken, cow, rabbit, compost, mineral, and chicken + biochar treatments, respectively (Table 6).
On the other hand, for the first growing season, the yields were higher following aerated treatment than following non-aerated treatment by 43.5%, 48.9%, 32.8%, 31%, 7.81%, and 22.4% for chicken, cow, rabbit, compost, and chicken + biochar fertilizers, respectively. For the second season, yields were higher by 31.6%, 41.47%, 12.77%, 37.15%, 8.05%, and 9.0% for chicken, cow, rabbit, compost, mineral, and chicken + biochar treatments, respectively. Depending on the wholesale price of potato, the percentage increases observed in this study could translate into a projected increase in benefit per hectare for the farmer (Table 6).
For the first growing season, water productivity was 53.6%, 61.7%, 40.8%, 40.7%, 17.3%, and 32.2% greater under aerated treatments for chicken, cow, rabbit, compost, mineral, and chicken + biochar, respectively, compared with non-aerated treatment. In the second growing season, it was greater by 42.3%, 55.3%, 23.0%, 48.3%, 18.8%, and 19.0% under aerated treatments for chicken, cow, rabbit, compost, mineral, and chicken + biochar treatments, respectively, compared with non-aerated treatments (Table 6).
The application of irrigation water depends mainly on soil physical characteristics, which differ according to the type of organic manure used. Treatments vary in the extent to which they increase the soil water holding capacity and affect the soil moisture content at wilting point and field capacity and thus the irrigation water applied. The reference line for applied irrigation water is the field capacity, which represents 100% of the available plant water in the root zone.
The reduction of crop water consumption under aerated treatments compared with non-aerated treatments is related to that of SDI; the root zone is concentrated into a smaller volume, hence if hypoxia persists in the rhizosphere, it sharply arrests the uptake of water and nutrients, even if these inputs are in ready supply. The permeability of the root to water and ions under hypoxic conditions is restricted due to impediments to root respiration, as it is under waterlogging, high CO2, and low O2 [9]. Poor root aeration affects the absorption of water by plant roots [35] and oxygen deficiency causes decreased root permeability, particularly in intolerant species [36]. Such an apparent decrease in permeability in response to hypoxia can be interpreted in two ways: as a change in the ability of a membrane to allow the passage of water, or as a reduction in the driving force acting across the membrane. It is likely that both are important, but the relative contribution of each is yet to be determined [37].
An increase in productivity of any crop depends on the availability of suitable conditions for growth in the soil, where oxygen is the most important element for root respiration and the performance of metabolic processes. In the case of saturation, water replaces air in the soil, disrupting the existing balance between water and air in the spaces between grains of soil. This decreases root respiration, which is reflected by a lack of productivity since the plant stops growing and the transport of metabolites, such as carbon dioxide and ethylene, is inhibited (although ethylene inhibits growth). When air is injected into the soil through the SDI laterals in the root propagation area, it moves carbon dioxide and ethylene away from the root propagation area, which is beneficial for improving the growth environment and increasing productivity [38].
Water productivity was improved by injecting air into the soil. A lack of oxygen in the soil limits the growth of the roots, which is reflected in the cycle of the root’s total weakness and the inability to absorb water, which leads to an increase in the amount of water lost by deep percolation and thus to a significant inefficiency in the use of irrigation water. In addition, the drainage water moves downward to the water table, causing contamination of the groundwater. This is in addition to a rise in the groundwater level and in the groundwater’s proximity to the surface of the soil. Thus, due to their proximity to each other, the groundwater limits the spread of the roots, stunting their growth [39].
Compared with the mineral fertilizer, it was shown that all organic fertilizers increased the total yield under both aerated and non-aerated conditions (Table 6). Similarly, Sayed et al. [34] showed an increase in potato yield with a compost fertilizer compared with a mineral fertilizer.

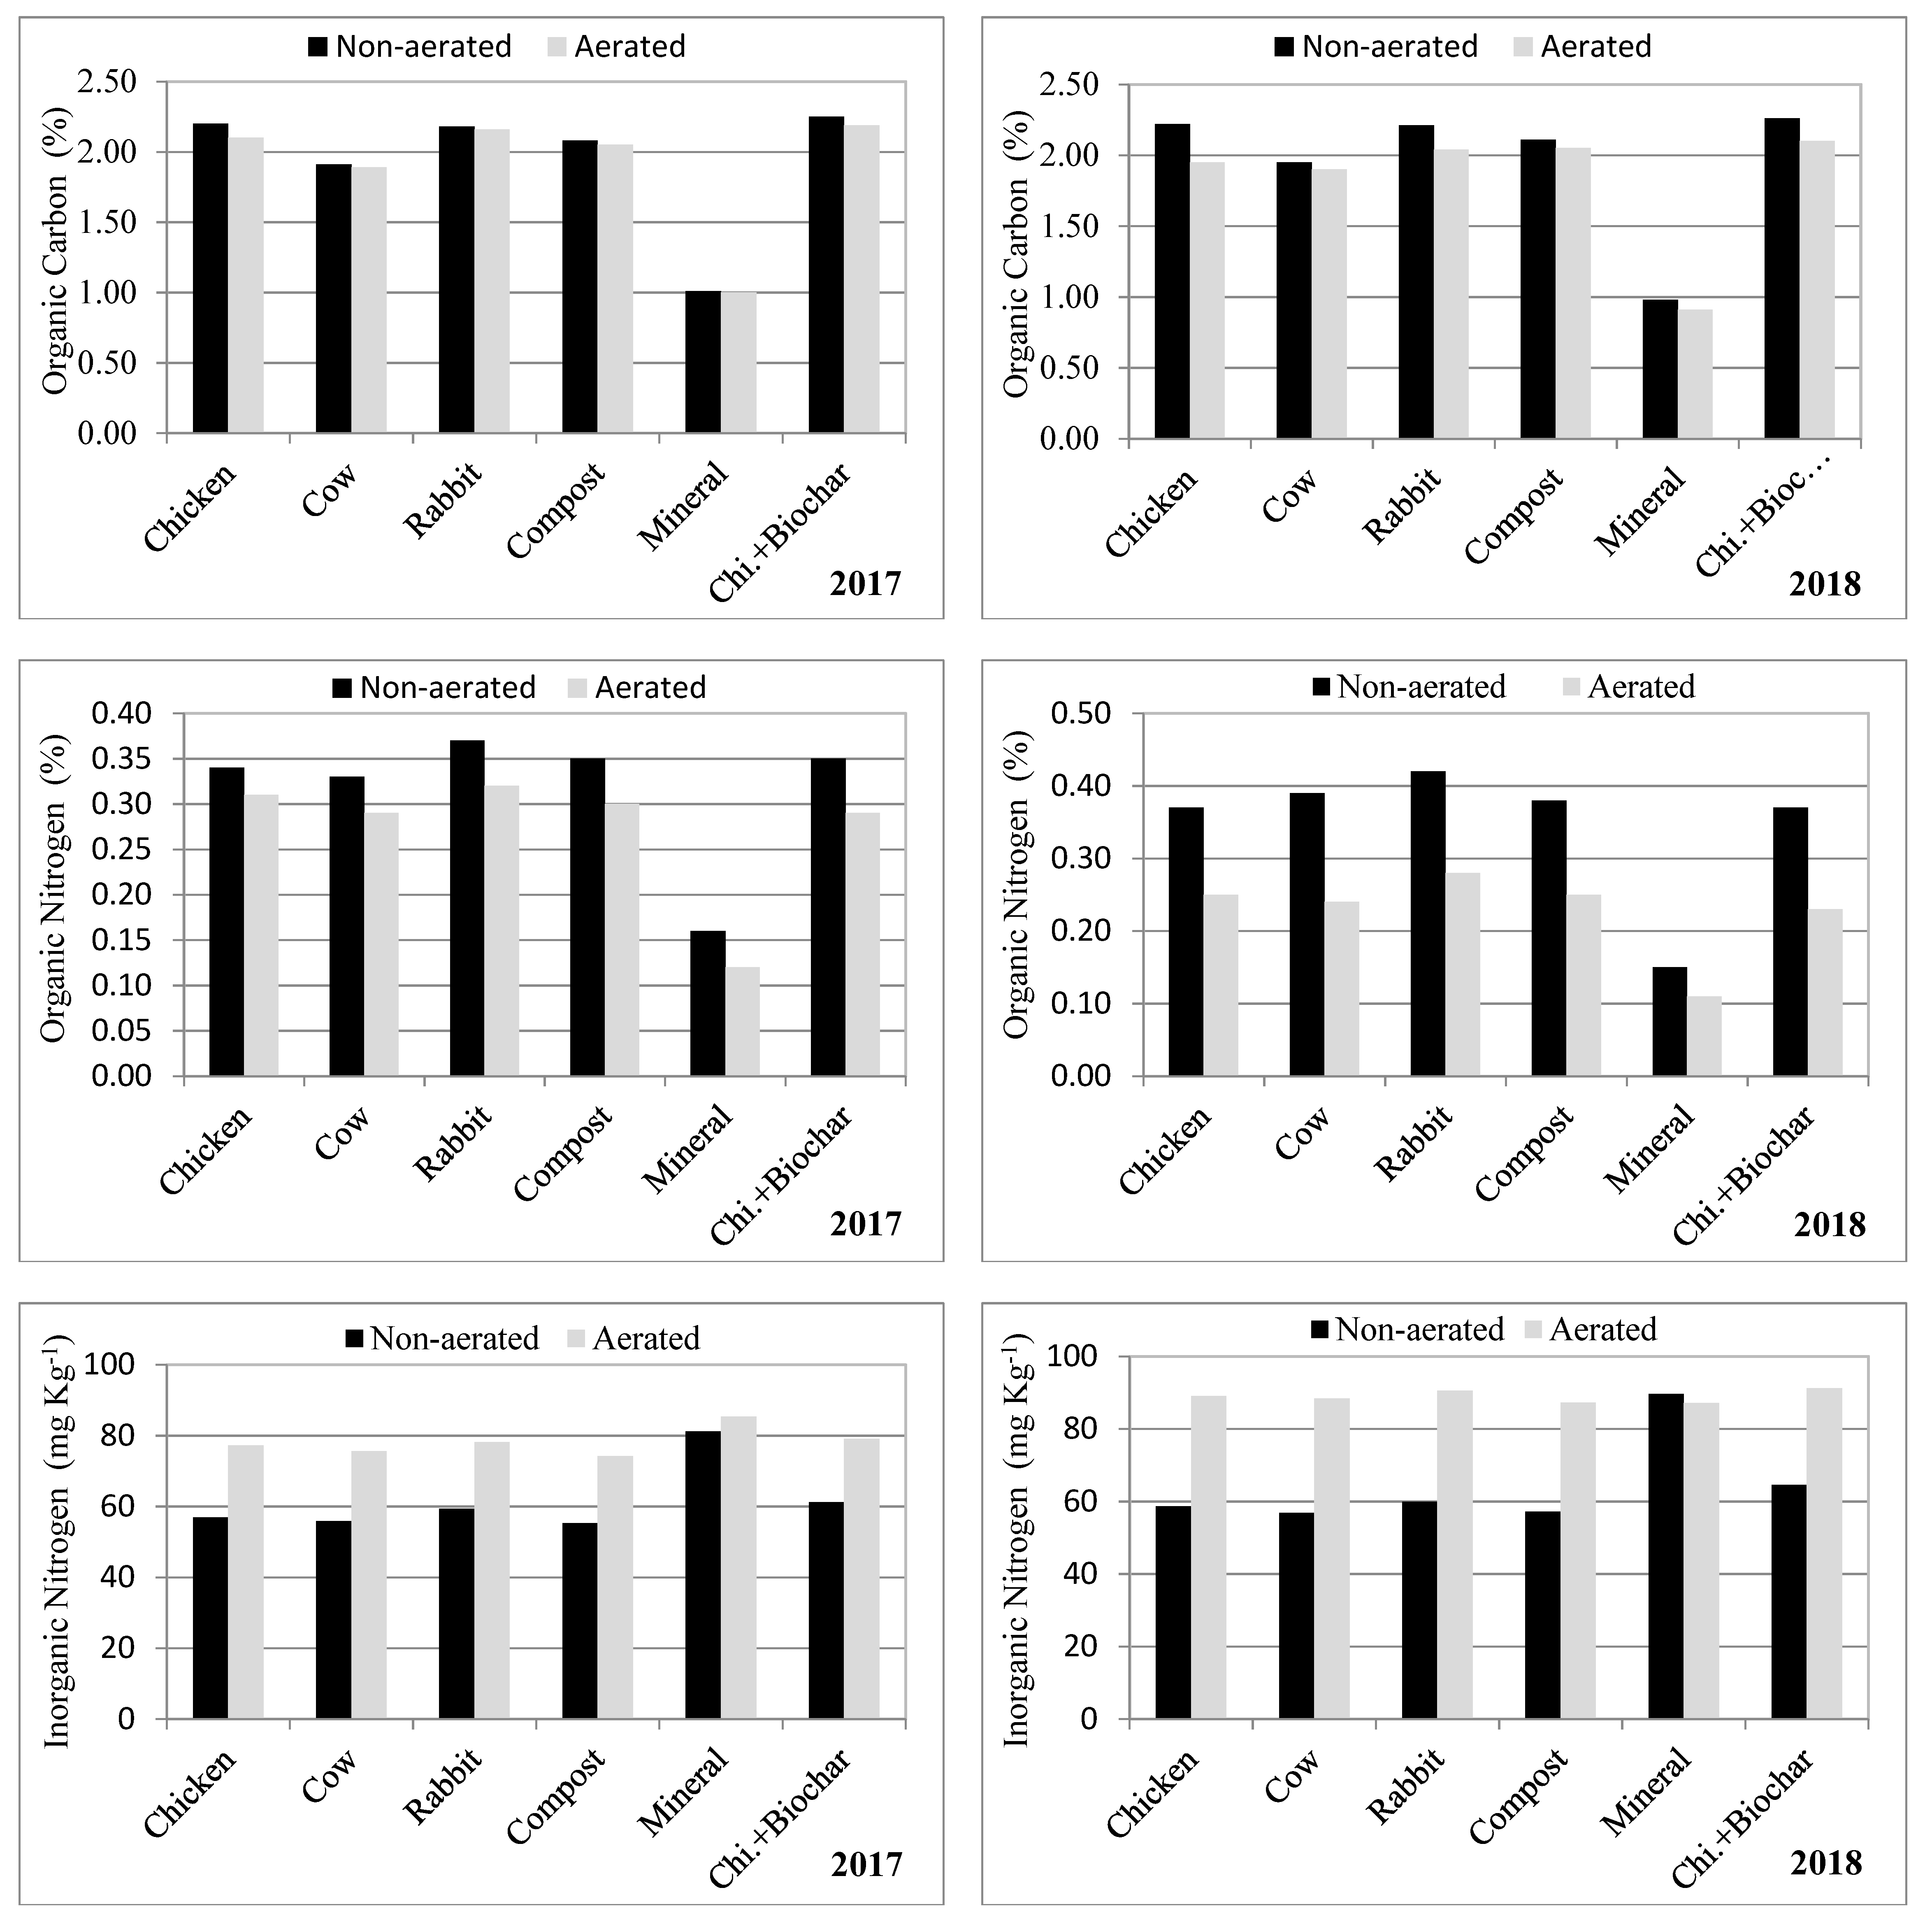
3.3. Soil Chemical Characteristics

The soil pH was reduced significantly with all organic manure treatments compared to the mineral fertilizer in both seasons. The reduction was more pronounced under aerated treatment because non-aerated treatment may show an increased pH because the anaerobic conditions favor denitrification of soil nitrate to nitrogen gas and sulfates to H2S [35] (Table 7).
Soil electrical conductivity (EC) indicates the mineralization of organic matter in the soil and the amount of soluble nutrients. EC values were different in all treatments in both growing seasons under non-aerated and aerated irrigation treatments (Table 7). The effects of organic and mineral fertilizer applications on organic carbon are shown in Figure 2. The data indicate that all organic fertilizer applications showed a significant increase in organic carbon (OC) compared to mineral treatments for both growing seasons. However, the chicken + biochar treatment had the highest values: 2.25% and 2.19% in the first growing season and 2.26% and 2.1% in the second growing season.
Figure 2 shows the chemical components of each treatment in both growing seasons under aerated irrigation treatments in nitrogen content compared to non-aerated irrigation treatments. The recorded amounts of nitrogen in the first growing season were 77.2, 75.6, 78.1, 74.2, 85.4, and 79.1 mg kg−1 for chicken, cow, rabbit, compost, mineral, and chicken + biochar treatments, respectively, and those in the second growing season were 89.1, 88.4, 90.5, 87.3, 87.1, and 91.2 mg kg−1 for chicken, cow, rabbit, compost, mineral, and chicken + biochar treatments, respectively.
Most soil microbes—bacteria, actinomycetes, fungi, and algae—consume oxygen from soil air and produce carbon dioxide. In the absence of gaseous exchange, carbon dioxide accumulates in soil air and becomes toxic to the microbes [40]. Rates of oxygen intake and simultaneous evolution of carbon dioxide are measures of microbial activity. In well-aerated soils, aerobic organisms use oxygen to oxidize and decompose organic matter. However, when oxygen is limited, anaerobic organisms predominate and use nitrates ( N O 3 ), sulfates ( S O 4 2 ), and ferric oxide as electron acceptors in place of oxygen [36,37]. Both free living and symbiotic nitrogen-fixing organisms are also very sensitive to the availability of oxygen in the rhizosphere [41]. Anaerobiosis greatly reduces the activities of the nitrogen-fixing bacteria [42], while the activities of denitrifying bacteria increase significantly in a hypoxic rhizosphere.
The increase in N could be explained by the fact that the microbial decomposition of organic matter gradually releases ammoniacal N ( S O 4 + N ), which is stable under anaerobic conditions.
The available phosphorus was significantly higher in organic manure treatments compared with the mineral treatment. The highest mean available P values occurred with chicken + biochar fertilizer under aerated irrigation treatments in the 2016–2017 and 2017–2018 seasons (75.2 and 78.3 mg kg−1, respectively). This increase was due to the phosphorus released as a result of the mineralization of organic manure, which is converted to Fe–P and Ca–P by mineral fertilizers (Figure 2).
The application of organic manure treatments had a significant effect on the potassium content in both growing seasons, especially under aerated conditions, due to a greater release of organically bound K from organic manure following its mineralization into inorganic forms. A similar finding was reported by Abdeldaym et al. [43,44], who found that the application of spent mushroom compost (SMC) improved the soil-exchangeable potassium content. It was observed that the available iron content increased in both seasons following the addition of organic manure. The highest values of K were detected following chicken + biochar treatment under non-aerated irrigation (5.31 and 5.36 mg kg−1 in the first and second growing seasons, respectively); on the other hand, the iron content reduced under aerated compared with non-aerated irrigation in both seasons, due to the oxidation of Fe+2 to Fe+3, which reduces iron availability. Mn availability showed the same trend in soil treated with organic manure under aerated conditions. Thus, the low-ion transport due to poor soil aeration in the root zone imposes stress on the shoot [45].
The lack of oxygen also increases the hydraulic resistance of the root, thereby reducing water and mineral transport from the root through the plant tissue that sends water and dissolved nutrients upward from the root and helps to form the woody element of the stem [46]. Poor absorption of water and minerals under hypoxic conditions is known to be due to the incomplete root cell membrane permeability [39]. The most severe depressive effect of low soil aeration on nutrient element uptake is ion-specific. Air injection improves K and P uptake in the shoot [45].
It has been reported that poor soil aeration affects potassium uptake more than any other major nutrient; 45% of normal uptake was recorded in hypoxic soil compared to well-aerated soil conditions [47]. Losses of N from a hypoxic rhizosphere are due to denitrification and leaching [48]. Temporal saturation around the active root zone of subsurface-drip-irrigated crops can also lead to a loss of nitrogen due to the same causes. If aeration around the root zone is improved, it will have direct, positive impacts on nitrogen use efficiency, growth and crop yield.

3.4. Plant Growth Parameters

The data in Table 8 indicate that all plant growth parameters under study (fresh plant weight, dry plant weight, plant height, the number of branches, the number of leaves, fresh root weight, dry root weight, and leaf area) significantly increased following aerated compared with non-aerated irrigation for all fertilizer applications in both growing seasons. On the other hand, the vegetative growth parameters showed nonsignificant differences between growing seasons.
Fresh plant weight was enhanced by aerated treatment in both seasons, but this differed depending on the fertilizer treatment used. A higher fresh weight was detected under the aerated rabbit and compost treatments in the first season, while in the second season, higher fresh weight was observed under the aerated cow fertilizer treatment. Dry plant weight was not affected by aerated treatment during the first growing season. In 2017–2018, the highest values were recorded for the aerated cow treatment.
Plant height was increased significantly under aerated treatment in both seasons. Longer plants were recorded for aerated rabbit and compost fertilizer applications during the first growing season, while in the second growing season, the tallest plant was recorded under aerated rabbit and mineral fertilizer applications (Table 8).
The potato plant branch number was not influenced by the type of organic fertilizer treatment used in either growing season.
The number of leaves was influenced by aeration for both growing seasons. The highest number of potato leaves was obtained following compost and chicken + biochar treatments under aerated conditions during the first growing season. In the second growing season, the highest number of potato leaves was recorded for the chicken + biochar treatment followed by the aerated mineral and cow fertilizer applications.
Fresh root weight was influenced by aeration and fertilizer applications in both growing seasons. The rabbit and chicken + biochar fertilizer applications were associated with the highest fresh root weights under aerated treatment during the first growing season. Similarly, for the second growing season, the highest fresh root weights were detected with rabbit and compost fertilizer under aerated treatment.
Dry root weight was influenced by aeration and organic fertilizer applications in both growing seasons. The rabbit fertilizer treatment was associated with the highest dry root weight under aerated treatment during the first growing season. In the second growing season, there was no significant difference between aerated and non-aerated treatments for any of the fertilizer applications.
In both seasons, the plant leaf area increased significantly more under the chicken + biochar treatment compared to other fertilizer applications under aerated conditions (Table 8).
An improvement in overall plant growth under aerated treatments compared with non-aerated treatments is related to poor root respiration which reduces the absorption of water and nutrients, because chemical changes in the soil produce toxins that limit total plant growth [49]. Poor soil aeration has a greater effect on the reduction of plant growth than root growth. At any given temperature, the plant growth rate can be linked to the soil oxygen level [9]. Most field crops show low growth rates when oxygen availability in the soil is low. A basic manifestation of hypoxia is a reduction in stomatal conductance and water absorption [50], which leads to reduced transpiration. Indeed, it has been shown that stem sap flow rates are increased by air injection, an effect that may have positive reactions through reducing the water content in the soil and thus increasing the flow of oxygen from the atmosphere to the roots.
Plant roots grown in well-aerated soils are usually long, fibrous, and profusely branched with many root hairs and high rates of root respiration. Oxygenation with SDI leads to similar root traits. Indeed, very clear anatomical root differences are evident in response to oxygenation. The potato data agrees with data showing that fresh root weight, dry root weight, and yield are higher under aerated treatments compared with non-aerated treatment [42].
Soil respiration rates have been observed to be almost doubled in soybean and proportionately even greater in cotton following oxygenation [5]. Likewise, Goorahoo et al. [23] reported a 53% increase in dry root weight in a field experiment with venture oxygenation of bell peppers on sandy loam irrigated to field capacity. This suggests that root zone aeration favors root growth in both well-drained and heavy soils. The potato data agree with the findings of Goorahoo et al.’s study [23], where there was an increment of dry root weight under aerated and fertilizer applications by almost double compared with non-aerated treatment.

4. Conclusions

Air injection into the soil under an SDI system improves the growth environment of crops, thus improving the water productivity and increasing the yield and quality of the crop.
The highest yield and water productivity values were achieved under aeration and cow manure treatments in both growing seasons. Yields were higher than under non-aerated treatments by 48.9% and 41.47%, and water productivity values were higher by 61.7% and 55.3%, in the 2016–2017 and 2017–2018 seasons, respectively. Compared with non-aerated treatments, aerated treatments achieved higher vegetative growth parameters for potatoes. Compared with the traditional method of adding soil fertilizer without aeration, aerated treatments yielded the best nutritional values and the highest coupling after air injection.
Air injection into the soil for potatoes, as expected, benefitted the crop by increasing the soil–air exchange rate and nutrient absorption, thus increasing the water productivity and reducing overall irrigation requirements. However, soil aeration cannot overcome soil compaction; soil aeration affects only root growth and function, since it is restricted by oxygen or oxygen deficiency. As such, good agricultural practice should, for example, change the plowing depth each year and change the use of the moldboard plow and the disc plow to overcome soil compaction.

Author Contributions

Conceptualization, M.E.A. and A.M.H.; Methodology, M.E.A. and N.H.A.; Formal Analysis, E.A.A.; Investigation, A.M.H.; Resources, M.B.I.E.; Data Curation, M.E.A.; Writing-Original Draft Preparation, M.E.A.; Writing-Review & Editing, M.E.A. and M.M.E.

Funding

This research received no external funding.

Conflicts of Interest

The authors have declared no conflict of interest.

References

  1. El-sayed, S.F. Effect of Different Substrates and Nutrient Solutions on Vegetative Growth, Mineral Content, Production and Fruit. Zagazig J. Agric. Res. 2017, 43, 1919–1938. [Google Scholar]
  2. FAO. Agriculture Organization of the United Nations Statistics Division; FAO: Rome, Italy, 2016. [Google Scholar]
  3. Yuan, L.; Wenquan, N.; Jingwei, W.; Jian, X. Review on advances of airjection irrigation. Int. J. Agric. Biol. Eng. 2015, 9, 1–10. [Google Scholar]
  4. Rengasamy, P. Subsoil constraints and agricultural productivity. J. Indian Soc. Soil Sci. 2000, 48, 674–682. [Google Scholar]
  5. Bhattarai, S.P.; Midmore, D.J. Oxygation of rhizosphere with subsurface aerated irrigation water improves lint yield and performance of cotton on saline heavy clay soil. In Proceedings of the 4th International Crop Science Congress, Brisbane, Australia, 26 September–1 October 2004; Volume 26. [Google Scholar]
  6. Ben-Noah, I.; Friedman, S.P. Aeration of clayey soils by injecting air through subsurface drippers: Lysimetric and field experiments. Agric. Water Manag. 2016, 176, 222–233. [Google Scholar] [CrossRef]
  7. Errebhi, M.; Rosen, C.J.; Gupta, S.C.; Birong, D.E. Potato yield response and nitrate leaching as influenced by nitrogen management. Agron. J. 1998, 90, 10–15. [Google Scholar] [CrossRef]
  8. Mehrvarz, S.; Chaichi, M.R.; Alikhani, H.A. Effects of phosphate solubilizing microorganisms and phosphorus chemical fertilizer on yield and yield components of barely (Hordeum vulgare L.) department of soil science engineering. Am. Eurasian J. Agric. Environ. Sci. 2008, 3, 822–828. [Google Scholar]
  9. McLaren, R.G.; Cameron, K.C. Soil Sciencesustainable Production and Environmental Protection; Oxford University Press: Mexico, 1996; ISBN 0195583450. [Google Scholar]
  10. Ferdoushi, S.N.; Farooque, A.M.; Alam, M.S. Effects of organic and inorganic fertilizer management practices and mulch on the growth and yield of potato. J. Agrofor. Environ. 2010, 3, 175–178. [Google Scholar]
  11. Bhattarai, S.; Pendergast, L.; Midmore, D.J. Oxygation of Subsurface Drip Irrigated Tomato (Lycopersicon esculentum L.) Improves Yield Performance, Tolerance to Salinity and Water Use Efficiency in Normal and Saline Heavy Clay Soil; Sci. Hortic.: Rockhampton, Australia, 2005. [Google Scholar]
  12. Abuarab, M.; Mostafa, E.; Ibrahim, M. Effect of air injection under subsurface drip irrigation on yield and water use efficiency of corn in a sandy clay loam soil. J. Adv. Res. 2013, 4, 493–499. [Google Scholar] [CrossRef]
  13. Bhattarai, S.P.; Midmore, D.J.; Pendergast, L. Yield, water-use efficiencies and root distribution of soybean, chickpea and pumpkin under different subsurface drip irrigation depths and oxygation treatments in vertisols. Irrig. Sci. 2008, 26, 439–450. [Google Scholar] [CrossRef]
  14. Niu, W.; Guo, Q.; Zhou, X.; Helmers, M.J. Effect of aeration and soil water redistribution on the air permeability under subsurface drip irrigation. Soil Sci. Soc. Am. J. 2012, 76, 815–820. [Google Scholar] [CrossRef]
  15. Klute, A. Methods of soil analysis, part 1 physical and mineralogical methods, Arnold Klute ed. Agronomy 1986, 9. [Google Scholar]
  16. Jackson, M.L. Soil Chemical Analysis; Prentice Hall of India: New Delh, India, 1967. [Google Scholar]
  17. Vomocil, J.A. Measurement of soil bulk density and penetrability: A review of methods. Adv. Agron. 1957, 9, 159–175. [Google Scholar]
  18. Klute, A. Water Retention: Laboratory Methods. Methods of Soil Analysis: Part 1—Physical and Mineralogical Methods; USDA: Denver, CO, USA, 1986; pp. 635–662. [Google Scholar]
  19. Yimer, F.; Ledin, S.; Abdelkadir, A. Soil organic carbon and total nitrogen stocks as affected by topographic aspect and vegetation in the Bale Mountains, Ethiopia. Geoderma 2006, 135, 335–344. [Google Scholar] [CrossRef]
  20. Jackson, M.L. Estimation of Phosphorus Content: Soil Chemical Analysis; Printer Hall: New Delhi, India, 1973. [Google Scholar]
  21. Black, C.A. Methods of Soil Analysis: Physical and Mineralogical Properties, Including Statistics of Measurement and Sampling. Part 2. Chemical and Microbiological Properties; Agronomy: Denver, CO, USA, 1965. [Google Scholar]
  22. Lindsay, W.L.; Norvell, W.A. Development of a DTPA soil test for zinc, iron, manganese and copper 1. Soil Sci. Soc. Am. J. 1978, 42, 421–428. [Google Scholar] [CrossRef]
  23. Goorahoo, D.; Carstensen, G.; Zoldoske, D.F.; Norum, E.; Mazzei, A. Using air in sub-surface drip irrigation(SDI) to increase yields in bell peppers. Int. Water Irrig. 2002, 22, 39–42. [Google Scholar]
  24. Heuberger, H.; Livet, J.; Schnitzler, W. Effect of soil aeration on nitrogen availability and growth of selected vegetables-preliminary results. In Proceedings of the International Conference on Environmental Problems Associated with Nitrogen Fertilisation of Field Grown Vegetable Crops, Potsdam, Germany, 30 August–1 September 1999; Volume 563, pp. 147–154. [Google Scholar]
  25. Bhattarai, S.P.; Huber, S.; Midmore, D.J. Aerated subsurface irrigation water gives growth and yield benefits to zucchini, vegetable soybean and cotton in heavy clay soils. Ann. Appl. Biol. 2004, 144, 285–298. [Google Scholar] [CrossRef]
  26. Phillips, S.B.; Warren, J.G.; Keahey, D.A.; Mullins, G.L. Nitrogen Management for White Potato Production. Va. Va. Coop. Ext. 2004, 438. [Google Scholar]
  27. Bhushan, L.; Ladha, J.K.; Gupta, R.K.; Singh, S.; Tirol-Padre, A.; Saharawat, Y.S.; Gathala, M.; Pathak, H. Saving of water and labor in a rice–wheat system with no-tillage and direct seeding technologies. Agronomy 2007, 99, 1288–1296. [Google Scholar] [CrossRef]
  28. Marcus, D.M.; Latov, N.; Hsi, B.P.; Gillard, B.K.; Antel, J.; Appel, S.; Callegaro, L.; Daune, G.; Gillard, B.; Latoy, N. Measurement and significance of antibodies against GM1 ganglioside Report of a workshop. J. Neuroimmunol. 1989, 25, 255–259. [Google Scholar] [CrossRef]
  29. Snedecor, G.W.; Cochran, W.G. Statistical Methods, 8th ed.; Ames, Iowa State University Press: Ames, IA, USA, 1989. [Google Scholar]
  30. Gibbs, J.; Greenway, H. Mechanisms of anoxia tolerance in plants. I. Growth, survival and anaerobic catabolism. Funct. Plant Biol. 2003, 30, 1–47. [Google Scholar] [CrossRef]
  31. Everard, J.D.; Drew, M.C. Mechanisms controlling changes in water movement through the roots of Helianthus annuus L. during continuous exposure to oxygen deficiency. J. Exp. Bot. 1989, 40, 95–104. [Google Scholar] [CrossRef]
  32. Samad, A.; Meisner, C.A.; Saifuzzaman, M.; Ginkel, M.V. Waterlogging tolerance. Application of Physiology in Wheat Breeding; Reynolds, M.P., Ortiz-Monasterio, J.I., McNab, A., Eds.; CIMMYT: Mexico, 2001; pp. 136–144. [Google Scholar]
  33. Anderson, R.C.; Liberta, A.E.; Dickman, L.A. Interaction of vascular plants and vesicular-arbuscular mycorrhizal fungi across a soil moisture-nutrient gradient. Oecologia 1984, 64, 111–117. [Google Scholar] [CrossRef] [PubMed]
  34. El-Sayed, S.F.; Hassan, A.H.; El-Mogy, M.M. Impact of Bio- and Organic Fertilizers on Potato Yield, Quality and Tuber Weight Loss After Harvest. Potato Res. 2015, 58, 67–81. [Google Scholar] [CrossRef]
  35. Huang, B.; Scott Nesmith, D. Soil Aeration Effects on Root Growth and Activity. In Proceedings of the VI Symposium on Stand Establishment and ISHS Seed Symposium, Roanoke, VA, USA, October 1999; Volume 504, pp. 41–52. [Google Scholar]
  36. Vartapetian, B.B.; Jackson, M.B. Plant adaptations to anaerobic stress. Ann. Bot. 1997, 79, 3–20. [Google Scholar] [CrossRef]
  37. Everard, C.O.R.; Everard, J.D. Mongoose rabies in Grenada. Population Dynamics of Rabies in Wildlife; Philip, J.B., Ed.; Academic Press: London, UK, 1985. [Google Scholar]
  38. Arkin, G.F.; Taylor, H.M. Modifying the Root Environment to Reduce Crop Stress; American Society of Agricultural Engineers: St. Joseph, MO, USA, 1981; ISBN 0916150402. [Google Scholar]
  39. Bhattarai, S.P.; Su, N.; Midmore, D.J. Oxygation unlocks yield potentials of crops in oxygen-limited soil environments. Adv. Agron. 2005, 88, 313–377. [Google Scholar]
  40. Rathbone, K.; Fuchs, J.; Anderson, K.; Karthikeyan, R.; Nurhidayat, N. Effects of Pahs on Microbial Activity and Diversity in Freshly Contaminated and Weathered Soils; Kansas State University: Manhattan, NY, USA, 1998; p. 383. [Google Scholar]
  41. Mundy, G.N.; Jones, H.R.; Mason, W.K. Nitrogen fixation activity by white clover pastures during flood irrigation cycles. Aust. J. Agric. Res. 1988, 39, 409–414. [Google Scholar] [CrossRef]
  42. Deaker, R.; Kennedy, I.R. Improved potential for nitrogen fixation in Azospirillum brasilense sp7-s associated with wheat nifH expression as a function of oxygen pressure. Acta Biotechnol. 2001, 21, 3–17. [Google Scholar] [CrossRef]
  43. Abdeldaym, E.A.; Erriquens, F.; Sasanelli, N.; Ceglie, F.G.; Zaccone, C.; Miano, T.; Cocozza, C. Effects of several amendments on organic melon growth and production, Meloidogyne incognita population and soil properties. Sci. Hortic. 2014, 180, 156–160. [Google Scholar] [CrossRef]
  44. Abdeldaym, E.A.; Traversa, A.; Cocozza, C.; Brunetti, G. Effects of a 2-Year Application of Different Residual Biomasses on Soil Properties and Potato Yield. Clean Soil Air Water 2018, 46. [Google Scholar] [CrossRef]
  45. Aguilar, E.A.; Turner, D.W.; Gibbs, D.J.; Armstrong, W.; Sivasithamparam, K. Oxygen distribution and movement, respiration and nutrient loading in banana roots (Musa spp. L.) subjected to aerated and oxygen-depleted environments. Plant Soil 2003, 253, 91–102. [Google Scholar] [CrossRef]
  46. Steudle, E. Water uptake by plant roots: An integration of views. Plant Soil 2000, 226, 45–56. [Google Scholar] [CrossRef]
  47. Armstrong, W. Aeration in higher plants. In Advances in Botanical Research; Elsevier: Hull, UK, 1980; Volume 7, pp. 225–332. ISBN 0065-2296. [Google Scholar]
  48. Allègre, A.; Silvestre, J.; Morard, P.; Kallerhoff, J.; Pinelli, E. Nitrate reductase regulation in tomato roots by exogenous nitrate: A possible role in tolerance to long-term root anoxia. J. Exp. Bot. 2004, 55, 2625–2634. [Google Scholar] [CrossRef] [PubMed]
  49. Brady, N.C.; Weil, R.R. Soil Aeration and Temperature. In The Nature and Properties of Soil, 12th ed.; Prentice Hall: New York, NY, USA, 1999; pp. 265–306. [Google Scholar]
  50. Vasellati, V.; Oesterheld, M.; Medan, D.; Loreti, J. Effects of flooding and drought on the anatomy of Paspalum dilatatum. Ann. Bot. 2001, 88, 355–360. [Google Scholar] [CrossRef]
Figure 1. Hydraulic diagram of the micro irrigation system, air injection unit, and treatments.
Agronomy 09 00418 g001
Figure 2. Soil organic carbon, organic nitrogen, inorganic nitrogen, and available P and K for different growing seasons and under different fertilizer applications.
Agronomy 09 00418 g002aAgronomy 09 00418 g002b
Table 1. Physical properties of the experimental soil.
Soil Depth (cm)Particle Size DistributionTextureField Capacity
(cm3 cm−3)
Wilting Point
(cm3 cm−3)
Bulk Density
(g cm−3)
Sand
(%)
Silt
(%)
Clay
(%)
0–20353332Clay Loam39.1818.311.28
20–40313435Clay Loam39.0219.311.3
40–60293338Clay Loam38.7221.41.33
Table 2. Chemical properties of experimental soil.
pH
(1:2.5)
ECe
(dS m−1)
O.N
(%)
N
(mg kg−1)
P
(mg kg−1)
K
(mg kg−1)
Fe
(mg kg−1)
Mn
(mg kg−1)
7.822.510.1741.1858.12512.45.1522.1
7.812.080.1536.451.33498.24.8419.9
7.831.980.1429.5850.08473.34.419.2
Table 3. Monthly climatic data of the experimental area for the two growing seasons.
YearClimate ParameterMonth
OctoberNovemberDecemberJanuaryFebruaryMarch
2016–2017Tmin (°C)16.012.28.26.36.610.1
Tmax (°C)30.125.321.219.521.024.2
Tave (°C)23.118.814.712.913.817.2
RH (%)697575777266
Solar radiation (MJ/m²/day)17.113.411.211.714.718.3
2017–2018Tmin. (°C)17.613.79.87.98.910.9
Tmax (°C)29.324.519.518.520.423.4
Tave (°C)23.4519.1014.6513.2014.6517.15
RH (%)545753555144
Solar radiation (MJ/m²)17.513.811.412.315.418.9
Tmin (°C): the minimum air temperature, Tmax (°C): the maximum air temperature, Tave (°C): average air temperature, and RH (%): relative air humidity.
Table 4. Chemical properties of organic fertilizers.
Organic ManurepH
(1:2.5)
ECe
(dS m−1)
O.C
(%)
N
(%)
P
(%)
K
(%)
Fe
(mg kg−1)
Mn
(mg kg−1)
Chicken6.512.4719.81.40.660.97648.1140.2
Cow7.732.0816.21.60.630.92634.6142.5
Rabbit7.51.8626.741.50.931.12819.8152.7
Compost7.11.5219.11.10.540.81627.5143.5
Chicken + Biochar8.121.1148.140.720.440.74642.1156.1
Table 5. Soil physical characteristics after mixing with organic manures.
Growing SeasonsFertilizer ApplicationsField Capacity
(cm3 cm−3)
Wilting Point
(cm3cm−3)
H.C
(mm hour−1)
Bulk Density
(g cm−3)
Non-AeratedAeratedNon-AeratedAeratedNon-AeratedAeratedNon-AeratedAerated
2016–2017Mineral38.8 d38.1 g19.3 e18.9 f3.1 abc3.2 ab1.3 a1.28 bcd
Chicken42.7 c39.2 e20.7 d18.8 f2.9 cde3.2 ab1.28 bc1.23 e
Cow39.1 e38.1 g19.7 e18.3 g3.0 bcd3.3 a1.29 b1.22 ef
Rabbit44.8 a39.3 de21.6 b20.7 d2.7 f2.9 cde1.27 d1.22 ef
Compost43.2 bc39.9 d21.1 c20.6 d2.9 cde3 bcd1.28 bcd1.27 d
Chicken + Biochar43.8 bc38.2 g22.3 a20.8 cd2.5 g2.9 cde1.23 e1.2 g
LSD 0.050.6070.3790.1700.012
2017–2018Mineral38.6 h38 i19.2 g18.4 h3.2 ab3.3 a1.29 a1.27 ab
Chicken43.3 d38.7 h21.1 c18.4 h2.7 de3.3 a1.27 ab1.21 e
Cow39.3 f37.8 j19.6 f18.1 i2.7 de3.1 b1.27 ab1.21 e
Rabbit44.7 a39 g21.9 b20.6 d2.6 ef2.8 d1.24 cd1.21 e
Compost43.8 c39.6 e21.2 c20.4 e2.8 d3.1 b1.26 bc1.24 cd
Chicken + Biochar44.1 b38.1 i22.4 a20.6 d2.5 g3 c1.22 de1.2 e
LSD 0.050.1340.1200.1080.021
Note: Numbers followed by different letters within the growing seasons and irrigation treatments are statistically different (p < 0.05). H.C: hydraulic conductivity.
Table 6. Total amount of water irrigation (I), yield, and water productivity of potato under non-aerated and aerated fertilizer applications in different growing seasons.
Growing SeasonsFertilizer ApplicationsI (m3 ha−1)Yield (kg ha−1)Water Productivity (kg m−3)
Non-AeratedAeratedNon-AeratedAeratedNon-AeratedAerated
2016–2017Chicken3706.96 h3462.84 i24,000 d34,430 a6.47 d9.94 a
Cow3923.13 fg3611.07 hi24,350 d36,250 a6.21 d10.04 a
Rabbit4072.33 ef3760.84 gh25,480 cd33,830 a6.26 d9.00 b
Compost4274.61 cd3979.78 ef26,150 cd34,250 a6.12 d8.61 b
Mineral4507.37 b4143.40 de27,920 bc30,100 b6.68 d6.74 d
Chicken + Biochar4681.11 a4329.73 c27,650 bc33,830 a5.91 d7.81 c
LSD 0.05LSD 0.05168.52.974
2017–2018Chicken3975.72 f3674.08 g25,000 c32,900 ab6.29 cde8.95 a
Cow4209.52 e3834.95 fg24,740 c35,000 a5.88 cde9.13 a
Rabbit4371.64 de3995.89 f25,450 c28,700 bc5.83 cde7.17 bc
Compost4590.93 c4230.50 de25,520 c35,000 a5.57 de8.26 ab
Mineral4843.17 b4406.51 d27,840 bc30,080 abc5.75 de6.83 cd
Chicken + Biochar5032.2 a4606.83 c26,450 c28,830 bc5.26 e6.26 cde
LSD 0.05LSD 0.05168.55.277
Note: Numbers followed by different letters within the growing seasons and irrigation treatments are statistically different (p < 0.05).
Table 7. Some of the soil chemical components under non-aerated and aerated treatments with various fertilizer applications for different growing seasons.
Growing
Seasons
Fertilizer
Applications
pH (1:2.5)EC (dS m−1)C/N RatioFe (mg kg−1)Mn. (mg kg−1)
Non-AeratedAeratedNon-AeratedAeratedNon-AeratedAeratedNon-AeratedAeratedNon-AeratedAerated
2016–2017Mineral7.71 g7.72 fg2.63 c2.55 d6.47 cde6.00 ef5.2 bc5.1 d ef21.22 e21.1 e
Chicken7.76 ef7.76 ef2.44 e2.37 f5.79 e5.00 g5.18 cd5.04 f23.4 b22.9 c
Cow7.78 bcde7.77 de2.03 h1.94 i 5.89 de5.26 fg5.22 abc5.17 cde22.35 d22.38 d
Rabbit7.79 abcde7.78 cde3.31 a3.15 b5.94 de5.55 efg5.28 ab5.21 bc21.46 e21.24 e
Compost7.82 a7.81 abc2.12 g2.08 gh6.31 cde6.53 de5.08 ef5.05 f23.87 a23.88 a
Chicken + Biochar7.80 abcd7.82 ab2.52 d2.45 e6.43 cde6.11 ef5.31 a5.24 abc22.05 d22.1 d
LSD 0.050.0380.0380.0520.7950.092
2017–2018Mineral7.70 ef7.68 f2.72 c2.51 d6.77 cd7.80 bc5.33 a5.11 c23.7 b23.55 b
Chicken7.75 cd7.73 de2.71 c2.47 d6.52 cde7.92 bc5.25 b4.98 c23.1 b23.2 b
Cow7.78 abc7.77 bcd1.98 f1.76 g6.75 bc7.29 cd5.20 b5.09 c24.3 a24.4 a
Rabbit7.78 abc7.76 bcd3.36 a2.97 b6.83 bc8.20 bc 5.33 a5.19 b23.15 b23.17 b
Compost7.81 a7.79 abc2.15 e1.89 f8.33 a8.27 ab5.21 b5.19 b23.44 b23.47 b
Chicken + Biochar7.81 a7.8 ab2.53 d2.11 e7.55 ab9.13 a5.36 a5.21 b22.14 c22.24 c
LSD 0.050.0410.0410.0920.8720.064
Note: numbers followed by different letters within the growing seasons and irrigation treatments are statistically different (P < 0.05). LSD: least significant difference
Table 8. The vegetative growth parameters of potato under non-aerated and aerated fertilizer applications for different growing seasons.
Growing SeasonFertilizer ApplicationsFresh Plant Weight (g)Dry Plant Weight (g)Plant Height (cm)Number of BranchesNumber of LeavesFresh Root Weight (g)Dry Root Weight (g)Leaf Area (cm)
Non-AeratedAeratedNon-AeratedAeratedNon-AeratedAeratedNon-AeratedAeratedNon-AeratedAeratedNon-AeratedAeratedNon-AeratedAeratedNon-AeratedAerated
2016–2017Mineral206.02 b262.80 ab24.90 a35.31 a46.50 de54.17 c3.00 bc4.34 a39.00 de55.84 b13.78 f20.26 bcde4.55 c8.14 ab117.78 bcd128.44 b
Chicken249.34 ab257.79 ab31.26 a30.65 a46.17 def58.42 b3.00 bc4.00 ab45.50 c46.50 c16.89 def23.00 ab4.46 c7.68 b92.10 de111.56 bcde
Cow227.71 b239.12 ab25.99 a32.48 a44.50 def54.72 bc2.00 c4.00 ab41.67 d45.84 c18.43 cde20.80 abcd3.95 cd8.27 ab95.88 cde121.70 bc
Rabbit249.13 ab319.84 a28.53 a31.99 a47.50 d67.34 a2.50 c4.50 a46.50 c55.50 b16.85 def24.59 a4.16 cd8.85 a108.33 bcde112.20 bcd
Compost228.17 b318.80 a24.98 a37.84 a42.50 f65.50 a2.00 c4.00 ab35.00 f60.00 a16.93 def22.03 abc3.26 d8.26 ab91.24 de92.58 de
Chicken + Biochar213.99 b287.65 ab27.32 a36.26 a43.00 ef57.50 bc3.00 bc4.50 a36.00 ef62.50 a16.13 ef24.62 a4.57 c7.50 b84.68 e161.48 a
LSD 0.0570.52039.1203.6101.2003.7293.7291.01123.820
2017–2018Mineral294.78 abcd318.21 ab25.17 de31.06 ab51.34 bcd62.70 a3.50 abc4.50 a43.00 d56.50 b21.88 de24.74 cd5.47 a5.66 a127.15 bc129.14 bc
Chicken224.21 ef253.15 cdef20.99 f30.26 bc43.00 ef57.98 ab3.67 abc3.67 abc45.67 d51.67 c21.19 e26.41 bc4.46 a5.28 a119.56 cd150.28 ab
Cow246.93 def348.77 a25.21 de33.50 a42.95 ef52.84 bcd2.84 bcd4.50 a37.50 e56.00 b22.77 de26.61 bc5.08 a6.06 a114.20 cd152.94 ab
Rabbit217.99 f301.03 abcd22.05 ef30.06 bc50.00 cde62.50 a2.50 cd4.50 a45.17 d53.00 bc23.68 cde29.94 a4.54 a6.66 a125.95 bc128.00 bc
Compost281.985 bcde309.02 abc25.91 d27.88 bcd45.96 def 56.00 abc2.00 d4.00 ab38.67 e46.50 d22.84 de28.08 ab4.59 a5.83 a96.83 d110.62 cd
Chicken + Biochar277.03 bcde298.29 abcd22.16 ef27.54 cd40.17 f57.50 abc3.00 bcd4.50 a32.34 f62.50 a21.77 de24.16 cde5.02 a6.39 a101.83 cd162.24 a
LSD 0.0553.2402.9916.9891.0883.9482.85952.43025.900
Note: numbers followed by different letters within the growing seasons and irrigation treatments are statistically different (p < 0.05).

