Abstract
Large collections of the forage and bioenergy grass Dactylis glomerata were made in northwest (NW) Europe along east to west and north to south clines for genetic resource conservation and to inform breeding programmes of genetic diversity, genepools, and ploidy. Leaves were sampled for genetic analysis and seed and rhizome for ex-situ conservation. Genotyping by sequencing (GBS) was used to assay nuclear DNA diversity and plastome single nucleotide polymorphism (SNP) discovery was undertaken using a long-read PCR and MiSeq approach. Nuclear and plastid SNPs were analysed by principal component analysis (PCA) to compare genotypes. Flow cytometry revealed that all samples were tetraploid, but some genome size variation was recorded. GBS detected an average of approximately 10,000 to 15,000 SNPs per country sampled. The highest average number of private SNPs was recorded in Poland (median ca. 2000). Plastid DNA variation was also high (1466 SNPs, 17 SNPs/kbp). GBS data, and to a lesser extent plastome data, also show that genetic variation is structured geographically in NW Europe with loose clustering matching the country of plant origin. The results reveal extensive genetic diversity and genetic structuring in this versatile allogamous species despite lack of ploidy variation and high levels of human mediated geneflow via planting.
Keywords:
Dactylis glomerata; diversity; forage; GBS; marginal land; genetic resources; phylogeography; plastome; SNPs 1. Introduction
Dactylis glomerata L. (cock’s foot; orchard grass) is a tufted C3 photosynthetic perennial species that is classified within the grass tribe Poeae [1,2,3]. It is one of the most important forages in the world [4] and is also under investigation for biomass and bioenergy [5]. It is outbreeding, has substantial dispersal ability [6] and is highly variable in its morphology, reflecting natural variation and a long history of cultivation, selection and introduction for forage [6,7,8]. It can form large tussocks, but individual plants do not generally spread far laterally [9]. Dactylis glomerata has a circumpolar southern-temperate distribution and is native to Eurasia and North Africa [10]. It is commonly found naturalized outside of its native range and breeding material has been introduced into many areas for modern-day forage systems [11]. It is also a significant contributor to ecosystem function [12].
Dactylis glomerata produces high biomass yields and is well adapted to a broad range of habitats [5,13] including calcareous grasslands, Mediterranean grasslands, coastal cliffs, fixed dunes, meadows, open woodland, pastures, river banks and rough grassland. It also thrives in more artificial sites such as paths, roadsides, spoil heaps, quarries and waste ground [9,14]. It occurs on a range of soils but is particularly common on those of moderate fertility between pH of 5 and 8 [9,11]. As a result of this wide environmental distribution, it is a good candidate species for cultivation on marginal land that is unsuitable or unproductive for other agricultural uses. The challenge is to develop new high-yielding genotypes suitable for growth in a range of habitats and on marginal land [15,16,17].
Stress tolerance and biomass yield are important traits of Dactylis glomerata [5,18]. Dactylis generally has good abiotic stress tolerance in comparison to other biomass crops [5,19]. There is potential to use natural genetic variation in forage breeding programmes that develop new cultivars for sustainable agriculture in a changing global climate [20,21,22]. Dactylis glomerata is predominantly tetraploid across its natural range in Eurasia but populations of diploids are not uncommon particularly around the Mediterranean region [7,23,24]. Sometimes these diploids are taxonomically segregated as separate species or infraspecific taxa but they intergrade with each other and the tetraploid forms, in a polyploid complex. Triploids, pentaploids and hexaploids were reported [24,25,26,27,28,29] and genome size varied with altitude in natural tetraploid populations [30].
Genetic diversity of Dactylis was assessed using a range of protein and DNA markers including allozymes [27,31]; SSR [24,32,33,34,35]; RAPD/ISSR/SCoT [35,36,37,38]; AFLP [38] and SNPs [32]. Nuclear genotyping by sequencing (GBS) was used by Bushman et al. [39], but not for genetic diversity studies. A related high throughput sequencing SNP genotyping method called specific-locus amplified fragment sequencing (SLAF-seq) was used by Zhao et al. [40] for the construction of a high-density linkage map and discovery of flowering time quantitative trait loci (QTL), and also by Zeng et al. [41] for genome wide association study of rust traits. Plastid DNA sequences were used in phylogenetic studies of grasses including Dactylis [2]. However, few have sampled high density plastid genome SNP data for genetic diversity analyses. Plastomes are generally highly informative for phylogeographic studies because of their maternal inheritance that can help estimate seed mediated gene flow [42,43].
We undertook comprehensive sampling of Dactylis germplasm across northwest Europe over latitudinal and longitudinal distances of 3000 and 2500 km, respectively (Figure 1). Plants were collected from a broad range of habitats along east to west and north to south clines from Denmark, Germany, Ireland, Poland, Sweden and the UK. They were assessed for nuclear and plastome variation, ploidy and genetic/genepool structure. Seeds and living plants were also stored for ex-situ conservation. We demonstrate the utility of GBS [44] to study nuclear DNA variation within the collections and a long-read PCR and MiSeq DNA sequencing approach [45] to study plastome variation. The dual GBS/plastome sequencing approach proved highly informative for defining genepools for future breeding efforts in this versatile species.
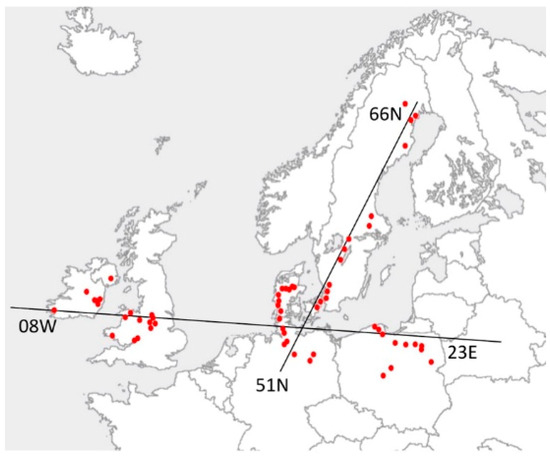
Figure 1.
Collection locations of Dactylis glomerata in northwest Europe. Plants were sampled across east to west (2500 km) and north to south (3000 km) clines.
2. Materials and Methods
2.1. Sample Collection, Ploidy Measurement and DNA Extraction
Samples of Dactylis glomerata were collected over broad latitudinal (51°37′41.92″ N to 65°59′58.04″ N) and longitudinal gradients (8°3′33.69” W to 23°11′13.20″ E) in Denmark, Germany, Ireland, Poland, Sweden and the United Kingdom (Table 1, Figure 1). Thirty accessions were collected from each of the ten locations per country. Seed, rhizomes and herbarium voucher specimens were collected and stored following Perderau et al. [46]. Not all plants were sequenced to determine nuclear and plastome variation because of time and money constraints. Thus, representative subsets of 88 plants, grown from rhizome, were sampled for GBS and 48 accessions for plastome sequencing (Table 1). DNA was extracted and quantified from fresh or dried leaf tissue following [46,47]. Flow cytometry was undertaken to determine ploidy using leaves from grown-up plants. Ploidy estimation involved comparison of the new Dactylis glomerata genotypes with samples of known tetraploidy (confirmed by standard Feulgen staining of mitotic root tip meristems following [48]) and visualisation using light microscopy at ×1000 magnification. Flow cytometry was undertaken using 4′,6-diamidino-2-phenylindole (DAPI) fluorochrome staining by Plant Cytometry Services, Netherlands [49] on 72 Dactylis genotypes and two Dactylis standards. Internal Vinca major controls were included and the resulting ratios of controls to samples used to determine ploidy in comparison to the Dactylis controls with known ploidy.

Table 1.
Dactylis glomerata collected for ex-situ conservation and used in the study.
2.2. Genotyping by Sequencing (GBS)
Firstly, 100–200 ng of genomic DNA per sample were digested for 2 h at 37 °C with 2 units each of MspI and PstI-HF(NEB) and 1× Cutsmart buffer in a final volume of 20 µL, followed by heat inactivation incubation at 80 °C for 20 min. ddRAD library construction involved: (a) ligation: 10 µL of each restriction digest were mixed on ice with 1.5 µL of one of the 96 inline-barcoded forward PstI adaptors (pre-hybridized, concentration 1 pM µL−1), followed by addition of 20 µL of ligation master mix (15 µL NEB Quick ligation buffer, 0.4 µL NEB Quick ligase, 5 pM pre-hybridized common reverse MspI adaptor) and incubated at room temperature for 1 h with subsequent heat inactivation at 65 °C for 10 min; (b) library purification: reactions were all diluted with 30 µL Tris-EDTA (TE; 50 mM EDTA, 10 mM Tris/HCl, pH 8.0) and mixed with 50 µL Agencourt XP beads, incubated for 10 min (room temperature) and put on a magnet for 5 min to collect the beads. The supernatant was discarded, and beads washed twice with 200 µL 80% ethanol before being air dried for 10 min. Libraries were then eluted in 20 µL Tris buffer (5 mM Tris/HCl pH 9); (c) library amplification: 10 µL of each of the 96 libraries were separately amplified in 20 µL PCR reactions with 14 cycles using standard Illumina TrueSeq amplification primers and MyTaq (Bioline, London, UK) polymerase.
A total of 5 µL of each of the 96 amplified libraries were then combined. Small amplicons and PCR primer were removed by Agencourt XP bead purification using one volume of beads. The PCR polymerase was removed during purification on Qiagen MinElute columns. The pooled library was eluted in 20 µL of Tris buffer (5 mM TrisHCl pH 9). Normalization was done using a Trimmer Kit (Evrogen), and 1 µg in 12 µL of the pooled ddRAD library was combined with 4 µL 4× hybridization buffer, denatured at 98 °C for 3 min and incubated at 68 °C for 5 h to permit re-association of DNA. Then, 20 µL of 2× duplex-specific nuclease (DSN) master buffer was added, and the samples were incubated for 10 min at 68 °C. One unit of DSN enzyme (1 U µL−1) was added and the reaction was incubated for another 30 min. Reactions were terminated by the addition of 20 µL DSN stop solution, purified on a Qiagen MinElute column and eluted in 10 µL Tris buffer (5 mM TrisHCl pH 9). Reamplification of normalized libraries: 10 µL of the purified normalization reaction was reamplified in 5× 30 µL reactions using standard Illumina TrueSeq amplification primers and MyTaq (Bioline) polymerase. Cycle number was restricted to 15. Size selection: a low melting point agarose gel was used for size selection of the ddRAD library, removing fragments larger than 400 bp and smaller than 200 bp.
2.3. Plastome Sequencing via Long-Read PCR
The long-read PCR protocol and the primers followed that of Uribe-Convers et al. [45] and optimisation parameters are given in Table S1. Initially, all plastome sections (coded 1 to 16) described in Uribe-Convers et al. [45] were amplified on four samples of Dactylis glomerata but sections 2, 5, 11 and 14 were omitted because of poor amplification. The other sections were all well-amplified, with or without optimisation, in the 48 samples. PCR purification, quantification, Illumina Nextera XT library preparation (Illumina, San Diego, CA, USA), multiplexing with Illumina MiSeq Reagent Nano kit v.3 and sequencing followed Perdereau et al. [46].
2.4. Data Analyses
Quality control of the raw GBS sequence reads for all samples was undertaken using BBduk [50] and used to trim low quality bases with less than a Phred score of 20 from the 3′ end of sequence read pairs, to remove adaptor contamination and also remove read pairs containing ambiguous bases. Stacks [51] was used to profile genetic markers adjacent to restriction enzyme sites. Data from each sample were grouped into loci using ustacks and polymorphic sites identified. A minimum of three reads was used to define a cluster. Cstacks was used to generate a catalogue of variant loci across all samples and the final allelic state at each polymorphic locus for all samples was determined using Sstacks. SNP calls were converted to variant call format (VCF) for downstream analysis. SNPRelate [52] was used to carry out principal component analysis (PCA) to examine relatedness between samples collected at various sites. SNPs were filtered to exclude variants missing in >20% of study samples and exclude variants with minor allele frequency <0.05. Linkage disequilibrium-based SNP pruning was used to remove SNPs in approximate linkage equilibrium. PCA was carried out using the snpgdsPCA function in SNPRelate and visualised using the ggplot2 R library [53].
The plastome MiSeq data was analysed, cleaned and assembled against a reference genome of Lolium perenne L. (GenBank accession no. NC009950; [54]) using the Galaxy public online server [55,56,57] following Perdereau et al. [46]. MPileup [58] was used to call insertions/deletions (INDELs) and SNPs and they were visually checked on IGV v2.3 [59] and then filtered, with a minimum coverage depth of 5, using the SnpSift filter tool [60]. Finally, the individual files were combined and re-filtered (maximum-likelihood estimate of the first alternative allele frequency, AF1=1) before transfer to Microsoft Excel. The software STRUCTURE v2.3.4. [61,62] was applied to investigate the genetic structure of the samples using an admixture model following Perdereau et al. [46]. The ΔK statistic [63], implemented in Structure Harvester [64], was used to determine the optimal value of K. An alternative cluster number was compared but we have no a priori evidence to accept any of these. For example, K = 5, based on rough geographical proximity of groups, did not markedly change the interpretation (Figure S2). The principal coordinate analysis (PCA) was performed in GenAlEx version 6.5 [65].
3. Results
3.1. Ploidy of Dactylis Glomerata
All Dactylis plants subjected to flow cytometry were found to be tetraploid but some variation existed in genome size (Table S2). The DNA content ratios for the known tetraploid plants relative to the internal control were 1.29 and 1.32 and ranged from 1.25 to 1.45 for the other 72 Dactylis samples included for flow cytometry analysis.
3.2. GBS Analysis
The GBS analysis generated a total of 10,744 SNPs across all genotypes (at a frequency of at least 5% in the samples). Total number of SNPs, in at least 5% of the samples, are shown in Figure 2a from a total number of ca. 13,000 SNPs per country sample assayed (Figure 2b). Number of private SNPs per individual ranged from ca. 200 to nearly 4000 and had a median ranging from approximately 1200 in the UK to 2000 in Poland (Figure 2c). PCA was used to assess clustering of genotypes based on the GBS SNPs. Genetic clusters loosely reflected geographic groupings based on country of origin (Figure 3). Axis one represents 5.38% of the variation and axis two, 2.08% of the variation. There was a large degree of overlap among regions, but geographic clusters can be identified, and they match the geographic space with Ireland and the UK in the left of the PCA, Germany and Denmark in the centre and Poland and Sweden in the right (with Poland and Sweden clearly separating on the second axis of the PCA). Adjustment/modelling for tetraploidy was not undertaken because our GBS read depth was not sufficient for a reliable assessment of allele copy numbers of sequence variants in autotetraploids [66].
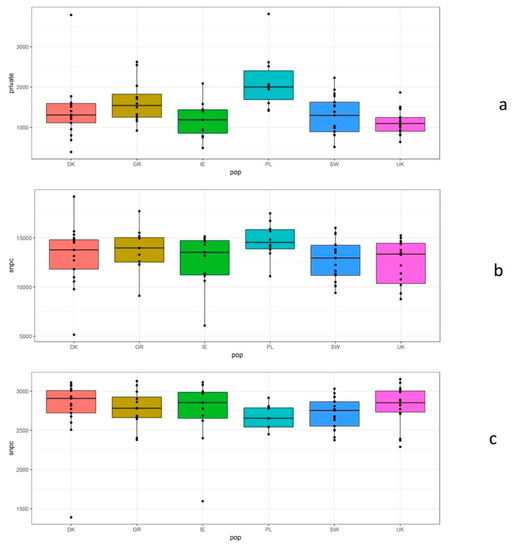
Figure 2.
Summary of GBS SNP data grouped by geographic region. (a) Number of SNPs with greater than 5% frequency, (b) total number of SNPs, (c) private SNPs.
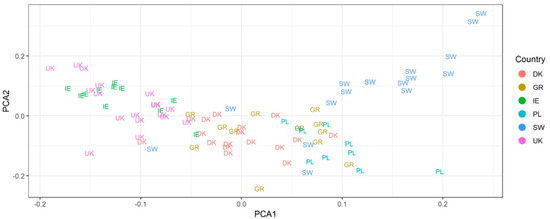
Figure 3.
Principal coordinate analysis (PCA) analysis of Dactylis glomerata GBS data. Samples from different countries overlap but clustering of genotypes relative to geography is evident with Ireland and the UK on the left, Germany and Denmark central and Poland and Sweden on the right (and also split on axis 2).
3.3. Plastome Analysis
With as few as ten long-read PCR reactions per plant it was possible to amplify and sequence ca. two thirds of the plastome (Table 2). A total of 8,966,825 out of 9,283,503 MiSeq reads passed the filter. A total of 98% of the reads were assigned to an individual, for an average of 182,606 reads per individual. An excellent level of per base sequence quality was determined in the FastQC reports and the MiSeq reads were therefore not trimmed. Over 88% of the reads passed the high stringency filter (7,789,626 reads). Reads were assembled against the Lolium reference genome and on average, 62% of the genome (83,834 bp) was aligned (ranging from 54,465 bp to 103,541 bp, Table 2). The resulting assemblies had an average depth of coverage of 105× (minimum 23×; maximum: 193×). The sequences were deposited in GenBank with the Bioproject SRA accession number SRP066566.
Table 2.
Mapped length of Dactylis plastome sequenced.
Over 93% of the SNPs passed the filter equalling 1446 SNPs among the Dactylis plants (Table 3), with a mean of 17 SNPs per kbp. A mean of 8.7 SNPs/kbp were found in the coding regions and SNP content per gene was highly variable ranging from zero in ndhJ, psbN, and rrn16 to 98 in ndhA. PCA was undertaken to examine genotype similarity, to determine plastid gene pools and investigate phylogeographic grouping of individuals. Axes 1 and 2 (Figure 4, PC1 and PC2) explained 14.2% and 5.6% of the variation, respectively. Despite these low percentages, not discrete geographic structures could be detected. Ireland and the UK genotypes group to the left of the plot and Sweden and some Poland samples to the right, with genotypes from Germany and Denmark closer to the middle. The same data was subject to structure analyses. It revealed eight clusters (Figure 5) with the ΔK statistic [63]. Membership of the genotypes to these clusters does not correspond tightly to the country of origin (Figure 5 and Figure S2). However, the germplasm does split into one group with strong identity to cluster 1 (blue) that intergrades with the rest of the samples that have a diversity of membership to the other seven clusters (Figure 5 and Figure S2).
Table 3.
Plastome variation in Dactylis glomerata.
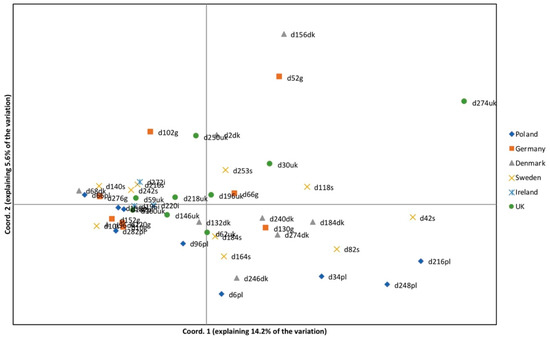
Figure 4.
PCA of the plastome data. Axis one accounts for 14.2% of the variation and axis two for 5.6% of the variation. Some weak pattern can be seen relating to the geographical origin of samples. For example, samples from Ireland and UK are more common in the central region of the plot and Polish samples are only found in the lower region of the plot.
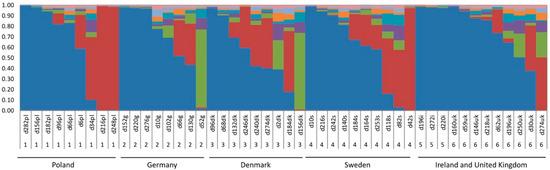
Figure 5.
Structure of Dactylis glomerata genotypes estimated using structure analysis of plastome SNPs. Each plant is shown as a vertical bar and SNP variation is partitioned into coloured segments that show the individual’s estimated membership fractions in each of the K = 8 clusters, determined as optimal by the ΔK statistic [63]. Samples are arranged according to geographic location (1 = Poland, 2 = Germany, 3 = Denmark, 4 = Sweden, 5 = Ireland, 6 = UK). Alternative values of K were tested but did not clarify groups any more than the optimal value of eight. An alternative plot with K = 5 is shown in Figure S5 as an example.
4. Discussion
4.1. Genetic Diversity
GBS has proven to be a highly effective genotyping tool in Dactylis glomerata, detecting a high number of SNPs (median total of 13,000 per country sample; or about 2700 SNPs per country at a frequency of 5% or higher). There was also a high number of private SNPs per country (average of approximately 1200 to 2000 per country sample). Poland had the greatest number of private SNPs and the pattern could be related to sampling as Poland includes samples from both oceanic and continental Europe. Germany had the second highest value of private SNPs and also contained a mixture of oceanic and continental locations. The SNP markers can be easily transferred among laboratories, unlike many of the other markers systems developed for Dactylis (see Introduction). Nuclear SNP markers have also been used for D. glomerata by Bushman et al. [39] using GBS to discover SNPs in autotetraploid plants and generate a genetic linkage map for QTL analysis. Zhao et al. [40] used a related genotyping approach called SLAF-seq to generate over 440,000 markers for high-density genetic linkage map construction and identification of flowering time QTL, and Zeng et al. [37] used it for association mapping of rust traits. However, none of these studies assessed genome variation or genetic variation/gene pools at a broad geographic scale like we have done here for NW Europe.
We chose to apply a long-read PCR based method of plastid DNA isolation prior to sequencing with MiSeq with the ‘universal’ primers described in Uribe-Convers et al. [45] for dicots. A number of other methods exist for plastome sequencing [54,67] but we have shown that the long-read PCR method offers a highly reliable and effective way of sequencing the plastome in grasses because, for example, our results with Phalaris arundinacea [46] and Dactylis glomerata (this study) found that over 88% of reads passed the high stringency filter.
An average of 61.97% (83,834 bp) of the reads was aligned to the reference genome for each plant sample (Table 2) with a range of 40.26% to 76.54%. A complete D. glomerata plastome has not been published so we aligned our sequences to the Lolium perenne plastid genome of Diekmann et al. [54] which is a closely related grass species of the tribe Poeae [68]. It is noteworthy that we have sequenced up to 90.91% of the Dactylis plastome in this paper. Such plastome data will be valuable for future comparative genomic projects and we have also provided plastome data for many genotypes across a broad geographic range. Our results also show that it is not necessary to sequence the entire plastome of each Dactylis glomerata individual because high variability was recorded in the partial plastomes sequenced here (ca. 62% of the genome) from 48 sampled European plants. Each of the plastid DNA loci would be expected to provide a similar phylogeographic signal because they are linked and found on the same maternally inherited chromosome. However, mutation rates and selection rates vary and we found SNP incidence to be high and heterogeneous among genes (Table 3). Sample field collection aimed to discover maximum variation of Dactylis and included a broad range of habitats over a latitudinal distance of 3000 km and a longitudinal distance of 2500 km including Poland, Germany, Denmark, Sweden, Ireland and the United Kingdom (Figure 1; Table 1). The results of our plastome analysis show that a high diversity of plastid types exist in our genetic resource collection.
High plastome diversity has also been recorded in other plants [69] and other grasses including Lolium perenne using nuclear SSR markers by McGrath et al. [42] and Phalaris arundinacea by Perdereau et al. [46] using plastome sequencing. Both of these forages are outbreeding, and wind pollinated species like Dactylis but differ in their ecological niche. We discovered high variability in genic as well as non-genic plastome regions. The adaptive significance of these variants in the wild is unknown but it is clear that plastid genepool diversity is high in our collection and that this variability could be of value to plant breeders. The plastomes will not always mirror patterns of nuclear DNA variability because of lower mutation rates, uniparental inheritance and plastid introgression [46,70,71,72]. However, our studies of nuclear SNPs using GBS also reveal high levels of genetic diversity within Dactylis.
4.2. Geographical Differentiation
The PCA analysis of the GBS data (Figure 3) showed geographic structuring of Dactylis glomerata according to the country of origin. Groupings can be seen in the PC (principal component) 1 vs. PC2 plot (Figure 3). However, there is a large degree of overlap among country groups in this ordination space indicating a relatively high degree of gene flow via pollen and seed. The samples from the eastern and northeastern regions of the sample range (Poland and Sweden) are clustered to the right side of the plot (and also separated from each other on PC2; lower and upper, respectively) and the western samples from Ireland and the UK are positioned towards the left of the plot. Samples from Germany and Denmark are positioned in the middle. Structuring is generally more evident across an east to west than north to south cline. This could be due to the high proportion of more northern samples that had an oceanic climate (Denmark, Ireland, Sweden, UK) rather than a more continental climate (eastern Germany and Poland). This could also be partly explained by a data gap from southern to northern Sweden.
The PCA of the plastome data (Figure 4) shows some geographic structure although it is not clear. The lack of strong geographic structuring is also evident in the structure analysis (Figure 5 and Figure S5). Dactylis is a wind pollinated, outbreeding species with a gametophytic self-incompatibility system [73] and thus dilution of genetic structuring relative to geographical proximity was expected. Dactylis also has good seed dispersal ability and is widely planted throughout Europe from seed as a forage species [9]. Maternally inherited plastid markers are useful for tracing seed mediated geneflow and we propose that the weak geographic structure in the plastome data could be influenced by seed planting. It is possible that many of our genotypes have been inadvertently or intentionally moved by human activity. We collected samples with no known history of cultivation but do not know if we have sampled commercial cultivars or material introgressed via wild plant/cultivar hybridization. In a different study on another potential biomass and bioenergy grass, Phalaris arundinacea, sampled across the same geographical range, we found more genetic structure relating to geographical location in the plastome dataset [46] possibly due to the lower level of planting and human mediated seed movement in that forage species. However, genetic structuring by geographical location was more evident in the nuclear GBS dataset suggesting that introgression of nuclear genes from local populations to any planted material is helping to maintain geographical genetic structure. Plastid markers do not introgress, but nuclear markers do, thus geneflow from native Dactylis will maintain a geographic signal where it is lost in the plastid genome.
All samples were recorded as tetraploid (Table S2) so polyploidy does not explain the structuring of genotypes that we determined. A range of ploidy was found in European D. glomerata but tetraploids are the most common. Our extensive and wide sampling of northwestern European material supports the hypothesis that tetraploidy is the dominant type. Cytologically, Dactylis is known to form a polyploid complex. Diploid (2n = 2x = 14), tetraploid (2n = 4x = 28) and hexaploids (2n = 6x = 42) were recorded in Europe and Africa [24,26] and triploid (2n = 3x = 21) and pentaploid cytotypes were recorded in Israel [25]. Tetraploids have arisen via autopolyploidy and triploids/pentaploids via autopolyploidy and allopolyploidy of diploid, triploid and tetraploid types [25]. Diploid cytotypes are sometimes recognized as different taxa but intergrade with tetraploid forms on morphological differences, chromosome number, ecology and geography [9]. The flow cytometry results do indicate some variation in genome size. We do not know the cause of this variation, but previous studies indicate it could be due to the presence of aneuploids and other meiotic irregularities [26,74] or genome size variation with altitude [30]. Indeed, Dactylis glomerata is not cytogenetically stable and quadrivalents are frequent at meiosis [75] leading to aneuploidy. We have not counted the chromosomes in our material, but aneuploidy is a likely cause of the nuclear DNA content variation witnessed.
5. Conclusions
Both nuclear GBS and plastome SNP variation is high in northwestern Europe and plants show broad scale genetic structuring corresponding to their country of origin, despite the common dispersal of its seed for forage and its wind pollinated allogamous breeding system. Our analyses define groupings of Dactylis glomerata for genetic resource characterization and have characterised valuable material for future breeding. None of the genetic variation could be explained by ploidy because all sampled plants were found to be tetraploid. The sequence data is available for future comparisons and analyses and it would be useful to extend the sampling to southern and eastern Europe and include selected diploid individuals for comparison.
Supplementary Materials
The following are available online at https://www.mdpi.com/2073-4395/9/7/342/s1, Figure S1: Optimal value of K determined by the ΔK statistic using Structure Harvester. Eight clusters were determined as optimal, Figure S2: Structure of Dactylis glomerata genotypes estimated using structure analysis of plastome SNPs with K = 5 instead of the optimal value of K = 8. The K = 8 plot is presented in the main text. Each plant is shown as a vertical bar and SNP variation is partitioned into coloured segments that show the individual’s estimated membership fractions in each of the K = 5 clusters. K = 8 was determined as optimal by the ΔK statistic. Alternative cluster numbers were compared but we have no a priori evidence to accept any of these nor do they alter our interpretation of the results based on the optimal value of K = 8. We present K = 5 here as an example of results with an alternative K value. K = 5 was chosen a priori, instead of other alternative K values (e.g., 2, 3, 4, 6, 7), based on the artificial but rough geographical proximity of groups (national boundaries). Samples are arranged in the plot according to geographic location (1 = Poland, 2 = Germany, 3 = Denmark, 4 = Sweden, and 5 = Ireland, 6 = UK combined; total K = 5). Table S1: Long-read PCR parameters for each primer pair, Table S2: Flow cytometry and ploidy determination results for Dactylis glomerate.
Author Contributions
Conceptualization, T.R.H. and S.B.; data curation, A.P. and M.K.; formal analysis, A.P., M.K. and P.C.; writing—original draft, T.R.H. and A.P.; writing—review and editing, S.B.
Funding
This research was supported by EU FP7 KBBE.2011.3.1-02, grant number 289461 (GrassMargins) and the APC was funded by an agreement with the Journal Agronomy.
Acknowledgments
We thank Ruby Prickett for collecting some Dactylis plant material in Ireland. We also thank Valeria Mattiangeli, Smurfit Institute of Genetics, Trinity College Dublin, The University of Dublin and Elaine Kenny, Trinity Genome Sequencing Laboratory, Dublin, Ireland for help with the plastome sequencing work.
Conflicts of Interest
The authors declare no conflict of interest.
References
- GPWGII. New grass phylogeny resolves deep evolutionary relationships and discovers C4 origins. New Phytol. 2012, 193, 304–312. [Google Scholar] [CrossRef] [PubMed]
- Hodkinson, T.R. Evolution and taxonomy of the grasses (Poaceae): A model family for the study of species-rich groups. Annu. Plant Rev. Online 2018, 1, 1–39. [Google Scholar] [CrossRef]
- Hodkinson, T.R.; Savolainen, V.; Jacobs, S.W.L.; Bouchenak-Khelladi, Y.; Kinney, M.S.; Salamin, N. Supersizing: Progress in documenting and understanding grass species richness. In Reconstructing the Tree of Life. Taxonomy and Systematics of Species Rich Taxa; Hodkinson, T.R., Parnell, J.A.N., Eds.; CRC Press: Boca Raton, FL, USA, 2006; pp. 276–290. [Google Scholar]
- Stewart, A.V.; Ellison, N.W. Dactylis. In Wild Crop Relatives: Genomic and Breeding Resources; Kole, C., Ed.; Springer: Berlin/Heidelberg, Germany, 2011; pp. 73–87. [Google Scholar]
- Jones, M.B.; Finnan, J.; Hodkinson, T.R. Morphological and physiological traits for higher biomass production in perennial rhizomatous grasses grown on marginal land. GCB Bioenergy 2015, 7, 375–385. [Google Scholar] [CrossRef]
- Borrill, M. Evolution and Genetic Resources in Cocksfoot; Annual Report Welsh Plant Breeding Station; Welsh Plant Breeding Station: Aberystwyth, Wales, 1977; pp. 190–209. [Google Scholar]
- Stebbins, G.L. Cytogenetic and evolutionary studies in the genus Dactylis. I. Morphology, distribution and inter-relationships of the diploid subspecies. Univ. Calif. Publ. Bot. 1959, 31, 1–40. [Google Scholar]
- Casler, M.D.; Fales, S.L.; McElroy, A.R.; Hall, M.H.; Hoffman, L.D.; Leath, K.T. Genetic progress from 40 years of orchardgrass breeding in North America measured under hay management. Crop Sci. 2000, 40, 1019–1025. [Google Scholar] [CrossRef]
- Cope, T.; Gray, A. Grasses of the British Isles; B.S.B.I. Handbook No. 13; Botanical Society of the British Isles: London, UK, 2009. [Google Scholar]
- Preston, C.D.; Hill, M.O. The geographical relationships of British and Irish vascular plants. Bot. J. Linn. Soc. 2008, 124, 1–120. [Google Scholar] [CrossRef]
- Barney, J.N.; DiTomaso, J.M. Global climate niche estimates for bioenergy crops and invasive species of agronomic origin: Potential problems and opportunities. PLoS ONE 2011, 6, e17222. [Google Scholar] [CrossRef] [PubMed]
- Finn, J.A.; Kirwan, L.; Connolly, J.; Sebastià, M.T.; Helgadottir, A.; Baadshaug, O.H.; Bélanger, G.; Black, A.; Brophy, C.; Collins, R.P.; et al. Ecosystem function enhanced by combining four functional types of plant species in intensively managed grassland mixtures: A 3-year continental-scale field experiment. J. Appl. Ecol. 2013, 50, 365–375. [Google Scholar] [CrossRef]
- Lewandowski, I.; Scurlock, J.M.O.; Lindvall, E.; Christou, M. The development and current status of perennial rhizomatous grasses as energy crops in the US and Europe. Biomass Bioenergy 2003, 25, 335–361. [Google Scholar] [CrossRef]
- Estendorfer, J.; Stempfhuber, B.; Haury, P.; Vestergaard, G.; Rillig, M.C.; Joshi, J.; Schröder, P.; Schloter, M. The influence of land use intensity on the plant-associated microbiome of Dactylis glomerata L. Front. Plant Sci. 2017, 8, 930. [Google Scholar] [CrossRef]
- Nijsen, M.; Smeets, E.; Stehfest, E.; Vuuren, D.P. An evaluation of the global potential of bioenergy production on degraded lands. GCB Bioenergy 2011, 4, 130–147. [Google Scholar] [CrossRef]
- Stewart, A.V.; Ellison, N.W. A molecular phylogenetic framework for cocksfoot (Dactylis glomerata L.) improvement. Crop Pasture Sci. 2014, 65, 780–786. [Google Scholar] [CrossRef]
- Hodkinson, T.R.; Klaas, M.; Jones, M.B.; Prickett, R.; Barth, S. Miscanthus: A case study for the utilization of natural genetic variation. Plant Genet. Resour. 2015, 13, 219–237. [Google Scholar] [CrossRef]
- Mårtensson, L.-M.; Carlsson, G.; Prade, T.; Kørup, K.; Lærke, P.E.; Jensen, E.S. Water use efficiency and shoot biomass production under water limitation is negatively correlated to the discrimination against 13C in the C3 grasses Dactylis glomerata, Festuca arundinacea and Phalaris arundinacea. Plant Physiol. Biochem. 2017, 113, 1–5. [Google Scholar] [CrossRef] [PubMed]
- Hodkinson, T.R.; Chase, M.W.; Renvoize, S.A. Genetic resources of Miscanthus. Asp. Appl. Biol. 2001, 65, 239–248. [Google Scholar]
- Humphreys, M.W.; Yadav, R.S.; Cairns, A.J.; Turner, L.B.; Humphreys, J.; Skøt, L. A changing climate for grassland research. New Phytol. 2006, 169, 9–26. [Google Scholar] [CrossRef] [PubMed]
- Stewart, A.V.; Ellison, N.W.; Bushman, B.S. Dactylis and Phleum. In Genetics, Genomics and Breeding of Forage Crops; CRC Press: Boca Raton, FL, USA, 2013; p. 109. [Google Scholar]
- Kørup, K.; Laerke, P.E.; Baadsgaard, H.; Andersen, M.N.; Kristensen, K.; Münnich, C.; Didion, T.; Jensen, E.S.; Mårtensson, L.-M.; Jørgensen, U. Biomass production and water use efficiency in perennial grasses during and after drought stress. GCB Bioenergy 2017, 10, 12–27. [Google Scholar] [CrossRef]
- Amirouche, R.; Misset, M.-T. Hordein polymorphism in diploid and tetraploid Mediterranean populations of the Hordeum murinum L. complex. Plant Syst. Evol. 2003, 242, 83–99. [Google Scholar] [CrossRef]
- Last, L.; Widmer, F.; Fjellstad, W.; Stoyanova, S.; Kölliker, R. Genetic diversity of natural orchardgrass (Dactylis glomerata L.) populations in three regions in Europe. BMC Genet. 2013, 14, 102. [Google Scholar] [CrossRef]
- Zohary, D.; Nur, U. Natural triploids in the orchard grass, Dactylis glomerata L., polyploid complex and their significance for gene flow from diploid to tetraploid levels. Evolution 1959, 13, 311–317. [Google Scholar] [CrossRef]
- Stebbins, G.L. Chromosomal Evolution in Higher Plants; University Park Press: New York, NY, USA, 1971. [Google Scholar]
- Lumaret, R.; Barrientos, E. Phylogenetic relationships and gene flow between sympatric diploid and tetraploid plants of Dactylis glomerata (Gramineae). Plant Syst. Evol. 1990, 169, 81–96. [Google Scholar] [CrossRef]
- Lindner, R.; Garcia, A. Genetic differences between natural populations of diploid and tetraploid Dactylis glomerata ssp. izcoi. Grass Forage Sci. 2008, 52, 291–297. [Google Scholar] [CrossRef]
- Zhao, Y.F.; Zhang, X.Q.; Ma, X.; Xie, W.G.; Huang, L.K. Morphological and genetic characteristics of hybrid combinations of Dactylis glomerata. Genet. Mol. Res. 2014, 13, 2491–2503. [Google Scholar] [CrossRef] [PubMed]
- Reeves, G.; Francis, D.; Davies, M.S.; Rogers, H.J.; Hodkinson, T.R. Genome size is negatively correlated with altitude in natural populations of Dactylis glomerata. Ann. Bot. 1998, 82, 99–105. [Google Scholar] [CrossRef]
- Lumaret, R. Protein variation in diploid and tetraploid orchard grass (Dactylis glomerata L.): Formal genetics and population polymorphism of peroxidases and malate dehydrogenases. Genetica 1982, 57, 207–215. [Google Scholar] [CrossRef]
- Bushman, B.S.; Larson, S.R.; Tuna, M.; West, M.S.; Hernandez, A.G.; Vullaganti, D.; Gong, G.; Robins, J.G.; Jensen, K.B.; Thimmapuram, J. Orchardgrass (Dactylis glomerata L.) EST and SSR marker development, annotation, and transferability. Theor. Appl. Genet. 2011, 123, 119–129. [Google Scholar] [CrossRef]
- Xie, W.G.; Lu, X.F.; Zhang, X.Q.; Huang, L.K.; Cheng, L. Genetic variation and comparison of orchardgrass (Dactylis glomerata L.) cultivars and wild accessions as revealed by SSR markers. Genet. Mol. Res. 2012, 11, 425–433. [Google Scholar] [CrossRef]
- Jiang, L.; Zhang, X.; Ma, X.; Huang, L.; Xie, W.; Ma, Y. (Dactylis glomerata L.) cultivars by using simple sequence repeat markers. Genet. Mol. Res. 2013, 12, 5111–5123. [Google Scholar] [CrossRef]
- Madesis, P.; Abraham, E.M.; Kalivas, A.; Ganopoulos, I.; Tsaftaris, A. Genetic diversity and structure of natural Dactylis glomerata L. populations revealed by morphological and microsatellite-based (SSR/ISSR) markers. Genet. Mol. Res. 2014, 13, 4226–4240. [Google Scholar] [CrossRef]
- Jiang, L.F.; Qi, X.; Zhang, X.Q.; Huang, L.K.; Ma, X.; Xie, W.G. Analysis of diversity and relationships among orchardgrass (Dactylis glomerata L.) accessions using start codon-targeted markers. Genet. Mol. Res. 2014, 13, 4406–4418. [Google Scholar] [CrossRef]
- Zeng, B.; Huang, X.; Huang, L.K.; Zhang, J.; Yan, H.D.; Luo, D.; Liang, H.; Yuan, Y. Optimization of SCoT-PCR reaction system in Dactylis glomerata by orthogonal design. Genet. Mol. Res. 2015, 14, 3052–3061. [Google Scholar] [CrossRef] [PubMed]
- Costa, R.; Pereira, G.; Garrido, I.; Tavares-De-Sousa, M.M.; Espinosa, F. Comparison of RAPD, ISSR, and AFLP molecular markers to reveal and classify orchardgrass (Dactylis glomerata L.) germplasm variations. PLoS ONE 2016, 11, e0152972. [Google Scholar] [CrossRef] [PubMed]
- Bushman, B.S.; Robbins, M.D.; Larson, S.E.; Staub, J.E. Genotyping by Sequencing in Autotetraploid Cocksfoot (Dactylis glomerata) without a Reference Genome BT—Breeding in a World of Scarcity; Roldán-Ruiz, I., Baert, J., Reheul, D., Eds.; Springer International Publishing: Cham, Switzerland, 2016; pp. 133–137. [Google Scholar]
- Zhao, X.; Huang, L.; Zhang, X.; Wang, J.; Yan, D.; Li, J.; Tang, L.; Li, X.; Shi, T. Construction of high-density genetic linkage map and identification of flowering-time QTLs in orchardgrass using SSRs and SLAF-seq. Sci. Rep. 2016, 6, 29345. [Google Scholar] [CrossRef] [PubMed]
- Zeng, B.; Yan, H.; Liu, X.; Zang, W.; Zhang, A.; Zhou, S.; Huang, L.; Liu, J. Research open access genome-wide association study of rust traits in orchardgrass using SLAF-seq technology. Hereditas 2017, 154, 1–8. [Google Scholar] [CrossRef][Green Version]
- McGrath, S.; Hodkinson, T.R.; Barth, S. Extremely high cytoplasmic diversity in natural and breeding populations of Lolium (Poaceae). Heredity 2007, 99, 531–544. [Google Scholar] [CrossRef] [PubMed][Green Version]
- Diekmann, K.; Hodkinson, T.R.; Wolfe, K.H.; van den Bekerom, R.; Dix, P.J.; Barth, S. The Complete Chloroplast Genome Sequence of Perennial Ryegrass (Lolium perenne L.) Reveals Useful Polymorphisms Among European Ecotypes. In Sustainable Use of Genetic Diversity in Forage and Turf Breeding; Springer: Dordrecht, The Netherlands, 2010; pp. 409–413. [Google Scholar]
- Elshire, R.J.; Glaubitz, J.C.; Sun, Q.; Poland, J.A.; Kawamoto, K.; Buckler, E.S.; Mitchell, S.E. A robust, simple genotyping-by-sequencing (GBS) approach for high diversity species. PLoS ONE 2011, 6, e19379. [Google Scholar] [CrossRef] [PubMed]
- Uribe-Convers, S.; Duke, J.R.; Moore, M.J.; Tank, D.C. A long PCR–based approach for DNA enrichment prior to next-generation sequencing for systematic studies. Appl. Plant Sci. 2014, 2, 1300063. [Google Scholar] [CrossRef] [PubMed]
- Perdereau, A.; Klaas, M.; Barth, S.; Hodkinson, T.R. Plastid genome sequencing reveals biogeographical structure and extensive population genetic variation in wild populations of Phalaris arundinacea L. in north-western Europe. GCB Bioenergy 2017, 9, 46–56. [Google Scholar] [CrossRef]
- Hodkinson, T.R.; Waldren, S.; Parnell, J.A.N.; Kelleher, C.T.; Salamin, K.; Salamin, N. DNA banking for plant breeding, biotechnology and biodiversity evaluation. J. Plant Res. 2007, 120, 17–29. [Google Scholar] [CrossRef]
- Hodkinson, T.R.; Chase, M.W.; Takahashi, C.; Leitch, I.J.; Bennett, M.D.; Renvoize, S.A. The use of DNA sequencing (ITS and trnL-F), AFLP, and fluorescent in situ hybridization to study allopolyploid Miscanthus (Poaceae). Am. J. Bot. 2002, 89, 279–286. [Google Scholar] [CrossRef]
- Plant Cytometry Services. Available online: https://.plantcytometry.com (accessed on 21 May 2019).
- Sourceforge, BBMap. Available online: https://sourceforge.net/projects/bbmap/ (accessed on 21 May 2019).
- Catchen, J.; Hohenlohe, P.A.; Bassham, S.; Amores, A.; Cresko, W.A. Stacks: An analysis tool set for population genomics. Mol. Ecol. 2013, 22, 3124–3140. [Google Scholar] [CrossRef] [PubMed]
- Zheng, X.; Levine, D.; Shen, J.; Gogarten, S.M.; Laurie, C.; Weir, B.S. A high-performance computing toolset for relatedness and principal component analysis of SNP data. Bioinformatics 2012, 28, 3326–3328. [Google Scholar] [CrossRef] [PubMed]
- Wickham, H. Ggplot2: Elegant Graphics for Data Analysis; Springer: New York, NY, USA, 2009. [Google Scholar]
- Diekmann, K.; Hodkinson, T.R.; Wolfe, K.H.; van den Bekerom, R.; Dix, P.J.; Barth, S. Complete chloroplast genome sequence of a major allogamous forage species, perennial ryegrass (Lolium perenne L.). DNA Res. 2009, 16, 165–176. [Google Scholar] [CrossRef] [PubMed]
- Galaxy. Available online: http://usegalaxy.org/ (accessed on 21 May 2019).
- Giardine, B.; Riemer, C.; Hardison, R.C.; Burhans, R.; Elnitski, L.; Shah, P.; Zhang, Y.; Blankenberg, D.; Albert, I.; Taylor, J.; et al. Galaxy: A platform for interactive large-scale genome analysis. Genome Res. 2005, 15, 1451–1455. [Google Scholar] [CrossRef] [PubMed]
- Goecks, J.; Nekrutenko, A.; Taylor, J. Galaxy: A comprehensive approach for supporting accessible, reproducible, and transparent computational research in the life sciences. Genome Biol. 2010, 11, R86. [Google Scholar] [CrossRef] [PubMed]
- Li, H.; Handsaker, B.; Wysoker, A.; Fennell, T.; Ruan, J.; Homer, N.; Marth, G.; Abecasis, G.; Durbin, R.; 1000 Genome Project Data Processing Subgroup. The sequence alignment/map format and SAMtools. Bioinformatics 2009, 25, 2078–2079. [Google Scholar] [CrossRef] [PubMed]
- Integrative Genomics Viewer, v.2.3. Available online: https://software.broadinstitute.org/software/igv/download (accessed on 21 May 2019).
- Cingolani, P.; Patel, V.M.; Coon, M.; Nguyen, T.; Land, S.J.; Ruden, D.M.; Lu, X. Using Drosophila melanogaster as a model for genotoxic chemical mutational studies with a new program, SnpSift. Front. Genet. 2012, 3, 35. [Google Scholar] [CrossRef] [PubMed]
- Pritchard, J.K.; Stephens, M.; Donnelly, P. Inference of population structure using multilocus genotype data. Genetics 2000, 155, 945–959. [Google Scholar] [PubMed]
- Falush, D.; Stephens, M.; Pritchard, J.K. Inference of population structure using multilocus genotype data: Linked loci and correlated allele frequencies. Genetics 2003, 164, 1567–1587. [Google Scholar]
- Evanno, G.; Regnaut, S.; Goudet, J. Detecting the number of clusters of individuals using the software structure: A simulation study. Mol. Ecol. 2005, 14, 2611–2620. [Google Scholar] [CrossRef]
- Earl, D.A.; vonHoldt, B.M. Structure Harvester: A website and program for visualizing structure output and implementing the Evanno method. Conserv. Genet. Resour. 2012, 4, 359–361. [Google Scholar] [CrossRef]
- Peakall, R.; Smouse, P.E. GenAlEx 6.5: Genetic analysis in Excel. Population genetic software for teaching and research—An update. Bioinformatics 2012, 28, 2537–2539. [Google Scholar] [CrossRef]
- Uitdewilligen, J.G.; Wolters, A.M.; D’hoop, B.B.; Borm, T.J.; Visser, R.G.; van Eck, H.J. A next-generation sequencing method for genotyping-by-sequencing of highly heterozygous autotetraploid potato. PLoS ONE 2015, 8, e62355. [Google Scholar] [CrossRef]
- Stull, G.W.; Moore, M.J.; Mandala, V.S.; Douglas, N.A.; Kates, H.-R.; Qi, X.; Brockington, S.F.; Soltis, P.S.; Soltis, D.E.; Gitzendanner, M.A. A targeted enrichment strategy for massively parallel sequencing of angiosperm plastid genomes. Appl. Plant Sci. 2013, 1, 1200497. [Google Scholar] [CrossRef]
- Bouchenak-Khelladi, Y.; Salamin, N.; Savolainen, V.; Forest, F.; Van Der Bank, M.; Chase, M.W.; Hodkinson, T.R. Large multi-gene phylogenetic trees of the grasses (Poaceae): Progress towards complete tribal and generic level sampling. Mol. Phylogenet. Evol. 2008, 47, 488–505. [Google Scholar] [CrossRef]
- Perdereau, A.C.; Kelleher, C.T.; Douglas, G.C.; Hodkinson, T.R. High levels of gene flow and genetic diversity in Irish populations of Salix caprea L. inferred from chloroplast and nuclear SSR markers. BMC Plant Biol. 2014, 14, 202. [Google Scholar] [CrossRef]
- Hodkinson, T.; Renvoize, S.; Chase, M. Characterization of a genetic resource collection for Miscanthus (Saccharinae, Andropogoneae, Poaceae) using AFLP and ISSR PCR. Ann. Bot. 2002, 89, 627–636. [Google Scholar] [CrossRef]
- Salamin, N.; Hodkinson, T.R.; Savolainen, V. Towards building the tree of life: A simulation study for all angiosperm genera. Syst. Biol. 2005, 54, 183–196. [Google Scholar] [CrossRef]
- Teerawatananon, A.; Jacobs, S.W.L.; Hodkinson, T.R. Phylogenetics of Panicoideae (Poaceae) based on chloroplast and nuclear DNA sequences. Telopea 2011, 13, 115–142. [Google Scholar] [CrossRef]
- Lundqvist, A. Self-incompatibility in Dactylis glomerata L. Hereditas 1969, 61, 353–360. [Google Scholar] [CrossRef]
- Müntzing, A. Quadrivalent formation and aneuploidy in Dactylis glomerata L. Bot. Not. 1933, 84, 198–205. [Google Scholar]
- Müntzing, A. The effects of chromosomal variation in Dactylis. Hereditas 1937, 23, 113–235. [Google Scholar] [CrossRef]
© 2019 by the authors. Licensee MDPI, Basel, Switzerland. This article is an open access article distributed under the terms and conditions of the Creative Commons Attribution (CC BY) license (http://creativecommons.org/licenses/by/4.0/).