Article

ACC Deaminase Producing PGPR Bacillus amyloliquefaciens and Agrobacterium fabrum along with Biochar Improve Wheat Productivity under Drought Stress

1
Department of Soil Science, Faculty of Agricultural Sciences and Technology, Bahauddin Zakariya University, Multan 60800, Pakistan
2
Institute of Horticultural Sciences, Faculty of Agriculture, University of Agriculture, Faisalabad 38000, Pakistan
3
Department of Soil Science, University College of Agriculture & Environment Sciences, The Islamia University of Bahawalpur, Bahawalpur 63100, Pakistan
4
Department of Geography, University of Calgary, 2500 University Drive NW, Calgary, AB T2N 1N4, Canada
*
Author to whom correspondence should be addressed.
Agronomy 2019, 9(7), 343; https://doi.org/10.3390/agronomy9070343
Submission received: 16 June 2019 / Revised: 26 June 2019 / Accepted: 27 June 2019 / Published: 29 June 2019

Abstract

:
Drought stress retards wheat plant’s vegetative growth and physiological processes and results in low productivity. A stressed plant synthesizes ethylene which inhibits root elongation; however, the enzyme 1-Aminocyclopropane-1-Carboxylate (ACC) deaminase catabolizes ethylene produced under water stress. Therefore, the ACC deaminase producing plant growth promoting rhizobacteria (PGPR) can be used to enhance crop productivity under drought stress. Biochar (BC) is an organically active and potentially nutrient-rich amendment that, when applied to the soil, can increase pore volume, cation exchange capacity and nutrient retention and bioavailability. We conducted a field experiment to study the effect of drought tolerant, ACC deaminase producing PGPR (with and without timber waste BC) on plant growth and yield parameters under drought stress. Two PGPR strains, Agrobacterium fabrum or Bacillus amyloliquefaciens were applied individually and in combination with 30 Mg ha−1 BC under three levels of irrigation, i.e., recommended four irrigations (4I), three irrigations (3I) and two irrigations (2I). Combined application of B. amyloliquefaciens and 30 Mg ha−1 BC under 3I, significantly increased growth and yield traits of wheat: grain yield (36%), straw yield (50%), biological yield (40%). The same soil application under 2I resulted in greater increases in several of the growth and yield traits: grain yield (77%), straw yield (75%), above- and below-ground biomasses (77%), as compared to control; however, no significant increases in chlorophyll a, b or total, and photosynthetic rate and stomatal conductance in response to individual inoculation of a PGPR strain (without BC) were observed. Therefore, we suggest that the combined soil application of B. amyloliquefaciens and BC more effectively mitigates drought stress and improves wheat productivity as compared to any of the individual soil applications tested in this study.

1. Introduction

Wheat is a staple and cash crop globally recognized for its nutritional and economic importance [1,2]. Wheat grain (flour) constitutes 20% of daily human diet and contains protein (8–12%) and a high amount of carbohydrates (55%). Drought is a worldwide, most critical abiotic factor due to which sustainable wheat crop productivity is at risk [3,4,5]. Drought severity is predicted to successively increase under climate change scenarios of atmospheric and soil warmings and altered precipitation patterns [6,7,8,9,10,11]. Consistent and prolonged warming and drought conditions combined with associated abiotic and biotic changes [12] may drastically retard crop productivity and risk food security [13,14]. Drought stress reduces nutrient uptake, which can cause poor development of roots, low transpiration and photosynthetic rates, closure of leaf stomata and desiccation resulting in wilting of plants [15,16,17]. Like other abiotic stresses, the drought also stimulates stress ethylene synthesis through an elevated level of 1-Aminocyclopropane-1-carboxylic acid (ACC; an ethylene precursor) via the methionine pathway, in higher plants [18,19]. Accumulation of stress ethylene in-turn inhibits roots elongation and consequently, shoot growth in plants [20].
Water management strategies and genetic engineering are useful tools to adapt to or mitigate drought stress. While irrigation water is being managed in irrigation-dependent cropping systems, genetic engineering to cope with water stress remains limited. However, a vital biological approach to combat drought impacts is the soil inoculation of plant growth promoting rhizobacteria (PGPR). The PGPR are frequently reported to efficiently elongate plant roots in the pot [21,22] and mitigate drought impacts in field or greenhouse conditions [23,24], and mobilize the immobile nutrients that lead to significant increases in plant vegetative growth [25] and crop yield [26,27]. PGPR produces ACC deaminase enzyme, which catabolizes stress ethylene through cleavage of ACC into α-ketobutyrate and ammonium ion (NH4+) under drought stress, e.g., [28], thus reducing the level of stress ethylene [29,30].
Biochar (BC) is an organically active soil amendment with very high soil pore volume and cation exchange capacity and has been reported to reduce drought stress in plants [31,32,33,34]. Biochar is a nutrient-rich, black carbon soil amendment [35] that is produced through pyrolysis of waste feedstock at high temperature [36] under anaerobic or partially anaerobic condition [37,38,39].
While individual soil application of ACC-deaminase containing PGPR or BC has been frequently investigated for combating drought effects in pot experiments, controlled field experimentation for evaluation of cumulative mitigating effects remains limited. Therefore, the objective of this research was to observe the efficiency of combined application of ACC-deaminase producing PGPR and timber waste BC in granting resistance to field-scale wheat crop against drought impacts. We hypothesized that soil inoculation of drought-tolerant ACC-deaminase containing PGPR along with timber waste BC amendment would be a more efficient technique to mitigate adverse drought effects on wheat growth and yield traits.

2. Materials and Methods

We conducted this experiment in the research area of the Department of Soil Science, Bahauddin Zakariya University, Multan, Pakistan, in November 2016. A total of 54 same size plots (9 m2) were prepared and randomly divided into six triplicate treatments (T) (6 × 3 = 18) with each applied at three levels of irrigation (I), (i.e., 4I, 3I and 2I) following a randomized complete block design (RCBD; 18 × 3 = 54 plots). The experimental area was cropped with wheat and maize (rotation) during the last five years.
Recommended nitrogen (N), phosphorus (P) and potassium (K) fertilizers (RNPKF) were applied at the rates of 120, 60 and 60 kg ha−1 [40,41]. Full doses of P (as diammonium phosphate) and K (as sulphate of potash), and a 1/3rd dose of N were incorporated to topsoil at the seedbed preparation stage, and the remaining two splits of N were top-dressed after 30 and 60 days of seeding. We used standard crop management practices such as irrigation, fertilization, weeding, hoeing and plant protection to grow wheat crop during the study season. Timber-waster biochar (BC) was applied at a rate of 1.5%, i.e., 30 Mg ha−1. Treatments included: Control (No PGPR + No BC + RNPKF), A. fabrum, B. amyloliquefaciens, 30 Mg ha−1 BC, A. fabrum + 30 Mg ha−1 BC and B. amyloliquefaciens + 30 Mg ha−1 BC.
The two most competent drought-tolerant ACC-deaminase producing PGPR strains, Agrobacterium fabrum (NR_074266.1) and Bacillus amyloliquefaciens (FN597644.1), as documented by Danish and Zafar-ul-Hye [22], were provided from the collection of Soil and Environmental Microbiology Laboratory, Bahauddin Zakariya University Multan, Pakistan. Both strains were initially tested and found eligible to grow in Dworkin and Foster (DF) minimal salt medium at −0.78 Mpa osmotic potential, generated by 20% polyethylene glycol 6000 (PEG) [22]. For experimental purpose, DF minimal salt medium without agar was used to prepare inoculum of desired PGPR strains [42]. For measuring ACC-deaminase produced by PGPR strains (A. fabrum = 349.6 ± 21.4 and B. amyloliquefaciens = 313.2 ± 34.3 µmol α-ketobutyrate mg−1 protein h−1), we followed El-Tarabily [43]. Glickmann and Dessaux methods [44] was used for assessment of indole acetic acid with (A. fabrum = 58.8 ± 3.27 and B. amyloliquefaciens = 17.3 ± 2.34 µg/mL) and without 0.5 gL−1 L-tryptophan (A. fabrum = 2.43 ± 0.34 and B. amyloliquefaciens = 1.12 ± 0.60 µg/mL) using Salkowski reagent. Vazquez et al. [45] and Sheng and He [46] methodologies were followed for determination of P (A. fabrum = 16.2 ± 1.48 and B. amyloliquefaciens = 20.9 ± 2.48 µg/mL) and K solubilizing activities (A. fabrum = 26.7 ± 1.49 and B. amyloliquefaciens = 23.4 ± 1.92 µg/mL) [22].
Initially, timber waste was sun-dried and then pyrolyzed at 389 °C in a pyrolyzer for 80 min [22]. pH and ECe of BC were also assessed following Danish and Zafar-ul-Hye [22]. Biochar was digested with di-acid (HNO3: HClO4) mixture [47] for determination of total P using a UV-VIS spectrophotometer (Model 6305, Jenway, UK) at 430 nm wavelength following Tandon et al. [48]. For the development of colour, ammonium molybdate and ammonium metavanadate were used [49]. The K and sodium were determined on flame photometer (Model EEL 410, Watford, UK) [49]. For assessing nitrogen, H2SO4 digestion [49] was carried out, followed by Kjeldahl’s distillation [49]. Volatile matter and ash content of BC were measured by heating BC in a muffle furnace at 450 and 550 °C respectively. Fixed carbon was calculated following Ronsse et al. [50] (Table 1).
The hydrometer method was used for the textural class analysis of soil [51]. Using the United States Department of Agriculture triangle (USDA triangle), the textural class was assessed as “sandy clay loam”. The Walkley method [52] was used for the determination of soil organic matter. The following equation was used to calculate organic soil N:
Organic N (%) = Soil Organic Matter/20
Extractable soil P was determined by the Olsen and Sommers methodology [53]. The Chapman and Pratt [47] protocol was followed for the determination of extractable K. The physiochemical characteristics of soil are provided in Table 1.
Wheat seeds (Glaxay-2013) were purchased from the Government of Punjab certified seed dealer. Weak seeds were initially screened out manually. Seeds sterilization was done with sodium hypochlorite (5%). Finally, seeds were ethanol (95%) washed thrice, followed by three times sterilized distilled water washings [54]. For inoculation, 100 g of sterilized seeds were inoculated with 1 mL of PGPR inoculum having optical density 0.5 at 535 nm wavelength along with 10% sugar (glucose) solution. After sticking of inoculum and sugar solution uniformly [55], seeds were top dressed in BC. Before inoculation of seeds, the BC was sterilized for 20 min at 121 °C in an autoclave [56]. For the control treatment, seed top dressing was also done with BC along with 10% sugar solution [57].
In each of the 18 plots (9 m2), six rows of seeds were sown using the drill method. Four irrigations were applied according to the production technology of wheat recommended and published by the Directorate of Agricultural Information Punjab [58]. There was no precipitation event during the study period, therefore, no precipitation-induced soil moisture variations were monitored. To create a mild drought, three irrigations were applied (one irrigation was skipped at the tillering stage). However, severer drought stress was induced by using two irrigations (two irrigations were skipped; one at the tillering stage and other at the milky stage). The irrigation schedule was:
  • 1st = 25 days after sowing (Crown root Initiation)
  • 2nd = 55 days after sowing (Tillering stage)
  • 3rd = 80 days after sowing (Heading stage)
  • 4th = 110 days after sowing (Milky stage/soft dough)
After 65 days of sowing (vegetative phase), we collected vegetative samples from four random spots in each plot for the determination of chlorophyll contents, gas exchange attributes, electrolyte leakage and nutrient concentrations in the shoot. At the vegetative phase, samples were collected only from 4I (control) and 3I (mild drought) treatments (no 2I (severe drought) treatment was available at this point of time). Skipping one irrigation created mild drought treatment as compared to skipping two irrigations (2nd and 4th) which created severe drought treatment. The drought and control treatments were sampled at maturity point of time for estimating yield attributes.
We followed Kumar et al. [59] for root sampling and Newman [60] for root length measurement at 120 days after seeding. Briefly, an augar of 10 cm internal diameter was used and the core samples were taken at 10 cm depth intervals to a total depth of 90 cm. Random sampling locations within each plot included sampling at row and midway between rows for collecting four, 90 cm depth samples. Soil/root cores were placed on a 32 cm mesh screen and gently washed in water [59]. Root length was measured by the line intercept technique of Newman [59,60]. For yield attributes and grain analyses, harvesting was done at the time of maturity when soil and plants were fully dried. The plant height, spike length, grains spike−1, spikelets spike−1, 1000-grains weight, grains yield, straw yield and biological yield (aboveground + root biomass) data were collected at the time of maturity (approx. 140 days).
Leaf samples were digested in sulfuric acid for analysis of nitrogen on Kjeldahl’s distillation apparatus [49]. Leaf P concentration was determined using the yellow colour development method and spectrophotometric absorbance at 420 nm [49]. Total K concentration in shoot and grain were found out by digesting the samples in di-acid (HNO3-HClO4) mixture [49] and using a flamephotometer (Model EEL 410, Watford, UK).
CI-340 Photosynthesis system (Bio Science Inc., WA, USA), Infra-Red Gas Analyzer (IRGA–EGM-4, PP Systems, USA) was used for assessment of net transpiration rate, stomatal conductance and photosynthetic rate [61]. On a sunny day, all readings were taken at a saturating intensity of light between 10:17 and 11:56 AM [62].
For the determination of photosynthetic pigments, the methodology of Arnon [63] was followed. Leaf samples were initially ground in a mortar by adding acetone (80%) solution. After that, absorbance was taken on a spectrophotometer at 645 and 663 nm wavelengths. Final chlorophyll contents were calculated by using equations;
Chlorophyll a (mg/g) = 12.7 (OD 663) − 2.69 (OD 645) V/(1000 × W)
Chlorophyll b (mg/g) = 22.9 (OD 645) − 4.68 (OD 663) V/(1000 × W)
Total Chlorophyll (mg/g) = Chlorophyll a + Chlorophyll b
where OD = Optical density (nm), V = Final volume made (mL), W = Fresh weight of sample (g).
The Lutts et al. [64] method was adopted for the determination of electrolyte leakage (EL). All the leaves samples were washed with deionized (DI) water for the removal of dust particles. After that, discs of uniform size were cut with a steel cylinder of 1 cm diameter. Finally, one gram of equal discs was dipped in a test tube containing 20 mL DI water and incubated at 25 °C for 24 h. First electrical conductivity (EC1) was determined using a pre-calibrated EC meter. Second EC (EC2) was noted after heating the test tubes at 120 °C for 20 min in a water bath. We calculated the final value of electrolyte leakage (EL) by using the equation:
Electrolyte Leakage (%) = (EC1/EC2) × 100
Maximum increase (%) was calculated by using the formula:
Maximum Increase (%) = (Highest Value − Control treatment value/Control treatment value) × 100
Statistical analysis was performed using standard statistical procedures as described by Steel and Torrie [65]. Two factorial ANOVA was applied on Statistix 8.1 software for determination of treatments significance under various levels of irrigations. Tukey’s test at p ≤ 0.05 was applied for comparison of the treatments.

3. Results

3.1. Plant Height, Root Length and Spike Length

Both the individual and interactive effects of T and I were significant on plant height and root length. For spike length, the main effects were significantly different while the interactive effects (T × I) remained nonsignificant. Application of BC, A. fabrum + BC and B. amyloliquefaciens + BC significantly improved plant height compared to control, with 4I and 2I (Table 2). The treatments A. fabrum, B. amyloliquefaciens, BC, A. fabrum + BC and B. amyloliquefaciens + BC differed significantly from control at 3I for plant height. A maximum increase of 0.31-fold in plant height was observed in A. fabrum + BC at 4I while 0.81-fold in B. amyloliquefaciens + BC with 2I from control. However, plant height was the maximum (0.42-fold) from control, in responses to A. fabrum + BC and B. amyloliquefaciens + BC treatments. For root length, the BC, A. fabrum + BC and B. amyloliquefaciens + BC differed significantly from control at 4I and 3I. The B. amyloliquefaciens, BC, A. fabrum + BC and B. amyloliquefaciens + BC were significantly better from control for root length with 2I (Table 2). Maximum increases, i.e., 0.49, 1.11 and 0.90-fold in root length were noted over control in B. amyloliquefaciens + BC with 4I, 3I and 2I, respectively. In the case of spike length, all the treatments were statistically alike but different from control (Table 2).

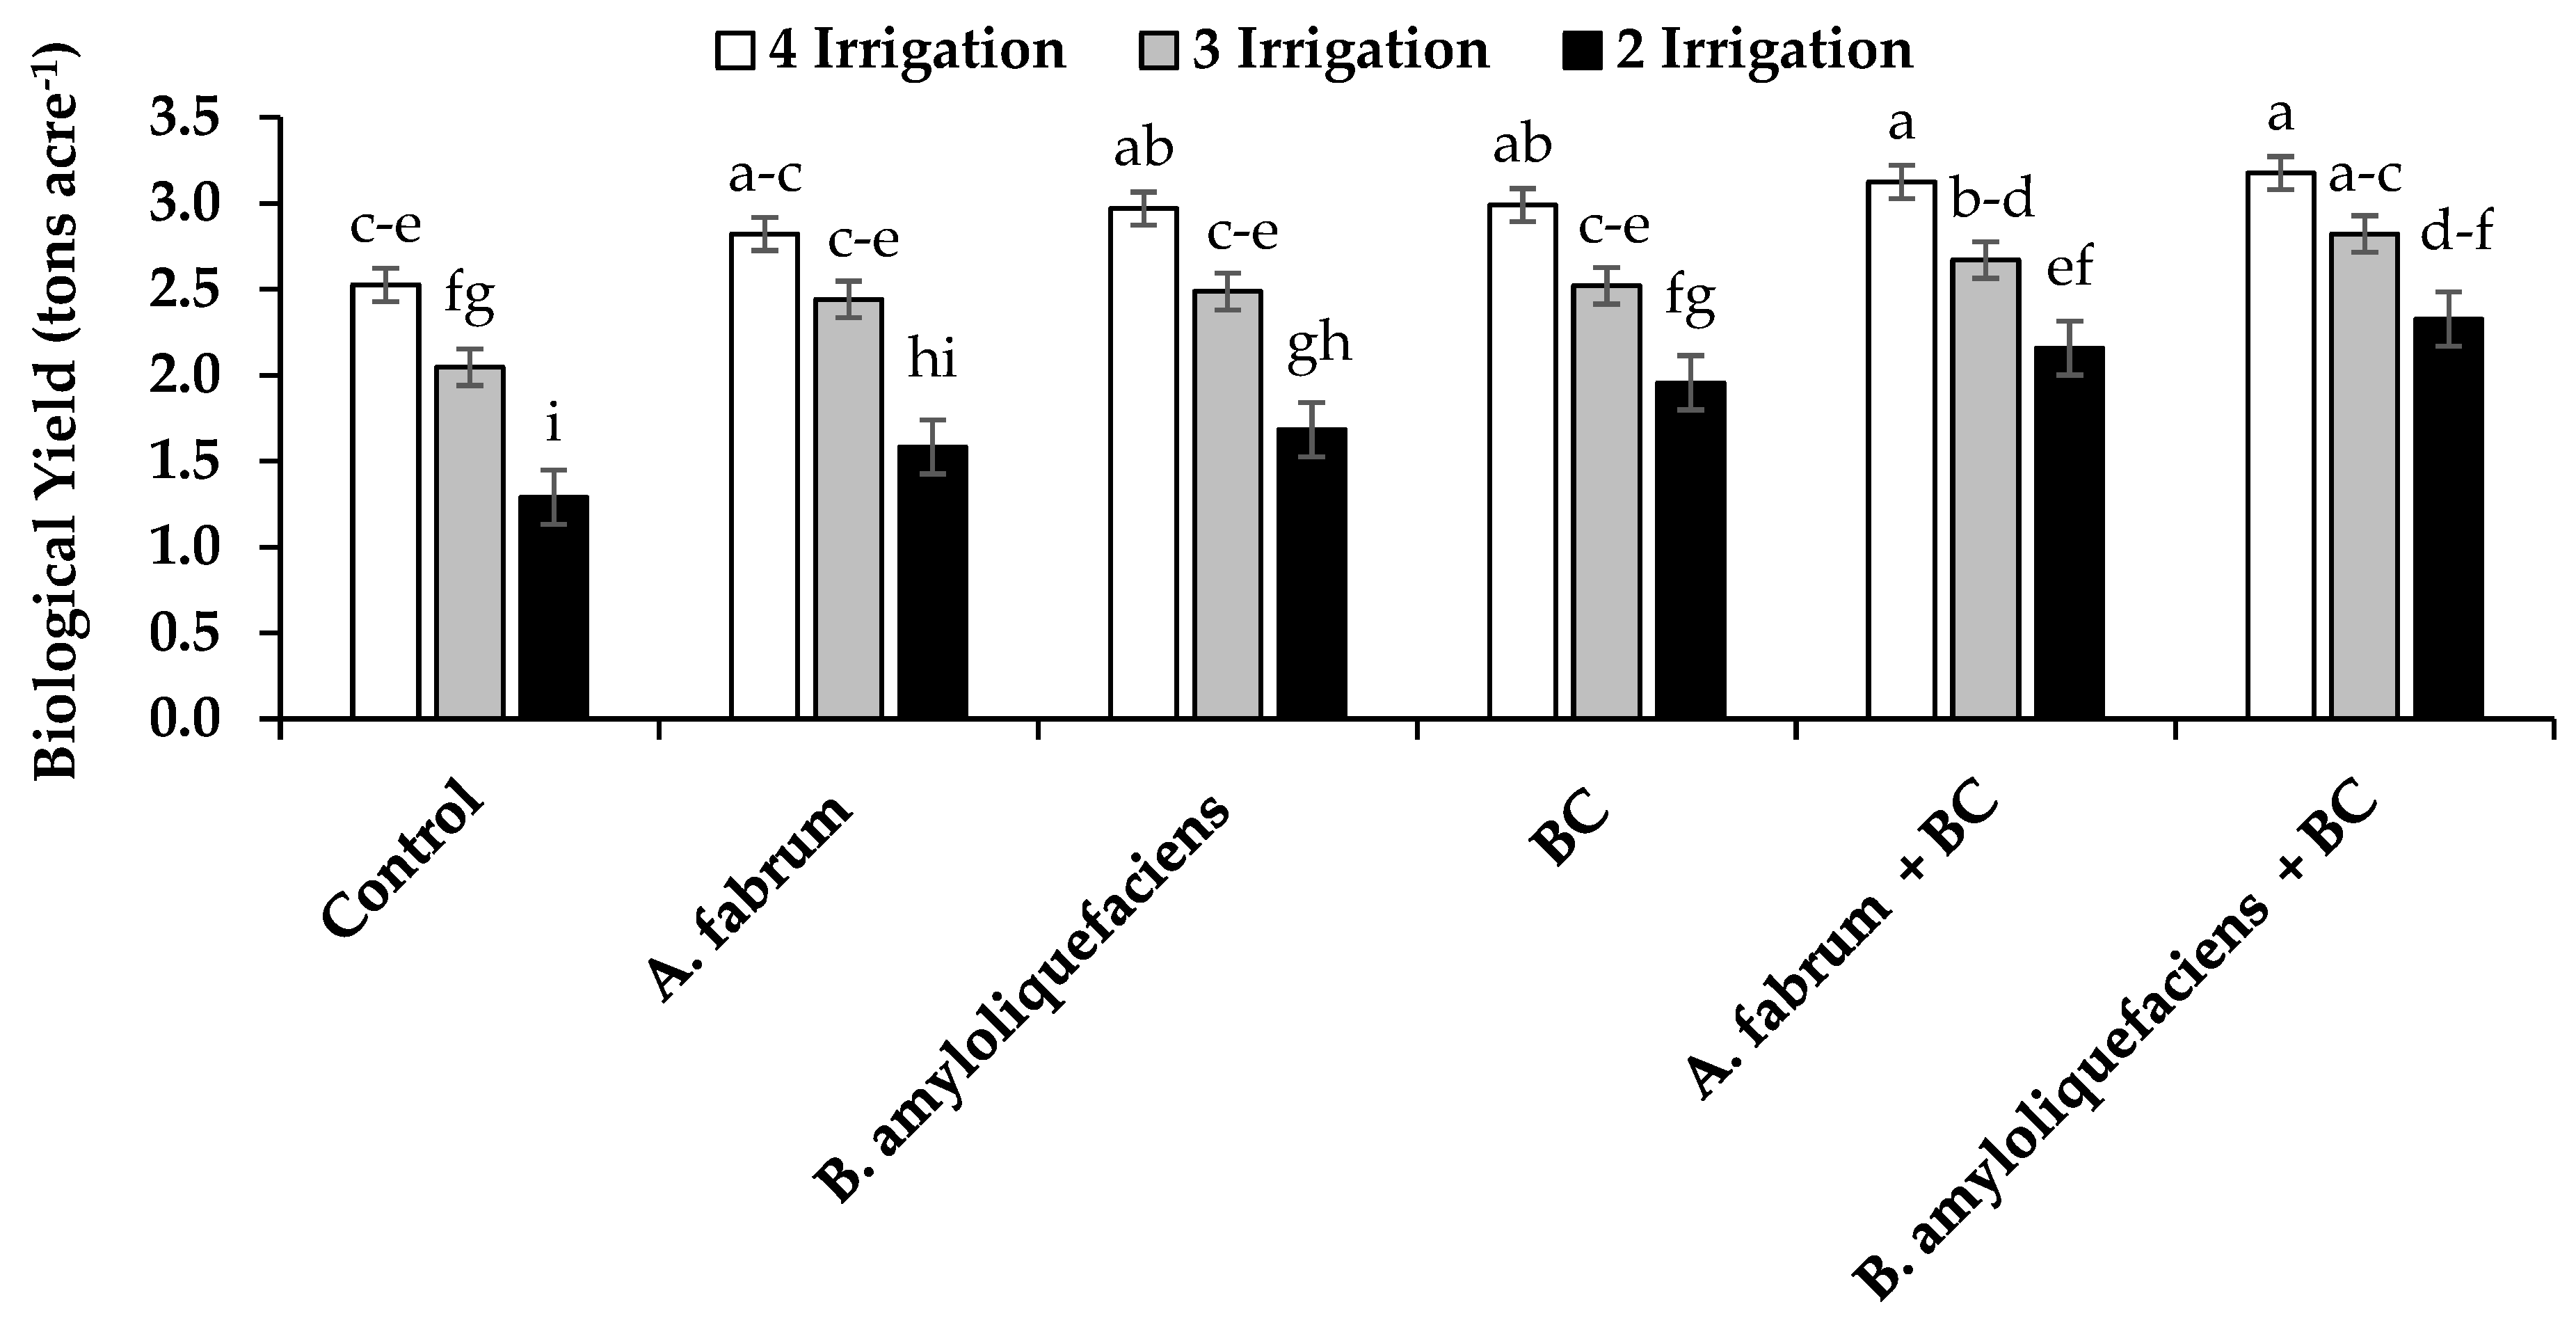
3.2. Grain, Straw and Biological Yield

Both the individual and interactive effects of T and I were significantly different for grain, straw and biological yield of wheat. The A. fabrum + BC and B. amyloliquefaciens + BC differed significantly from control for grain yield with 4I (Figure 1). Applications of A. fabrum, B. amyloliquefaciens, BC, A. fabrum + BC and B. amyloliquefaciens + BC differed significantly from control for grain yield at 3I. However, the BC, A. fabrum + BC and B. amyloliquefaciens + BC showed significantly better results over control for grain yield at 2I. The maximum increases, i.e., 0.29, 0.36 and 0.77-fold in grain yield were noted from control in B. amyloliquefaciens + BC with 4I, 3I and 2I, respectively. For straw yield, the B. amyloliquefaciens, BC, A. fabrum + BC and B. amyloliquefaciens + BC differed significantly from control with 3I and 2I (Figure 2). Maximum increases of 0.25, 0.50 and 0.75-fold in straw yield were noted from control in B. amyloliquefaciens + BC. In case of biological yield, the B. amyloliquefaciens, BC, A. fabrum + BC and B. amyloliquefaciens + BC differed significantly from control with 4I and 2I. From control, the A. fabrum, B. amyloliquefaciens, BC, A. fabrum + BC and B. amyloliquefaciens + BC differed significantly at 3I for biological yield (Figure 3). The maximum increases of 0.28, 0.40 and 0.77-fold in biological yield were noted from control in B. amyloliquefaciens + BC with 4I, 3I and 2I, respectively.

3.3. Spikelets Spike1, Grains Spik−1 and 1000 Grain Weight

Main effects of T and I differed significantly for spikelets spike1, grains spike1 and 1000 grain weight but the interaction (T × I) was significantly different only for 1000 grain weight. From control, the applications of B. amyloliquefaciens, BC, A. fabrum + BC and B. amyloliquefaciens + BC differed significantly from control for spikelets spike1 (Table 3). The treatment B. amyloliquefaciens + BC differed significantly over BC and B. amyloliquefaciens for spikelets spike1. Similarly, A. fabrum + BC differed significantly as compared to A. fabrum but did not differ significantly as compared to BC for spikelets spike1. A maximum increase of 0.24-fold in spikelets spike1 was noted from control in B. amyloliquefaciens + BC. In the case of grains spike1, the BC, A. fabrum + BC and B. amyloliquefaciens + BC were statistically alike but differed significantly from control (Table 3). Inoculation of B. amyloliquefaciens also differed significantly from control for grains spike1. A maximum increase of 0.51-fold in grains spike1 was noted from control in B. amyloliquefaciens + BC. For 1000 grain weight, the A. fabrum + BC differed significantly from control with 4I. It was noted that A. fabrum + BC and B. amyloliquefaciens + BC differed significantly from control at 3I for 1000 grain weight (Table 3). However, the applications of B. amyloliquefaciens, BC, A. fabrum + BC and B. amyloliquefaciens + BC differed significantly from control with 2I for 1000 grain weight. A maximum increase of 0.20-fold in 1000 grain weight was noted as compared to control in A. fabrum + BC with 4I. With 3I, the application of B. amyloliquefaciens + BC gave a maximum increase of 0.29-fold as compared to control in 1000 grains weight. However, the BC and A. fabrum + BC gave a maximum rise of 0.46-fold as compared to control in 1000 grain weight with 2I.

3.4. N, P and K Concentration in Grains

Both the main and interactive effects of T and I were significant for N, P and K concentrations in wheat grains. All the treatments were statistically alike with 4I for grains N concentration. Applications of BC, A. fabrum + BC and B. amyloliquefaciens + BC performed significantly better from control with 3I and 2I for grains’ N concentration (Table 4). The maximum increases of 0.13, 0.37 and 0.57-fold in grains’ N concentration were noted in B. amyloliquefaciens + BC with 4I, 3I and 2I, respectively. In the case of grains’ P concentration, B. amyloliquefaciens, BC, A. fabrum + BC and B. amyloliquefaciens + BC remained statistically alike but only A. fabrum + BC and B. amyloliquefaciens + BC differed significantly from control with 4I. The A. fabrum, B. amyloliquefaciens, BC, A. fabrum + BC and B. amyloliquefaciens + BC were significantly better from control with 3I and 2I for grains P concentration (Table 4). Both the A. fabrum + BC and B. amyloliquefaciens + BC showed a maximum increase of 0.32-fold in the grains’ P concentration from control with 4I. However, with 3I and 2I, the B. amyloliquefaciens + BC gave the maximum increases of 0.91 and 1.64-fold in grains P concentration from control, respectively. For the grains’ K concentration, the A. fabrum, B. amyloliquefaciens, BC, A. fabrum + BC and B. amyloliquefaciens + BC were statistically similar to each other while, the BC, A. fabrum + BC and B. amyloliquefaciens + BC differed significantly from control with 4I (Table 4). The A. fabrum + BC and B. amyloliquefaciens + BC differed significantly with 3I from control for the grains’ K concentration. However, the A. fabrum, B. amyloliquefaciens, BC, A. fabrum + BC and B. amyloliquefaciens + BC differed significantly over control for the grains’ K concentration with 2I. The maximum increases of 0.22, 0.27 and 0.61-fold in the grains’ K concentration were noted in B. amyloliquefaciens + BC with 4I, 3I and 2I, respectively.

3.5. N, P and K Concentration in Shoot

Both the individual and interactive effects of T and I differed significantly for shoot nitrogen compared to only individual effects of T and I were significant for P and K concentrations in wheat. All treatments were statistically alike with 4I for shoot nitrogen concentration. The A. fabrum + BC, B. amyloliquefaciens + BC and BC differed significantly from control at 3I for shoot nitrogen concentration (Table 5). A. fabrum and B. amyloliquefaciens were non-significant over control for shoot nitrogen concentration. A maximum increase of 0.32-fold in shoot nitrogen concentration was noted from control with 3I in both the B. amyloliquefaciens + BC and A. fabrum + BC treatments. For P concentration in the shoot, B. amyloliquefaciens + BC differed significantly from control. A. fabrum and B. amyloliquefaciens and BC also differed substantially from control (Table 5). Maximum increases of 0.44-fold in shoot P concentration were noted from control in B. amyloliquefaciens + BC treatment. However, wheat cultivation with 4I gave 0.44-fold higher P shoot concentration from 3I. For shoot K concentration, A. fabrum + BC and B. amyloliquefaciens + BC remained statistically alike but significantly better from control. Both the A. fabrum and B. amyloliquefaciens inoculations also differed significantly from control for shoot K concentration. We observed that BC was significantly different from A. fabrum, B. amyloliquefaciens and control treatments for shoot K concentration (Table 5). Maximum increases of 0.51-fold in shoot K concentration were noted from control in A. fabrum + BC. However, wheat cultivation with 4I gave 0.13-fold higher K shoot concentration from 3I treatment.

3.6. Gas Exchange Attributes

Main effects of T and I differed significantly but the interactive effect (T × I) was non-significant for photosynthetic rate and stomatal conductance. For the photosynthetic rate, the BC, A. fabrum + BC and B. amyloliquefaciens + BC were statistically alike but differed significantly from control (Table 6). Applications of A. fabrum and B. amyloliquefaciens were non-significant from control for the photosynthetic rate. A maximum increase of 0.48-fold in the photosynthetic rate was observed from control in B. amyloliquefaciens + BC treatment. However, wheat cultivation with 4I showed 0.35-fold higher photosynthetic rate from 3I. In case of transpiration rate, A. fabrum + BC and B. amyloliquefaciens + BC were statistically similar to each other but differed significantly from control. A. fabrum, B. amyloliquefaciens and BC proved significantly better treatments from control for transpiration rate (Table 6). A maximum increase of 0.81-fold in the rate of transpiration was noted from control in B. amyloliquefaciens + BC. However, wheat cultivation with 4I showed 0.32-fold higher transpiration rate from 3I. For stomatal conductance, the BC, A. fabrum + BC and B. amyloliquefaciens + BC treatments remained statistically alike but were significantly different from A. fabrum and control (Table 6). The A. fabrum and B. amyloliquefaciens were statistically similar to control for stomatal conductance. The maximum increases of 0.42-fold in stomatal conductance were noted from control in B. amyloliquefaciens + BC treatment. However, wheat cultivation with 4I showed 0.24-fold higher stomatal conductance from 3I.

3.7. Chlorophyll Content

The main effects of T and I were significantly different but interaction (T × I) was non-significant for chlorophyll a, chlorophyll b and total chlorophyll contents in wheat leaves. In the case of chlorophyll a, the A. fabrum + BC and B. amyloliquefaciens + BC were statistically similar, while both differed significantly from control (Table 7). The BC also differed significantly from control for chlorophyll a content. The A. fabrum and B. amyloliquefaciens did not vary significantly from control for chlorophyll a content. A maximum increase of 0.40-fold in chlorophyll a was noted in B. amyloliquefaciens + BC treatment over control. However, wheat cultivation with 4I showed 0.15-fold higher chlorophyll a content from 3I. For chlorophyll b, the B. amyloliquefaciens + BC and A. fabrum + BC treatments differed significantly from control. The BC also differed significantly from control for chlorophyll b. While, A. fabrum and B. amyloliquefaciens, did not differ significantly from control for chlorophyll b, maximum increase of 0.42-fold in chlorophyll b was noted from control in B. amyloliquefaciens + BC treatment. However, wheat cultivation with 4I showed 0.20-fold higher chlorophyll b content from 3I. In case of total chlorophyll, A. fabrum + BC and B. amyloliquefaciens + BC differed significantly from control. Inoculation of A. fabrum and B. amyloliquefaciens did not vary significantly but BC was significant from control for total chlorophyll (Table 7). A maximum increase of 0.41-fold in total chlorophyll was noted over control due to B. amyloliquefaciens + BC application. However, wheat cultivation with 4I showed 0.17-fold higher total chlorophyll content from 3I.

3.8. Electrolyte Leakage

Main effects of T and I were significantly different from control for electrolyte leakage. The A. fabrum + BC and B. amyloliquefaciens + BC treatments differed significantly from control for electrolyte leakage (Table 7). The A. fabrum, B. amyloliquefaciens and BC were statistically similar to control for electrolyte leakage. The B. amyloliquefaciens + BC exhibited significant reduction, i.e., 0.21-fold in electrolyte leakage compared to control. However, with 4I application wheat plants showed a significant reduction (0.20-fold) in electrolyte leakage from 3I.

4. Discussion

The sole application of BC under 2I significantly improved the root length and grain yield of wheat as compared to control. Biochar is frequently reported to have very high pore volume, water holding and cation exchange capacities, e.g., [66], and such properties stimulate root growth and facilitate better water and nutrient uptakes resulting in improved vegetative and reproductive growth [67,68]. Significantly greater K concentrations in the shoot and grain and improved plant yield in this field and in an earlier pot study [22] have validated the reportedly productive characteristics of BC. However, the specific objective of this study was to investigate and present the cumulative role of drought tolerant ACC-deaminase producing PGPR and BC in mitigating drought stress in wheat crop under field conditions.
Combined application of ACC-deaminase producing PGPR Agrobacterium fabrum or Bacillus amyloliquefaciens and timber-waste BC significantly improved the growth and yield of field grown wheat under mild (3I) and severe drought (2I) conditions. Our field study results validate earlier pot study results of improved growth and yield in response to comparable drought conditions [22,23,24]. Both the PGPR strains, A. fabrum and B. amyloliquefaciens along with BC significantly enhanced root length and plant height compared to those under control condition. Similar results were also observed in a previous pot study where A. fabrum and B. amyloliquefaciens significantly improved morphological growth attributes in wheat under drought stress [22]. As the A. fabrum, B. amyloliquefaciens were capable of producing ACC-deaminase, improvement in root length and plant height might be due to a reduction in ethylene level.
According to Mayak et al. [29], raised level of 1-aminocyclopropane-1-carboxylic acid (ACC) in plants exposed to drought, raises ethylene concentration in root and shoot of plants. Roots secrete accumulated ACC into rhizosphere which is cleaved by PGPR secreted ACC-deaminase into NH3 and α-ketobutyrate, and ultimately ethylene level decreases. The decrease in ethylene concentration results in better root coverage, which results in improvements in the uptake of water and nutrients due to the enhanced rhizospheric area [69].
Significant improvements in grain yield, photosynthetic rate, transpiration rate, stomatal conductance chlorophyll a, chlorophyll b and total chlorophyll validated the enhanced functioning of the A. fabrum and B. amyloliquefaciens when applied in combination with BC, as compared to using the same rhizobacteria without BC [25]. Secretion of growth hormone, i.e., IAA by the A. fabrum and B. amyloliquefaciens and greater water holding capacity of BC in addition to ACC-deaminase production are the allied factors responsible for the improvement in wheat growth. The findings of previous pot studies also support this argument [22,23,24]. Xie et al. [70] described IAA as a co-factor, playing a crucial role in crop growth enhancement. Moreover, increases in surface area and length of lateral and adventitious roots due to high IAA secretion by PGPR play a vital role in better nutrient uptake [71].
This study finds that both the A. fabrum and B. amyloliquefaciens were solubilizing P and K, which may explain why grain and shoot P and K concentrations were significantly improved [72,73] with and without BC. Also, the increases in N, P and K contents in shoot and grain in responses to BC (without rhizobacteria) might be due to the retention of N and presences of P and K in BC. Improvement in cation exchange sites through BC addition also increases the retentions of mobile nutrients like N [74], thus, enhancing its bioavailability by decreasing leaching and volatilization losses [75]. Significant improvements in total chlorophyll, chlorophyll a, and chlorophyll b in the current study were probably due to better uptake of N.
Singh et al. [76] stated that greater K concentration in BC ash also contributed to better K uptake. Improvement in K concentration might have maintained the cell turgor pressure and regulated the stomatal conductance by osmoregulation [77,78]. Novak et al. [79] and Lehmann et al. [80] also observed a significant improvement in water holding capacity of soil where BC was applied. The greater surface area and pore spaces of BC facilitate the retention of water when used in soil [33,79,80,81]. According to Singh et al. [76], the organic carbon in BC significantly facilitates PGPR for improvement in their growth. Danish and Zafar-ul-Hye [22] also documented the synergistic effects of PGPR and BC against drought. They argued that root elongation and retention of water and nutrients by PGPR and BC respectively create a favourable environment in rhizosphere for plants to perform better under drought. Specifically, significant increases in growth and yield of wheat through the co-application of both ACC-deaminase PGPR (A. fabrum and B. amyloliquefaciens) along with BC might be due to better survivability, activity and proliferation of PGPR in combination with the water and nutrients holding potentials of BC under 3I and 2I.

5. Conclusions

Combined application of PGPR and biochar more effectively mitigates drought impacts as compared to individual PGPR inoculation or BC application, in field-grown wheat crop. Specifically, soil application of drought-tolerant ACC-deaminase producing PGPR Agrobacterium fabrum or Bacillus amyloliquefaciens, in addition to timber waste BC (30 tons ha−1), significantly promotes growth and yield traits of wheat under field drought conditions.

Author Contributions

S.D. conducted research, prepared biochar, collected data and wrote manuscript; M.Z.H. designed and supervised experiment and wrote manuscript. M.A. and M.A. assisted in investigation and methodology validation. T.M.M. supported research, reviewed/edited article and collaborated funding.

Acknowledgments

First author is grateful to Higher Education Commission (HEC) of Pakistan to provide Indigenous Scholarship (PIN: 315-8403-2AV3-049) for his Ph.D. study in Pakistan.

Conflicts of Interest

The authors declare no conflict of interest.

References

  1. Bos, C.; Juillet, B.; Fouillet, H.; Turlan, L.; Daré, S.; Luengo, C.; N’tounda, R.; Benamouzig, R.; Gausserès, N.; Tomé, D.; et al. Postprandial metabolic utilization of wheat protein in humans. Am. J. Clin. Nutr. 2005, 81, 87–94. [Google Scholar] [CrossRef] [PubMed] [Green Version]
  2. Shiferaw, B.; Smale, M.; Braun, H.-J.; Duveiller, E.; Reynolds, M.; Muricho, G. Crops that feed the world 10. Past successes and future challenges to the role played by wheat in global food security. Food Secur. 2013, 5, 291–317. [Google Scholar] [CrossRef] [Green Version]
  3. Ahmad, Z.; Waraich, E.A.; Akhtar, S.; Anjum, S.; Ahmad, T.; Mahboob, W.; Hafeez, O.B.A.; Tapera, T.; Labuschagne, M.; Rizwan, M. Physiological responses of wheat to drought stress and its mitigation approaches. Acta Physiol. Plant. 2018, 40, 80. [Google Scholar] [CrossRef]
  4. Kilic, H.; Yağbasanlar, T. The effect of drought stress on grain yield, yield components and some quality traits of durum wheat (Triticum turgidum ssp. Durum) cultivars. Not. Bot. Horti Agrobot. Clujnapoca 2010, 38, 164–170. [Google Scholar]
  5. Waraich, E.A.; Ahmad, R.; Ashraf, M. Role of mineral nutrition in alleviation of drought stress in plants. Aust. J. Crop Sci. 2011, 5, 764–777. [Google Scholar]
  6. Griffin, M.T.; Montz, B.E.; Arrigo, J.S. Evaluating climate change induced water stress: A case study of the lower cape fear basin, nc. Appl. Geogr. 2013, 40, 115–128. [Google Scholar] [CrossRef]
  7. Munir, T.; Perkins, M.; Kaing, E.; Strack, M. Carbon dioxide flux and net primary production of a boreal treed bog: Responses to warming and water-table-lowering simulations of climate change. Biogeosciences 2015, 12, 1091–1111. [Google Scholar] [CrossRef] [Green Version]
  8. Bechtold, M.; De Lannoy, G.; Koster, R.; Reichle, R.; Mahanama, S.; Bleuten, W.; Bourgault, M.; Brümmer, C.; Burdun, I.; Desai, A.; et al. Peat-clsm: A specific treatment of peatland hydrology in the nasa catchment land surface model. J. Adv. Model. Earth Syst. 2019. [Google Scholar] [CrossRef]
  9. Saikia, J.; Sarma, R.K.; Dhandia, R.; Yadav, A.; Bharali, R.; Gupta, V.K.; Saikia, R. Alleviation of drought stress in pulse crops with acc deaminase producing rhizobacteria isolated from acidic soil of northeast india. Sci. Rep. 2018, 8, 3560. [Google Scholar] [CrossRef]
  10. Zhang, S.; Kang, H.; Yang, W. Climate change-induced water stress suppresses the regeneration of the critically endangered forest tree nyssa yunnanensis. PLoS ONE 2017, 12, e0182012. [Google Scholar] [CrossRef]
  11. Strack, M.; Munir, T.M.; Khadka, B. Shrub abundance contributes to shifts in dissolved organic carbon concentration and chemistry in a continental bog exposed to drainage and warming. Ecohydrology 2019. [Google Scholar] [CrossRef]
  12. Preston, K.L.; Rotenberry, J.T.; Redak, R.A.; Allen, M.F. Habitat shifts of endangered species under altered climate conditions: Importance of biotic interactions. Glob. Chang. Biol. 2008, 14, 2501–2515. [Google Scholar] [CrossRef]
  13. Allen, M.R.; Barros, V.R.; Broome, J.; Cramer, W.; Christ, R.; Church, J.A.; Clarke, L.; Dahe, Q.; Dasgupta, P.; Dubash, N.K. IPCC Fifth Assessment Synthesis Report-Climate Change 2014 Synthesis Report. 2014. Available online: https://ar5-syr.ipcc.ch/ (accessed on 28 June 2019).
  14. Mishra, V.; Cherkauer, K.A. Retrospective droughts in the crop growing season: Implications to corn and soybean yield in the midwestern united states. Agric. Meteorol. 2010, 150, 1030–1045. [Google Scholar] [CrossRef]
  15. Fahad, S.; Bajwa, A.A.; Nazir, U.; Anjum, S.A.; Farooq, A.; Zohaib, A.; Sadia, S.; Nasim, W.; Adkins, S.; Saud, S. Crop production under drought and heat stress: Plant responses and management options. Front. Plant Sci. 2017, 8, 1147. [Google Scholar] [CrossRef] [PubMed]
  16. Reddy, S.K.; Liu, S.; Rudd, J.C.; Xue, Q.; Payton, P.; Finlayson, S.A.; Mahan, J.; Akhunova, A.; Holalu, S.V.; Lu, N. Physiology and transcriptomics of water-deficit stress responses in wheat cultivars tam 111 and tam 112. J. Plant Physiol. 2014, 171, 1289–1298. [Google Scholar] [CrossRef] [PubMed]
  17. Munir, T.M.; Khadka, B.; Xu, B.; Strack, M. Mineral nitrogen and phosphorus pools affected by water table lowering and warming in a boreal forested peatland. Ecohydrology 2017, 10, e1893. [Google Scholar] [CrossRef]
  18. Wang, W.; Vinocur, B.; Altman, A. Plant responses to drought, salinity and extreme temperatures: Towards genetic engineering for stress tolerance. Planta 2003, 218, 1–14. [Google Scholar] [CrossRef] [PubMed]
  19. Zafar-Ul-Hye, M.; Shahjahan, A.; Danish, S.; Abid, M.; Qayyum, M.F. Mitigation of cadmium toxicity induced stress in wheat by acc-deaminase containing pgpr isolated from cadmium polluted wheat rhizosphere. Pak. J. Bot. 2018, 50, 1727–1734. [Google Scholar]
  20. Sharp, R.E.; LeNoble, M.E. Aba, ethylene and the control of shoot and root growth under water stress. J. Exp. Bot. 2002, 53, 33–37. [Google Scholar] [CrossRef]
  21. Danish, S.; Zafar-ul-Hye, M.; Hussain, M.; Shaaban, M.; Núñez-Delgado, A.; Hussain, S.; Qayyum, M.F. Rhizobacteria with ACC-deaminase activity improve nutrient uptake, chlorophyll contents and early seedling growth of wheat under PEG-induced osmotic stress. Intl. J. Agric. Biol. 2019, 21, 1212–1220. [Google Scholar]
  22. Danish, S.; Zafar-ul-Hye, M. Co-application of acc-deaminase producing pgpr and timber-waste biochar improves pigments formation, growth and yield of wheat under drought stress. Sci. Rep. 2019, 9, 5999. [Google Scholar] [CrossRef] [PubMed]
  23. Stromberger, M.E.; Abduelafez, I.; Byrne, P.; Elamari, A.A.; Manter, D.K.; Weir, T. Genotype-specific enrichment of 1-aminocyclopropane-1-carboxylic acid deaminase-positive bacteria in winter wheat rhizospheres. Soil Sci. Soc. Am. J. 2017, 81, 796–805. [Google Scholar] [CrossRef]
  24. Salem, G.; Stromberger, M.E.; Byrne, P.F.; Manter, D.K.; El-Feki, W.; Weir, T.L. Genotype-specific response of winter wheat (Triticum aestivum L.) to irrigation and inoculation with acc deaminase bacteria. Rhizosphere 2018, 8, 1–7. [Google Scholar] [CrossRef]
  25. Kumputa, S.; Vityakon, P.; Saenjan, P.; Lawongsa, P. Carbonaceous greenhouse gases and microbial abundance in paddy soil under combined biochar and rice straw amendment. Agronomy 2019, 9, 228. [Google Scholar] [CrossRef]
  26. Basak, B.B.; Biswas, D.R. Co-inoculation of potassium solubilizing and nitrogen fixing bacteria on solubilization of waste mica and their effect on growth promotion and nutrient acquisition by a forage crop. Biol. Fertil. Soils 2010, 46, 641–648. [Google Scholar] [CrossRef]
  27. Mwajita, M.R.; Murage, H.; Tani, A.; Kahangi, E.M. Evaluation of rhizosphere, rhizoplane and phyllosphere bacteria and fungi isolated from rice in kenya for plant growth promoters. SpringerPlus 2013, 2, 606. [Google Scholar] [CrossRef]
  28. Belimov, A.A.; Safronova, V.I.; Sergeyeva, T.A.; Egorova, T.N.; Matveyeva, V.A.; Tsyganov, V.E.; Borisov, A.Y.; Tikhonovich, I.A.; Kluge, C.; Preisfeld, A. Characterization of plant growth promoting rhizobacteria isolated from polluted soils and containing 1-aminocyclopropane-1-carboxylate deaminase. Can. J. Microbiol. 2001, 47, 642–652. [Google Scholar] [CrossRef]
  29. Mayak, S.; Tirosh, T.; Glick, B.R. Plant growth-promoting bacteria confer resistance in tomato plants to salt stress. Plant Physiol. Biochem. 2004, 42, 565–572. [Google Scholar] [CrossRef]
  30. Zahir, Z.A.; Munir, A.; Asghar, H.N.; Shaharoona, B.; Arshad, M. Effectiveness of rhizobacteria containing acc deaminase for growth promotion of peas (Pisum sativum) under drought conditions. J. Microbiol. Biotechnol. 2008, 18, 958–963. [Google Scholar]
  31. Gundale, M.J.; DeLuca, T.H. Charcoal effects on soil solution chemistry and growth of koeleria macrantha in the ponderosa pine/douglas-fir ecosystem. Biol. Fertil. Soils 2006, 43, 303–311. [Google Scholar] [CrossRef]
  32. Hartmann, M.; Fliessbach, A.; Oberholzer, H.R.; Widmer, F. Ranking the magnitude of crop and farming system effects on soil microbial biomass and genetic structure of bacterial communities. FEMS Microbiol. Ecol. 2006, 57, 378–388. [Google Scholar] [CrossRef] [PubMed] [Green Version]
  33. De Jesus Duarte, S.; Glaser, B.; Pellegrino Cerri, C.E. Effect of biochar particle size on physical, hydrological and chemical properties of loamy and sandy tropical soils. Agronomy 2019, 9, 165. [Google Scholar] [CrossRef]
  34. Wacal, C.; Ogata, N.; Basalirwa, D.; Handa, T.; Sasagawa, D.; Acidri, R.; Ishigaki, T.; Kato, M.; Masunaga, T.; Yamamoto, S.; et al. Growth, seed yield, mineral nutrients and soil properties of sesame (Sesamum indicum L.) as influenced by biochar addition on upland field converted from paddy. Agronomy 2019, 9, 55. [Google Scholar] [CrossRef]
  35. De la Rosa, J.M.; Rosado, M.; Paneque, M.; Miller, A.Z.; Knicker, H. Effects of aging under field conditions on biochar structure and composition: Implications for biochar stability in soils. Sci. Total Environ. 2018, 613, 969–976. [Google Scholar] [CrossRef] [PubMed]
  36. Paneque, M.; De la Rosa, J.M.; Kern, J.; Reza, M.; Knicker, H. Hydrothermal carbonization and pyrolysis of sewage sludges: What happen to carbon and nitrogen? J. Anal. Appl. Pyrolysis 2017, 128, 314–323. [Google Scholar] [CrossRef] [Green Version]
  37. Lehmann, J. Bio-energy in the black. Front. Ecol. Environ. 2007, 5, 381–387. [Google Scholar] [CrossRef] [Green Version]
  38. Singh, B.; Singh, B.P.; Cowie, A.L. Characterisation and evaluation of biochars for their application as a soil amendment. Aust. J. Soil Res. 2010, 48, 516–525. [Google Scholar] [CrossRef]
  39. Hagemann, N.; Subdiaga, E.; Orsetti, S.; De la Rosa, J.M.; Knicker, H.; Schmidt, H.-P.; Kappler, A.; Behrens, S. Effect of biochar amendment on compost organic matter composition following aerobic composting of manure. Sci. Total Environ. 2018, 613, 20–29. [Google Scholar] [CrossRef]
  40. Sarfraz, M.; Mehdi, S.; Abid, M.; Akram, M. External and internal phosphorus requirement of wheat in bhalike soil series of pakistan. Pak. J. Bot. 2008, 40, 2031–2040. [Google Scholar]
  41. Ahmad, I.; Bibi, F.; Ullah, H.; Munir, T.M. Mango fruit yield and critical quality parameters respond to foliar and soil applications of zinc and boron. Plants 2018, 7, 97. [Google Scholar] [CrossRef]
  42. Dworkin, M.; Foster, J.W. Experiments with some microorganisms which utilize ethane and hydrogen. J. Bacteriol. 1958, 75, 592–603. [Google Scholar] [PubMed]
  43. El-Tarabily, K.A. Promotion of tomato (Lycopersicon esculentum mill.) plant growth by rhizosphere competent 1-aminocyclopropane-1-carboxylic acid deaminase-producing streptomycete actinomycetes. Plant Soil 2008, 308, 161–174. [Google Scholar] [CrossRef]
  44. Glickmann, E.; Dessaux, Y. A critical examination of the specificity of the salkowski reagent for indolic compounds produced by phytopathogenic bacteria. Appl. Environ. Microbiol. 1995, 61, 793–796. [Google Scholar] [PubMed]
  45. Vazquez, P.; Holguin, G.; Puente, M.E.; Lopez-Cortes, A.; Bashan, Y. Phosphate-solubilizing microorganisms associated with the rhizosphere of mangroves in a semiarid coastal lagoon. Biol. Fertil. Soils 2000, 30, 460–468. [Google Scholar] [CrossRef]
  46. Sheng, X.F.; He, L.Y. Solubilization of potassium-bearing minerals by a wild-type strain of bacillus edaphicus and its mutants and increased potassium uptake by wheat. Can. J. Microbiol. 2006, 52, 66–72. [Google Scholar] [CrossRef] [PubMed]
  47. Chapman, H.; Pratt, P. Methods of Analysis for Soils, Plants and Waters; University of California, Division of Agricultural Sciences: Oakland, CA, USA, 1961; pp. 169–176. [Google Scholar]
  48. Tandon, H.; Cescas, M.; Tyner, E. An acid-free vanadate-molybdate reagent for the determination of total phosphorus in soils 1. Soil Sci. Soc. Am. J. 1968, 32, 48–51. [Google Scholar] [CrossRef]
  49. Jones, J.B., Jr.; Wolf, B.; Mills, H.A. Plant Analysis Handbook. A Practical Sampling, Preparation, Analysis, and Interpretation Guid; Micro-Macro Publishing, Inc.: Athens, GA, USA, 1991. [Google Scholar]
  50. Ronsse, F.; Van Hecke, S.; Dickinson, D.; Prins, W. Production and characterization of slow pyrolysis biochar: Influence of feedstock type and pyrolysis conditions. Gcb Bioenergy 2013, 5, 104–115. [Google Scholar] [CrossRef]
  51. Gee, G.; Bauder, J. Particle-size analysis. Agronomy 1986, 4, 255–293. [Google Scholar]
  52. Walkley, A. An examination of methods for determining organic carbon and nitrogen in soils. J. Agric. Sci. 1935, 25, 598–609. [Google Scholar] [CrossRef]
  53. Olsen, S.R.; Sommers, L.E. Phosphorus. In Method of Soil Analysis, 2nd ed.; American Society of Agronomy: Madison, WI, USA, 1982; pp. 403–430. [Google Scholar]
  54. Ahmad, I.; Akhtar, M.J.; Zahir, Z.A.; Naveed, M.; Mitter, B.; Sessitsch, A. Cadmium-tolerant bacteria induce metal stress tolerance in cereals. Environ. Sci. Pollut. R. 2014, 21, 11054–11065. [Google Scholar] [CrossRef]
  55. Ahmad, M.T.; Asghar, N.; Saleem, M.; Khan, M.Y.; Zahir, Z.A. Synergistic effect of rhizobia and biochar on growth and physiology of maize. Agron. J. 2015, 107, 2327–2334. [Google Scholar] [CrossRef]
  56. Nadeem, S.M.; Zahir, Z.A.; Naveed, M.; Arshad, M. Rhizobacteria containing acc-deaminase confer salt tolerance in maize grown on salt-affected fields. Can. J. Microbiol. 2009, 55, 1302–1309. [Google Scholar] [CrossRef] [PubMed]
  57. Shaharoona, B.; Arshad, M.; Zahir, Z.A. Effect of plant growth promoting rhizobacteria containing acc-deaminase on maize (Zea mays L.) growth under axenic conditions and on nodulation in mung bean (vigna radiata L.). Lett. Appl. Microbiol. 2006, 42, 155–159. [Google Scholar] [CrossRef] [PubMed]
  58. Sheikh, A.; Rehman, T.; Yates, C. Logit models for identifying the factors that influence the uptake of new ‘no-tillage’technologies by farmers in the rice–wheat and the cotton–wheat farming systems of pakistan’s punjab. Agric. Syst. 2003, 75, 79–95. [Google Scholar] [CrossRef]
  59. Kumar, K.; Prihar, S.; Gajri, P. Determination of root distribution of wheat by auger sampling. Plant Soil 1993, 149, 245–253. [Google Scholar] [CrossRef]
  60. Newman, E. A method of estimating the total length of root in a sample. J. Appl. Ecol. 1966, 3, 139–145. [Google Scholar] [CrossRef]
  61. Munir, T.; Khadka, B.; Xu, B.; Strack, M. Partitioning forest-floor respiration into source based emissions in a boreal forested bog: Responses to experimental drought. Forests 2017, 8, 75. [Google Scholar] [CrossRef]
  62. Tekalign, T.; Hammes, P. Growth and productivity of potato as influenced by cultivar and reproductive growth: I. Stomatal conductance, rate of transpiration, net photosynthesis, and dry matter production and allocation. Sci. Hortic. 2005, 105, 13–27. [Google Scholar] [CrossRef]
  63. Arnon, D.I. Copper enzymes in isolated chloroplasts:Polyphenoloxidase in beta vulgaris. Plant Physiol. 1949, 24, 1–15. [Google Scholar] [CrossRef]
  64. Lutts, S.; Kinet, J.M.; Bouharmont, J. Nacl-induced senescence in leaves of rice (oryza sativa L.) cultivars differing in salinity resistance. Ann. Bot. 1996, 78, 389–398. [Google Scholar] [CrossRef]
  65. Steel, R.G.D.; Torrie, J.H. Principles and Procedures of Statistics, a Biometrical Approach; McGraw-Hill Kogakusha, Ltd.: New York, NY, USA, 1980. [Google Scholar]
  66. Horel, Á.; Tóth, E.; Gelybó, G.; Dencső, M.; Farkas, C. Biochar amendment affects soil water and CO2 regime during capsicum annuum plant growth. Agronomy 2019, 9, 58. [Google Scholar] [CrossRef]
  67. Sánchez-Monedero, M.A.; Cayuela, M.L.; Sánchez-García, M.; Vandecasteele, B.; D’Hose, T.; López, G.; Martínez-Gaitán, C.; Kuikman, P.J.; Sinicco, T.; Mondini, C. Agronomic evaluation of biochar, compost and biochar-blended compost across different cropping systems: Perspective from the european project fertiplus. Agronomy 2019, 9, 225. [Google Scholar] [CrossRef]
  68. Amonette, J.E.; Joseph, S. Characteristics of biochar: Microchemical properties. In Biochar for Environmental Management; Routledge: London, UK, 2012; pp. 65–84. [Google Scholar]
  69. Glick, B.R.; Liu, C.; Ghosh, S.; Dumbroff, E.B. Early development of canola seedlings in the presence of the plant growth-promoting rhizobacterium pseudomonas putida gr12-2. Soil Biol. Biochem. 1997, 29, 1233–1239. [Google Scholar] [CrossRef]
  70. Xie, H.; Pasternak, J.J.; Glick, B.R. Isolation and characterization of mutants of the plant growth-promoting rhizobacterium pseudomonas putida gr12-2 that overproduce indoleacetic acid. Curr. Microbiol. 1996, 32, 67–71. [Google Scholar] [CrossRef]
  71. Mohite, B. Isolation and characterization of indole acetic acid (iaa) producing bacteria from rhizospheric soil and its effect on plant growth. J. Soil Sci. Plant Nutr. 2013, 13, 638–649. [Google Scholar] [CrossRef]
  72. Pérez-Fernández, M.; Alexander, V. Enhanced plant performance in cicer arietinum l. Due to the addition of a combination of plant growth-promoting bacteria. Agriculture 2017, 7, 40. [Google Scholar] [CrossRef]
  73. Ma, Y.; Látr, A.; Rocha, I.; Freitas, H.; Vosátka, M.; Oliveira, R.S. Delivery of inoculum of rhizophagus irregularis via seed coating in combination with pseudomonas libanensis for cowpea production. Agronomy 2019, 9, 33. [Google Scholar] [CrossRef]
  74. De la Rosa, J.M.; Paneque, M.; Hilber, I.; Blum, F.; Knicker, H.E.; Bucheli, T.D. Assessment of polycyclic aromatic hydrocarbons in biochar and biochar-amended agricultural soil from southern spain. J. Soils Sediments 2016, 16, 557–565. [Google Scholar] [CrossRef]
  75. Chan, K.Y.; Zwieten, L.V.; Meszaros, I.; Downie, A.; Joseph, S. Using poultry litter biochars as soil amendments. Aust. J. Soil Res. 2008, 46, 437–444. [Google Scholar] [CrossRef]
  76. Singh, A.; Singh, A.P.; Singh, S.K.; Rai, S.; Kumar, D. Impact of addition of biochar along with pgpr on rice yield, availability of nutrients and their uptake in alluvial soil. J. Pure Appl. Microbiol. 2016, 10, 2181–2188. [Google Scholar]
  77. Shabala, S. Regulation of potassium transport in leaves: From molecular to tissue level. Ann. Bot. 2003, 95, 627–634. [Google Scholar] [CrossRef] [PubMed]
  78. Wilkinson, S.; Davies, W.J. Aba-based chemical signalling: The co-ordination of responses to stress in plants. Plant Cell Environ. 2002, 25, 195–210. [Google Scholar] [CrossRef] [PubMed]
  79. Novak, J.M.; Lima, I.; Xing, B.; Gaskin, J.W.; Steiner, C.; Das, K.C.; Ahmedna, M.; Rehrah, D.; Watts, D.W.; Busscher, W.J.; et al. Characterization of designer biochar produced at different temperatures and their effects on a loamy sand. Ann. Environ. Sci. 2009, 3, 195–2006. [Google Scholar]
  80. Lehmann, J.; Rillig, M.C.; Thies, J.; Masiello, C.A.; Hockaday, W.C.; Crowley, D. Biochar effects on soil biota—A review. Soil Biol. Biochem. 2011, 43, 1812–1836. [Google Scholar] [CrossRef]
  81. Abbas, T.; Rizwan, M.; Ali, S.; Adrees, M.; Zia-ur-Rehman, M.; Qayyum, M.F.; Ok, Y.S.; Murtaza, G. Effect of biochar on alleviation of cadmium toxicity in wheat (Triticum aestivum L.) grown on cd-contaminated saline soil. Environ. Sci. Pollut. R. 2018, 25, 25668–25680. [Google Scholar] [CrossRef] [PubMed]
Figure 1. Effect of Agrobacterium fabrum, Bacillus amyloliquefaciens with/without biochar (30 Mg ha−1) on grains yield (tons acre−1) in wheat cultivated in drought-stressed field conditions.
Agronomy 09 00343 g001
Figure 2. Effect of Agrobacterium fabrum, Bacillus amyloliquefaciens with/without biochar (30 Mg ha1) on straw yield (tons acre1) in wheat cultivated in drought-stressed field conditions.
Agronomy 09 00343 g002
Figure 3. Effect of Agrobacterium fabrum, Bacillus amyloliquefaciens with/without biochar (30 Mg ha1) on biological yield (tons acre1) in wheat cultivated in drought-stressed field conditions.
Agronomy 09 00343 g003
Table 1. Characteristics of soil and timber waste biochar (BC).
SoilUnitValueBiocharUnitValue
Sand%55pH-7.26
Silt%25ECedS m−11.22
Clay%30Volatile Matter%8.96
TextureSandy Clay LoamAsh Content%28.9
pHs-8.52Fixed Carbon%62.1
ECedS m−13.69Total N%0.21
Organic Matter%0.45Total P%0.62
Total N%0.02Total K%1.61
Extractable Pmg kg−15.26Total Na%0.19
Extractable Kmg kg−1170
Table 2. Effect of Agrobacterium fabrum, Bacillus amyloliquefaciens with/without biochar (30 Mg ha−1) on plant height, root length and spike length of wheat cultivated in drought-stressed field conditions.
TreatmentsPlant Height (cm)Root Length (cm)Spike Length (cm)
No. of Irrigations (I)
IE (T × I)ME (T)IE (T × I)ME (T)IE (T × I)ME (T)
4I3I2I4I3I2I4I3I2I
Control59.0 d–f48.1 g,h33.0 i46.7 D8.82 d–f5.65 h,i4.46 i6.31 D5.754.864.344.98 B
A. fabrum65.5 c–f58.3 e,f40.1 h,i54.6 C10.1 b–d7.08 f–h6.22 g–i7.79 C6.686.224.875.92 A
B. amyloliquefaciens66.2 b–e60.0 d–f39.6 h,i55.3 B,C 10.3 b–d7.46 f–h6.36 g,h8.03 C6.696.274.785.91 A
BC71.2 a–c60.9 d–f45.6 h59.2 B11.5 a–c9.67 c–e7.81 e–g9.67 B6.676.464.966.03 A
A. fabrum + BC76.8 a68.3 a–d56.5 f,g67.2 A12.8 a11.2 a–c8.46 d–f10.8 A7.136.335.106.19 A
B. amyloliquefaciens + BC75.5 a,b68.3 a–d59.7 d–f67.8 A13.1 a11.9 a,b8.49 d–f11.2 A7.126.555.056.24 A
ME (I)69.0 A60.7 B45.8 C 11.1 A8.83 B6.97 C 6.67 A6.1 B4.85 C
Means sharing different letters are significantly different (p ≤ 0.05). ME = indicates main effect; IE = interactive effect; 4I = 4 irrigations; 3I = 3 irrigations; 2I = 2 irrigations.
Table 3. Effect of Agrobacterium fabrum, Bacillus amyloliquefaciens with/without biochar (30 Mg ha1) on spikelet’s spike1, grains spike1 and 1000 grains weight of wheat cultivated in drought-stressed field conditions.
TreatmentsSpikelets spike1Grains Spike11000 Grains Weight (g)
No. of Irrigations (I)
IE (T × I)ME (T)IE (T × I)ME (T)IE (T × I)ME (T)
4I3I2I4I3I2I4I3I2I
Control15.313.010.713.0 D37.727.722.029.1 C35.3 b–d28.2 f,g20.2 h27.9 C
A. fabrum16.013.713.014.2 C,D38.333.726.732.9 B,C34.2 c–f30.7 c–g25.5 g,h30.2 B,C
B. amyloliquefaciens16.013.312.714.0 C39.335.029.734.7 B35.2 b–e31.0 c–g26.8 g31.0 B
BC16.314.313.014.6 B,C47.342.032.740.7 A36.3 a–c31.1 c–g29.4 d–f32.3 B
A. fabrum + BC17.015.314.315.6 A,B45.340.739.041.7 A42.5 a34.7 b–e29.4 d–f35.5 A
B. amyloliquefaciens + BC17.315.715.316.1 A49.043.039.343.8 A40.8 a,b36.5 a–c28.9 e–f35.4 A
ME (I)16.3 A14.2 B13.2 C 42.8 A37.0 B31.6 C 37.4 A32.0 B26.7 C
Means sharing different letters are significantly different (p ≤ 0.05). ME = indicates main effect; IE = interactive effect; 4I = 4 irrigations; 3I = 3 irrigations; 2I = 2 irrigations.
Table 4. Effect of Agrobacterium fabrum, Bacillus amyloliquefaciens with/without biochar (30 Mg ha1) on nitrogen, phosphorus and potassium concentration in wheat grain cultivated in drought-stressed field conditions *.
TreatmentsGrains Nitrogen (%)Grains Phosphorus (%)Grains Potassium (%)
No. of Irrigations (I)
IE (T × I)ME (T)IE (T × I)ME (T)IE (T × I)ME (T)
4I3I2I4I3I2I4I3I2I
Control2.58 a–e1.99 h–j1.54 k2.04 D0.66 d–g0.43 i0.25 j0.44 D0.50 b–e0.45 e0.31 f0.42 D
A. fabrum2.78 a,b2.21 f–i1.79 j,k2.26 C0.71 c–f0.60 f–h0.45 i0.59 C0.55 a–c0.47 d,e0.43 e0.48 C
B. amyloliquefaciens2.73 a–c2.33 e–h1.86 i–k2.31 C0.75 a–e0.61 e–h0.48 h,i0.61 B,C0.56 a–c0.48 c–e0.46 e0.50 C
BC2.74 a–c2.55 b–f2.13 g–j2.47 B0.78 a–d0.68 c–g0.54 g–i0.67 B0.58 a0.50 b–e0.46 e0.51 B,C
A. fabrum + BC2.87 a,b2.68 a–d2.33 d–h2.63 A,B0.87 a,b0.73 b–f0.62 e–h0.74 A0.60 a0.54 a–d0.49 c–e0.55 A,B
B. amyloliquefaciens + BC2.92 a2.76 a–c2.42 c–g2.70 A0.87 a0.82 a–c0.66 d–g0.78 A0.61 a0.57 a,b0.50 b–e0.56 A
ME (I)2.77 A2.42 B2.01 C 0.77 A0.65 B0.50 C 0.57 A0.50 B0.44 C
Followed Danish and Zafar-ul-Hye, 2019 [22] for comparisons. Means sharing different letters are significantly different at p ≤ 0.05. ME = indicates main effect; IE = interactive effect; 4I = 4 irrigations; 3I = 3 irrigations; 2I = 2 irrigations.
Table 5. Effect of Agrobacterium fabrum, Bacillus amyloliquefaciens with/without biochar (30 Mg ha−1) on nitrogen, phosphorus and potassium concentration in wheat shoot cultivated in drought-stressed field conditions *.
TreatmentsShoot Nitrogen (%)Shoot Phosphorus (%)Shoot Potassium (%)
No. of Irrigations (I)
IE (T × I)ME (T)IE (T × I)ME (T)IE (T × I)ME (T)
4I3I4I3I4I3I
Control1.88 a1.33 c1.60 B0.420.26 0.34 C1.85 1.56 1.71 D
A. fabrum1.85 a1.58 b,c1.71 A,B0.46 0.36 0.41 B2.20 1.97 2.09 C
B. amyloliquefaciens1.85 a1.57 b,c1.71 A,B0.45 0.38 0.42 B2.20 2.01 2.11 C
BC1.88 a1.59 b1.73 A,B0.48 0.42 0.45 A,B2.56 2.17 2.37 B
BC + A. fabrum1.93 a1.75 a,b1.84 A0.51 0.43 0.47 A2.69 2.47 2.58 A
BC + B. amyloliquefaciens1.94 a1.75 a,b1.85 A0.53 0.45 0.49 A2.68 2.44 2.56 A
ME (I)1.89 A1.59 B 0.47 A0.39 B 2.37 A2.10 B
* Followed Danish and Zafar-ul-Hye, 2019 [22] for comparisons. Means sharing different letters are significantly different at p ≤ 0.05. Means sharing no letters are non-significant at p ≤ 0.05. ME = indicates main effect; IE = interactive effect; 4I = 4 irrigations; 3I = 3 irrigations.
Table 6. Effect of Agrobacterium fabrum, Bacillus amyloliquefaciens with/without biochar (30 Mg ha−1) on gas exchange attributes of wheat cultivated in drought-stressed field conditions *.
TreatmentsPhotosynthetic Rate
(µmol (CO2) m−2 s−1)
Transpiration Rate
(mmol (H2O) m−2 s−1)
Stomatal Conductance
(µmol (CO2) m−2 s−1)
No. of Irrigations (I)
IE (T × I)MEIE (T × I)ME (T)IE (T × I)ME (T)
4I3I(T) 4I3I4I3I
Control14.5 9.07 11.8 C4.352.973.66 D150.7 105.3 128.0 C
A. fabrum16.1 10.7 13.4 C4.904.234.56 C148.3 125.7 137.0 C
B. amyloliquefaciens15.9 10.1 13.0 B,C5.414.174.79 B,C166.7 127.7 147.2 B,C
BC17.4 13.5 15.5 A,B6.274.645.46 B181.3 145.0 163.2 A,B
A. fabrum + BC18.6 15.6 17.1 A7.355.856.60 A193.0 156.3 174.7 A
B. amyloliquefaciens + BC19.1 15.8 17.5 A7.865.436.64 A193.3 172.3 182.8 A
ME (I)16.9 A12.5 B 6.02 A4.55 B 172.2 A138.7 B
* Followed Danish and Zafar-ul-Hye, 2019 [22] for comparisons. Means sharing different letters are significantly different at p ≤ 0.05. Means sharing no letters are non-significant at p ≤ 0.05. ME = indicates main effect; IE = interactive effect; 4I = 4 irrigations; 3I = 3 irrigations.
Table 7. Effect of Agrobacterium fabrum, Bacillus amyloliquefaciens with/without biochar (30 Mg ha−1) on photosynthetic pigments synthesis in wheat leaves cultivated in drought-stressed field conditions *.
TreatmentsChlorophyll a
(mg g−1)
Chlorophyll b
(mg g−1)
Total Chlorophyll
(mg g−1)
Electrolyte Leakage
(%)
No. of Irrigations (I)
IE (T × I)ME (T)IE (T × I)ME (T)IE (T × I)ME
(T)
IE (T × I)ME
(T)
4I3I4I3I4I3I4I3I
Control0.87 0.68 0.77 C0.42 0.34 0.38 C1.29 1.02 1.15 C41.059.350.2 A
A. fabrum0.91 0.78 0.85 B,C0.47 0.39 0.43 B,C1.38 1.17 1.28 B,C40.355.347.8 A,B
B. amyloliquefaciens0.90 0.78 0.84 B,C0.48 0.38 0.43 B,C1.37 1.16 1.27 B,C41.354.047.7 A,B
BC0.99 0.85 0.92 B0.48 0.42 0.45 B1.47 1.27 1.37 B41.047.044.0 A,B
A. fabrum + BC1.16 0.98 1.07 A0.53 0.45 0.49 A,B1.68 1.44 1.56 A39.041.040.0 B
B. amyloliquefaciens + BC1.10 1.06 1.08 A 0.59 0.49 0.54 A1.69 1.55 1.62 A37.042.339.7 B
ME (I)0.99 A0.86 B 0.49 A0.41 B 1.48 A1.27 B 39.9 B49.8 A
* Followed Danish and Zafar-ul-Hye, 2019 [22] for comparisons. Means sharing different letters are significantly different at p ≤ 0.05. Means sharing no letters are non-significant at p ≤ 0.05. ME = indicates main effect; IE = interactive effect; 4I = 4 irrigations; 3I = 3 irrigations.

