Article

Effect of Soybean and Maize Rotation on Soil Microbial Community Structure

1
College of Agronomy, Inner Mongolia Agricultural University, No. 275, Xin Jian East Street, Hohhot 010019, China
2
Chifeng Academy of Agricultural and Animal Husbandry Sciences, Song Shan District, Chifeng 024031, China
*
Author to whom correspondence should be addressed.
These authors contributed equally to this work.
Agronomy 2019, 9(2), 42; https://doi.org/10.3390/agronomy9020042
Submission received: 29 October 2018 / Revised: 4 January 2019 / Accepted: 5 January 2019 / Published: 22 January 2019
(This article belongs to the Special Issue Environmental and Management Factor Contributions to Maize Yield)

Abstract

:
Examining the soil microbiome structure has great significance in terms of exploring the mechanism behind plant growth changes due to maize (Zea mays L.) and soybean (Glycine max Merr.) crop rotation. This study explored the effects of soil microbial community structure after soybean and maize crop rotation by designing nine treatments combining three crop rotations (continuous cropping maize or soybean; and maize after soybean) with three fertility treatments (organic compound fertilizer, chemical fertilizer, or without fertilizer). Soil was sampled to 30 cm depth the second year at approximately the middle of the growing season, and was analyzed for physical, chemical, and phospholipid fatty acid (PLFA) profiles. Bacteria was found to be the predominant component of soil microorganisms, which mainly contained the PLFAs 16:0. Crop rotation with organic compound fertilizer application reduced the percentage of fungi in the soil by 24% compared to continuous maize and soybean with the same fertilizer application. The combination of crop rotation with organic fertilizer can reduce the percentage of fungi/bacteria to the greatest degree. In addition, the content of soil aggregate and organic matter had great influence on Gram-positive bacteria and actinomyces. In conclusion, soybean and maize crop rotation improve the soil nutrient content primarily by influencing the composition of bacterial community, especially the Gram-positive bacteria.

1. Introduction

The quality of soil is one of the most important factors affecting crop growth because it is not only one of the major components of the environment but also is necessary for the survival of field crops. Maize is the world’s largest grain crop and thus has high economic value. However, the continuous planting of maize leads to the lack of soil nutrient uniformity and intensifies the occurrence and transmission of soil diseases in the same plot. In order to relieve the land pressure, knowledge of the effects of crop rotation patterns of maize and other crops on soil properties is important. Owing to the long-term economic and ecological benefits of Leguminosae crops and Gramineae crops, crop rotation patterns between the two plant families has long been considered the optimal system for maintaining the soil nutrient cycle. A great deal of research has been done on inserting exotic Leguminosae into various crop rotation patterns. For example, the three-course cropping of ancient Greece and Rome (three plot of field, fallow land, spring sowing land, autumn (winter) sowing land respectively, and rotate in the same order, so in three years, each plot can fallow one time), the British Norfolk 4-year rotation model (red clover-wheat/rye-feeding turnip/sugar-beet-two-rowed barley/red clover) in 1730 and the American 6-year rotation model initiated in 1794 were both examples of legume and non-legume crop rotation [1]. However, there have been few studies on the ecological effects of crop rotation, most of which focus on crop yield and the effect on physical and chemical soil properties. Furthermore, the detection and analysis of the change of soil microbial community structure before and after crop rotation has not been common.
Microorganisms are an important component of the material cycle and energy transformation process in a soil ecosystem. Due to the effect of fertilization, soil microorganisms not only affect the physical and chemical properties of soil but also affect the effectiveness of fertilizers on plants [2]. Fertilization mainly affects soil microorganisms by changing the physical and chemical properties of soil as well as its nutrient contents. Fertilization affects soil microorganisms mainly by changing the physical structure and nutrient content of soil and the amount of root and aboveground litter of crops [3]. The rhizosphere is the microenvironment in which plants come into contact with soil. The soil microbial community composition is an important limiting factor of soil processes, and the composition and activity of a microbial community largely determine biogeochemical cycles, metabolic processes of soil organic matter, and soil fertility and quality [4,5]. In addition, soil microorganisms are closely related to the stability and health of the soil ecosystem. Soil microorganisms are more sensitive to changes in external conditions, such as land use change, management measures, and cultivation than other soil physical and chemical indexes. Therefore, soil microbial biomass, community composition, and diversity are often used as indicators of soil quality changes [6,7].
Phospholipid fatty acid (PLFA) spectrogram technology was used to analyze biological community structures in the 1980s [8,9]. This method of analysis relies on fatty acid spectrograms to quantify the entire microbial community without the need for soil enrichment or cultivation, and therefore is quicker and more reliable than traditional approaches [10]. Although this method cannot identify the specific microbial species at the strain level, PLFA does not depend on the influence of the plant culture system, but can directly provide information and quantitatively describe the whole microbial community. This method also has the advantages of objective and reliable test results, simple operation of test conditions, and multiple test functions and has been used widely in the field of cycle microbiology. In order to clarify the effects of crop rotation and fertilization on soil microbial community structure, PLFA was used to analyze the microbial community composition of soil samples.

2. Materials and Methods

2.1. Study Survey and Design

The experiments were conducted at Chifeng Academy of Agricultural and Animal Husbandry Sciences, Inner Mongolia Autonomous Region, northeastern China (42°15′ N, 118°72′) in 2016 and 2017. The study area has a temperate semi-arid continental climate, with an average annual temperature of 6.5 °C and an average annual precipitation of 380 mm, with the precipitation mainly concentrated in July and August. The sunshine time is generally at least 2800 to 3200 h/year. The main crops grown in the area are maize, buckwheat (Fagopyrum esculentum Moench.), and millet (Panicun italicun L.). The previous crop in the farmland was maize.
A randomized block design was used in this experiment with three replications. There were nine cropping designs for the study including (1) continuous cropping of maize with organic compound fertilizer (CM + OF), (2) continuous cropping of maize with chemical fertilizer Nitrogen and Phosphorus (CM + NP), (3) continuous cropping maize without fertilizer (CM + 0), (4) maize after soybean with organic compound fertilizer (SM + OF), (5) maize after soybean with chemical fertilizer Nitrogen and Phosphorus (SM + NP), (6) maize after soybean with no fertilizer (SM + 0), (7) soybean continuous cropping with organic compound fertilizer (CS + OF), (8) continuous cropping soybean with chemical fertilizer Nitrogen and Phosphorus (CS + NP), and (9) continuous cropping soybean without fertilizer (CS + 0). The annual planting date was 18 May, and the amount of fertilizer applied per year was consistent. According to the local recommendation, 300 kg/ha of chemical (NP) fertilizer diammonium phosphate (N 13%, P2O5 44%) were applied for maize, 150 kg/ha of chemical (NP) fertilizer diammonium phosphate (N 13%, P2O5 44%) were applied for soybean, and the rate of organic compound fertilizer for maize and soybean is 900 kg/ha. The chemical fertilizer and organic compound fertilizer were applied when sowing. The rotation area was planted with soybeans in 2016 and maize in 2017. The field management measures are similar to local management measures. Drip irrigation was carried out after sowing to ensure seedling emergence rate. Beginning on 29 June, every 30 days, field weeds were removed up until the crops were harvested. Sowing rate of soybean and maize rotation in trial plots 2016–2017 is shown in Table 1.

2.2. Samples Collection

The soil samples of the study area were obtained during the vigorous growth of crops on 8 August 2017. In each plot, three points located 5 cm from the root were randomly selected from the rhizosphere of maize and soybean. Soil samples, which were taken at the soil depth of 0–30 cm, were separated into two samples. One sample was dried to analyze the soil physical structure and chemical properties, the other sample was stored in a freezer at −20 °C for the determination of soil microbial community structure.

2.3. Soil Physical and Chemical Properties

The content of soil macroaggregates (SA) was measured by mechanical sieving method. Soil pH (pH) in water was measured at a soil/water ratio of 2:5 (w:v) after 1 h in suspension for water. Soil available nitrogen (AN) was determined using the alkaline diffusion method; soil available phosphorus (AP) and soil organic matter (SOM) were measured by NaHCO3 leaching molybdenum-antimony anti-absorption spectrophotometry and potassium dichromate volumetric method, respectively [11,12,13].

2.4. Determination of Soil Microbial Community Structure

Soil microorganisms PLFAs were extracted by Bligh-Dyer modified method and esterified C19:0 was used as the internal standard [14]. Briefly, the processes of extraction, purification, and analysis consisted of measuring 2 g freeze-dried soil, then 20 mL chloroform-methanol-citric acid buffer (1:2:0.8, v/v/v) was added to extract total PLFAs of the samples. The extracted PLFAs were subsequently separated by silica gel column (SPE-SI), and consisted of neutral fatty acids, sugar fatty acids, and phosphatidic acid. Phospholipid acid was dissolved in methanol/toluene (1:1, v/v) solution, then 0.2 mol/L KOH was added, the solution was esterified at 37 °C for 15 min, then separated by GC-MS (gas chromatograph-mass spectrometry) analyzer, and then separated by bacterial fatty acid standards and commercial MIDI system (Microbial Identification System) to identify and quantify phospholipid fatty acids. Soil microbial phospholipid fatty acid profiles were obtained by analyzing the corresponding microbial communities, and the structural diversity of soil microbial communities were judged by statistical analysis [15]. Phospholipid fatty acids were determined based on Frostegard et al. [16]: [i/a/cy/br/10Me (delspray with methyl in the 10th carbon atom)] X:Y ω Z (OH/cis/t), where X represents the total number of C atoms of fatty acid molecule, Y indicates the number of unsaturated olefin bonds, ω represents the position of the olefinic bond from the carboxyl group, Z represents the position of the olefin bond or cyclopropane chain. The prefix “i” (iso) represents the isomeric methyl branched chain (the third carbon atom from the methyl end), “a” (anteiso) represents the pre-isomeric methyl branched chain (the third carbon atom from the methyl end), “cy” represents the cyclopropyl group, and “br” represents the unknown position of the methyl chain.
The suffixes “cis” and “trans” represent cis and trans isomers, respectively, and the number before “OH” denotes the position of hydroxyl groups (counted from the carboxyl end, the second carbon is alpha, and the third carbon is beta). Characterization of microbial PLFA is shown in Table 2 [17,18,19,20,21,22,23].

2.5. Data Analysis

The data in this paper were analyzed by variance analysis, principal component analysis (PCA), and nonlinear dimensionality reduction analysis (RDA) in Excel (Microsoft Office 2016, Microsoft: 2015, Washington, WA, USA), SPSS 25.0 (Statistical Product and Service Solutions. International Business Machines Corporation (IBM), 2017, Chicago, IL, USA), and R (R Foundation for Statistical Computing 3.5.1, R Core Development Team, 2018, Vienna, Austria). Excel was used to calculate the mean and standard deviation of all data. The principal component analysis of phospholipid fatty acid data was carried out using SPSS 25.0. The relationship between soil microbial community structure and characteristics of environmental soil factors was redundantly analyzed by R language vegan package, and the correlation between them was further analyzed by R language corrplot package.

3. Results

3.1. Effects of Each Treatment on the Composition and Content of Phospholipid Fatty Acids

Altogether, 20 kinds of phospholipid fatty acids were checked from the soil samples treated by the different rotation and fertilizer treatments. There were seven kinds of phospholipid fatty acids among the 20 kinds of phospholipid fatty acids with significant effects with regard to the rotation treatment or interaction between rotation treatment and fertilizer treatment. From Table 3, we can see that seven kinds of phospholipid fatty acids were mainly detected in this study, in which 16:0 (Gram-positive bacteria) had the maximum content, accounting for 11.6–12.7% of the total phospholipid fatty acids. These seven kinds of phospholipid fatty acids belonged to Gram-positive bacteria, Gram-negative bacteria, AM Fungi, Actinomycetes, and other bacteria.
The rotation treatment had a significant effect on the content of a15:0, 16:0, 16:1ω5c, and 18:0 at p ≤ 0.01, had a significant effect on 17:1 ω 7c and 10Me18:0 at p ≤ 0.05, and did not have a significant effect on i16:0. The fertilizer treatment had no significant effect on the content of the above phospholipid fatty acids, there were significant effect on the content of i16:0 at p ≤ 0.05 in the interaction between rotation treatment and fertilizer treatment, no significant differences were observed between the others as a result of the interaction between the treatment of rotation and fertilizer.
For a15:0, soybean continuous cropping with chemical fertilizer applied resulted in significantly higher numbers than that maize continuous cropping with organic fertilizer and chemical fertilizer applied. For another Gram-positive bacteria (i16:0), there was significant interaction between fertilizer and cropping system (p = 0.047). For 17:1 ω 7c, continuous cropping of maize without fertilizer was remarkably higher than soybean continuous cropping with organic fertilizer and without fertilization. Cropping system had a significant effect on its content at 0.05 level (p = 0.018). Cropping system had an extremely significant influence on 16:1 ω 5c (AM Fungi (Arbuscular Mycorrhizal Fungi)) at the 0.01 level (p = 0.000); its numbers were significantly lower in soybean continuous cropping than maize continuous cropping and soybean-maize rotation.
The content of 10Me18:0 presented a significant difference under the SM + OF, which displayed significantly higher content than all of the other treatments, and there was no significant difference between the other treatments. The 18:0 displayed a significant difference under the CS + OF, CS + NP, and CS + 0, although there was no significant difference observed between CS + OF, CS + NP, and CS + 0, all of which displayed significantly higher content than all the other treatments.
The rotation treatment had a significant effect on the content of Gram-positive bacteria (G+) and the other bacteria at p ≤ 0.01; had a significant effect on Gram-negative bacteria (G-), fungi, and fungi/bacteria at p ≤ 0.05; but did not have a significant effect on Actinomycetes. The fertilizer treatment had no significant effect on the content of the above phospholipid fatty acids, only the content of Gram-positive bacteria (G+) showed significant differences at p ≤ 0.05 in the interaction between rotation treatment and fertilizer treatment. Table 4 shows that bacteria accounted for 69% to 71% of the total amount of soil microorganisms, and thus represented the main component of the soil microorganisms. While fungi only accounted for about 3% of the total amount of microorganisms, other bacteria accounted for 8.1–9.9% of the total amount. Cropping system had a significant effect on the composition of the soil microbial community and had a significant effect on Gram-positive bacteria (p = 0.008) and other bacteria (p = 0.006). For Gram-positive bacteria, there was an obvious interaction between fertilizer and farming system (p = 0.034).
Analysis of variance for the fertilizer treatment showed that the content of Gram-negative bacteria (G-) was significantly affected by fertilizer application under the condition of continuous maize cropping system at the 0.01 level. The content of Gram-positive bacteria (G+) was significantly affected by fertilizer application under the condition of soybean-maize rotation system at the 0.01 level (Table 5). Under the condition of continuous maize cropping system, the content of Gram-negative bacteria (G-) treated by organic fertilizer and chemical fertilizer application was significantly higher than that of no fertilizer treatment at the level of 0.01, and there was no significant difference between the organic fertilizer and chemical fertilizer application treatments. Under the condition of the soybean-maize rotation system, the content of Gram-positive bacteria (G+) treated by organic fertilizer application and no fertilizer was significantly higher than that of chemical fertilizer application at the 0.01 level, and there was no significant difference between the organic fertilizer application and no fertilizer.

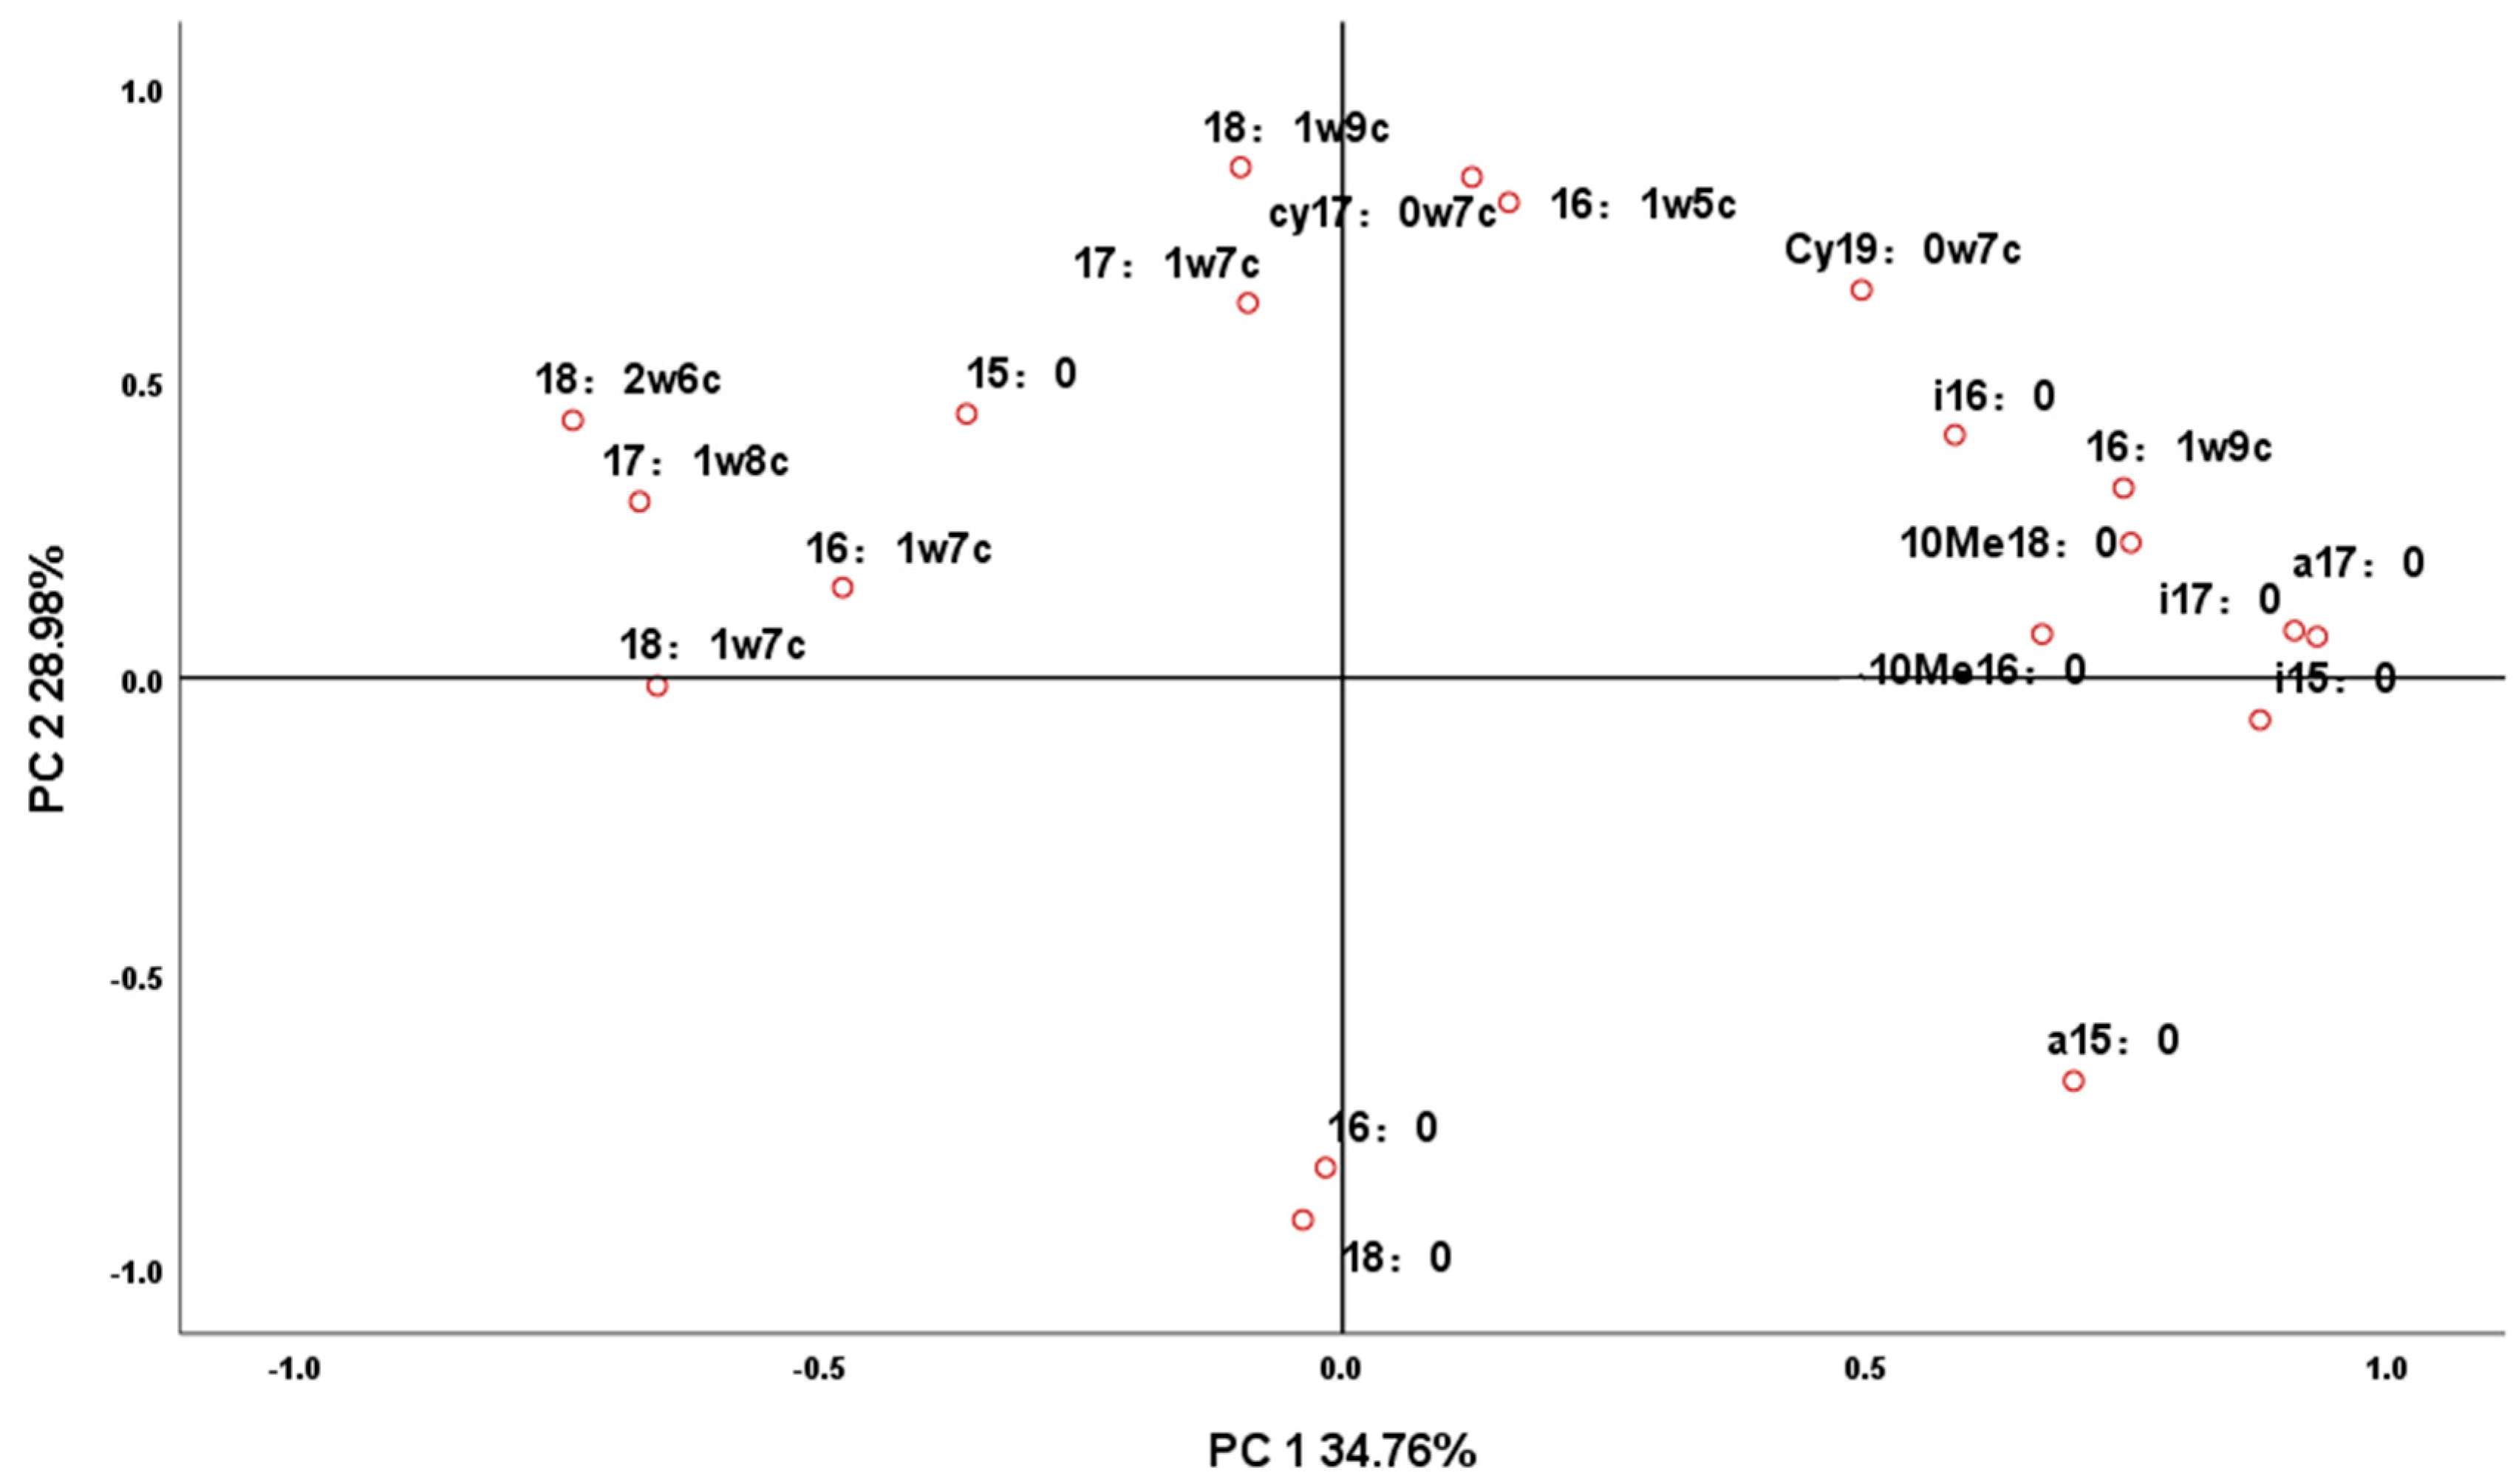
3.2. Principal Component Analysis of Microbial Fatty Acids in Soil by Each Treatment

The principal component analysis of the microbial fatty acids in soil is presented in Figure 1, where explanation variances of the first principal component (PC1) and the second principal component are 34.76% and 28.98%, respectively (Figure 1). Indeed, PC1 is highly related with i17:0, a17:0, and i15:0, which all belong to Gram-positive bacteria, and their component matrix coefficients are 0.932, 0.911, and 0.876, respectively (Figure 1, Table 6). Meanwhile, PC2 displays the more obvious correlations with 18:1 ω 9c, cy17:0 ω 7c, and 16:1 ω 5c, with corresponding component matrix coefficients of 0.866, 0.846, and 0.802, respectively (Figure 1, Table 6). However, there are some lower correlations between PC1 and 18:0, 16:0, and 17:1 ω 7c, which have corresponding component matrix coefficients of −0.053, −0.030, and −0.080, respectively. Moreover, the component matrix coefficients of i17:0, a17:0, and 10Me16:0 to PC2 are also lower, with corresponding values of 0.064, 0.054, and 0.062, respectively (Figure 1, Table 6).

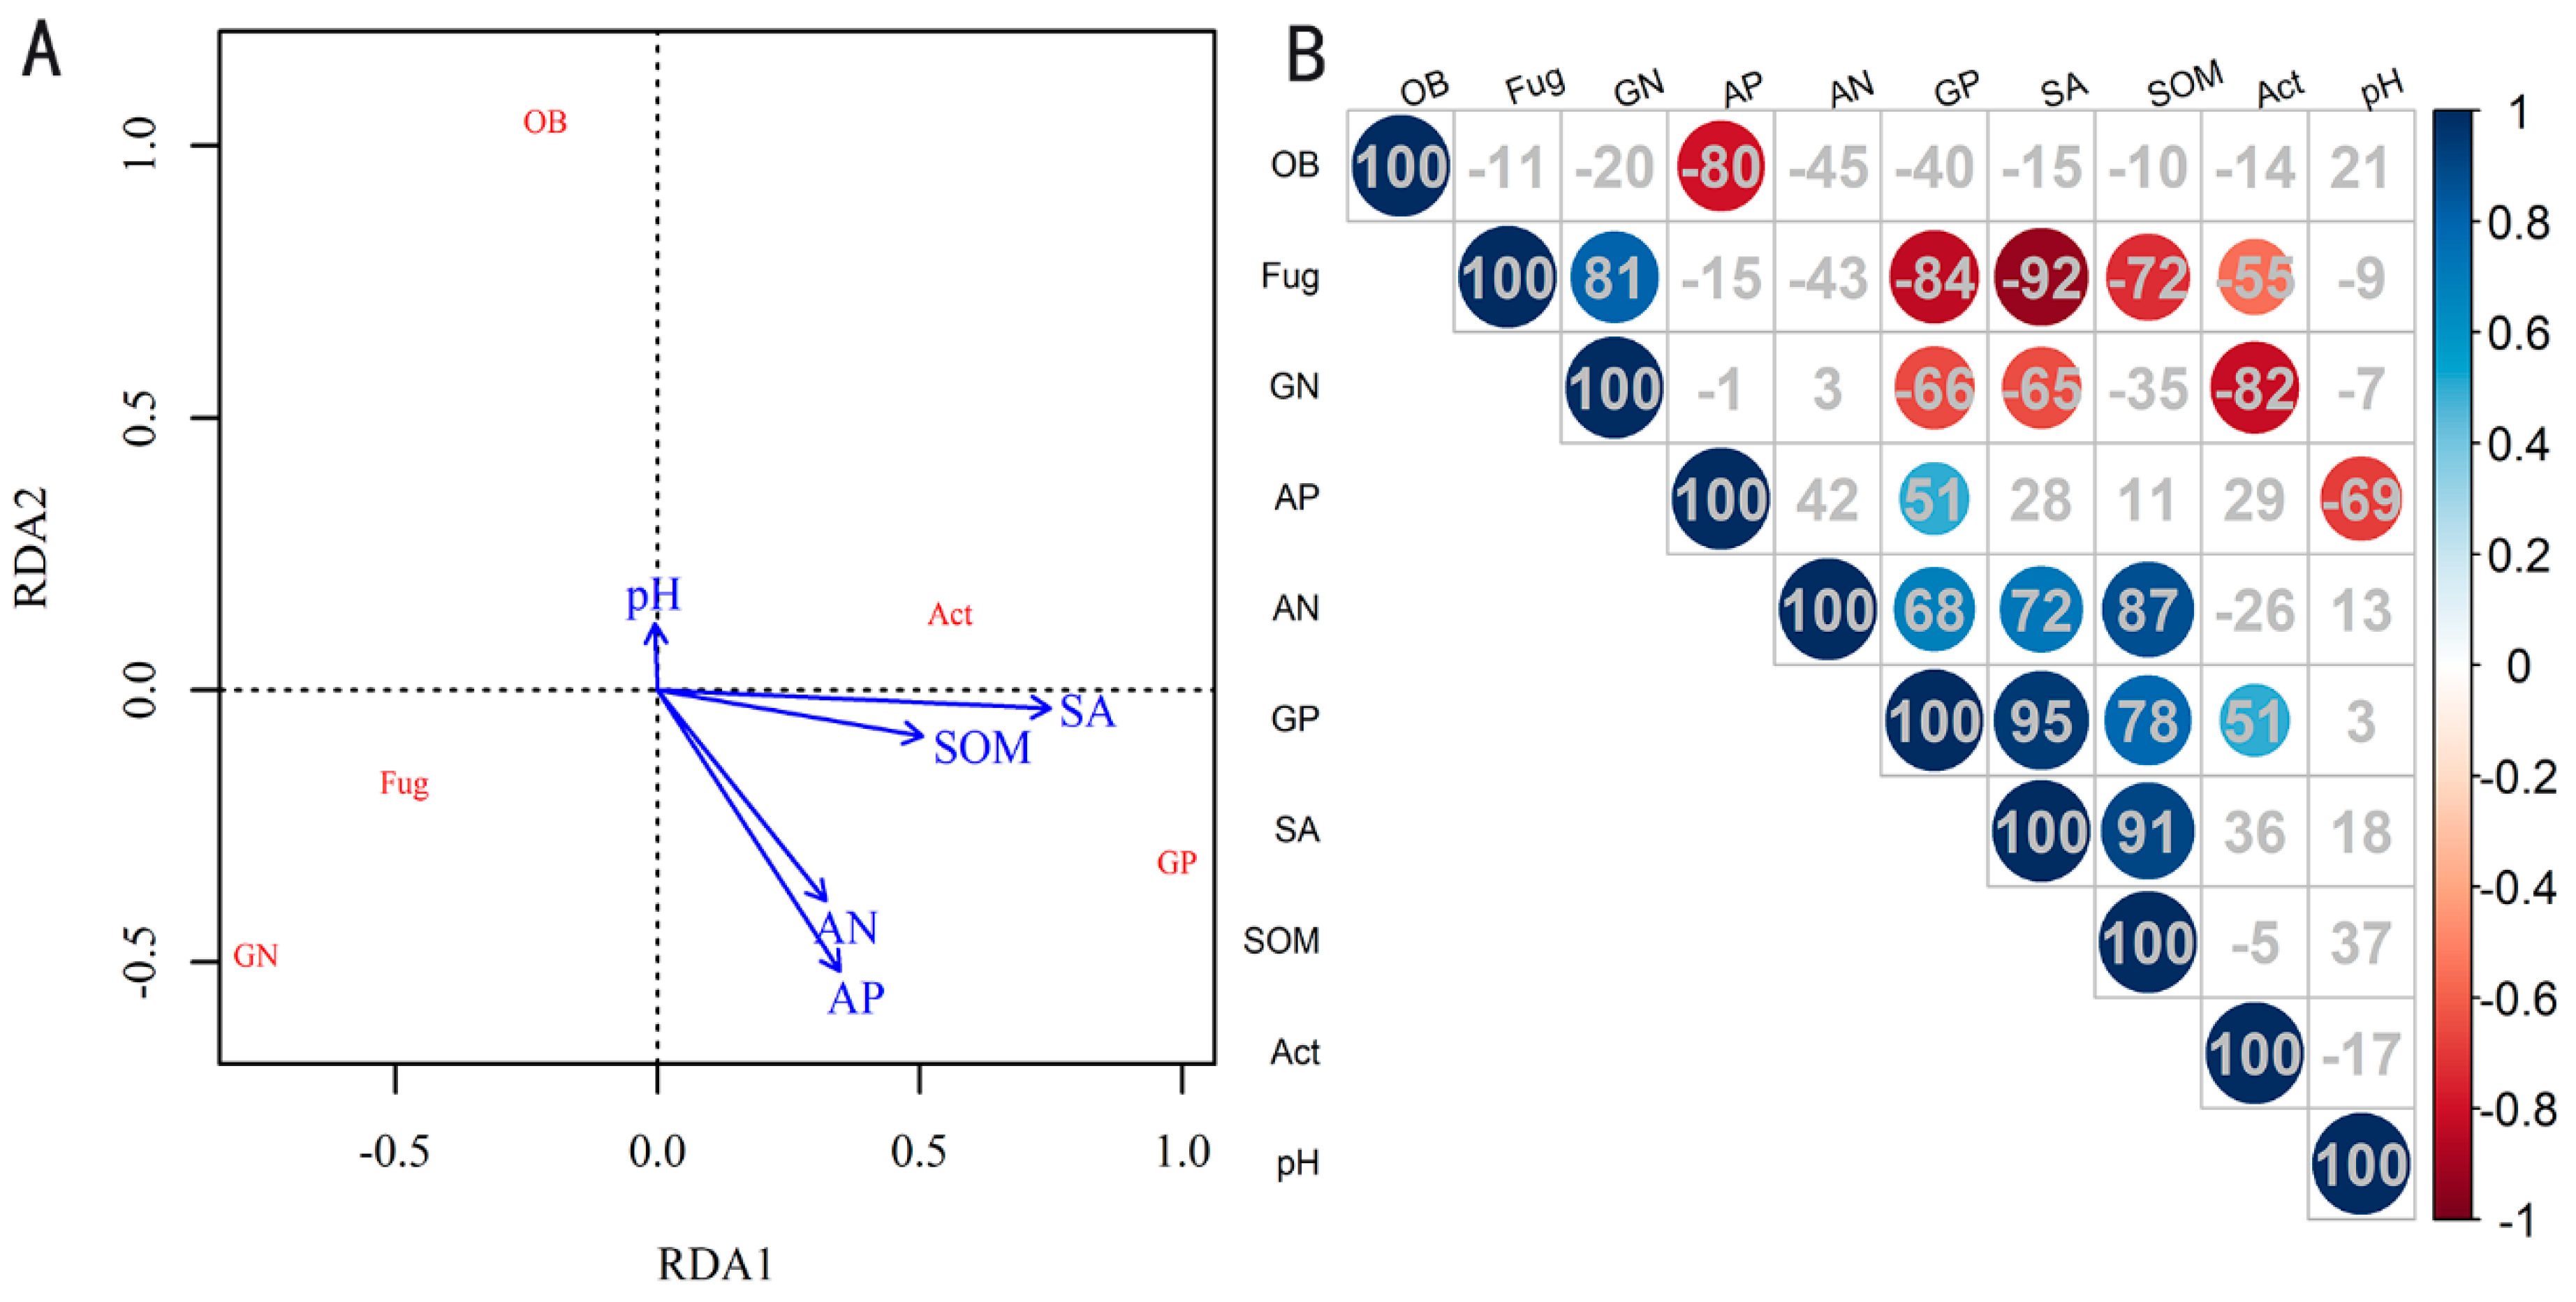
3.3. Relationship between Soil Microbial Community Structure and Soil Properties

Relationships among soil microbial community structure and soil properties were investigated by redundancy analysis (RDA) and correlation analysis in Figure 2, where AP showed a significant negative effect on OB, and inversely positively affected GP with R2 = 0.80 and 0.51 (p < 0.05), respectively. There were significant correlativity between SA with Fug and GN, as well as GP (p < 0.05), with R2 values of −0.92, −0.65, and 0.95, respectively (Figure 2). GP was also dramatically positively influenced by SOM (R2 = 0.78, p < 0.05) and AN (R2 = 0.68, p < 0.05), besides SA and AP. There were no soil properties significantly affecting Act (p < 0.05).

4. Discussion

Microorganisms play a vital role in the material cycle and energy transformation of the soil ecosystem, and the soil microbial community structure represents an important aspect to consider when investigating the effect of different crop planting patterns on soil properties. In this study, the results showed that bacteria were the main components of the soil microbial community, which mainly included Gram-positive bacteria and Gram-negative bacteria under the three crop planting patterns (Table 3 and Table 4). Some previous research that suggested that bacteria are the main content of soil microorganisms is in agreement with our results [24]. Many types of bacteria have high environmental resistance, such as Gram-positive bacteria and Gram-negative bacteria, which have spores and thicker cell walls and adjust their cell wall structure to adapt to environmental changes [24,25,26]. Hence variation of bacteria community structure has a significant effect on soil properties [25]. However, some differences in the bacteria community structure were observed under the three crop planting patterns (see Table 4).
Crop rotation has a significant impact on the composition of soil microbial community. Previous studies have shown that complex crop rotation can improve soil quality and crop productivity, including studies on perennial plants [27], and cover crops such as oat, radish, and vetch could increase the bacterial content in PLFA, especially the content of Gram-positive bacteria [28]. In this study, there were some obvious variations observed with Gram-positive bacteria. Gram-positive bacteria presented a significant negative correlation with Gram-negative bacteria (Figure 2). The percentage of Fungi content was reduced in other treatments in comparison to maize continuous cropping (Table 4). Bin Zhang’s study had a similar conclusion as the results of this study: short-time rotation has a significant impact on soil fungi community structure, especially arbuscular mycorrhizal fungi, short-time rotation can significantly reduce the content of soil fungi, which resulted in higher biomass of fungi in continuous cropping of maize than rotation. Bacteria account for a large proportion of the soil microbial community, and continuous cropping can increase the content of fungi in soil, which leads to the intensification of soil-borne diseases, but fungi play an important role in the decomposition of recalcitrant compounds in corn residues at later stages [29]. Chavarría et al. suggested that microbial community structure would not change during short-time rotations, which is not supported from the results of this research [28].
Fertilizer application had a significant impact on the content of Gram-negative bacteria (G-) under the cropping system of continuous maize, and showed no significant difference under the cropping system of soybean-maize rotation and continuous soybean. It is possible that the function of nitrogen fixation by soybean fertilized the soil, which covered the response of the Gram-negative bacteria (G-) to the fertilizer application. Fertilizer application had a significant impact on Gram-positive bacteria (G+) under the soybean-maize rotation system, but no significant differences were observed under either the continuous maize or continuous soybean cropping systems. Under the soybean-maize rotation system, the organic fertilizer application treatment and no fertilizer treatment showed a higher content of Gram-positive bacteria (G+) than that of the chemical fertilizer application treatment. The reason for this may be that the Gram-positive bacteria (G+) can be promoted by the organic fertilizer, and be restrained by the chemical fertilizer, due to the supplement of organic fertilizer by nitrogen fixation of no fertilizer application treatment, the effect of promotion and restraining was affected by the soil condition of rotation system, continuous maize system and continuous soybean system. The mechanism(s) behind the response of Gram-negative bacteria (G-) and Gram-positive bacteria (G+) to soil characteristics and fertilizer application should be explored in future research.
The relationship between environmental factors and soil microbial community structure is rather complicated. In our exploration, bacteria (Gram-positive bacteria) primarily improve soil nutrient content, which includes soil available phosphorus, soil available nitrogen, and soil organic matter (Figure 2), Our results also indicated that the Gram-positive bacteria is primarily composed of i17:0, a17:0, and i15:0 (Figure 1). The principal reason for this phenomenon is microbial decomposition. The role of specific species of bacteria needs further study.

5. Conclusions

This study clearly demonstrates the effects of soil microbial community structure under three crop planting patterns on soil properties. The specific conclusions are as follows: (1) bacteria were the main components of the soil microbial community, which mainly included 16:0 (Gram-positive bacteria) under the three crop planting patterns; (2) crop rotation changed the microbial community structure, especially Gram-positive bacteria, which was significantly impacted by the interaction between crop rotation and fertilizer application; (3) Gram-positive bacteria have significant beneficial effects on the soil nutrient content, including the soil available phosphorus, soil available nitrogen, and soil organic matter after soybean and maize crop rotation. In conclusion, soybean and maize crop rotation can improve the soil nutrient content primarily by influencing the composition of bacterial community.

Author Contributions

P.Z., J.S., and L.L. conceived and designed the experiments; X.W., X.L., and J.Q. performed the experiments; P.Z. and L.L. wrote the paper.

Funding

This study was funded by the National Natural Science Foundation of China (31660374), National Commonwealth Industry (Agriculture) Program of China [201503120], National Key Research and Development Program of China [2017YFD0300802].

Acknowledgments

We would like to thank the Oat Research Team for field and data collection, and especially Juliann Seebauer for manuscript revisions.

Conflicts of Interest

The authors declare no conflicts of interest.

References

  1. Olsen, R.J.; Hensler, R.F.; Attoe, O.J.; Witzel, S.A.; Peterso, L.A. Fertilizer Nitrogen and Crop Rotation in relation to movement of Nitrate Nitrogen through Soil Profiles. Soil Sci. Soc. Am. J. 1970, 34, 448–452. [Google Scholar] [CrossRef]
  2. Jenkinson, D.S.; Ladd, J.N. Microbial Biomass in Soil: Measurement and Turnover. Soil Biochem. 1981, 5, 415–471. [Google Scholar]
  3. Wu, Q.; Lu, K.; Mao, X.; Qin, H.; Wang, H. Responses of Soil Nutrients and Microbial Biomass and Community Composition to Long-term Fertilization in Cultivated Land. Chin. Agric. Sci. Bull. 2015, 31, 150–156. [Google Scholar]
  4. Cavigelli, M.A.; Robertson, G.P. The functional significance of denitrifire community composition in a terrestrial ecosystem. Ecology 2000, 81, 1402–1414. [Google Scholar] [CrossRef]
  5. Zelles, L. Fatty acid patterns of phospholipids and lipopolysaccharides in the characterisation of microbial communities in soil: A review. Biol. Fertil. Soils 1999, 29, 111–129. [Google Scholar] [CrossRef]
  6. Miller, M.; Dick, R.P. Dynamics of soil C and microbial biomass in whole soil and aggregates in two cropping systems. Appl. Soil Ecol. 1995, 2, 253–261. [Google Scholar] [CrossRef]
  7. Bucher, A.E.; Lanyon, L.E. Evaluating soil management with microbial community-level physiological profiles. Appl. Soil Ecol. 2005, 29, 59–71. [Google Scholar] [CrossRef]
  8. White, D.C.; Davis, W.M.; Nickels, J.S.; King, J.D.; Bobbie, R.J. Determination of the sedimentary microbial biomass by extractible lipid phosphate. Oecologia 1979, 40, 51–62. [Google Scholar] [CrossRef]
  9. Tunlid, A.H.; Baird, B.B.; Trexler, M.; Olsson, S.; Findlay, R.; Odham, G.C.; White, D. Determination of phospholipid ester-linked fatty acids and poly β-hydroxybutyrate for the estimation of bacterial biomass and activity in the rhizosphere of the rape plant Brassica napus (L.). Can. J. Microbiol. 1985, 31, 1113–1119. [Google Scholar] [CrossRef]
  10. Roslev, P.; Iversen, N.; Henriksen, K. Direct fingerprinting of metabolically active bacteria in environmental samples by substrate specific radiolabelling and lipid analysis. J. Microbiol. Methods 1998, 31, 99–111. [Google Scholar] [CrossRef]
  11. ISSCAS. Physical and Chemical Analysis Methods of Soils; Institute of Soil Sciences, Chinese Academy of Sciences; Shanghai Science and Technology Press: Shanghai, China, 1978; pp. 7–59. (In Chinese) [Google Scholar]
  12. Hong, S.B.; Piao, S.L.; Chen, A.P.; Liu, Y.W.; Liu, L.L.; Peng, S.S.; Sardans, J.; Sun, Y.; Penuelas, J.; Zeng, H. Afforestation neutralizes soil pH. Nat. Commun. 2018, 9, 7. [Google Scholar] [CrossRef] [PubMed]
  13. Chen, X.H.; Duan, Z.H. Changes in soil physical and chemical properties during reversal of desertification in Yanchi County of Ningxia Hui autonomous region, China. Enviorn. Geol. 2009, 57, 975–985. [Google Scholar] [CrossRef]
  14. Bossio, D.A.; Scow, K.M. Impacts of Carbon and Flooding on Soil Microbial Communities: Phospholipid Fatty Acid Profiles and Substrate Utilization Patterns. Microb. Ecol. 1998, 35, 265–278. [Google Scholar] [CrossRef] [PubMed]
  15. Wu, J.; Jiang, Y.; Wu, Y.; Xu, J. Effect of complex heavy metal pollution on biomass and community structure of soil microbes in paddy soil. Acta Pedol. Sin. 2008, 45, 1102–1109. [Google Scholar] [CrossRef]
  16. Frostegård, Å.; Bååth, E.; Tunlio, A. Shifts in the structure of soil microbial communities in limed forests as revealed by phospholipid fatty acid analysis. Soil Biol. Biochem. 1993, 25, 723–730. [Google Scholar] [CrossRef]
  17. Federle, T.W. Microbial distribution in the soil-new techniques. In Perspectives in Microbial Ecology, Proceedings of the International Symposium of Microbial Ecology IV, Ljubljana, Slovenia, January 1986; Megusar, F., Gantar, M., Eds.; Slovene Society for Microbiology: Ljubljana, Slovenia, 1986; pp. 493–498. [Google Scholar]
  18. Hamel, C.; Vujanovic, V.; Jeannotte, R.; Nakano-Hylander, A.; St-Arnaud, M. Negative feedback on a perennial crop: Fusarium crown and root rot of asparagus is related to changes in soil microbial community structure. Plant Soil 2005, 268, 75–87. [Google Scholar] [CrossRef]
  19. Tunlid, A.; Hoitink, J.H.A.; Low, C.; White, C.D. Characterization of bacteria that suppress rhizoctonia damping-off in bark compost media by analysis of Fatty Acid biomarkers. Appl. Environ. Microbiol. 1989, 55, 1368–1374. [Google Scholar]
  20. Zogg, G.P.; Zak, D.R.; Ringelberg, D.B.; White, D.C.; MacDonald, N.W.; Pregitzer, K.S. Compositional and Functional Shifts in Microbial Communities Due to Soil Warming. Soil Sci. Soc. Am. J. 1997, 61, 475. [Google Scholar] [CrossRef]
  21. Blume, E.; Bischoff, M.; Reichert, J.M.; Moorman, T.; Konopka, A.; Turco, R.F. Surface and subsurface microbial biomass, community structure and metabolic activity as a function of soil depth and season. Appl. Soil Ecol. 2002, 20, 171–181. [Google Scholar] [CrossRef]
  22. Brant, J.B.; Myrold, D.D.; Sulzman, E.W. Root controls on soil microbial community structure in forest soils. Oecologia 2006, 148, 650–659. [Google Scholar] [CrossRef]
  23. Xu, Y.; Cai, X.; Zhu, X. Comparative analysis of microbial community structures in soils from rice-upland crop rotation fields by PLFA profile technique. Acta Agric. Zhejiangensis 2013, 25, 1056–1061. [Google Scholar] [CrossRef]
  24. Song, Y.S.P.; Deng, V. Acosta-Martínez, E. Katsalirou. Characterization of redox-related soil microbial communities along a river floodplain continuum by fatty acid methyl ester (fame) and 16s rrna genes. Appl. Soil Ecol. 2008, 40, 499–509. [Google Scholar] [CrossRef]
  25. Zhang, X.; Xin, X.; Zhu, A.; Yang, W.; Zhang, J.; Ding, S.; Mu, L.; Shao, L. Linking macroaggregation to soil microbial community and organic carbon accumulation under different tillage and residue managements. Soil Tillage Res. 2018, 178, 99–107. [Google Scholar] [CrossRef]
  26. Mccann, M.C.; Shi, J.; Roberts, K.N.; Carpita, C. Changes in pectin structure and localization during the growth of unadapted and nacl-adapted tobacco cells. Plant J. 2010, 5, 773–785. [Google Scholar] [CrossRef]
  27. Kiani, M.; Hernandez-Ramirez, G.; Quideau, S.; Smith, E.; Janzen, H.; Larney, F.J.; Puurveen, D. Quantifying sensitive soil quality indicators across contrasting long-term land management systems: Crop rotations and nutrient regimes. Agric. Ecosyst. Environ. 2017, 248, 123–135. [Google Scholar] [CrossRef]
  28. Chavarría, D.N.; Verdenelli, R.A.; Serri, D.L.; Restovich, S.B.; Andriulo, A.E.; Meriles, J.M.; Vargas-Gil, S. Effect of cover crops on microbial community structure and related enzyme activities and macronutrient availability. Eur. J. Soil Biol. 2016, 76, 74–82. [Google Scholar] [CrossRef]
  29. Zhang, B.; Li, Y.; Ren, T.; Tian, Z.; Wang, G.; He, X. Short-term effect of tillage and crop rotation on microbial community structure and enzyme activities of a clay loam soil. Biol. Fertil. Soils 2014, 50, 1077–1085. [Google Scholar] [CrossRef]
Figure 1. Principal component analysis (PCA) of microbial fatty acids in soil. This figure is a principal component analysis based on the phospholipid fatty acid structure nomenclature. PC: Principal Component.
Agronomy 09 00042 g001
Figure 2. Effects of environmental factors on soil microbial community structure. (A) Redundancy analysis (RDA) of environmental factors on soil microbial community structure. (B) Correlation analysis of soil environmental factors and soil microbial community. GP: Gram-positive bacteria; GN: Gram-negative bacteria; Fug: Fungi; Act: Actinomycetes; OB: other bacteria. SA: soil macroaggregate content; AP: available phosphorus; AN: soil available nitrogen; SOM: soil organic matter.
Agronomy 09 00042 g002
Table 1. Sowing rate of soybean and maize rotation in trial plots 2016–2017.
PlantsVarietiesSowing RatePlant SpacingRow Spacing
Plant/hacmcm
maizeFengdan 18967,5003345
soybeanRed bean 3210,0001240
Table 2. Phospholipid fatty acid (PLFA) characterization of microorganisms.
Microbial TypePhospholipid Fatty Acid Labelled
Bacteria in general (B)i14:0, i15:1, i15:0, a15:0, i16:0, i17:0, a17:0, 16:1 ω 7cis, 16:1 ω 9cis, 17:1 ω 7cis, 17:1 ω 8cis, 18:1 ω 7cis, 18:1 ω 5cis, cy17:0, cy19:0, 16:12 OH, 16:0, 18:0
Gram-positive bacteria (G+)i14:0, i15:1, i15:0, a15:0, i16:0, 16:0, i17:0, a17:0
Gram-negative bacteria (G-)16:1 ω 7cis, 16:1 ω 9cis, 17:1 ω 7cis, 17:1 ω 8cis, 1:1 ω 7cis, 18:1 ω 7cis, 18:1 ω 5cis, cy17:0, cy19:0, 16:12 OH
Actinomycetes (Act)10Me16:0, 10Me17:0, 10Me18:0
Fungi (Fug)16:1 ω 5cis, 18:1 ω 9cis, 18:2 ω 6cis, 18:2 ω 9cis, 18:3 ω 6cis
Table 3. The percentage of phospholipid fatty acids under different treatments in soil (%). Values are the average ± 1 standard error.
TreatmentG+G-AMFActOB
a15:016:0i16:017:1 ω 7c16:1 ω 5c10Me18:018:0
CM + OF† 4.4 ± 0.2 bc† 11.7 ± 1.0 bc† 3.9 ± 0.3 a† 2.1 ± 0.3 ab† 3.9 ± 0.1 a† 1.9 ± 0.2 b† 2.1 ± 0.2 c
CM + NP4.4 ± 0.1 c11.6 ± 0.3 c3.6 ± 0.1 c2.0 ± 0.3 ab3.9 ± 0.1 a1.8 ± 0.1 b2.1 ± 0.1 c
CM + 04.4 ± 0.0 abc11.8 ± 0.5 abc3.7 ± 0.0 abc2.2 ± 0.4 a3.9 ± 0.2 a1.9 ± 0.1 b2.2 ± 0.2 bc
SM + OF4.7 ± 0.1 abc11.6 ± 0.4 c3.8 ± 0.1 abc1.9 ± 0.2 ab3.9 ± 0.1 a2.2 ± 0.2 a2.3 ± 0.2 bc
SM + NP4.6 ± 0.3 abc11.7 ± 0.2 bc3.9 ± 0.1 ab1.9 ± 0.1 ab3.7 ± 0.1 a1.9 ± 0.1 b2.3 ± 0.1 ab
SM + 04.7 ± 0.3 ab12.0 ± 0.4 abc3.8 ± 0.1 abc1.9 ± 0.1 ab3.7 ± 0.2 a2.1 ± 0.4 ab2.2 ± 0.2 bc
CS + OF4.6 ± 0.2 abc12.7 ± 0.6 a3.6 ± 0.1 bc1.8 ± 0.1 b3.2 ± 0.2 b1.8 ± 0.1 ab2.5 ± 0.1 a
CS + NP4.8 ± 0.1 a12.7 ± 0.1 ab3.8 ± 0.1 abc2.0 ± 0.1 ab3.1 ± 0.2 b1.8 ± 0.1 b2.5 ± 0.1 a
CS + 04.6 ± 0.1 abc12.1 ± 0.4 abc3.8 ± 0.1 abc1.8 ± 0.2 b3.1 ± 0.1 b1.8 ± 0.1 b2.5 ± 0.1 a
Cropping system**********
Fertilizer
Interaction effect*
† Means within a column followed by the same letter are not significantly different at p ≤ 0.05, and the different letters are significantly different at p ≤ 0.05. ‘**’ Means significant at the 0.01 probability level, ‘*’ means significant at the 0.05 probability level, ‘—’ means not significant. AMF: Arbuscular Mycorrhizal Fungi; G+: Gram-positive bacteria; G-: Gram-negative bacteria; Act: Actinomycetes; OB: other bacteria; CM + OF: continuous cropping of maize with organic compound fertilizer; CM + NP: continuous cropping of maize with chemical fertilizer Nitrogen and Phosphorus; CM + 0: continuous cropping maize without fertilize; SM + OF: maize after soybean with organic compound fertilizer; SM +NP: maize after soybean with inorganic fertilizer Nitrogen and Phosphorus; SM + 0: maize after soybean with no fertilizer; CS + OF: soybean continuous cropping with organic compound fertilizer; CS + NP: continuous cropping soybean with inorganic fertilizer Nitrogen and Phosphorus; CS + 0: continuous cropping soybean without fertilizer.
Table 4. Influence of each treatment on soil microbial community structure (%). Values are the average ± 1 standard error.
TreatmentGram-Positive BacteriaGram-Negative BacteriaFungiActinomycetesOther BacteriaFungi/Bacteria
G+G-
CM + OF† 37.3 ± 0.5 bc† 33.2 ± 0.3 ab† 3.4 ± 0.3 ab† 17.5 ± 0.8 a† 8.3 ± 1.3 ab† 0.049 a
CM + NP36.2 ± 0.6 c33.6 ± 0.4 ab3.4 ± 0.5 a17.0 ± 1.5 a9.7 ± 0.4 a0.050 a
CM + 037.0 ± 0.4 bc32.1 ± 0.6 b3.0 ± 0.5 abc18.1 ± 0.3 a9.9 ± 0.5 a0.043 ab
SM + OF38.1 ± 0.8 ab32.4 ± 0.8 b2.6 ± 0.1 c17.7 ± 0.5 a9.2 ± 0.6 ab0.036 b
SM + NP37.5 ± 0.8 ab32.7 ± 0.5 b2.9 ± 0.3 abc17.1 ± 0.6 a9.7 ± 1.0 a0.041 ab
SM + 038.0 ± 0.9 ab32.3 ± 0.8 b2.6 ± 0.3 bc18.1 ± 0.8 a9.0 ± 0.6 ab0.037 b
CS + OF37.0 ± 0.7 bc34.4 ± 0.3 a3.4 ± 0.8 ab16.9 ± 0.8 a8.3 ± 0.6 b0.048 ab
CS + NP38.5 ± 0.7 a32.7 ± 1.6 b2.6 ± 0.2 bc18.1 ± 0.5 a8.1 ± 0.4 b0.037 b
CS + 037.8 ± 0.7 ab33.6 ± 1.5 ab2.8 ± 0.5 abc17.3 ± 1.0 a8.5 ± 0.4 ab0.039 ab
Cropping system*******
Fertilizer
Interaction effect*
† Means within a column followed by the same letter are not significantly different at p ≤ 0.05, and the different letters are significantly different at p ≤ 0.05. ‘**’ Means significant at the 0.01 probability level, ‘*’ means significant at the 0.05 probability level, ‘—’ means not significant.
Table 5. Influence of fertilizer treatment on Gram-negative bacteria and Gram-positive bacteria (%). Values are the average ± 1 standard error.
TreatmentGram-Negative BacteriaTreatmentGram-Positive Bacteria
G-G+
CM + OF† 33.2 ± 0.3 aASM + OF† 38.1 ± 0.8 aA
CM + NP33.6 ± 0.4 aASM + NP37.5 ± 0.8 bB
CM + 032.1 ± 0.6 bBSM + 038.0 ± 0.9 aA
† Means within a column followed by the same lowercase letter or capital letter are not significantly different at p ≤ 0.05 and at p ≤ 0.01, respectively, and the different lowercase and capital letters are significantly different at p ≤ 0.05 and p ≤ 0.01, respectively.
Table 6. Principal component analysis component matrix.
Phospholipid Fatty AcidComponent
12
a17:00.9320.054
i17:00.9110.064
i15:00.876−0.086
10Me18:00.7570.216
16:1 ω9c0.7520.309
18:2 ω6c−0.7280.448
10Me16:00.6700.062
17:1 ω8c−0.6670.310
18:1 ω7c−0.655−0.003
i16:00.5920.401
16:1 ω7c−0.4750.161
18:0−0.053−0.917
18:1 ω9c−0.0830.866
cy17:0 ω7c0.1380.846
16:0−0.030−0.829
16:1 ω5c0.1730.802
a15:00.687−0.695
cy19:0 ω7c0.5070.648
17:1 ω7c−0.0800.636
15:0−0.3520.453

