Article

Ground Truthing and Physiological Validation of Vis-NIR Spectral Indices for Early Diagnosis of Nitrogen Deficiency in cv. Barbera (Vitis vinifera L.) Grapevines

1
DIPROVES, Università Cattolica del Sacro Cuore, Via E. Parmense 84, I-29122 Piacenza, Italy
2
CRAST, Università Cattolica del Sacro Cuore, Via E. Parmense 84, I-29122 Piacenza, Italy
*
Author to whom correspondence should be addressed.
Agronomy 2019, 9(12), 864; https://doi.org/10.3390/agronomy9120864
Submission received: 23 October 2019 / Revised: 21 November 2019 / Accepted: 6 December 2019 / Published: 10 December 2019
(This article belongs to the Special Issue Recent Advances in Viticulture and Breeding of Grapevine)

Abstract

:
Several narrow or broadband spectral indices can be calculated at varying spatial and spectral resolution, which can then be correlated with the physiological and nutritional status of the leaves. In a three-year trial carried out on fruiting, potted cv. Barbera grapevines subjected to full (N+) or no (N0) nitrogen supply, seasonal evolution of different leaf spectral indices were correlated with non-destructive chlorophyll readings (Minolta SPAD meter), leaf gas exchange, and vine performance. Throughout the entire trial, N starvation resulted in greater-than-proportional limitation of vine yield as compared to vegetative growth (55% compared to 26% less than values measured on N+). Indices calculated within the red-edge spectral domain had highest sensitivity to relative change between N+ and N0, also indicating that the promptest response was recorded at the median shoot zone level. Twelve broadband indices were linearly correlated with leaf blade N concentration at veraison, indicating that N values ≤ 1.8% of dry matter identify a limiting N status. Any of these indices collected at the leaf level can be reliably used as a non-destructive predictor of N availability, albeit due to significant between-year variation in their absolute values at a given N level, readings should always include a well-supplied N treatment.

1. Introduction

Nitrogen is a key element affecting canopy growth, yield formation, and fruit composition in the grapevine [1]. Overall, seasonal N demand function by the vine has been thoroughly characterized leading to the conclusions that the highest demand is around flowering and fruit set and, depending on crop level, a second smaller peak might take place slightly after veraison [2,3], coinciding with resumption of berry enlargement and a rapid increase of soluble sugars. However, likely due to high mobility of this nutrient in the soil and through the plant [4], growers still encounter difficulties at matching demand with supply at specific phenological stages. Cases of N-deficiency or excess are anything but rare. N-deficiency is especially harmful when occurring around flowering [3] as it can severely curtail fruit set of the current season, while having also negative effects on next-year bud induction [5]; N excess can likely be even more detrimental as it can lead to: (i) Too high shoot growth rates early in the season, with negative consequences on fruit set; (ii) excessive canopy density with obvious negative impact on bud induction and ripening (e.g., conferring excessive green aroma compounds and rot susceptibility) [6,7,8,9]; (iii) too prolonged shoot growth late in season, leading to excessive competition towards ripening and formation of less cold-resistant wood [10]; (iv) compact clusters with larger berries leading, again, to higher rot incidence and less favorable skin-to-berry ratio [11]; (v) downregulation of transcript expression of both structural and regulatory genes involved in anthocyanin biosynthesis [12] and (vi) surface- and ground-water pollution.
Most importantly, nitrogen is the main component of the most abundant photosynthetic enzyme ribulose, 1,5 bis-phosphate carboxilase (Rubisco) [13] and is also involved in the leaf longevity process, as it has been demonstrated that photosynthetic decline in a mature grapevine leaf links to increased N export towards growing sinks [2,14,15,16].
A good correlation between leaf assimilation rates (A) and leaf blade or petiole nitrogen concentration has, therefore, unsurprisingly been reported [1,17,18] although other authors have warned that the same correlation can vanish depending, for instance, on the variability in age of the leaf sample [14]. These last authors, in field work on Sangiovese grapevines, reported that, regardless of the unit chosen to express leaf N concentration (dry weight or leaf area basis), a close correlation with leaf A was found only for basal, fully expanded leaves (R2 = 0.78–0.85), whereas no correlation was found when the sample was representative of apical and still actively growing leaves. However, because N is overall a good indicator of A rates in mature leaves, a lot of work has been conducted in several crops to achieve reliable assessment of chlorophyll (Chl) and nitrogen (N) concentration through non-destructive methods based on the use of portable chlorophyll meters measuring leaf transmittance at two wavelengths in the red (approximately 660 nm) and near infrared (NIR, approximately 940 nm) ranges [19]. In Asian pear trees (Pyrus serotinia Rehd), a chlorophyll content index (CCI) calculated through a meter (Opti-sciences CCM 200) yielded a linear correlation with both total chlorophyll (R2 = 0.90) and total N content (R2 = 0.76) [20]. Indeed, the most popular chlorophyll meter is the SPAD-502 (Konica Minolta, Osaka, Japan) which, however, when used on grapevine leaves, has shown some inherent limitations; while its sensitivity to Chl contents in yellowish-green to green leaves with Chl below 300 mg/m2 is quite good, the same sensitivity in the range between 300 and 600 mg/m2 becomes inadequate [21], making SPAD for early diagnosis (i.e., pre-visual) of a stress status an ineffective tool. Fundamental work performed by Richardson [22] suggested that, compared to hand-held Chl meters offering only a single index value, reflectance spectroscopy leading to the calculation of indices based on leaf reflectance either in the red-edge spectral range (700–750 nm) or the green bands (around 550) and the near infrared [23,24] yielded much better correlation with total Chl content. Such a discovery has more recently fed intense work on deriving spectral indices from both remote [25] and proximal sensing approaches [26], and testing their degree of correlation with mineral deficiency symptoms and vine yield [27,28]. Likewise, this procedure was also used as a proxy for vineyard soil mapping [29] or canopy growth [30]. Nowadays, one of the most robust and promising tools for making spectral ground-validation is ASD FieldSpec®. This instrument was recently used not only to assess the chlorophyll content, but also for the soil chemical and physical characterization [31,32]. In viticulture, the spectroscopy technique had been studied for several purposes, such as, water potential assessment, grapevine cultivar classification and grape quality determination [26]. Yet, lack of information still seems to exist about suitable methodology to select appropriate indices among the vast array of those available that can be also used via remote sensing. Moreover, once correlation with main traits of leaf function is established, proper ground-truthing of predicted vine behavior under different availability of a given nutrient is also very rarely found.
This three-year study carried out outdoors on fruiting Barbera potted vines subjected to N fertilization or deprived of any N supply aimed to: (i) Provide a detailed agronomic and SPAD-502 assessment of vine performance to establish the effect of N supply on leaf function, growth, yield components, and grape composition; (ii) determine the sensitivity of several Vis-NIR spectral indices collected at the leaf level for early (i.e., pre-symptomatic) detection of nitrogen deficiency, and (iii) provide practical guidelines on how to use Vis-NIR indices to handle assessment of vine N availability and to design suitable and timely fertilization strategies.

2. Materials and Methods

2.1. Plant Material and Experimental Layout

The three-year trial (2016–2018) was carried out at the Department of Sustainable Crop Production (DIPROVES) of the Università Cattolica del Sacro Cuore (45°02′ N, 9°43′ E, 54 m asl) using a batch of 25 three‑year old cv. Barbera vines grafted onto 110 Richter (V. Berlandieri × V. Rupestris) grown outside in 14 L pots filled with a loamy soil with available water of 110 mm/m. The main soil characteristics were as follows: 12.1% and 24.4% and 1.46 g/cm3 corresponding to the wilting point, the field capacity and the bulk density, respectively, according to Saxton and Rawls [33]. Chemical and physical properties of the soil used to fill the pots are reported in Table S1. Weather trends of the three growing seasons included in the trial are given in Figure S1. Barbera is one of the most cultivated varieties in North-Western Italy and it is often grafted to 110 R. Previous studies had demonstrated that V. Berlandieri × V. Rupestris rootstocks can be sensitive to N-deficiency [34].
Plants were head-trained and two 2-node spurs per vine were kept at winter pruning. After budburst (BBCH 15 according to Lorenz et al. [35]), vines were thinned to four main shoots while crop level was standardized to four clusters per vine by removing all distal inflorescences (BBCH 57). From the initial group, eight vines were assigned to a N-fertilized (N+) treatment whereas an equal number of vines was kept as an unfertilized N control (N0). Differential fertilization was performed in N+ plants by using ammonium nitrate (34%) at the dose of 0.5 g per application. Phosphorous and potassium were provided to both N+ and N0 vines by using a 0:52:34 (N:P:K) fertilizer at the rate of 0.5 g per application. Fertilization was carried out manually by dissolving fertilizers in 1 L of water per vine and by watering the top of the pot with the solution. Applications were performed three times per week between inflorescence swelling (BBCH 55) and beginning of ripening (BBCH 81). Such a schedule resulted in 30, 39, and 34 fertilization events in 2016, 2017, and 2018, respectively yielding a cumulated total of 51.5 g N/vine on the three-year span. Pots were painted white to minimize possible overheating of the root system. The number and intensity of daily irrigation events was calibrated to assure pot water capacity not to decrease below 90%; the total amount of daily irrigation was 3.50 L/pot that represents the 100% of the soil field capacity. Pots were provided by under-pots and plant protection was primarily focused against downy and powdery mildews and followed sustainable local practices. Each year the canopies were trimmed when shoots outgrew the top foliage wire to retain 13–14 main leaves.

2.2. Vine Measurements

On each vine (eight per treatment), two shoots (S1 and S2) were selected each spring season and three leaves were tagged on S1 to represent basal (4–5th node, cluster zone), median (8–9th node), and apical (11–12th node) shoot zones. On each leaf, the Greenness Index was determined by using a SPAD-502 portable meter (Konica Minolta, Osaka, Japan). For each leaf, five determinations were taken and averaged considering main and lateral lobes on a typically 5-lobe shaped Barbera leaf.
At the same dates and on the same leaves, the Greenness index (SPAD) was measured and assimilation (A, µmol m−2 s−1) and stomatal conductance (gs) were assessed with the portable gas-exchange analyzer LCi-SD (ADC BioScientific Ltd., Hoddesdon, UK). All readings were taken in the morning hours (10:00–13:00) under clear sky and saturating light conditions. Previous studies have demonstrated that N deficiency exhibits different patterns depending on leaf age [14], hence the evaluation of physiological data against leaf position. Measurements were taken at ambient relative humidity, and the flow fed to the broad-leaf chamber (4.5 cm2 window size) was 300 mL min−1. For each trial year, monitoring of the above-mentioned parameters started prior to fertilization until pre-veraison and measuring dates were 7, 9, and 5 in 2016, 2017, and 2018, respectively.
Each year, at pre-veraison, leaves from nodes 4, 7, and 10 along the stem were sampled from all vine shoots except for S1. Thus, for each treatment × node position combination, 12 leaves were harvested. Thereafter, petioles were removed and leaf blades were washed twice in distilled water, dried in a forced air oven at 75 °C, finely ground, and sent to an external laboratory for mineral ion analysis.
In 2016, 2017, and 2018, physiological measurements were associated to Vis-NIR spectra collected on the same leaves with a spectroradiometer having a wavelength range of 325–1075 nm, an accuracy of ±1 nm and a resolution of <3 nm at 700 nm (ASD FieldSpec® HandHeld 2 VNIR Spectroradiometer; Analytical Spectral Devices, Inc., Boulder, CO, USA). The instrument is equipped with a fibre-optic contact probe ending with a leaf clip allowing one-handed functionality for non-destructive contact readings on a portion of leaf area of 0.8 cm2. Single-wavelength reflectance rates were measured for each trial year; measurements were periodically conducted from the beginning of fertilization to veraison. Thereby, spectral data were elaborated using the Prospect package, version 0.1.3 [36]. On every spectral acquisition, the smoothing was applied, and bands were analysed by “resample2” function that uses gaussian models to resample the hyperspectral data. The FWHM values used to assess the new band positions and resolution were determined in order to reproduce the spectral configuration of Sentinel-2 (0.443, 0.490, 0.560, 0.665, 0.705, 0.740, 0.783, 0.842, 0.865, and 0.945 µm) [37]; broadband indices were then calculated. In addition to standard NDVI, twenty-nine relevant broadband vegetation indices were developed by modifying the base formula of the respective original index with different bands configurations. Acronyms, base formulas, references full name, and spectral bands used for each index are reported in Table S2 [38,39,40,41,42,43,44]. Twelve indices having higher significance early in the 2016 season and recorded from the basal tagged leaves, where then correlated with N content in dry leaf mass measured at veraison.

2.3. Grape Composition

At harvest occurring on DOY 256, 242, and 234 in 2016, 2017, and 2018, respectively, clusters from tagged shoots were individually picked, immediately weighed, and taken to the laboratory. The remaining clusters were harvested together, and their total number and mass recorded as well. Clusters from S1 and S2 were then destemmed, berries were counted and classified as a function of their size (i.e., normal and shot berries). Accordingly, cluster compactness was evaluated as cluster mass-to-rachis length. A sub-sample of 10 intact berries per cluster was taken and stored at −18 °C for subsequent determination of the berry mass and individual berry organs (skin, flesh, and seeds). Skin, flesh, and seed mass were then determined through the use of a razor blade and a small metal spatula. Seeds and flesh were carefully removed from each berry without rupturing any pigmented hypodermal cells, then the seeds carefully separated from the flesh with tweezers and the number of seeds per berry was counted. Both skins and seeds were rinsed in deionized water, blotted dry, and weighed. A second sub-sample of 50 healthy berries was stored at −18 °C and then used for the determination of anthocyanins and total phenolic concentration according to Iland et al. [45]. Remaining berries were crushed and the juice immediately processed to determine TSS using a temperature compensated refractometer whilst titratable acidity (TA) was measured by titration with 0.1 N NaOH to a pH 8.2 endpoint and expressed as g/L of tartrate equivalents. Must pH was measured simultaneously using a pH-meter CRISON GLP 22 (Crison, Barcelona, Spain). The concentration of tartaric and malic acids was determined by HPLC. The quantification of organic acids was performed by injecting 1:4 diluted must into HPLC after filtering through a 0.22 μm polypropylene filter. The identification was performed by external calibration with standards and concentration was calculated measuring the peak area and expressed in g/L. For this analysis an Allure Organic Acid column, 300 × 4.6 mm, 5 µm (Restek, Bellefonte, PA, USA) was used. Separation was performed in isocratic conditions using water, pH was adjusted at 2.5 by adding orthophosporic acid. The column temperature was maintained at 30 ± 0.1 °C, 15 µL of sample was injected. The elution was monitored at 200–700 nm and detected by UV-Vis absorption with DAD at 210 nm. At the end of the season, immediately after leaf fall, the pruning weight of the one-year wood was recorded by separating main and lateral canes, and the yield-to-pruning weight ratio calculated.

2.4. Statistical Analysis

Plant growth, yield components, nutritional status, and fruit composition data were subjected to a two-way analysis of variance (ANOVA) assuming N supply as main factor (N+ versus N0) and year as a random factor. Treatments were compared by Student–Newman–Keuls test at p = 0.05. Treatment × year interaction was partitioned only in case of F test significance, and mean values compared by standard error. Spectral data, narrow and broad-band vegetation indices depending on N supply were compared by t-test at p = 0.05.

3. Results

3.1. Leaf Nutrition, Vegetative Growth, Yield Components, and Grape Composition

Three-year data pooled over shoot positions and years showed that N+ vines had higher leaf blade N concentration at veraison (2.21% compared to 1.60% recorded in N0), whereas P, Mn, and Zn concentrations showed an opposite trend (Table 1).
The main factor represented by leaf position along the shoot stem also played a role as N, P, Ca, Mg, and S concentration increased from the base to the shoot apex along a decreasing gradient of age, while Mn and Zn retained the highest concentration in their basal leaves. A few first order interactions occurred, indicating that ΔN between N+ and N0 increased proceeding from the base to the shoot apex (Figure S2) whereas, within Y × T interactions, N0 had consistently high leaf P concentration that amplified over the years (Figure S2C). Multi-season N supply versus no N had a strong impact on vegetative growth (Table 2).
Total pruning weight per vine, once averaged over the three trial years was reduced by 26% in N0 vines, with the greatest limitation observed for lateral growth (60% less than N+). The impact of no N supply was even greater on yield per vine, which decreased by 55% as compared to N+ along with all main yield components and the fraction of shot berries; lower fruit set and smaller berries allowed N0 vines to show a reduced cluster compactness; interestingly the Ravaz index (yield-to-pruning weight ratio) was significantly lowered by no N application.
The effect of N supply on vegetative growth and yield is also marked by a number of significant Y × T interactions that were partitioned in Figure S3. Vine vigor—assessed as total pruning weight and its components—showed a strong response in 2016 and 2018 and a milder one in 2017 (Figure S3A–C); conversely, relative reduction of yield per vine and cluster weight of N0 vines was highest in 2017 (Figure S3D–E). As a related result, yield-to-pruning weight ratio significantly increased in 2017 in N0 vines (Figure S3F).
Growth of individual berry organs (skin, flesh, and seeds) was markedly affected by N supply (Table 3).
No N supply reduced flesh weight/berry, seed number and development, and increased both skin-to-berry and skin-to-flesh ratios. Interestingly, total skin weight per berry was not affected. A few parameters also showed significant Y × T interactions (Figure S4) which, however, had a different nature. Conversely, in 2016 N0 had a higher skin/berry ratio, while the reverse was true for the two following seasons, with N+ taking over in 2017 (Figure S4A). For flesh weight/berry, each season N0 had lower values that reached a maximum gap in 2017 (Figure S4B).
Must composition at harvest was dramatically changed by N supply as N0 vines showed, on average, higher TSS (+2.1 °Brix as compared to N+), lower TA driven by a drastic decrease in malic acid and notably higher total anthocyanins and phenols concentrations (Table 4). Once again, significant Y × T interactions were found for several parameters (Figure S5). Regardless of season, N0 strongly reduced malic acid concentration at harvest; by contrast TSS and total anthocyanins showed no response to N supply in 2016, while over the following years N0 reached significantly higher values for both parameters; tartaric acid at harvest was lower in 2016 in N0 vines while an opposite response was found in 2017 and 2018.

3.2. Leaf Physiology

Seasonal variation of the Greenness index taken with the SPAD 502 Minolta meter showed significant modifications between different shoot zones within the same year (Figure 1). In 2016, regardless of leaf position along the stem, values measured in N0 were definitely similar to those measured in N+ for the first several sampling dates. Median and apical leaves of N0 vines were the quickest to show lower SPAD values versus N+ (i.e., 13–15 d after initial N supply), whereas basal leaves took longer to differentiate between treatments (28 d) (Figure 1A–C). Such a pattern was significantly modified in 2017, when even the pre-fertilization measurement already showed lower SPADs in median and apical leaves of N0 (Figure 1E–F). Then, over the remainder of the season, such differences broadened further with the largest gap reached during late season readings taken on apical leaves. 2018 was overall confirmatory of previous years’ assessment with an important change highlighting that, even in basal leaves, pre-fertilization SPAD rates were lower in N0 as compared to N+ vines (Figure 1G).
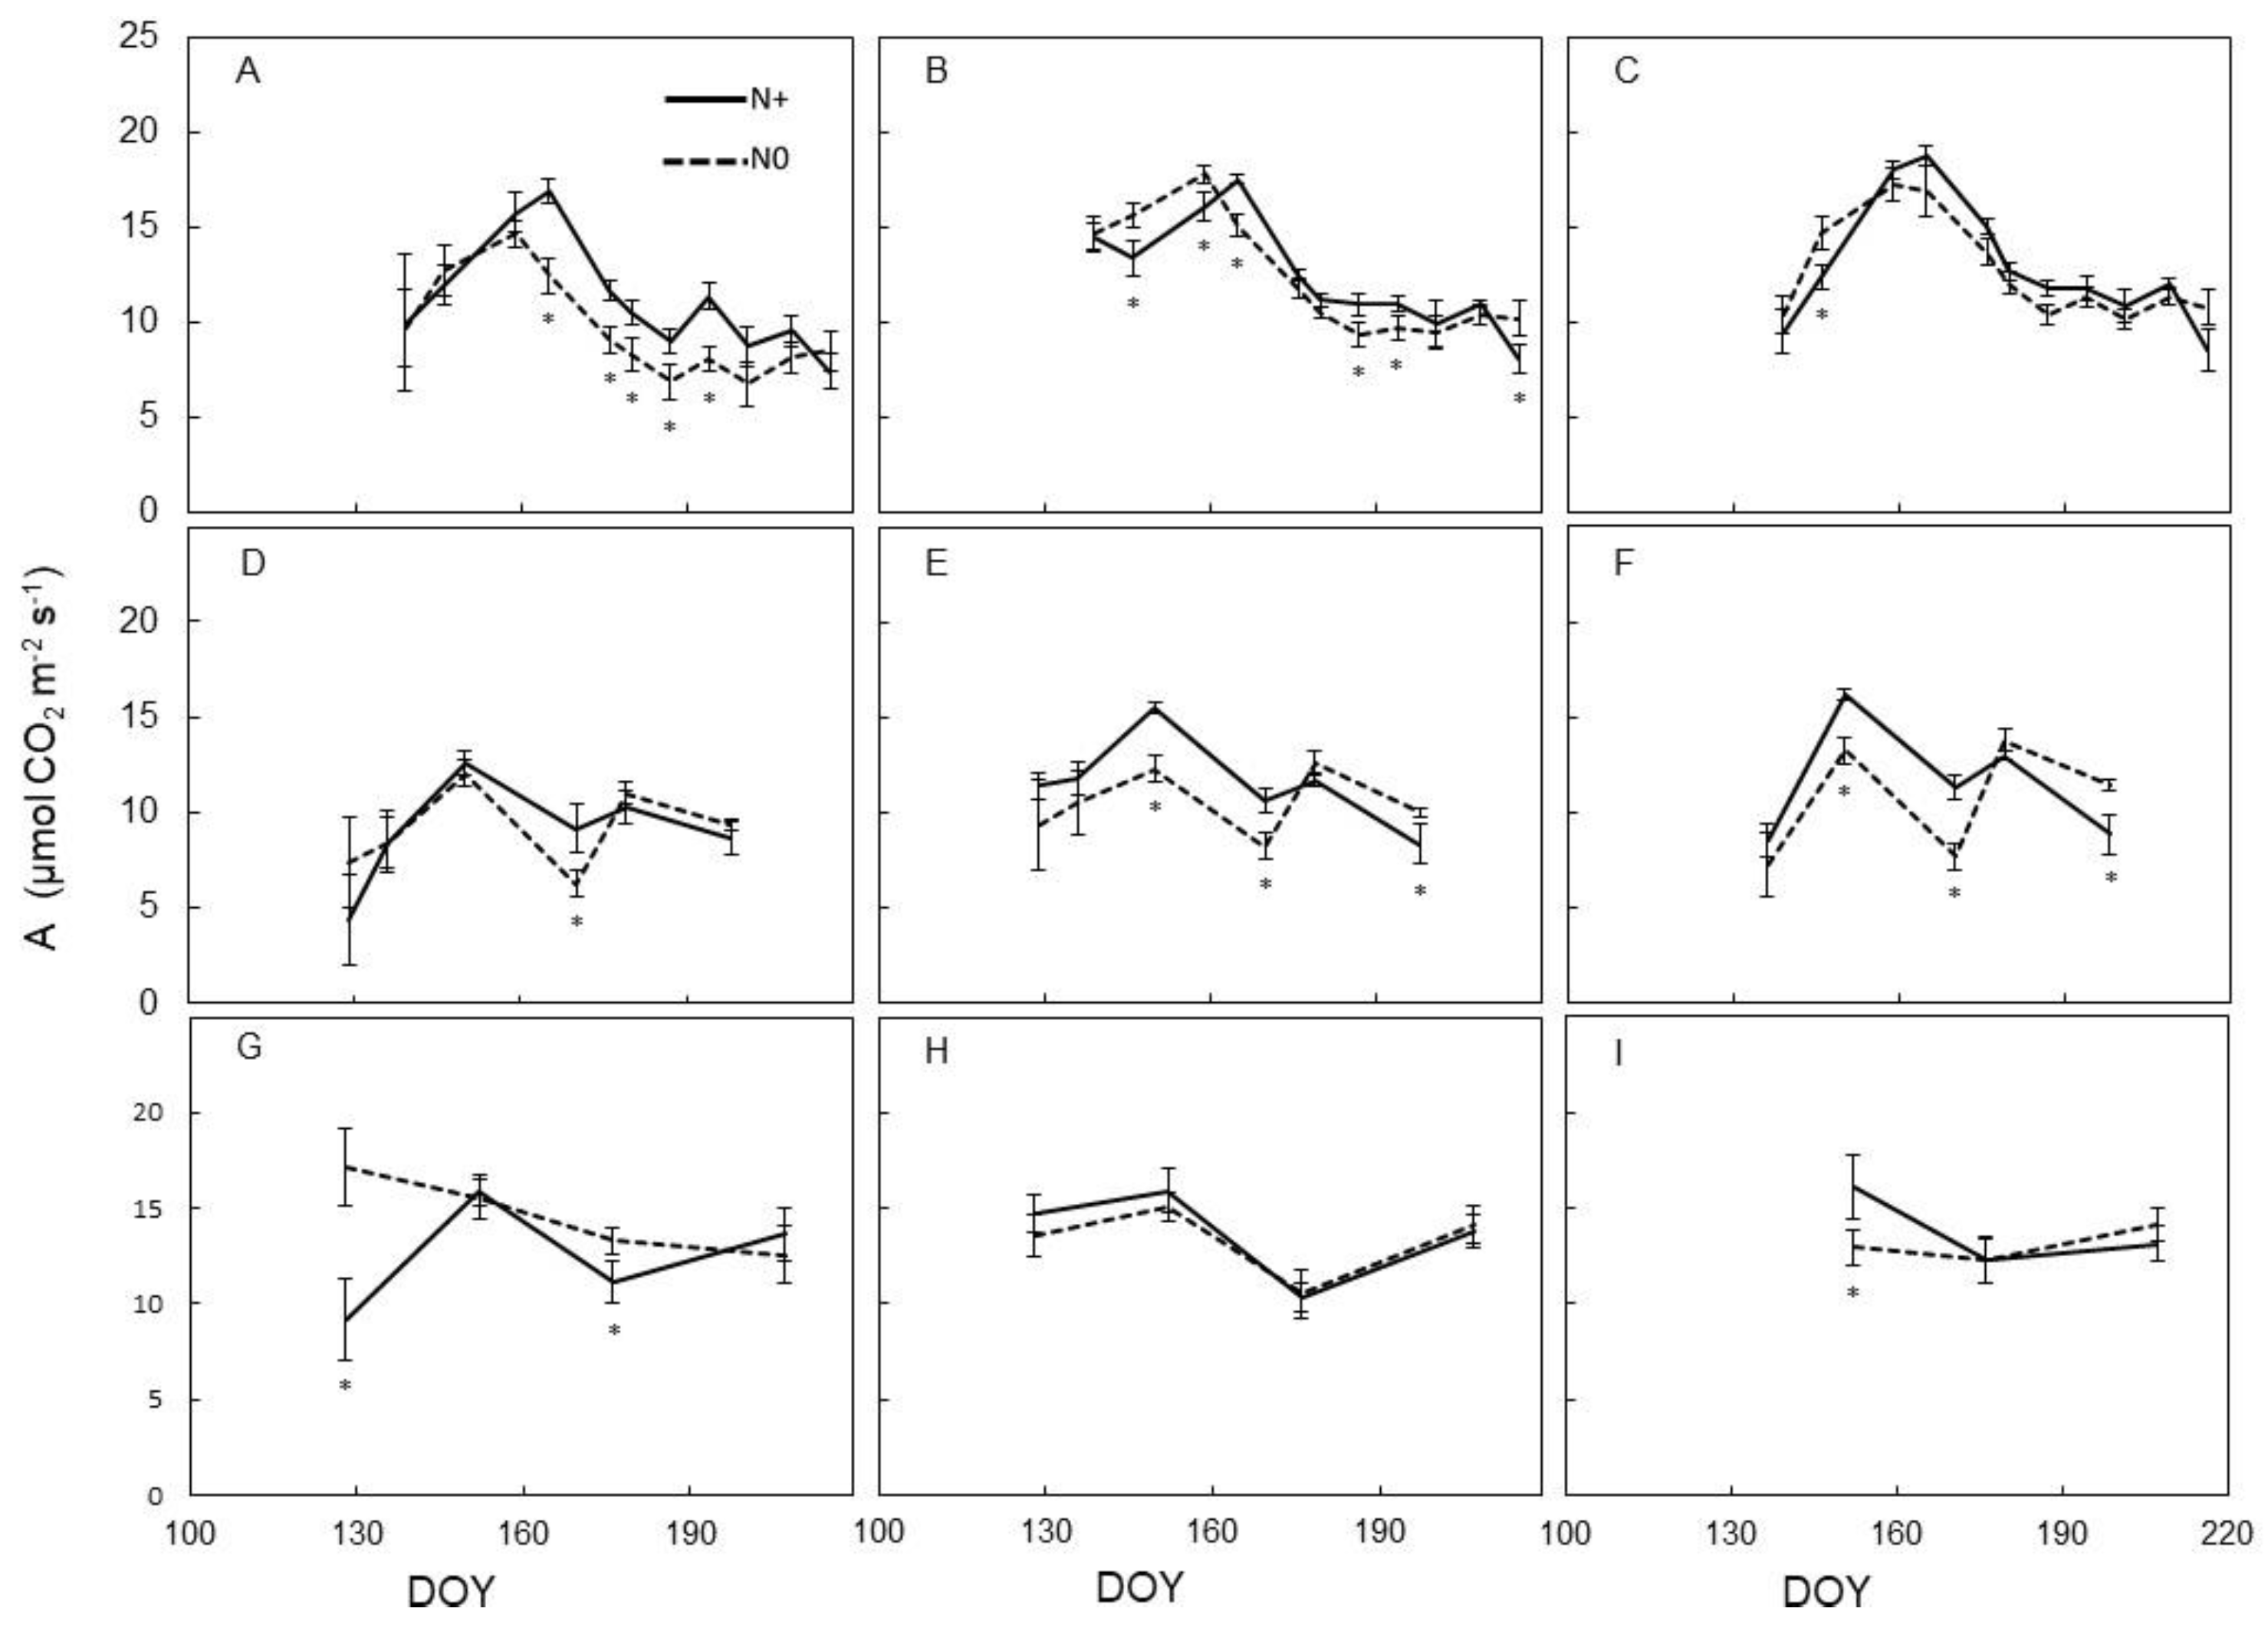
Seasonal variation of leaf assimilation (A, µmol m−2 s−1) taken each season at different dates on the same leaves previously used for SPAD readings provided a quite different scenario (Figure 2). In 2016, on basal leaves only, mid-season A rates recorded on N0 vines were lower than rates taken on N+ vines; conversely, very similar A was measured during the season in the two treatments for either median and apical leaves (Figure 2A–C). In 2017, occasional and quite inconsistent differences were found for A measured in N0 and N+ at different positions along the stem and even fewer differences were found in 2018, albeit under a lower number of measuring dates (Figure 2D–I).
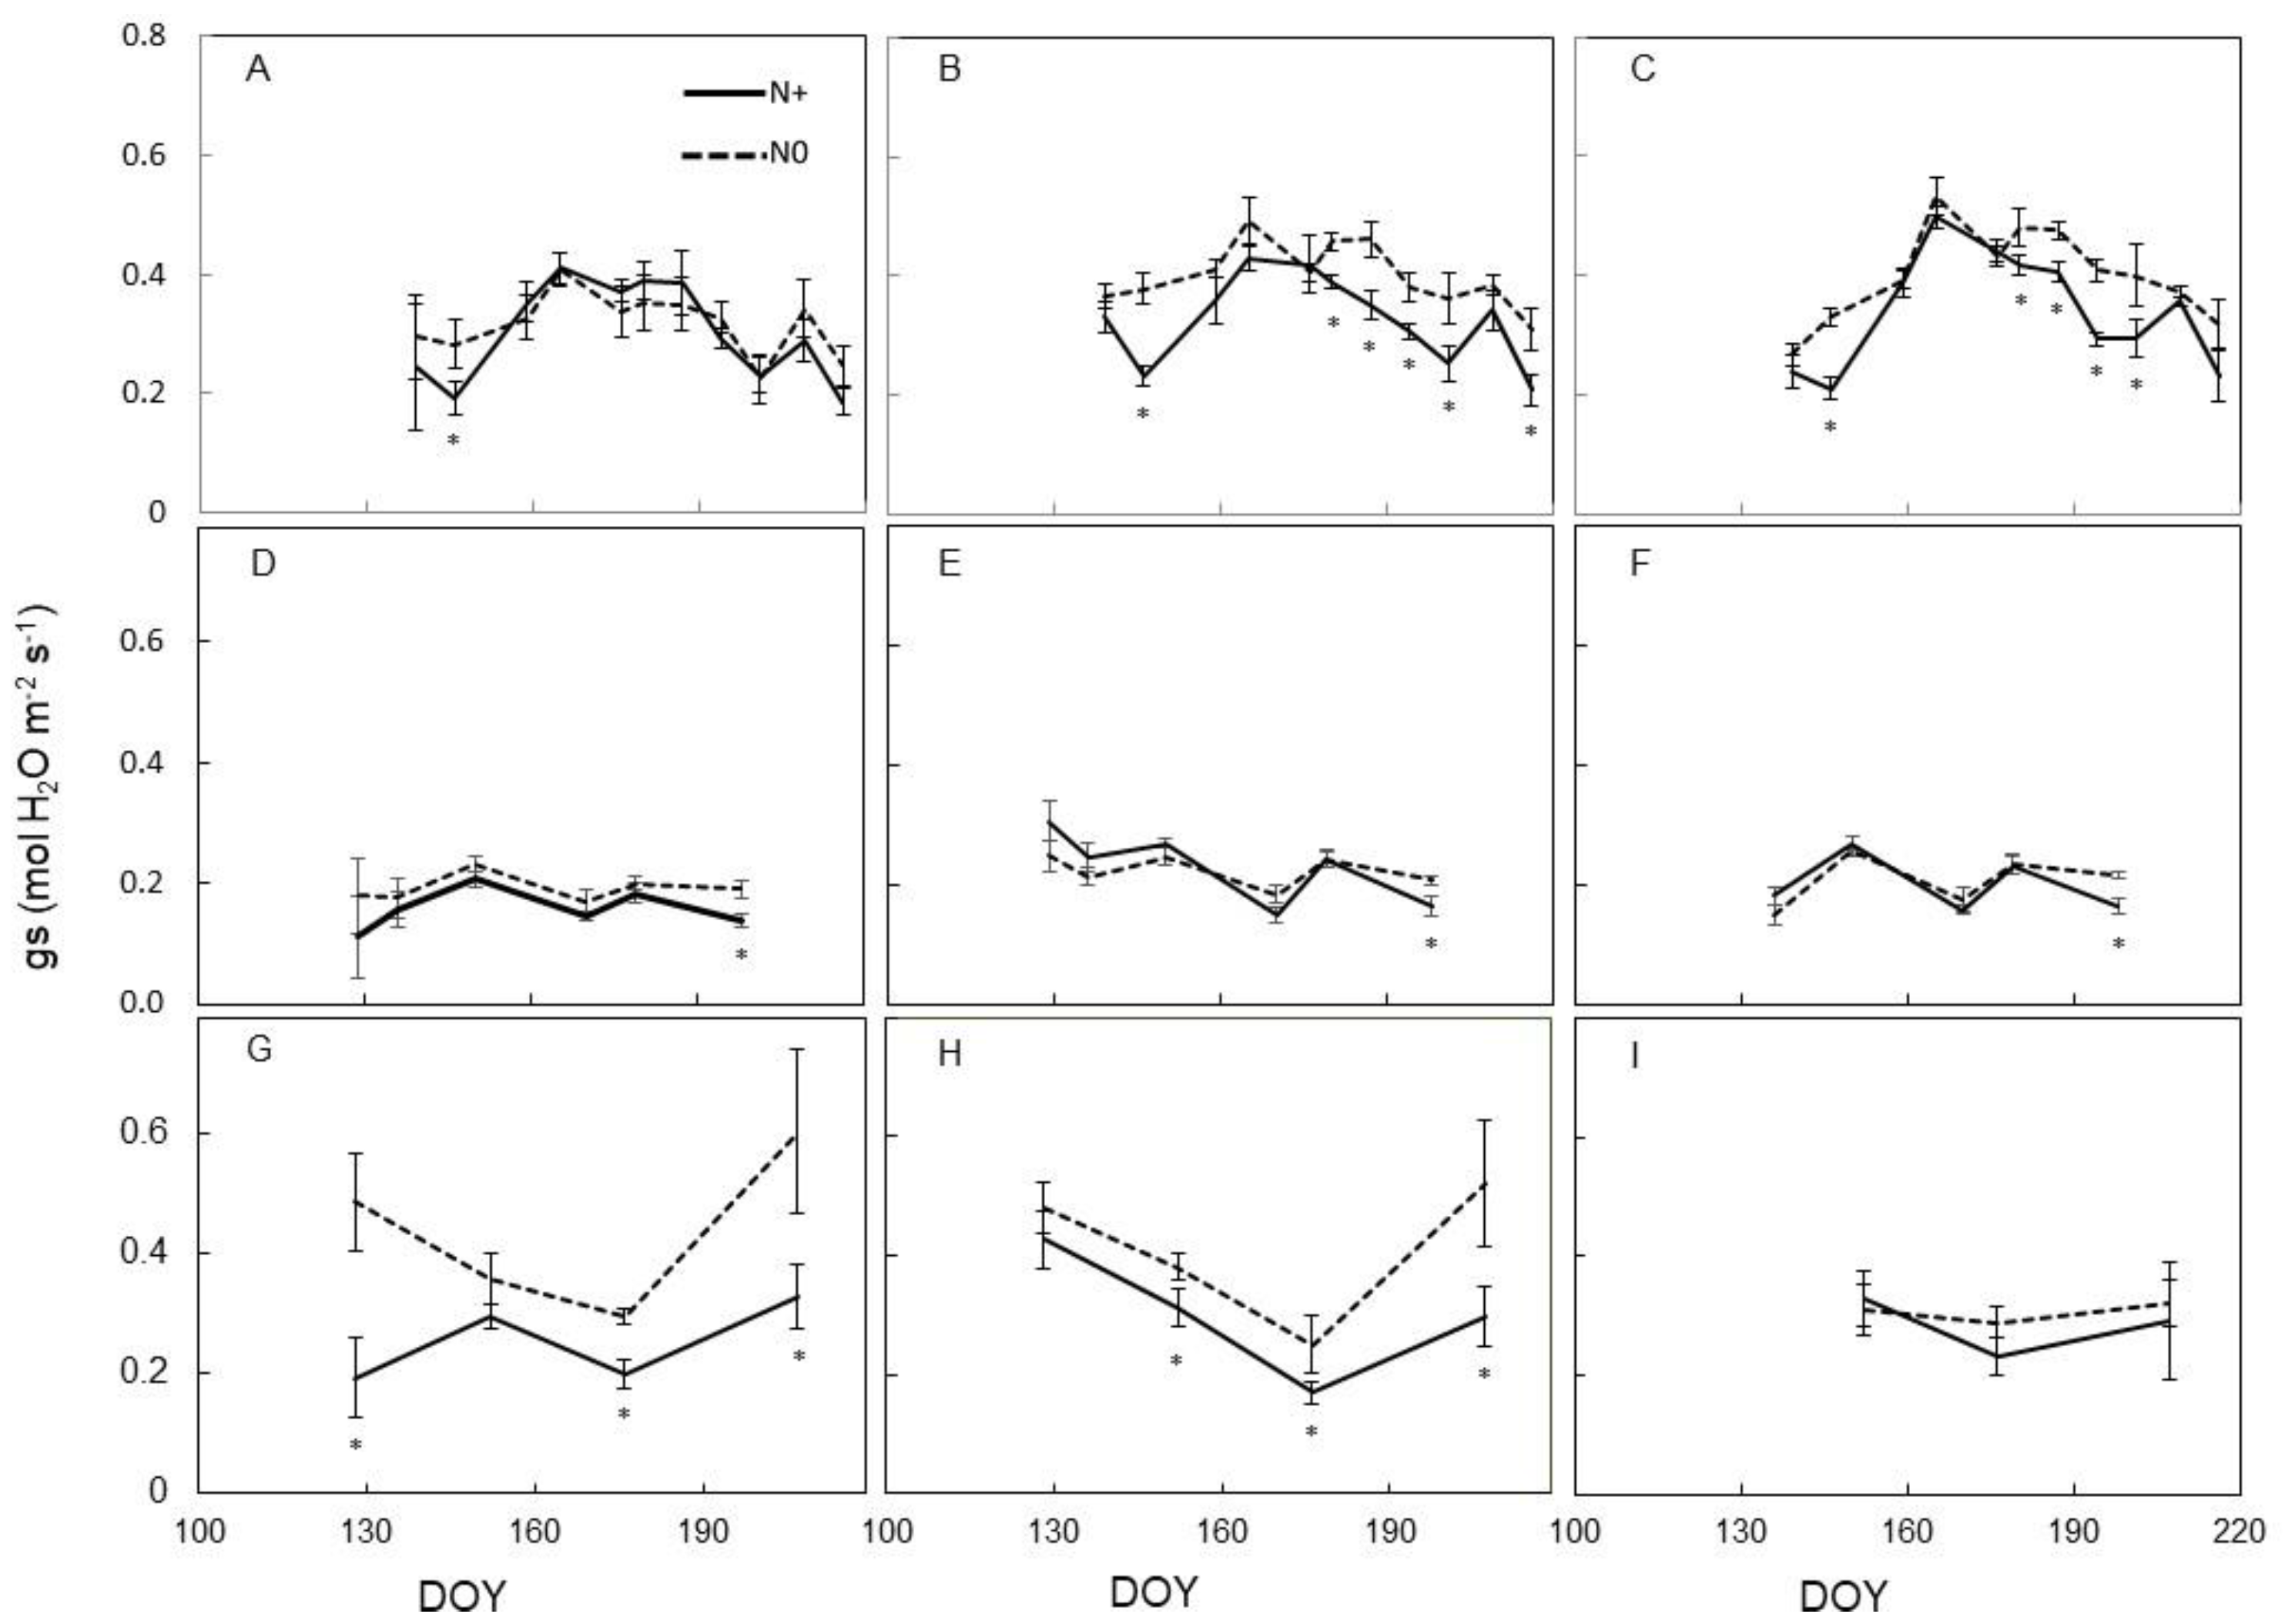
A quite different behaviour was found for seasonal trends for leaf stomatal conductance (gs) that, regardless of leaf position along the stem, showed on N0 values either similar or even significantly higher than those recorded on N+ (Figure 3).
Quite expectedly, no significant correlation was found between SPAD unit and A when data were pooled over years and position or, likewise, analysed separately within basal, median, and apical shoot portions (not shown). A similar poor correlation (R2 ranging from 0.02 and 0.16) was found when, within each N supply level, leaf blade N concentration determined upon sampling performed at veraison was regressed over the closest measurement of leaf assimilation rates.

3.3. Spectral Indices and Relationships with Leaf Function

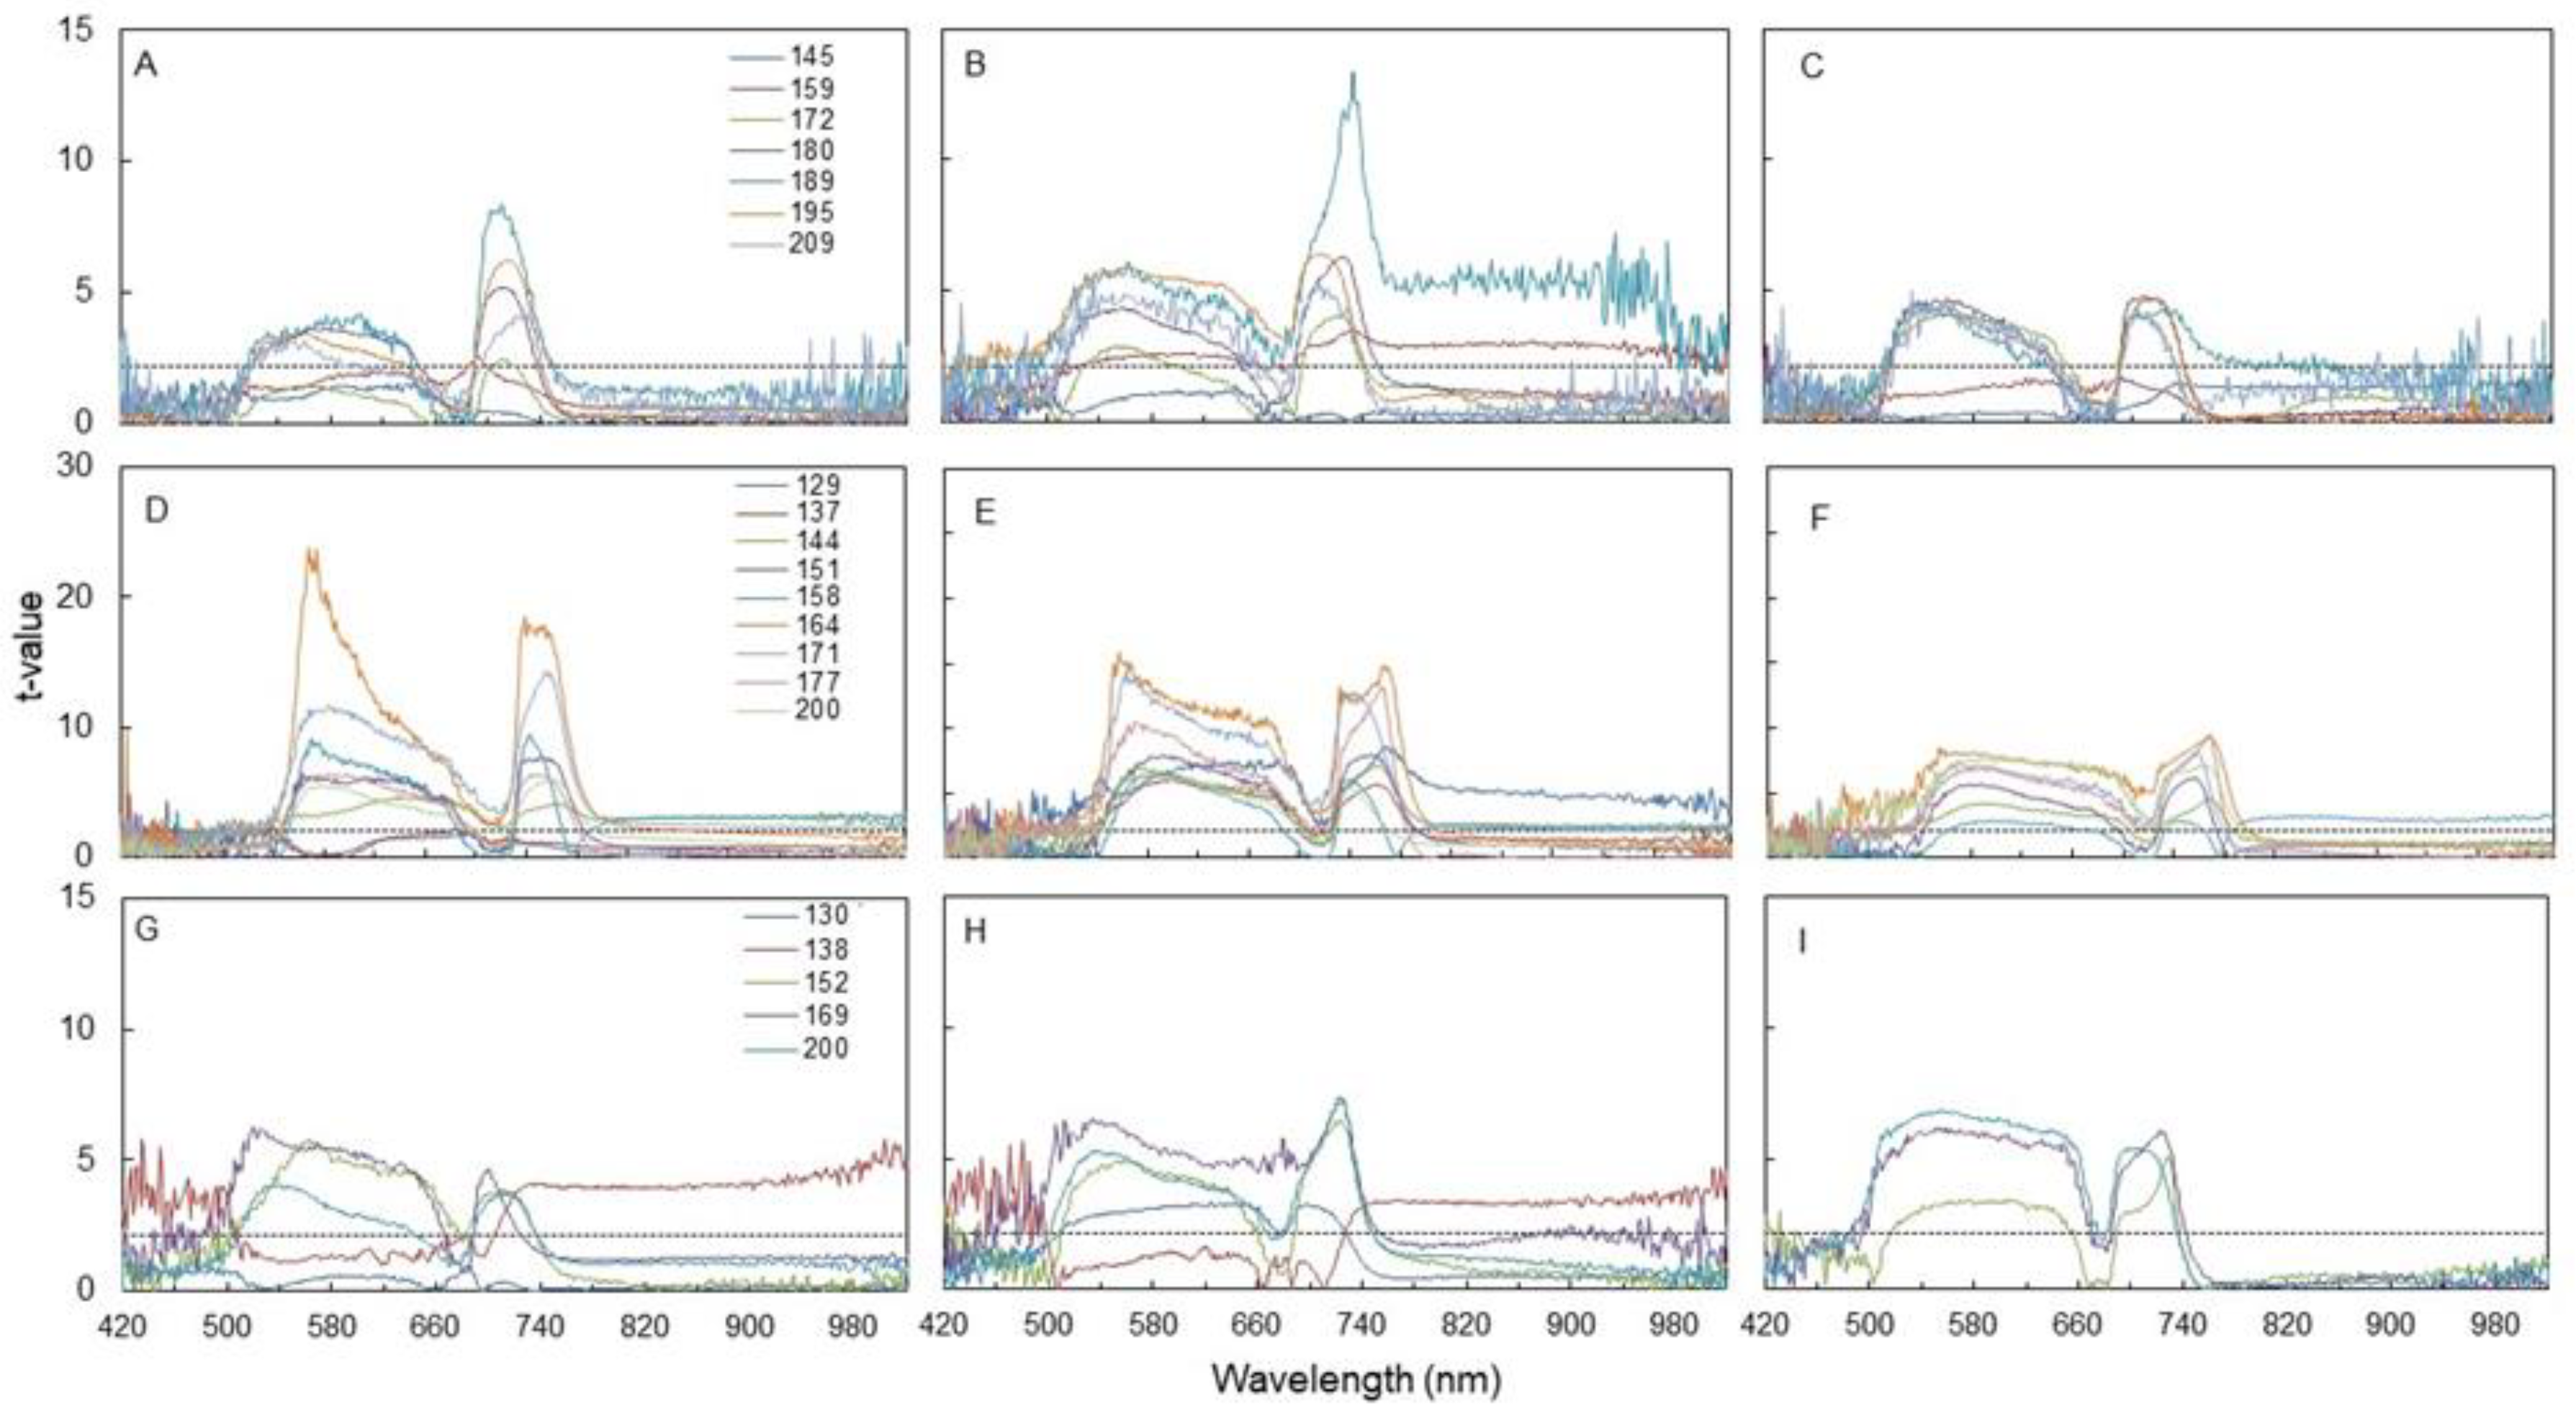
Leaf light reflectance within the Vis-NIR spectrum measured at various dates in 2016, 2017, and 2018 indicates large changes between seasons and, within each season, among different shoot zones (Figure 4). Differences in leaf reflectance rates between N0 and N+ evaluated as trespassing critical t-values at P0.05 suggest that the green and red-edge domains were the most sensitive, whereas the red wavelength was overall less responsive. Within each shoot zone, leaf reflectance increased, in terms of earliness and intensity of response, in 2017 and 2018 as compared to 2016. Significant leaf reflectance differences between N0 and N+ started to become detectable on DOY 180, 159, and 172, for basal, median, and apical shoot zones in 2016 (Figure 4A–C), respectively, whereas in 2017, in the same order, the same response was prompted on DOY 144, 129, and 144 (i.e., 36, 30, and 28 days earlier) (Figure 4D–F). In 2018, in basal and apical leaves, significant leaf reflectance differences between the two N supplies were found on DOY 152, whereas in median leaves such a response was already reached on DOY 130 (Figure 4G–I). Notably, regardless of season, median leaves were the promptest to show significant alteration of leaf reflectance properties due to N supply and, in 2017 and 2018, N0 and N+ were already different at the first spectral acquisition on DOYs 129 and 130 (Figure 4E,H).
Focusing on green and red-edge domains, seasonal variation of reflectance values averaged over the whole leaf sampling (n = 24, eight leaves per shoot zone) showed that, in 2016, at the second sampling date (DOY 159, i.e., 16 days after the beginning of the N supply), N0 vines already had higher reflectance than N+ and such gap broadened along the season for both waveband lengths (Figure 4A–C). Robustness of such a response increased in 2017, when at the very first sampling date (DOY 129, i.e., 11 days after the beginning of the N supply) and, for all the following dates, N0 had higher leaf reflectance rates than N+ in both wavebands (Figure 4D–F). In 2018, reflectance in the two wavebands started to differentiate between N0 and N+ beginning at the third date of sampling (DOY 152, i.e., 25 days after the beginning of the N supply) and then widened along the season (Figure 4G–I).
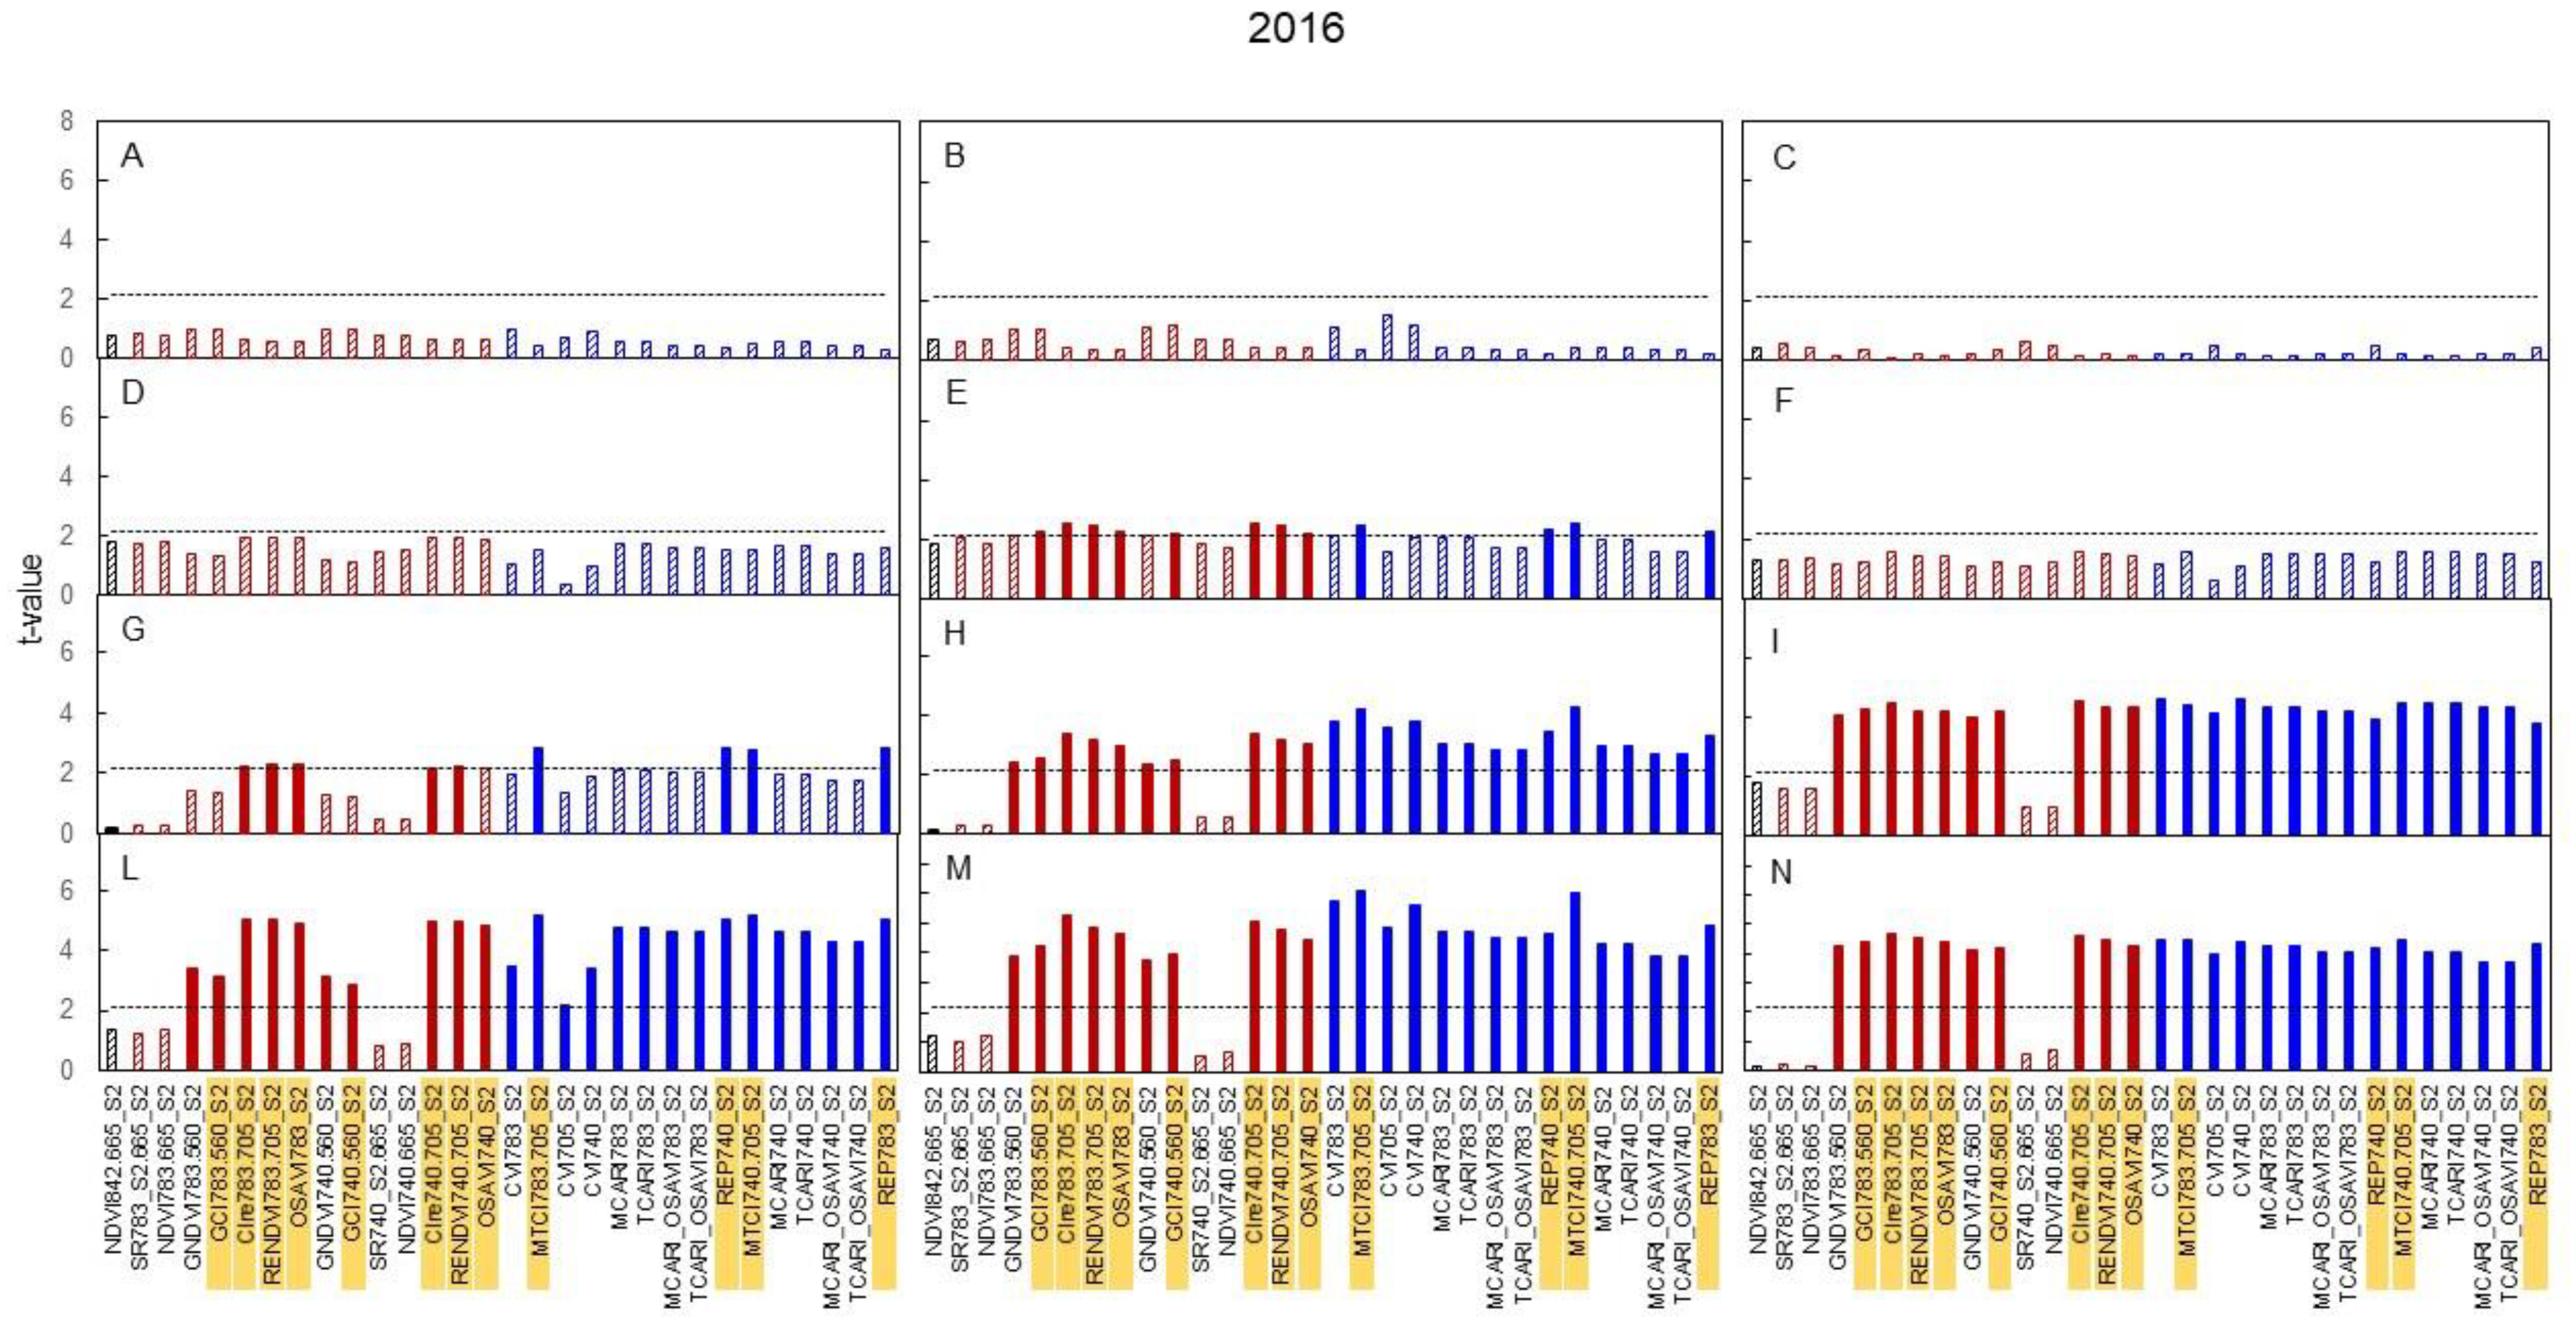
Figure 5 Shows t-values resulting from pair comparisons (N+ versus N0) in 2016 for all indices. Data are presented separately for basal, median, and apical shoot zones and, for each shoot section, top panels report data taken the same day the N supply started, whereas panels underneath shows data taken 14, 27, and 35 days later. It is quite apparent from the seasonal dynamic of spectral signatures that median shoot zone was prompter than basal and apical, reaching significant t-values already at DOY 159, i.e., two weeks after the beginning of N supply (Figure 5E).
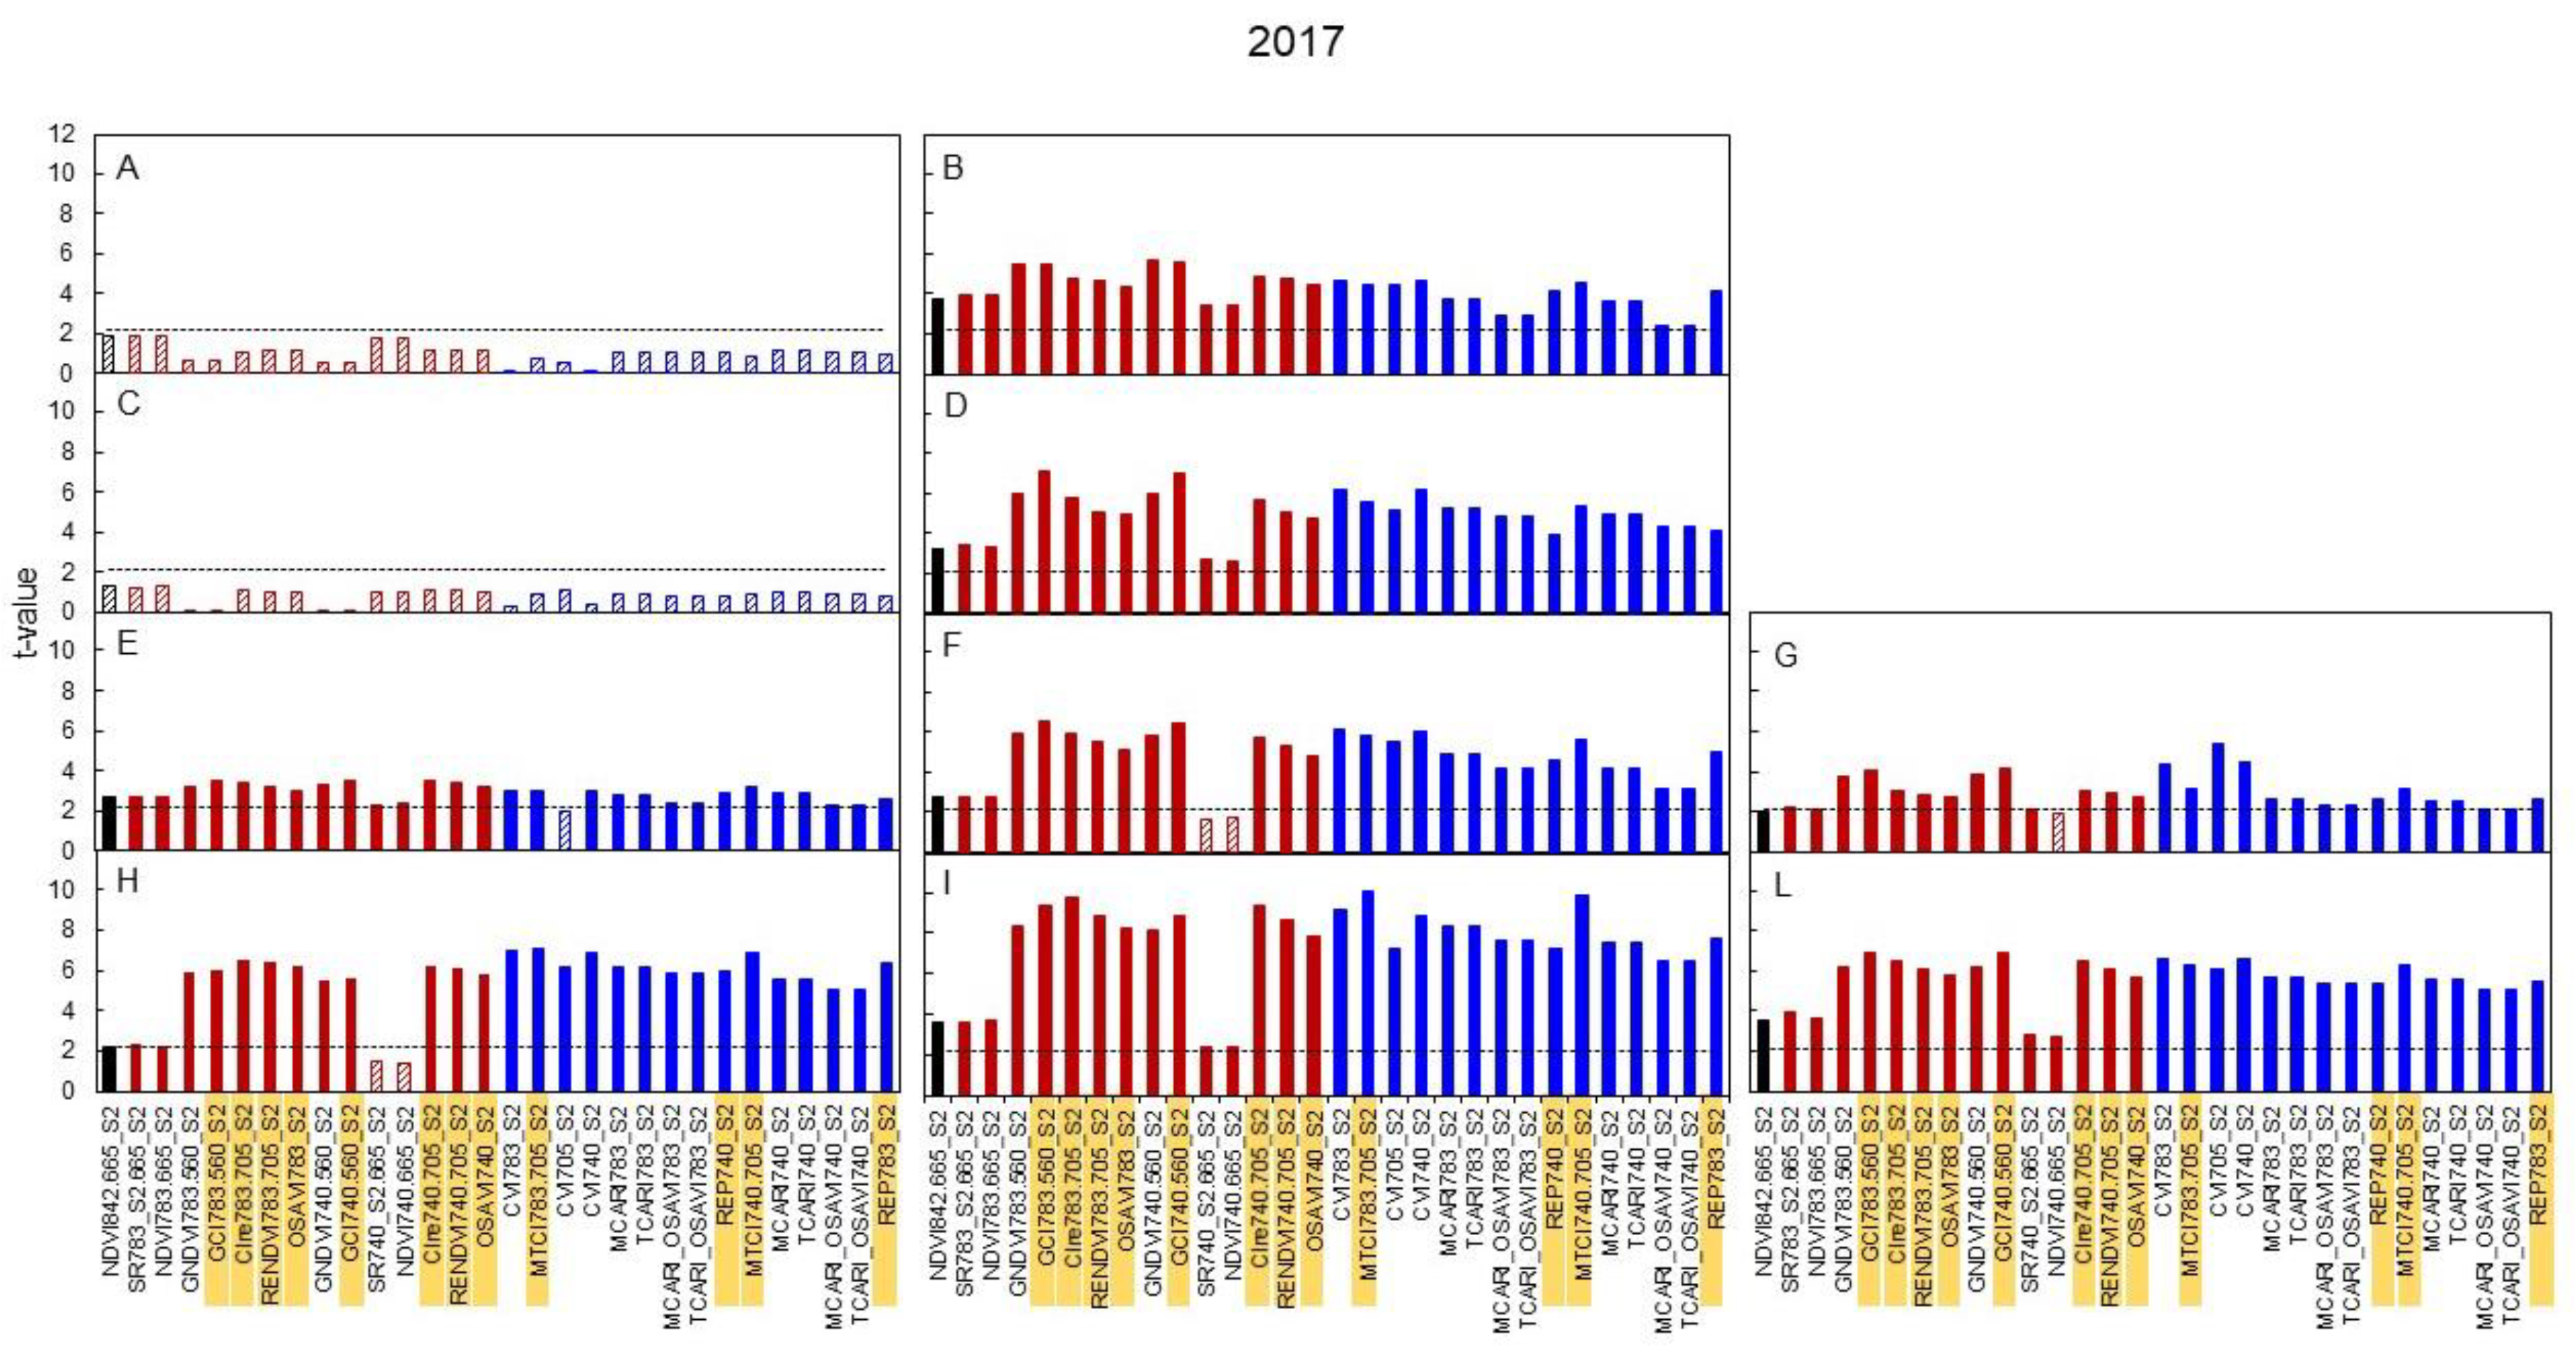
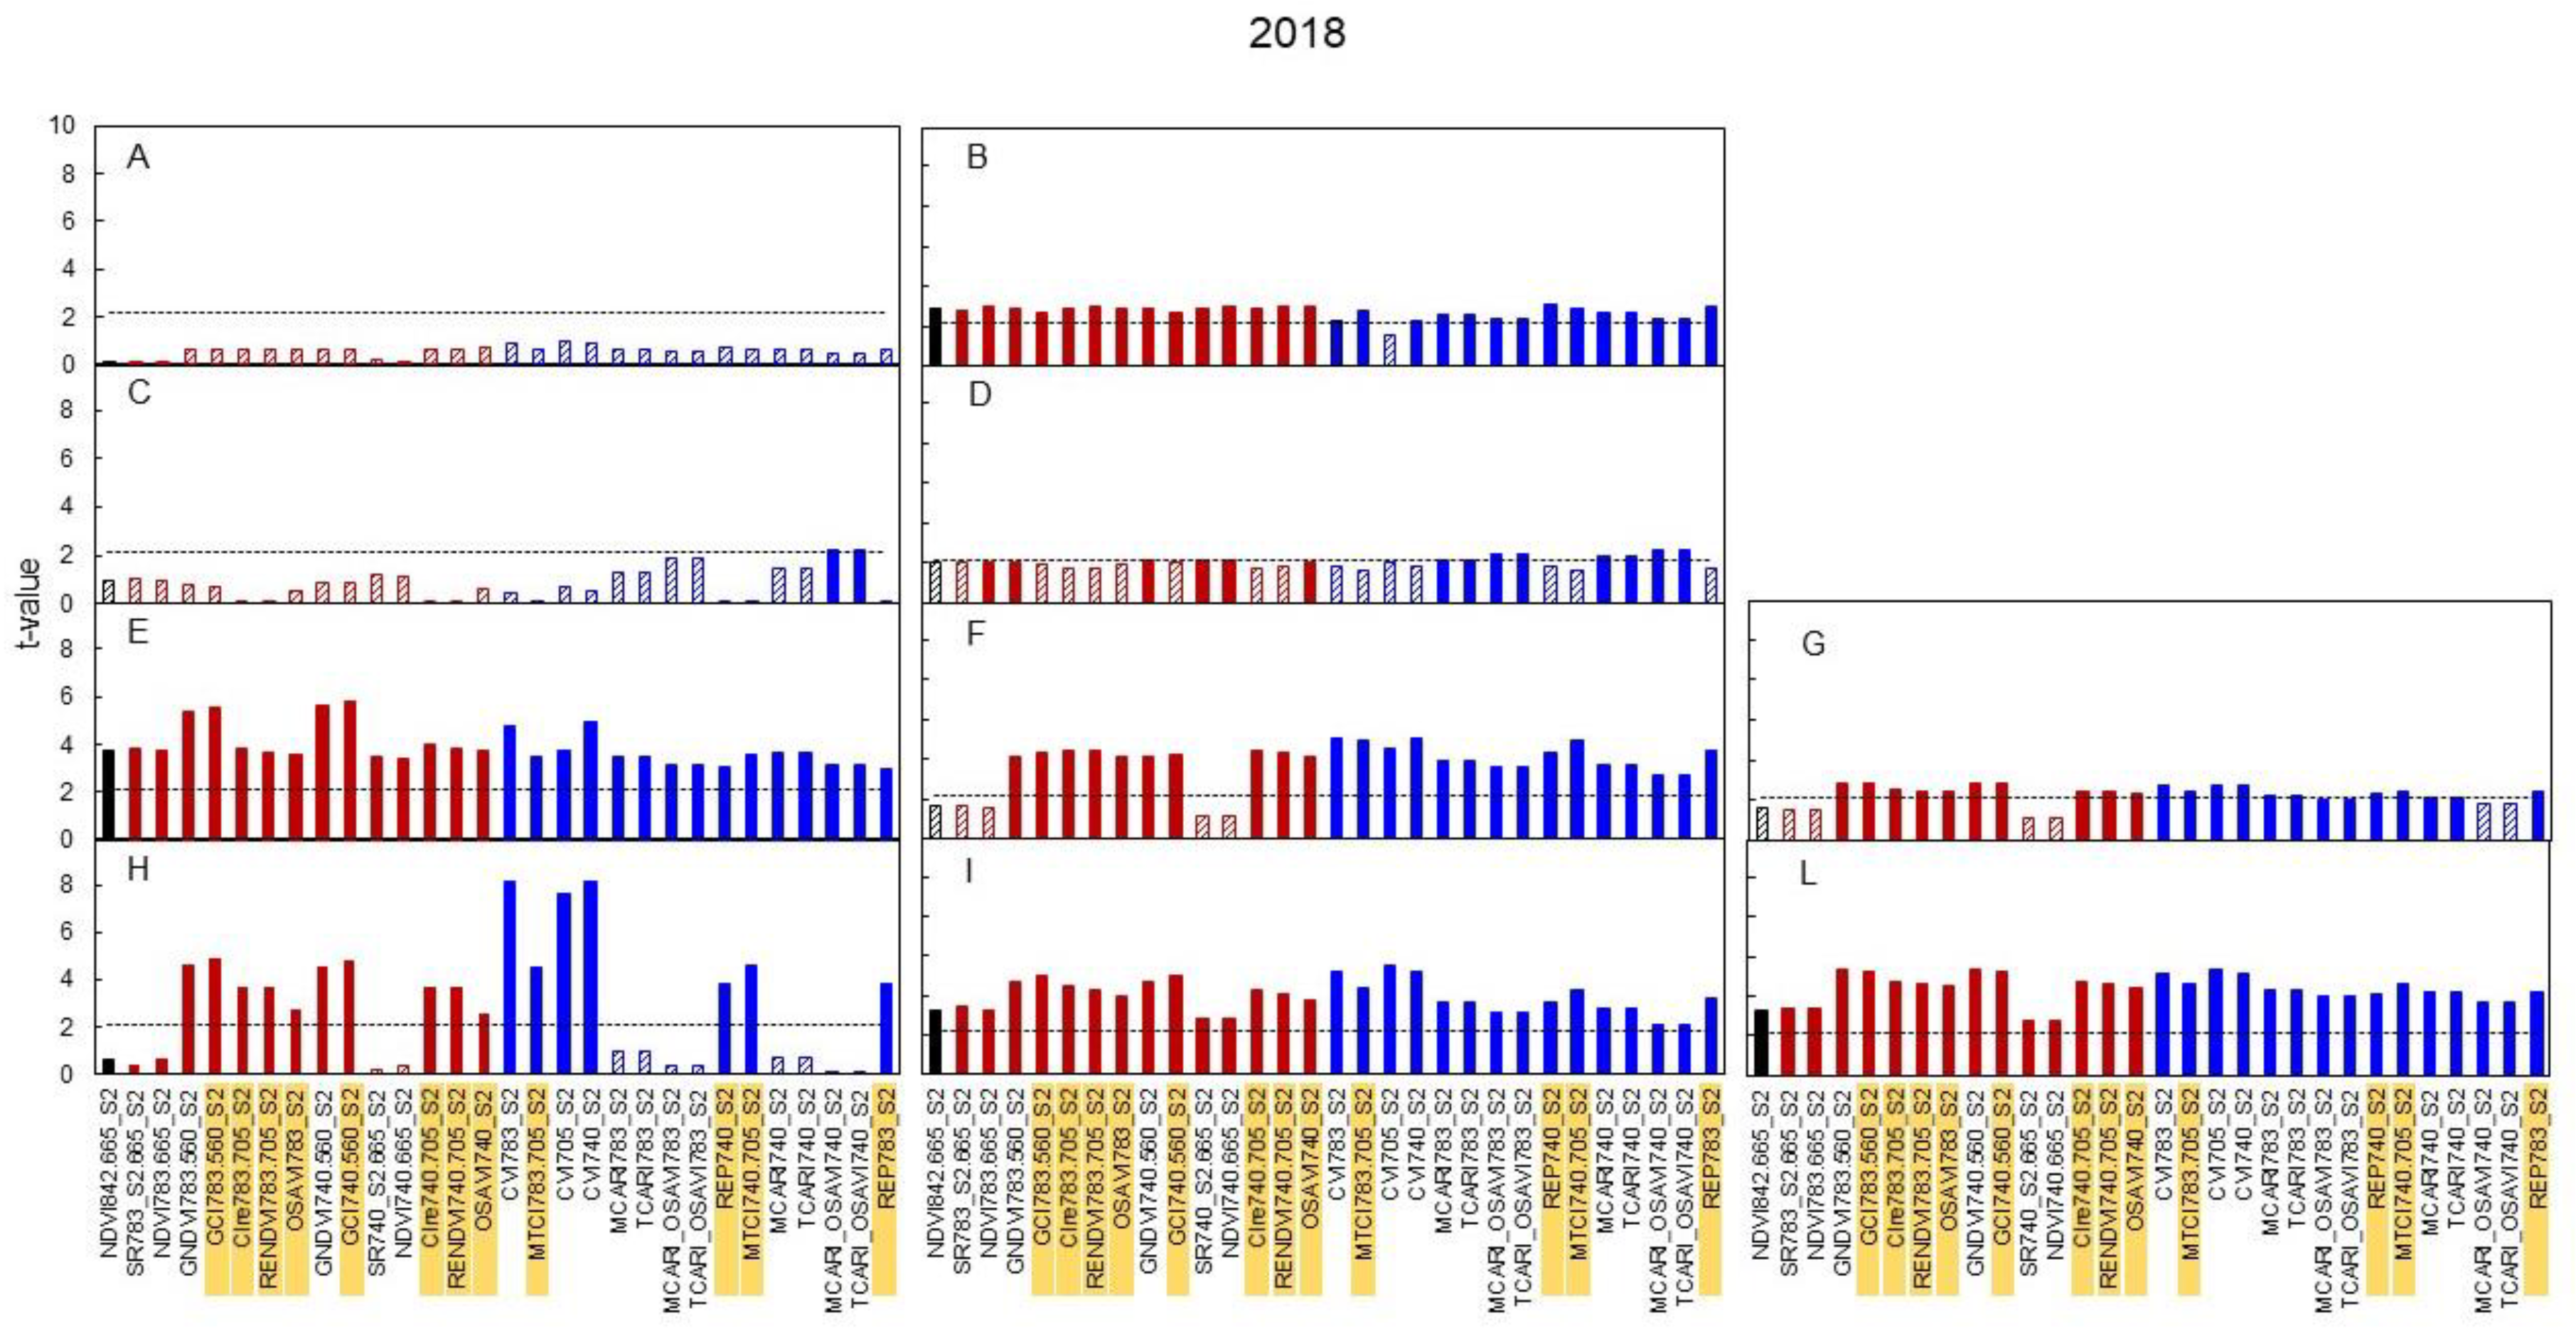
Equivalent graphs built for 2017 and 2018 (Figure 6 and Figure 7) show that, in 2017, the median leaves were especially reactive, as several indices already showed significant t-values for the N0 versus N+ comparison at the very first date of sampling (DOY 129), i.e., 11 days after the beginning of the N supply, (Figure 6B) and such higher reactivity was maintained for the remainder of the season (Figure 6D,F,I). In 2018 (Figure 7) the pattern described in 2017 was essentially maintained.
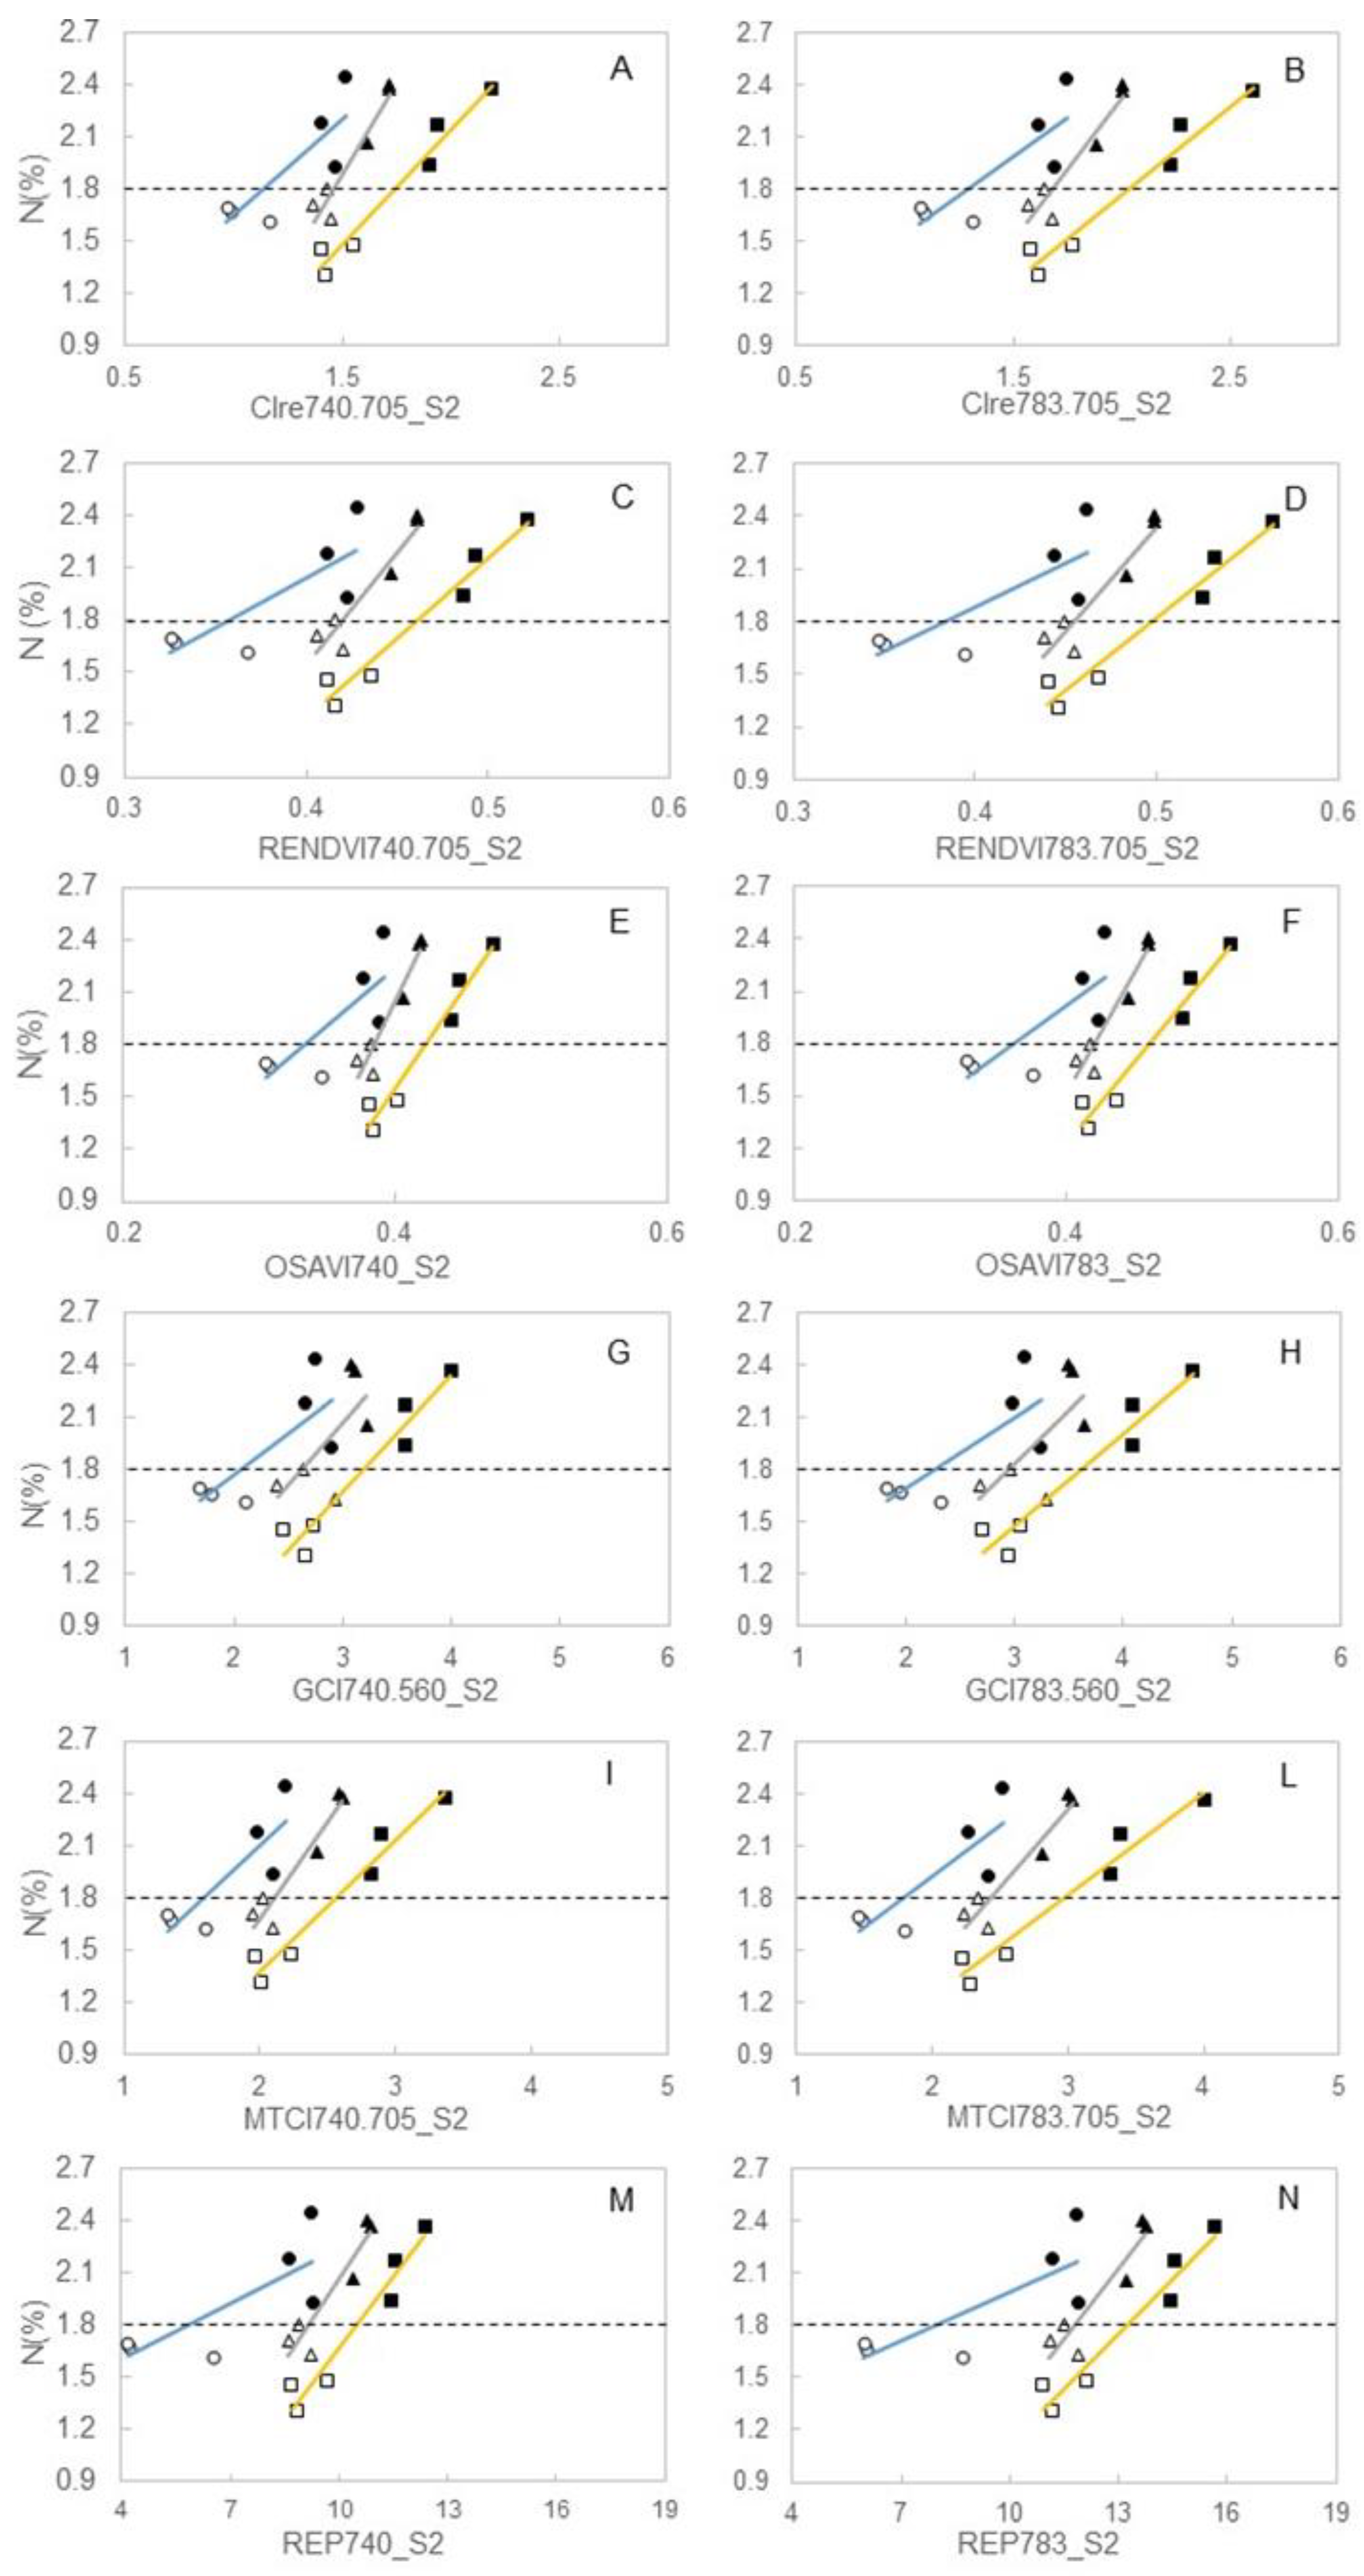
Criteria used to select, among the population of 29 broadband vegetation indices, those to be regressed against leaf N concentration determined at veraison is based on data shown in Figure 5, giving priority to those reaching, in 2016, significant t-values as related to the sampling date and position along the stem. Such criteria were met by readings taken in the median shoot zone on DOY 159 and indices having, at that date, a t-value ≥ than significant thresholds at P0.05 are highlighted in bold character in Table 1. For the selected 12 broadband vegetation indices, within-year correlation between index reflectance and leaf N concentration was evaluated for data pooled over N+ and N0 (Figure 8). Index values used in each correlation were those taken at the closest date to nutritional leaf sampling, i.e., DOY 172, 177, and 169 in 2016, 2017, and 2018, respectively. Significance of the linear models changed with year, with 2018 generally achieving looser correlations. However, in both 2016 and 2017, correlations between CIre, RENDVI, OSAVI, GCI, MTCI, and REP and the respective leaf N concentration at veraison was very close (R2 varying from 0.86 and 0.96). In 2018, correlations were not so close, albeit all calculated R2—ranging between 0.60 and 0.71—were significant at p < 0.05.

4. Discussion

4.1. Agronomic Vine Performance to N Supply

In this trial, the vine responses to N supply marked large differences between a so called “agronomical” behaviour (i.e., vegetative growth, yield and grape composition) and physiological leaf function (namely SPAD values and gas-exchange rates). In regard to the first group of variables, the vines indeed showed a fast response to the N0 and N+ treatments, beginning from the first trial year when leaf N concentration at veraison was already lower than N+ (Figure S2B); moreover, as expected, leaf N increased linearly, according to a decreasing gradient of age from the base to apical part of the shoot as already shown in Poni et al., [14], who also suggested that such a behaviour reflects the seasonal increase, with age, of dry weight per unit leaf area. It is quite notable that, in N0, a leaf N concentration at veraison of 1.60% (DM basis) for data pooled over seasons and positions (Table 1) was low enough to drastically curtail yield per vine (55% less than N+) and such limitation was much stronger than that observed for total pruning weight per vine (−26% than N), leading to the ostensible paradox that a N deficiency actually leads to decreased Ravaz index (Table 2). Such a severe yield reduction was contributed to by both fewer and smaller berries (−41% and −21%, respectively when compared to N+), while the fraction of shot berries increased by 270% in N0. Moreover, the alternate pattern of proportional berry organ growth suggests that vine vigour can affect the berry development. When pruning weight was severely impaired in N0 vines in 2016, it might have led to a much more open canopy with more exposed clusters, which, as a well-known defense mechanism, were prone to increased skin thickness [46]. The same mechanism did not occur in 2017 and 2018 because, with increasing N deficiency, this “microclimate” effect was fully offset by N starvation that is also quite critical for cell division hence number and thickness of skin cell layers. Although in this trial we did not assess leaf N earlier in the season, the above scenario suggests an inadequate N supply around flowering and fruit that might have exacerbated flower drop and impaired the fertilization process (hence the rise in shot berries and the drop in seed number and size), according to May et al. and Guilpart et al. [3,5]. This hypothesis is also inherently supported by the fact that a strong yield reduction was already recorded on year one of our trial when negative carryover effects on bud induction and differentiation from the previous season should be ruled out. Sensitivity of the grapevine reproductive behaviour to N supply was also reported in Keller et al. [47]. In their trial on cv. Müller–Thurgau comparing two rates of N supply (0 and 100 kg/ha), they found that no supply significantly decreased fruit-set, berries per cluster and berry weight, whereas inflorescence necrosis was increased. A three-year trial conducted in Pinot Noir grown in pots and subjected to different levels of N supply (i.e., 100% as control and reduced levels of 50%, 20%, and 10% of control) showed that vine vigour given as total dormant cane weight was reduced by 31% with 10% N replenishment as compared to full supply, whereas yield per vine was curtailed by 66%, thus confirming that reproductive behaviour might be more significantly affected than vegetative growth under N deficiency [48]. These authors concluded that N leaf blade values of 1.8% at veraison are required to maintain yield and this fits very nicely with the mean blade N concentration we found at veraison (1.6% for data pooled over seasons and leaf positions in N0 vines).

4.2. Physiological Vine Performance to N Supply

The study tracked the progressive inception of symptomless and then more visible N deficiency in N0 plots. Both SPAD and assimilation trends showed no difference between treatments in the initial sampling dates, hence initial leaf function on N0 vines was definitely not limited. Although it is well known that under N-deficiency, leaves decrease their chlorophyll content to avoid oxidative stress induced by a more pronounced drop in rubisco activity as compared to the decrease in the electron transport capacity [1], in our study no correlation was found between SPAD values and leaf A rates. Therefore, when using the greenness index measured by the Minolta SPAD 502, two different considerations are at hand: (i) SPAD is, in general, useful to detect relative differences between treatments and its sensitivity is generally quite good at discriminating either year-to-year variations or at identifying when, during the season, treatments subjected to different N supply start to show differences; (ii) such differences do not necessarily correspond to actual variations in leaf chlorophyll content and/or leaf assimilation rates. Although in our study we did not carry out destructive chlorophyll readings, it is apparent from data reported in Figure 1 that over 95% of the SPAD values were above the 25 SPAD unit threshold. Such a threshold is exactly matching the one above which Steele et al. [21] found quite poor correlation with chlorophyll values derived from wet chemical extractions.
A distinctive feature of our work was that plants subjected to N-deficiency showed a moderate decrease in assimilation rates that were slightly lower than well N supplied vines at few dates in both 2016 and 2017, whereas in 2018 treatments showed similar leaf assimilation (Figure 2). Such a response seems to contradict the strong limitation that no N supply exerted onto vine vigour and, especially, on yield performance. Very little information is available for the grapevine about long-term adaptation mechanisms to a low N supply. In their three-year study on Pinot noir, Schreiner et al. [48] found no difference in A rates among different N supply levels (100% down to 10%) over the first two years of the trial and only during the third year, 10% and 20% replenishment resulted in lower A than the 100% level. Their conclusion was that the lowest N concentration in leaves they observed (about 1.4%) was above the limiting level needed for high rates of carbon fixation in Pinot noir vines, suggesting caution in basing leaf tissue N guidelines on photosynthetic capacity of leaves. Thus, there is a good fit with our data since the lowest leaf N concentration measured in leaf blades at veraison was 1.48% (N0 in 2017, Figure S2B). A more complicated matter of discussion is related to: (i) Causes of lower A rates under N-deficiency, i.e., stomatal versus non stomatal and (ii) type of compensation mechanisms aiming at maximizing N utilization for photosynthesis. Both Keller et al. [1] and Schreiner et al. [48] agree that non-stomatal limitations are the primary cause for lower A under N-deficiency primarily in light of a rising sub-stomatal CO2 concentration (ci) and a parallel variation in A and mesophyll conductance. This explanation can also be extended to our work if we also consider that, in N0, gs was never reduced (Figure 3), supporting the hypothesis that the low N vines kept the stomata proportionally more open in an effort to maximise A. In regard to item ii), to the best of our knowledge, no specific information seems to be available for the grapevine. However, a case in point that is well adapted to our case is the one reported for maize plants subjected, for two years, to nil or 180 kg N ha−1. Interestingly, leaf A rates were not at all affected, despite specific N content (g m−2) being reduced by 38% and, as a related consequence, photosynthetic N-use efficiency increased by 54% [49]. Their interpretation for such combined effects was that, under low-N stress, maize plants tended to invest relatively more N into bioenergetics to sustain electron transport and, conversely, N allocated to chlorophyll and light harvesting proteins was reduced to control excess electron production. Low N supply in grapevine could, indeed, cause a similar within-leaf N allocation mechanism. As a matter of fact, in the three-year trial, the different fertilization caused N concentration (g N m−2) change equal to 44%, interpolated using leaf dry matter m−2. At the same time, the photosynthetic N-use efficiency, calculated using assimilation averaged data of three years, increased by 58%. However, data shown in Figure 2 for seasonal A rates’ variation in 2016 according to leaf position (hence age) along the stem also suggest a between-leaf N allocation mechanism. Poni et al. [15] pointed out that, when leaf N content (mg/cm2) is plotted versus leaf age—given as days after unfolding, the peak reached at around 50 days of age and then, with increasing age a diminishing pattern is quite apparent. Data reported in panels A, D, and G of Figure 2 highlight that, for older basal leaves, no N supply anticipated N export towards median and apical leaves to sustain or improve their assimilation capacity under a low N regime. As a matter of fact, at no dates in 2016 did leaf A differ between N0 and N+ for apical leaves (Figure 2C), i.e., those able to provide highest assimilation late in the season, i.e., after veraison. Interestingly, the described mechanism did not occur in 2017 and 2018, suggesting that an abrupt change in N supply is likely required to foster such a response before an equilibrium is reached.

4.3. Sensitivity of Canopy Reflectance Indices versus N Leaf Status and Vine Behaviour

Our large data set on seasonal variation of canopy reflectance indices calculated on Barbera potted vines subjected to regular or no N supply during the season confirm that combined indices processed within the green or the red-edge domains are the most reliable for early detection of inadequate N status in grapevines [26]. While Rustioni et al. [27] have recently successfully shown that reflectance spectra collected along veins, in interveinal areas and at leaf margins are able to discriminate among early iron, magnesium, nitrogen, and potassium deficiency without necessarily requiring the availability of a well- supplied control, our three-year work adds more about sensitivity of reflectance indices versus the dynamic of early N-deficiency in grapevine leaves. Contrariwise to what Rustioni et al., [27] suggested for initial N-deficiency symptoms, our 2016 campaign indicates that for 12 spectral indices, the median part of the shoot was the first to be affected in terms of significant spectra modifications against no N supply (Figure 5E) and such a behaviour was confirmed with greater magnitude over the following seasons (Figure 5H,M). Thus, interpreting N mobility within the shoot as a progressive and faster translocation from the older (basal) leaves towards the youngest apical leaves—especially when N supply is becoming increasingly deficient—seems to be a risky oversimplification. In fact, within a so called “basal”, “median”, and “apical” shoot zone we might have, depending upon sampling date and shoot development stage, a population of leaves greatly differing in age and, as a consequence, in terms of source–sink balance. In our study, all spectra readings, except for a quite late date (DOY 200) in 2018 corresponding to post-veraison, were taken between pre-flowering and lag-phase of berry growth. Throughout those dates, the sampled median leaves (8–9th along the shoot stem) were the most reactive in terms of reflectance in the red-edge to N supply (Figure 4B,E,H). Thus, our hypothesis to explain why those leaves were the promptest to show early and significant changes in reflectance links to older data reported by Poni et al. [14] who showed, in field grown Sangiovese grapes, that, from flowering until veraison, N content (area basis) is highest in median leaves. It is possible that, within a scenario of progressive N starvation, those leaves having the highest N pool would actually favor translocation to either basal leaves, to prevent or slow down senescence and to the apical leaves to meet their higher sink demand. Indirect confirmation of such a hypothesis is also provided by t-values calculated for N0 versus N+ comparison of spectral signature performed on DOY 200 in 2018, i.e., post-veraison (Figure 4I). On that specific occasion and for a quite late recording date, the apical shoot zone displayed highest spectral sensitivity to N supply; this is again fitting with the hypothesis built on the work of Poni et al. showing that, after veraison, the now mature apical leaves have the highest N content when given on a per leaf area basis.
A second interesting matter of discussion is if such detailed information provided by characterization of canopy reflectance properties can be practically used to guide N fertilization in the vineyard. Working for two years on two cultivars under either well-watered and water stressed conditions and employing either chlorophyll meters (SPAD 502 and CCM-200) and two active canopy sensors (Crop Circle ACS 210 and 430) Taskos et al. [28] concluded that such a task is still difficult to achieve due to both genotype-related variability and looser relationships with yield and grape composition later in the season. However, their leaf N concentrations for data pooled over the years and water regimes highlight a 1.78% and a 1.82% at veraison for cvs. Cabernet S. and Xinomavro, respectively, that, according to previous data and data presented in our study, do not seem to represent a severely limited status. Cases of correlations reported in Figure 8 suggest that in 2018 N deficiency was at the peak, leading to significant leaf discoloration or inception of necrosis and this phenomenon might have easily affected precision of the FieldSpec readings. However, these regressions provide two different and valuable guidelines in terms of management of N nutrition in cv. Barbera: (i) Regardless of season, all index values calculated for the N0 treatment correspond to a leaf N concentration at veraison ≤ 1.8%. Thus, such a threshold must be considered the upper boundary below which, in Barbera, an increasing limitation in yield and growth is expected; (ii) it is likewise true that, especially when referring to readings taken in 2017 and 2018 the same leaf N concentration might correspond to a quite different value of a specific index; yet such interference can be easily overcome by acquiring, in a given year, reflectance readings also on control leaves provided with adequate N supply.

5. Conclusions

In a three-year trail where fruiting cv. Barbera potted vines were subjected to standard (N+) or no (N0) nitrogen fertilization, it was apparent the N deficiency decreased yield more than proportionally when compared with its effects on vegetative growth by exerting severe limitations on berry set and size. Conversely, reduction of leaf assimilation in N0 vines was definitely milder or non-existent, suggesting that compensation mechanisms for photosynthesis under low N supply are triggered. Reflectance spectral characterization of the leaf nutritional status showed increased reflectance in green and red-edge bands under N-deficiency. Furthermore, some indices (CIre, RENDVI, OSAVI, GCI, MTCI, and REP), when opportunely adapted to use the bands within the red-edge domain, showed higher efficiency in detecting significant changes in leaf N concentration from the early stages of canopy growth, with leaves located in the median part of the shoots showing the highest level of promptness. Standard NDVI did not show sensitivity to leaf chlorophyll and N variations. Even when the formula was modified using red-edge bands, it showed a delayed response. Practical guidelines emerging from this work are that a leaf blade N concentration at veraison ≤ 1.8% identifies a threshold below which severe and increasing yield limitation is expected and that a number of broadband spectral indices, mostly falling in the red-edge domain, can be used to accurately and non-destructively estimate leaf N. Though, due to year-to-year variation in the values of each index, pair readings with control leaves supplied with adequate N is recommended. Further studies are needed to test the indices sensitivity in field conditions to investigate if the selected indices will show reliable responses in different environments and grapevine varieties.

Supplementary Materials

The following are available online at https://www.mdpi.com/2073-4395/9/12/864/s1, Table S1. Chemical–physical properties of the soil used to fill the pots in trial. Table S2. Vegetation indices used in the study. Figure S1. Daily maximum (red line), mean (green line), and minimum (blue line) air temperature for 1 April to 30 Sept recorded in 2016 (A), 2017 (B), and 2018 (C) at a weather station near the experimental center. Histograms show daily rainfall, DOY, day of year. Figure S2. Partitioning of the interaction between leaf position (basal, median, apical) and fertilization treatment (N0, N+) for leaf N concentration (% DM) at veraison (panel A). Each treatment combination mean is calculated over the years and sub-replicates (n = 36). Vertical bars of each column represent standard error (SE). Partitioning of the interaction between years (2016, 2017, 2018) and fertilization treatment (N0, N+) for leaf N and P concentration (% DM) at veraison (panels B, C). Each treatment combination mean is calculated over leaf position and sub-replicates (n = 36). Vertical bars of each column represent standard error (SE). Figure S3. Partitioning of the interaction between years (2016, 2017, 2018) and fertilization treatment (N0, N+) for main, lateral, and total pruning weight per vine (panels A, B, C), yield per vine (panel D), cluster weight (panel E), and Ravaz index (panel F). Each treatment combination mean is calculated over sub-replicates (n = 8). Vertical bars of each column represent standard error (SE). Figure S4. Partitioning of the interaction between years (2016, 2017, 2018) and fertilization treatment (N0, N+) for skin weight, flesh weight and total seed weight per berry (panels A, B, C) and seed number per berry (panel D). Each treatment combination mean is calculated over sub-replicates (n = 8). Vertical bars of each column represent standard error (SE). Figure S5. Partitioning of the interaction between years (2016, 2017, 2018) and fertilization treatment (N0, N+) for total soluble solids (TSS, panel A), tartaric and malic acid concentration (panels B, C) and total anthocyanins (panel D). Each treatment combination mean is calculated over sub-replicates (n = 8). Vertical bars of each column represent standard error (SE).

Author Contributions

Conceptualization, M.G. and S.P.; Formal analysis, M.G., A.V., and M.C.; Investigation, C.S., A.G., M.C., F.C., and M.V.; Data curation, C.S., A.G., and M.B.; Writing—original draft preparation, C.S. and S.P.; Writing—review and editing, M.G. and M.V.; Supervision, S.P.

Funding

This study was funded by Emilia Romagna Region (project Nutrivigna) within the POR-FESR 2014-2020 program.

Acknowledgments

The authors wish to thank Lily Ronney for editing the English text.

Conflicts of Interest

The authors declare no conflict of interest.

References

  1. Keller, M. Deficit irrigation and vine mineral nutrition. Am. J. Enol. Vitic. 2005, 56, 267–283. [Google Scholar]
  2. Conradie, W.J. Utilization of nitrogen by the grapevine affected as affected by time of application and soil type. S. Afr. J. Enol. Vitic. 1986, 7, 76–83. [Google Scholar]
  3. May, P. Flowering and Fruitset in Grapevines; Phylloxera and Grape Industry Board of South Australia: Adelaide, SA, Australia, 2004.
  4. Marschner, H. Marschner’s Mineral Nutrition of Higher Plants; Academic Press: Waltham, MA, USA, 2012. [Google Scholar]
  5. Guilpart, N.; Metay, A.; Gary, C. Grapevine bud fertility and number of berries per cluster are determined by water and nitrogen stress around flowering in the previous year. Eur. J. Agron. 2014, 54, 9–20. [Google Scholar] [CrossRef]
  6. Mundy, D.C. A review on the direct and indirect effects of nitrogen on botrytis cluster rot in wine grapes. N. Z. Plant. Prot. 2008, 61, 306–310. [Google Scholar]
  7. Mendez-Costabel, M.P.; Wilkinson, K.L.; Bastian, S.E.P.; Jordans, C.; Mccarthy, M.; Ford, C.M.; Dokoozlian, N.K. Effect of increased irrigation and additional nitrogen fertilisation on the concentration of green aroma compounds in Vitis vinifera L. Merlot fruit and wine. Aust. J. Grape Wine Res. 2014, 20, 80–90. [Google Scholar] [CrossRef]
  8. Thomidis, T.; Zioziou, E.; Koundouras, S.; Karagiannidis, C.; Navrozidis, I.; Nikolaou, N. Effects of nitrogen and irrigation on the quality of grapes and the susceptibility to Botrytis cluster rot. Sci Hortic. 2016, 212, 60–68. [Google Scholar] [CrossRef]
  9. Palliotti, A.; Gardi, T.; Berrios, J.G.; Civardi, S.; Poni, S. Early source limitation as a tool for yield control and wine quality improvement in a high-yielding red Vitis vinifera L. cultivar. Sci Hortic. 2012, 145, 10–16. [Google Scholar] [CrossRef]
  10. Sabbatini, P.; Howell, G.S. Rootstock scion interaction and effects on vine vigor, phenology, and cold hardiness of interspecific hybrid grape cultivars (Vitis spp.). Int. J. Fruit Sci. 2013, 13, 466–477. [Google Scholar] [CrossRef]
  11. Gatti, M.; Garavani, A.; Vercesi, A.; Poni, S. Ground-truthing of remotely sensed within-field variability in a cv. Barbera plot for improving vineyard management. Aust. J. Grape Wine Res. 2017, 23, 399–408. [Google Scholar] [CrossRef]
  12. Soubeyrand, E.; Basteau, C.; Hilbert, G.; Van Leeuwen, C.; Delrot, S.; Gomes, E. Nitrogen supply affects anthocyanin biosynthetic and regulatory genes in grapevine cv. Cabernet-Sauvignon berrries. Phytochemistry 2014, 103, 38–49. [Google Scholar] [CrossRef]
  13. Seemann, J.R.; Sharkey, T.D.; Wang, J.; Osmond, C.B. Environmental effects on photosynthesis, nitrogen use efficiency and metabolite pools in leaves of sun and shade plants. Plant. Physiol. 1987, 84, 796–802. [Google Scholar] [CrossRef] [PubMed] [Green Version]
  14. Poni, S.; Intrieri, C.; Silvestroni, O. Interactions of leaf age, fruiting, and exogenous cytokinins in sangiovese grapevines under non-irrigated conditions. II. Chlorophyll and nitrogen content. Am. J. Enol. Vitic. 1994, 45, 278–284. [Google Scholar]
  15. Poni, S.; Intrieri, C.; Silvestroni, O. Interactions of leaf age, fruiting, and exogenous cytokinins in Sangiovese grapevines under non-irrigated conditions. I. Gas exchange. Am. J. Enol. Vitic. 1994, 45, 71–78. [Google Scholar]
  16. Lim, P.O.; Kim, H.J.; Nam, H.G. Leaf senescence. Ann. Rev. Plant. Biol. 2007, 58, 115–136. [Google Scholar] [CrossRef] [Green Version]
  17. Evans, J.R. Photosynthesis and nitrogen relationships in leaves of C3 plants. Oecologia 1989, 78, 9–19. [Google Scholar] [CrossRef]
  18. Williams, L.E.; Dokoozlian, N.K.; Wample, R. Grape. In Handbook of Environmental Physiology of Fruit Crops Vol. I. Temperate Crops; Schaffer, B., Andersen, P.C., Eds.; CRC Press: Boca Raton, FL, USA, 1994; Volume I, pp. 85–133. [Google Scholar]
  19. Markwell, J.; Osterman, J.C.; Mitchell, J.L. Calibration of the Minolta SPAD-502 leaf chlorophyll meter. Photosynth. Res. 1995, 46, 467–472. [Google Scholar] [CrossRef]
  20. Ghasemi, M.; Arzani, K.; Yadollahi, K.; Ghasemi, S.; Sarikhani Khorrami, S. Estimate of leaf chlorophyll and nitrogen content in Asian pear (Pyrus serotina Rehd.) by CCM-200. Not. Sci. Biol. 2011, 3, 91–94. [Google Scholar] [CrossRef] [Green Version]
  21. Steele, M.R.; Gitelson, A.A.; Rundquist, D.C. A comparison of two techniques for non destructive measurement of chlorophyll content in grapevine leaves. Agr. J. 2008, 100, 779–782. [Google Scholar] [CrossRef] [Green Version]
  22. Richardson, A.D.; Duigan, S.P.; Berlyn, G.P. An evaluation of noninvasive methods to estimate foliar chlorophyll content. New Phytol. 2002, 153, 185–194. [Google Scholar] [CrossRef] [Green Version]
  23. Gitelson, A.A.; Gritz, U.; Merzlyak, M.N. Relationships between leaf chlorophyll content and spectral reflectance and algorithms for non-destructive chlorophyll assessment in higher plant leaves. J. Plant. Physiol. 2003, 160, 271–282. [Google Scholar] [CrossRef]
  24. Matese, A.; Di Gennaro, S.F. Technology in precision viticulture: A state of the art review. Int. J. Wine Res. 2015, 7, 69–81. [Google Scholar] [CrossRef] [Green Version]
  25. Clevers, J.G.P.W.; Gitelson, A.A. Remote estimation of crop and grass chlorophyll and nitrogen content using red-edge bands on Sentinel-2 and-3. Int. J. Appl. Earth Obs. Geoinf. 2013, 23, 344–351. [Google Scholar] [CrossRef]
  26. Páscoa, R.N.M.J. In situ visible and near-infrared spectroscopy applied to vineyards as a tool for precision viticulture. Compr. Anal. Chem. 2018, 80, 252–279. [Google Scholar]
  27. Rustioni, L.; Grossi, D.; Brancadoro, L.; Failla, O. Iron, magnesium, nitrogen and potassium deficiency symptom discrimination by reflectance spectroscopy in grapevine leaves. Sci. Hort. 2018, 241, 152–159. [Google Scholar] [CrossRef]
  28. Taskos, D.G.; Koundouras, S.; Stamatiadis, S.; Zioziou, E.; Nikolaou, N.; Karakioulakis, K.; Theodorou, N. Using active canopy sensors and chlorophyll meters to estimate grapevine nitrogen status and productivity. Precis. Agric. 2015, 16, 77–98. [Google Scholar] [CrossRef]
  29. Páscoa, R.N.M.J.; Lopo, M.; dos santos, T.C.; Graça, A.R.; Lopes, J.A. Exploratory study on vineyards soil mapping by visible/near-infrared spectroscopy of grapevine leaves. Comp. Elec. Agric. 2016, 127, 15–25. [Google Scholar] [CrossRef]
  30. Caruso, G.; Tozzini, L.; Rallo, G.; Primicerio, J.; Moriondo, M.; Palai, G.; Gucci, R. Estimating biophysical and geometrical parameters of grapevine canopies (’Sangiovese’) by an unmanned aerial vehicle (UAV) and VIS-NIR cameras. Vitis 2017, 56, 63–70. [Google Scholar]
  31. Liu, J.; Han, J.; Chen, X.; Shi, L.; Zhang, L. Nondestructive detection of rape leaf chlorophyll level based on Vis-NIR spectroscopy. Spectrochimica Acta Part A Mol. Biomol. Spect. 2019, 222, 117202. [Google Scholar] [CrossRef]
  32. Soltani, I.; Fouad, Y.; Michot, D.; Pichelin, P.; Cudennec, C. Relevance of a near infrared spectral index for assessing tillage and fertilization effects on soil water retention. Soil Tillage Res. 2019, 194, 104345. [Google Scholar] [CrossRef]
  33. Saxton, K.E.; Rawls, W.J. Soil water characteristic estimates by texture and organic matter for hydrologic solutions. Soil Sci. Soc. Am. J. 2006, 70, 1569–1578. [Google Scholar] [CrossRef] [Green Version]
  34. Keller, M.; Kummer, M.; Vasconcelos, M.C. Soil nitrogen utilisation for growth and gas exchange by grapevines in response to nitrogen supply and rootstock. Aust. J. Grape Wine Res. 2001, 7, 2–11. [Google Scholar] [CrossRef]
  35. Lorenz, D.H.; Eichorn, K.W.; Bleiholder, H.; Klose, R.; Meier, U.; Weber, E. Phenological growth stages of the grapevine (Vitis vinifera L. ssp. vinifera). Codes and descriptions according to the extended BBCH scale. Aust. J. Grape Wine Res. 1995, 1, 100–103. [Google Scholar] [CrossRef]
  36. Stevens, A.; Ramirez-Lopez, L. An Introduction to the Prospectr Package. R Package Vignette, Report No.: R Package Version 0.1 3. 2014. Available online: https://github.com/antoinestevens/prospectr (accessed on 4 February 2017).
  37. European Space Agency Home Page. Available online: https://sentinel.esa.int/web/sentinel/home (accessed on 21 October 2019).
  38. Main, R.; Cho, M.A.; Mathieu, R.; O’Kennedy, M.M.; Ramoelo, A.; Koch, S. An investigation into robust spectral indices for leaf chlorophyll estimation. ISPRS J. Photogramm. 2011, 66, 751–761. [Google Scholar] [CrossRef]
  39. Rouse, J., Jr.; Haas, R.H.; Schell, J.A.; Deering, D.W. Monitoring vegetation systems in the Great Plains with ERTS. In Third Earth Resources Technology Satellite-1 Symposium. Volume 1: Technical Presentations, Section A; National Aeronautics and Space Administration: Washington, DC, USA, 1974. [Google Scholar]
  40. Gitelson, A.; Merzlyak, M.N. Quantitative estimation of chlorophyll-a using reflectance spectra: Experiments with autumn chestnut and maple leaves. J. Photochem. Photobiol. B Biol. 1994, 22, 247–252. [Google Scholar] [CrossRef]
  41. Gitelson, A.A.; Viña, A.; Arkebauer, T.J.; Rundquist, D.C.; Keydan, G.; Leavitt, B. Remote estimation of leaf area index and green leaf biomass in maize canopies. Geophys. Res. Lett. 2003, 30. [Google Scholar] [CrossRef] [Green Version]
  42. Rondeaux, G.; Steven, M.; Baret, F. Optimization of soil-adjusted vegetation indices. Remote Sens. Environ. 1996, 55, 95–107. [Google Scholar] [CrossRef]
  43. Vincini, M.; Frazzi, E.; D’Alessio, P. A broad-band leaf chlorophyll vegetation index at the canopy scale. Precis. Agric. 2008, 9, 303–319. [Google Scholar] [CrossRef]
  44. Haboudane, D.; Miller, J.R.; Pattey, E.; Zarco-Tejada, P.J.; Strachan, I.B. Hyperspectral vegetation indices and novel algorithms for predicting green LAI of crop canopies: Modeling and validation in the context of precision agriculture. Remote Sens. Environ. 2004, 90, 337–352. [Google Scholar] [CrossRef]
  45. Iland, P.; Dry, P.; Proffitt, T.; Tyerman, S. The Grapevine: From the Science to the Practice of Growing Vines for Wine; Patrick Iland Wine Promotions Pty Ltd.: Campbelltown, SA, Australia, 2011. [Google Scholar]
  46. Keller, M. The Science of Grapevines: Anatomy and Physiology; Academic Press: Waltham, MA, USA, 2015. [Google Scholar]
  47. Keller, M.; Kummer, M.; Carmo Vasconcelos, M. Reproductive growth of grapevines in response to nitrogen supply and rootstocks. Aust. J. Grape Wine Res. 2001, 7, 12–18. [Google Scholar] [CrossRef]
  48. Schreiner, P.; Lee, J.; Skinkis, P.A. N, P and K supply to pinot noir grapevines: Impact on vine nutrient status, growth, physiology and yield. Am. J. Enol. Vitic. 2013, 64, 26–38. [Google Scholar] [CrossRef]
  49. Mu, X.; Chen, Q.; Chen, F.; Yuan, L.; Mi, G. Within-leaf nitrogen allocation in adaptation to low nitrogen supply in maize during grain-filling stage. Front. Plant. Sci. 2016, 7, 699. [Google Scholar] [CrossRef] [PubMed]
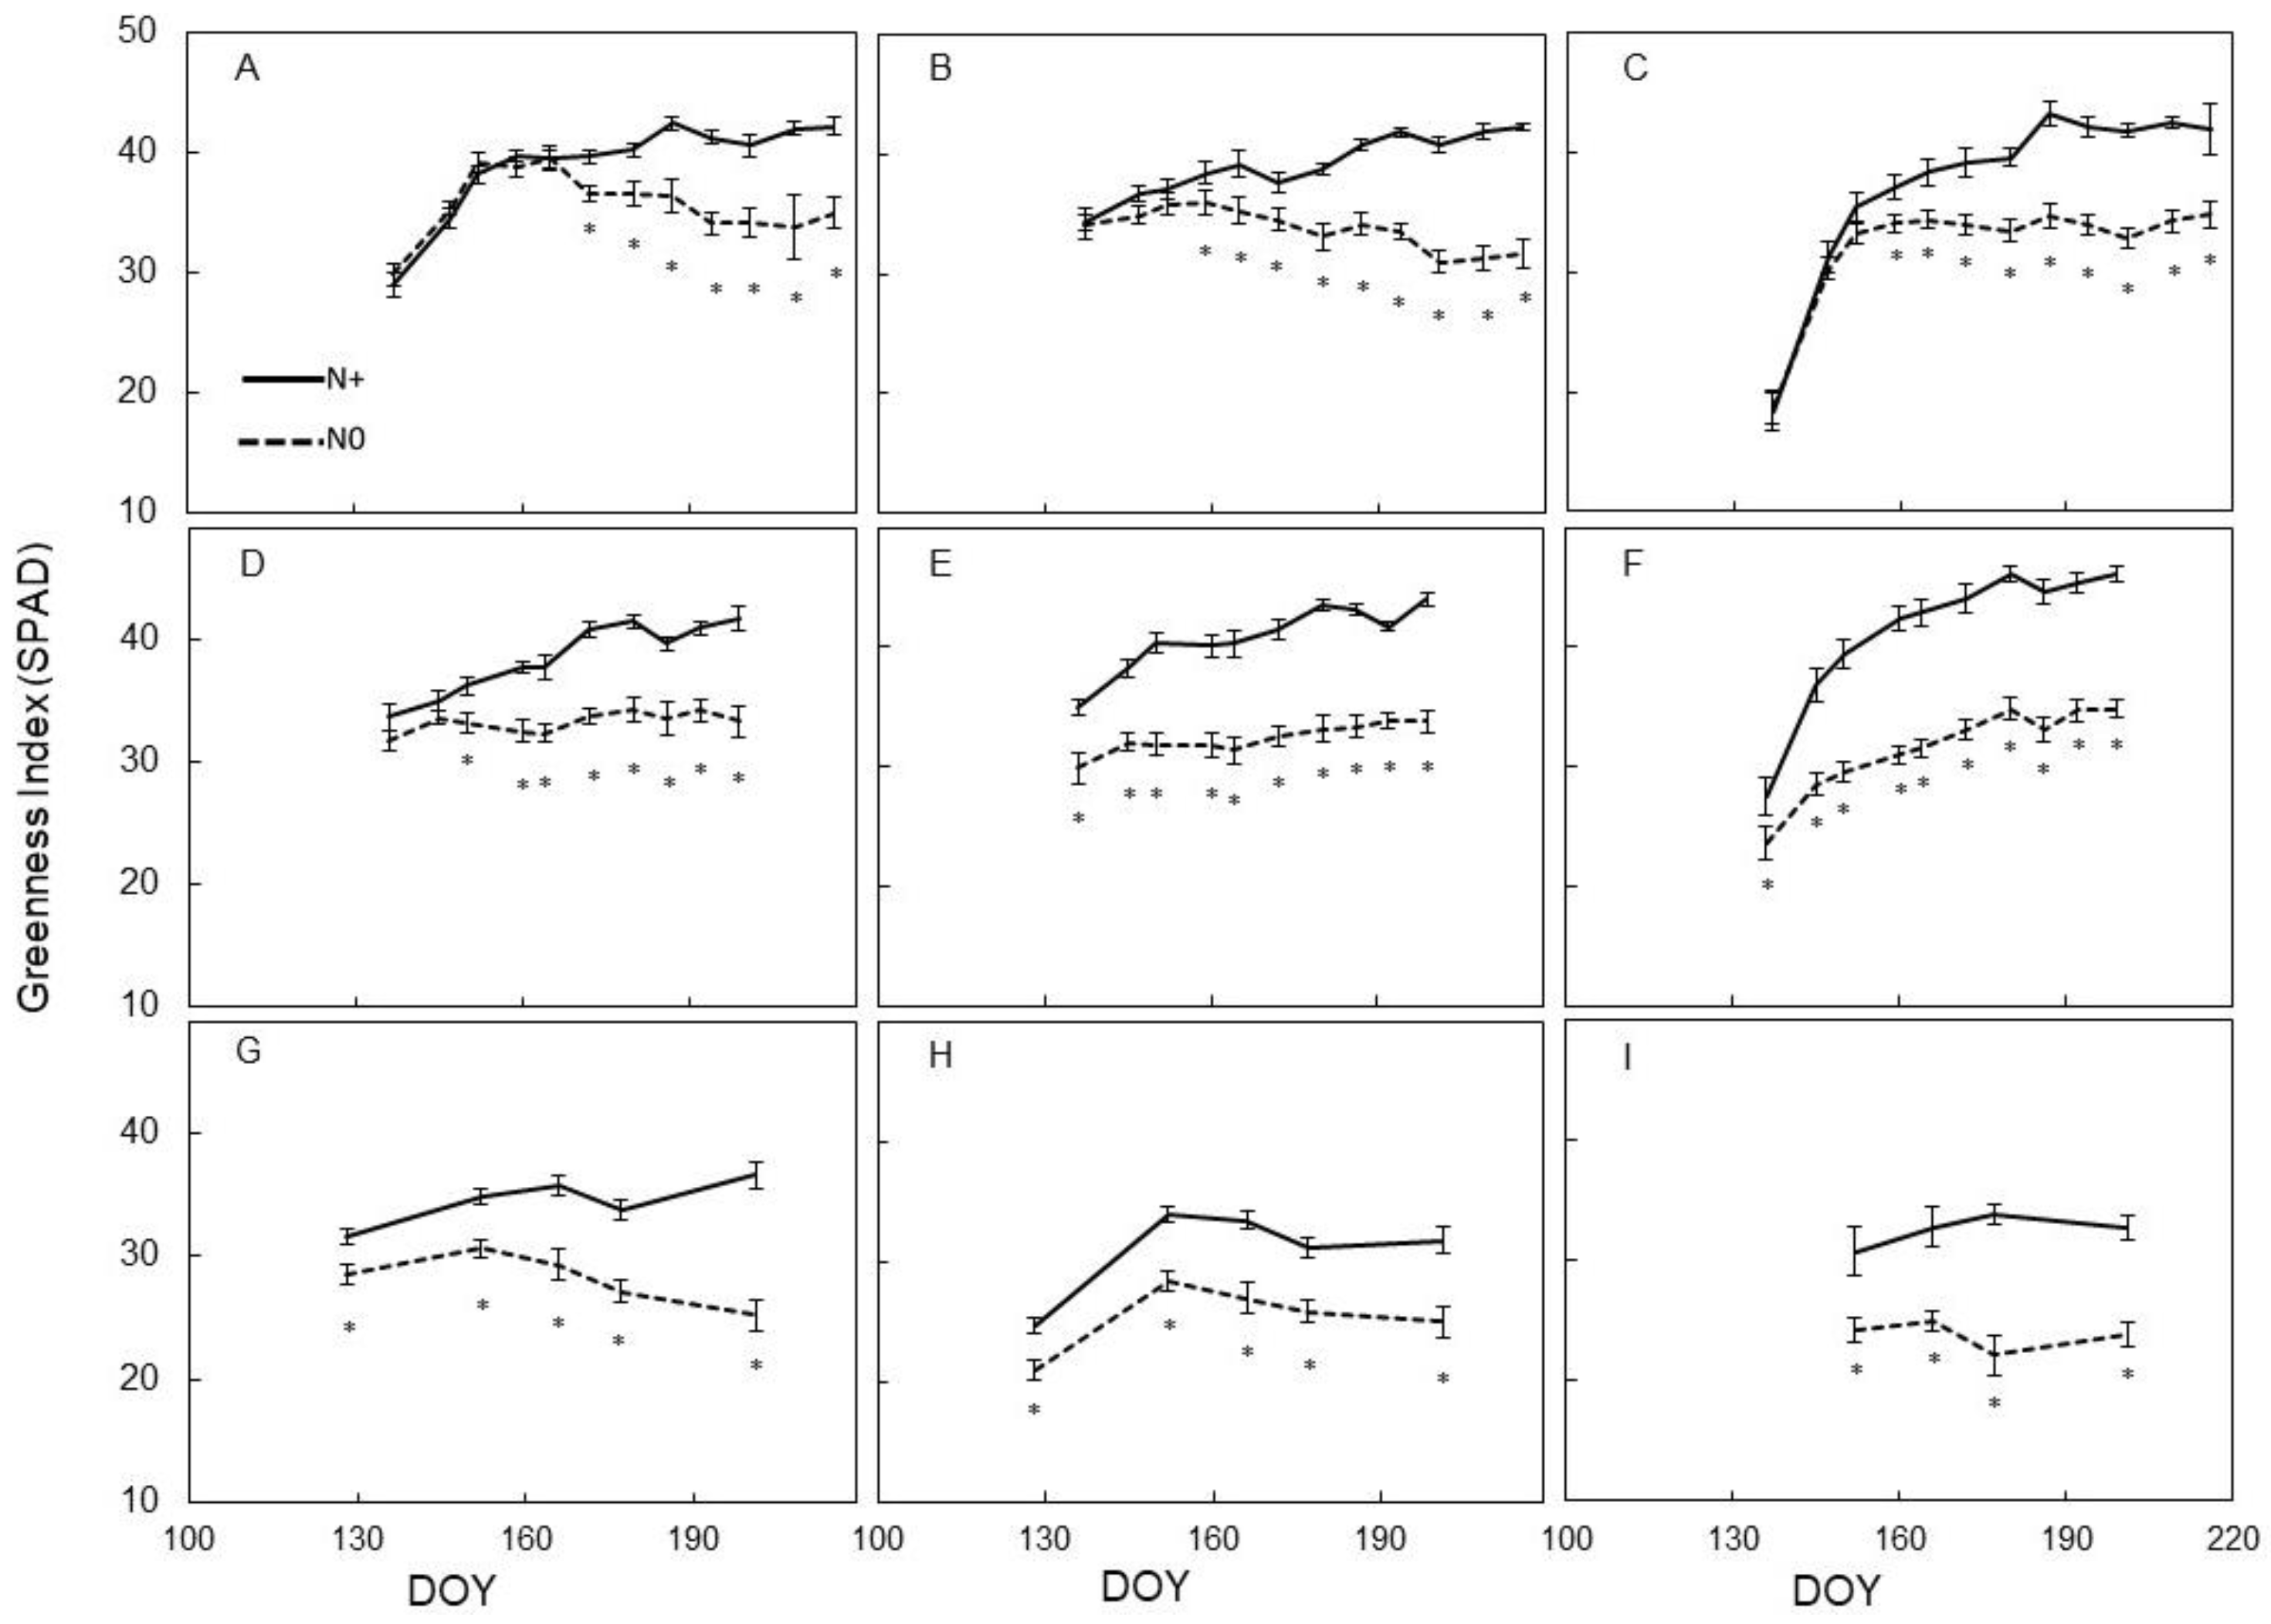
Figure 1. Seasonal variation of the Greenness Index (SPAD) measured on leaves of Barbera vines subjected to different nitrogen fertilization (N+ versus N0), for each trial year (2016–2017–2018). (A): 2016, basal; (B): 2016, median; (C): 2016, apical; (D): 2017, basal; (E): 2017, median; (F): 2017, apical; (G): 2018, basal; (H): 2018, median; (I): 2018, apical. First fertilization: 23 May 2016 (day of the year (DOY)) 144), 28 April 2017 (DOY 118), 7 May 2018 (DOY 127). Within each sampling date, the asterisk indicates significant differences among vigor levels at p < 0.05 according to the Student–Newman–Keuls (SNK) test. Vertical bars indicate standard error (SE).
Agronomy 09 00864 g001
Figure 2. Seasonal variation of the assimilation rate measured on leaves of Barbera vines subjected to different nitrogen fertilization (N+ versus N0), for each trial year (2016–2017–2018). (A): 2016, basal; (B): 2016, median; (C): 2016, apical; (D): 2017, basal; (E): 2017, median; (F): 2017, apical; (G): 2018, basal; (H): 2018, median; (I): 2018, apical. First fertilization: 23 May 2016 (DOY 144), 28 April 2017 (DOY 118), 7 May 2018 (DOY 127). Within each sampling date, the asterisk indicates significant differences among vigor levels at p < 0.05 according to the Student–Newman–Keuls (SNK) test. Vertical bars indicate SE.
Agronomy 09 00864 g002
Figure 3. Seasonal variation of stomatal conductance (gs) measured on leaves of Barbera vines subjected to different nitrogen fertilization (N+ versus N0), for each trial year (2016–2017–2018). (A): 2016, basal; (B): 2016, median; (C): 2016, apical; (D): 2017, basal; (E): 2017, median; (F): 2017, apical; (G): 2018, basal; (H): 2018, median; (I): 2018, apical. First fertilization: 23 May 2016 (DOY 144), 28 April 2017 (DOY 118), 7 May 2018 (DOY 127). Within each sampling date, the asterisk indicates significant differences among vigor levels at p < 0.05 according to the Student–Newman–Keuls (SNK) test. Vertical bars indicate SE.
Agronomy 09 00864 g003
Figure 4. Seasonal variation of the t-value relative to the comparison between the foliar reflectance values of the N+ versus N0 treatments for each wavelength of the electromagnetic spectrum Vis-NIR. (A): 2016, basal; (B): 2016, median; (C): 2016, apical; (D): 2017, basal; (E): 2017, median; (F): 2017, apical; (G): 2018, basal; (H): 2018, median; (I): 2018, apical. First fertilization: 23 May 2016 (DOY 144), 28 April 2017 (DOY 118), 7 May 2018 (DOY 127).
Agronomy 09 00864 g004
Figure 5. Seasonal variation in 2016 of the t-value relative to the comparison between the values of broadband vegetation indices of the N+ versus N0 treatments. In black is presented the standard NDVI, in red are reported indices based on two bands and in blue indices based on three bands. Linear pattern when the t-value is below the threshold of significance, full color when significant. (A): DOY 145-basal; (B): DOY 145-median; (C): DOY 145-apical; (D): DOY 159-basal; (E): DOY 159-median; (F): DOY 159-apical; (G): DOY 172-basal; (H): DOY 172-median; (I): DOY 172-apical; (L): DOY 180-basal; (M): DOY 180-median; (N): DOY 180-apical. Indices highlighted were then correlated with N content (Figure 8).
Agronomy 09 00864 g005
Figure 6. Seasonal variation in 2017 of the t-value relative to the comparison between the values of broadband vegetation indices of the N+ versus N0 treatments. In black is presented the standard NDVI, in red are reported indices based on two bands and in blue indices based on three bands. Linear pattern when the t-value is below the threshold of significance, full color when significant. (A): DOY 129-basal; (B): DOY 129-median; (C): DOY 137-basal; (D): DOY 137-median; (E): DOY 144-basal; (F): DOY 144-median; (G): DOY 144-apical; (H): DOY 177-basal; (I): DOY 177-median; (L): DOY 177-apical. Indices highlighted were then correlated with N content (Figure 8).
Agronomy 09 00864 g006
Figure 7. Seasonal variation in 2018 of the t-value relative to the comparison between the values of broadband vegetation indices of the N+ versus N0 treatments. In black is presented the standard NDVI, in red are reported indices based on two bands and in blue indices based on three bands. Linear pattern when the t-value is below the threshold of significance, full color when significant. (A): DOY 130-basal; (B): DOY 130-median; (C): DOY 138-basal; (D): DOY 138-median; (E): DOY 152-basal; (F): DOY 152-median; (G): DOY 152-apical; (H): DOY 169-basal; (I): DOY 169-median; (L): DOY 169-apical. Indices highlighted were then correlated with N content (Figure 8).
Agronomy 09 00864 g007
Figure 8. Within-year correlation between index reflectance and leaf N concentration and selected 12 broadband vegetation indices evaluated for data pooled over N+ and N0. Index values were DOY 172, 177, and 169 in 2016, 2017, and 2018, respectively. △: 2016-N0; ▲: 2016-N+; □: 2017-N0; ■: 2017-N+; ○: 2018-N0; ●: 2018-N+. Individual regression formulae are provided below. (A): 2016, y = 2.09x − 1.25 (R2 = 0.91); 2017, y = 1.32x − 0.51 (R2 = 0.96); 2018, y = 1.12x + 0.53 (R2 = 0.69). (B): 2016, y = 1.68x − 1.01 (R2 = 0.91); 2017, y = 1.02x − 0.27 (R2 = 0.96); 2018, y = 0.90x + 0.64 (R2 = 0.69). (C): 2016, y = 13.04x − 3.68 (R2 = 0.90); 2017, y = 9.23x − 2.46 (R2 = 0.96); 2018, y = 5.68x − 0.24 (R2 = 0.66). (D): 2016, y = 11.87x − 3.59 (R2 = 0.89); 2017, y = 8.22x − 2.29 (R2 = 0.95); 2018, y = 5.04x − 0.14 (R2 = 0.65). (E): 2016, y = 16.07x − 4.38 (R2 = 0.92); 2017, y = 11.20x − 2.93 (R2 = 0.95); 2018, y = 6.59x − 0.39 (R2 = 0.62). (F): 2016, y = 13.93x − 4.07 (R2 = 0.91); 2017, y = 9.38x − 2.53 (R2 = 0.95); 2018, y = 5.63x − 0.23 (R2 = 0.62). (G): 2016, y = 0.70x − 0.05 (R2 = 0.44); 2017, y = 0.66x − 0.31 (R2 = 0.93); 2018, y = 0.48x + 0.81 (R2 = 0.59). (H): 2016, y = 0.62x − 0.03 (R2 = 0.48); 2017, y = 0.53x − 0.12 (R2 = 0.93); 2018, y = 0.41x + 0.87 (R2 = 0.60). (I): 2016, y = 1.10x − 0.52 (R2 = 0.91); 2017, y = 0.75x − 0.12 (R2 = 0.96); 2018, y = 0.72x + 0.66 (R2 = 0.71). (L): 2016, y = 0.90x − 0.38 (R2 = 0.90); 2017, y = 0.59x + 0.05 (R2 = 0.95); 2018, y = 0.59x + 0.76 (R2 = 0.71). (M): 2016, y = 0.31x − 1.06 (R2 = 0.87); 2017, y = 0.27x − 1.03 (R2 = 0.94); 2018, y = 0.11x + 1.18 (R2 = 0.61). (N): 2016, y = 0.27x − 1.35 (R2 = 0.86); 2017, y = 0.21x − 0.98 (R2 = 0.94); 2018, y = 0.09x + 1.07 (R2 = 0.61).
Agronomy 09 00864 g008
Table 1. Leaf nutrition assessment for main macro and micro-elements performed on leaf blades sampled each at veraison from different node positions along the main stem (basal, median, and apical).
N
(%)
P
(%)
K
(%)
Ca
(%)
Mg
(%)
S
(%)
Na
(ppm)
Fe
(ppm)
Mn
(ppm)
B
(ppm)
Zn
(ppm)
Treatment (T)
N+2.21a0.34b0.642.890.660.217310259b2517b
N01.60b0.59a0.663.120.630.19859476a2720a
Position (P)
Basal1.75c0.42b0.692.69b0.53b0.18b8310779a2522a
Median1.94b0.49a0.643.19a0.68a0.19b8010067ab2717b
Apical2.02a0.49a0.623.12a0.73a0.22a748856b2617b
Year (Y)
20162.00a0.43b0.71a2.60b0.55b0.24a58b126a78a29a19
20171.80c0.47ab0.54b3.29a0.69a0.19b66b72c68ab29a18
20181.92b0.49a0.70a3.12a0.69a0.18b112a97b57b20b18
T****nsnsnsnsnsns*Ns*
P***ns***nsns*Ns*
Y*****************ns
T × P**nsnsnsnsnsnsnsnsNsns
T × Y***nsnsnsnsnsnsnsNsns
P × YNsnsnsnsnsnsnsnsnsNsns
Within column, in case of significant F test, mean separation was performed by Student–Newman–Keuls test. * = p < 0.05, ** p < 0.01, ns = not significant. When significant, partitioning of the T × P (Treatment × Position) and T × Y (Treatment × Year) interactions are shown in Figure S2.
Table 2. Vegetative growth, yield components, and Ravaz Index (vine yield to-total pruning weight) recorded over 2016, 2017, and 2018 for nitrogen (N)+ and N0 treatment levels.
Main Pruning Weight
(g/vine)
Lateral Pruning Weight
(g/vine)
Total Pruning Weight
(g/vine)
Yield
(g/vite)
Cluster Weight
(g)
Berry Weight
(g)
Cluster Compactness
(g/cm)
Shot Berries
(%)
Live Green Ovaries
(%)
Ravaz Index
(kg/kg)
Treatment (T)
N+200.4a66.2a266.67a651a155a2.08a19. 10 a8.44b0.99a2.80a
N0169.7b26.8b196.50b291b72b1.64b9.76b22.72a0.27b1.55b
Year (Y)
2016187.1ab53.7a240.87a529b137a2.13a17.59a26.22a1.24a2.19b
2017166.2b39.7b206.00b706a139a1.99a17.96a4.58c0.48b3.54a
2018201.8a46.1ab247.87a178c65b1.46b7.73b15.94b0.15b0.80c
T*******************
Y*****************
T × Y********nsNsnsNs**
Within column, in case of significant F test, mean separation was performed by Student–Newman–Keuls test. * = p < 0.05, ** p < 0.01, ns = not significant. When significant, partitioning of the T × Y (Treatment × Year) interaction is shown in Figure S3.
Table 3. Absolute and relative growth of the three main berry organs/skin, flesh, and seeds) recorded over 2016, 2017, and 2018 for N+ and N0 treatment levels.
Skin Weight
(g/berry)
Flesh Weight
(g/berry)
Total Seed Weight
(g/berry)
Mean Seed Weight
(mg)
Seed Number
(n/berry)
Skin-to-berry Ratio
(%)
Seed-to-berry Ratio
(%)
Flesh-to-berry Ratio
(%)
Skin-to-flesh Ratio
(%)
Treatment (T)
N+0.1521.960a0.092a36.79a2.49a7.39b4.22a88.39a8.48b
N00.1411.515b0.066b32.77b2.00b8.97a3.83b87.28b10.42a
Year (Y)
20160.138b 2.012a0.080b32.52b2.54a 6.38c3.52b90.09a7.12b
20170.156a 1.703b0.090a38.18a2.29ab8.48b4.31a87.22b9.85a
20180.143b 1.375c0.066b33.64b1.92b9.68a4.25a86.19b11.39a
Tns**************
Y*****************
T × Y******Ns**nsnsnsns
Within column, in case of significant F test, mean separation was performed by Student–Newman–Keulstest. * = p < 0.05, ** p < 0.01, ns = not significant. When significant, partitioning of the T × Y (Treatment × Year) interaction is shown in Figure S4.
Table 4. Grape composition determined at harvest on musts obtained from vines that, over three years (2016, 2017, and 2018) were subject to N supply (N+) or received no N supply (N0).
Total Soluble Solids
(Brix)
pHTitratable Acidity
(g/L)
Tartrate
(g/L)
Malate
(g/L)
Total Anthocyanins
(mg/g)
Total Phenols
(mg/g)
Treatment (T)
N+23.6b3.4211.82a7.57b5.89a0.584b1.865b
N025.8a3.397.70b8.58a2.65b1.047a2.939a
Year (Y)
201625.13.368.15c8.57a3.65c1.083a2.750a
201723.73.439.55b9.27a4.35b0.667b1.703b
201825.23.4211.58a6.40b4.81a0.697b2.754a
T**ns*********
Y*ns**********
T × Y**nsNs******ns
Within column, in case of significant F test, mean separation was performed by Student–Newman–Keulstest. * = p < 0.05, ** p < 0.01, ns = not significant. When significant, partitioning of the T × Y (Treatment × Year) interaction is shown in Figure S5.