Article

Integrating Phenological, Aerobiological and Weather Data to Study the Local and Regional Flowering Dynamics of Four Grapevine Cultivars

by
María Fernández-González
1,2,
Helena Ribeiro
1,3,
Alba Piña-Rey
2,
Ilda Abreu
1,4 and
F. Javier Rodríguez-Rajo
2,*
1
Earth Sciences Institute (ICT), Pole of the Faculty of Sciences, University of Porto, 4169-007 Porto, Portugal
2
CITACA, Agri-Food Research and Transfer Cluster, University of Vigo, 32002 Ourense, Spain
3
Department of Geosciences, Environment and Spatial Plannings of the Faculty of Sciences, University of Porto, 4169-007 Porto, Portugal
4
Department of Biology of the Faculty of Sciences, University of Porto, 4169-007 Porto, Portugal
*
Author to whom correspondence should be addressed.
Agronomy 2020, 10(2), 185; https://doi.org/10.3390/agronomy10020185
Submission received: 19 December 2019 / Revised: 21 January 2020 / Accepted: 25 January 2020 / Published: 28 January 2020
(This article belongs to the Special Issue Recent Advances in Viticulture and Breeding of Grapevine)

Abstract

:
Phenological, aerobiological, and weather data are useful tools to study local and regional flowering dynamics in crops with economic importance. The present study focuses on four autochthonous grapevine cultivars, namely, ‘Treixadura’, ‘Godello’, ‘Loureira’, and ‘Albariño’ (Vitis vinifera L.), which belong to the Designation of Origin Ribeiro area (located in northwestern Spain) from 2015–2019. The aims of the work were to (1) compare the airborne pollen concentration in the vineyard collected by two different traps, (2) analyze the influence of the main meteorological variables on cultivar phenology and pollen concentration, and (3) test the contribution of the air masses on pollen concentrations in the vineyard. Phenological development has been assessed twice weekly, according to the Biologische Bundesanstalt, Bundessortenamt und Chemische Industrie (BBCH) scale. Airborne pollen concentrations were monitored by using two traps during stage 6 (flowering), namely, a Hirst volumetric sampler and a Cour passive trap. The bioclimatic conditions affected the duration of flowering, ranging from 11 and 24 days. The highest seasonal pollen integral (SPIn) was registered in 2016 for the Hirst sampler, with 302 pollen, and in 2019 for the Cour trap, with 1,797,765 pollen/m2/day. The main variables affecting pollen concentrations were average temperature during the main pollen season, as well as, temperatures and dew points during the pre-peak period. The relationship between pollen data registered by both traps and the obtained harvest indicate that the Hirst trap may be more suitable for predicting a local production and that the Cour sampler is more appropriate for forecasting regional productions.

1. Introduction

Viticulture is one of the most important worldwide agricultural practices, with a relevant economic importance in areas where the climate meet requirements for the production of high-quality wines [1]. Grapevine phenological development is modified by abiotic conditions, including the atmospheric temperature, soil water availability, and photoperiod [1,2], and, in addition, genotype-specific characteristics [2]. The weather condition is the main variable affecting grape production for winemaking [3]. Factors such as temperature or rainfall affect the phenological development of grapevines [2,4]. Premium grape and wine production are restricted to a small geographical area worldwide. The current effects of climate change have been promoting earlier inceptions of the phenological stages bud burst, flowering and ripening of berry in major grape growing regions [2,4,5,6].
Knowledge of the phenological timing succession of Vitis vinifera L. is a valuable tool for the crop management optimization [3,7]. Also, it plays an important role for the understanding of the adaptive capacity of the different Vitis vinifera L. cultivars to variations in environmental conditions, which is useful in determining the potential of a given area in establishing the most suitable cultivar in that area [8]. Finally, it represents a key factor to rationalize phytosanitary treatments, which only should be applied when a real infection risk exists due to a propitious phenological stage for a given plague [3,7].
One of the most important phenological stages is flowering. Vitis vinifera L. pollination is performed by wind, although self-pollination may also occur depending on the cultivar in question [9,10]. Since the 1990s several research studies have used the airborne pollen content in plots as a predictor variable for the final vine [11,12,13] or olive [14,15,16,17] harvest prediction models.
For this purpose, different pollen trapping methodologies have been considered. Passive traps were the former used for the determination of the total pollen concentration [15,18] or for spore sampling in the atmosphere of vineyards [19]. During recent years, works using volumetric traps have frequently been conducted [20,21,22,23,24]. The use of these two different methodologies provide accurate data depending on the characteristics of the sampling areas [18,25].
This work seeks to study the flowering stage of four most important autochthonous vine cultivars of the Designation of Origin Ribeiro area and the airborne Vitis vinifera L. pollen concentration in the vineyard in order to achieve the following objectives: (1) To compare the airborne pollen concentration in the vineyard, as collected by two different sampling devices (volumetric and passive sampling), (2) to analyze the influence of the main meteorological variables on plant phenology and pollen concentration, and (3) to test the contribution of the air masses on pollen concentrations in the vineyard area.

2. Material and Methods

The study was carried out in a vineyard located in Cenlle (Ourense) in northwestern Spain (42°18′ N, 8°6′ W), belonging to the Designation of Origin (DO) Ribeiro area (Figure 1). According to the Multicriteria Climatic Classification System (MCC), most grape growing areas in the region are irrigated via the Miño river, which is defined as temperate, warm, and sub-humid, with very cold nights [26]. The study area has an Oceanic-Mediterranean transition ecoclimate. The soils here have a granitic origin with a significant presence of stones and gravel, and a sandy texture, with an average depth between 70–100 cm [27]. The vineyard plot consisted of 20 rows of grapevines trained on a vertical shoot positioned trellis system with an undivided canopy. Vines were planted at a row spacing of 2 m and a vine spacing of 1 m. The different cultivars are spread in consecutive plots, separated by a distance of 10 m.
The study of airborne pollen was carried out continuously from 2015–2019 using two pollen traps. Both samplers were located in the central part of the vineyard, 3 m above ground level, such that pollen trapping would not be impeded by vine growth. The first collector was a VPPS-2000 volumetric pollen and spore trap (Lanzoni s.r.l., Bologna, Italy) [28] with the potential for daily and hourly data collection. During the Vitis vinifera L. flowering stage, the pollen identification and counting was performed using a NIKON OPTIPHOT II microscope equipped with 40 × 0.95 lens, following the model proposed by the Spanish Aerobiological Network (R.E.A.) [29]. Pollen data were expressed as pollen grains for the annual pollen integral or pollen per cubic meter of air when referring to daily mean values [30]. The second collector was a passive Cour sampler (Cour, Montpellier, France) [31] where pollen grains are trapped on gauze filters (400 cm2) fixed vertically on a wind vane, which continually orientates the filters according to the wind direction [31]. During stage 6 (flowering), the filters were exposed for 3 or 4 days. Airborne pollen flow (APF), obtained by the pollen captured in each filter exposed for 3 or 4 days, was expressed in the number of average daily pollen grains transported per square meter of filter (pollen/m2). After exposure, the pollen grains were removed from the filters using chemical treatments including the destruction of the gauze, acetolysis, and the addition of glycerol for sediment quantification. The pollen identification and counting were carried out independently of the pollen grain concentration, with ten regular traverse rows, by using a Leica optical microscope equipped with 63 × 0.75 lens [13].
The main pollen season (MPS) was defined using a pollen emission model [12,32] which fits a nonlinear logistic regression model to the values of the accumulated sum of daily airborne pollen concentration sampled along the year (Cunha et al. 2003). The Levenberg–Marquardt method was used to fit the model by applying the “regression non-linear” function of the software IBM SPSS Statistics 23.0. A one-sided t-test was used at the 10% mark to denote the MPS begin and end dates.
Phenological development was assessed throughout the growing season, from 2015–2019. The sampling period was initiated during the first ten days of May and finalized during the second half of June. During the studied years, twice weekly visits to the sampling area were carried out during stage 6. The phenological study was conducted on 20 selected plants of each main autochthonous cultivars, namely, ‘Treixadura’, ‘Godello’, ‘Loureira’ and ‘Albariño’. The Biologische Bundesanstalt, Bundessortenamt, und Chemische Industrie (BBCH) phenological scale, which was developed by [33] and is used as the standardized scale for phenological grapevine observations [34], was used for monitoring the flowering principal stage (stage 6) and it´s phenophases, namely, 61 (beginning of flowering: 10% of flower cap fallen), 65 (full flowering: 50% of flower cap fallen), and 69 (end of flowering). For the elaboration of the grapevine phenological calendar, the start date of the phenological stage was considered when the 50% of the studied vines had reached each phenophase. The mean date of each stage was calculated as the average for the 20 plants considered.
The data of the total annual harvest in the whole D.O. Ribeiro area were delivered by the D.O. Ribeiro Regulatory Council, and the data of the total harvest in the studied plots were provided by the company owner of the vineyards, “Viña Costeira s.r.l.”. The vines were harvested during all of the study years when the fruits reached the accurate ripeness level of 20 °Brix, with the exception of the ‘Albariño’ cultivar with and optimal ripeness level of 22 °Brix.
Weather data were obtained from a Hobo H8 Pro Micro Station data logger, located in the vineyard. The monitored parameters were the maximum, average, and minimum temperatures and dew point. Rainfall and wind speed data were recorded using a Davids weather station, also located in the vineyard.
In order to analyze the association degree between pollen concentrations and meteorological data, a Spearman correlation test has been applied (significance was calculated for p ≤ 0.01 and p ≤ 0.05). The software IBM SPSS Statistics 23.0 was used for statistical analysis here.
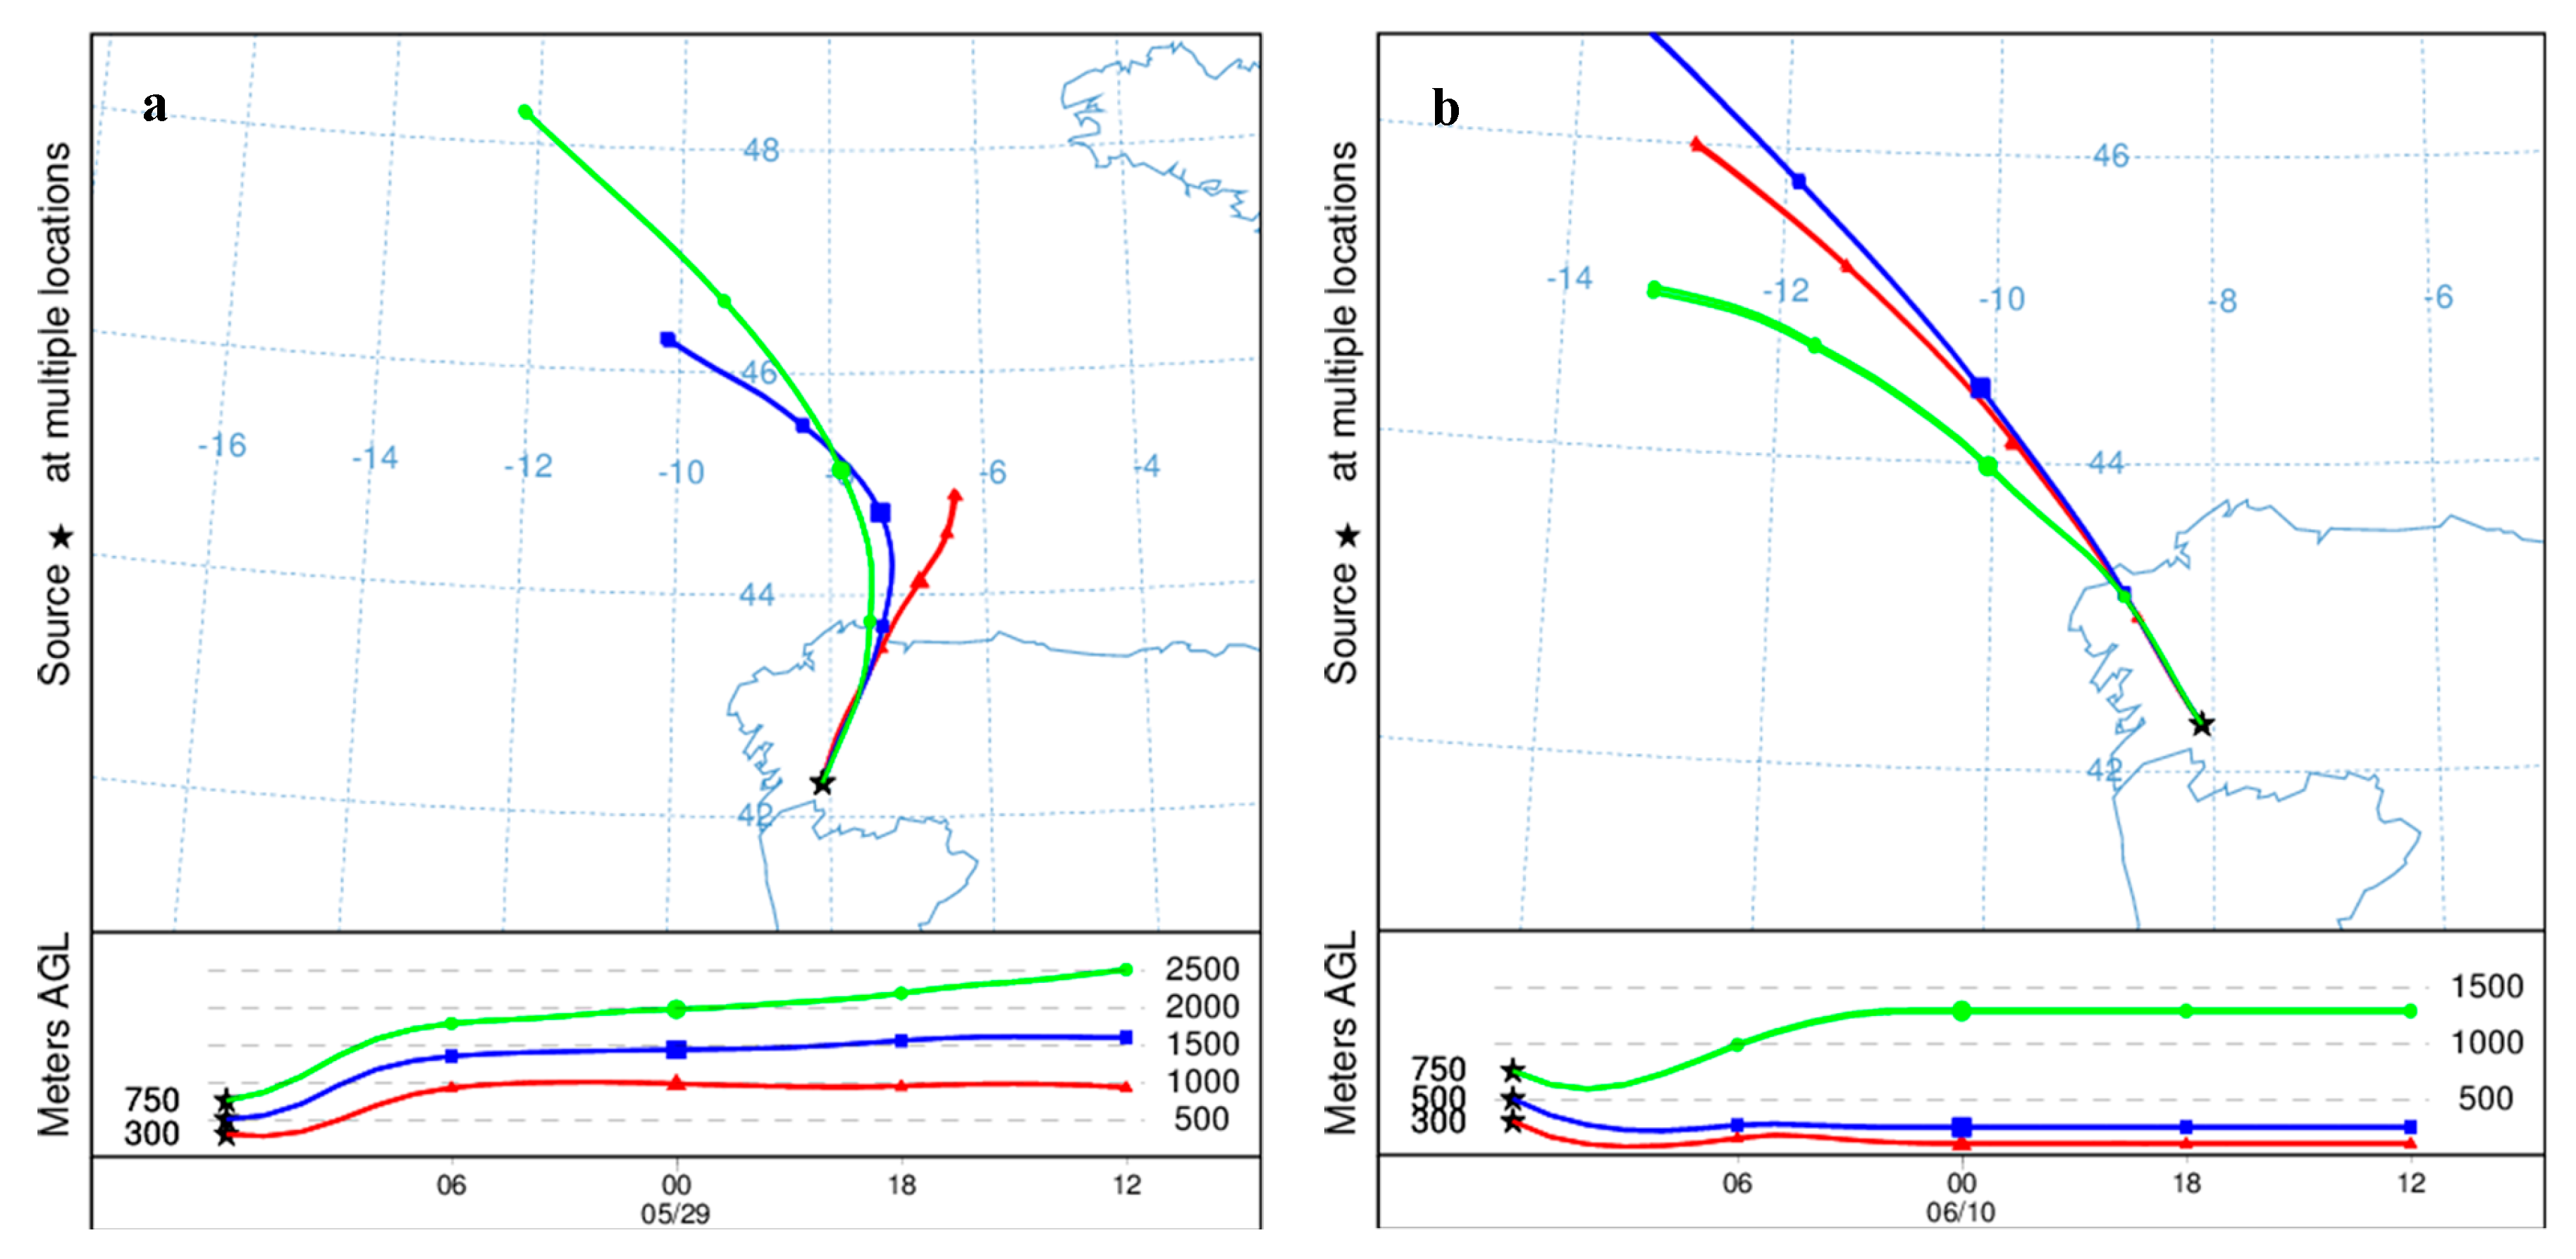
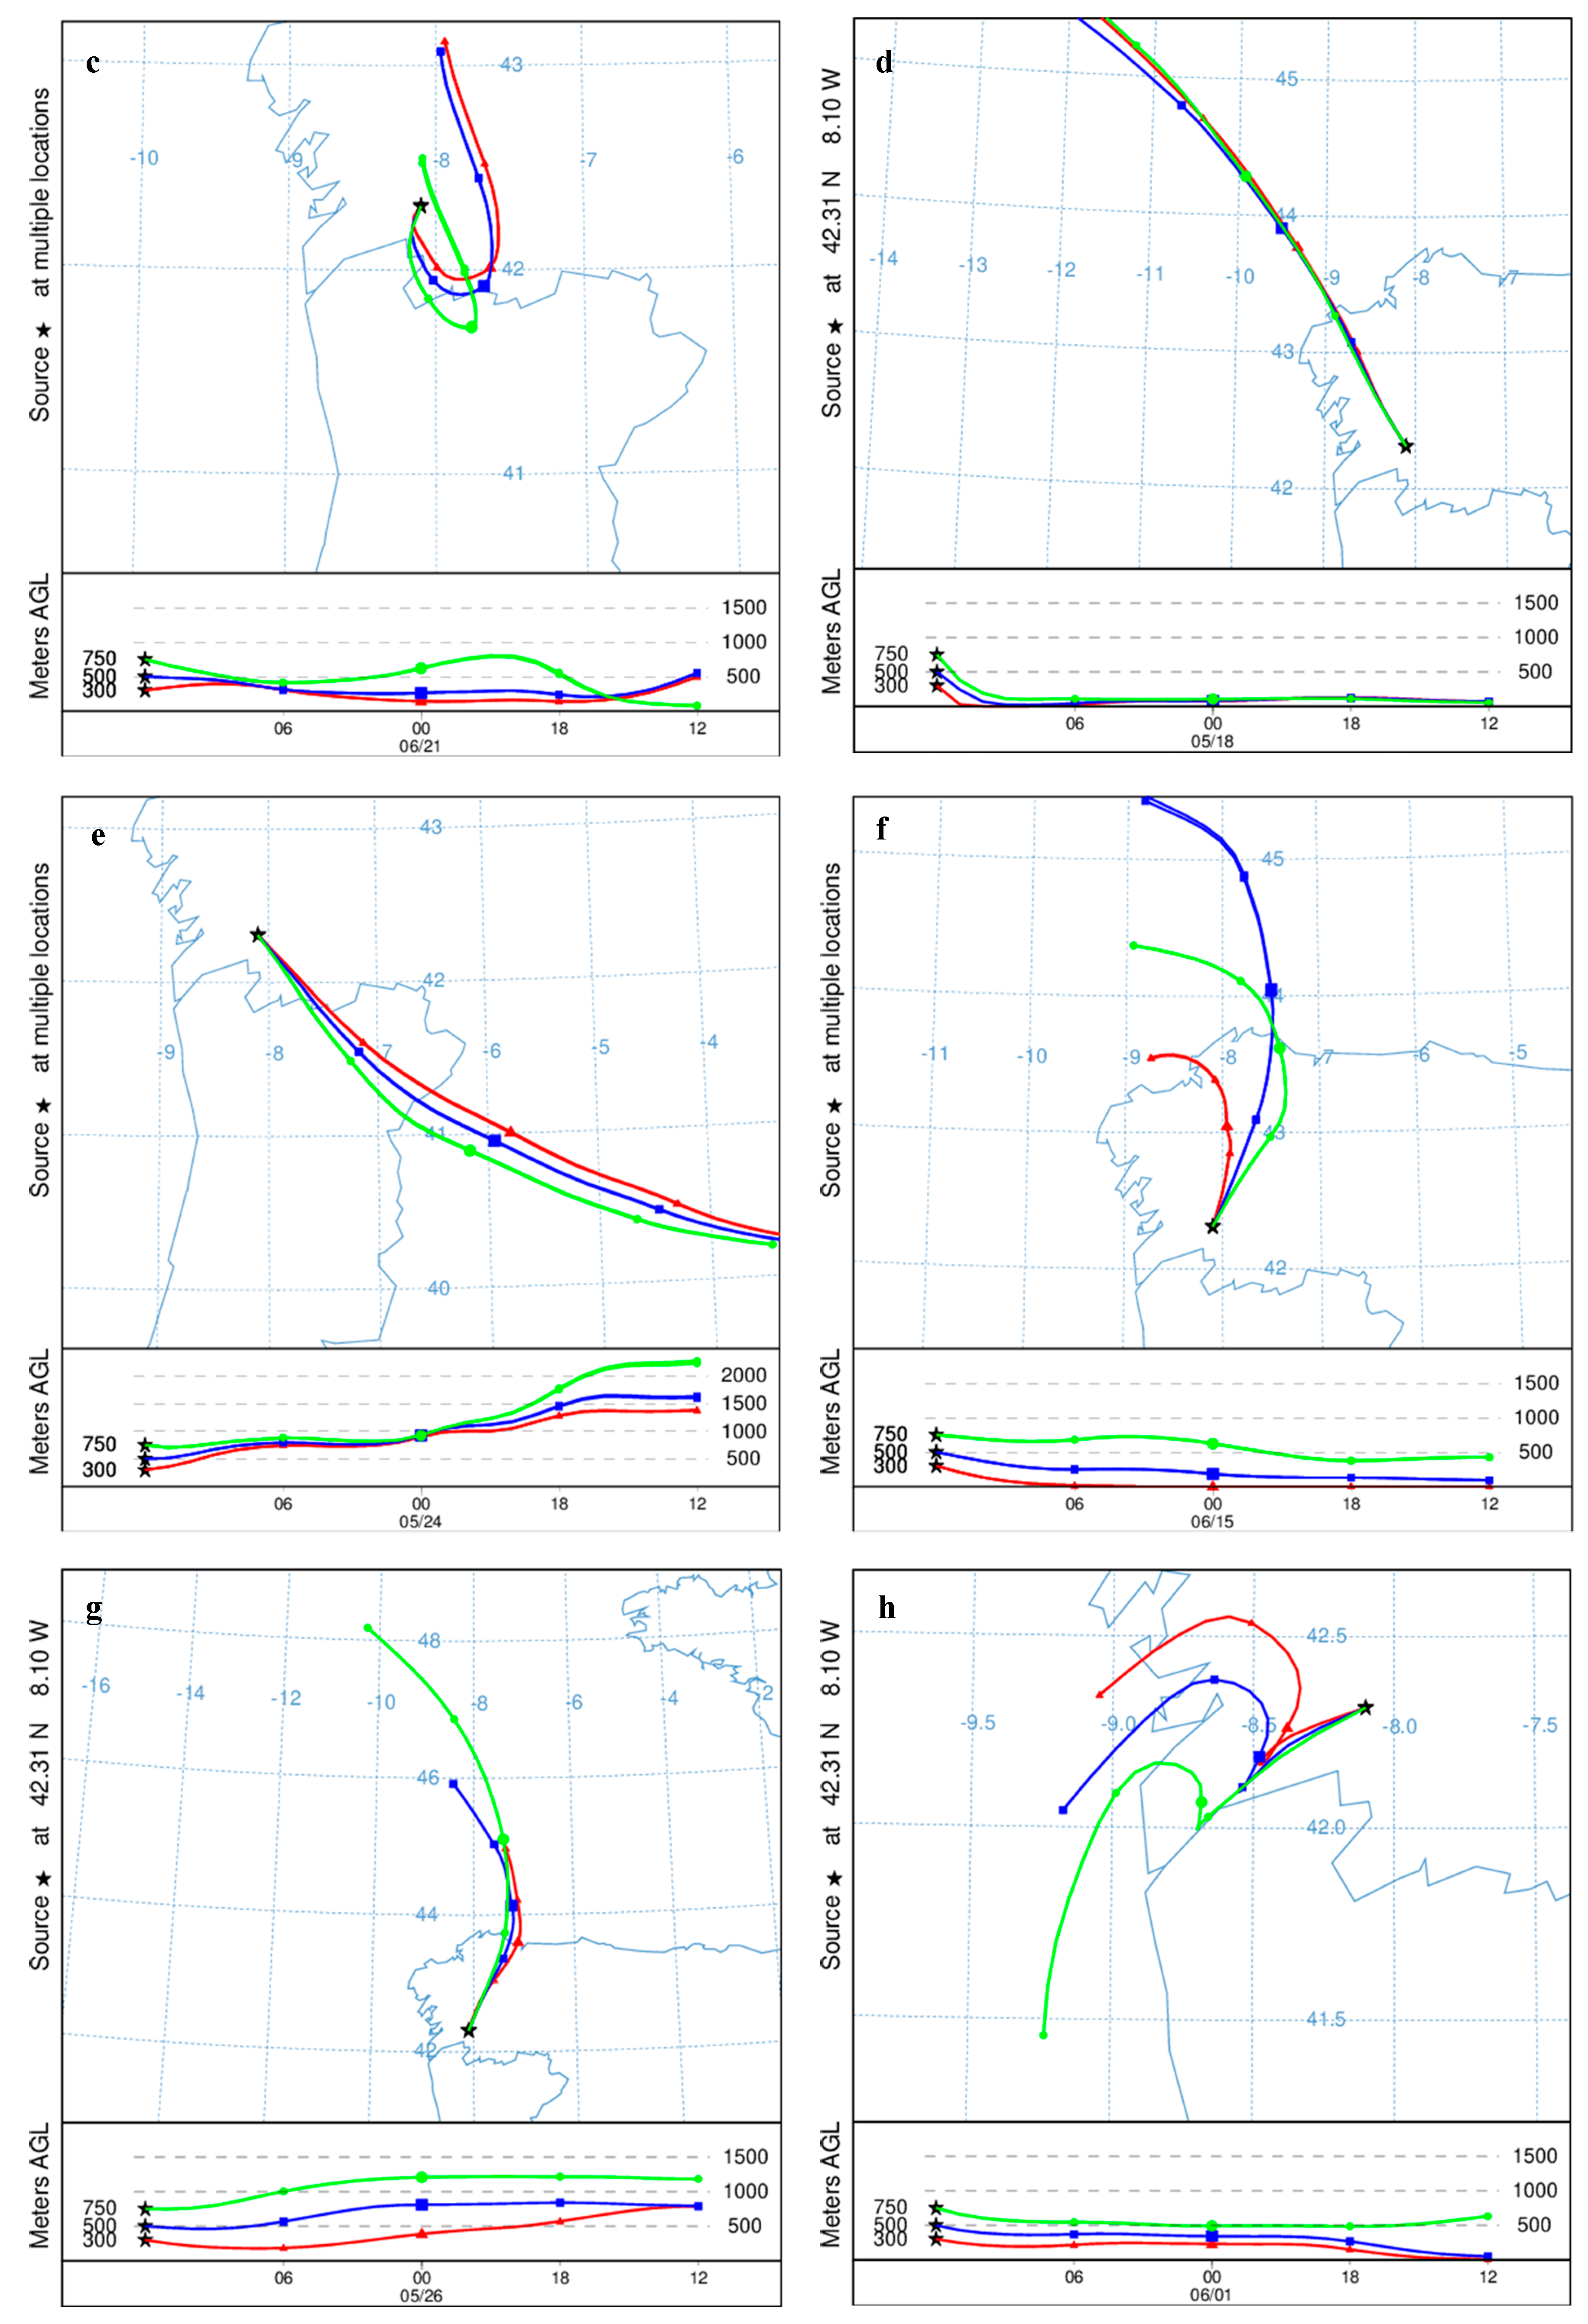
Back trajectories were calculated for the airborne pollen peak day concentrations during stage 6. Eight episodes were studied, namely, 29 May 2015, 10 and 21 June 2016, 18 and 24 May 2017, 15 June 2018, 26 May and 1 June 2019, using the Hybrid Single-Particle Lagrangian Integrated Trajectory (HYSPLIT) developed by the National Oceanic and Atmospheric Administration (NOAA). These models allowed us to determine the hourly 24 h back trajectories in 3D (latitude, longitude, and elevation) using the global data analysis system (GDAS) meteorological files. Following the model of [35], the isentropic back-trajectories of air masses arriving in Cenlle at 12:00 UTC were calculated during the peak pollen concentration episodes. The backward trajectories were calculated for different heights from the earth surface, namely, 300, 500 and 750m [20,36,37,38,39,40].

3. Results

In the D.O. Ribeiro area, weather variables such as the maximum, minimum, and average temperatures prompted an annual mean duration of stage 6 (flowering) from 10–16 days during the study years (Table 1). Stage 6 took place during the first ten days of May until the second half of June. The average duration was 13 days for ‘Treixadura’ and ‘Loureira’, 12 days for ‘Godello’ and 14 days for ‘Albariño’. The phenophase that showed a higher duration was phenophase 61 for ‘Treixadura’ and ‘Albariño’, and phenophases 61 and 69 for the ‘Loureira’ cultivar. Finally, the three studied phenophases had the same average duration for the ‘Godello’ cultivar. The cultivar with an earlier flowering period was ‘Albariño’ (Table 1, Figure 2).
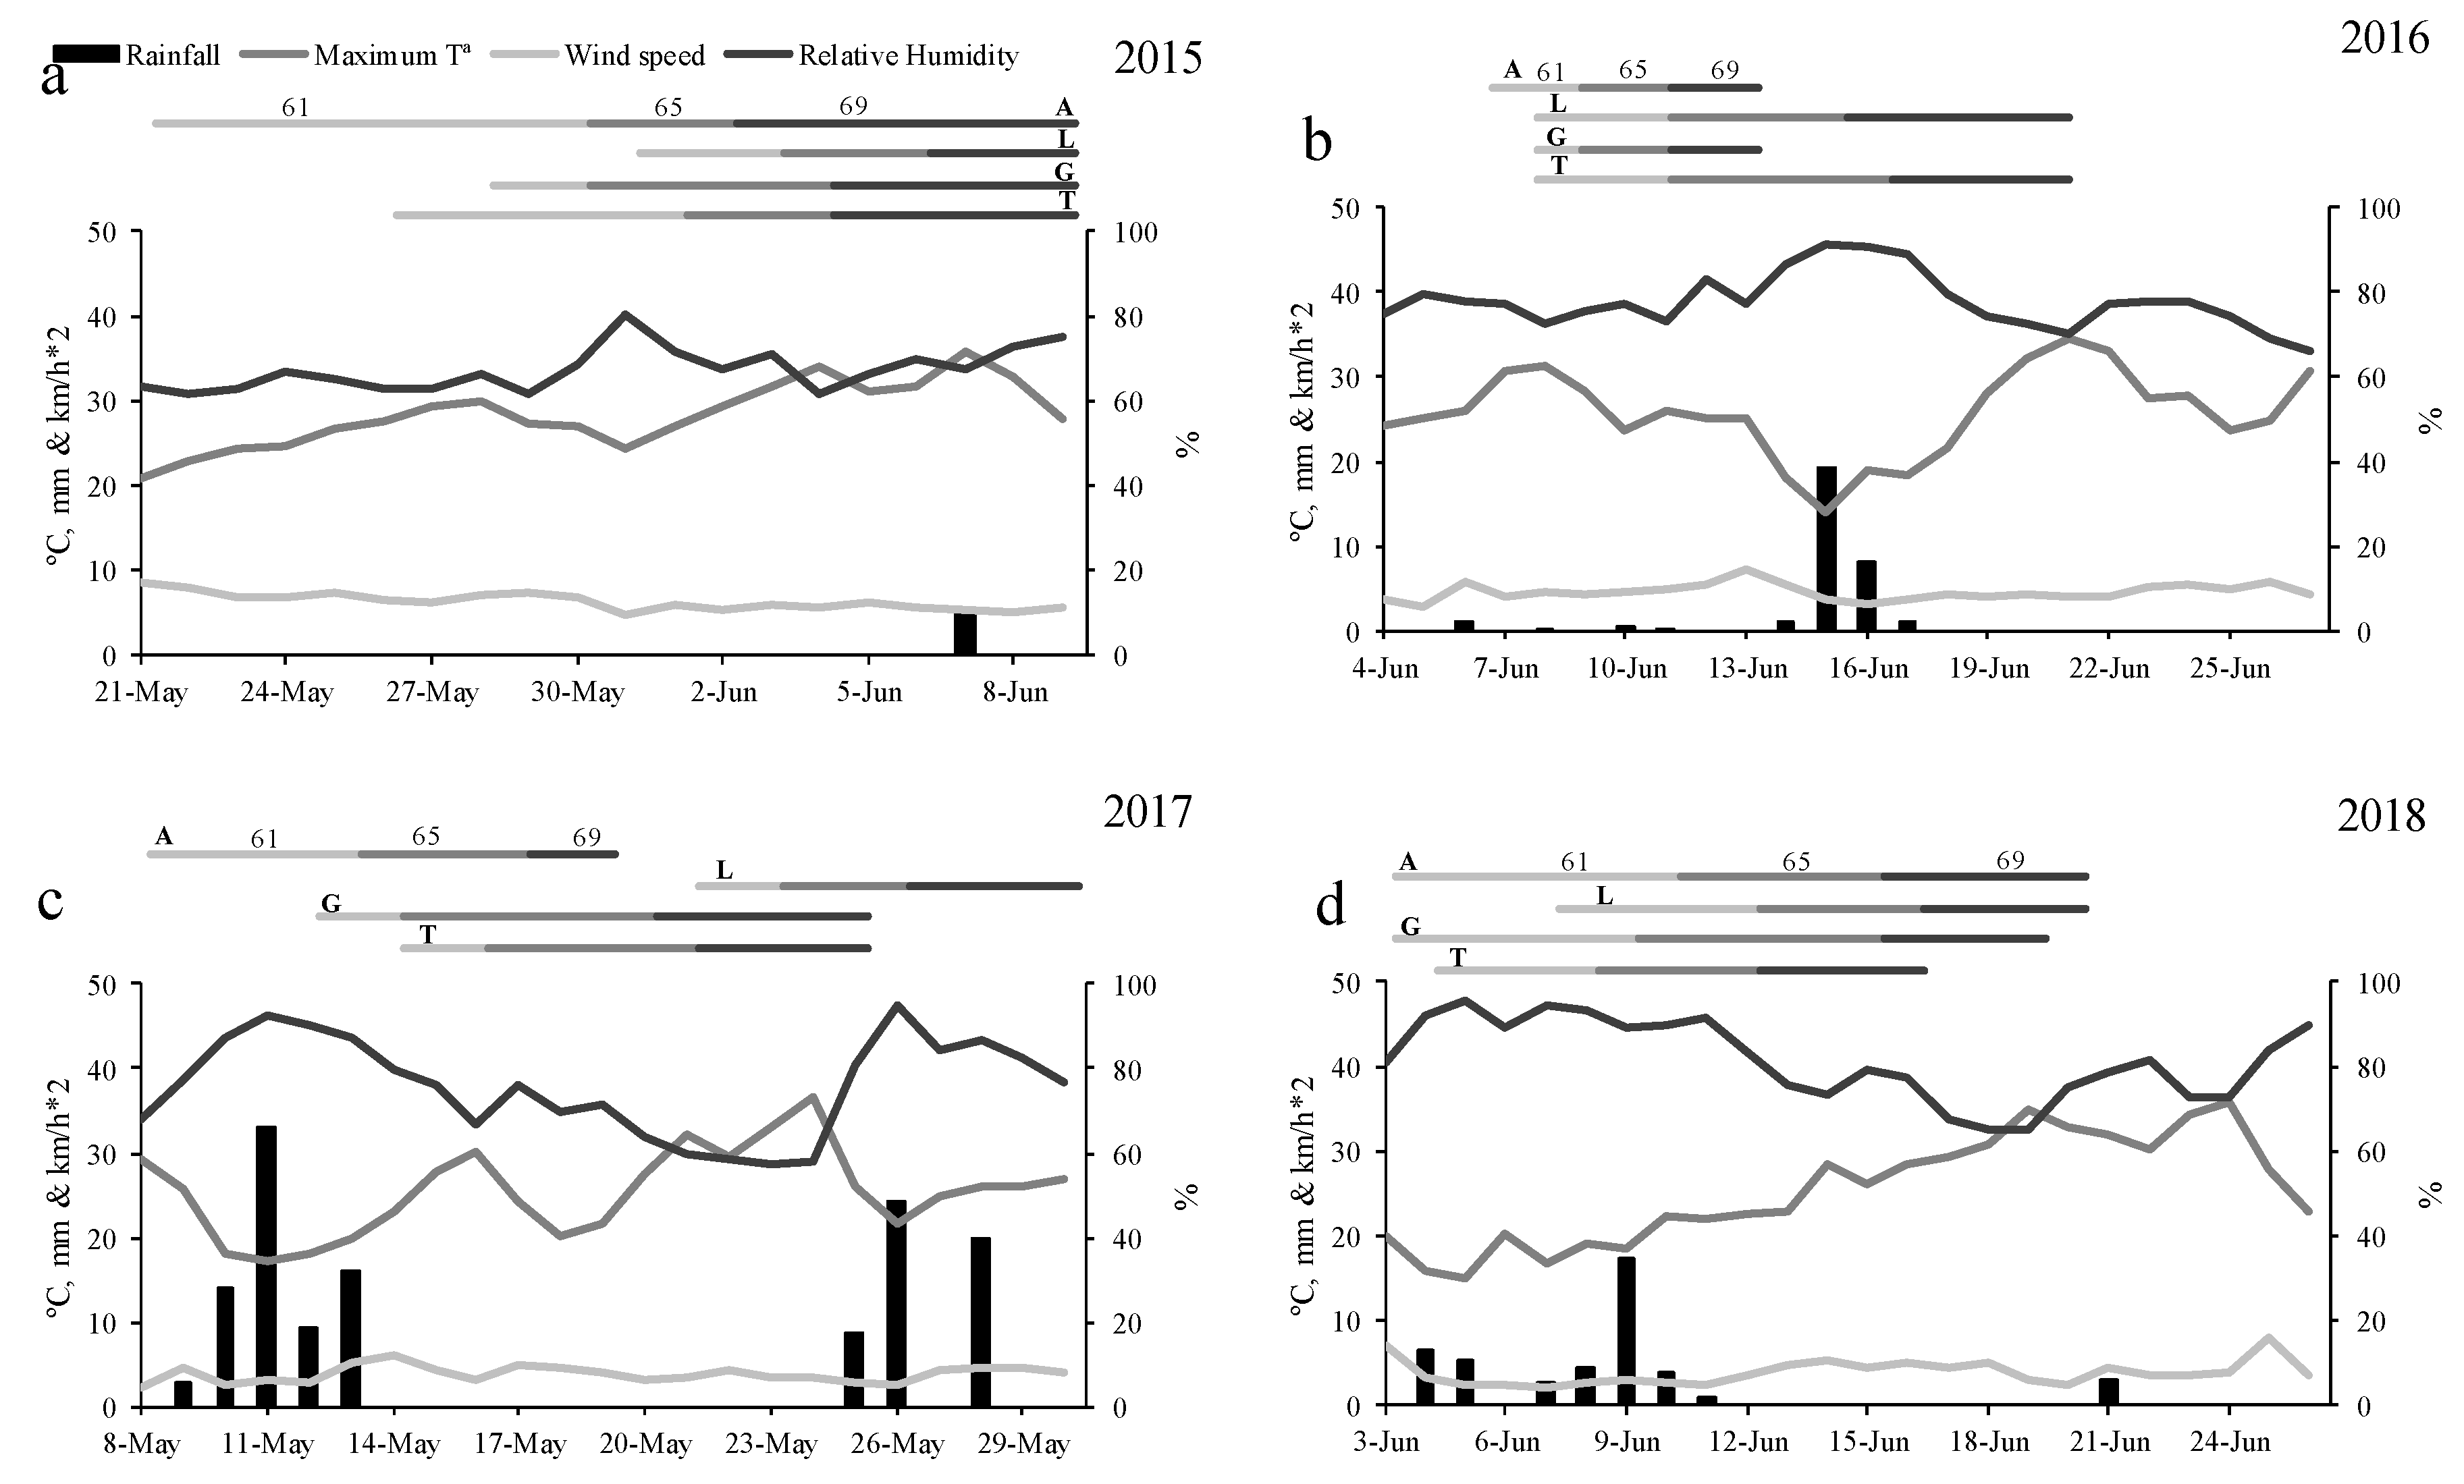
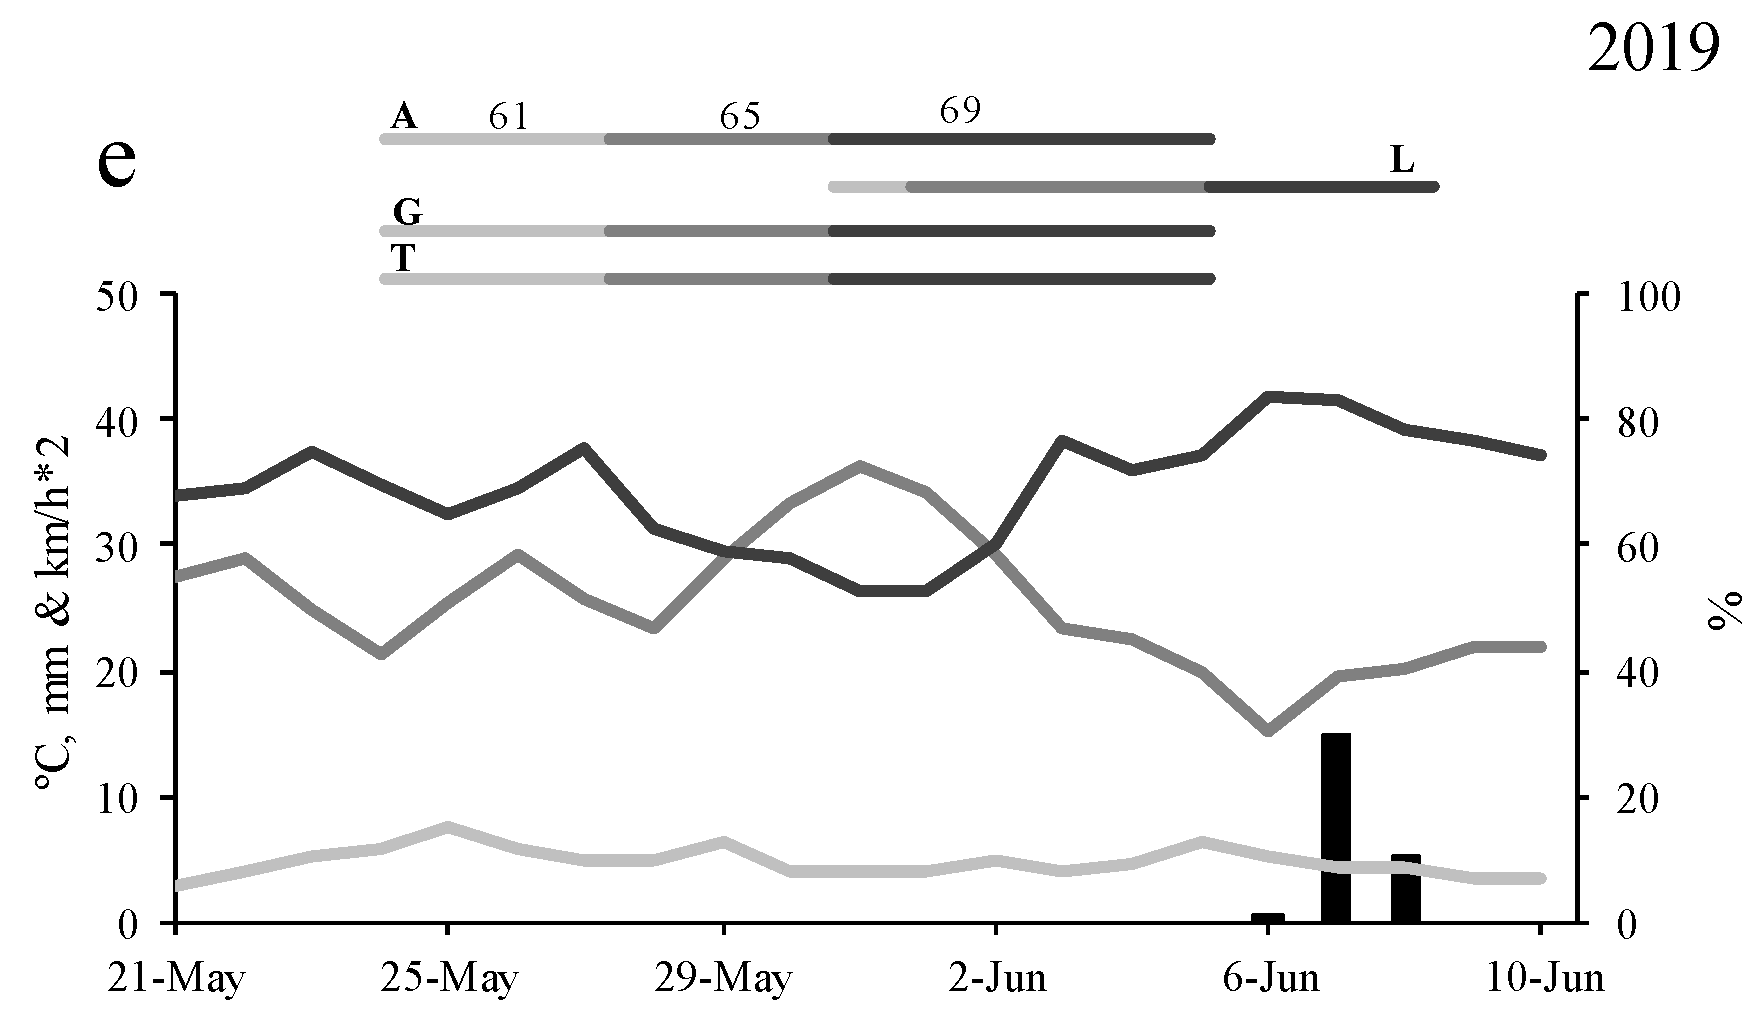
Regarding the weather variables, the year with a higher maximum temperature was 2017, with 36.50 °C registered on the 24 May, coinciding with phase 69 for the ‘Treixadura’ and ‘Godello’ cultivars and phase 65 for the ‘Loureira’ cultivar. The highest relative humidity was found on June 5 2018, with 95.3%, whereas a second peak was detected on 26 May 2017, with 94.8%, where both peaks coincide with abundant rainfall. The year with the higher amount of rainfall was 2017 (128.2 mm), followed by 2018 (44 mm). The peak of rainfall during the studied period was observed in 2017, with 33.2 mm (11 May 2017) during with the phase 61 of the ‘Albariño’ cultivar (Figure 2).
The Vitis vinifera L. pollen concentration during the study years, recorded by means of the volumetric Hirst pollen trap and the passive Cour pollen trap, the maximum temperature, and rainfall variation, and the length of the flowering phenological stage are each shown in Figure 3. The presence of Vitis vinifera L. airborne pollen was mainly registered during the last few days of stage 5 (inflorescence emergence) (data not shown) and the whole of stage 6 (Figure 3). The main pollen season (MPS) was defined using data from the Hirst and Cour traps. By means of the Hirst volumetric sampler, the MPS started on 24, 15 and 26 May in 2015, 2017 and 2019, respectively, whereas it started on June 4 and 9 in 2016 and 2018, respectively. The MPS ended on May 29 in 2017 and on June 3, 6, 21 and 27 in 2015, 2019, 2018, and 2016 respectively. The year that showed a higher SPIn was 2016 with 302 pollen, and the lower was registered in 2015, with 89 pollen (Table 2). The results obtained with the Cour sampler showed that the MPS started on May 23, 11, and 21 in 2015, 2017, and 2019 respectively whereas it started on June 3 and 5 in 2016 and 2018, respectively. The MPS ended on the 21 and 31 of May in 2017 and 2015, respectively, whereas it ended on June 3, 14, and 18 in 2019, 2016, and 2018, respectively. The year that reached the highest SPIn was 2019 (1,797,765 pollen) and the lowest was registered in 2017, with 1,260,434 pollen (Table 2). The peak daily concentration registered by the two samplers matched with the flowering stage in most study cultivars, and it was observed in the same day during the years of 2015 and 2018. In the cases of 2016, 2017 and 2019 the airborne peak Vitis vinifera L. pollen concentrations did not coincide with both samplers detecting the pollen peak by the Cour sampler before the Hirst sampler peak. In 2016, the pollen peak detected by the Hirst sampler occurred on June 21, coinciding with the ‘Treixadura’ and ‘Loureira’ flowering stage, whereas the pollen peak registered by the Cour trap advanced to June 10/13 coinciding with the ‘Godello’ and ‘Albariño’ flowering. This discordance may be due to rainfall episodes that occurred from June 14 to June 17, accompanied by a decrease in the maximum temperature (Figure 3). In 2017 and 2019 the pollen peak was detected by the Cour sampler on 17/19 and 24/27 of May respectively, whereas the pollen peak detected by the Hirst sampler was found on 24 of May and the 1 of June in 2017 and 2019, respectively, where both peaks coincide with an increase in maximum temperature and the absence of rainfall (Figure 3).
The airborne pollen concentrations in the vineyard were strongly influenced by the meteorological variables. A Spearman correlation test was conducted between the main pollen season variables and the principal weather parameters (Table 3). The Hirst sampler pollen daily data show a significant positive correlation with the average (p < 0.01), maximum, and minimum temperatures (p < 0.05), and negative correlation with rainfall (p < 0.05). When the correlation test was conducted during the Hirst pre-peak period, the variables with a higher significative positive correlation were average, maximum and minimum temperatures (p < 0.01) and dew point (p < 0.05), whereas a negative correlation was observed with relative humidity and rainfall (p < 0.05). The Cour pollen sampler data during the MPS and pre-peak pollen period showed a significant negative correlation with rainfall (p < 0.05).
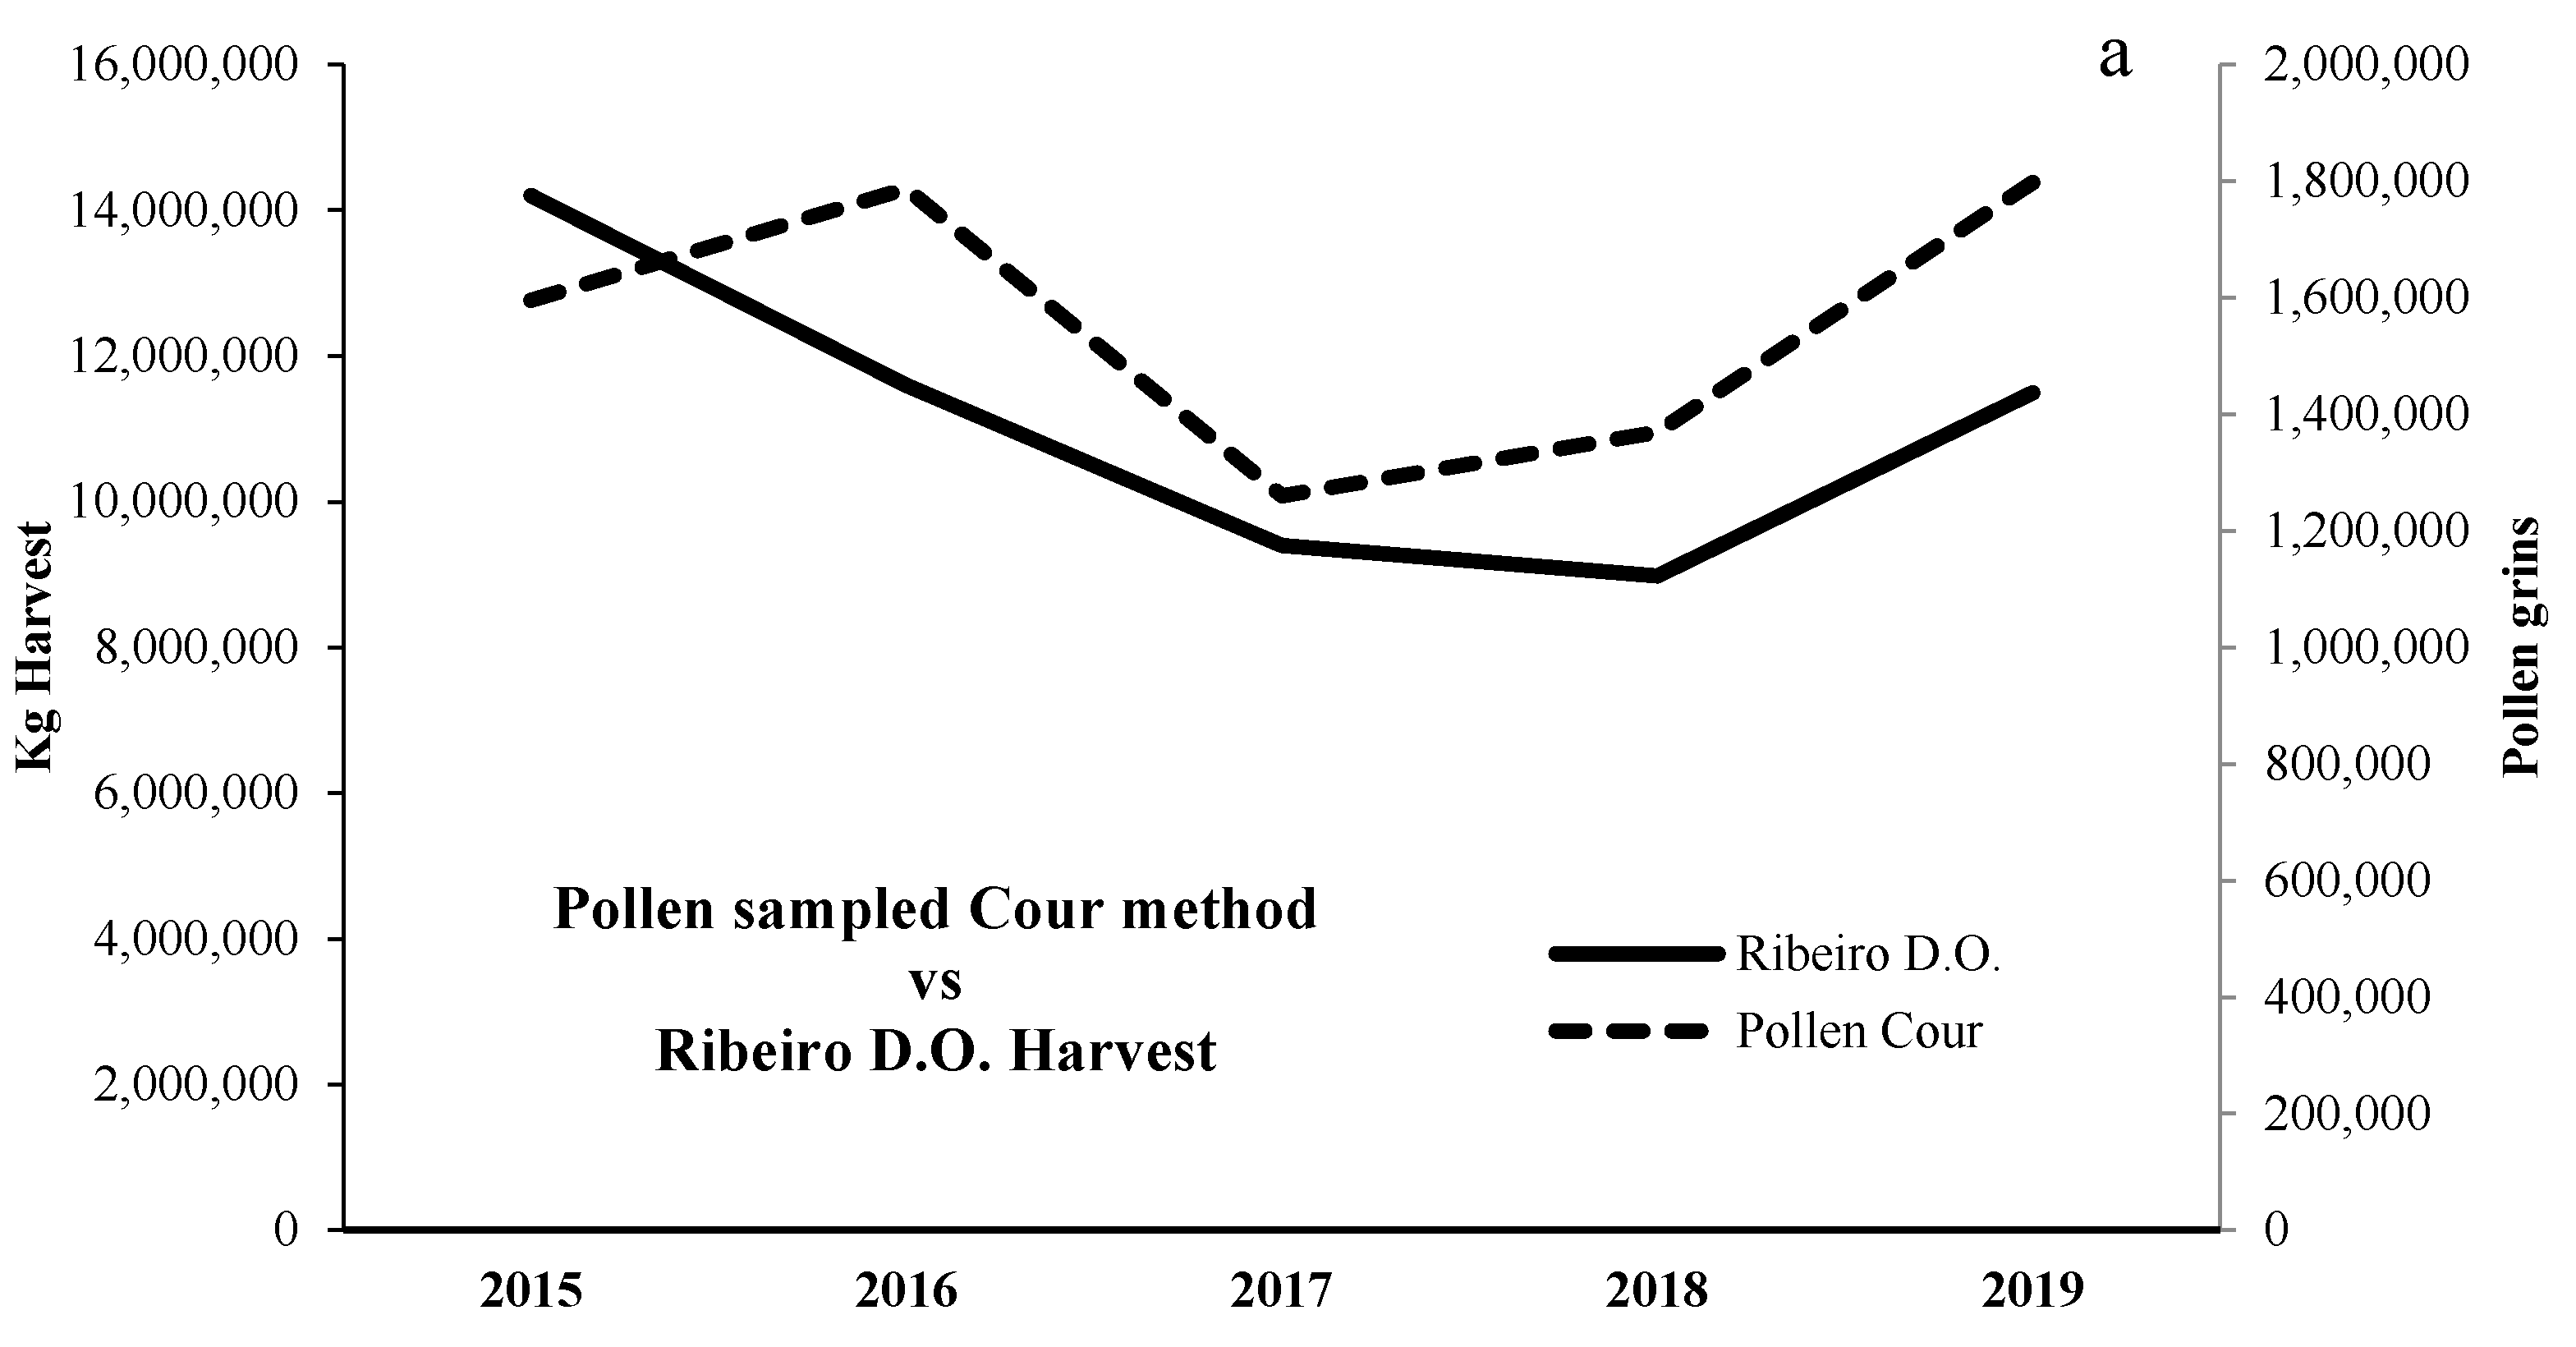
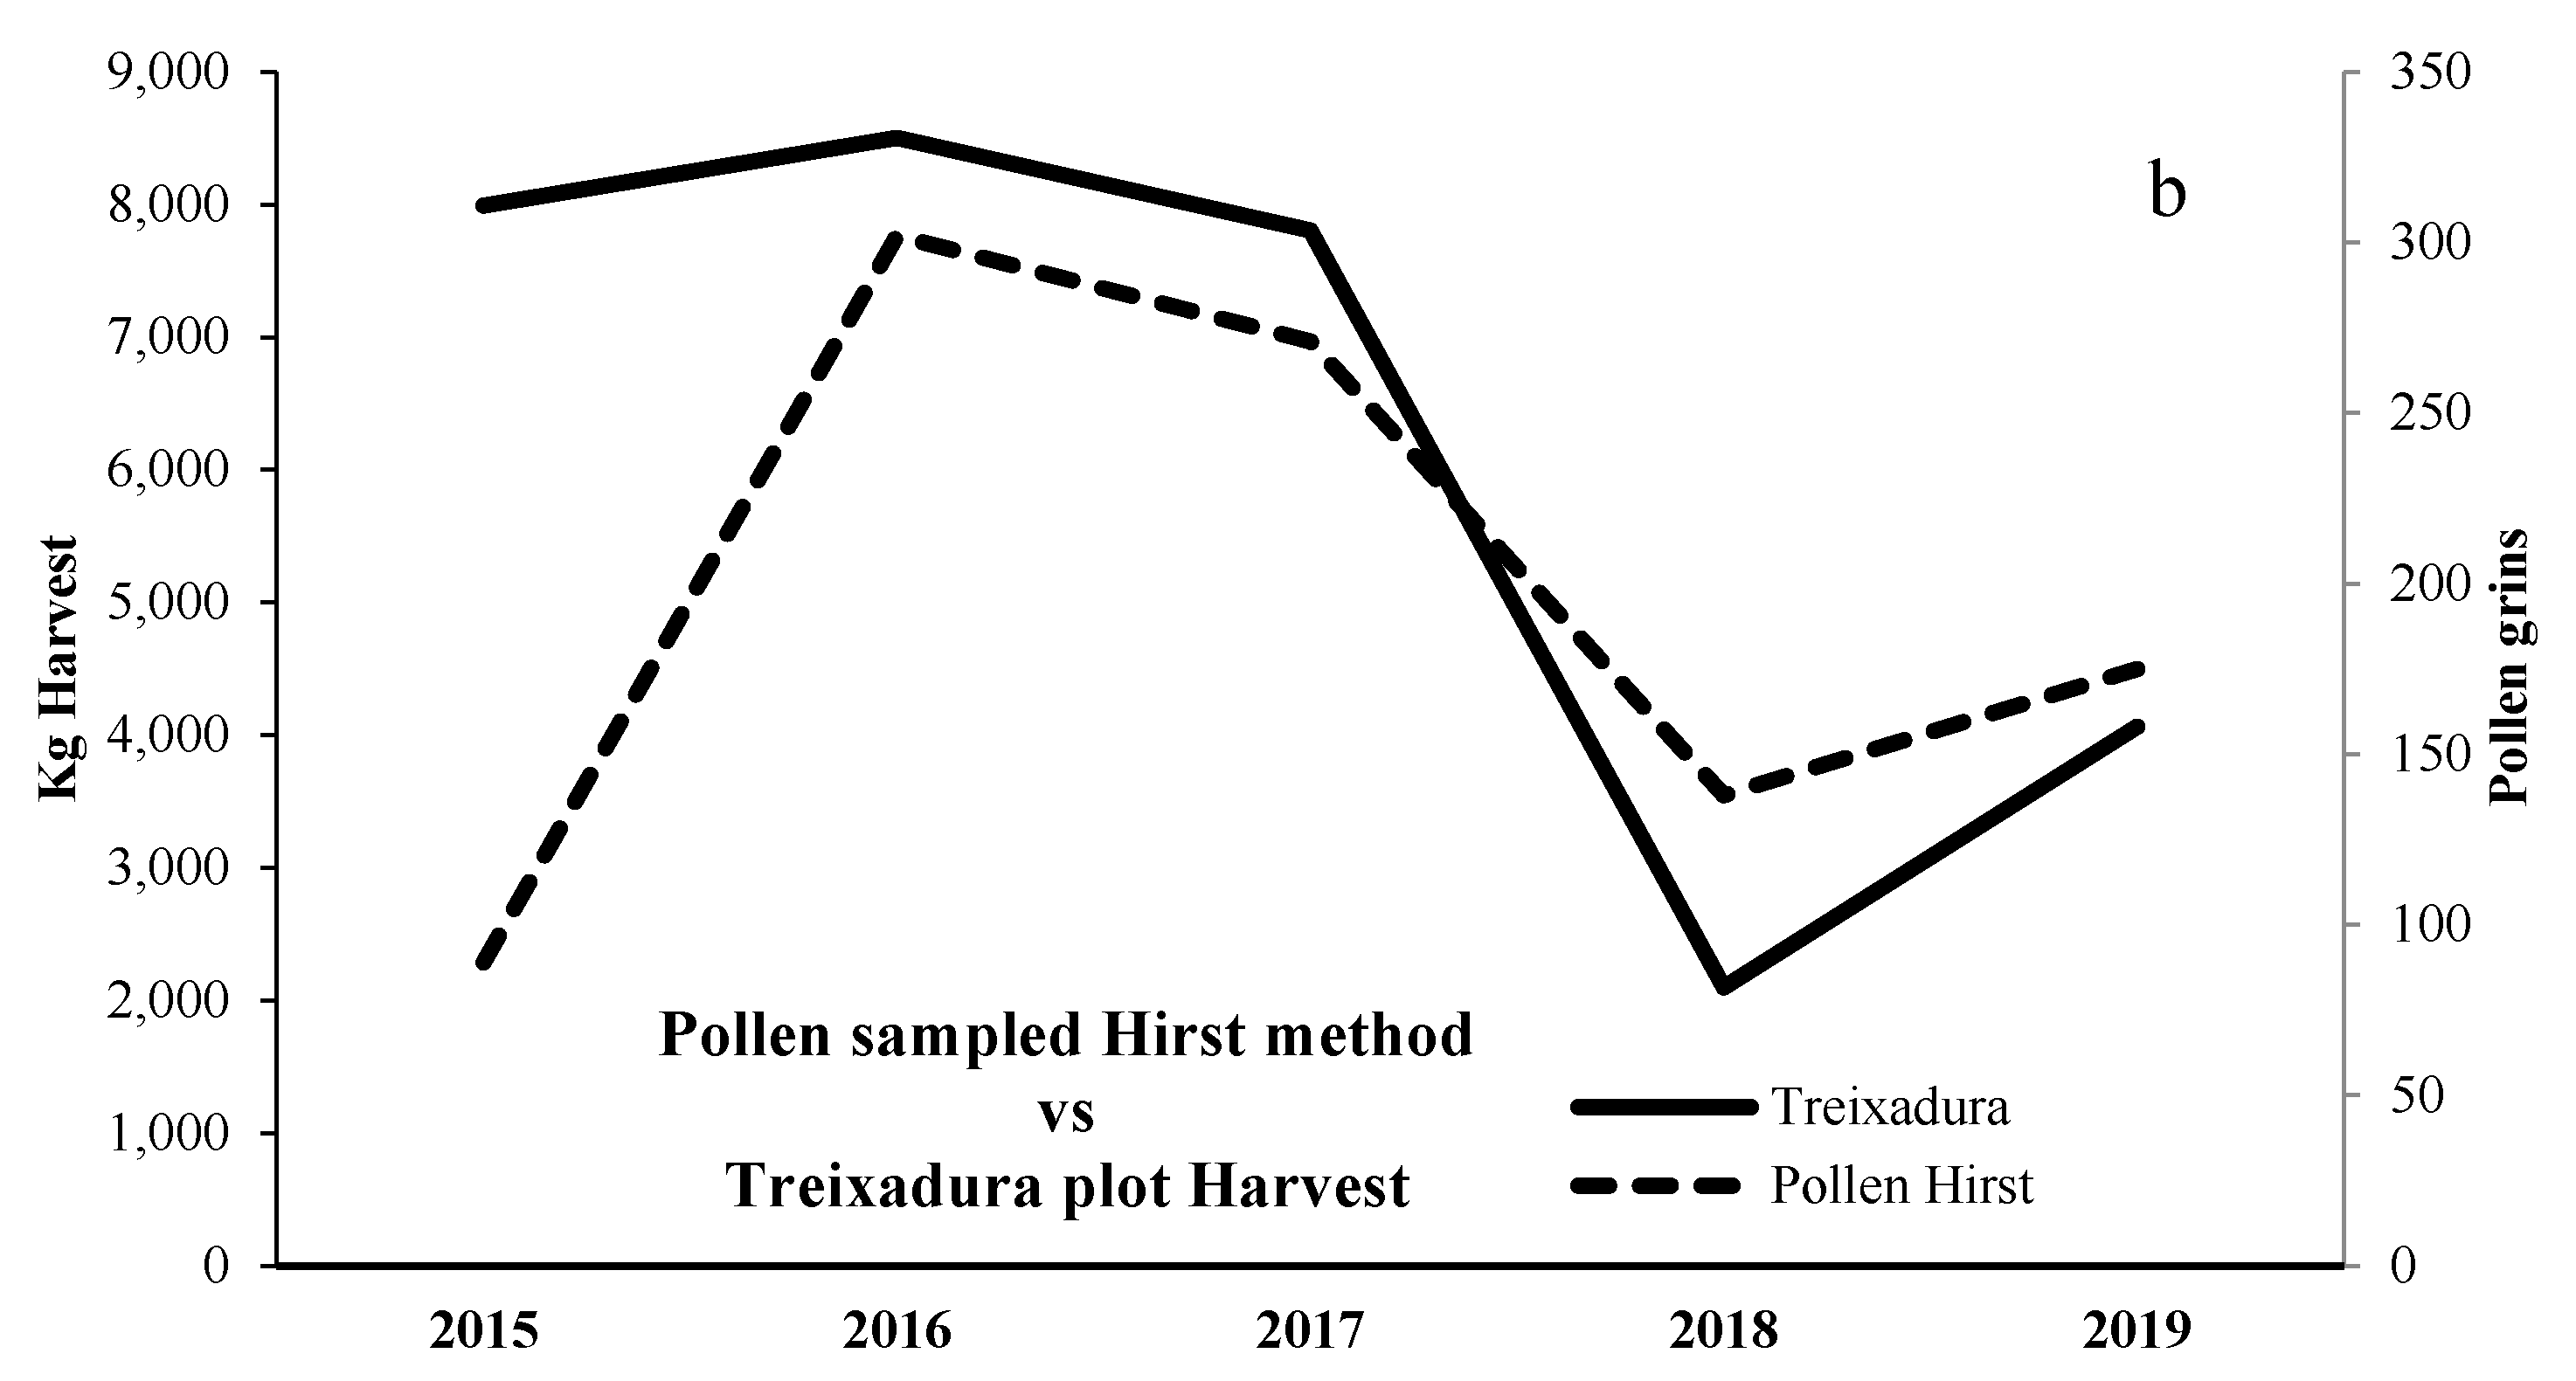
The relationship between the airborne pollen concentration of the vineyard and the amount of yield was also assessed. Figure 4 shows the high association between the total annual pollen sampled by the Cour method and the total annual harvest in the whole D.O. Ribeiro area. In addition, the pollen sampled in the atmosphere of the vineyard by the Hirst method was greatly related with the total annual harvest of the ‘Treixadura’ plot, which is where the sampler was placed (Figure 4).
With the aim of analyzing the discordances observed in the seasonal pollen integral (SPIn) between year and traps, a back-trajectory analysis was carried out considering the pollen peak date for each trap and year (Figure 5). Hirst sampler back trajectory analysis showed that in the years with higher pollen concentration (2016 and 2017), the air masses came from inland areas, but in the years with lower pollen concentrations (2015, 2018 and 2019) the air masses came from the ocean. In addition, the Cour sampler back trajectory analysis showed that along the study years the air masses during the pollen peaks came from the north and the ocean.

4. Discussion

Examining the expected wine grape production at a regional and local level is important in order to develop regulatory systems to attenuate harvest variation effects, optimize cultural and post-harvest tasks, aid with crop insurance and the enhancement of possible fraud detection due to the introduction of foreign grapes. Our study sought to compare the airborne pollen concentrations collected by two different sampling devices (volumetric and passive sampling), due their relationships as early indicators of the total yield, have been used to analyze the influence of the main weather variables and test the contribution of the air masses on pollen concentrations in the vineyard being studied. Climate is one of the most important factors influencing the success of all agricultural systems, modulating cultivar suitability, the quantity and quality of the crop production and their economic sustainability [36]. The meteorological variables can directly modify the duration of the phenological stages depending on the complex interaction with the different soil or climate conditions of a given region [37] and the genetical sensitivity of the given cultivar [2]. The most important meteorological key factors are temperature and water stress, but photoperiod also plays an important role [2]. Several authors have pointed out temperature as a key factor for plant development, where in regions with an average annual regime of temperature around 13–15 °C, the grapevine cycle length is longer [2].
The environmental conditions that influence plants at different bioclimatic areas can explain their unequal phenology behaviors [10]. In addition, the annual meteorological differences determine modifications in the phenological sequence every year for the same cultivar [4]. In our study, the MPS duration registered by the two samplers, was on average 13 and 16 days for the Hirst and Cour traps, respectively. These data are in agreement with the results noted for different Turkish cultivars, with flowering duration periods of 12 and 15 days under optimal temperature conditions [38]. Shorter flowering periods between 8 and 14 days have been observed for the “Muscat Blanc”, “Verdejo”, “Chardonnay” and “Pedro Ximenez” grape cultivars [39]. In Chilean vineyards, flowering periods of around 21–22 days have been registered for the “Tannat” and “Cabernet Sauvignon” cultivars [40] and 20– 27 days for the “Isabel” and “Rubea” cultivars [41]. Longer flowering stages of around 12 and 29 days have been observed in the “Chardonnay”, “Merlot”, “Cabernet”, and “Schiava” grape cultivars in Italian vineyards [42], and around 35 days for the ‘‘Cabernet Sauvignon’’ cultivar in the Bordeaux region [43]. Flowering is a crucial stage for a good fertilization and fruit set, which has transcendental repercussions in the final grape production. The ideal weather conditions for an optimal fertilization process are temperatures of around 20 °C with soft wind and the absence of rainfall. In the present study, the years with the higher seasonal pollen integral (SPIn) were 2016 for the Hirst sampler and 2019 for the Cour sampler, although, soft rainfall was registered at the beginning of the MPS during both years, and an increase in the temperature was followed by a rise in pollen concentration. Some authors have pointed out that the synchronism between temperature and rainy periods induces a successful release of pollen in the atmosphere [44]. Nevertheless, the Vitis vinifera L. SPIn registered by the Hirst trap during the study period was higher than that reported in Braga [44] or in previous studies in Cenlle [4]. The quantity of pollen in the present study was lower than that the observed in the Montilla-Moriles DO area (southern Spain) [39,45] or in San Michele all’Adige of Trento (Italy) [42]. The pollen peak registered during the studied years ranged from 28 pollen/m3 on May 29 in 2015 to 54 pollen/m3 on June 1 in 2019. These values were lower than that observed for the Montilla-Moriles DO area, with 94 pollen/m3 on May 12th 2015 [39] or that reported for the Trento area, ranging from 41–197 pollen/m3 [42].
The Spearman correlation analysis results between the meteorological parameters and the pollen concentration reinforce the importance of temperature on the length of the pollen season and the total quantity of pollen registered during a given year. If we consider only the Hirst MPS data, a significant and positive correlation with the average, maximum, and minimum temperatures can be found, and a negative correlation with rainfall in both traps (Hirst and Cour). If only the pre-peak period is included in the analysis, a significant and positive correlation with the average, maximum temperature, and dew point can be found in the case of the Hirst trap, whereas a significant and negative correlation with relative humidity and rainfall may be found in the case of the Hirst trap, and that with rainfall in the Cour trap. Therefore, the pre-peak correlation shows the importance of temperature and rainfall on pollen release into the atmosphere. These results are in accordance with the data pointed out by several authors from the same study area [4], the Trento area [42], and the Montilla-Moriles DO area (southern Spain) [39]. The differences between the correlation level between both collectors during the two periods considered in our research, the MPS and the pre-peak could be influenced by the number of studied samples. In the case of the Cour trap, the samples were collected every 3 or 4 days, and for the Hirst collector, samples were taken daily, leading to a better correlation with the meteorological factors. Nevertheless, a study conducted in Barcelona showed that different collectors (Hirst and Cour) provide essentially the same information [18]. In our study, the main difference between the two samplers was that the Hirst volumetric sampler was more suitable for predicting the production of a particular local plot, while the Cour sampler is passive, being more appropriate when forecasting regional grapevine production. A high degree of association between the total annual pollen sampled by the Cour method and the total annual harvest in the whole D.O. Ribeiro area was detected, whereas the pollen sampled in the atmosphere of the vineyard by the Hirst method was greatly related with the total harvest of the ‘Treixadura’ plot. If the data of 2015 are omitted in the analysis (as a consequence of their anomalous character regarding the pollen concentrations recorded from the atmosphere of the vineyard in north-western Spain) a highly significant correlation coefficient of 0.959 (p = 0.041) can be registered between the total grapevine harvest of the region and the pollen sampled by the Cour method. Likewise, the significant correlation coefficient increases to 0.995 (p = 0.005) when the ‘Treixadura’ cultivar plot harvest is compared with the pollen registered by the Hirst method. Therefore, the comparison of data from the Hirst and Cour traps is valuable for determining whether local data are representative of the region as a whole [19]. Further investigations with a greater number of study years may corroborate this behavior.
Therefore, the pollen content in the atmosphere represents a useful tool to achieve an adjusted crop yield prediction some months in advance, allowing possible fraud detection due to the introduction of foreign grapes, the optimization of cultural and post-harvest tasks, or crop insurance hiring. These are essential aspects for wine and products of standardized quality of a given viticultural designated origin area.
Some discordances in the pollen peak timing in the atmosphere between the two traps were detected. The main disagreements took place in 2016, 2017, and 2019 as a consequence of several causes. The placement of the Hirst trap should be at the same height as the vines, registering local variations, whereas the Cour trap placement over the vines identifies global variations. Moreover, the vine trellis-training system is in a vertical trellis with a canopy that is not divided. The shoot thinning would improve airflow inside the canopy (as in dense canopies airflow is restricted), prompting self-pollination processes. This fact can make pollen collection by the Hirst trap difficult [10]. Also, the Hirst trap is a volumetric sampler that has a suction rate of 10 L/min and the Cour trap is a passive sampler collecting, the pollen from an air column in a higher impact surface. Backward trajectory analysis was conducted in order to obtain a deeper understanding about the discordances between the pollen peak timing in the atmosphere registered between the two traps. Our results have shown that years with high pollen concentration in the Hirst sampler indicate air masses that have come from the inland areas whereas in the years with lower pollen concentrations the air masses came from the ocean. This behavior was also noted for airborne pollen in Porto [46]. On the contrary, back trajectory analysis with the Cour sampler peak data showed that the air masses come from the ocean in all of the studied years.

5. Conclusions

The pollen data obtained by both traps indicate that the Hirst trap may be more suitable for predicting local grapevine production and that the Cour trap is better for developing regional yield predictions. With the Hirst sampler, higher pollen concentrations were recorded with air masses arriving from inland areas, but in the case of the Cour sampler, the pollen peaks were registered with air masses from the north and the ocean. Due to the bioclimatic conditions of the DO Ribeiro area, the Vitis vinifera L. airborne main pollen season was detected mainly during the final days of stage 5 (inflorescence emergence) and the whole of stage 6 (flowering). The weather variables strongly influence airborne Vitis vinifera L. pollen grains, primarily the average and maximum temperature. In general, cultivar phenology and pollen concentration were affected by the main meteorological variables, since temperature increases prompted a greater pollen concentration in the vineyard, whereas rainfall produced a decrease in the airborne pollen concentrations.

Author Contributions

Conceptualization, I.A. and F.J.R.-R.; methodology, M.F.-G. and H.R.; software, M.F.-G. and H.R.; validation, M.F.-G.; formal analysis, M.F.-G., H.R. and A.P.-R.; investigation, M.F.-G., H.R. and A.P.-R.; resources, I.A. and F.J.R.-R.; data curation, M.F.-G., H.R. and A.P.-R.; writing—original draft preparation, M.F.-G., H.R., I.A. and F.J.R.-R.; writing—review and editing, M.F.-G., H.R., I.A. and F.J.R.-R.; visualization, M.F.-G., H.R., I.A. and F.J.R.-R.; supervision, I.A. and F.J.R.-R.; project administration, I.A. and F.J.R.-R.; funding acquisition, I.A. and F.J.R.-R.. All authors have read and agreed to the published version of the manuscript.

Funding

This research was funded by Economy and Competence Ministry of Spain Government, grant number AGL2014-60412-R and the contract UID/GEO/04683/2013 (POCI-01-0145-FEDER-007690) FCT and FEDER through the Operational Program Competitiveness Factors − COMPETE.

Conflicts of Interest

The authors declare no conflict of interest.

References

  1. Leolini, L.; Moriondo, M.; Fila, G.; Costafreda-Aumedes, S.; Ferrise, R.; Bindi, M. Late spring frost impacts on future grapevine distribution in Europe. Field Crop. Res. 2018, 222, 197–208. [Google Scholar] [CrossRef]
  2. Parker, A.; de Cortázar-Atauri, I.G.; Chuine, I.; Barbeau, G.; Bois, B.; Boursiquot, J.M.; Cahurel, J.-Y.; Claverie, M.; Dufourcq, T.; Gény, L.; et al. Classification of varieties for their timing of flowering and veraison using a modelling approach: A case study for the grapevine species Vitis vinifera L. Agric. For. Meteorol. 2013, 180, 249–264. [Google Scholar] [CrossRef]
  3. Fernández-González, M.; Rodríguez-Rajo, F.J.; Jato, V.; Aira, M.J.; Ribeiro, H.; Oliveira, M.; Abreu, I. Forecasting ARIMA models for atmospheric vineyard pathogens in Galicia and Northern Portugal: Botrytis cinerea spores. Ann. Agric. Environ. Med. 2012, 19, 255–262. [Google Scholar] [PubMed]
  4. Fernández-González, M.; Rodríguez-Rajo, F.J.; Escuredo, O.; Aira, M.J. Influence of thermal requirement in the aerobiological and phenological behavior of two grapevine varieties. Aerobiologia 2013, 29, 523–535. [Google Scholar] [CrossRef]
  5. Kishino, A.Y.; Marur, I.P.H. Factores climáticos e o desenvolvimento da videira. In Viticultura Tropical: O Sistema deProducao doParana; Kishino, A.Y., de Carvalho, S.C., Roberto, S.R., Eds.; IAPAR: Londrina, Brazil, 2007; pp. 59–86. [Google Scholar]
  6. Duchene, E.; Huard, F.; Dumas, V.; Schneider, C.; Merdinoglu, D. The challenge of adapting grapevine varieties to climate change. Clim. Res. 2010, 41, 193–204. [Google Scholar] [CrossRef] [Green Version]
  7. Mandelli, F.; Tonietto, J.; Camargo, U.A.; Czermainski, A.B.C. Fenologia e necessidades térmicas da videira na Serra Gaúcha. In XVIII Congresso Brasileiro de Fruticultura; Agrolink: Florianópolis, Brazil, 2004. [Google Scholar]
  8. Piña, S.; Bautista, D. Ciclo fenológico de cultivares de vid (Vitis vinifera L.) para mesa en condiciones tropicales. Bioagro 2004, 16, 9–15. [Google Scholar]
  9. Kamel, A. Estudio Sobre la Sexualidad de las Uvas de Mesa en España; Instituto Nacional de Investigaciones Agronómicas: Madrid, Spain, 1959. [Google Scholar]
  10. Fernández-González, M.; Rodríguez-Rajo, F.J.; Aira, M.J.; Jato, V. Phenology of the Treixadura variety cultivated in the Ribeiro Denomination of Origin (Ourense-Spain) during the year 2008. Polen 2007, 17, 23–38. [Google Scholar]
  11. Fernández-González, M.; Rodríguez-Rajo, F.J.; Jato, V.; Escuredo, O.; Aira, M.J. Estimation of yield ‘Loureira’ variety with an aerobiological and phenological model. Grana 2011, 50, 63–72. [Google Scholar] [CrossRef]
  12. Cunha, M.; Abreu, I.; Pinto, P.; Castro, R. Airborne pollen samples for early-season estimates of wine production in a Mediterranean climate of northern Portugal. Am. J. Enol. Vitic. 2003, 54, 189–194. [Google Scholar]
  13. Cunha, M.; Ribeiro, H.; Costa, P.; Abreu, I. A comparative study of vineyard phenology and pollen metrics extracted from airborne pollen time series. Aerobiologia 2015, 31, 45–56. [Google Scholar] [CrossRef]
  14. Galán, C.; Vázquez, L.; García-Mozo, H.; Dominguez-Vilches, E. Forecasting olive (Olea europaea) crop yield based on pollen emission. Field Crop Res. 2004, 86, 43–51. [Google Scholar] [CrossRef] [Green Version]
  15. Ribeiro, H.; Cunha, M.; Abreu, I. A bioclimatic model for forecasting olive yield. J. Agric. Sci. 2009, 147, 647–656. [Google Scholar] [CrossRef]
  16. Ribeiro, H.; Abreu, I.; Cunha, M. Olive crop-yield forecasting based on airborne pollen in a region where the olive groves acreage and crop system changed drastically. Aerobiologia 2017, 33, 473–480. [Google Scholar] [CrossRef]
  17. Oteros, J.; Orlandi, F.; García-Mozo, H.; Aguilera, F.; Dhiab, A.B.; Bonofiglio, T.; Abichou, M.; Ruiz-Valenzuela, L.; Trigo, M.M.; Díaz de la Guardia, C.; et al. Better prediction of Mediterranean olive production using pollen-based models. Agron. Sustain. Dev. 2014, 34, 685–694. [Google Scholar] [CrossRef] [Green Version]
  18. Belmonte, J.; Canela, M.; Guàrdia, R.A. Comparison between categorical pollen data obtained by Hirst and Cour sampling methods. Aerobiologia 2000, 16, 177–185. [Google Scholar] [CrossRef]
  19. Kelly, H.Y.; Dufault, N.S.; Walker, D.R.; Isard, S.A.; Schneider, R.W.; Giesler, L.J.; Wright, D.L.; Marois, J.J.; Hartman, G.L. From select agent to an established pathogen: The response to Phakopsora pachyrhizi (soybean rust) in North America. Phytopathology 2015, 105, 905–916. [Google Scholar] [CrossRef] [Green Version]
  20. Moreno-Grau, S.; Aira, M.J.; Elvira-Rendueles, B.; Fernández-González, M.; Fernández-González, D.; García-Sánchez, A.; Martínez-García, M.J.; Moreno, J.M.; Negral, L.; Vara, A.; et al. Assessment of the Olea pollen and its major allergen Ole e 1 concentrations in the bioearosol of two biogeographical areas. Atmos. Environ. 2016, 145, 264–271. [Google Scholar] [CrossRef]
  21. Galán, C.; Alcázar, P.; Oteros, J.; García-Mozo, H.; Aira, M.J.; Belmonte, J.; Díaz de la Guardia, C.; Fernández-González, D.; Gutierrez-Bustillo, M.; Moreno-Grau, S.; et al. Airborne pollen trends in the Iberian Peninsula. Sci. Total Environ. 2016, 550, 53–59. [Google Scholar] [CrossRef]
  22. Aira, M.J.; Almaguer Chávez, M.; Fernández-González, M.; Rodríguez-Rajo, F.J. Pollen diversity in the atmosphere of Havana, Cuba. Aerobiologia 2018, 34, 389–403. [Google Scholar] [CrossRef]
  23. Almaguer-Chávez, M.; Aira, M.J.; Rojas, T.I.; Fernández-González, M.; Rodríguez-Rajo, F.J. New findings of airborne fungal spores in the atmosphere of havana, cuba, using aerobiological non-viable methodology. Ann. Agric. Environ. Med. 2018, 25, 349–359. [Google Scholar] [CrossRef]
  24. Fernández-González, M.; Rodríguez-Rajo, F.J.; Escuredo, O.; Aira, M.J. Optimization of integrated pest management for powdery mildew (Unincula necator) control in a vineyard based on a combination of phenological, meteorological and aerobiological data. J. Agric. Sci. 2013, 151, 648–658. [Google Scholar] [CrossRef]
  25. West, J.S.; Kimber, R.B.E. Innovations in air sampling to detect plant pathogens. Ann. Appl. Biol. 2015, 166, 4–17. [Google Scholar] [CrossRef] [PubMed] [Green Version]
  26. Blanco-Ward, D.; García, J.M.; Jones, G.V. Spatial climate variability and viticulture in the Miño River Valley of Spain. Vitis 2007, 46, 63–70. [Google Scholar]
  27. Orriols, I.; Vázquez, I.; Losada, A. Variedades gallegas. Terruños 2006, 16, 11–18. [Google Scholar]
  28. Hirst, J.M. An automatic volumetric spore trap. Ann. Appl. Biol. 1952, 39, 257–265. [Google Scholar] [CrossRef]
  29. Galán, C.; Cariñanos, P.; Alcázar, P.; Dominguez-Vilches, E. Spanish Aerobiology Network (REA): Management and Quality Manual; Servicio de Publicaciones: Córdoba, Spain, 2007; pp. 39–74. [Google Scholar]
  30. Galán, C.; Ariatti, A.; Bonini, M.; Clot, B.; Crouzy, B.; Dahl, A.; Fernández-González, D.; Frenguelli, G.; Gehrig, R.; Isard, S.; et al. Recommended terminology for aerobiological studies. Aerobiologia 2017, 33, 293–295. [Google Scholar] [CrossRef]
  31. Cour, P. Nouvelles technique de détection des flux et des retombé es polliniques: Étude de la sedimentation des pollens et des spores á la surface du sol. Pollen et Spores XVI 1974, 1, 103–141. [Google Scholar]
  32. Ribeiro, H.; Cunha, M.; Abreu, I. Definition of the main pollen season using a logistic model. Ann. Agric. Environ. Med. 2007, 14, 159–167. [Google Scholar]
  33. Lorenz, D.H.; Eichorn, K.W.; Bleiholder, H.; Klose, R.; Meier, U.; Weber, E. Phänologische Entwicklungsstadien der Weinrebe (Vitis vinifera L. ssp. vinifera). Codierung und Beschreibung nach der erweiterten BBCH-Skala. Viticult. Enol. Sci. 1994, 49, 66–70. [Google Scholar]
  34. Meier, U. Growth Stages of Mono and Dicotyledonous Plants. 2001. Available online: https://www.julius-kuehn.de/media/Veroeffentlichungen/bbch%20epaper%20en/page.pdf (accessed on 19 December 2019).
  35. Rolph, G.D. Real-time Environmental Applications and Display SYstem (READY). Environ. Modell. Softw. 2017, 95, 210–228. [Google Scholar] [CrossRef]
  36. Jones, G.V.; Reid, R.; Vilks, A. Climate, grapes, and wine: Structure and suitability in a variable and changing climate. In The Geography of Wine: Regions, Terroir, and Techniques; Dougherty, P.H., Ed.; Springer: Heidelberg, The Netherlands, 2012; pp. 109–133. [Google Scholar]
  37. Pedro Júnior, M.J.; Sentelhas, P.C. Clima e produção. In Uva: Tecnologia de Produção, Pós-Colheita, Mercado; Pommer, C.V., Ed.; Editora Cinco Continentes: Porto Alegre, Brazil, 2003; pp. 63–107. [Google Scholar]
  38. Kelen, M.; Dermitas, I. Pollen viability, germination capability and pollen production level of some grape varieties (Vitis vinifera L.). Acta Physiol. Plant. 2003, 25, 229–233. [Google Scholar] [CrossRef]
  39. Martínez-Bracero, M.; Alcázar, P.; Velasco-Jiménez, M.J.; Calderón-Ezquerro, C.; Galán, C. Phenological and aerobiological study of vineyards in the Montilla-Moriles PDO area, Cordoba, southern Spain. J. Agric. Sci. 2018, 156, 821–831. [Google Scholar] [CrossRef]
  40. Sato, A.J.; Jubileu, B.S.; Marinho de Asis, A.; Roberto, S.R. Phenology production and must compounds of ‘‘Cabernet Saugvignon’’ and ‘‘Tanat’’ grapevines in subtropical climate. Rev. Bras. Frutic. 2011, 33, 491–499. [Google Scholar] [CrossRef] [Green Version]
  41. Sato, A.J.; Silva, B.J.; Santos, C.E.; Bertolucci, R.; Santos, R.; Carielo, M.; Guiraud, M.C.; de Batista Fonseca, I.C.; Roberto, S.R. Phenology and thermal demand of ‘‘Isabel’’ and ‘‘Rubea’’ grapevines on different rootstocks in North of Paraná. Semina Ciencias Agrárias 2008, 29, 283–292. [Google Scholar]
  42. Cristofolini, F.; Gottardini, E. Concentration of airborne pollen of Vitis vinifera L. and yield forecast: A case study at S. Michele all’Adige, Trento, Italy. Aerobiologia 2000, 16, 125–129. [Google Scholar] [CrossRef]
  43. Jones, G.V.; Davis, R.E. Climate influences on grapevine phenology, grape composition, and wine production and quality for Bordeaux, France. Am. J. Enol. Vitic. 2000, 51, 249–261. [Google Scholar]
  44. Ribeiro, H.; Cunha, M.; Abreu, I. Airborne pollen concentration in the regions of Braga, Portugal, and its relationship with meteorological parameters. Aerobiologia 2003, 19, 21–27. [Google Scholar] [CrossRef]
  45. Martínez-Bracero, M.; Alcázar, P.; Velasco-Jiménez, M.J.; Galán, C. Effect of the Mediterranean crops in the ariborne pollen espectrum. Aerobiologia 2019, 35, 647–657. [Google Scholar] [CrossRef]
  46. Fernández-González, M.; Ribeiro, H.; Pereira, J.R.S.; Rodríguez-Rajo, F.J.; Abreu, I. Assessment of the potential real pollen related allergenic load on the atmosphere of Porto city. Sci. Total Environ. 2019, 668, 333–341. [Google Scholar] [CrossRef]
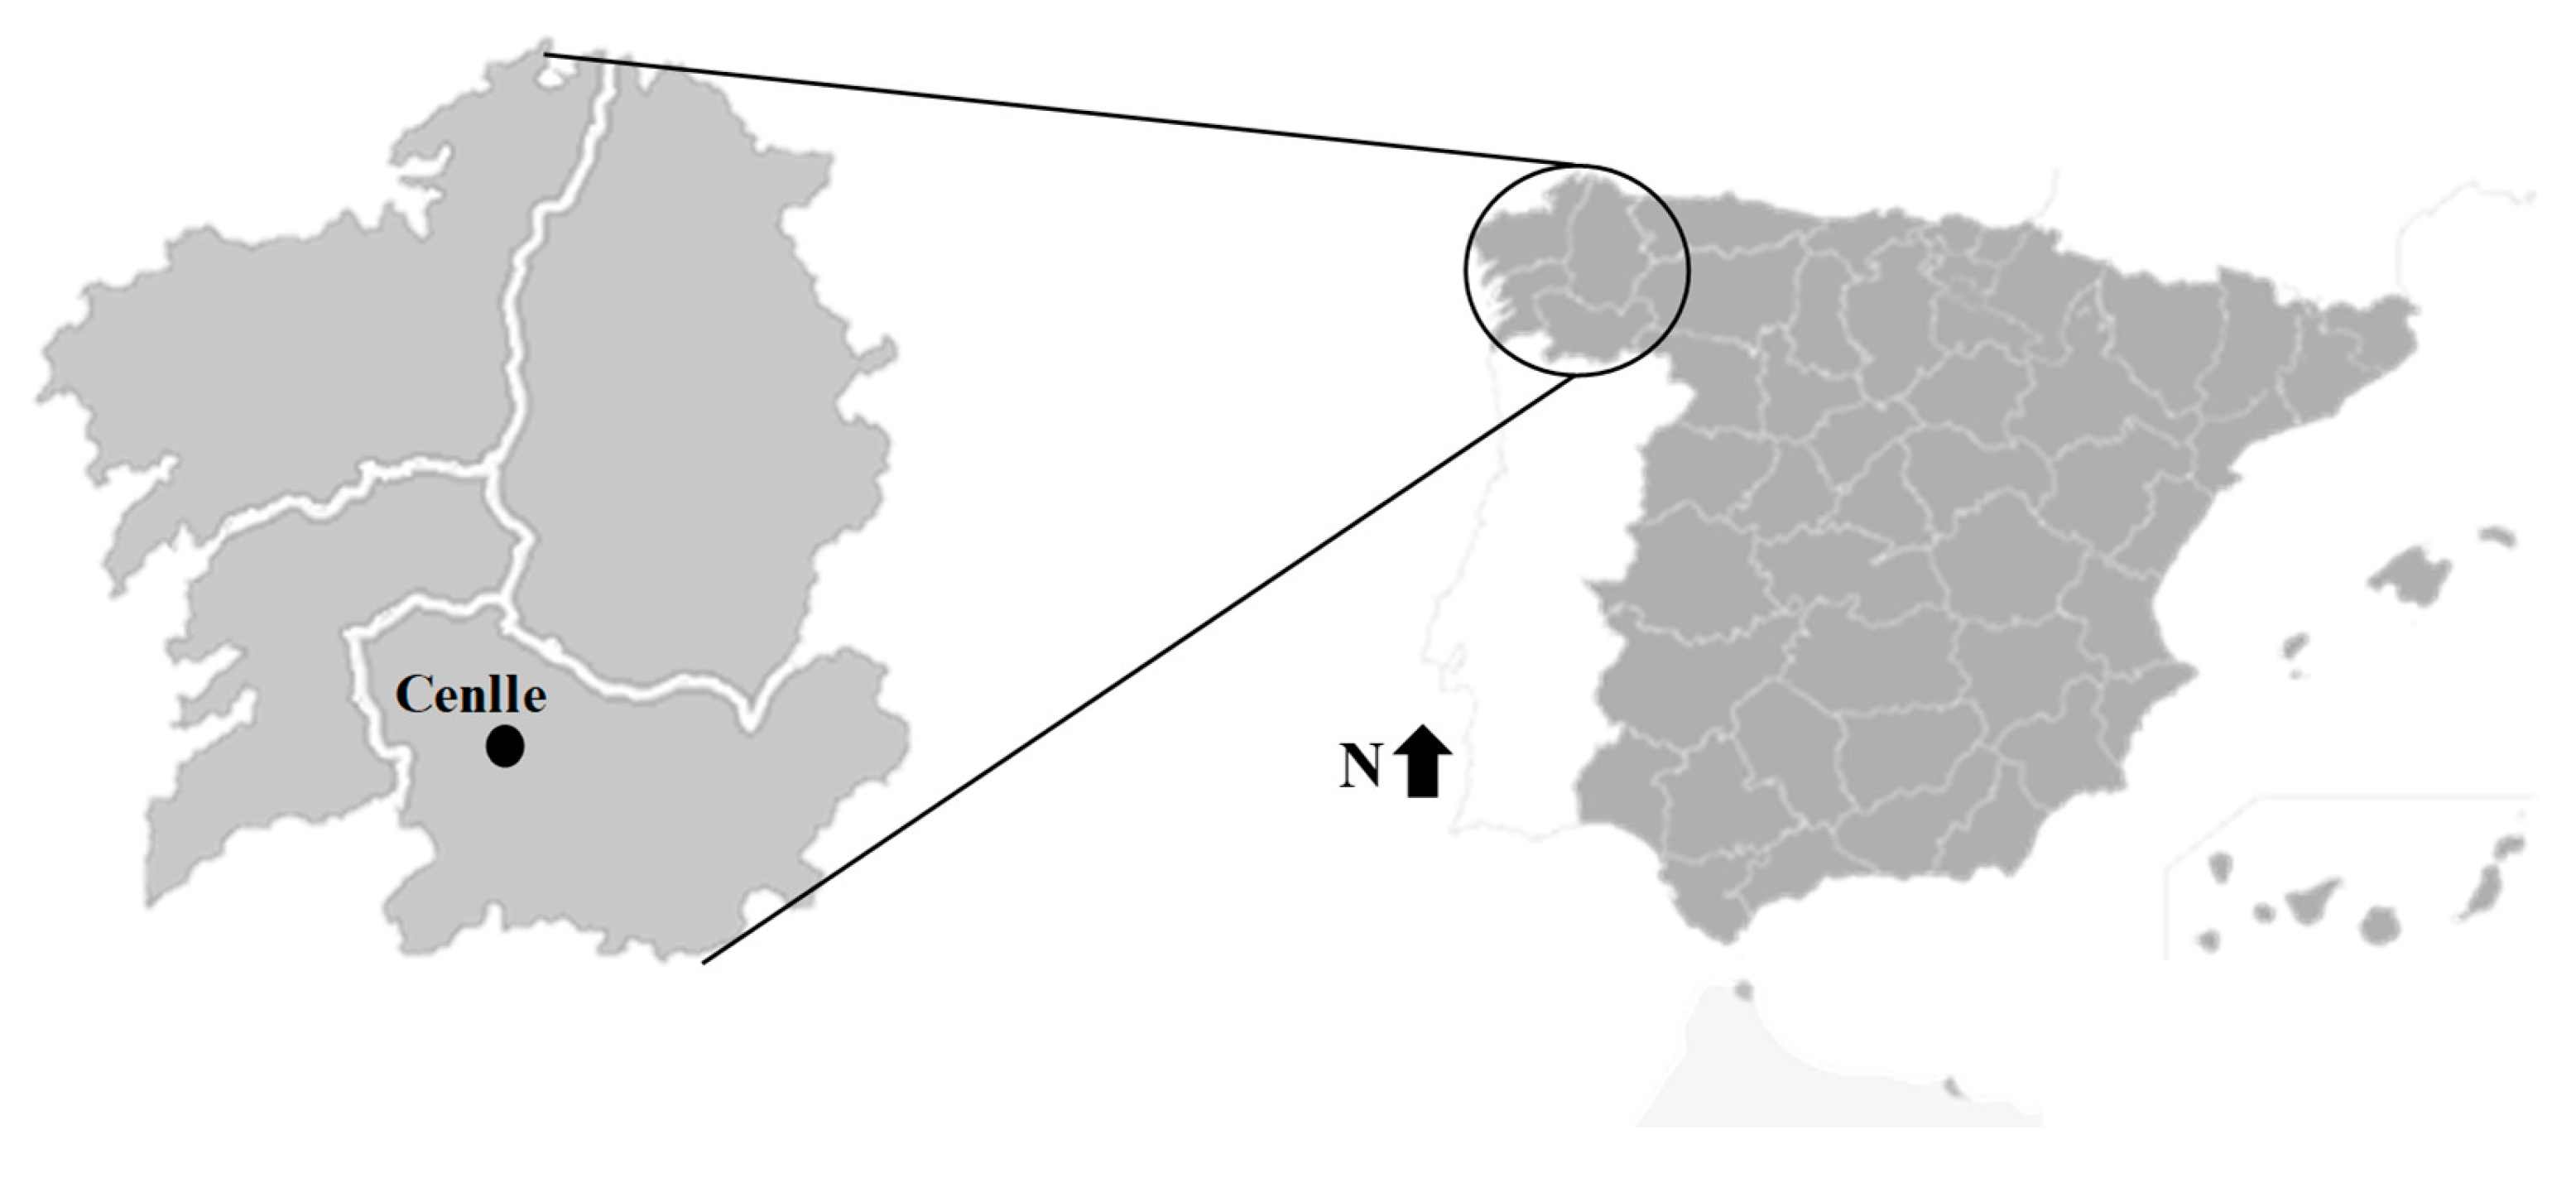
Figure 1. Location of Cenlle in Spain.
Agronomy 10 00185 g001
Figure 2. Meteorological parameters, rainfall (black bars), relative humidity, maximum temperature, wind speed (lines) and phenophases of flowering (stage 6): 61 (Beginning of flowering: 10% of flower caps fallen), 65 (Full flowering: 50% of flower caps fallen) and 69 (End of flowering) for four cultivars (T) ‘Treixadura’, (G) ‘Godello’, (L) ‘Loureira’, and (A) ‘Albariño’. a, b, c, d, e, sub-graphs of the years of the study.
Agronomy 10 00185 g002aAgronomy 10 00185 g002b
Figure 3. Vitis vinifera L. pollen concentration during the study years, Hirst pollen (brown line), Cour pollen (blue line), maximum temperature (discontinuous black line) and rainfall in bars. Phenological stage 6 (flowering) with tree phenophases 61: Beginning of flowering: 10% of flower caps fallen, 65: Full flowering: 50% of flower caps fallen and 69: End of flowering. Cultivars A: ‘Albariño’, L: ‘Loureira’, G: ‘Godello’, and T: ‘Treixadura’. (a) 2015 data (b) 2016 data (c) 2017 data (d) 2018 data (e) 2019 data.
Agronomy 10 00185 g003
Figure 4. Pollen sampled in the atmosphere of the vineyard by means the Cour method compared with the total annual harvest in the whole Ribeiro D.O. (a). Pollen sampled in the atmosphere of the vineyard by means the Hirst method compared with the total harvest of the ‘Treixadura’ plot (b).
Agronomy 10 00185 g004aAgronomy 10 00185 g004b
Figure 5. HYSPLIT backward trajectories 24-h at a final height of 300, 500, and 750m agl at considered Vitis vinifera L. pollen peak episodes: (a) 29th May 2015; (b) 10th June 2016; (c) 21th Jun 2016; (d) 18th May 2017; (e) 24th May 2017; (f) 15th Jun 2018; (g) 26th May 2019; (h) 1st June 2019.
Agronomy 10 00185 g005aAgronomy 10 00185 g005b
Table 1. Start, end and length of the phenophases 61 (Beginning of flowering: 10% of flower caps fallen), 65 (Full flowering: 50% of flower caps fallen) and 69 (End of flowering) during the stage 6 (flowering), and annual average length.
Phenological‘Treixadura’‘Godello’‘Loureira’‘Albariño’Average
PhasesStartEndLengthStartEndLengthStartEndLengthStartEndLengthAnnual Length
20156126-May1-Jun728-May31-May331-May2-Jun421-May30-May1015
652-Jun4-Jun31-Jun4-Jun53-Jun6-Jun331-Jun2-Jun3
695-Jun9-Jun55-Jun9-Jun57-Jun9-Jun33-Jun9-Jun7
2016619-Jun12-Jun49-Jun10-Jun29-Jun12-Jun48-Jun10-Jun310
6513-Jun17-Jun511-Jun12-Jun213-Jun16-Jun411-Jun12-Jun2
6918-Jun21-Jun413-Jun14-Jun217-Jun21-Jun513-Jun14-Jun2
20176114-May16-May312-May14-May321-May23-May38-May13-May612
6517-May21-May515-May20-May624-May26-May314-May17-May4
6922-May25-May421-May25-May527-May30-May418-May19-May2
2018614-Jun8-Jun53-Jun9-Jun77-Jun12-Jun63-Jun10-Jun816
659-Jun12-Jun410-Jun15-Jun613-Jun16-Jun411-Jun15-Jun5
6913-Jun16-Jun416-Jun19-Jun417-Jun20-Jun416-Jun20-Jun5
20196124-May27-May424-May27-May430-May31-May224-May27-May411
6528-May30-May328-May30-May31-Jun4-Jun428-May30-May3
6931-May4-May531-May4-May55-Jun7-Jun331-May4-May5
Table 2. Date of the start and end of the main pollen season (MPS), length of the main pollen season (MPS) (days), seasonal pollen integral (SPIn) (pollen), pollen peak (pollen/m3) (pollen/m2 and date of the pollen peak (day).
Start
(date)
End
(date)
Lenght
(days)
SPIn
(pollen)
Peak
(pollen/m3 or pollen/m2)
Peak Date
Hirst201524-May3-Jun11892829-May
20164-Jun27-Jun243024221-Jun
201715-May29-May152714924-May
20189-Jun21-Jun131383215-Jun
201926-May6-Jun12175541-Jun
Cour201523-May31-May91.595.8331.068.19329-May/31-May
20163-Jun14-Jun121.787.525836.78010-Jun/13-Jun
201711-May21-May111.260.434852.68717-May/19-May
20185-Jun18-Jun141.368.687544.19915-Jun/18-Jun
201921-May3-Jun141.797.765612.10924-May/27-May
Table 3. Spearman correlation between Hirst and Cour pollen traps and main meteorological variables, during the main pollen season (MPS) and during pre-peak (** p ≤ 0.01; * p ≤ 0.05).
MPSPre-Peak
HirstCourHirstCour
R2pR2pR2pR2p
Average Temperature0.325 **0.0040.2300.3440.498 **0.0000.3570.191
Maximum Temperature0.251 *0.0300.1610.5090.417 **0.0030.3040.271
Minimum Temperature0.263 *0.0230.0110.9660.444 **0.002−0.0790.781
DewPoint0.1770.129−0.1070.6630.313 *0.030−0.0890.752
Relative Humidity−0.2130.067−0.2490.304−0.354 *0.014−0.3790.164
Rainfall−0.231 *0.046−0.463 *0.046−0.333 *0.021−0.581 *0.023
Wind speed0.1090.3500.0670.7860.1790.2230.1570.576