1. Introduction
The dramatic transformation of wheat production due to unprecedented productivity growth from the Green Revolution benefited both producers and consumers of wheat through low production costs and low food prices [
1]. However, future challenges to the role of wheat in global food security will be shaped by its potential to produce larger yields and better nutritional quality, while increasingly withstanding multiple biotic and abiotic stresses [
2,
3]. Slowing productivity growth, which is caused by biotic and abiotic stresses, is further complicated by changing consumption patterns and the growing demand for diverse and more nutritious wheat products in the developing world [
1,
4]. Average annual growth rate for the Unites States (US) and Canada during the last 15 years was 1.65% with a negative area growth rate of −1.25%, negative consumption of −1.06%, and a modest average yield of 2.97 Mg ha
−1 [
1].
Wheat genotypes with improved adaptation to abiotic stresses are required to satisfy increasing demand for more quantity and better quality of wheat products [
2], especially protein content and micronutrient density [
5]. Renewed interest in phenotypic plasticity (PP) in agronomic research led to fresh insights into the complex relationships among yield components [
6,
7]; and, their association with phenological and architectural traits, expressed, respectively, by growing degree days, GDD; and, fractal dimension, Do [
8,
9]. To assess the benefit or cost of plasticity in wheat, it is imperative to estimate the relationship between a trait plasticity and grain yield per se, as well as other traits that are associated with grain yield [
10,
11]. Grain yield depends largely on resource allocation to different parts of the wheat plant [
12,
13]. In turn, resource allocation may influence nearly all major structures and functions of the wheat plant; is affected by a range of interacting physiological pathways; is temporally variable; and, interacts with several environmental factors [
14]. Remarkably, large diversity of phenotypically plastic strategies evolved in response to changes in resource availability caused either by climate change or management practices [
15].
A wide range of phenotypically plastic strategies evolved in response to changes in resource availability for
T. durum under Mediterranean climate [
4,
16] and for
T. aestivum under continental climate [
17,
18]. Under both climates, natural selection usually favored the evolution of a phenotypically plastic resource allocation when the optimal resource allocation strategy changes due to resource availability [
12]. Differences between durum and bread wheat, which are mainly attributed to evolution under domestication, intensity of breeding and selection [
16], and eco-geographical adaption (i.e., Mediterranean vs. Continental) [
10,
19], have been documented in a few studies [
20]. However, assessment of biomass, and potential grain yield and its components (e.g., tillers, kernels m
−2 and 1000-kernel weight) in response to abiotic stresses, such as water deficit [
21] and micronutrient deficiencies [
22], are of increasing interest to wheat scientists. Grain yield of wheat under abiotic stress can be explained by traits that are fully independent of the species (e.g., durum and bread wheat) or genotypic response to stress environment [
19,
20,
23]; therefore, it is important to properly separate plasticity of constitutive (e.g., kernel weight) from adaptive (e.g., kernels m
−2), maladaptive (e.g., plant height), or neutral (e.g., days to maturity) traits in search for high yielding wheat under abiotic stress. High-yielding wheat genotypes are expected to exhibit strong PP, particularly in number of fertile tillers and spike size. Alternatively, wheat genotypes (and species, e.g., einkorn, emmer, or spelt) with a high survival rate under increasing abiotic stress, but with low PP, might be of value to farmers under future climate change [
17,
19,
24].
Phenotypic plasticity, as an antipode to stability, is a mechanism by which single plants in a crop adjust their expressed trait values in architectural and physiological functions, thereby responding dynamically to abiotic stresses that are caused by resource (in) availability, mainly light, water, and nutrients [
10,
25,
26,
27]. The classical concept of PP [
28] indicates that a range of phenotypes is produced by a single genotype under varying environmental conditions. However, the ability of different genotypes (e.g., in a landrace) that can assume the same phenotype is an alternative form of PP [
29]. In this case, a population may maintain a practical level of genetic diversity while exhibiting a relatively similar level of phenotypic expression under varying field condition. Additionally, plasticity at a population level may be used as a statistical measure of average differences among environments across genotypes [
19,
30]. Nevertheless, when expressed at a population level, plasticity is a statistical measure of how the across-genotypes phenotypic mean of a trait changes with abiotic stress [
30].
Phenotypic plasticity of wheat plants in response to abiotic stresses is important for adapting to a changing climate; therefore, future wheat genotypes need to be more flexible and adaptable to abiotic stresses and exhibit larger levels of plasticity to environmental diversity [
4,
5,
17]. Wheat plants under dryland production systems experience complex multidimensional and spatiotemporal environments, therefore, wheat scientists are keenly interested in understanding the mechanisms of plant response to single and multiple abiotic stresses [
20,
24,
31]. Resource limitations due to abiotic stress, in addition to field spatial heterogeneity, impact wheat yield, due to intra-population competition [
32]. However, common occurrence of interactions (i.e., non-additivity) between plant responses to abiotic stress (e.g., limiting water, light, and nutrients resources) [
8], and the complexity and trait-specific mechanisms of such responses make it difficult to extrapolate from single to multiple abiotic stress scenarios [
9,
33]. Additionally, recent empirical studies exploring the effects of growth stage on plasticity suggested that a plastic response at an earlier growth stage (e.g., nutrient stress at seedling stage) might adjust (in magnitude or direction) the ability of a plant or population to respond to future abiotic stress at a latter growth stage [
21,
22,
33].
The wheat phenotype is a dynamic and plastic system of successive processes of organ initiation, differentiation, resource capture, growth, reproduction, recycling of internal carbon and nutrient resources (i.e., C:N ratio as indicator of their coupling, yield), and senescence [
4,
7,
18,
34]. The remarkable stability of this performance across diverse environments and population densities in the absence of physiological stresses is a result of adaptive plasticity, or compensatory growth, of sequentially initiated and inter-dependent yield components [
6,
7,
35]. Recent reports [
7,
22] attributed the stability of wheat yield to greater plasticity of its component traits, especially harvest index (HI), which is approaching its physiological limits [
35,
36]. Since the early 1990s, almost no systematic progress in HI was achieved; therefore, future yield gains will depend more on increased biomass, which demonstrated a close association with higher grain yield [
3,
19,
24].
A larger magnitude of association between yield plasticity and maximum grain yield, as opposed to a much smaller one that is associated with minimum grain yield, indicates that larger plasticity is favored under optimal conditions, without a yield penalty under low-yielding conditions [
11,
37]; thus, negating the classical attitude towards large phenotypic diversity as a negative trait because of its association with low grain yield under low-yielding conditions [
38]. Nevertheless, genotypes with higher yield potential generally express their advantage under a wide range of suboptimal environments [
39]. Large grain yield plasticity is often associated with short plants, less lodging, more kernels m
−2, lower grain protein content (grain protein content), late maturity, and large kernel weight [
7,
37]. Associations between plasticity estimates of these traits are typically, but not always, positive. In the case of durum and bread wheat, and regardless of clear differences between these species in kernels m
−2, and kernel weight, their yield responses to abiotic stress are independent of the latter and are exclusively mediated by the former yield component [
40].
Recent advances in phenotyping made it possible to streamline quantitative measurements and qualitative description of large numbers of crop plants and their yield components [
29]. This was achieved despite negative relationships between phenotypic plasticity and heritability estimates of yield components due to the collective effects of strong environmental impact, genetic and physiological controls, and evolutionary constraints [
36,
41], which may restrict their value in breeding [
16] and agronomic applications [
41]. In such case, phenotypic plasticity, as a measure of how a wheat genotype may respond to the environment, could impact important quality traits, such as protein content and micronutrients density [
11,
42], especially of high-yielding wheat genotypes [
43].
Objectives of this study were to (1) conduct a comprehensive assessment of differences between a T. durum and a T. aestivum genotype at the reproductive and full maturity stages; (2) estimate variance components, PP, and their heritability estimates for yield, yield components, and micronutrients; (3) build calibration and validation models for micronutrient densities under abiotic stresses; and, (4) estimate regression and correlation coefficients in confirmatory factor analyses to integrate the effects at the start (no stress) and end (extreme stress) of abiotic stress six-year field experiment for each wheat genotype.
3. Results
3.1. Inter- and Intraspecific Variation in Phenotypic Plasticity
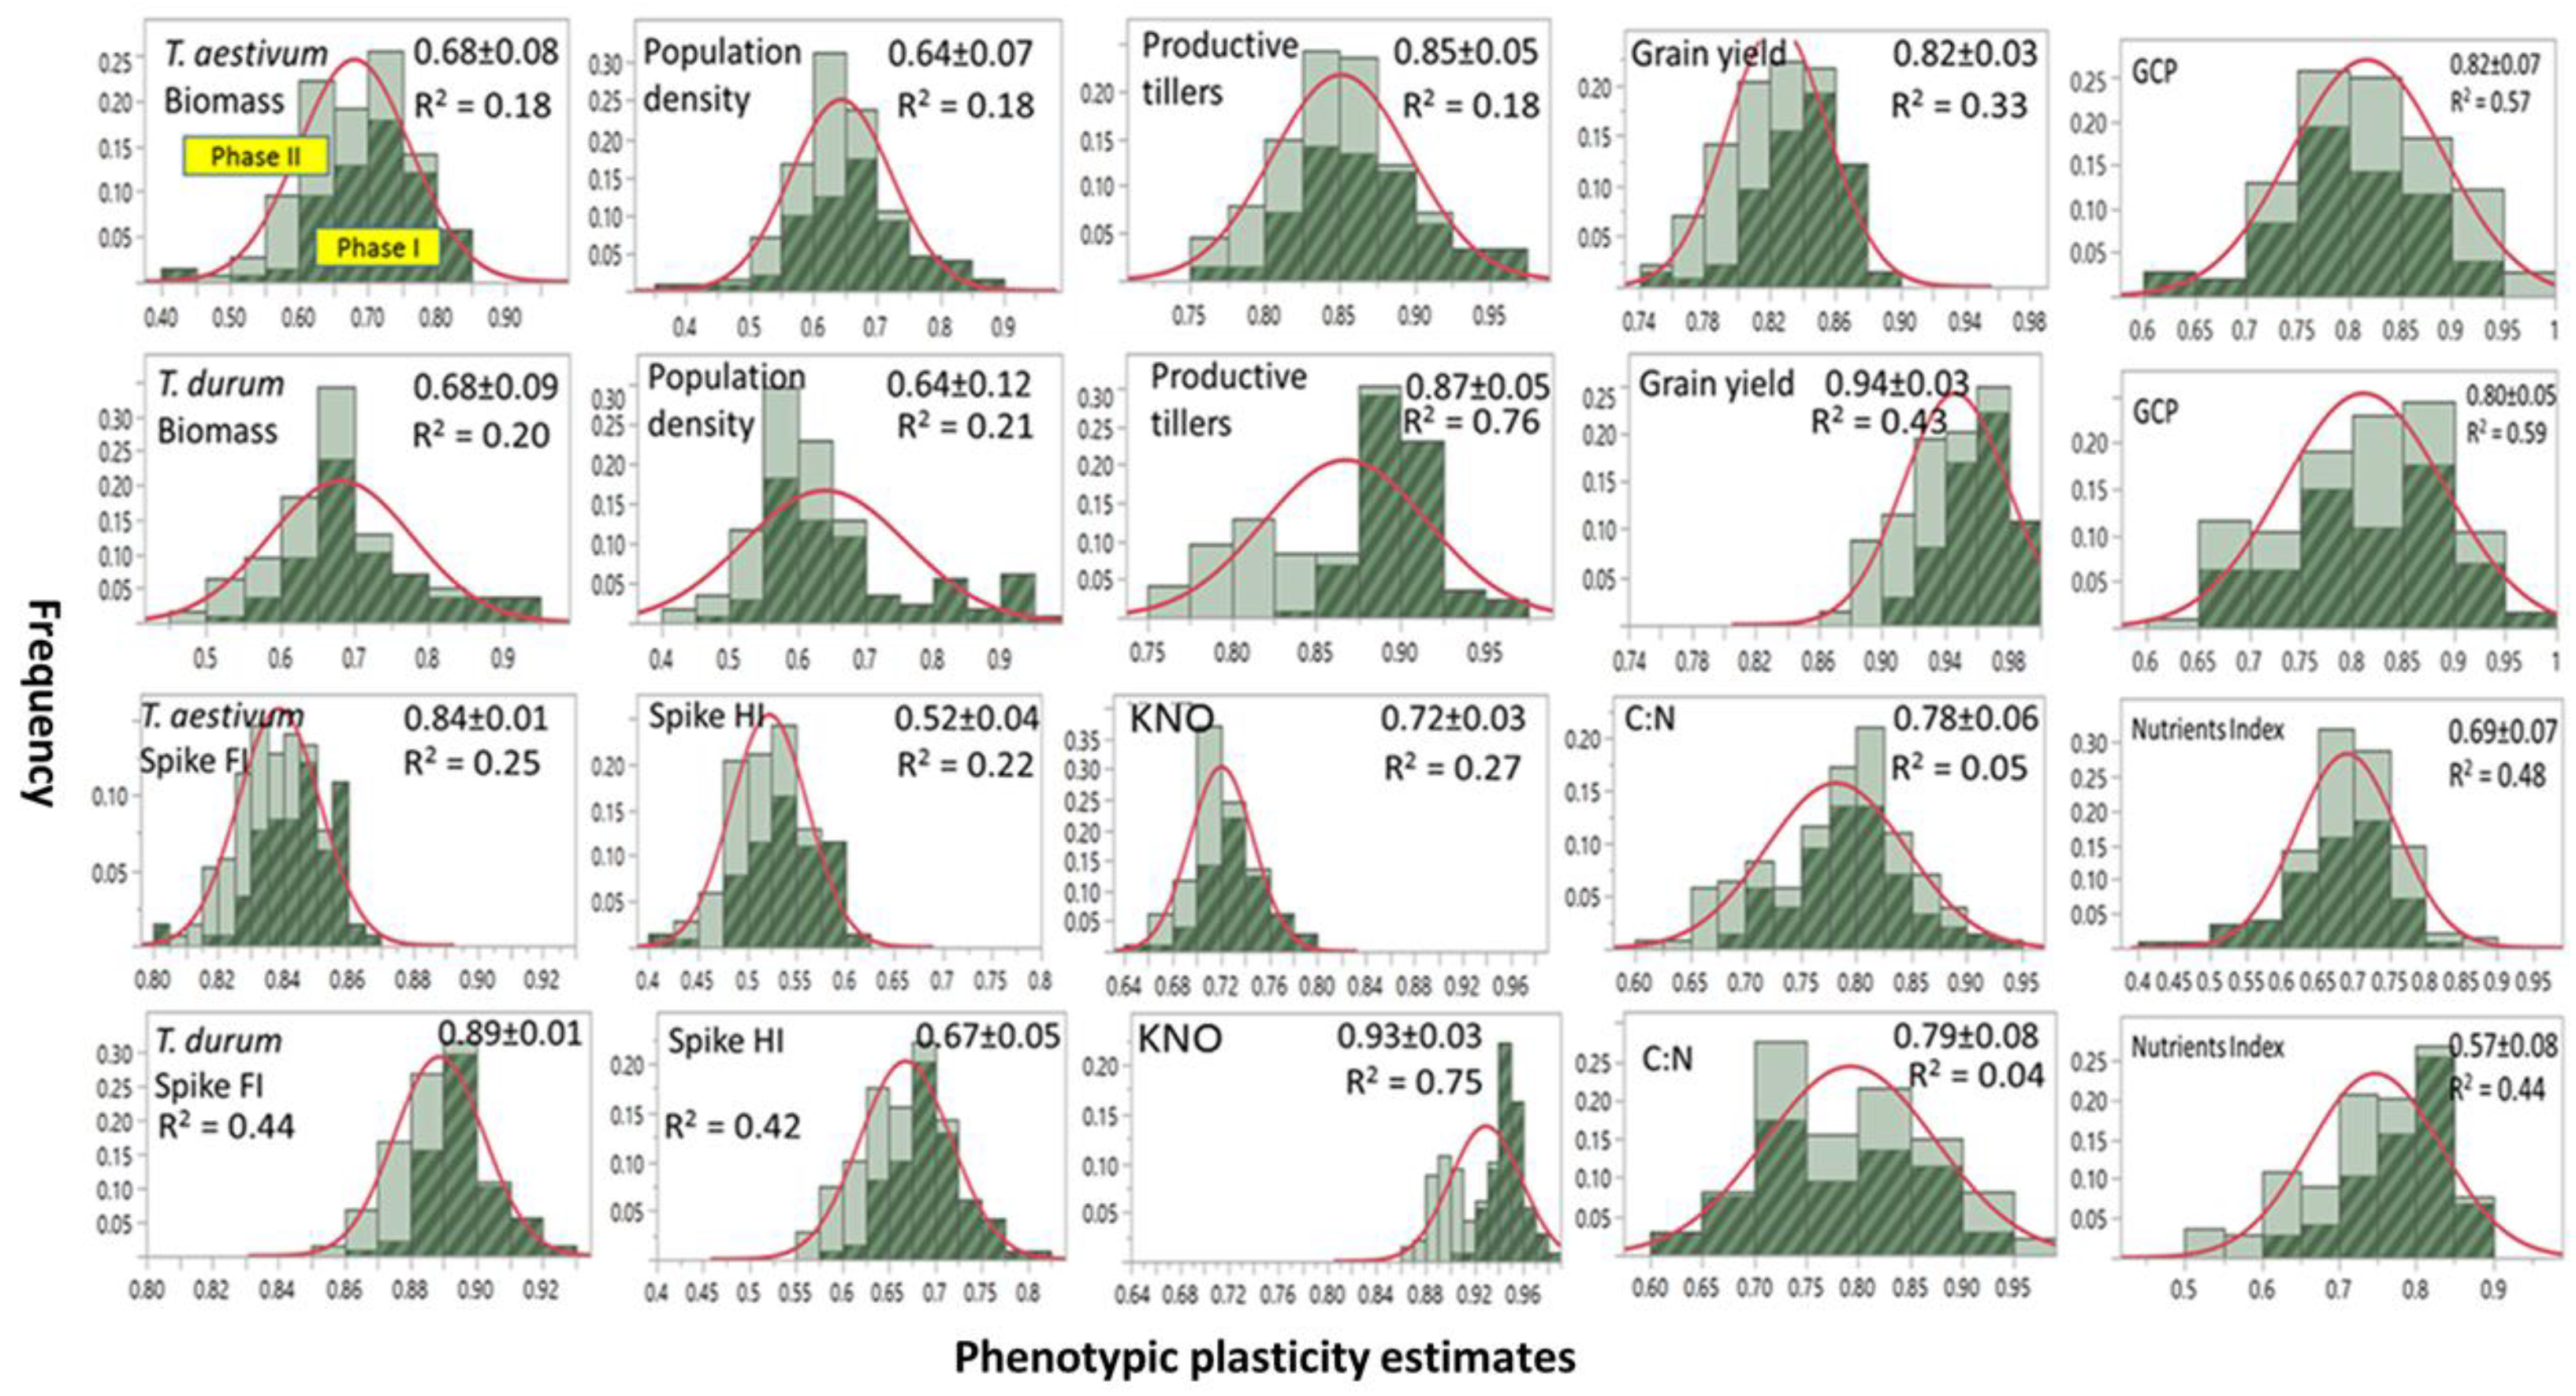
Frequency distribution, range, and mean ±SD of PP estimates of agronomic traits and micronutrients index assessed on two wheat genotypes representing
T. durum and
T. aestivum and then subjected to two stress phases are presented in
Figure 1. Included is variance estimates (
R2) accounted for by differences between abiotic stress phases. Most PPs were normally distributed when stress phases were not considered. A few PPs in
T. durum were negatively (e.g., population density) or positively skewed (e.g., grain yield, and nutrient index). Slightly larger number of mean PPs were ≤0.75 than those with mean PPs > 0.75. Both of the wheat genotypes displayed a wide range of PPs (0.40–0.90) for biomass, population density, and micronutrients. The estimates for productive tillers and grain yield had narrow ranges (0.75–0.95), and a still narrower range was found for spike fertility index in both genotypes (0.80–0.92). Large differences between wheat genotypes were found for kernels m
−2 and the spike harvest index.
Frequency distributions for most PPs differed between both stress phases. Estimates during PS I exceeded their counterparts during PS II; however, with a few exceptions (e.g., kernels m−2 in T. durum). Minimum PPs for PS II (e.g., biomass) or substantially (e.g., population density and kernels m−2 in T. durum) were slightly larger than their counterparts during PS I. These differences contributed to the small R2 (≤0.20) for biomass and population density in both genotypes. Also, they contributed to medium (0.20 > R2 ≤ 0.50) for grain yield, spike fertility index, and micronutrient index (micronutrients index in both genotypes); and, to large variance estimates (>0.50) for grain protein content in both genotypes, and for kernels m−2 in T. durum.
3.2. Assessment of Agronomic and Micronutrients PPs
Test statistics that were derived from results of a GLM analysis, level of significance, and percent significant pair-wise differences between sub-factors; phenotypic and genotypic coefficients of variation and narrow-sense heritability of PPs of agronomic traits and micronutrients of
T. aestivum and
T. durum wheat genotypes attributed to fixed single factors and their interactions in a six-year field study under abiotic stress are presented in
Table 2. The photo-thermal quotient (PTQ) was the most effective covariate, accounting for significant variances (
R2, 0.34–0.72) in PPs of agronomic traits, with the exception of spike fertility index, and kernels m
−2; the integrated soil conductivity measure (ECa) explained significant portions of variance in fertile tillers (0.21) and grain yield (0.35); while, the spatial variation, mediated by columns and rows of experimental plots as covariates, accounted for small (0.25) variance in grain yield; however, none of the covariates accounted for significant portions of variances in micronutrients index or C:N ratio.
Almost equal portions (60%) of test statistics for PPs in agronomic and micronutrient traits due to single fixed factors were significant. Most of the significant effects were mediated by differences between wheat genotypes and between stress phases; while kernels m−2 and grain protein content exhibited significant differences due to all single fixed factors. Micronutrients (and their index, but not C:N ratio) displayed significant differences due to single fixed factors; with a few exceptions (e.g., Fe, Mn, and micronutrients index due to stress phases and abiotic stress treatments). Two-way interactions significantly affected 91% of agronomic traits PPs. Different reactions of wheat genotypes to abiotic stress resulted in significant differences for all agronomic traits, followed by their interaction with stress phases and with growth stages. Significant differences due to interaction of growth stage with abiotic stresses were limited to biomass, population density, kernel weight, and grain protein content. Almost all PPs for the micronutrients index and micronutrients index, as well as C:N ratio, displayed significant differences due to two-way interactions; the only exceptions were Fe and Zn in response to growth stage × abiotic stress. Three-way interactions were less effective in significantly affecting all PPs (34%); however, larger portion of agronomic trait PPs (71%) when compared to a smaller portion of C:N were not significantly affected by these interactions; while all PPs for the micronutrients index were significantly affected by all three-way interactions.
Summary statistics of the GLM analysis indicated that the mean of response (i.e., estimated PPs) ranged from a minimum of 0.59 (spike harvest index) to a maximum of 0.88 (grain yield). However, the model accounted for a minimum of 0.69 (micronutrients index) to a maximum of 0.98 (kernels m−2) of variation (adjusted R2) in PPs of all traits; the majority of which were >0.80. Percent change in PPs of both wheat genotypes due to maximum abiotic stress (SH during SPII) when compared with their estimates due to NN during SP I were larger for agronomic traits as compared to micronutrients index; while, both genotypes displayed similar trends with a few exceptions. Triticum durum experienced slightly more reductions than T. aestivum in most agronomic trait PPs (−15.2 ± 1.6 for spike harvest index to −40.2 ± 9.2 for biomass); while, the slight increases in nutrients and C:N ratio were comparable. Four agronomic traits (BM, PD, FT, and GY) had larger PCV and GCV values (18.6 to 29.9) for PPs than those for micronutrients index (8.3 to 18.6). Most PCV estimates were larger than their GCV counterparts, while no clear trend can be detected between both wheat genotypes. Narrow-sense heritability estimates (h2) were larger for agronomic traits (56.8% to 88.9%) than for micronutrients and their index (34.6% to 52.8%) PPs; while, the largest estimates were those for C:N in both genotypes.
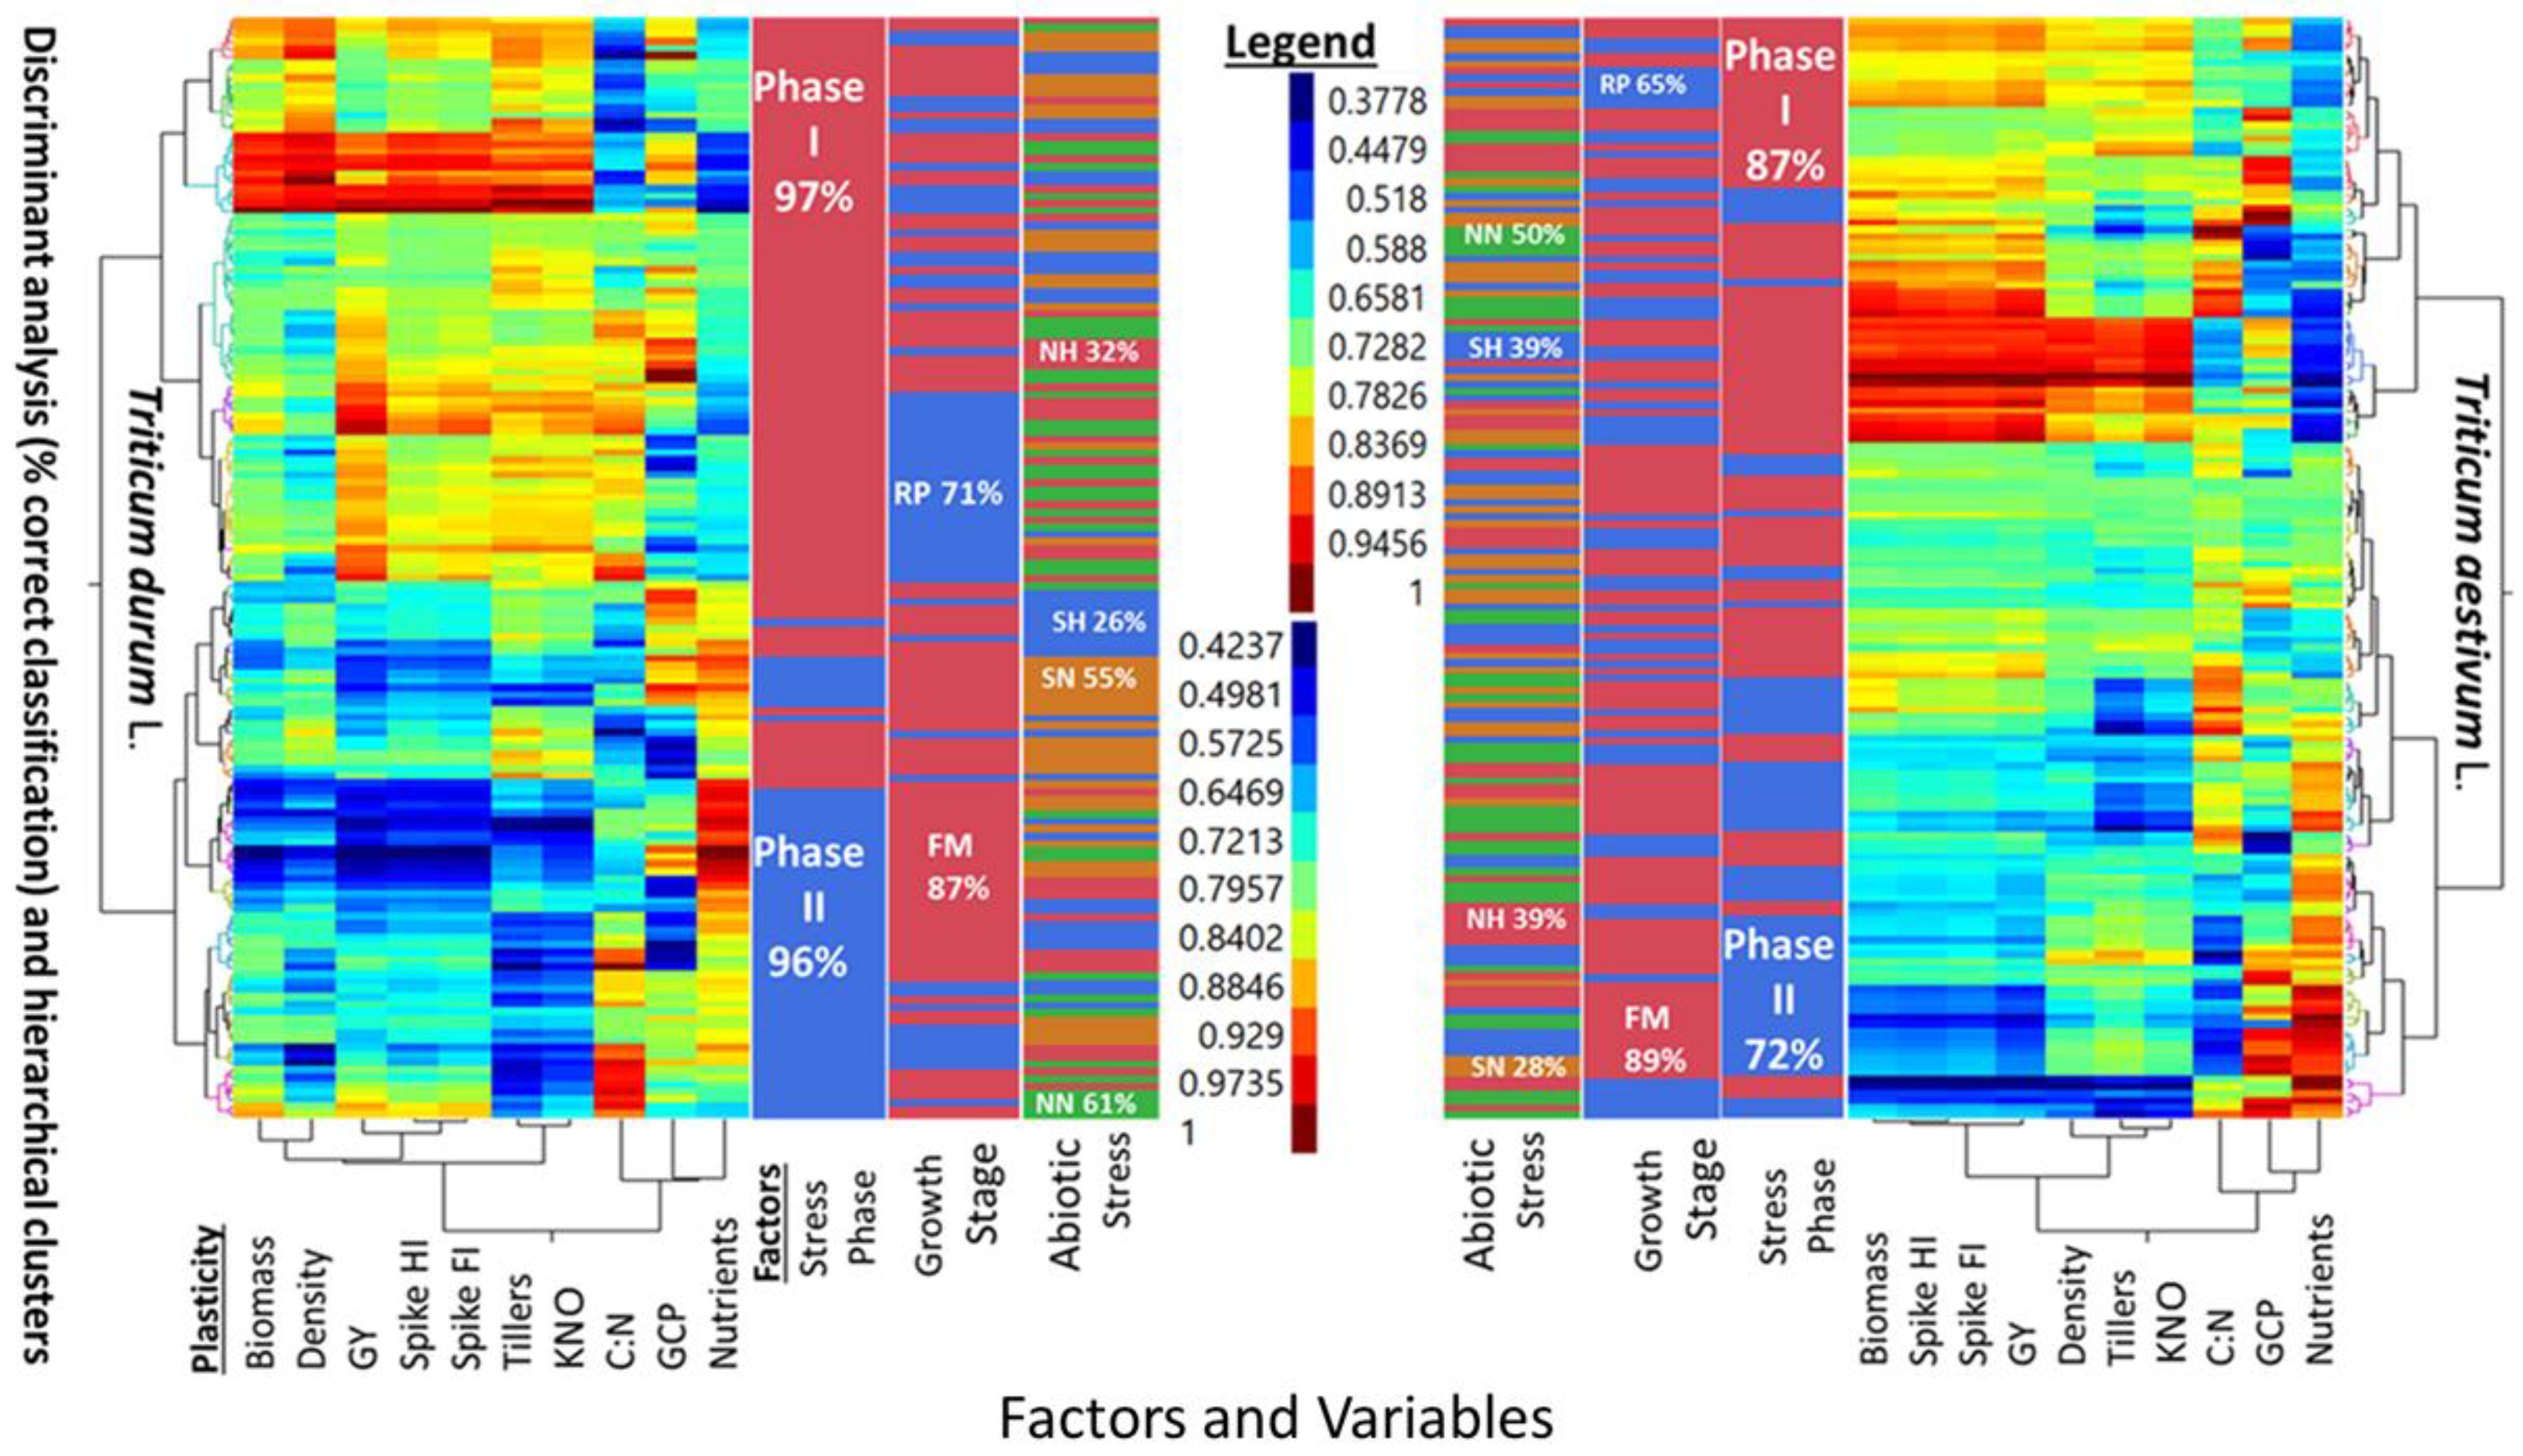
Five-way cluster analyses of PPs in two wheat genotypes (
T. durum and
T. aestivum), and discriminant analysis (i.e., percent correct classification) of two stress phases (SP I and SP II), two growth stages (reproductive, and full maturity), and three levels of abiotic stress (NH, SN, SH) as compared to a no-stress control (NN) are presented in
Figure 2. Similarities and differences between the two wheat genotypes can be deduced from the multi-way, multi-variate clustering and discriminant analyses of PPs for agronomic traits, in addition to the micronutrients index and C:N ratio. The PPs legend indicated similar ranges for both wheat genotypes. However, PPs clustered with slightly different configurations in each genotype. Two main clusters in
T. aestivum were composed of biomass-population density-kernels m
−2 -micronutrients index, and fertile tillers-grain yield-spike fertility index-C:N, with spike harvest index in between; the two corresponding clusters in
T. durum were composed of biomass-spike harvest index-population density-C:N, and fertile tillers-spike fertility index-grain yield-kernels m
−2, with C:N and micronutrient index in between. Numerous combinations of two, or more small, medium, and large PPs can be visualized in these clusters. A few PPs were uniform in
T. aestivum (e.g., spike harvest index at the lower scale, and spike fertility index at the intermediate scale) and in
T. durum (e.g., population density at the lower scale and both kernels m
−2 and grain yield at the largest scale). Discrimination between levels of three factors, superimposed upon these clusters, suggested that differences between both genotypes whether considering one, two, or all three factors were large. Percent correct classification of these factors decreased in the same order in both genotypes. Stress phases were 87% and 72% correctly classified in
T. aestivum, and 97% and 96% in
T. durum. Percent correct classification of reproductive phase in
T. aestivum (65%) and
T. durum (71%) were smaller than the respective values for full maturity (89% and 87%) growth stages. The smallest correct classifications were those of abiotic stresses; the largest in both genotypes was NN (50% and 61%), followed, in decreasing order by NH and SH (39% each), then by SN (28%) in
T. aestivum, and by SN (55%), NH (32%), and SH (26%) in
T. durum.
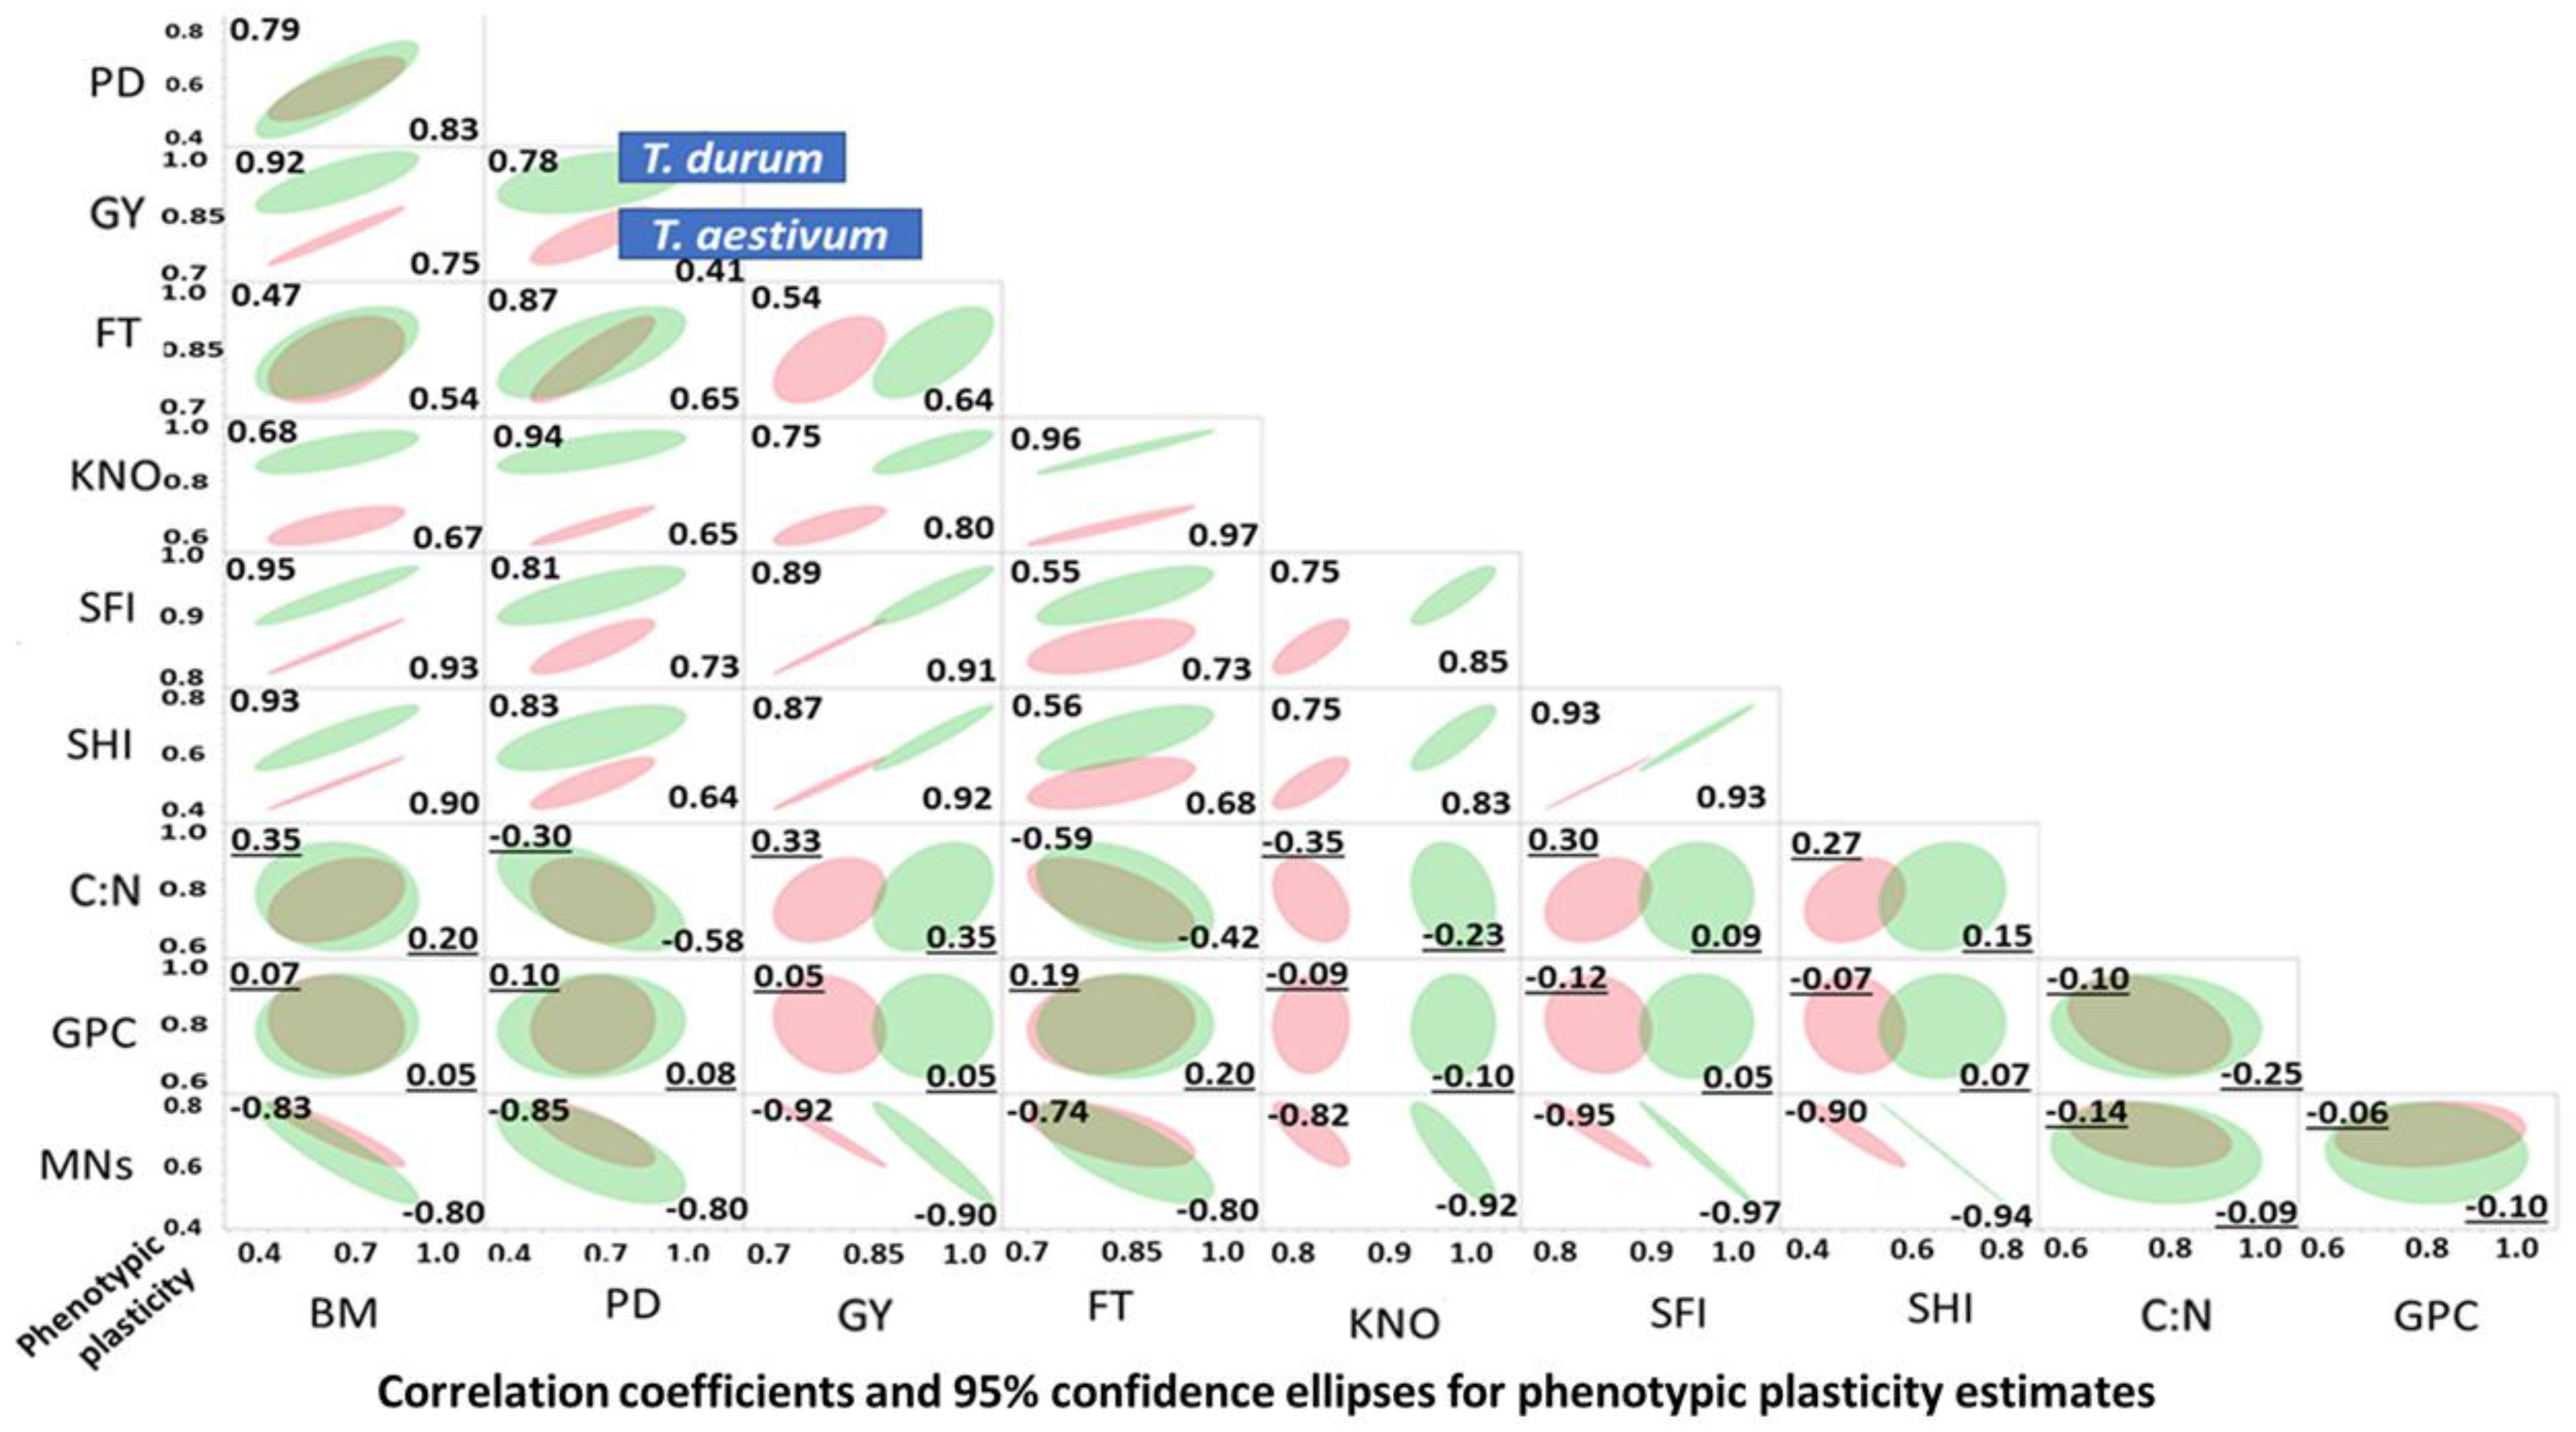
Results of the graphical discriminant analysis, quantitative description of bivariate distributions (95% ellipsis), and associations between PPs of agronomic and micronutrient traits in
T. durum (red) and
T. aestivum (green) subjected to abiotic stress are presented in
Figure 3. The 95% joint ellipses suggested that the PPs were largely (67%) uncoupled; while, the remaining 33% were either totally or almost totally overlapping. Most uncoupled distributions have PPs of kernels m
−2, spike harvest index, spike fertility index and grain yield involved in bivariate associations with other traits. Most bivariate associations, where the 95% confidence ellipsis of both wheat genotypes overlapped, included PPs of grain protein content with each of BD, population density, PT, C:N, and nutrients index. In these, and some other bivariate distributions, the 95% confidence ellipsis of
T. durum was encompassing those of
T. aestivum. Positive and negative bivariate associations between PPs comprised 33.3 and 20.0% of all bivariate associations, respectively.
Bivariate relationships between trait PPs ranged from 0.0 to >0.90, with a few being negative but not significant. Most negative correlations involved C:N, grain protein content and nutrient PP estimates. Close to half (47.0%) of all correlation coefficients for T. durum and T. aestivum were positive and significant; 18% and 22% were positive but not significant, respectively; 18% and 20% were negative and significant, respectively; and, the remaining 17% and 11% were negative, but not significant, respectively.
3.3. Ontogeny’s Impact on PPs
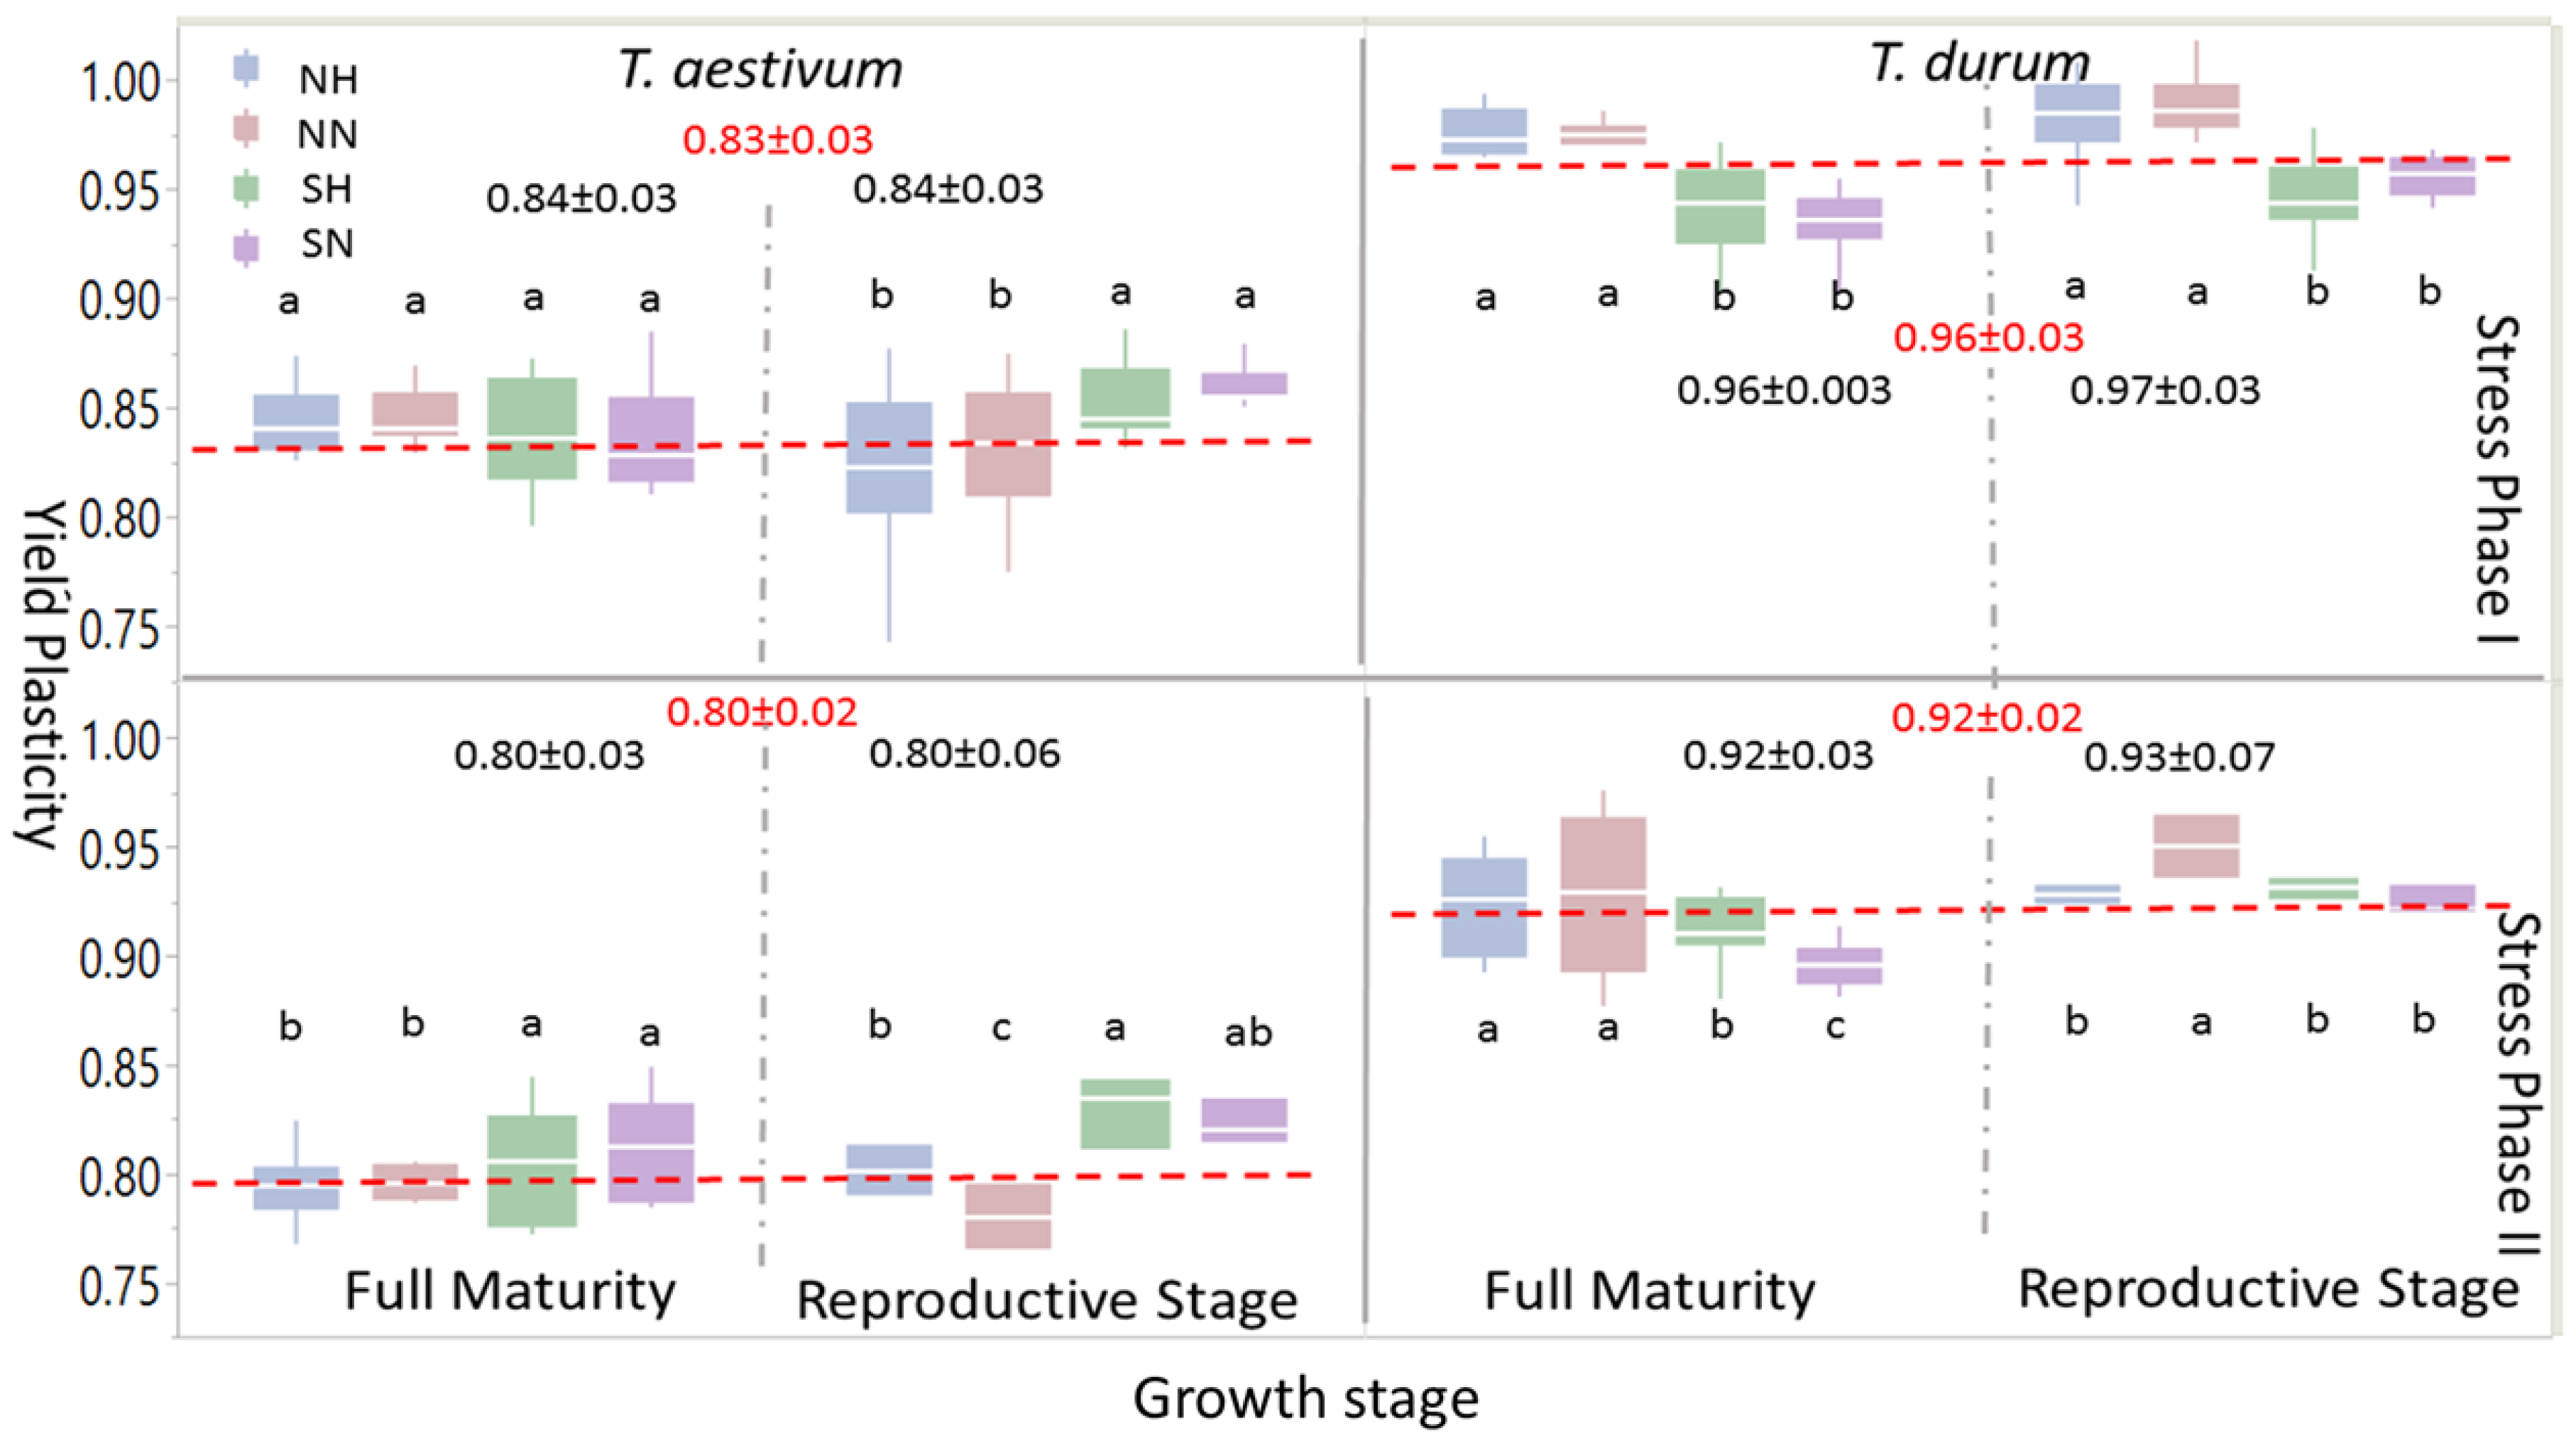
Box-plots and mean separation between PPs of grain yield (
Figure 4) indicated some similarities at the large scale, but many differences when different levels of abiotic stress (i.e., abiotic stress treatments: NH, NN, SH, and SN) were considered. When one or both stress phases were considered, PPs for grain yield were significantly larger in
T. durum than
T. aestivum; the same trend was observed at growth stages within the stress phases. However, within each wheat genotype, levels of significant differences between abiotic stress treatments at each maturity stage presented variable statistics and significant differences followed, to some extent, the trend of the 95% confidence intervals around the mean in each case. During the reproductive phase, significant differences were found in
T. aestivum during SP I between SN and SH, on one hand, and NN and NH, on the other; these differences, however, disappeared at full maturity; whereas, the larger significant differences between PPs of abiotic stress treatment at the reproductive phase during PS II persisted at full maturity, with SN and SH being significantly larger than NH and NN. During SP I and SP II, significant differences between abiotic stress treatments persisted during both of the growth stages in
T. durum. However, PPs for grain yield due to short growing season with normal or high population densities (SN and SH, respectively), unlike
T. aestivum, were significantly smaller than those attributed to NN and NH.
Most micronutrients index PPs in
T. durum were larger than their counterparts in
T. aestivum, with significant differences at SP II and at both growth stages (
Figure 5). Abiotic stress levels at the reproductive phase within SP I were more variable in
T. durum than their counterparts in
T. aestivum, especially for NN and NH. This large variability persisted in NN for
T. aestivum at full maturity during both stress phases, and for
T. durum at full maturity during SP II.
Significant differences between abiotic stress treatments in T. durum were minimal at full maturity under SP I and maximal under SP II. Respective cases for T. aestivum were during the reproductive phase and full maturity during SP I. Comparisons between population density at the same level of length of growing season, or alternatively between length of growing season at the same population level provided insights into interactions between these levels at the same or at different growth stages in one or both wheat genotypes. For example, estimates of extreme abiotic stress (i.e., SH) differed significantly from the control (i.e., NN), except at the reproductive phase of T. aestivum during SP II; while, NH and SH, for example, expressed significant differences for all comparisons, except at the reproductive phase during SP II in T. durum.
3.4. Modeling Phenotypic Plasticity
3.4.1. Wheat Genotypes
Results of the partial least squares regression (PLSR), factor analyses, prediction of micronutrients as functions of PPs, multivariate distances, and matrix correlations between predictors and between the predicted variables for
T. aestivum and
T. durum under two abiotic stress phases are presented in
Table 3. In
T. aestivum, the PLSR1 component of the calibration model extracted a wide range of variation (
R2X PLSR1: 0.08 to >0.80) in dependent variables and accounted for 0.57 of validation variance (
Q2Y). Comparable values were obtained for
T. durum; however, with a slightly larger
Q2Y (0.63). Loadings of nine predictors on two independent factors explained 0.94 and 0.92 of total variation in
T. aestivum and
T. durum, respectively. Loadings on each Factor of a varimax rotated matrix of these variables identified some differences between wheat genotypes, especially for population density, fertile tillers, kernels m
−2, and C:N ratio. Most PLSR model coefficients for centered and scaled data were negative; however, those for grain protein content were the exception in their magnitude and positive effect. The matrix correlation coefficient between predictor variables of
T. aestivum and
T. durum was smaller (0.53) and not significant (
z = 0.21) when compared with the larger (0.65), and significant (
z = 0.05) one between nutrient matrices. In addition, PLSR1 accounted for comparable
R2Y variances in Fe and Zn, but different variances in Cu and Mn when wheat genotypes were considered. The C:N ratio, besides its negative effects on most micronutrients in both genotypes, exhibited different, but mostly negative and significant relationships with PPs of these micronutrients, with a clear difference between the wheat genotypes for Mn.
Functional relationships, as quantified by the RMA slope (±s.e.) between micronutrients in both wheat genotypes ranged from 0.55 ± 0.04 for Mn, to 1.10 ± 0.04 for Cu, which was the only value significantly above 1.0 and a large Jackknifed R2 of 0.74 ± 0.03. The multivariate distance between both wheat genotypes (D2 = 451.8) was significant (p < 0.0001) and it was supported by the significant F-value for univariate test between genotypes (0.01) and the F-value for multivariate tests between independent variables (0.04), which, when combined, accounted for 0.46 of the total variation.
3.4.2. Stress Phases
Results of PLSR, Factor Analyses, prediction of micronutrients as functions of PPs, multivariate distances, and matrix correlations between predictors and between predicted variables for two stress phases (PS I ad PS II) are presented n
Table 4. At the calibration model stage, PLSR1 extracted small (0.07 and 0.02) to large (0.90 and 0.84) portions of variation in individual predictors, explained large portions of variation (
R2Y) in all micronutrients, except for Cu, and accounted for similar validation variances (
Q2Y) under PS I (0.74) and PS II (0.74). Coefficients of the PLSR model for centered and scaled data were mostly negative (83.3%), except those for spike fertility index (Cu), kernels m
−2 (Cu and Fe), and grain protein content (Cu, Fe, and Zn) during SP I; while, 38.9% of those coefficients were positive during PS II. Coefficients of biomass and C:N were generally larger in magnitude than most others for both of the stress phases. The rotated varimax loadings of two factors composed of independent variables explained 0.86 and 0.76 of total variation under SP I and SP II, respectively; these loadings differed in magnitude between the stress phases, especially for population density, fertile tillers, grain protein content, and C:N. Large differences were found between SP I (−0.06 to −0.22) and SP II (−0.81 to 0.42) in the magnitude and significance of C:N correlations with micronutrients.
Functional relationships between micronutrients under both stress phases were larger than 1.0, except Cu; however, the Jackknifed R2 estimates were uniformly small (0.13–0.18). Overall, differences between SP I and SP II (p < 0.01) and between predictors (p < 0.05) were significant; while, the whole model accounted for only 0.44 of total variation. Predictor matrices were not significantly correlated (r = 0.57; z = 0.18); while, micronutrients matrices were significantly correlated (r = 0.83; z < 0.01) and the multivariate distance (D2 = 68.9; p < 0.001) separating both stress phases was significant.
3.4.3. Growth Stages
Multiple comparisons between
T. aestivum and
T. durum at the reproductive phase (anthesis + 15 days) and full maturity growth stages, while using multivariate statistical analyses procedures identified similarities and a few differences between these growth stages (
Table 5). The PLSR calibration model, with the exception of the C:N ratio, extracted large and almost uniform amounts of variation (0.36 for PT to 0.90 for spike fertility index in reproductive phase, and 0.24 for population density to 0.86 for spike harvest index in full maturity) and accounted for 0.70 and 0.68 of validation variances in reproductive phase and full maturity, respectively. On the other hand, the variance portion in micronutrients explained by the model was extremely small for Cu, while it was large (>0.65) for other micronutrients.
The majority of PLSR model coefficients for the reproductive phase (75.0%) and full maturity (80.6%) were negative, with clear differences between most Cu-coefficients between growth stages. Model coefficients for centered and scaled data, especially those for grain protein content, displayed some differences between growth stages. At full maturity, larger (more negative) coefficients were observed for biomass; while, those of grain protein content were positive and larger than their counterparts at the reproductive phase.
The structure, loadings, and amount of variation explained by two independent Factors for reproductive phase and full maturity growth stages were remarkably similar, except for a positive loading of C:N on full maturity-Factor 1. Total variation explained by both factors was 0.83 and 0.81 for reproductive phase and full maturity, respectively. The C:N relationships with micronutrients at the reproductive phase were significant, negative, and for all micronutrients, except Cu, specific for each growth stage, except with Cu. Strong and negative relationships (−0.25 to −0.39; p < 0.05) were found between C:N and each of Fe, Mn, and Zn at reproductive phase, but not at full maturity. Non-significant differences were found between growth stages (p = 0.46) and between predictors (p = 0.32), while the model accounted for a small portion (R2 = 0.26) of total variation. All of the slope estimates in the RMA functional relationship model were >1.1, while only Cu had a large (0.65) Jackknifed R2. Correlation coefficients for both sets of matrices were large (r > 0.90) and significant (z < 0.0001), while both growth stages were separated at a small (D2 = 6.7), but significant (p < 0.01) multivariate distance.
3.4.4. Abiotic Stress Treatments
Multiple comparisons were performed between two abiotic stress levels (NN: normal length of growing season and normal population density, and NH: normal length of growing season and high population density;
Table 6) and between the contrasting abiotic stress treatments (i.e., SN: short growing season and normal population density, and SH: short growing season and high population density;
Table 7). The NN-NH stress treatment comparison represents the single effect of high population density; while, the SN-SH stress treatment comparison represents the single effect of short growing season and its joint effect with high population density. Coefficients of the calibration PLSR-1 model were comparable, and they accounted for similar validation variances for both of the stress treatments. Most (75.0%) of the PLSR model coefficients for centered and scaled data were negative in both stress treatments; fertile tillers had the largest negative (Cu, −0.377), while grain protein content the largest positive (Cu, 0.305) coefficients in NN and NH stress treatments, respectively.
Similarities between NN and NH at several levels of comparison are illustrated in the almost identical loadings of independent variables on, and variance proportion accounted for, by Factor 1 (0.56 and 0.55) and Factor 2 (0.30 and 0.34), respectively. Correlation coefficients between C:N and micronutrients were typical of the majority of values encountered in previous analyses, with non-significant relationships with Cu, and negative and mostly significant relationships with the remaining nutrients. The functional relationships between micronutrients indicated that only the RMA slop for Cu did not differ significantly from 1.0 (1.08 0.04); however, all of the Jackknifed R2 estimates were exceptionally large. Based on univariate (p = 0.09) and multivariate (p = 0.11) statistical tests, there were no significant differences between NN and NH. This conclusion was supported by the large correlation coefficients between matrices of predictor variables (r = 0.91) and between nutrient matrices (r = 0.98); both of which were highly significant (z < 0.0001); nevertheless, NN and NH were separated by a small, but significant multivariate distance (D2 = 3.47; p < 0.05).
Comparisons between SN and SH (
Table 7) indicated that the calibration PLSR-1 model coefficients were almost similar in magnitude; the model extracted ≤0.50 of variation (
R2Y) in each dependent variable in SN, and slightly >0.60 of total variation in Fe and Zn for SH, while, validation variances (
Q2Y) were 0.65 and 0.62 for SN and SH, respectively. Coefficients for centered and scaled data for each abiotic stress treatment were comparable in magnitude; the majority of which were negative in SN (77.8%) and SH (80.5%), with biomass exerting the largest negative effects on Fe and Zn. However, a few of the remaining coefficients were positive but small in magnitude (e.g., kernels m
−2), while others were relatively large (e.g., grain protein content).
Independent variables in SN and SH that were loaded on two independent Factors with almost the same patterns, except for C:N, and explained 0.79 and 0.82 of total variation, respectively.
Relationships between C:N and each of the micronutrients were small in magnitude and non-significant, except for Mn in SN (r = 0.28; p < 0.05). Level of significance for univariate (p = 0.08) and multivariate (p = 0.03) statistical tests indicated that differences between the independent variables were significant, while those between SN and SH were marginally significant. The functional relationships between micronutrients due to both abiotic stresses indicated that all RMA slopes differed significantly from 1.0, except for Fe (1.12 ± 0.11); however, the only large Jackknifed R2 estimate (0.63) was found for Cu. Matrix correlation between predictor variables and between micronutrients were both large (r = 0.90) and significant (z < 0.0001), but the multivariate distance separating SN and SH (D2 = 1.39) was not significant (p > 0.05).
3.5. Confirmatory Factor Modeling of PPs
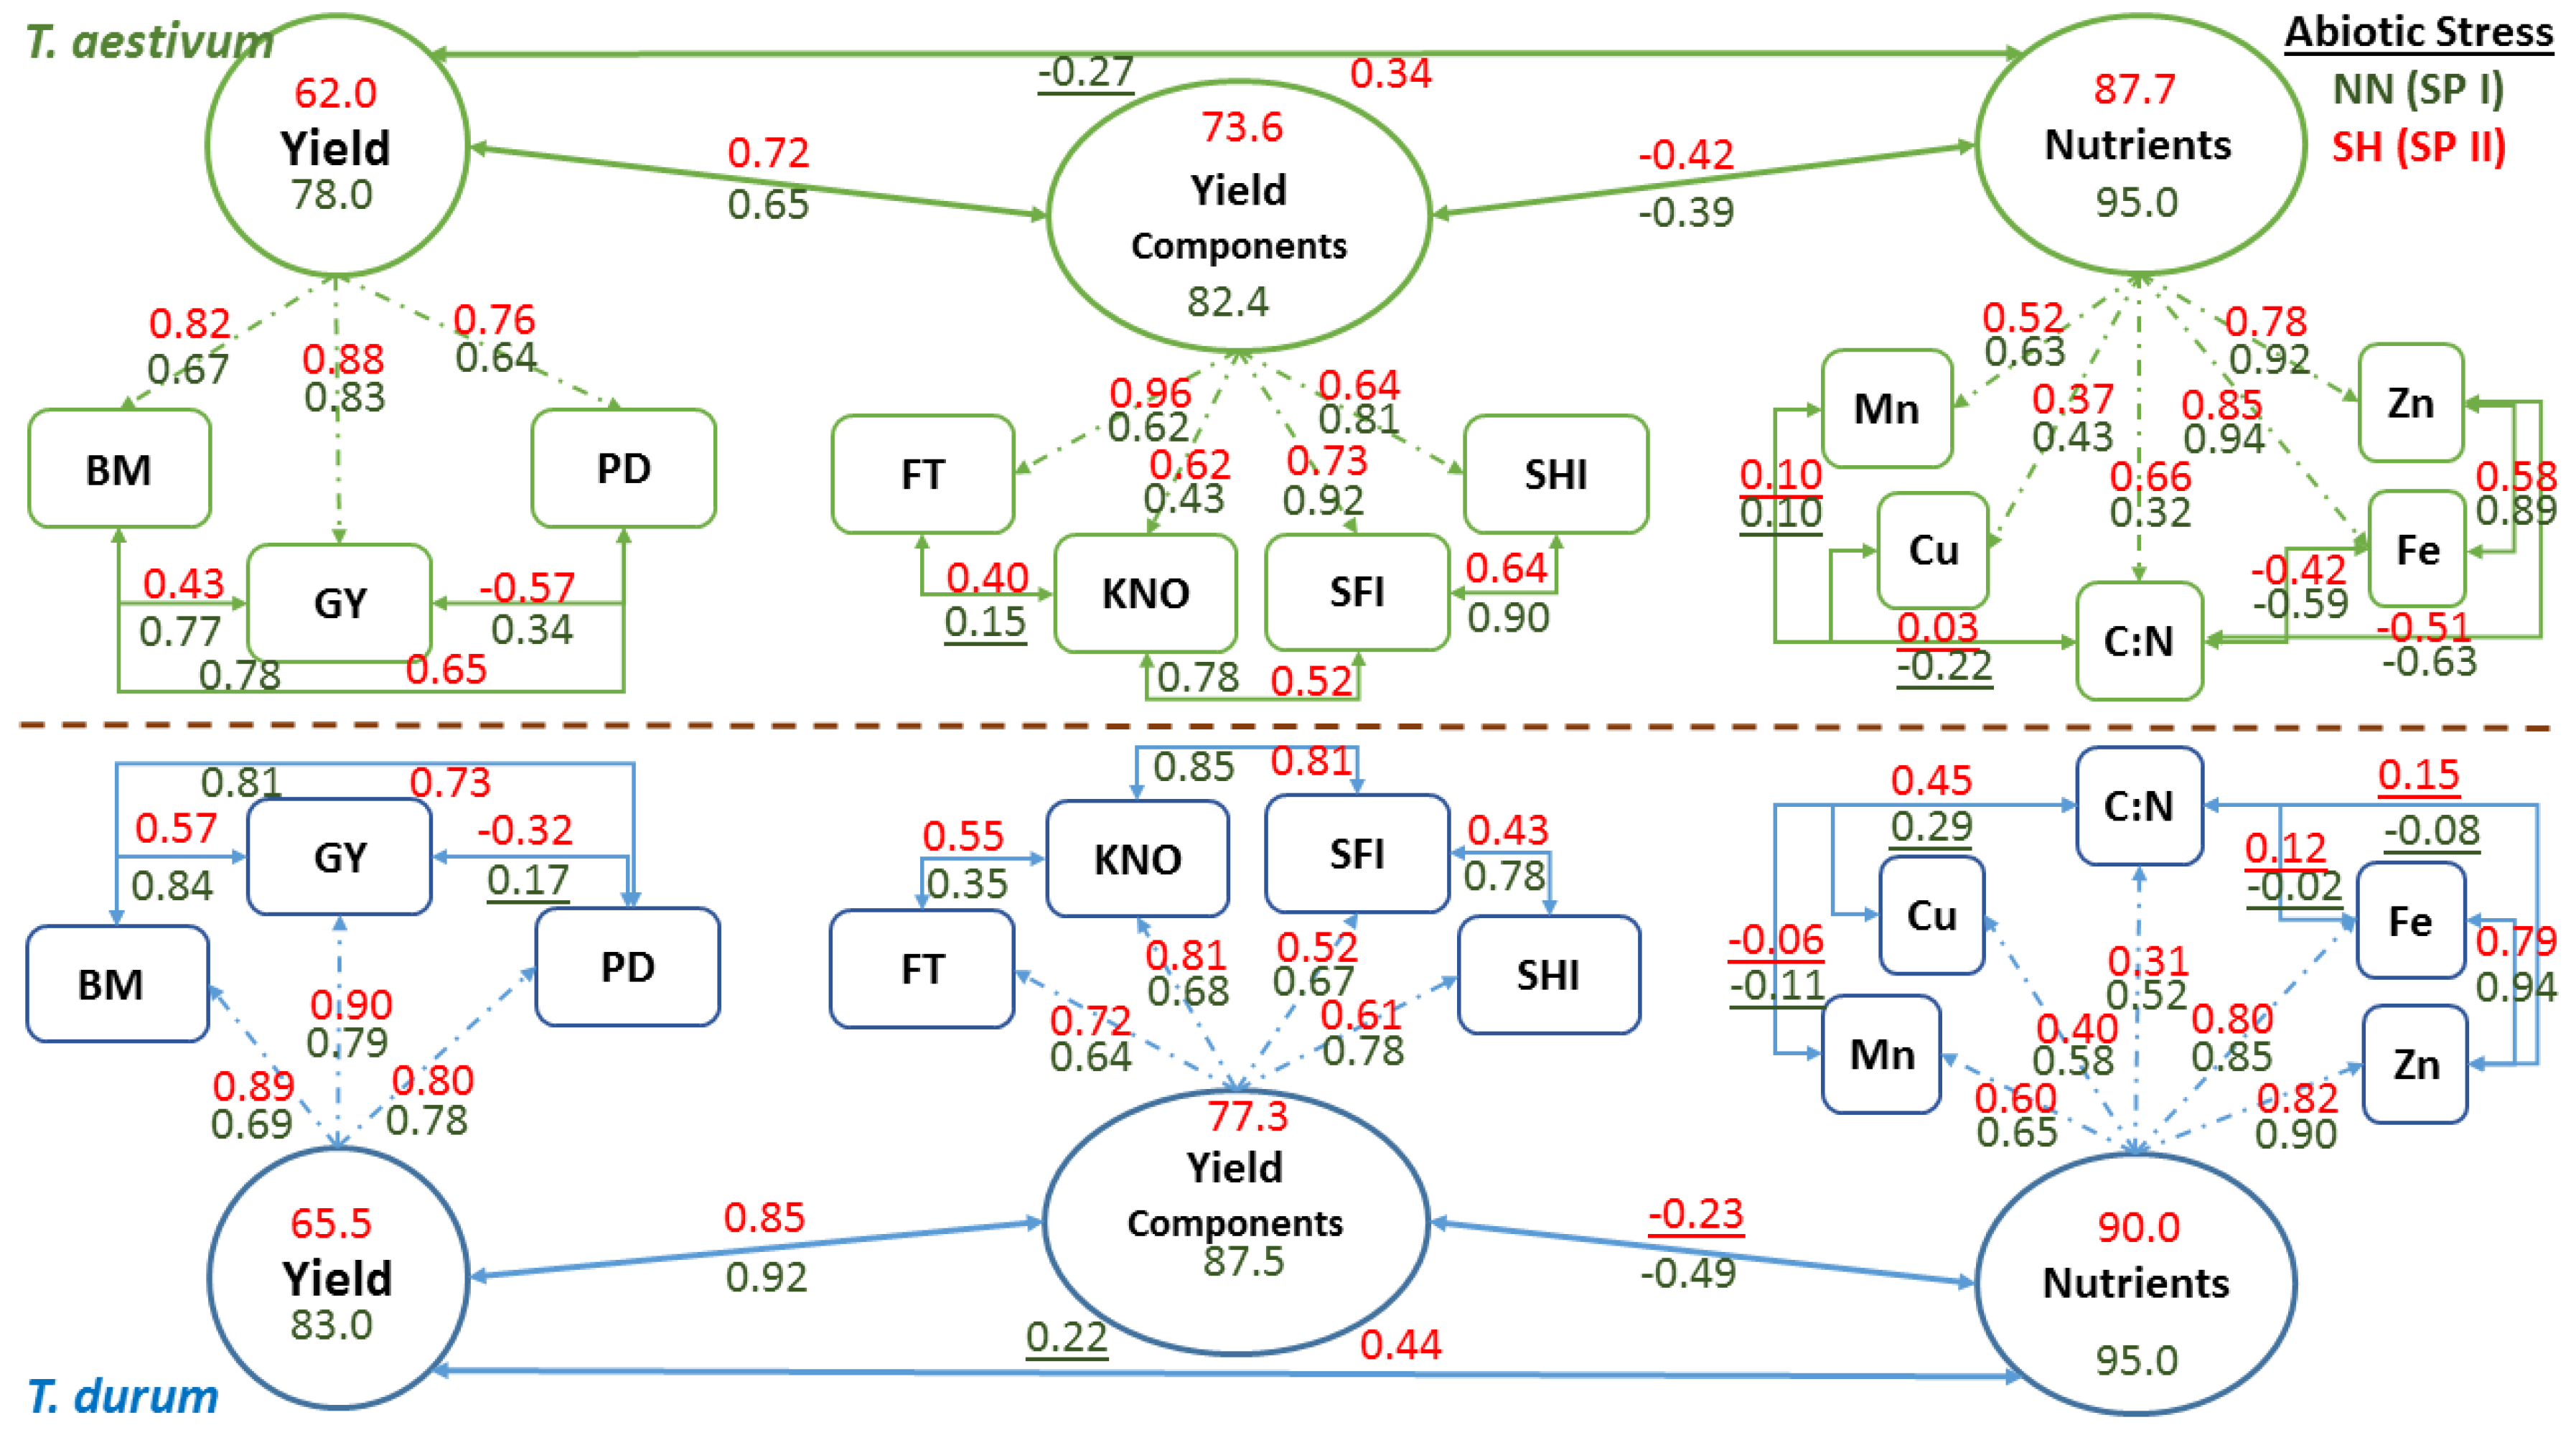
Schematic representation of confirmatory factor analysis that is based on path coefficients (arrows with single heads) relating latent variables (oval shapes: nutrients, yield components, and yield) with observed variables (rectangle shapes), correlation coefficients between observed variables, and variance in latent variables explained by observed variables in two wheat genotypes representing
T. durum and
T. aestivum, at the end of stress phase II (SH-SP II) under maximum abiotic stress (SH, short growing season and high population density) as compared to the control at the end of stress Phase I (NN, normal length of growing season and normal population density; NN-SP I) are presented in
Figure 6. Both wheat genotypes displayed similar trends in magnitude and direction of path and correlation coefficients of PPs within each CFA and for each latent variable at the start (NN-SP I) and the end (SH-SP II) of the experiment. Relatively small reductions in
R2 estimates (i.e., variance in latent variables, as explained by observed variables) of micronutrients (micronutrients index; from 0.95 to 87.7 for
T. aestivum; and from 95.0 to 90.0 for
T. durum) and yield components (yield components; from 82.4 to 73.6 in
T. aestivum, and from 87.5 to 77.3 in
T.durum), as latent variables, were found when compared with the large drop in
R2 estimates for grain yield (from 78.0 to 62.0 in
T. aestivum, and from 83.0 to 65.5 in
T. durum) in both wheat genotypes. Relationships between latent variables followed the same trend, whereby the micronutrients index and yield components were negatively correlated but their coefficients differed in magnitude between wheat genotypes. The same trend was found for relationships between grain yield and yield components, and between grain yield and micronutrients index; however, the double abiotic stress treatment (SH) resulted in major shifts in these relationships.
Relationships between PPs of micronutrients and those of C:N were highly variable and mostly changed magnitude depending on wheat genotyp and the level of abiotic stress. Micronutrients expressed negative and large r values between Fe and Zn with C:N in T. aestivum, but not in T. durum. Nevertheless, relationships among micronutrients were almost consistent in both wheat genotypes and declined in magnitude for SH-SP II as compared with NN-SPI. Path coefficients were larger for Fe and Zn, as compared to Cu and Mn in both wheat genotypes; however, C:N had the smallest path coefficients and their values exhibited opposite trends in wheat genotypes. Relationships between yield components and their path coefficients with their latent variable showed similar trends at both of the stress stages and for both wheat genotypes. All of the relationships between PPs of yield components were positive; their magnitudes declined at SH-SP II, especially between spike harvest index and spike fertility index; both of which had the smallest path coefficients with the latent variable in T. durum. Relationships between observed variables contributing to Yield, as a latent variable, were positive and significant, except those between population density and grain yield. Path coefficients, invariably, increased in magnitude at SH-SP II when compared to their original values at NN-SP I.


