Article

Can Faba Bean Physiological Responses Stem from Contrasting Traffic Management Regimes?

by
Kris G. Guenette
and
Guillermo Hernandez-Ramirez
*
Department of Renewable Resources, 454 Earth Sciences Building, University of Alberta, Edmonton, AB T6G 2E3, Canada
*
Author to whom correspondence should be addressed.
Agronomy 2018, 8(10), 200; https://doi.org/10.3390/agronomy8100200
Submission received: 4 August 2018 / Revised: 11 September 2018 / Accepted: 15 September 2018 / Published: 21 September 2018
(This article belongs to the Special Issue Crop Evapotranspiration)

Abstract

:
Our study examined how faba beans (Vicia faba L.) grown in soil conditions that simulate common traffic management regimes and water availabilities displayed alterations to their physiological state. Physiological changes were tracked through plant and sensor-based measurements, such as evapotranspiration, water use efficiency, aboveground biomass, stomatal conductance, and normalized difference vegetation index. A greenhouse experiment comprised of faba beans were sown into pots of two different soil types that were separated by treatments of dry bulk density and volumetric water content. The compaction treatment with a bulk density of 1.2 g cm−3 coupled with a volumetric water content of 41% displayed more favorable changes to the physiological state of the faba beans than the contrasting treatment of 1.4 g cm−3 bulk density at 33% volumetric water content. Handheld sensor-based measurements, such as the normalized difference vegetation index, exhibited a strong correlation with faba bean biomass production. Furthermore, the stomatal conductance was able to reveal plant water stress and capture evapotranspiration responses. Conclusive observations showed that increasing soil compaction restricted plant productivity. However, the presence of high water content was shown to offset the negative effects of heavily applied compaction while relatively lower water contents exacerbated differences in plant responses across compaction treatments.

1. Introduction

It is important to develop and implement management techniques that mitigate food production risk and reduce agriculture’s environmental footprint, such as the use of more diverse crop rotations [1]. Incorporating a greater variety of cropping species into rotations (e.g., legumes) has displayed positive effects on the soil biota, as legume amalgamation has been shown to improve subsequent yields while simultaneously reducing fertilizer inputs [2]. Integration of legumes (e.g., faba beans, Vicia faba L.) into crop rotations that are subsequently paired with management systems that improve soil quality may improve agroecosystem resiliency [3]; however, an overabundance or lack of water in the soil profile can be a major limiting factor in agricultural crop production [4,5,6]. As water within the soil profile is dependent on many factors within the soil–plant–atmosphere continuum [7], potential shifts in climatic trends may lead to variability in future water distribution. The severity of climatic deviations from normal conditions can be shown by “the drought of 2012 in the United States [that] led to a reduction of maize yields of up to 25% (which is moderate compared with the impacts projected for some regions at higher levels of temperature increase)” [8] (p. 3273). This concern has led to investigations on the factors that influence and control water use efficiencies of wheat [4,9,10], faba beans [11,12], and the inclusion of both cereals and legumes with varying rotations [13,14,15].
Despite the dependence of natural water distribution on uncontrollable sources (i.e., precipitation), Li et al. [16,17] and McHugh et al. [18] describe how management systems that control and reduce spatially-applied soil compaction can lessen plant stress based on improvements to the water storage capacity of the soils. A management system, such as controlled traffic farming (CTF), where wheel traffic is confined to specific areas within the field (i.e., tramlines) allows for the majority of cropped areas to be grown in un-trafficked conditions [18,19]. The contrasting effects of compacted and un-compacted soils on plant yield has been shown [20], as soils with a high bulk density can reduce the ability for plants to access and attain essential resources. Additionally, the detrimental effects of a combination of a high degree of soil compaction and a depletion in soil water content has been shown in wheat [10], soybean [21], and the common bean [22]. Conversely, there is a lack of existing literature on the dynamics and responses of faba beans exposed to varying levels of soil compaction and simultaneously different levels of water content on common agricultural soils. Furthermore, a clear knowledge gap exists in both the physiological and water use interactions of plants when comparing soil conditions between conventional and controlled traffic regimes. This knowledge gap may be bridged through the quantification of plant canopy responses across contrasting management systems and varying soil conditions, which may be achieved through the use of hand held sensor-based measurements [23] to potentially provide producers with the ability to un-intrusively measure plant stress.
It was the goal of this study to determine how different soil conditions typically experienced in conventional and controlled traffic regimes drive faba bean plant responses. Additionally, we tested if these responses are a function of either the compaction, water content, or both interacting simultaneously. This was pursued through an investigation of how simulated compaction and established volumetric water contents impact the soil–plant–atmosphere continuum under a controlled greenhouse setting. We also sought to determine if handheld sensor-based measurements of faba bean canopies, such as normalized difference vegetation index and stomatal conductance, can be used to detect plant physiological changes as a result of contrasting environmental conditions.

2. Materials and Methods

2.1. Experimental Design

The study was carried out in a greenhouse using soil pots (n = 48) arranged in a randomized complete block (factorial) design. Each pot (experimental unit in this study) consisted of a white 4.8 L rigid plastic bucket with dimensions of 20.5 cm in height, 19.5 cm in top inner diameter, and 17.5 cm in bottom inner diameter that was packed with soil to a height of 18 cm. The soils used in the experiment were collected from two commercial agriculture field sites within Alberta that were actively employing CTF. Soil collection took place in a Dark Grey Luvisol soil (Dapp, 54.402527° and −114.042741°) and a Black Chernozem soil (Lacombe, 52.490535° and −113.660029°), as these soil orders are commonly found within agricultural regions (Table 1). Within each site, soil was collected from a depth of 5–20 cm in un-trafficked cropping zones and sealed in containers after collection at 5 °C. Soil taken from each of the sites was composited within each soil type and mixed prior to being packed into the pots.
Soil treatments (n = 16) were applied to each individual pot and replicated three times as a combination of soil bulk density and volumetric water content (Table 2) for two soil types. This greenhouse soil pot experiment followed three sequential phases: (i) a primary cropping phase with wheat (Triticum aestivum L.) grown as a soil conditioning period, (ii) a freeze–thaw period, and (iii) a secondary cropping phase with faba beans (Vicia faba L.) grown as the measurement and analysis period in the study. The goal of the wheat phase and freeze–thaw period was to (through natural consolidation and root growth) establish and emulate field growing conditions commonly found during spring sowing in Alberta for the faba bean phase. Prior to seeding wheat in the first cropping phase, soils were packed in four dry bulk density treatments ranging from 1.0–1.4 g cm−3 in both soil types and maintained at 37% volumetric water content. The second cropping phase of the study consisted of faba beans grown in the established pots with three replicates of eight treatment combinations of four dry bulk densities (1.1–1.4 g cm−3) and two water contents (33% and 41% volumetric water content) consistently applied across two soil types (Table 2).
The range of dry bulk density values used as the treatments applied in this study were based upon 96 undisturbed soil core samples taken from each field site at a depth of 5–15 cm as part of a related study focusing on soil mapping [24]; these field samples captured typical variations in soil conditions under conventional and controlled traffic regimes and these direct observations were classified by trafficked and un-trafficked areas (Table 1). The dry bulk density treatments consisted of a control treatment and three treatments with varying levels of compactive effort applied (Table 2) as follows: (i) control density of 1.0 g cm−3 represented a soil with ample pore space and marginal compaction which was established by filling the pot with soil without applying any significant compression, (ii) lightly compacted soil density treatment of 1.2 g cm−3 representing a soil environment achieved with un-trafficked CTF management, (iii) compacted soil within the top half of the pot (1.2 g cm−3) and a heavily compacted soil within the bottom half (1.4 g cm−3) representing the existence of a plow pan that may be experienced in some conventional traffic operations with un-controlled traffic regimes, and (iv) heavily compacted soils that exist in the tramlines of CTF systems or areas of high traffic volume in conventional traffic were simulated by a density of 1.4 g cm−3 [24]. The soil density treatments were applied prior to the first cropping phase (wheat) and used without additional alterations throughout the duration of the study. Natural consolidation in the control treatment over the course of the wheat phase raised the dry soil bulk density from the initial 1.0 g cm−3 to 1.1 g cm−3 at the start of the faba bean phase. Packing of the soil occurred at 22% gravimetric water content. Creating the specified dry bulk density within the pot was achieved by filling the soil pot with an approximate volume of soil that was gradually packed in four separate layers of 4.5 cm thickness from a Proctor Hammer (4.5 kg with a 45 cm falling distance).
Based on spatial measurements of soil physical quality in a related field study [24], a water retention curve for each bulk density treatment was created based upon undisturbed soil core samples taken from each site (n = 96) through the use of a HYPROP® (UMS GmbH, Munich, Germany) and WP4C PotentiaMeter® (Decagon Devices Inc., Pullman, WA, USA) by the evaporation and dew point methods, respectively (Figure 1). The combination of these two methods can yield water retention curves from 0 to −1500 kPa [25,26,27]. We assembled water retention curves for the bulk density treatments (Figure 1) by encompassing the measured water retention curves corresponding to ranges of ±0.05 g cm−3 for the dry bulk density treatment. For experimental comparison, we selected and controlled for volumetric water contents as they can represent spatially uniform water input under rainfed farming environments irrespective of any existing variations in the soil compaction level. Hence, the selected volumetric water contents were consistently applied across the dry bulk density treatments and soil type. The wheat phase (conditioning period) of the study employed a uniform water content across all treatments (37% volumetric water content), which was used to ensure the wheat plants had adequate water availability and the initial conditions for the faba bean phase were consistent. Based on the existing soil water retention curves from field samples (Figure 1), the two treatments of volumetric water content applied during the faba bean phase (measurement and analysis period in the study) were chosen to simulate moisture conditions near field capacity (41% volumetric water content) and a relatively lower but still field moist condition (33% volumetric water content).

2.2. Greenhouse Study

Throughout the duration of both cropping phases, all pots received a 16-h diurnal photoperiod in the greenhouse. The light period for the wheat phase of the study was supplemented with additional lighting provided by two sets of high output fluorescent T5 lights (4100 K) positioned 1 m above the top of the plants, as daylight hours experienced in the winter months were shorter than those experienced during the growing season. Supplementary lighting was not directly supplied to the faba bean phase, as daylight hours were consistent with those experienced in growing season conditions throughout the Canadian Prairies. As recorded by a HOBO® UX100-001 temperature datalogger (Oneset® Computer Corporation, Bourne, MA, USA), ambient temperatures within the greenhouse had diurnal fluctuations between 17 °C and 31 °C. Pot locations in the greenhouse were randomized every week to reduce any possible effects of varying microclimatic conditions and positional variation.
Wheat planted in the first cropping phase of the study was a Canadian Western Red Spring cultivar called AC® Muchmore (FP Genetics, Regina, SK, Canada). The seeds were planted on February 10, 2016, and were terminated after anthesis, or at Z69 [28], on April 26, 2016. A seeding rate of 250 plants per m2 [29] was followed, with 12 seeds initially planted in each pot and thinned to eight plants per pot after emergence. A seeding depth of 4 cm below soil surface was applied, as recommended by Alberta Agriculture and Forestry [30]. After sowing had taken place, the pots were exposed once a week to a fertilizer solution of 1 g L−1 of 20-8-20 (200 ppm N, 80 ppm P, 200 ppm K) and 0.05 g L−1 of stock tank mix (0.39 ppm B, 0.03 ppm Cu, 2.1 ppm Fe, 0.9 ppm Mg, 0.6 ppm Mn, 0.018 ppm Mo, 0.9 ppm S, 0.12 ppm Zn) with the corresponding water used to maintain the nominal water content. Wheat stubble was left standing at 2 cm above the soil surface with 5 g of wheat straw biomass applied to the soil surface of each pot to simulate crop residue upon completion of the first cropping phase of the study. Progressing to the next stage of the study, the pots were placed in a freezer at −20 °C from May 6, 2016, to May 20, 2016; this was done to simulate winter conditions that take place between growing seasons in the Canadian Prairies.
Sowing of the faba beans in the second cropping phase of the study utilized a zero tannin faba bean cultivar called Snowbird (Innoseeds B.V., Vlijmen, The Netherlands). Seeding of the faba beans took place on June 2, 2016, with termination of the plants occurring after anthesis, or at BBCH 69 [31], on July 25, 2016. Seeds were planted at a rate of 43 plants per m2 [32,33], with an initial seeding rate of three plants per pot that were thinned to one plant per pot shortly after emergence. In addition, with the seed, 6.2 kg ha−1 of granular Tagteam inoculant was placed in each pot to a depth of 6 cm below the soil surface [33]. Fertilization was administered in the same technique and interval as the first cropping phase, with weekly applications of 1 g L−1 of 10–5241% (100 ppm N, 520 ppm P, 100 ppm K) and 0.05 g L−1 of stock tank mix (0.39 ppm B, 0.03 ppm Cu, 2.1 ppm Fe, 0.9 ppm Mg, 0.6 ppm Mn, 0.018 ppm Mo, 0.9 ppm S, 0.12 ppm Zn).

2.3. Measurements

Water contents were maintained for both cropping phases via measuring the total mass of each soil pot through the use of a load cell (Sartorius AG, Goettingen, Germany) with 30 kg capacity and accuracy of 0.001 kg, and adding the water/fertilizer solution to achieve their nominal mass (i.e., volumetric water content with a measured water density of 0.985 g cm−3) every two days, as these short two-day drying periods were used to simulate natural conditions between rainfall events. During the addition of water in the wheat phase, the weight of the biomass was not accounted for. However, the weight of the aboveground biomass was accounted for in the faba bean phase through the use of a faba bean growth curve (Figure 2) calculated prior to initiation.
Throughout the duration of the study, sensor and plant-based measurements were taken on a weekly basis for the faba bean plants. The sensor-based readings included the leaf stomatal conductance (gs, mmol m−2 s−1) and normalized difference vegetation index (NDVI, unitless). The gs and NDVI readings were taken between 1100 and 1500 coordinated universal time (UTC), with care being taken to avoid direct sunlight during the measurement period. Stomatal conductance is a quantification of the water vapor efflux (and associated carbon dioxide influx) in leaf stomatal openings and has been shown to be a good indicator of plant water stress [34]. We measured gs on the topmost fully developed leaf of each plant using a SC-1 steady state diffusion leaf porometer (Decagon Devices Inc., Pullman, WA, USA). Prior to taking gs measurements, the porometer was calibrated to the relative humidity conditions experienced in the greenhouse. Analysis of the gs data was normalized to 25 °C to account for temperature fluctuations at the time of sampling. The NDVI of a plant has been shown to correlate to possible nutrient stresses [35,36] and was used as an indicator to quantify overall changes in plant health by potential changes in nutrient uptake. The NDVI was taken 60 cm directly above the plant canopy of each pot by using a handheld HCS-100 GreenSeeker® (Trimble® Inc., Sunnyvale, CA, USA) and ranged from a minimum reading of 0 to a maximum of 1. It is important to note that the measurement of NDVI is not a direct reading, but a measure of the reflectance of visible red and near infrared wavelengths from the plant surface [37]. The reflectance of the plant can also be correlated to the color of the plant, which has been shown to have a direct correlation between the concentration of chlorophyll within the leaves and the nitrogen use of a given plant canopy [37]. The NDVI was determined through the following:
  N D V I = ( N I R r e d ) ( N I R + r e d )  
where near infrared (NIR) and visible red (red) are measurements of light reflectance within those spectrums.
Plant based measurements taken on a weekly temporal scale included the plant height (cm) and evapotranspiration rates (mm d−1). Upon completion of the faba bean phase, the final plant height and aboveground biomass for each pot was measured. The aboveground biomass was collected and placed in an oven at 65 °C for at least 24 h to obtain constant mass values. Additionally, the root biomass was collected after termination of the faba beans, where six soil core samples (inner diameter of 3 cm and height of 15 cm) were taken from each pot in a circular pattern around the faba bean plant. The soil samples were composited by pot and wet-sieved to separate the root biomass from the soil. Wet sieving was accomplished with the application of room temperature water through a 2 mm sieve to catch larger roots and a 1 mm sieve to catch finer roots. The collected root biomass was place in an oven at 65 °C for 24 h to determine the respective constant mass value.
The water-use efficiency (WUE, mg dry biomass g−1 water) of each pot was calculated based upon the total evapotranspiration and total aboveground dry plant biomass collected [38], which was calculated through the following:
W U E = D m θ i θ f +   G S W I  
where Dm is the total aboveground collected or calculated dry biomass, θi is the initial water content of the soil at the start of each phase, θf is the final water content of the soil upon completion of each phase, and GSWI is the growing season water input based upon the total amount of water added to each pot throughout the study.

2.4. Statistics

Analysis of the WUE, final height, above and below ground biomass was done with the treatment combinations of soil bulk density, water content, and soil type used as the fixed effects and replicate used as the blocking factor. Multiple observations per soil pot of NDVI and gs for each week were averaged to produce mean values and avoid pseudo-replication. Additionally, the treatment combinations of soil bulk density, water content, soil type, and time (i.e., week) were used as the fixed effects, with replicate used as a blocking factor for the temporal analysis of the repeated measurements of evapotranspiration, height, NDVI, and gs. To account for the lack of independence between repeated measurements, correlation and variance structures were introduced into the model and checked with an autocorrelation function (α = 0.05) to ensure the assumption of sphericity was met. When statistically valid, each soil type was analyzed separately due to significant interactions between soil type and treatments of soil bulk density and water content in conjunction with the replication as a blocking factor. The analysis was carried out in both R ver. 3.3.1 (R Development Core Team, Vienna, Austria) and SigmaPlot ver. 11.1. (Systat Software, San Jose, CA, USA).
Prior to analyzing the data, assumptions of normality and homogeneity of variance were checked through the Kolmogorov–Smirnov and Bartlett Tests, respectively. The test method used to differentiate changes across treatments was an analysis of variance (ANOVA). When the ANOVA yielded significantly different results among treatments (α = 0.05), a Tukey’s honestly significant difference (HSD) post-hoc analysis was carried out (Table 3). Least square means were calculated to determine significant trends within treatments and the temporal scale. Spearman rank correlations (ρ) were carried out on both plant and sensor-based measurements.

3. Results

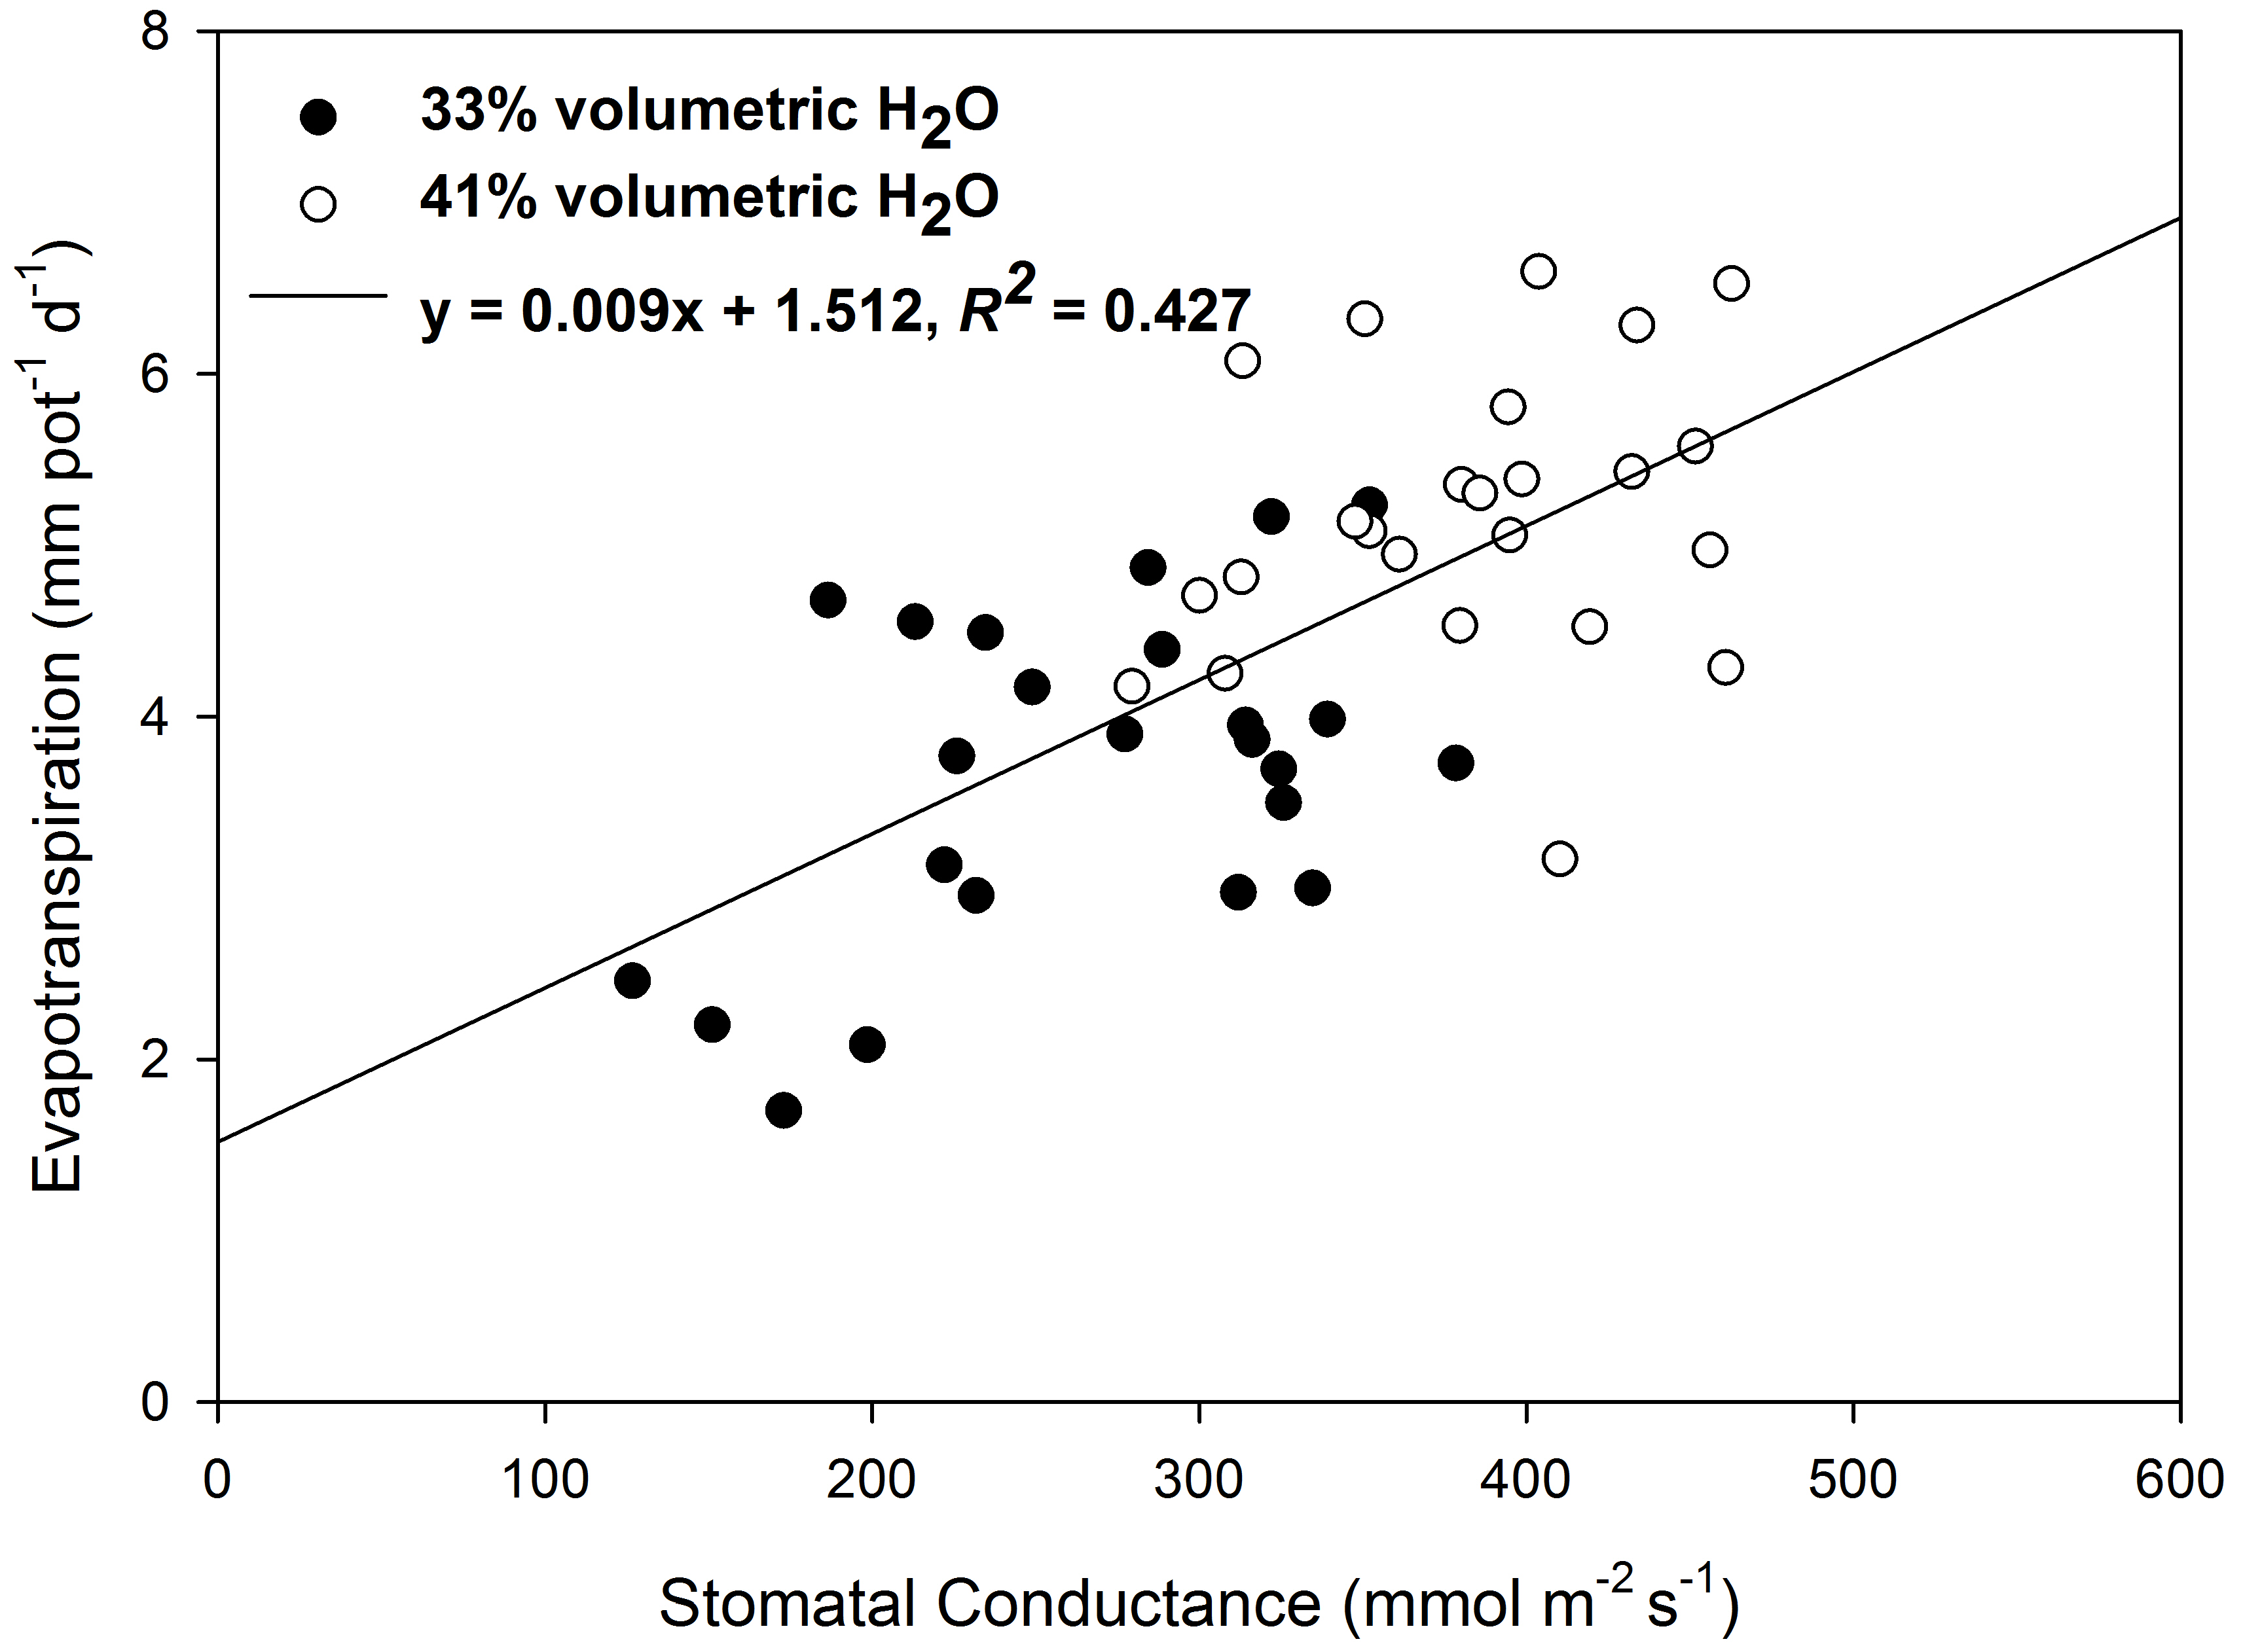
3.1. Evapotranspiration and Water-Use Efficiency

The water-use efficiency for the faba bean plants was based upon the total aboveground dry plant biomass (mg) and the total amount of water added to each pot (g) over the duration of the faba bean phase. The Black Chernozem (Lacombe) displayed the ability to sustain higher evapotranspiration rates and water use efficiencies (Table 3) both on average and in the relatively lower water content treatment (33% volumetric water content) when compared to the Dark Grey Luvisol (Dapp). Evapotranspiration rates showed statistically significant (α = 0.05) differences across treatment levels and interactions, where the higher water content (41% volumetric water content) showcased consistently higher evapotranspiration rates than the lower water content (33%) (Table 3). Additionally, the compaction treatment of 1.2 g cm−3 coupled with the high water content displayed the highest evapotranspiration rate across all treatments in both soils, with greater than 40% difference occurring between the lowest rate witnessed in the 1.4 g cm−3 at the lower water content. Furthermore, treatments with lower bulk densities generally displayed higher evapotranspirational flux than the higher bulk density treatments.
The faba bean WUE displayed no significant differences among treatments in the Dark Grey Luvisol, but displayed significant differences in the Black Chernozem as a result of the water content (Table 3). In the Black Chernozem soil, the lowest WUE occurred in the control (1.1 g cm−3) at the high water content and was contrasted by a 28% (1.2/1.4 g cm−3) and 32% (1.4 g cm−3) increase in WUE in the lower water content (Table 3). Additionally, an inverse relationship between the evapotranspirational flux and WUE was shown between significant differences in the water content treatments. Conversely, this trend was not followed in the Dark Grey Luvisol, as non-significant differences between treatments displayed no clear pattern. Generally, the lower soil bulk density treatments coupled with higher water content yielded growing conditions with fewer limiting factors for the faba beans, which contributed to an environment with a lower efficiency in water use.

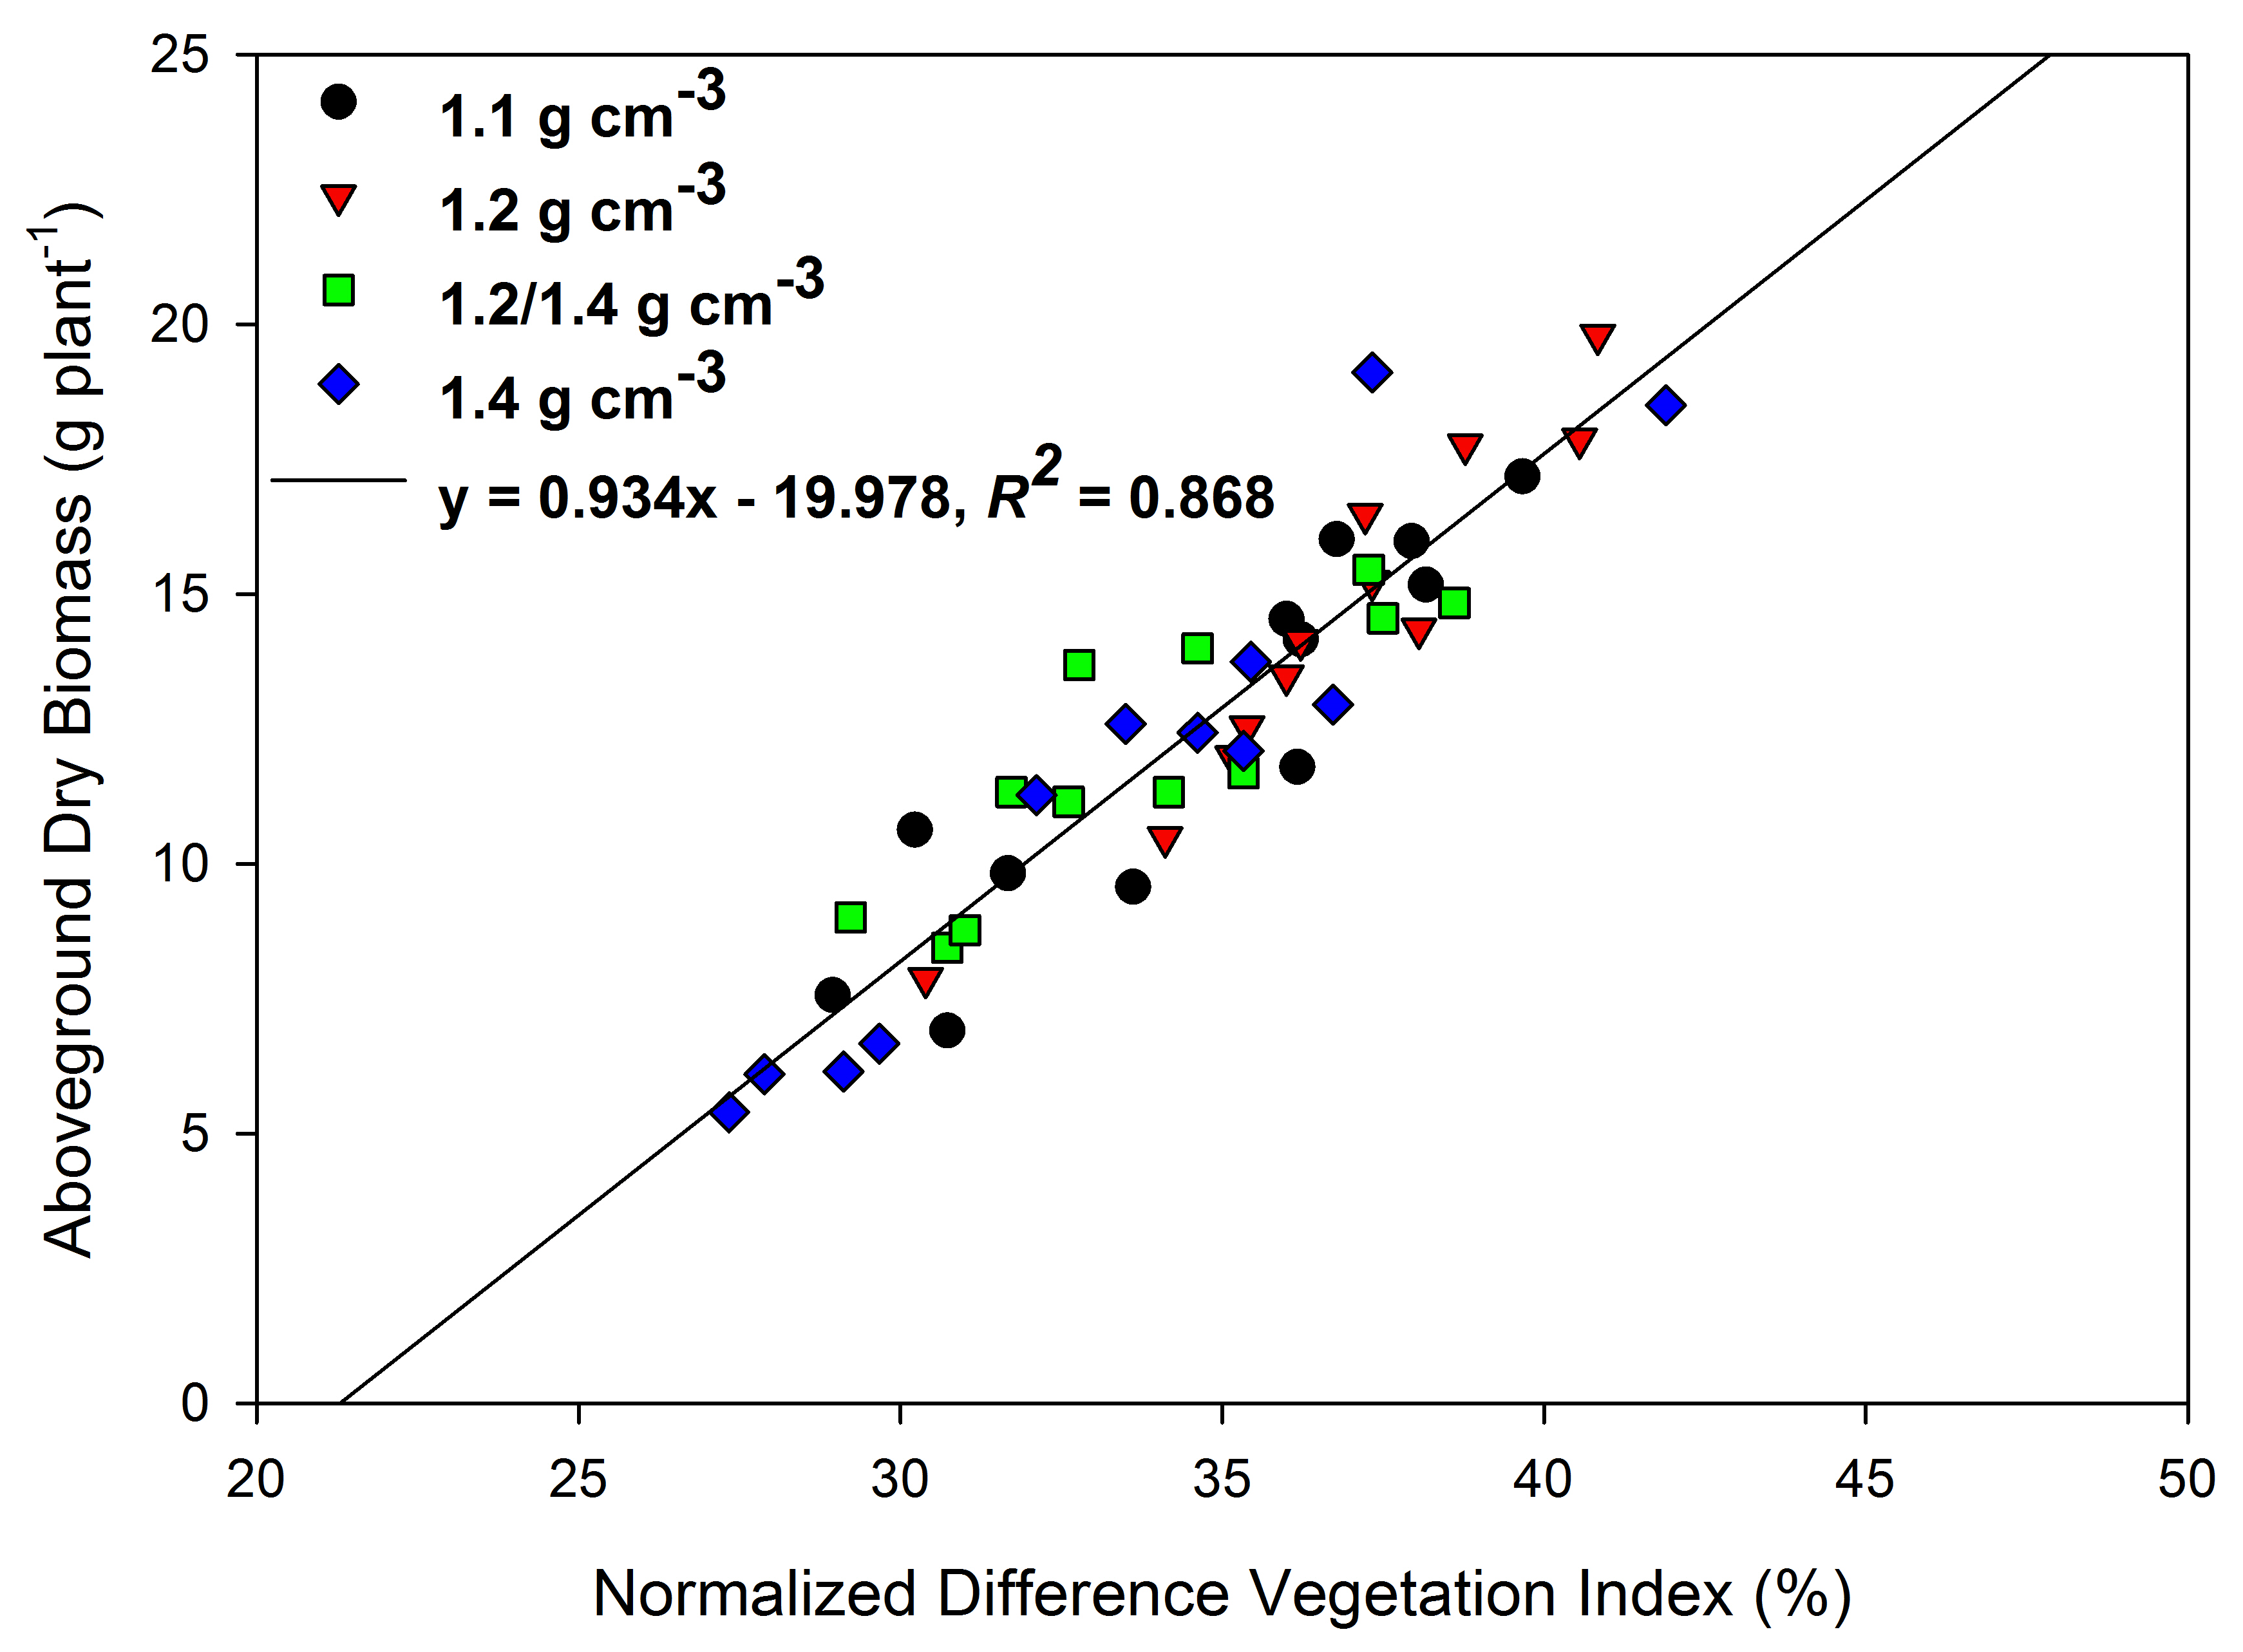
3.2. Normalized Difference Vegetation Index

The NDVI readings of the plant canopy were used in our study to differentiate possible changes in overall plant health among the treatments as it may be considered a proxy for general nutrient uptake [39,40]. The Black Chernozem soil displayed a higher average NDVI than the Dark Grey Luvisol; however, both soils displayed similar trends among treatments. Significant differences were observed as a function of the bulk density and water content for the Dark Grey Luvisol and as a function of the bulk density for the Black Chernozem. For both soils, the 1.4 g cm−3 treatment in the lower water content yielded the lowest levels of leaf reflectance (Table 3). Conversely, the 1.2 g cm−3 treatment at the high water content produced the highest NDVI readings in the Black Chernozem. Treatments with the higher water content generally displayed higher NDVI values than the treatments with the lower water content, indicating that greater water content positively influenced faba bean plant health (Table 3). Moreover, increasing the compactive effort under the lower water content showed noticeable decreases in NDVI for both soils (Table 3).

3.3. Stomatal Conductance

Stomatal conductance (gs) was used to monitor the water vapor flux as an indicator of water stress in our study. The measured gs for the faba beans displayed significant differences across the bulk density and water content treatments for both soils; gs values in the higher water content were consistently greater for all compaction treatments than the lower water content (Table 3). However, an additional data structure between the compaction treatments was observed, where gs values decreased with increasing compactive effort for both soils. Both the control treatment (1.1 g cm−3) and the treatment representing un-trafficked areas (1.2 g cm−3) at the high water content displayed the highest gs values for both soils; meanwhile, the 1.4 g cm−3 treatment at the lower water content showed a 90–160% reduction from the highest values (Table 3).

3.4. Plant Biomass

Significant variations among treatments in the aboveground biomass production occurred as a function of the bulk density and water content for the Dark Grey Luvisol and as an interaction between the two experimental factors for the Black Chernozem. On average, the Black Chernozem produced 20% more aboveground biomass than the Dark Grey Luvisol (Table 3). The highest producing treatment was observed in the high water content at a bulk density of 1.1 g cm−3 for the Dark Grey Luvisol and 1.2 g cm−3 for the Black Chernozem, while the lowest production of aboveground biomass occurred in the 1.4 g cm−3 treatment at the lower water content for both soils (Table 3). Significant differences among treatments for the root biomass production were only shown in the Black Chernozem soil, with the 1.2 g cm−3 treatment at the high water content showcasing the highest mean value. Contrary to the other plant parameters, the high compaction treatment (1.4 g cm−3) produced nearly the largest quantity of root biomass in both soils.
Faba bean plant height was measured throughout the duration of the faba bean study; however, final faba bean heights were measured at termination and were shown to generally resemble a similar statistical response (Table 3) as well as emulate the same numerical pattern as the aboveground biomass and NDVI (Table 3). The plant height results revealed a direct response to increasing amounts of water within the soil, as the high water content (41% volumetric water content) treatments generally displayed the largest final faba bean height in both soils. However, dissimilar significant differences between soil types were shown (Table 3). The Dark Grey Luvisol yielded the highest final faba bean height in the 1.1 g cm−3 treatment at the high water content, while the 1.2 g cm−3 and 1.4 g cm−3 treatments at the high water content displayed the highest overall final faba bean height in the Black Chernozem. However, both soil types showed that the high compaction treatment of 1.4 g cm−3 at the lower water content produced the lowest final faba bean height (Table 3). As was consistent with the majority of the measured parameters, the Black Chernozem displayed greater plant heights. The detrimental effect of the high compaction treatment (1.4 g cm−3) representing the tramlines or high traffic areas on final faba bean height was illuminated in both soils, as it was generally the poorest performing treatment across all the measured parameters.

3.5. Temporal Variation of Plant Parameters

Temporal changes were observed on a weekly basis after the emergence of the faba beans for gs, NDVI, plant height, and ET. Measurements began within the second week after sowing, as sufficient time had to be given to allow for emergence. Temporal variations for the measured NDVI and stomatal conductance (Figure 3 and Figure 4) did not follow the same trend, indicating each sensor-based measurement quantifying different plant processes. Temporal patterns for faba bean height and NDVI readings displayed similar patterns of steady increases with time; however, faba bean NDVI readings plateaued for all treatments in the seventh week after sowing (Figure 3 and Figure 4). The plant height measurements showed no indication of cessation, which may be attributed to the termination of the faba bean plants occurring prior to the physiological maximum being realized. Maximum gs values were witnessed in the third week, with a continuous downward trend observed until the seventh week (Figure 3 and Figure 4). Similarly, the evapotranspiration exhibited the same peak in the third week followed by a downward trend for the remainder of our study.

4. Discussion

4.1. Plant Dynamics Impacted by Varying Compactive Effort

Using a greenhouse study to draw conclusive observations that are applicable to field conditions can be challenging and are likely due to inherit differences in controlled environments of the greenhouse versus highly variable field conditions. However, in our study, we utilized soil taken from active commercial sites and subjected each soil pot to conditions that would be experienced throughout pre- and post-growing seasons before the main cropping phase of the study (i.e., faba beans). Therefore, observations made from this greenhouse study may be considerably linked to environments found in comparable field conditions. Increasing compaction levels caused a variety of detrimental effects on the measured parameters irrespective of water contents; however, a lack of continuity in the compaction response structure alludes to the possibility that the high volumetric water content (41%) simulating conditions at near field capacity was masking the overall negative effects of compaction. Conversely, at the relatively lower volumetric water content (33%) that was comparable to field moist conditions displayed how compaction experienced within the soil became a driving factor.
The natural state of the soil reached through consolidation in the control treatment was hypothesized to yield optimum results for the faba bean phase; however, the control was usually outperformed by the compaction treatment representing un-trafficked areas (1.2 g cm−3). An evaluation of the effects of compaction show that a minimum amount of soil contact is required to facilitate ideal plant growing conditions [41,42]. A lack of soil and root contact experienced in the control treatment (1.1 g cm−3) may have attributed to the lack of ideal plant productivity. Therefore, the bulk density of 1.2 g cm−3 was considered as the optimal treatment due to its near continuous peak performance in both plant (Figure 5) and sensor-based measurements (Figure 3). This indicates that un-trafficked soils in controlled traffic regimes (1.2 g cm−3) could incur the formation of an optimal plant growth medium for faba beans in both Black Chernozem and Dark Grey Luvisol soils.
Deficient performance observed by the bulk density treatment of 1.4 g cm−3 at the relatively lower water content representing field moist conditions (33%) was to be expected, as high applications of compaction have been shown to reduce plant yield and hamper plant nutrient uptake [43,44]. Furthermore, excessive soil contact experienced in both the plow pan treatment (1.2/1.4 g cm−3) and the heavy compaction treatment (1.4 g cm−3) exhibited generally poor but different responses as the water content treatment changed. Dissimilarities in these trends suggest that a soil with uniform heavy compaction throughout the vertical profile has a more profound detrimental effect at relatively lower water availabilities than a soil profile exhibiting heavy compaction just in the subsurface layer alone (Table 3). The highly compacted nature of tramlines can lead to reduced infiltration and water storage capacity [16,17,45], which points to the likelihood of plant growth in tramlines or areas of high compaction in conventional traffic regimes occurring in conditions similar to the treatment of 1.4 g cm−3.
Significant differences observed in the Black Chernozem were mainly the result of significant interactions between the bulk density and water content treatments (Table 3). This illustrates how the degree of compaction can be influenced by water availability to produce optimal or sub-optimal growing conditions for faba beans. Furthermore, the relative ability to access water could probably be attributed to the expansion or hindrance of root biomass at varying levels of compactive effort. Plant root biomass (i.e., root diameter and length) have been shown to be significantly affected by soil strength [46], and in our case, was driven both by the intensity of the applied compaction and access to water in each treatment. The large quantities of root biomass observed in the 1.4 g cm−3 treatment of our study was inconsistent with other studies [47,48], as well as the majority of our other measured parameters (Table 3). However, in highly compacted soil, the structure is largely massive, which reduces the ability for water and nutrients to be transmitted through soil via mass flow and diffusion mechanisms [49,50]. This may indicate that the high mean values of root biomass observed in the 1.4 g cm−3 bulk density treatment could allude to increased amounts of root growth being developed by the faba beans to access and uptake nutrient and water resources through root interception processes. The formation of greater quantities of root biomass in compaction treatments representing tramlines and conventional traffic regimes (i.e., 1.4 g cm−3) may be ultimately detrimental to yield, as more energy is put towards the development of root biomass instead of aboveground biomass and grain production.

4.2. Influences of Soil Water on Plant Responses

Faba beans have been shown to be highly susceptible to water stress [51], indicating that the amount of available water within the soil can be an active component influencing the physiological state of the faba beans. Contrary to our initial hypothesis of high bulk density treatments performing poorly in both water contents, a masking effect of adequate available water occurred in the high water content as it usually yielded favorable outcomes (Table 3). The capacity for high water content to mask the effects of the compaction treatments may be explained through the ability of the faba beans to readily adapt and thrive in higher water environments [3,11]. Furthermore, soil pots that contained the faba beans acted as a closed system and retained the applied water, which could infiltrate and re-distribute throughout the soil profile over time. However, in a field setting, the framework of a closed system does not hold true. Excess water would normally move away from these highly compacted areas as runoff or towards areas of greater porosity (i.e., un-trafficked areas), reducing the overall availability of water and emulating conditions found in our lower water content treatment. Moreover, responses at the lower water content (33%) elicited a greater dependence on the compaction level, indicating that the soil conditions experienced in un-trafficked areas represented a more ideal growth medium.

4.3. Sensor-Based Measurements in the Soil–Plant–Atmosphere Continuum

As a conceptual framework, the soil–plant–atmosphere continuum (SPAC) can be used to describe the movement of water from the soil and through the plant into the atmosphere [8]. The sensor-based measurements used in our study may act as indicators to represent the dynamics of the SPAC, as they emulated and quantified plant stress. The normalized difference vegetation index (NDVI) has been previously demonstrated to model plant nitrogen use and accurately determine yield projections of multiple crop types [23,35,36]. Moreover, our study is consistent with these existing reports as is evident by a high correlation (ρ = 0.940, p < 0.0001) of our NDVI results with faba bean biomass production. Experimental conditions in our study that were more conducive to increased stress potential (i.e., areas of intensive traffic causing high compaction and lower water content) caused decreased faba bean biomass and final faba bean height. Our results support the clear association of NDVI with aboveground faba bean biomass production (Figure 5), as weekly fertilizer additions during the wheat and faba bean phases of our study aimed at limiting nutrient deficiency. Thus, significant differences in our NDVI results across compaction and water content treatments implied the NDVI was fundamentally altered through the stress induced from increases in compaction level (that can be experienced in conventional traffic regimes) and changes in water content.
Differences across applied treatments support NDVI as a useful indicator of plant stress as driven by SPAC dynamics; however, correlating canopy NDVI readings with biomass production or plant height should be used with caution. Depending on the cultivar, indeterminate faba beans have been shown to display continuous growth and potential maturity delays under optimal growing conditions [51]. Therefore, the assumption that high NDVI readings and adequate faba bean nutrient uptake will produce optimal yields may not always hold true due to the potential for late maturity. Furthermore, faba bean nutrient deficiencies (other than nitrogen) may not always be captured from handheld NDVI readings, as the NDVI indirectly measures the greenness of the plant from nitrogen uptake due to leaf reflectance from chlorophyll concentrations [37] and not actual plant nutrient concentrations. Further research is needed to address any possible disparities between the use of NDVI as a measure of the plant health in legumes due to their nitrogen fixation properties. Rigorous analysis of sensor-based data should be completed for multiple crop types under a wider range of edaphic and climatic conditions before the incorporation of sensor-based measurements, such as NDVI, into crop modeling, yield prediction, or management zone delineation can confidently be undertaken.
The flux of water vapor and carbon dioxide through the leaf stomata is largely driven by changes in plant turgor, which can be correlated to the ability of the plant to obtain water through the SPAC [34] and is measured through the corresponding stomatal conductance (gs) [9,34,52,53]. In our study, gs responses mimicked evapotranspiration rates (ρ = 0.623, p < 0.001), but only partially paralleled aboveground faba bean biomass production (ρ = 0.424, p = 0.003). High values of gs witnessed in treatments that displayed the lowest efficiency in water usage (1.1 g cm−3 and 1.2 g cm−3) indicated that gs was able to display a linear trend with evapotranspiration (Figure 6) despite the lack of significance and an R2 of only 0.427. Additionally, the pod setting and filling stages of faba beans have been shown to be physiologically affected by the availability of water resources [3,52,53,54] through alterations to evapotranspiration; however, we witnessed large deviations in stomatal conductance values well before this stage (Figure 4). This suggests that there may be a threshold to which permanent alterations may occur to the physiological state of the Snowbird variety of faba bean as influenced by soil compaction and water content. Regardless of both NDVI and gs measurements displaying similar treatment response symmetry, each parameter was able to capture and display different drivers for plant stress as evident by high correlations with different measures of plant productivity (e.g., NDVI with aboveground biomass and gs with evapotranspiration). Furthermore, the significant interactions in both treatment levels for both soil types suggests that the stomatal conductance could be used as an indicator for water stress or water-use efficiency.

5. Conclusions

Faba bean plants displayed superior responses to treatments encompassing high water content and soils with relatively low levels of compaction, with the optimal treatment in our study for faba bean productivity determined as 1.2 g cm3 at 41% volumetric water content. This optimal condition represents potential field conditions encountered in un-trafficked areas within controlled traffic regimes at a water content that will not lead to anaerobic conditions. Un-trafficked areas represent 65–80% of the field area in controlled traffic systems [19], indicating that the implementation of CTF may increase the buffering capacity of soils to sustain peak growth conditions for faba beans. Furthermore, applications of large amounts of compaction (i.e., areas with plow pans, tramlines or intensive traffic) were shown to limit plant productivity in terms of biomass production and evapotranspiration. However, the detrimental effects of high compactive effort to faba bean productivity were somewhat offset through high amounts of available water (i.e., water content near field capacity), as faba beans displayed the ability to increase and sustain their water-use-efficiency in less than optimal growing conditions. Slight variations in treatment responses were witnessed between the Dark Grey Luvisol and the Black Chernozem soils. The Black Chernozem soil showed slightly elevated values for the measured parameters, apart from root biomass, when contrasted against the Dark Grey Luvisol. However, both soil types consistently displayed the poorest plant productivity in the treatment representing tramlines or conventional traffic regimes (1.4 g cm3) at 33% volumetric water content.
The use of sensor based measurements was able to emulate faba bean stress across our range of treatments and soil conditions. Leaf reflectance quantified as NDVI was highly correlated with faba bean aboveground biomass production and could be a good indicator of overall plant health. However, the use of NDVI to predict biomass production may be skewed from sources of uncertainty (nutrient deficits other than nitrogen, nitrogen fixation mechanisms, and plant diseases). Stomatal conductance was a good indicator of the general water movement and stress elicited by variations in both compaction and water content treatments, as it reflected changes in evapotranspiration. This study highlighted the effects of plant stress on faba beans caused by soil altering factors from different traffic management systems. We reiterate the recommendation of achieving optimal growing conditions that may be possible in the un-trafficked areas of controlled traffic regimes.

Author Contributions

K.G.G. contributions were part of the requirements for a Master’s degree, where this manuscript constituted a portion of the thesis. He was responsible for implementing the greenhouse study, completing the data analysis, and a significant portion of the commentary of this manuscript. G.H.-R. provided motivation and input into the design and implementation of this study, secured the necessary funding, mentored the first author throughout his MSc degree, and provided reviews and edits to the contents and presentation of the various versions of this manuscript.

Funding

This research received no external funding.

Acknowledgments

Much appreciation goes out to the funding agencies that have generously allowed this research to take place: Alberta Crop Industry Fund [2014F015R], the Alberta Canola Producers Commission [RES0021523], and the University of Alberta. Many thanks are extended to the invaluable individuals who provided technical support: Jichen Li, Lewis Fausak, Nikki-Karyssa Scott, Sheri Strydhorst, Dick Puurveen, Peter Gamache, and to James Jackson and Craig Shaw for letting us use their soil.

Conflicts of Interest

The authors declare no conflict of interest.

Abbreviations

CTFcontrolled traffic farming
NDVInormalized difference vegetation index

References

  1. Congreves, K.A.; Hayes, A.; Verhallen, E.A.; Van Eerd, L.L. Long-term impact of tillage and crop rotation on soil health at four temperate agroecosystems. Soil Tillage Res. 2015, 152, 17–28. [Google Scholar] [CrossRef]
  2. Dias, T.; Dukes, A.; Antunes, P.M. Accounting for soil biotic effects on soil health and crop productivity in the design of crop rotations. J. Sci. Food Agric. 2015, 95, 447–454. [Google Scholar] [CrossRef] [PubMed]
  3. Jensen, E.S.; Peoples, M.B.; Hauggaard-Nielsen, H. Faba bean in cropping systems. Field Crop. Res. 2010, 115, 203–216. [Google Scholar] [CrossRef] [Green Version]
  4. Kröbel, R.; Lemke, R.; Campbell, C.A.; Zentner, R.; McConkey, B.; Steppuhn, H.; De Jong, R.; Wang, H. Water use efficiency of spring wheat in the semi-arid Canadian prairies: Effect of legume green manure, type of spring wheat, and cropping frequency. Can. J. Soil Sci. 2014, 94, 223–235. [Google Scholar] [CrossRef]
  5. Medrano, H.; Tomás, M.; Martorell, S.; Flexas, J.; Hernández, E.; Rosselló, J.; Pou, A.; Escalona, J.-M.; Bota, J. From leaf to whole-plant water use efficiency (WUE) in complex canopies: Limitations of leaf WUE as a selection target. Crop J. 2015, 3, 220–228. [Google Scholar] [CrossRef]
  6. Xu, L.K.; Hsiao, T.C. Predicted versus measured photosynthetic water-use efficiency of crop stands under dynamically changing field environments. J. Exp. Bot. 2004, 55, 2395–2411. [Google Scholar] [CrossRef] [PubMed] [Green Version]
  7. Federer, C.A. A soil-plant-atmosphere model for transpration and availability of soil water. Water Resour. Res. 1979, 15, 555–562. [Google Scholar] [CrossRef]
  8. Rosenzweig, C.; Elliott, J.; Deryng, D.; Ruane, A.C.; Müller, C.; Arneth, A.; Boote, K.J.; Folberth, C.; Glotter, M.; Khabarov, N.; et al. Assessing agricultural risks of climate change in the 21st century in a global gridded crop model intercomparison. Proc. Natl. Acad. Sci. USA 2014, 111, 3268–3273. [Google Scholar] [CrossRef] [PubMed] [Green Version]
  9. Liang, Z.; Shao, M.; Zhang, J. The relations of stomatal conductance, water consumption, growth rate to leaf water potential during soil drying and rewatering cycle of wheat (Triticum aestivum). Bot. Bull. Acad. Sin. 2002, 43, 187–192. [Google Scholar]
  10. Sadras, V.O.; O’Leary, G.J.; Roget, D.K. Crop responses to compacted soil: Capture and efficiency in the use of water and radiation. Field Crop. Res. 2005, 91, 131–148. [Google Scholar] [CrossRef]
  11. Husain, M.M.; Reid, J.B.; Othman, H.; Gallagher, J.N. Growth and water use of faba beans (Vicia faba) in a sub-humid climate I. Root and shoot adaptations to drought stress. Field Crop. Res. 1990, 23, 1–17. [Google Scholar] [CrossRef]
  12. Loss, S.P.; Siddique, K.H.M. Adaptation of faba bean (Vicia faba L.) to dryland Mediterranean-type environments I. Seed yield and yield components. Field Crop. Res. 1997, 54, 153–162. [Google Scholar] [CrossRef]
  13. Campbell, C.A.; Zentner, R.P.; Basnyat, P.; Wang, H.; Selles, F.; McConkey, B.G.; Gan, Y.T.; Cutforth, H.W. Water use efficiency and water and nitrate distribution in soil in the semiarid prairie: Effect of crop type over 21 years. Can. J. Plant Sci. 2007, 87, 815–827. [Google Scholar] [CrossRef] [Green Version]
  14. Hatfield, J.L.; Sauer, T.J.; Prueger, J.H. Managing soils to achieve greater water use efficiency: A review. Agron. J. 2001, 93, 271–280. [Google Scholar] [CrossRef]
  15. Nielsen, D.C.; Unger, P.W.; Miller, P.R. Efficient Water Use in Dryland Cropping Systems in the Great Plains. Agron. J. 2005, 97, 364–372. [Google Scholar] [CrossRef]
  16. Li, Y.X.; Tullberg, J.N.; Freebairn, D.M. Wheel traffic and tillage effects on runoff and crop yield. Soil Tillage Res. 2007, 97, 282–292. [Google Scholar] [CrossRef]
  17. Li, Y.X.; Tullberg, J.N.; Freebairn, D.M.; Li, H.W. Functional relationships between soil water infiltration and wheeling and rainfall energy. Soil Tillage Res. 2009, 104, 156–163. [Google Scholar] [CrossRef]
  18. McHugh, A.D.; Tullberg, J.N.; Freebairn, D.M. Controlled traffic farming restores soil structure. Soil Tillage Res. 2009, 104, 164–172. [Google Scholar] [CrossRef]
  19. Tullberg, J.N.; Yule, D.F.; McGarry, D. Controlled traffic farming—From research to adoption in Australia. Soil Tillage Res. 2007, 97, 272–281. [Google Scholar] [CrossRef]
  20. Radford, B.J.; Yule, D.F.; McGarry, D.; Playford, C. Crop responses to applied soil compaction and to compaction repair treatments. Soil Tillage Res. 2001, 61, 157–166. [Google Scholar] [CrossRef]
  21. Buttery, B.R.; Tan, C.S.; Drury, C.F.; Park, S.J.; Armstrong, R.J.; Park, K.Y. The effects of soil compaction, soil moisture and soil type on growth and nodulation of soybean and common bean. Can. J. Plant Sci. 1998, 78, 571–576. [Google Scholar] [CrossRef] [Green Version]
  22. Buttery, B.R.; Tan, C.S.; Park, S.J. The effects of soil compaction on nodulation and growth of common bean (Phaseolus vulgaris L.). Can. J. Plant Sci. 1994, 74, 287–292. [Google Scholar] [CrossRef]
  23. Holzapfel, C.B.; Lafond, G.P.; Brandt, S.A.; Bullock, P.R.; Irvine, R.B.; Morrison, M.J.; May, W.E.; James, D.C. Estimating canola (Brassica napus L.) yield potential using an active optical sensor. Can. J. Plant Sci. 2009, 89, 1149–1160. [Google Scholar] [CrossRef]
  24. Guenette, K.G.; Hernandez-Ramirez, G. Tracking the influence of controlled traffic regimes on field scale soil variability and geospatial modelling techniques. Geoderma 2018, 328, 66–78. [Google Scholar] [CrossRef]
  25. Schelle, H.; Heise, L.; Jänicke, K.; Durner, W. Water retention characteristics of soils over the whole moisture range: A comparison of laboratory methods. Eur. J. Soil Sci. 2013, 64, 814–821. [Google Scholar] [CrossRef]
  26. Schindler, U.; Durner, W.; von Unold, G.; Muller, L. Evaporation method for measuring unsaturated hydraulic properties of soils: Extending the measurement range. Soil Sci. Soc. Am. J. 2010, 74, 1071–1083. [Google Scholar] [CrossRef]
  27. Schindler, U.; Müller, L. Simplifying the evaporation method for quantifying soil hydraulic properties. J. Plant Nutr. Soil Sci. 2006, 169, 623–629. [Google Scholar] [CrossRef]
  28. Zadoks, J.C.; Chang, T.T.; Konzak, C.F. A decimal code for the growth stages of cereals. Weed Res. 1974, 14, 415–421. [Google Scholar] [CrossRef]
  29. McKenzie, R.H.; Bremer, E.; Middleton, A.B.; Pfiffner, P.G.; Woods, S.A. Optimum seeding date and rate for irrigated cereal and oilseed crops in southern Alberta. Can. J. Plant Sci. 2011, 91, 293–303. [Google Scholar] [CrossRef]
  30. Alberta Agriculture and Forestry. Cereal Seeding Depth. 2008. Available online: http://www1.agric.gov.ab.ca/$department/deptdocs.nsf/all/crop4690 (accessed on 17 July 2002).
  31. Lancashire, P.D.; Bleiholder, H.; Vandenboom, T.; Langeluddeke, P.; Stauss, R.; Weber, E.; Witzenberger, A. A uniform decimal code for growth-stages of crops and weeds. Ann. Appl. Biol. 1991, 119, 561–601. [Google Scholar] [CrossRef]
  32. Alberta Agriculture and Forestry. Using 1,000 Kernal Weight for Calculating Seeding Rates and Harvest Losses. 2007. Available online: http://www1.agric.gov.ab.ca/$department/deptdocs.nsf/all/agdex81 (accessed on 1 September 2001).
  33. Douglas, L.; Laviolette-Brown, D.; Ma, X.; Shapka, B.; Yu, Z. Alberta Fababean Producers Manual: Ver. 1.0.; University of Alberta: Edmonton, AB, Canada, 2013; Available online: https://albertapulse.com/wp-content/uploads/2017/05/FABABEAN_PRODUCER_MANUAL_-Final_Copy-1.pdf (accessed on 9 February 2014).
  34. Fischer, R.A. After-effect of water stress on stomatal opening potential: II. Possible causes. J. Exp. Bot. 1970, 21, 386–404. [Google Scholar] [CrossRef]
  35. Raun, W.R.; Solie, J.B.; Johnson, G.V.; Stone, M.L.; Mullen, R.W.; Freeman, K.W.; Thomason, W.E.; Lukina, E.V. Variable rate application. Agron. J. 2002, 94, 815–820. [Google Scholar] [CrossRef]
  36. Tubaña, B.S.; Arnall, D.B.; Walsh, O.; Chung, B.; Solie, J.B.; Girma, K.; Raun, W.R. Adjusting Midseason Nitrogen Rate Using a Sensor-Based Optimization Algorithm to Increase Use Efficiency in Corn. J. Plant Nutr. 2008, 31, 1393–1419. [Google Scholar] [CrossRef]
  37. Filella, I.; Serrano, L.; Serra, J.; Peñuelas, J. Evaluating Wheat Nitrogen Status with Canopy Reflectance Indexes and Discriminant-Analysis. Crop Sci. 1995, 35, 1400–1405. [Google Scholar] [CrossRef]
  38. De Jong, R.; Rennie, D.A. Effect of soil profile type and fertilizer on moisture use by wheat grown on fallow or stubble land. Can. J. Soil Sci. 1969, 49, 189–197. [Google Scholar] [CrossRef]
  39. Holzapfel, C.B.; Lafond, G.P.; Brandt, S.A.; Bullock, P.R.; Irvine, R.B.; James, D.C.; Morrison, M.J.; May, W.E. Optical sensors have potential for determining nitrogen fertilizer topdressing requirements of canola in Saskatchewan. Can. J. Plant Sci. 2009, 89, 411–425. [Google Scholar] [CrossRef] [Green Version]
  40. Mikhabela, M.S.; Bullock, P.; Raj, S.; Wang, S.; Yang, Y. Crop yield forecasting on the Canadian Prairies using MODIS NDVI data. Agric. For. Meteorol. 2011, 151, 385–393. [Google Scholar] [CrossRef]
  41. Chen, G.; Weil, R.R. Root growth and yield of maize as affected by soil compaction and cover crops. Soil Tillage Res. 2011, 117, 17–27. [Google Scholar] [CrossRef]
  42. Hernandez-Ramirez, G.; Lawrence-Smith, E.J.; Sinton, S.M.; Schwen, A.; Brown, H.E. Root Responses to Alterations in Macroporosity and Penetrability in a Silt Loam Soil. Soil Sci. Soc. Am. J. 2014, 78, 1392–1403. [Google Scholar] [CrossRef]
  43. Hamza, M.A.; Anderson, W.K. Soil compaction in cropping systems: A review of the nature, causes and possible solutions. Soil Tillage Res. 2005, 82, 121–145. [Google Scholar] [CrossRef]
  44. Horn, R.; Domial, H.; Slowihka-Jurkiewiczb, A.; Van Ouwerkerkct, C. Soil compaction processes and their effects on the structure of arable soils and the environment. Soil Tillage Res. 1995, 35, 23–36. [Google Scholar] [CrossRef]
  45. Lipiec, J.; Kuś, J.; Słowińska-Jurkiewicz, A.; Nosalewicz, A. Soil porosity and water infiltration as influenced by tillage methods. Soil Tillage Res. 2006, 89, 210–220. [Google Scholar] [CrossRef]
  46. Shein, E.V.; Pachepsky, Y.A. Influence of root density on the critical soil water potential. Plant Soil 1995, 171, 351–357. [Google Scholar] [CrossRef]
  47. Munoz-Romero, V.; Lopez-Bellido, L.; Lopez-Bellido, R.J. Faba bean root growth in a Vertisol: Tillage effects. Field Crop. Res. 2011, 120, 338–344. [Google Scholar] [CrossRef]
  48. Smit, A.L.; Groenwold, J. Root characteristics of selected field crops: Data from the Wageningen Rhizolab (1990–2002). Plant Soil 2005, 272, 365–384. [Google Scholar] [CrossRef] [Green Version]
  49. Salama, A.M.; Sinclair, T.R. Soybean nitrogen fixation and growth as affected by drought stress and potassium fertilization. J. Plant Nutr. 1994, 17, 1193–1203. [Google Scholar] [CrossRef]
  50. Taylor, H.M.; Brar, G.S. Effect of soil compaction on root development. Soil Tillage Res. 1991, 19, 111–119. [Google Scholar] [CrossRef]
  51. De Costa, W.A.J.M.; Dennett, M.D.; Ratnaweera, U.; Nyalemegbe, K. Effects of different water regimes on field-grown determinate and indeterminate faba bean (Vicia faba L.). I. Canopy growth and biomass production. Field Crop. Res. 1997, 49, 83–93. [Google Scholar] [CrossRef]
  52. Khan, H.R.; Paull, J.G.; Siddique, K.H.M.; Stoddard, F.L. Faba bean breeding for drought-affected environments: A physiological and agronomic perspective. Field Crop. Res. 2010, 115, 279–286. [Google Scholar] [CrossRef]
  53. Xia, M.Z. Effects of soil drought during the generative development phase on seed yield and nutrient uptake of faba bean (Vicia faba). J. Agric. Sci. 1994, 122, 67–72. [Google Scholar] [CrossRef]
  54. Mwanamwenge, J.; Loss, S.P.; Siddique, K.H.M.; Cocks, P.S. Effect of water stress during floral initiation, flowering and podding on the growth and yield of faba bean (Vicia faba L.). Eur. J. Agron. 1999, 11, 1–11. [Google Scholar] [CrossRef]
Figure 1. Averaged water retention curves combined from the Black Chernozem and Dark Grey Luvisol soils assembled by bulk densities of (i) 1.1 g cm−3, (ii) 1.2 g cm−3, and (iii) 1.4 g cm−3. These modelled curves were created from tensiometer measurements in undisturbed soil core samples (n = 96) taken at a depth increment of 5–15 cm that were categorized for each of the dry bulk density treatments in our study by encompassing data within a range of ±0.05 g cm−3. The bulk density of 1.1 g cm−3 corresponds to a control treatment, 1.2 g cm−3 represents un-trafficked field areas, and 1.4 g cm−3 symbolizes tramlines or intensively trafficked field areas. The modelled water retention curves indicate that our experimental volumetric water contents of 33% and 41% corresponds to near −350 hPa (pF = 2.5) and −100 hPa (pF = 2.0), respectively, across the various bulk density categories. pF corresponds to log10 of water potential (hPa)
Agronomy 08 00200 g001
Figure 2. Allometric growth of faba beans. Shows the relationship between the average height of faba bean plants and dry aboveground biomass. Data obtained for >60 cm heights were taken from the dry weight of the aboveground biomass of all pots after completion of the second phases. Faba bean plants were grown during the first cropping phase in separate pots within the same greenhouse and were used to provide heights and dry weights in <60 cm heights. The trend line is modeled based upon the best coefficient of determination (R2).
Agronomy 08 00200 g002
Figure 3. Temporal changes of (i) normalized difference vegetation index (NDVI) and (ii) stomatal conductance (gs) per bulk density treatments. The changes on a weekly basis of the NDVI and stomatal conductance measurements for mean values of each treatment combination are displayed. In both panels, the bulk density of 1.2 g cm−3 is shown to represent the most productive results, while the bulk density of 1.4 g cm−3 displays the least.
Agronomy 08 00200 g003
Figure 4. Temporal changes of (i) normalized difference vegetation index (NDVI) and (ii) stomatal conductance (gs) per water content treatments. The changes on a weekly basis of the NDVI and stomatal conductance measurements for mean values of each treatment combination are shown. In both panels, the high water content (41% volumetric water content) is shown to represent the most productive results, while the lower water content (33% volumetric water content) displayed the least.
Agronomy 08 00200 g004
Figure 5. Faba bean aboveground dry biomass and average normalized difference vegetation index (NDVI) as a function of bulk density treatments. The compaction treatment effects on dry aboveground biomass and NDVI are shown. The bulk density that was representative of the best growing condition in our study was 1.2 g cm−3 and generally showed the highest biomass production. One plant was grown per experimental pot.
Agronomy 08 00200 g005
Figure 6. Faba bean average evapotranspiration rates and average stomatal conductance changes among water content treatments. The relationship between the evapotranspiration and stomatal conductance for both water contents is displayed. The high water content treatment (41% volumetric water content) exhibits the highest stomatal conductance and evapotranspiration, with the relatively lower water content (33% volumetric water content) showing the lowest stomatal conductance and evapotranspiration. One plant was grown per experimental pot.
Agronomy 08 00200 g006
Table 1. Soil type and characteristics. Shows both soil types used in the study and their respective mean values for given attributes. Mean values in table determined from undisturbed soil core samples (n = 96) taken from each field site at a depth of 5–15 cm.
SiteTextureSoil OrderTrafficked
(g cm−3)
Un-Trafficked
(g cm−3)
NH4+
(mg N kg−1)
NO3
(mg N kg−1)
pHSTN
(%)
SOC
(%)
DappSandy Clay LoamDark Grey Luvisol1.361.181.824.07.00.384.95
LacombeSandy LoamBlack Chernozem1.391.243.124.06.20.374.19
Trafficked: Average dry soil bulk density in tramlines and trafficked field areas; Un-trafficked: Average soil dry bulk density in un-trafficked field areas; NH4+: Mean ammonium ion concentration in soil; NO3: Mean nitrate ion concentration in soil; STN: Mean soil total nitrogen in soil; SOC: Mean soil organic carbon in soil.
Table 2. Treatment list during the greenhouse pot experiment. Shows the treatment description for the soil pots (n = 48) in the faba bean phase, where three experimental units were used for each treatment combination. Eight different fixed effect treatments of bulk density and volumetric water content were applied in both soil types, with conditions representative of the entire pot (20.5 cm height, 17.5 cm inner bottom diameter, 19.5 cm top diameter, with an 18.0 cm soil column height).
SoilBulk DensityWater ContentTreatment
(g cm−3)(% volume)
Dark Grey Luvisol (Dapp)1.1331a
411b
1.2332a
412b
1.2/1.4333a
413b
1.4334a
414b
Black Chernozem (Lacombe)1.1331a
411b
1.2332a
412b
1.2/1.4333a
413b
1.4334a
414b
For the treatment denominations: 1a, 1b, 2a, 2b, 4a and 4b, 1, 2 and 4 are the bulk densities of 1.1, 1.2 and 1.4 g cm−3, respectively, while a and b denote the volumetric water contents of 33% and 41%, respectively. Treatments 3a and 3b: Dry bulk density of 1.2 g cm−3 for the top 9 cm and 1.4 g cm−3 for the bottom 9 cm of the soil pot.
Table 3. Measured parameters during the faba bean cropping phase. The table shows the mean values of each sensor and plant-based measurement, with parameter groupings derived across the eight different treatment combinations of bulk density and volumetric water content for each soil type. Mean values of evapotranspiration (ET), normalized difference vegetation index (NDVI), and stomatal conductance (gs) are averaged across multiple weeks and multiple experimental units (soil pots) with the use of correlation and variance structures. Mean values for water-use efficiency (WUE), height, and above and below ground dry biomass were averaged across multiple experimental units (n = 48) at the end of the study. One plant was grown per experimental pot. Treatment combinations are defined in Table 2.
SoilBDWCAG BiomassR BiomassETHeightNDVIgsWUE
(g cm−3)(% vol)(g plant−1)(g plant−1)(mm pot−1 d−1)(cm)(unitless)(mmol m−2 s−1)(mg g−1 H2O)
Dark Grey Luvisol (Dapp)1.1339.2ab0.125a3.9B77.2ab0.305ab345.8BCD2.02a
4115.3c0.184a5.6DE94.7c0.370c413.6D2.14a
1.2339.9abc0.195a4.6BC79.8abc0.333bc271.7B2.09a
4114.2bc0.240a6.5E89.7bc0.367c388.1D2.03a
1.2/1.4338.6ab0.132a4.0B79.8abc0.302ab289.8BC2.12a
4113.9bc0.162a5.3CD93.0bc0.352c341.9BCD2.15a
1.4335.8a0.266a2.7A69.0a0.287a158.7A1.98a
4112.9bc0.121a5.7DE93.0bc0.352c367.8CD2.01a
Mean11.20.1784.884.50.334322.22.07
Black Chernozem (Lacombe)1.13313.5ABC0.236AB4.5B90.5AB0.366BC304.0abc2.34ab
4111.1AB0.105A5.2BC85.3AB0.345AB410.9d1.89a
1.23314.2ABC0.103A5.3BC92.8AB0.365ABC302.9abc2.21ab
4118.2C0.329B6.8D99.5B0.403C433.4d2.16ab
1.2/1.43313.7ABC0.114A4.6B95.8BC0.362ABC237.9ab2.41b
4111.4AB0.068A4.8BC91.3AB0.330AB382.8cd2.04ab
1.43310.2A0.101A3.1A78.3A0.323A215.8a2.50b
4116.05BC0.247AB5.6C100.3B0.375BC314.4bc2.21ab
Mean13.50.1635.091.80.359325.32.22
abcde: Lowercase letters indicate significant differences across compaction or water content treatment mean groupings at a critical level of 0.05, where uppercase letters indicate a significant interaction between compaction and water content treatments; BD: Bulk density treatment; WC: Water content treatment; AG Biomass: Aboveground dry biomass; R Biomass: Root dry biomass, ET: Evapotranspiration; Height: Faba bean final plant height; NDVI: Normalized difference vegetative index; gs: Stomatal conductance; WUE: Total water-use efficiency.

