Article

Physiological and Biochemical Mitigation of Tembotrione-Induced Phytotoxicity in Sorghum by Ascophyllum nodosum Extracts

by
Gabriel Bressiane Melo
1,
Alessandro Guerra da Silva
2,
Arthur Cunha França
2,
Ueric José Borges de Souza
3,
Marconi Batista Teixeira
4,
Layara Alexandre Bessa
3,
Wilker Alves Morais
4,
Jéssica Lauanda Stirle
4 and
Luciana Cristina Vitorino
3,*
1
Postgraduate Program in Agronomy, Goiano Federal Institute (IFGoiano), Rio Verde Campus, Rio Verde 75901-970, GO, Brazil
2
Postgraduate Program in Plant Production, University of Rio Verde (UniRV), University Campus, Fazenda Fontes do Saber, P.O. Box 104, Rio Verde 75901-970, GO, Brazil
3
Biodiversity Metabolism and Genetics Laboratory, Goiano Federal Institute (IFGoiano), Rio Verde Campus, Rio Verde 75901-970, GO, Brazil
4
Hydraulics and Irrigation Laboratory, Goiano Federal Institute (IFGoiano), Rio Verde Campus, Rio Verde 75901-970, GO, Brazil
*
Author to whom correspondence should be addressed.
Agronomy 2026, 16(9), 889; https://doi.org/10.3390/agronomy16090889
Submission received: 30 March 2026 / Revised: 24 April 2026 / Accepted: 25 April 2026 / Published: 28 April 2026
(This article belongs to the Section Plant-Crop Biology and Biochemistry)

Abstract

Weed interference and herbicide-induced phytotoxicity, particularly from HPPD inhibitors such as tembotrione, represent significant limitations to yield stability in grain sorghum. Developing strategies to enhance crop tolerance without compromising weed control is of high practical interest. This study tested the hypothesis that a commercial Ascophyllum nodosum-based biostimulant can mitigate tembotrione-induced oxidative stress and phytotoxicity in sorghum without compromising the weed-control activity of the herbicide. Sorghum plants at the V4 phenological stage (four fully expanded leaves) were subjected to five treatments: (1) untreated control; (2) biostimulant application alone; (3) tembotrione application alone; (4) simultaneous application of tembotrione and biostimulant; and (5) tembotrione followed by biostimulant application after six days of application (6 DAT). After 10 days of treatment, photosynthetic pigment synthesis, primary photochemistry, gas exchange, antioxidant metabolism, phytotoxicity levels, growth parameters, and yield indices were evaluated. The results support the hypothesis that A. nodosum-based biostimulants can act as effective mitigating agents. The biostimulant sustained carotenoid levels and preserved the stability of the photosynthetic apparatus (PSII), counteracting HPPD enzyme inhibition caused by the herbicide. Isolated biostimulant application upregulated net photosynthesis by 60%, while simultaneous co-application with tembotrione preserved membrane integrity and the leaf area index. Furthermore, the efficacy of the mitigation strategy was highly time-dependent, as simultaneous co-application proved superior to the delayed (6 DAT) intervention. From an agronomic perspective, the biostimulant reduced visual injury and restored the grain number per plant to control levels under simultaneous co-application, although the final yield of combined treatments did not differ statistically from either the untreated control or the treatment of tembotrione alone. This study shows that the integration of A. nodosum extracts into the chemical management of sensitive crops represents a viable biotechnological strategy to enhance herbicide selectivity and yield stability.

1. Introduction

Weed interference in sorghum, as in most cereal crops, represents a major constraint to yield stability. In the absence of effective control during the early stages after crop emergence, grain yield losses of 40–97% and biomass reductions of 18–80% have been reported, underscoring the critical importance of timely weed management in this crop [1,2,3]. This threat is particularly concerning given the increasing recognition of grain sorghum (Sorghum bicolor (L.) Moench) as a strategically important C4 cereal for food and feed security in tropical and subtropical regions, where its intrinsic tolerance to heat and intermittent drought allows reliable production under conditions of rising climatic variability [4,5].
Despite its agronomic relevance, the range of herbicides registered for sorghum remains limited, especially for the post-emergence control of grass weeds. In many production systems, atrazine remains the primary chemical option, with little or no selective post-emergence graminicide available [6,7,8,9,10]. This scarcity is compounded by the evolution of herbicide-resistant weed biotypes and the high yield penalties observed when weeds are left uncontrolled, with average grain sorghum yield losses of approximately 47% estimated for major producing regions in the United States [3,10]. Together, these factors highlight the need for additional selective herbicide tools that can be integrated into sustainable weed management programs for sorghum [4,11].
Among the post-emergence herbicides with broad-spectrum activity against grass and broadleaf weeds, tembotrione (a triketone) has attracted interest because of its high efficacy, including against some herbicide-resistant species [4,11,12]. Tembotrione inhibits 4-hydroxyphenylpyruvate dioxygenase (HPPD, EC 1.13.11.27), a non-heme iron oxygenase required for the synthesis of plastoquinone and tocopherols [6,11]. Because plastoquinone is an obligate cofactor for key carotenoid desaturases, HPPD inhibition depletes carotenoids, which serve as essential photoprotective pigments [6,11]. The resulting impairment of carotenoid-mediated energy dissipation leads to photooxidative damage, characterized by bleaching of meristematic tissues, chlorophyll destruction, membrane disruption, and ultimately, plant death in susceptible species [6,11,12].
Maize exhibits high selectivity to tembotrione, largely attributed to rapid cytochrome P450-mediated detoxification, whereas sorghum generally shows only partial and genotype-dependent tolerance [4,6]. Field and greenhouse studies have documented substantial variation among sorghum hybrids in the intensity and persistence of tembotrione injury, with yield reductions often exceeding 25–60% at labeled or slightly higher doses, particularly when mixed with atrazine [4,6,11]. Recent genetic analyses indicate that reduced sensitivity to HPPD inhibitors in sorghum is a partially dominant, polygenic trait associated with enhanced P450-mediated metabolism; however, this level of resistance is not yet widely available in commercial hybrids [4]. Consequently, strategies that can increase crop tolerance without compromising weed control are of considerable practical interest.
Biostimulants derived from the brown macroalga Ascophyllum nodosum have emerged as promising tools to improve plant performance under abiotic and biotic stress. Across multiple crops, these extracts have been shown to enhance growth and productivity, increase antioxidant capacity, and improve tolerance to drought, salinity, temperature extremes, and toxic elements [13,14,15,16,17,18,19]. A. nodosum extracts contain a complex mixture of bioactive compounds, including polysaccharides, betaines, polyamines, phenolics, amino acids, and hormone-like substances, which can modulate redox homeostasis, activate antioxidant enzymes, sustain photosynthetic pigment content, and influence stomatal conductance and carboxylation efficiency. Such effects are mechanistically compatible with the mitigation of HPPD inhibitor injury, as both herbicidal damage and the biostimulant’s protective action converge on carotenoid integrity, reactive oxygen species (ROS) balance, and photosystem II (PSII) function [17,18,19,20].
Although the stress-alleviating properties of A. nodosum-based biostimulants have been documented in several C3 and C4 crops, their specific ability to attenuate phytotoxicity from HPPD-inhibiting herbicides in sorghum has not been systematically evaluated [15,16,17,18,19]. Sorghum’s specialized C4 photosynthetic anatomy and biochemistry may condition responses to both chemical stress and biostimulant treatment in ways that differ from those of model or horticultural species more commonly used in biostimulant research [4,5]. Furthermore, the influence of application timing—whether the biostimulant is applied concurrently with or after herbicide exposure—on physiological, biochemical, and yield responses remains largely unexplored.
This study tested the hypothesis that a commercial A. nodosum-based biostimulant can mitigate tembotrione-induced phytotoxicity in grain sorghum. Specifically, the objectives were to (i) quantify the extent to which the biostimulant modifies visual injury, physiological functioning, and productivity of tembotrione-treated plants, and (ii) elucidate the underlying physiological and biochemical mechanisms, with particular emphasis on ROS metabolism, pigment status, and gas-exchange traits affected by two different biostimulant application timings: simultaneously with herbicide application and six days after herbicide application (6 DAT).

2. Materials and Methods

2.1. Experiment Management Conditions

The experiment was conducted in an acclimatized greenhouse (average temperature of 27 °C and 65% relative humidity) at the Laboratory of Ecophysiology and Plant Production of the Instituto Federal Goiano–Rio Verde Campus (17°48′11.0″ S, 50°54′31.8″ W, 749 m altitude), between October 2024 and February 2025.
The study was conducted using a completely randomized design with five treatments and four replications, totaling 20 experimental plots. The treatments were as follows: (1) control, (2) biostimulant application, (3) tembotrione application, (4) tembotrione applied simultaneously with biostimulant, and (5) tembotrione followed by biostimulant application six days after the herbicide (6 DAT). The 6-day interval was selected based on preliminary observations indicating that visible phytotoxic symptoms of tembotrione in sorghum typically emerge between 4 and 7 days after application, and on previous reports showing that HPPD-inhibitor-induced bleaching and carotenoid depletion reach peak severity within the first week after exposure [11]; this timing was therefore considered a physiologically relevant window for a curative biostimulant intervention. Tembotrione was applied at a dose of 120 g a.i. ha−1. The biostimulant used was Megafol® (Valagro, Atessa, CH, Italy), a product derived from natural compounds, including urea, potassium acetate, vinasse, and seaweed extract. Its chemical composition included 9% organic carbon (Corg), 8% K2O, 3% N, and 79% inert ingredients [21]. The biostimulant was applied as a foliar spray at a dose of 1.0 L c.p. ha−1, and tembotrione was likewise applied by foliar spraying, using the same sprayer configuration described below.
The experimental plots comprised 10 L polyethylene pots, distributed evenly and equidistantly on the benches. The cultivation substrate was a 2:1 (v/v) mixture of soil collected from the 0–20 cm layer of a dystroferric red latosol (Oxisol) and sand. Prior to sowing, the substrate underwent liming and phosphogypsum application for chemical correction, followed by fertilization according to crop recommendations [22]. The grain sorghum hybrid used was Buster®, an early-cycle variety. Five seeds were sown per pot at a depth of 2 cm, and thinning was performed seven days after emergence (DAE) to maintain three plants per pot. Irrigation was conducted daily, maintaining the moisture content at approximately 90% of field capacity.
To induce herbicide intoxication, treatments containing tembotrione were applied when the plants reached the V4 phenological stage. Applications were performed using a CO2-pressurized backpack sprayer (Agropeq, Sertãozinho, SP, Brazil) equipped with a four-nozzle boom (TT 110.02 double flat-fan nozzles), with a nozzle spacing of 0.5 m and a boom height set at 0.4 m above the plant canopy. The sprayer was calibrated to a working pressure of 245 kPa (2.5 kgf cm−2), delivering a spray volume of 250 L c.p. ha−1. All applications were carried out at 08:00 AM on the same day under consistent environmental conditions. Meteorological conditions during the application were monitored to ensure good uniformity and deposition of the mixture on the surface of the leaves, in addition to avoiding the risk of drift (temperature below 25 °C, relative humidity above 60%, and wind speed below 10 km h−1). Physiological and morphological assessments, as well as the collection of leaf tissues for metabolic analyses, were conducted ten days after tembotrione application (DAA). For these evaluations, two of the three plants initially grown per pot were randomly selected and used for destructive sampling of leaf tissue (metabolic and oxidative-stress analyses) and for morphological/biomass measurements; the third plant, which remained intact, was retained in each pot for yield component analysis (see Section 2.5), thereby ensuring that physiological and agronomic data originated from distinct plant sets.

2.2. Assessment of Chloroplast Pigments, Gas Exchange and Chlorophyll a Fluorescence

To determine the concentration of chloroplast pigments, three leaf discs with a diameter of 0.5 cm were immersed in 5 mL of dimethyl sulfoxide saturated with calcium carbonate (CaCO3) in flasks protected from light. After 6 h of incubation of the samples at 60 °C, absorbance readings of the extract were taken at wavelengths of 665, 649, and 480 nm. Chlorophyll a, b, and total content, the ratio between chlorophyll a and b, and carotenoid content were determined. Pigment concentrations were calculated according to the equations proposed by Wellburn [23].
Gas exchange and chlorophyll a fluorescence variables were measured on the central leaflet of the youngest fully expanded leaf. Assessments were conducted between 8:00 and 11:00 AM under clear-sky conditions using an infrared gas analyzer equipped with a fluorometer (model LI-6400xt, LI-COR Inc., Lincoln, NE, USA). The chamber was set to a constant photosynthetic photon flux density (PPFD) of 1500 µmol m−2 s−1, with a CO2 concentration of 400 ppm, a temperature of 25 °C, and a relative humidity of 50%. The recorded gas exchange parameters included net photosynthetic rate (A µmol CO2 m−2 s−1), transpiration rate (E µmol H2O m−2 s−1), stomatal conductance to water vapor (gsw mmol H2O m−2 s−1), the ratio between internal and external CO2 concentrations (Ci/Ca), water-use efficiency (WUE), and carboxylation efficiency (A/Ci).
Chlorophyll a fluorescence was measured on the same leaflets using a fluorometer coupled to an IRGA. The determined variables included the effective quantum yield of photosystem II (PSII; ϕPSII) [24], apparent electron transport rate (ETR) [25], non-photochemical quenching (NPQ), and the maximum quantum yield of PSII (Fv/Fm) [26].

2.3. Assessment of Oxidative Stress

Leaf samples were collected, immediately frozen in liquid nitrogen, and stored at −80 °C until analysis. Enzyme extraction was performed by macerating 200 mg of fresh leaf tissue in liquid nitrogen with 50% (w/w) polyvinylpolypyrrolidone (PVPP), following the protocol described by Biemelt et al. [27]. The extraction buffer consisted of 100 mM potassium phosphate (pH 7.8), 0.1 mM EDTA, and 10 mM ascorbic acid. The homogenate was centrifuged at 13,000× g for 10 min at 4 °C and the supernatant was used to determine the activities of superoxide dismutase (SOD), catalase (CAT), guaiacol peroxidase (POX), and ascorbate peroxidase (APX).
SOD activity was measured following Giannopolitis and Ries [28] based on the enzyme’s ability to inhibit the photoreduction of nitroblue tetrazolium (NBT). The reaction mixture contained 50 mM potassium phosphate buffer (pH 7.8), 14 mM methionine, 0.1 µM EDTA, 75 µM NBT, and 2 µM riboflavin. Samples were illuminated under a 20 W fluorescent lamp for 7 min, and absorbance was measured at 560 nm. One unit of SOD activity was defined as the amount of enzyme required to inhibit NBT photoreduction by 50%, and the results were expressed as U mg−1 protein.
CAT activity was determined according to Havir and McHale [29] by monitoring the decrease in absorbance at 240 nm resulting from H2O2 consumption. The reaction mixture contained a 100 mM potassium phosphate buffer (pH 7.0) and 12.5 mM H2O2, and absorbance was recorded every 15 s for 3 min. An extinction coefficient of 36 mM−1 cm−1 was used, and CAT activity was expressed as µmol H2O2 min−1 mg−1 protein. POX activity was determined according to Fang and Kao [30] by monitoring tetraguaiacol formation at 470 nm. The reaction mixture contained 50 mM sodium phosphate buffer (pH 6.0) and 0.13% guaiacol, and the reaction was initiated by adding 0.15% H2O2 (3 min). Absorbance was recorded using an extinction coefficient of 26.6 mM−1 cm−1. POX activity was expressed as µmol H2O2 min−1 mg−1 protein.
APX activity was assayed following Nakano and Asada [31] by measuring ascorbate oxidation at 290 nm every 15 s for 3 min. The reaction medium consisted of 100 mM potassium phosphate buffer (pH 7.0), 0.5 mM ascorbic acid, and 0.1 mM H2O2. An extinction coefficient of 2.8 mM−1 cm−1 was used, and APX activity was expressed as µmol ascorbate (AsA) min−1 mg−1 protein.
Cell membrane damage was measured by evaluating hydrogen peroxide (H2O2) content [32] and electrolyte leakage rate (EL) [33].

2.4. Symptomatology and Morphological Assessments

Visual assessments of phytotoxicity were conducted using the EWRC scale [34], with scores ranging from 1 to 9. The scale was defined as follows: 1, no symptoms; 2, minor changes (discoloration or deformation) visible in a few plants; 3, visible changes (chlorosis or wilting) in many plants; 4, pronounced discoloration or moderate deformation without necrosis; 5, necrosis in some leaves accompanied by leaf and shoot deformation; 6, growth reduction, leaf wilting, and necrosis; 7, over 80% leaf destruction; 8, extremely severe damage with only small green areas remaining; and 9, plant death.
Morphological parameters were assessed by quantifying the leaf area index (LAI, m2 cm−2), plant height (PH, cm), leaf number per plant (LN), stem dry mass (SDM, g plant−1), leaf dry mass (LDM, g plant−1), and root dry mass (RDM, g plant−1). PH was measured from the stem base to the apex of the flag leaf. To determine the dry mass of stems, leaves, and roots, samples were harvested, dried to a constant weight in a forced-air circulation oven at 65 °C, and subsequently weighed. The LAI was estimated using the ImageJ software, version 1.54, following the methodology described by Cosmulescu et al. [35].

2.5. Agronomic Assessments

After physiological, metabolic, and morphological assessments, the plants were thinned to one per pot and grown to maturity for yield component analysis. The yield components were as follows: number of grains per plant (NGP grains plant−1), hundred-grain weight (HGW g 100 grains−1), and plant yield (g plant−1). HGW was determined by weighing a representative sample with a moisture content adjusted to 13%, and plant yield was obtained by harvesting and threshing all panicles, with final weights also corrected to 13% moisture.

2.6. Statistical Analysis

The experiment was conducted in a randomized complete block design. As no block effect was detected, the data were analyzed as a completely randomized design using a one-way analysis of variance (ANOVA) to test for treatment effects via the F-test (p ≤ 0.05). When significant effects were detected, means of the response variables were compared using Tukey’s test (p ≤ 0.05). Subsequently, all variables were evaluated through a correlation matrix and integrated via Principal Component Analysis (PCA) using the prcomp function from the stats package. The number of principal components was determined based on eigenvalues > 1.0 and a cumulative variance explained > 70%. All statistical analyses were performed in the R software environment, version 4.5.1 [36] and generative AI tools were used to assist in data interpretation.

3. Results

Leaf chlorophyll metrics were unaffected by treatment (Figure 1A–D). Specifically, one-way analysis of variance (ANOVA) showed no differences in chlorophyll a (F = 0.64, p = 0.644), chlorophyll b (F = 0.44, p = 0.776), total chlorophyll (F = 0.45, p = 0.772), or the chlorophyll a/b ratio (F = 0.64, p = 0.644). However, carotenoid content differed markedly among treatments (F = 224.5, p < 0.001; Figure 1E). According to Tukey’s honest significant difference (HSD) test, the Biostimulant treatment ranked highest (0.600 mg g−1 FW; group a), followed by the untreated Control (0.528 mg g−1 FW; group b). Both tembotrione-biostimulant regimes showed intermediate carotenoid concentrations (0.433 and 0.425 mg g−1 FW; group c), whereas tembotrione alone yielded the lowest value (0.305 mg g−1 FW; group d).
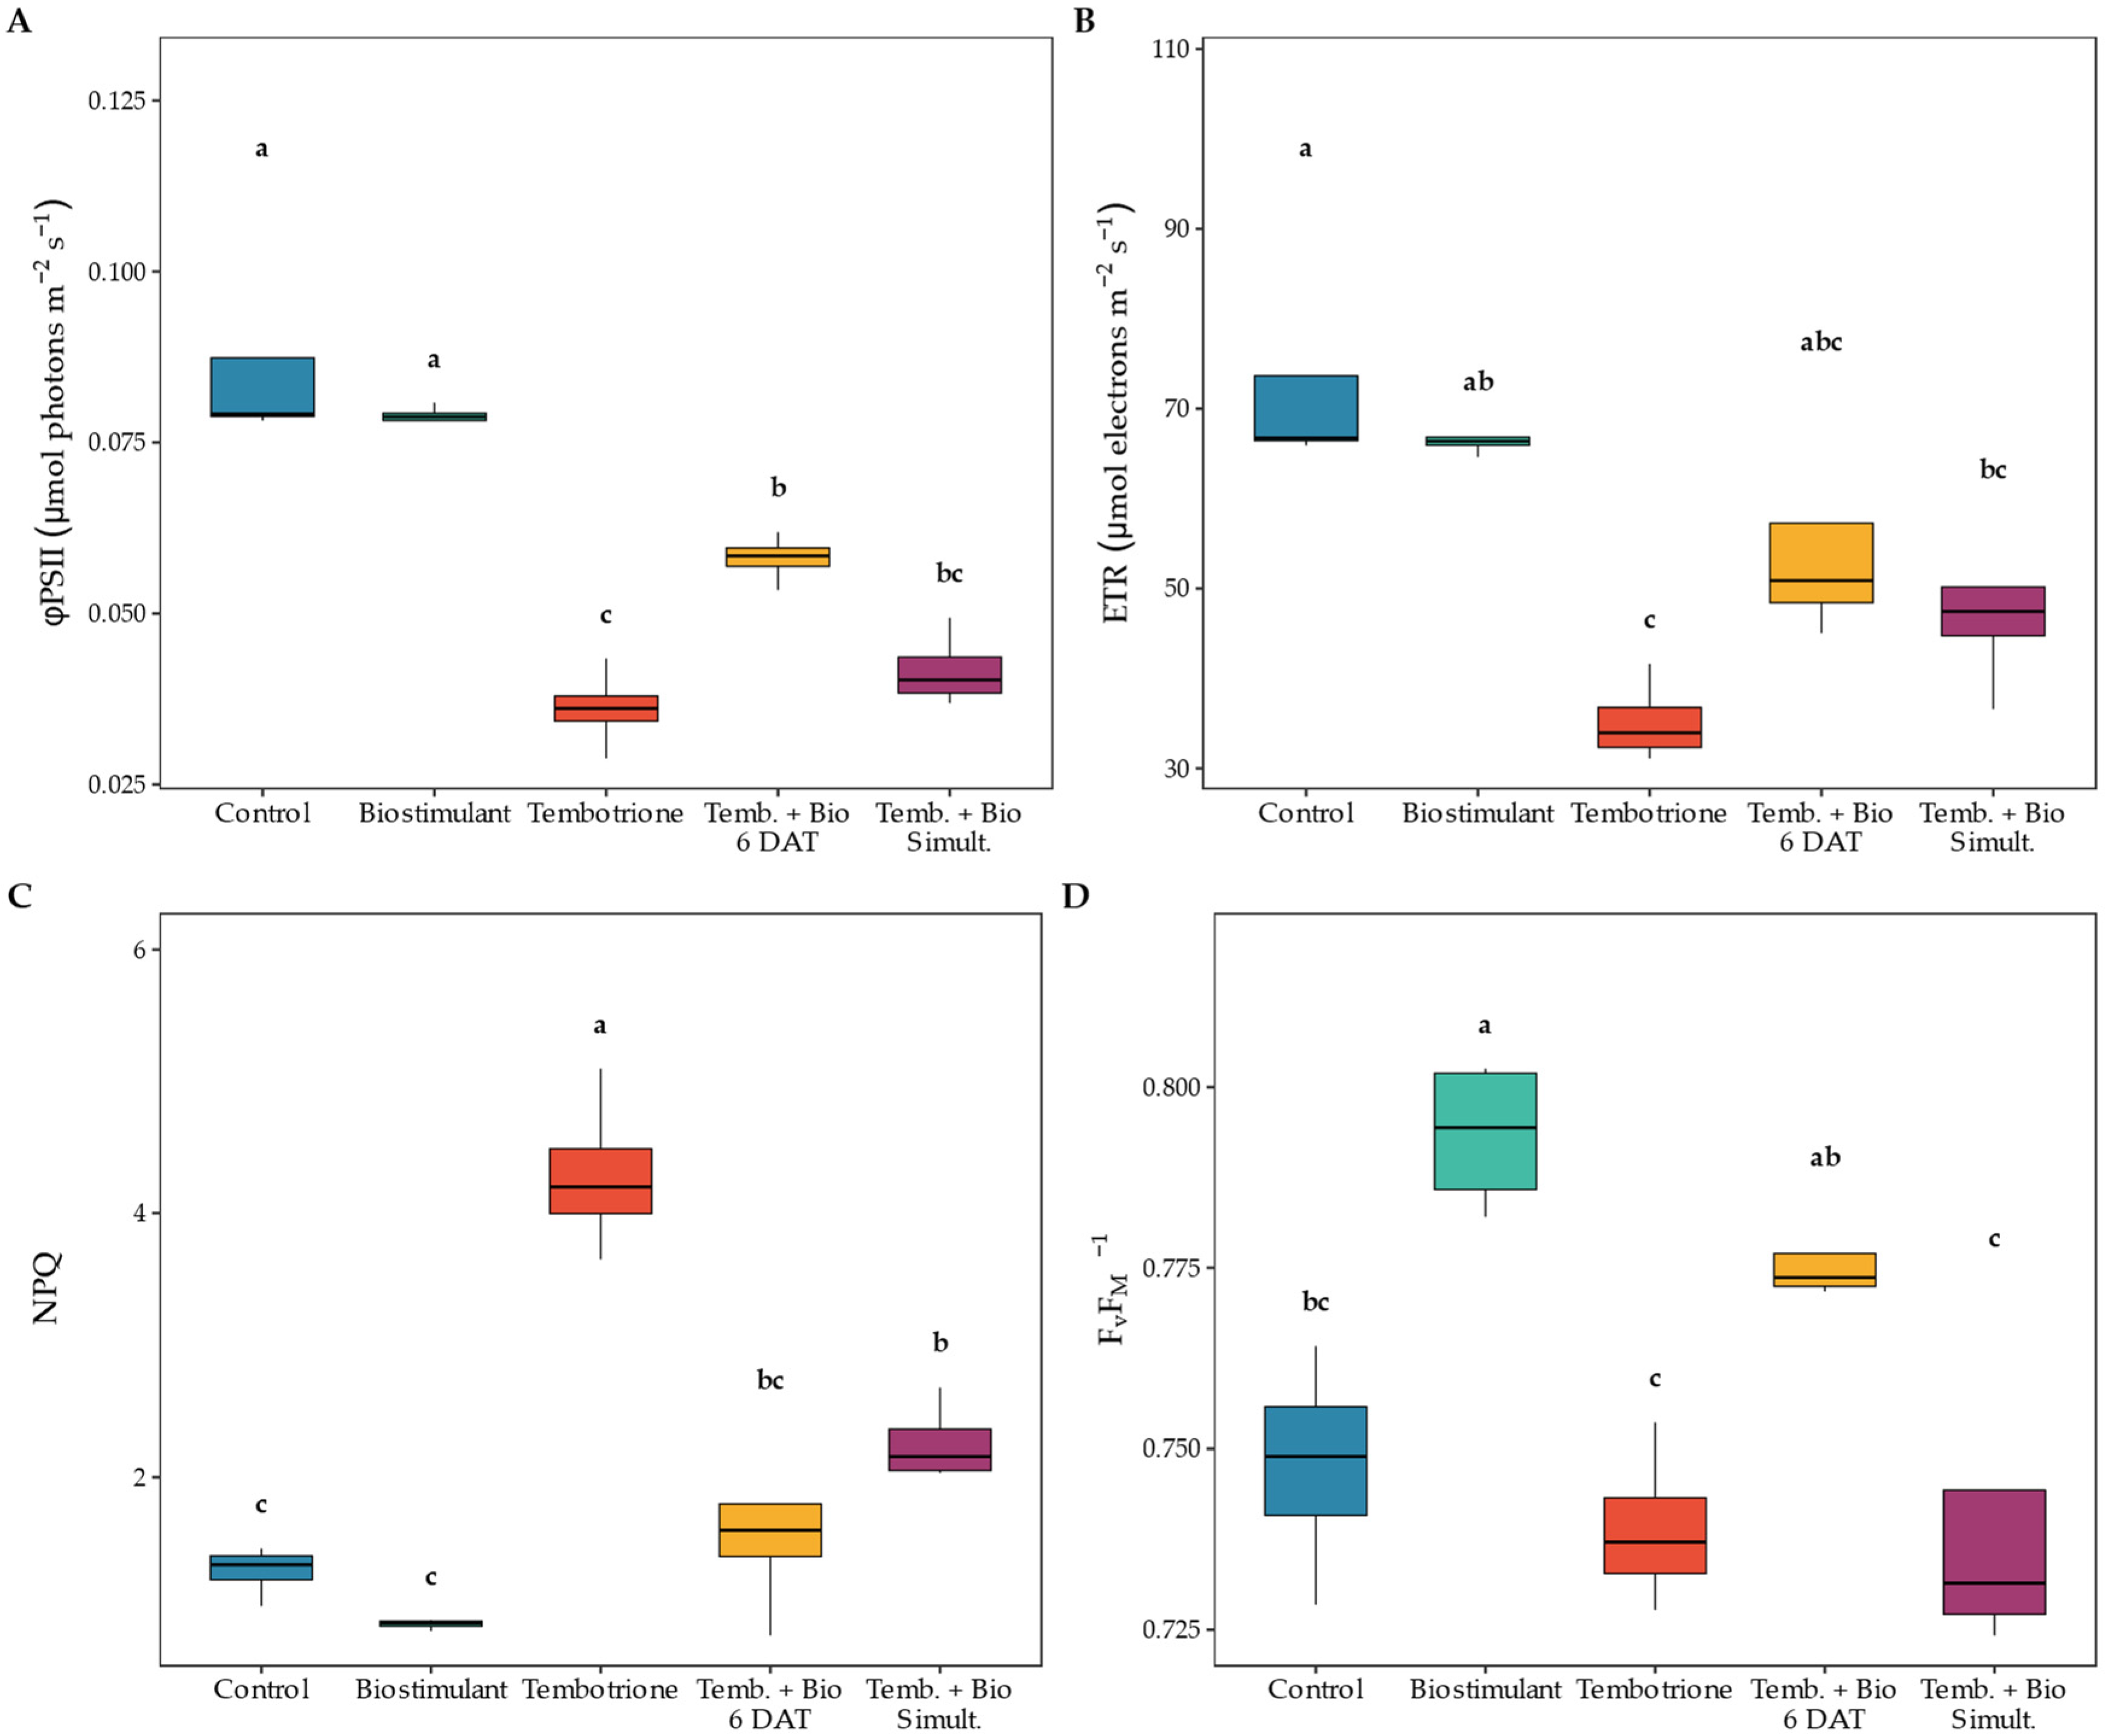
All four chlorophyll fluorescence parameters responded significantly to treatment. First, the effective quantum yield of PSII photochemistry (ΦPSII) decreased strongly following herbicide application (F = 28.54, p < 0.001). Control and Biostimulant plants had the highest ΦPSII (0.087 ± 0.008 and 0.079 ± 0.001, respectively; group a), whereas tembotrione alone reduced ΦPSII by approximately 60% (0.036 ± 0.003; group c). Combined treatments were intermediate but still lower than those of untreated plants (groups b and bc; Figure 2A). Similarly, the electron transport rate (ETR) followed a comparable pattern (F = 10.41, p < 0.001). The mean ETR in Control leaves (73.4 ± 6.9 μmol e m−2 s−1) exceeded that in tembotrione-treated leaves by >50% (35.2 ± 2.31 μmol e m−2 s−1). The Biostimulant alone maintained a relatively high ETR (66.4 ± 0.718 μmol e m−2 s−1), whereas the mixture schedule showed intermediate rates (47.5 ± 4.44 μmol e m−2 s−1) (Figure 2B).
In non-photochemical quenching (NPQ), the ranking was reversed (F = 39.23, p < 0.001). Tembotrione resulted in the highest NPQ levels (4.29 ± 0.302; group a), indicating increased thermal dissipation under stress. The biostimulant alone showed the lowest NPQ (0.88 ± 0.018; group c), with the Control slightly higher (1.29 ± 0.096; group c). Both combination treatments somewhat mitigated the increase in NPQ caused by tembotrione (groups b and bc; Figure 2C). The maximum quantum yield of PSII (FV/FM) differed less markedly among treatments (F = 11.91, p < 0.001). The Biostimulant group had the highest FV/FM values (0.793 ± 0.005; group a), while tembotrione alone (0.739 ± 0.003; group c) and the simultaneous mixture recorded the lowest values (0.74 ± 0.011; group c). The 6-DAT mixture (0.776 ± 0.003) and Control showed intermediate values (0.748 ± 0.008) (Figure 2D).
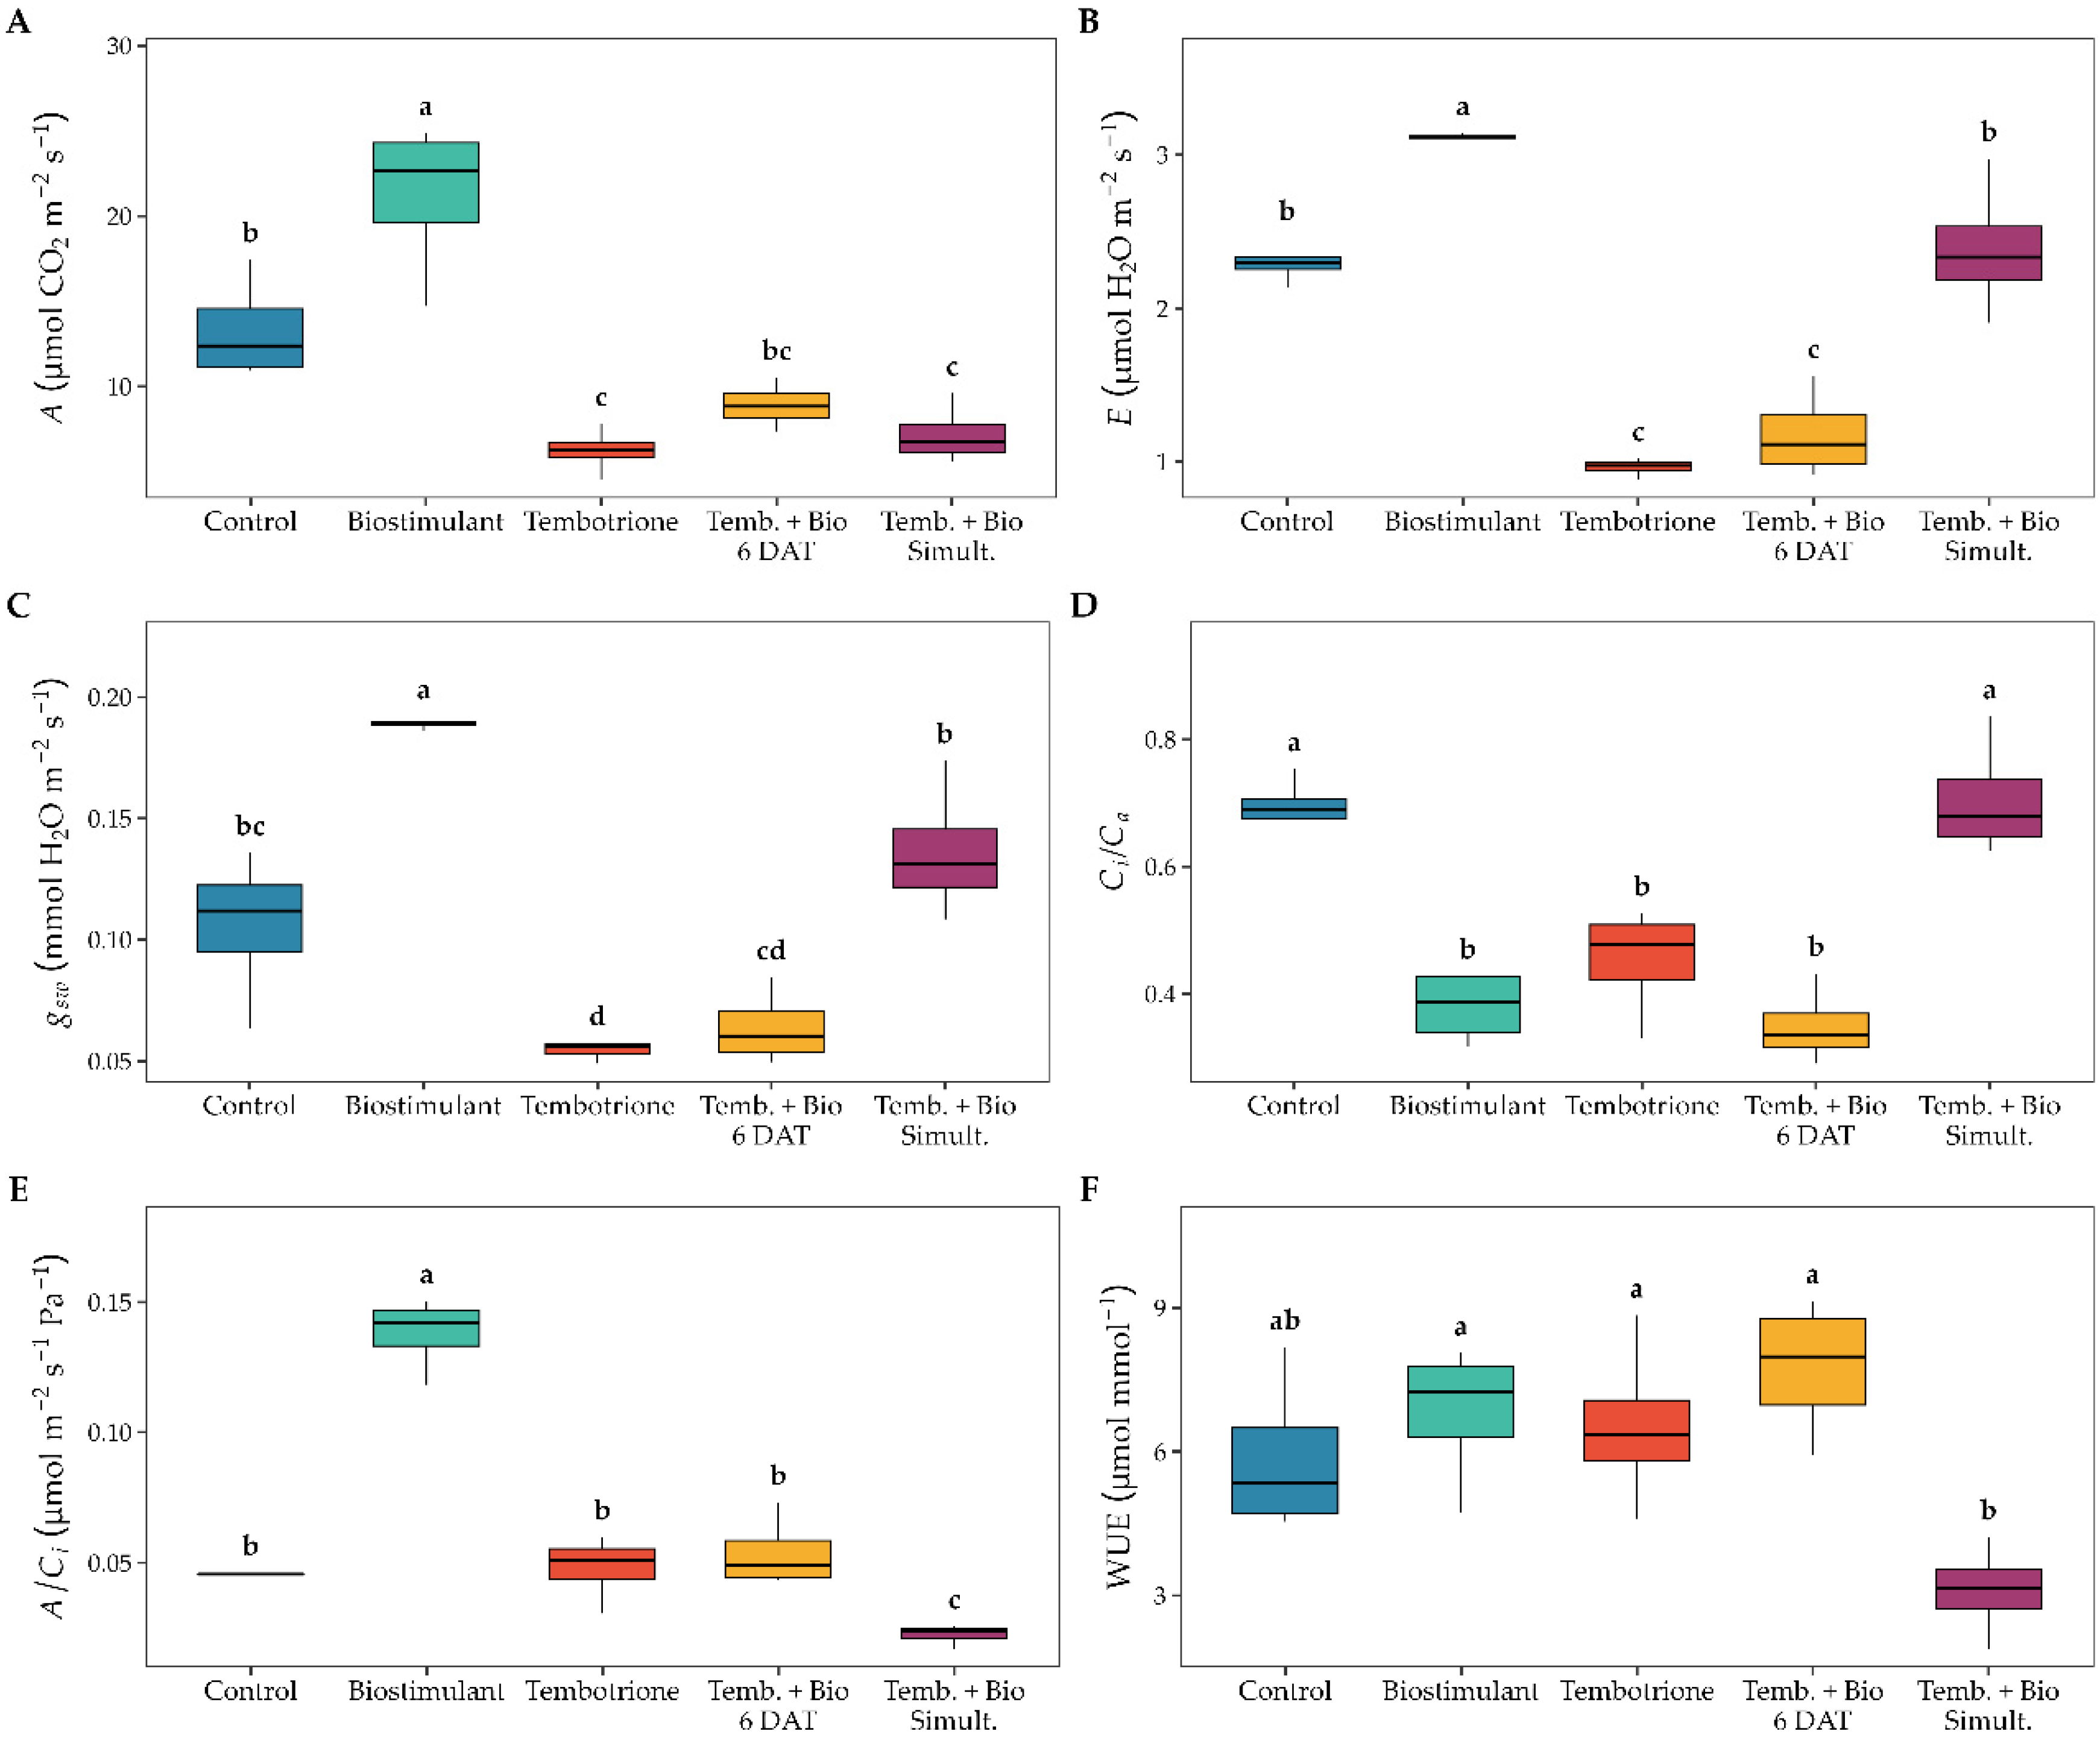
Herbicide–biostimulant treatments significantly affected leaf gas exchange parameters (Figure 3A–F). Net photosynthesis (A) was notably affected (F = 20.37, p < 0.001), with the Biostimulant treatment reaching the highest levels (21.23 ± 2.31 µmol CO2 m−2 s−1; group a), approximately 60% higher than the untreated Control (13.29 ± 1.51 µmol CO2 m−2 s−1; group b). Tembotrione alone decreased A by 53% relative to the Control (6.24 ± 0.67 µmol CO2 m−2 s−1; group c), and neither the combined regime fully restored carbon assimilation, with Temb.+Bio 6 DAT (8.90 ± 0.67 µmol CO2 m−2 s−1; group bc) and Temb.+Bio Simult. (7.18 ± 0.87 µmol CO2 m−2 s−1; group c) remaining well below Control levels.
The transpiration rate (E) followed a similar pattern (F = 54.23, p < 0.001; Figure 3B). The Biostimulant treatment resulted in the highest water loss (3.12 ± 0.01 µmol H2O m−2 s−1; group a), while Tembotrione alone (0.96 ± 0.03 µmol H2O m−2 s−1) and Temb.+Bio 6 DAT (1.18 ± 0.14 µmol H2O m−2 s−1) showed the lowest values (group c), indicating severe stomatal restriction. The Control (2.29 ± 0.07 µmol H2O m−2 s−1) and Temb.+Bio Simult. (2.39 ± 0.22 µmol H2O m−2 s−1) were statistically similar (group b), suggesting that simultaneous co-application largely maintained transpiration capacity. Stomatal conductance (gsw) followed the same patterns (F = 30.91, p < 0.001; Figure 3C). The Biostimulant group showed the highest gsw (0.189 ± 0.001 mmol H2O m−2 s−1; group a), while tembotrione alone caused the greatest stomatal closure (0.055 ± 0.002 mmol H2O m−2 s−1; group d). Temb.+Bio 6 DAT remained similarly restricted (0.064 ± 0.008 mmol H2O m−2 s−1; group cd), whereas the simultaneous combined application (0.136 ± 0.014 mmol H2O m−2 s−1; group b) and the Control (0.106 ± 0.015 mmol H2O m−2 s−1; group bc) occupied intermediate positions.
The Ci/Ca ratio differed significantly across treatments (F = 22.57, p < 0.001; Figure 3D). The highest ratios were observed in the Control and Temb.+Bio Simul. groups (0.691 ± 0.026 and 0.705 ± 0.047; group a), indicating open stomata that allowed unrestricted CO2 diffusion. In contrast, Tembotrione alone, the Biostimulant, and Temb.+Bio 6 DAT showed lower ratios (0.453 ± 0.044, 0.379 ± 0.028, and 0.348 ± 0.030; group b). Notably, the low Ci/Ca observed in the Biostimulant treatment does not indicate stomatal limitation; rather, the high gsw and elevated A in this group suggest that rapid CO2 consumption driven by enhanced carboxylation activity explains the lower intercellular CO2 concentration. Carboxylation efficiency (A/Ci) was the most distinguishing variable (F = 69.81, p < 0.001; Figure 3E). The Biostimulant treatment yielded an A/Ci nearly three times higher than all other groups (0.138 ± 0.007 µmol m−2 s−1 Pa−1; group a), pointing to enhanced Rubisco activity or electron supply. The Control, Tembotrione alone, and Temb.+Bio 6 DAT groups showed intermediate efficiencies (0.046 ± 0.000, 0.048 ± 0.006, and 0.054 ± 0.007 µmol m−2 s−1 Pa−1; group b), whereas simultaneous co-application demonstrated the lowest A/Ci (0.022 ± 0.002 µmol m−2 s−1 Pa−1; group c), indicating reduced biochemical capacity for carboxylation despite relatively open stomata.
Water-use efficiency (WUE) showed the smallest yet still significant treatment effect (F = 5.65, p = 0.006; Figure 3F). The highest WUE values were observed in Temb.+Bio 6 DAT, Biostimulant, and Tembotrione alone (7.76 ± 0.72, 6.82 ± 0.74, and 6.54 ± 0.87 µmol mmol−1, respectively; group a), with the Control showing an intermediate value (5.86 ± 0.83 µmol mmol−1; group ab). The lowest WUE was recorded for the Temb.+Bio Simult. treatment (3.11 ± 0.48 µmol mmol−1; group b), reflecting a disproportionate recovery of transpiration relative to carbon gain under this application schedule. Overall, these findings indicate that biostimulant application alone significantly enhances photosynthetic capacity and stomatal function, whereas co-application with tembotrione, although partially restoring stomatal aperture and transpiration, does not fully restore carboxylation efficiency and therefore reduces carbon-use efficiency.
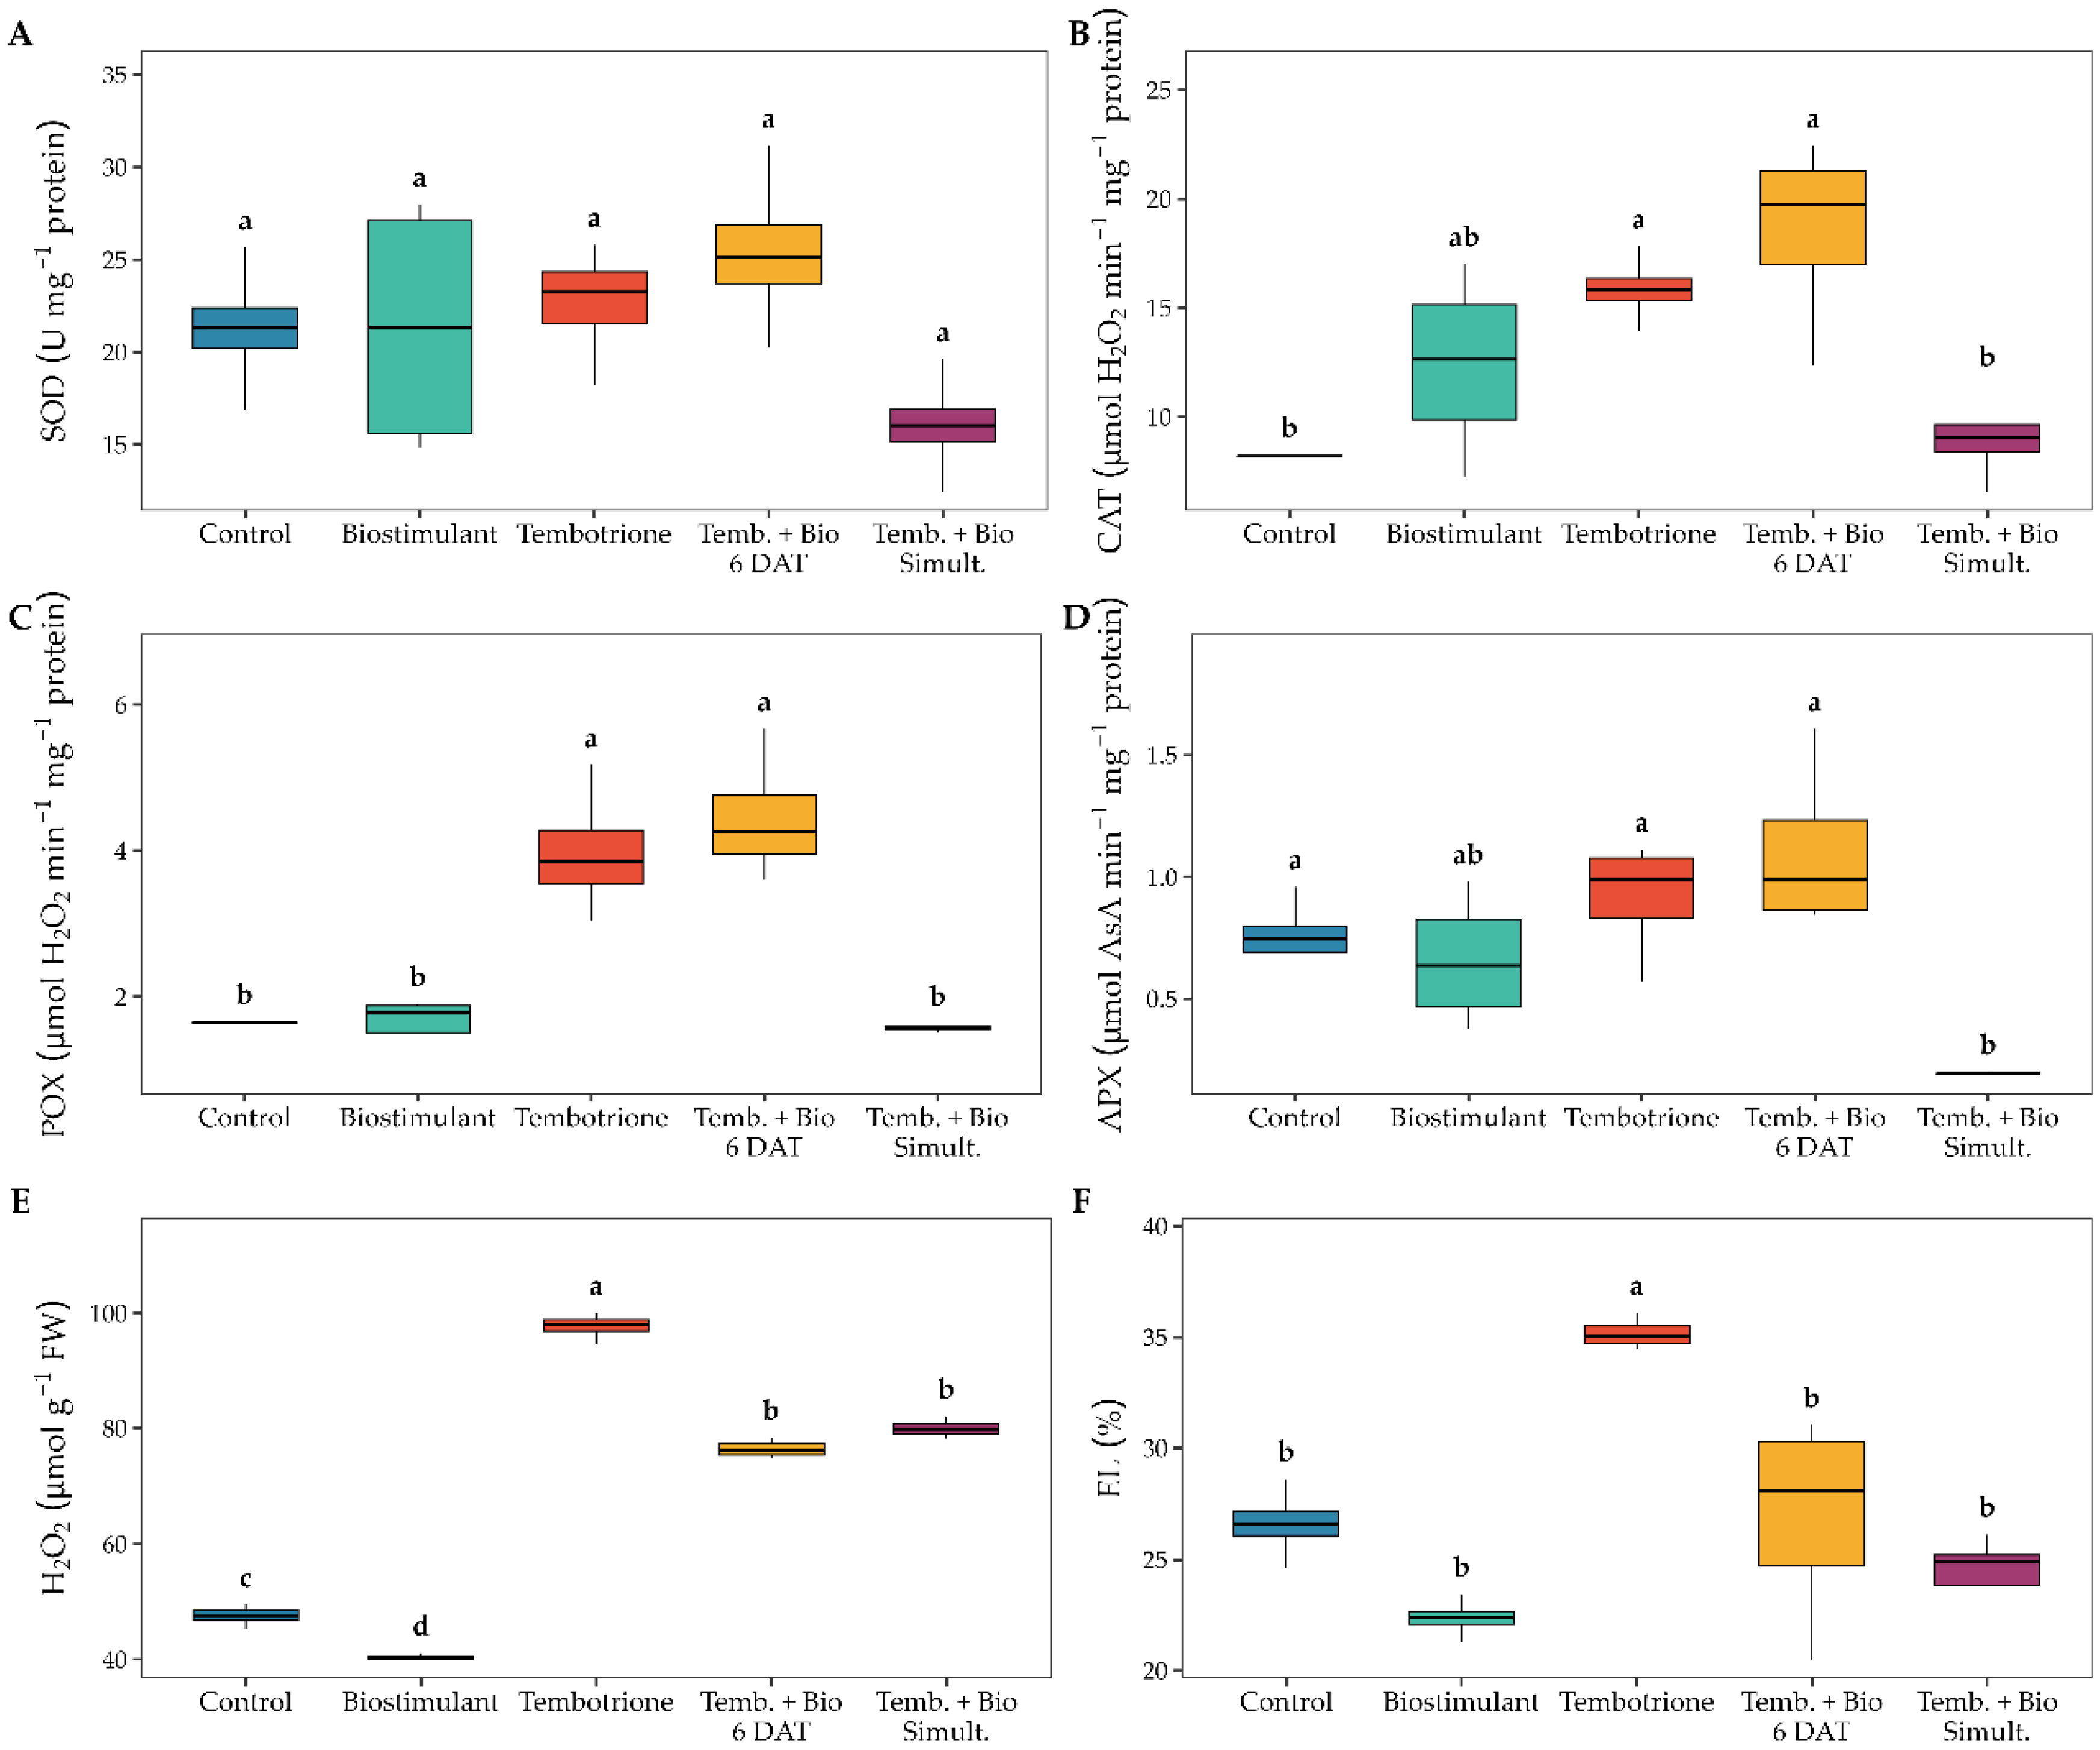
The activities of antioxidant enzymes and markers of oxidative stress responded differently to herbicide–biostimulant treatments (Figure 4A–F). Superoxide dismutase (SOD) activity was not significantly influenced by any treatment (F = 2.32, p = 0.105; Figure 4A), with values ranging from 16.04 ± 1.47 U mg−1 protein (Temb.+Bio Simult.) to 25.44 ± 2.24 U mg−1 protein (Temb.+Bio 6 DAT). This indicates that the capacity for O2 dismutation remained stable across all treatment conditions.
CAT activity varied significantly across treatments (F = 8.78, p < 0.001; Figure 4B). The highest CAT activity was observed in Temb.+Bio 6 DAT and Tembotrione alone (18.57 ± 2.22 and 15.86 ± 0.79 µmol H2O2 min−1 mg−1 protein, respectively; group a), while the lowest activity was recorded in the Control and Temb.+Bio Simult. groups (8.19 ± 0.02 and 9.03 ± 1.01 µmol H2O2 min−1 mg−1 protein; group b). The Biostimulant alone showed intermediate activity (12.38 ± 2.14 µmol H2O2 min−1 mg−1 protein; group ab), indicating partial H2O2 scavenging activation. Peroxidase (POX) activity exhibited a similar pattern (F = 23.25, p < 0.001; Figure 4C), with Tembotrione alone and Temb.+Bio 6 DAT recording the highest activity (3.98 ± 0.45 and 4.45 ± 0.44 µmol H2O2 min−1 mg−1 protein, respectively; group a), approximately 2.5 times higher than the Control, Biostimulant, and Temb.+Bio Simult. treatments (1.65 ± 0.003, 1.60 ± 0.23, and 1.57 ± 0.03 µmol H2O2 min−1 mg−1 protein, respectively; group b). The parallel increase in CAT and POX activities under tembotrione treatment, with or without delayed biostimulant application, suggests an active oxidative stress response not triggered by co-application.
Ascorbate peroxidase (APX) activity showed significant differences among treatments (F = 8.14, p = 0.001; Figure 4D). The highest APX activity was observed in Temb.+Bio 6 DAT (1.107 ± 0.177 µmol ASA min−1 mg−1 protein; group a), followed by treatments with Tembotrione alone and the Control (0.918 ± 0.122 and 0.745 ± 0.088 µmol ASA min−1 mg−1 protein, respectively; both group a). The Biostimulant treatment recorded lower activity (0.658 ± 0.136 µmol ASA min−1 mg−1 protein; group ab). Remarkably, the Temb.+Bio Simult. treatment significantly reduced APX activity to 0.192 ± 0.003 µmol ASA min−1 mg−1 protein (group b), representing nearly an 80% decrease compared to the 6 DAT regime, indicating that simultaneous application likely interferes with the ascorbate–glutathione cycle.
Hydrogen peroxide (H2O2) showed the greatest responsiveness among the variables (F = 837.12, p < 0.001; Figure 4E). Tembotrione alone produced the highest H2O2 accumulation, reaching 97.73 ± 1.13 µmol g−1 FW (group a), approximately twice the Control level of 47.53 ± 0.88 µmol g−1 FW (group c). Combined treatments—Tembotrione + Biostimulant at 6 DAT and simultaneous application—slightly lowered H2O2 levels to 76.53 ± 0.77 and 80.03 ± 0.83 µmol g−1 FW, respectively (group b), but did not reduce them to Control levels. The biostimulant alone resulted in the lowest H2O2 content (40.35 ± 0.27 µmol g−1 FW; group d), demonstrating its inherent ability to reduce reactive oxygen species accumulation.
Electrolyte leakage (EL), a key indicator of membrane integrity, closely reflected the pattern of oxidative stress (F = 14.91, p < 0.001; Figure 4F). Tembotrione alone caused the greatest membrane damage, with EL reaching 35.16 ± 0.36% (group a). All remaining treatments were statistically similar (group b), with the Biostimulant showing the lowest EL (22.37 ± 0.44%), followed by Temb.+Bio Simult. (24.16 ± 1.18%), the Control (26.62 ± 0.81%), and Temb.+Bio 6 DAT (26.92 ± 2.39%), indicating that both co-application schedules and the biostimulant alone were equally effective at maintaining membrane integrity relative to the Control.
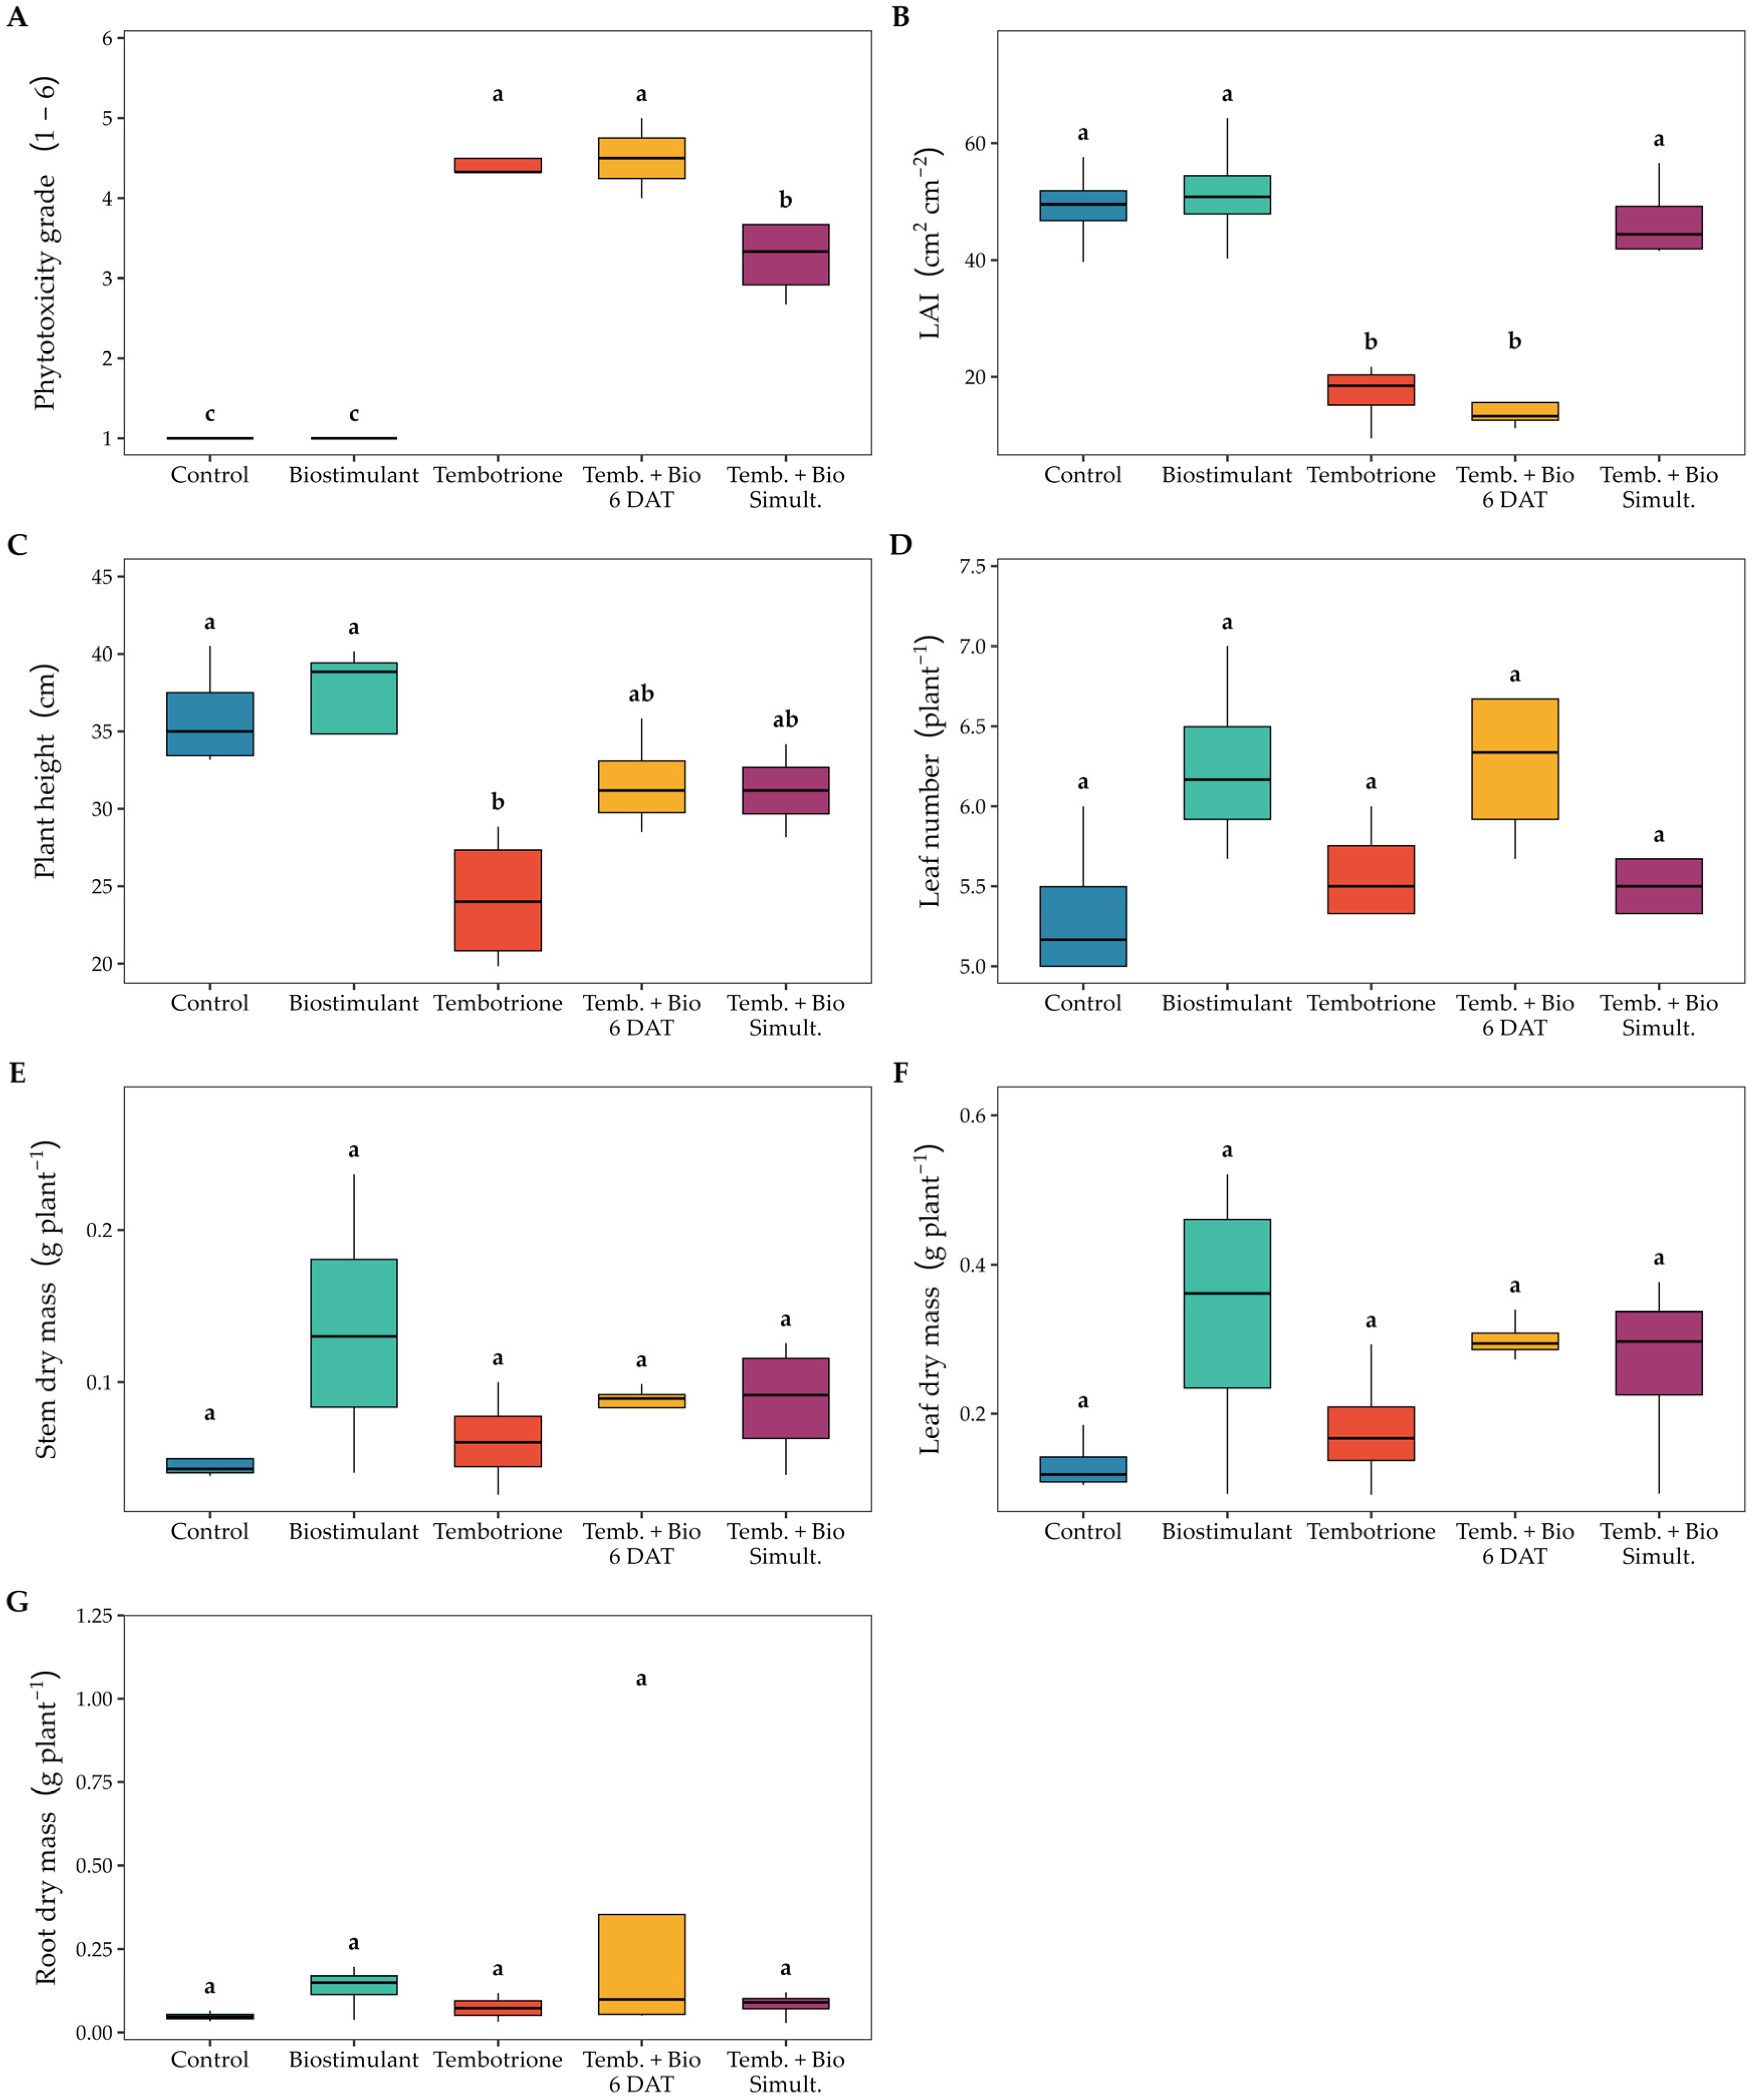
Plant morphological and growth traits were affected differentially by herbicide–biostimulant treatments (Figure 5A–G). The phytotoxicity grade (GF) showed significant differences across treatments (F = 113.39, p < 0.001; Figure 5A). Tembotrione alone and Temb.+Bio 6 DAT caused the highest phytotoxicity scores (4.498 ± 0.168 and 4.500 ± 0.216; group a), consistent with pronounced visual symptoms of herbicide injury. Applying Temb.+Bio simultaneously reduced this effect (3.253 ± 0.250; group b). The Control and Biostimulant-treated plants showed no symptoms during the assessment (1.000 ± 0.000; group c), demonstrating the selective nature of phytotoxicity.
The LAI showed a significant response to treatment (F = 26.56, p < 0.001; Figure 5B). Plants in the control and biostimulant-treated groups maintained the highest LAI values (49.09 ± 3.67 and 51.54 ± 4.92 cm2 cm−2, respectively; group a), which were statistically indistinguishable from those in the Temb.+Bio Simult. group (46.75 ± 3.48 cm2 cm−2; group a). In contrast, plants treated with tembotrione alone and those subjected to Temb.+Bio 6 DAT showed reductions exceeding 65% in LAI (17.04 ± 2.69 and 14.91 ± 2.37 cm2 cm−2, respectively; group b), indicating severe impairment of leaf expansion. The ability of simultaneous co-application to maintain LAI at control levels, unlike the 6 DAT schedule, highlights the importance of biostimulant application timing for protecting leaf area development.
Plant height (PH) was significantly affected by treatment (F = 4.13, p = 0.019; Figure 5C), although the differences were less pronounced than those observed for LAI. Tembotrione treatment alone resulted in an approximately 33% reduction in plant height relative to the Control (24.17 ± 2.17 cm vs. 35.92 ± 1.70 cm; group b). Both biostimulant-supplemented treatments partially mitigated this reduction (31.67 ± 1.58 and 31.17 ± 1.29 cm for Temb.+Bio 6 DAT and Temb.+Bio Simult.; group ab), but neither restored plant height to Control levels. The Biostimulant-only treatment did not differ significantly from the Control (35.42 ± 3.88 cm; group a), indicating a limited effect of the biostimulant alone on plant height under non-stress conditions. The number of leaves (LN) showed a marginally significant effect of treatment (F = 4.06, p = 0.020; Figure 5D). However, post hoc analysis revealed no statistically significant pairwise differences, as all groups were assigned the same Tukey rank (group a), with means ranging from 5.33 ± 0.24 (Control) to 6.25 ± 0.28 (Biostimulant). This suggests a statistically detectable but biologically modest effect of treatment on leaf emission rate.
Stem dry mass (SDM), leaf dry mass (LDM), and root dry mass (RDM) showed no significant differences among treatments (F = 2.21, p = 0.117; F = 2.36, p = 0.100; F = 1.03, p = 0.423, respectively; Figure 5E–G). Although there was a numerical trend for treatment with Biostimulant, which led to the accumulation of more biomass across all compartments (SDM: 0.134 ± 0.042 g plant−1; LDM: 0.334 ± 0.095 g plant−1; RDM: 0.133 ± 0.034 g plant−1) compared to tembotrione-treated plants (SDM: 0.062 ± 0.016 g plant−1; LDM: 0.180 ± 0.042 g plant−1; RDM: 0.073 ± 0.018 g plant−1), the high variability within groups—especially seen in Temb.+Bio 6 DAT root dry mass (0.309 ± 0.227 g plant−1)—prevented statistically significant differences. The absence of significant effects on biomass allocation, despite the notable phytotoxic symptoms and gas-exchange impairment, likely reflects the short evaluation period relative to the time needed for metabolic disruptions to produce measurable differences in dry matter accumulation.
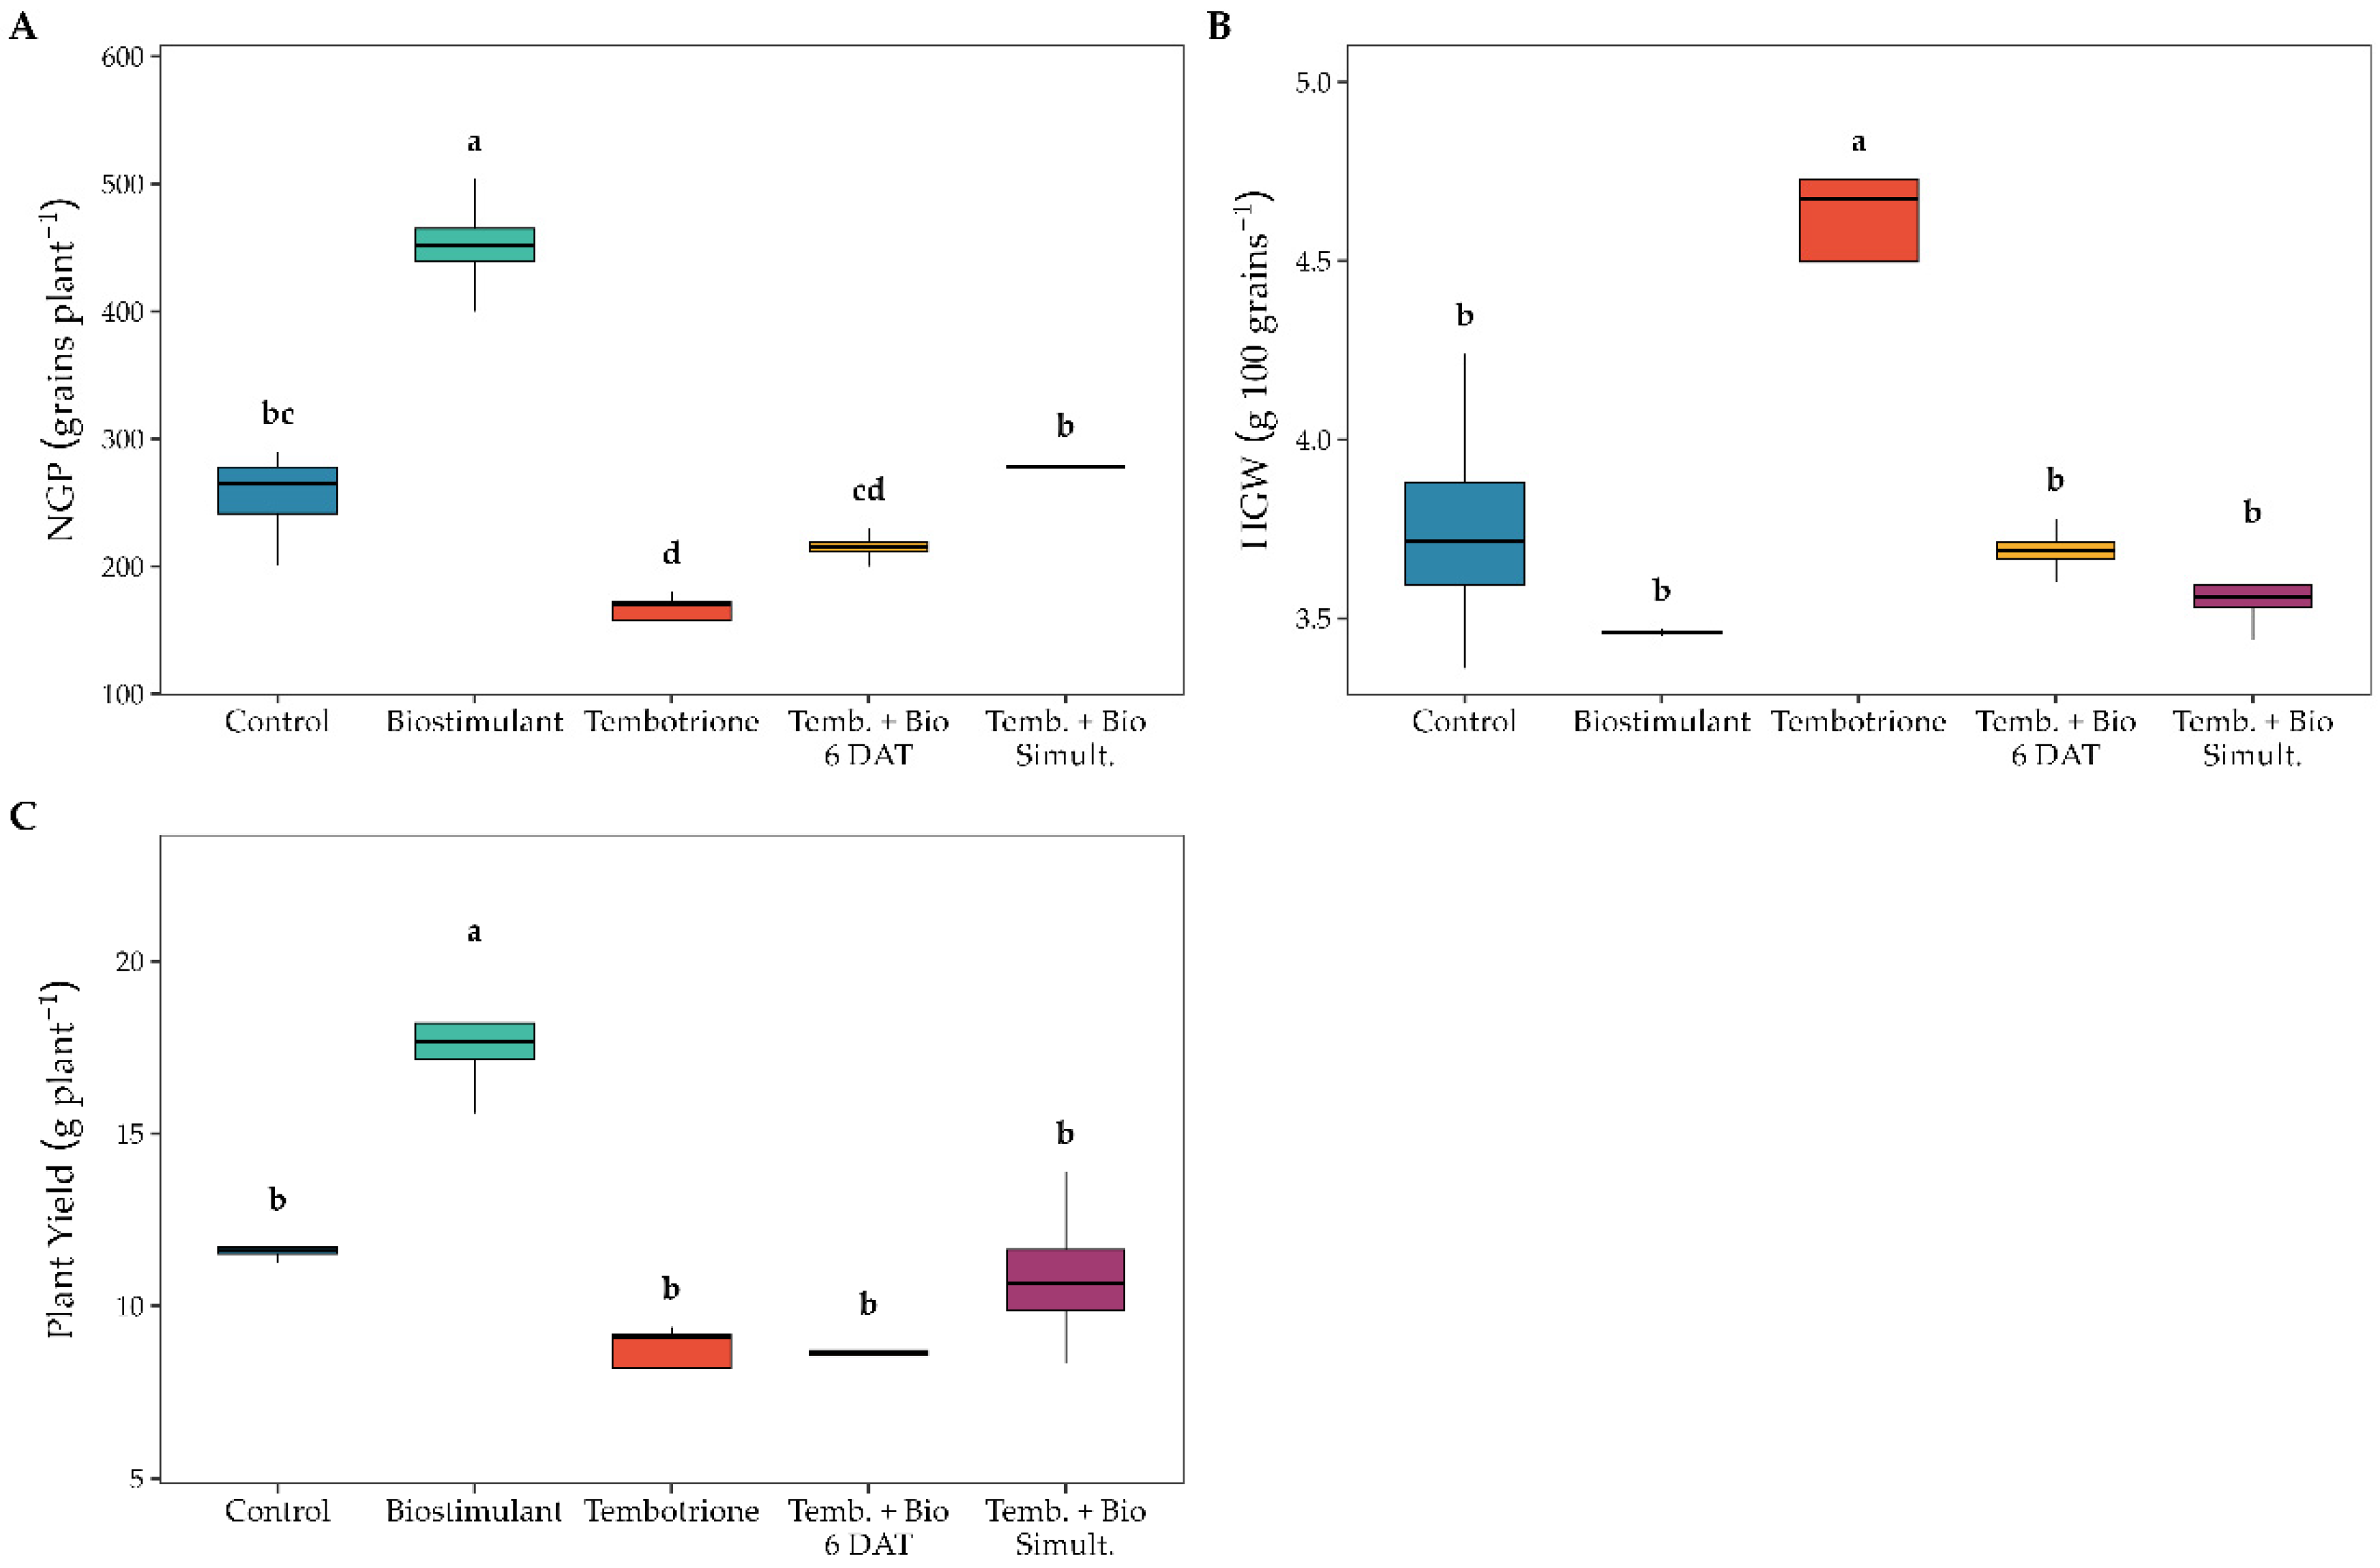
Herbicide–biostimulant treatments notably influenced grain yield components and productivity (Figure 6A–C). The number of grains per plant (NGP) emerged as the most distinguishing variable (F = 57.93, p < 0.001; Figure 6A). Biostimulant treatment achieved the highest NGP, averaging 452 ± 21.2 grains per plant (group a), which was 77% higher than the Control (255 ± 19.4 grains per plant; group bc). Tembotrione alone severely reduced the grain set to 160 ± 13.5 grains per plant (group d), representing a 37% decrease relative to the Control. Partial recovery was observed with Temb.+Bio 6 DAT (215 ± 6.1 grains per plant; group cd), while Temb.+Bio Simult. restored NGP to Control levels (278.5 ± 0.6 grains per plant; group b). These results highlight the importance of application timing for grain set recovery.
Hundred-grain weight (HGW) showed an inverse response to NGP (F = 16.30, p < 0.001; Figure 6B). Tembotrione alone produced the heaviest grains (4.553 ± 0.143 g per 100 grains; group a), consistent with reduced source-to-sink competition at the lowest recorded grain number. All other treatments were statistically similar (group b), with HGW values ranging from 3.460 ± 0.004 g (Biostimulant) to 3.757 ± 0.182 g (Control). This inverse correlation between NGP and HGW highlights a compensatory mechanism between grain number and individual grain filling, a common trade-off observed in cereal crops under stress.
Plant yield varied significantly among treatments (F = 24.65, p < 0.001; Figure 6C). The Biostimulant treatment achieved the highest yield (17.68 ± 0.855 g plant−1; group a), exceeding the Control by 52% (11.61 ± 0.147 g plant−1; group b). Despite the HGW compensation observed with tembotrione alone, the severe reduction in NGP resulted in the lowest overall yield (8.29 ± 0.903 g plant−1; group b), which was statistically similar to Temb.+Bio 6 DAT (8.64 ± 0.122 g plant−1; group b). Temb.+Bio Simult. produced intermediate productivity (10.88 ± 1.145 g plant−1; group b), numerically closer to the Control but not statistically different from the tembotrione-only treatment, indicating that the recovery of grain number under this regime was not enough to fully compensate for the photosynthetic and carboxylation limitations shown in Figure 2 and Figure 3.
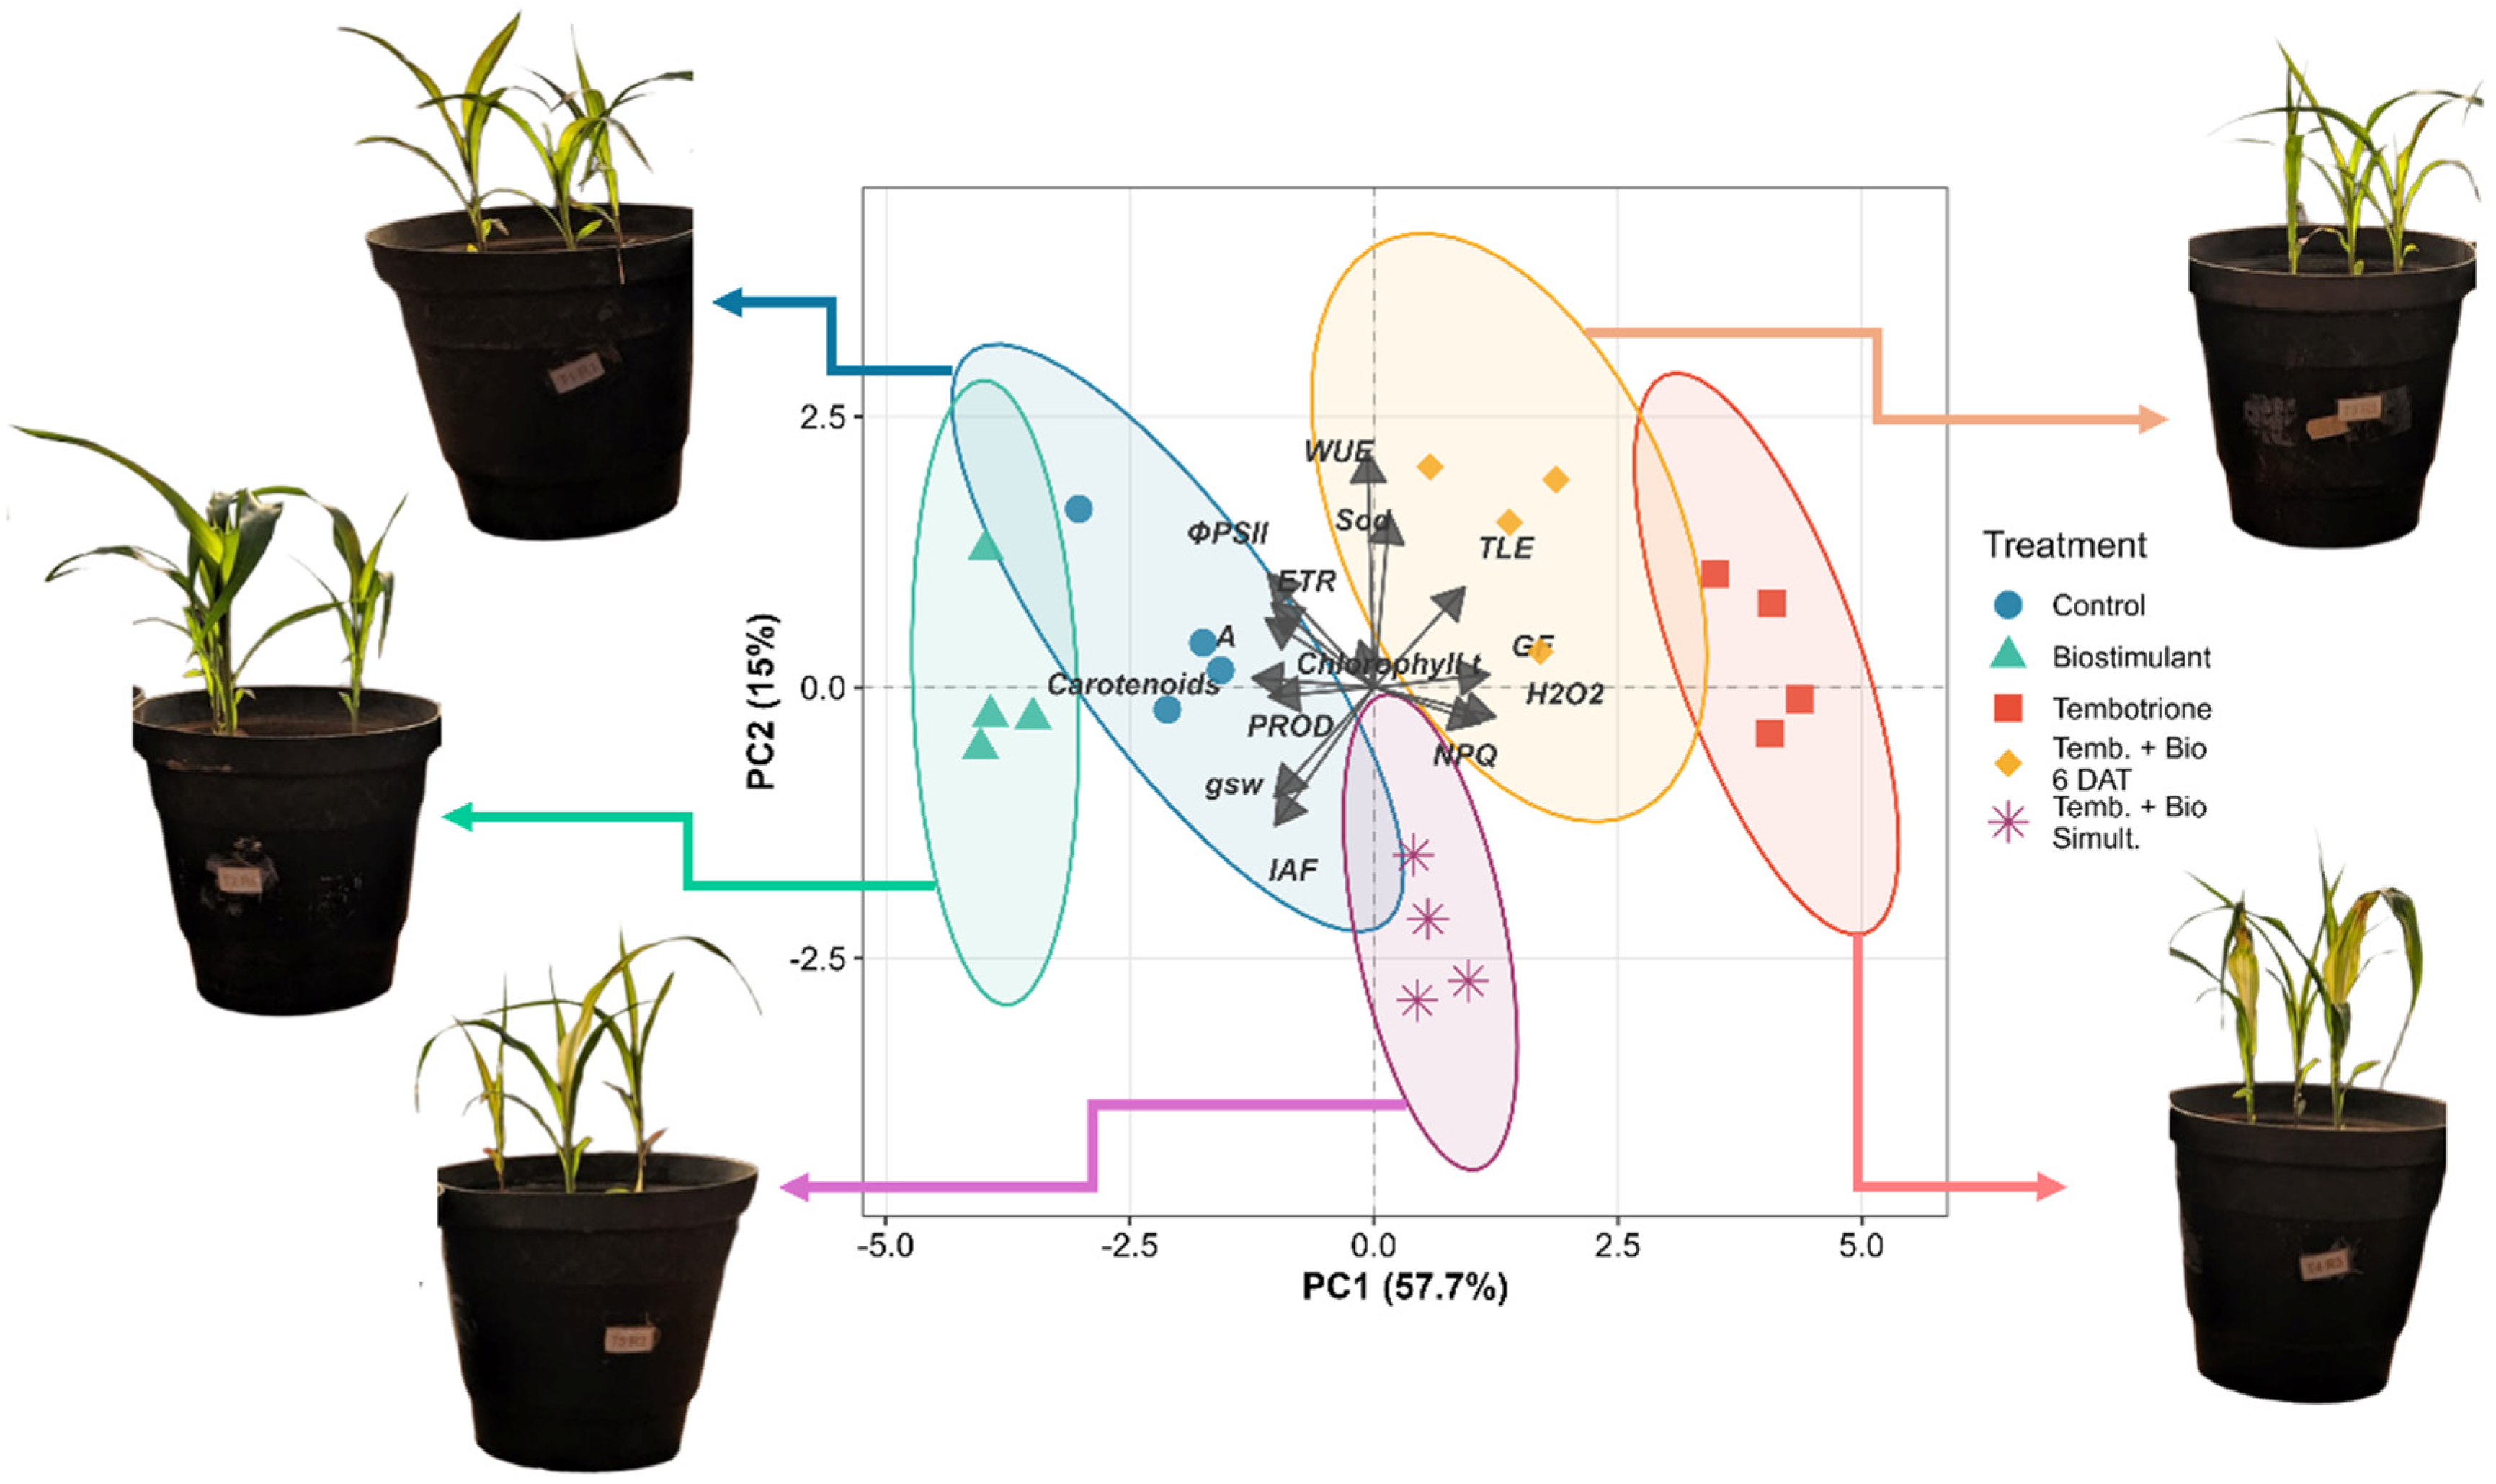
PCA retained three components accounting for 82.1% of total variance (PC1 = 57.7%, eigenvalue = 8.076; PC2 = 15.0%, eigenvalue = 2.094; PC3 = 9.4%, eigenvalue = 1.322), satisfying both Kaiser’s criterion (eigenvalues > 1.0) and the 80% cumulative variance threshold (Figure S1). The first two components (72.7%) were used to construct the global biplot (Figure 7), which revealed a clear physiological stress gradient along PC1 driven by Tembotrione application. This axis was characterized by positive loadings for H2O2 (+0.341), phytotoxicity grade (+0.324), NPQ (+0.299), and electrolyte leakage (+0.255), contrasted by negative loadings for net CO2 assimilation (−0.304), Φ_PSII (−0.297), and grain yield (−0.295). PC2 primarily reflected water-use efficiency and antioxidant defense capacity, with WUE (+0.595) and SOD activity (+0.441) as dominant variables, contrasting negatively with stomatal conductance (−0.278) and leaf area index (−0.349), suggesting a stomatal regulation and antioxidant compensation axis.
Tembotrione-treated plants were positioned along the positive PC1 axis, clearly separated from all other treatments, confirming severe photosynthetic impairment and elevated oxidative damage. Biostimulant treatment occupied the most negative PC1 region, suggesting enhanced photosynthetic performance relative to the Control. Treatments combining Tembotrione with biostimulant application (6 DAT and Simult.) were positioned intermediately along PC1, as evidenced by their reduced PC1 scores relative to Tembotrione alone, with partial physiological recovery associated with enhanced antioxidant activity (SOD) and water-use efficiency along PC2. Sequential application (6 DAT) demonstrated greater recovery potential than simultaneous application, as reflected by its lower PC1 score and higher PC2 position, indicating reduced oxidative burden concurrent with upregulated antioxidant defense and improved water-use efficiency (WUE; Figure 7).
At 10 DAT, sorghum plants subjected to Biostimulant treatment exhibited greater development in terms of height and leaf area. In contrast, the Tembotrione alone treatment severely impaired plant growth, resulting in a high degree of phytotoxicity. In the combined treatments (Temb.+Bio 6 DAT and Simult.), a mitigation of injury symptoms and an increase in plant height were observed compared to the herbicide applied alone. Additionally, the Temb.+Bio Simult. treatment promoted greater leaf area expansion relative to Tembotrione alone (Figure 7).
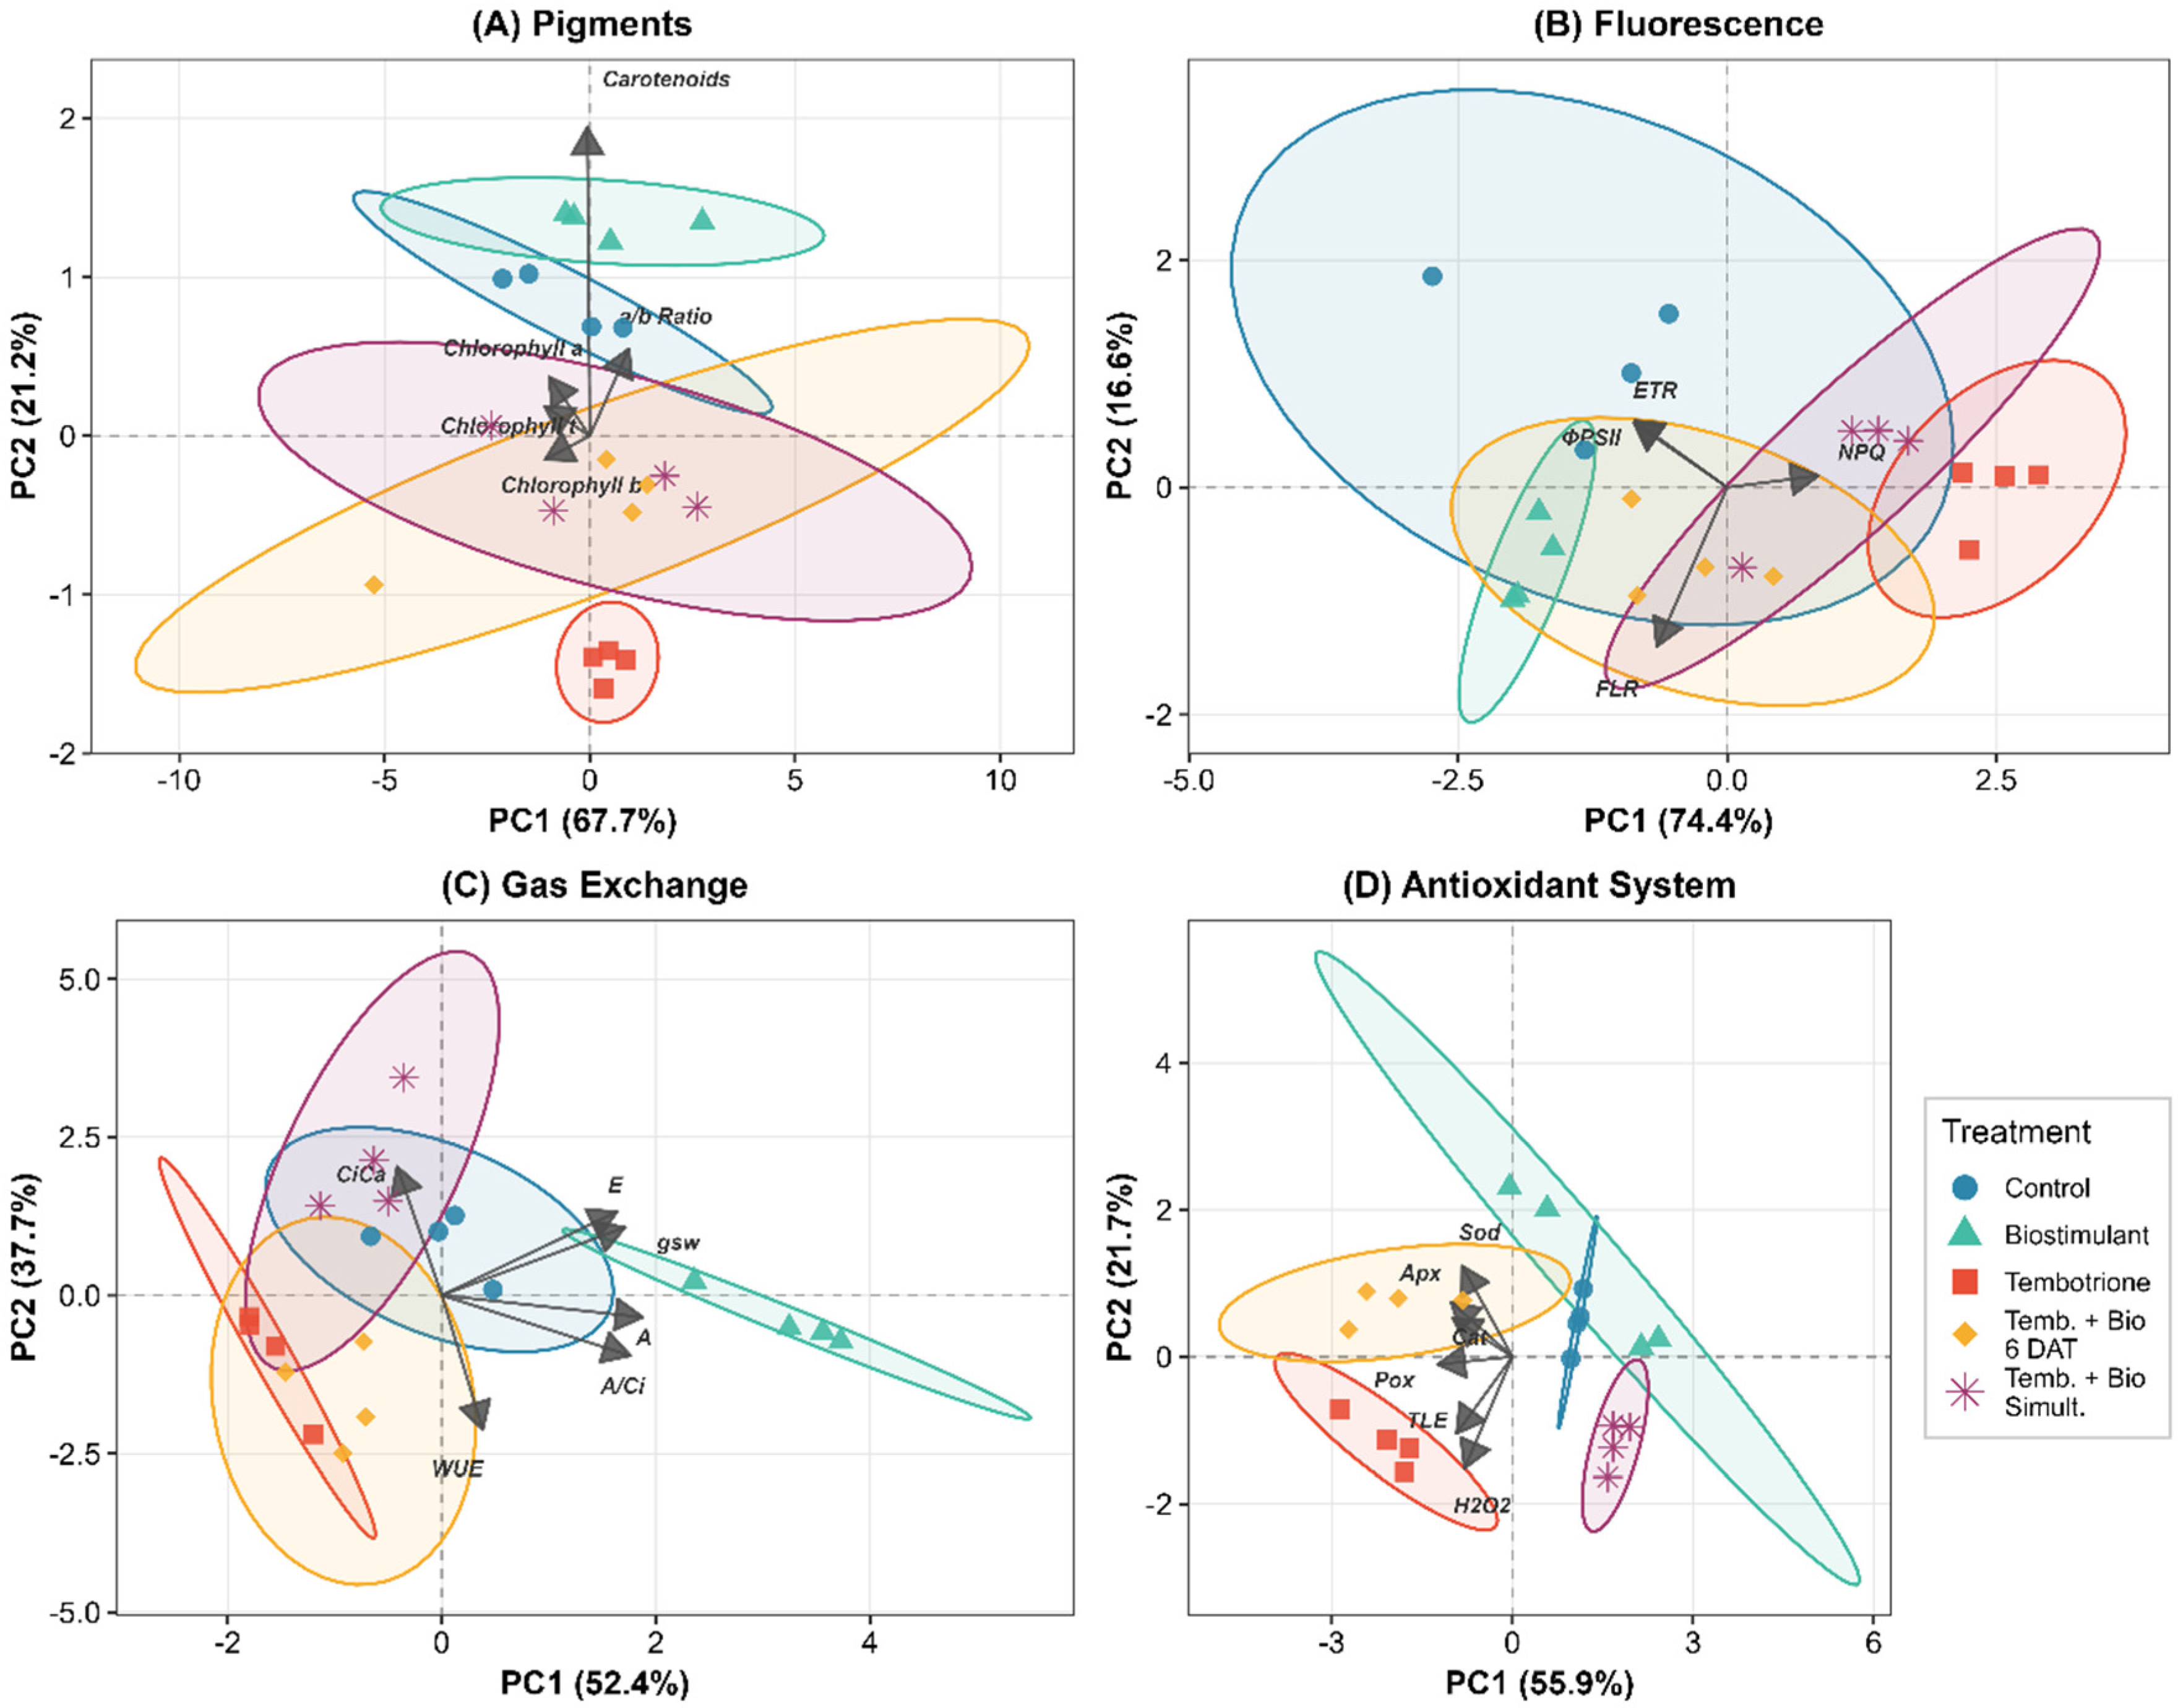
The PCA of photosynthetic pigments retained two components that together explained 88.9% of the total variance (PC1 = 67.7%, PC2 = 21.2%), clearly separating treatments along a pigment gradient (Figure 8A). Plants treated with tembotrione clustered at positive PC1 scores, which were associated with lower chlorophyll content, whereas the biostimulant treatment occupied the most negative PC1 scores, corresponding to higher pigment levels. Carotenoids loaded strongly onto PC2 (+0.89; Figure 8A), largely independent of chlorophyll fractions, indicating a distinct response pattern among treatments. PCA of chlorophyll fluorescence parameters explained 91.0% of the variance (PC1 = 74.4%, PC2 = 16.6%) (Figure 8B). In this case, PC1 defined a photoinhibition axis, with ΦPSII and ETR loading negatively and NPQ loading positively, indicating reduced photochemical activity and enhanced non-photochemical energy dissipation in tembotrione-treated plants. PC2 was dominated by FLR (−0.861), separating Control and Biostimulant treatments along a fluorescence ratio axis. The Temb.+Bio 6 DAT showed intermediate PC1 and relatively higher PC2 scores than the simultaneous application, evidencing greater PSII recovery when biostimulant application was delayed.
The gas-exchange PCA retained two components explaining 90.1% of the variance (PC1 = 52.4%, PC2 = 37.7%) (Figure 8C). PC1 integrated A, A/Ci, gsw, and E, representing a carboxylation–stomatal conductance axis; Biostimulant plants showed the highest PC1 scores, whereas Tembotrione plants clustered in the negative region, indicating impaired carboxylation and stomatal closure. PC2 contrasted WUE and Ci/Ca, capturing a water-use efficiency trade-off. Combined treatments differed along PC2, with the simultaneous application showing higher Ci/Ca and lower WUE than Temb.+Bio 6 DAT, indicating timing-dependent effects on the balance between stomatal reopening and CO2 fixation. The antioxidant system PCA explained 77.6% of the variance (PC1 = 55.9%, PC2 = 21.7%). All antioxidant enzymes (SOD, CAT, POX, and APX) and oxidative damage markers (H2O2 and TLE) loaded negatively on PC1, showing that increased enzyme activity was associated with, rather than preventing, oxidative damage in Tembotrione-treated plants. PC2 contrasted SOD with H2O2 and TLE, separating the Biostimulant treatment (higher SOD, lower damage) from Tembotrione. The Temb.+Bio 6 DAT occupied a more favorable PC2 position than the simultaneous application, indicating more effective activation of antioxidant defenses with delayed biostimulant application.
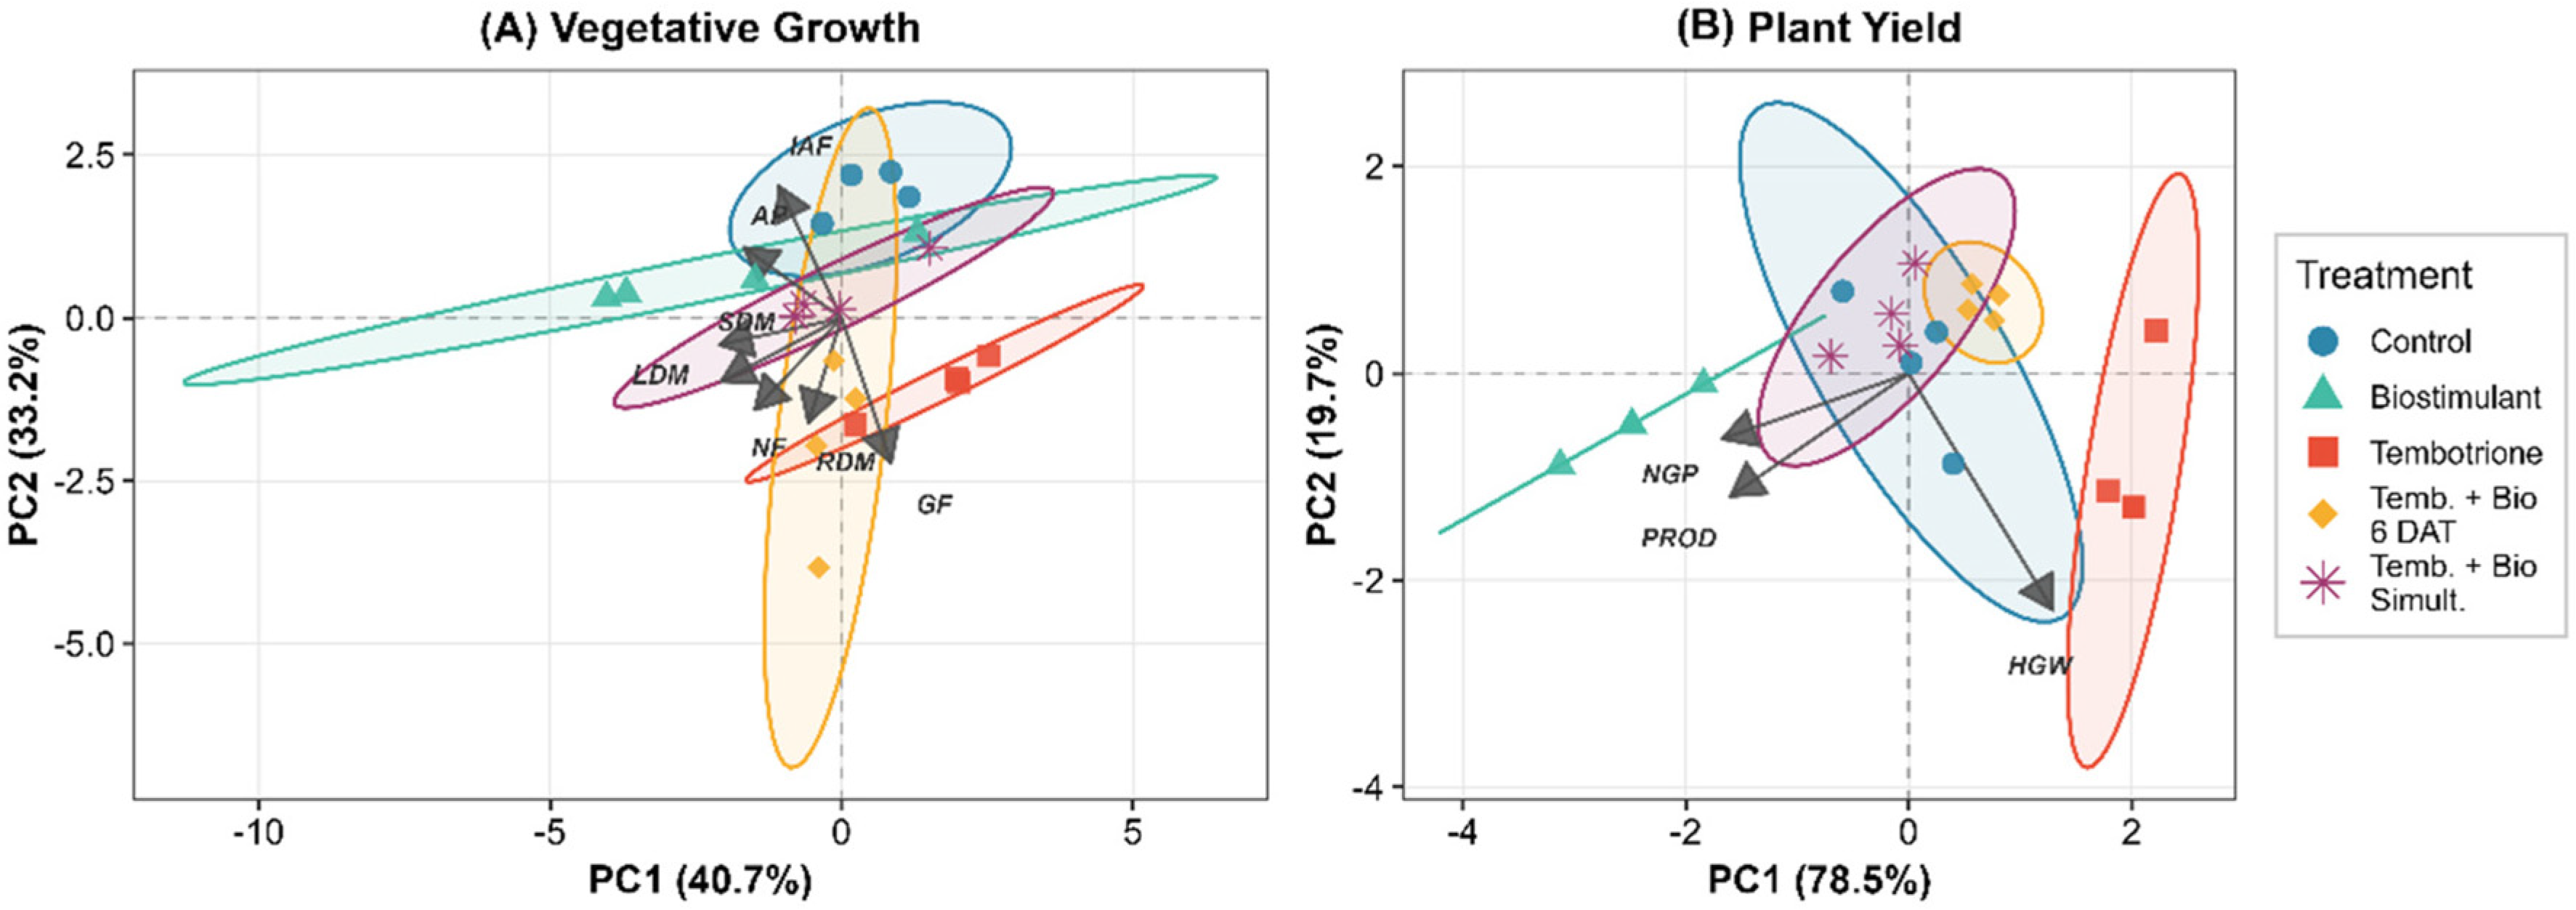
Vegetative-growth PCA retained two components explaining 73.9% of the variance (PC1 = 40.7%, PC2 = 33.2%) (Figure 9A). PC1 was driven by shoot biomass (SDM, LDM) and plant height, defining an assimilate–accumulation axis, whereas PC2 contrasted leaf area (IAF) with phytotoxicity (GF) and root biomass (RDM). Biostimulant-treated plants were located in the quadrant with higher shoot biomass and leaf area, whereas Tembotrione-treated plants showed positive PC1 and negative PC2 scores, characterized by reduced canopy development and greater phytotoxicity. The Temb.+Bio 6 days after treatment (DAT) combination showed greater dispersion along PC2, associated with variability in RDM. The yield-component PCA produced a simple structure, with PC1 explaining 78.5% and PC2 19.7% of the variance (98.2% cumulative; Figure 9B). PC1 represented the trade-off between grain number and grain weight, contrasting NGP and PROD with HGW. Biostimulant-treated plants exhibited the most negative PC1 scores, corresponding to a higher grain number and yield. Tembotrione-treated plants clustered at positive PC1 scores, with increased HGW and reduced grain set. The Temb.+Bio 6 DAT shifted toward negative PC1 relative to Tembotrione alone, indicating partial recovery of grain number and productivity, whereas the simultaneous application showed a smaller shift.

4. Discussion

The patterns observed in leaf carotenoid accumulation, with Biostimulant treatment ranking the highest, followed by the Control, tembotrione + biostimulant regimes, and tembotrione alone ranking the lowest, suggest a key mechanism by which the Ascophyllum nodosum-based biostimulant confers tolerance to tembotrione. Tembotrione, a triketone herbicide from the HPPD-inhibiting family, competitively inhibits the enzyme 4-hydroxyphenylpyruvate dioxygenase (HPPD; EC 1.13.11.27), a non-heme iron oxygenase involved in tyrosine catabolism [37]. This enzyme catalyzes the production of homogentisate, an essential intermediate in the synthesis of α-tocopherols and plastoquinone [37,38,39].
The depletion of plastoquinone has significant consequences. Plastoquinone acts as a cofactor for phytoene desaturase and ζ-carotene desaturase and serves as an immediate electron acceptor in carotenoid and abscisic acid (ABA) biosynthesis; its absence directly inhibits carotenoid accumulation [40,41]. Carotenoids are essential photoprotective compounds that quench triplet chlorophyll and singlet oxygen, thereby preventing photooxidative damage to the photosynthetic system [42]. Consequently, the reduction in carotenoid content observed under tembotrione treatment increases the vulnerability of the photosynthetic apparatus to photooxidative damage and leads to the bleaching of meristematic tissues. This mechanism is consistent with the 60% decline in the effective quantum yield of PSII observed in this study, supporting the interpretation that HPPD inhibition disrupts plastoquinone-dependent carotenoid biosynthesis and compromises PSII functionality [40,42]. The biostimulant’s capacity to sustain higher carotenoid levels, even under tembotrione stress, may therefore contribute to enhanced photoprotection and improved photosynthetic efficiency.
The observed protective effect is primarily attributed to enhanced photoprotection and reduced oxidative stress. The bioactive compounds present in A. nodosum extracts, including betaines, polyamines, and phenolics, promote redox homeostasis by activating antioxidant enzymes, such as CAT, POX, and APX, as well as by scavenging reactive oxygen species [13,20,43]. These mechanisms may help counteract hydrogen peroxide accumulation and lipid peroxidation resulting from herbicide-induced excess singlet oxygen [44,45]. A. nodosum-based biostimulants further improve antioxidant dynamics, osmoregulation, cellular repair, and photosynthetic performance, including the maintenance of chlorophyll and retention of carotenoids. These physiological improvements are linked to increased yields and enhanced plant vigor, particularly when biostimulants are co-applied to mitigate early bleaching symptoms [46,47,48,49,50,51]. The efficacy of these biostimulants is closely related to their composition of phytohormones, polysaccharides, amino acids, and secondary metabolites, which modulate physiological processes and reinforce defenses against photooxidative damage under HPPD-inhibitor herbicide stress [52,53,54,55].
The maximum quantum yield of PSII (Fv/Fm) is a reliable marker of photoinhibition and photosynthetic efficiency. In the present study, plants treated with tembotrione showed a decrease in Fv/Fm (0.739 ± 0.003), which was consistent with the reduced photosynthetic efficiency. Lower carotenoid levels, which normally protect plants from photooxidative damage, increase susceptibility to photoinhibition and further suppress Fv/Fm [56,57]. When the plastoquinone pool in PSII is depleted, reduced plastoquinone binding at the QB site of the D1 protein slows down electron flow and D1 turnover [58]. In sorghum plants with low carotenoid-based protection, excess absorbed light is dissipated as heat via non-photochemical quenching, consistent with the high NPQ levels observed in this study (NPQ = 4.29 in tembotrione-treated plants). Previous molecular and physiological research has shown that perturbations in the photosynthetic electron transport chain and over-reduction in PSII electron carriers promote NPQ induction as a compensatory response to prevent photodamage [59,60,61,62].
Gas-exchange analysis revealed that A. nodosum application alone profoundly upregulated the C4 photosynthetic machinery in sorghum. The Biostimulant treatment achieved the highest net photosynthesis (A = 21.23 µmol CO2 m−2 s−1), a 60% increase over the untreated Control, alongside maximal stomatal conductance (gsw). Notably, this group also exhibited a low Ci/Ca ratio and an exceptionally high carboxylation efficiency (A/Ci of 0.138 µmol m−2 s−1 Pa−1). In a C4 species, such as sorghum, this physiological signature does not indicate stomatal limitation; rather, it suggests that the initial carbon fixation by PEP carboxylase (PEPc) in the mesophyll operates at a highly accelerated rate [63]. High carboxylation efficiency has been associated with a highly efficient growth strategy in tropical grasses and sedges with low Ci/Ca ratios [64,65]. CO2-concentrating mechanisms (CCMs) serve to increase the concentration of CO2 surrounding RuBisCO (Ribulose-1,5-bisphosphate carboxylase/oxygenase), thereby improving carboxylation efficiency and mitigating the impact of competing oxygenation reactions [66,67]. Considering the presence of carbonic anhydrase and other CCM components in related macroalgae, it is reasonable to propose that bioactive compounds found in A. nodosum extracts could potentially activate or enhance analogous CCM-related processes in sorghum, a hypothesis that warrants direct experimental investigation [65,68,69].
Delayed biostimulant application, administered 6 days after herbicide treatment (6 DAT), constitutes a distinct stress-adaptation strategy. This intervention partially restored PSII photochemistry, as indicated by the partial recovery of Fv/Fm. Nevertheless, net photosynthesis (A = 8.90 µmol CO2 m−2 s−1) and stomatal conductance did not recover fully. This partial restoration aligns with previous findings indicating that, under combined stress conditions, plants often sustain persistent mesophyll-level constraints even after substantial recovery of PSII function [65,70,71]. The coexistence of sustained stomatal limitation with a partially preserved photosynthetic apparatus resulted in a marked increase in WUE (7.76 µmol mmol−1), highlighting a strategic trade-off between carbon assimilation and water conservation.
This temporal separation strategy suggests that the delayed application of bioactive compounds can enhance both water conservation and photoprotection. The physiological resilience observed after the delay is likely linked to a time-dependent reinforcement of antioxidant defenses, together with more effective regulation of ROS-scavenging systems [72,73]. By temporally uncoupling the peak phytotoxic effects of HPPD-inhibiting herbicides from subsequent biostimulant application, plants may gain additional time to upregulate stress-responsive genes (e.g., HSFA2, HSFA6a, and Zat12) and to rebalance abscisic acid and brassinosteroid (ABA/BR) signaling pathways, which coordinate stomatal behavior, redox homeostasis, and growth response [41,74,75]. Therefore, this phased intervention promotes stress tolerance, helps sustain growth vigor, and mitigates the acute inhibition of pigment biosynthesis typically associated with HPPD-inhibiting herbicides, aligning with broader evidence that biostimulants can improve PSII performance, WUE, and antioxidant capacity under water and herbicide-related stresses [18,73,76,77].
Analysis of antioxidant enzyme activities and oxidative damage markers indicated that the timing of biostimulant application significantly altered plant biochemical responses under tembotrione stress. Tembotrione alone, and to a lesser extent tembotrione combined with biostimulant at 6 DAT, induced pronounced oxidative stress, as indicated by elevated H2O2 levels, increased activities of CAT, POX, and APX, as well as increased membrane permeability. Similar herbicide-induced ROS imbalances and antioxidant enzyme activation have been widely documented in plants subjected to abiotic and chemical stressors [73,78]. In contrast, simultaneous application of tembotrione and biostimulant suppressed APX, thereby disrupting the ascorbate–glutathione cycle, which is central to H2O2 detoxification and redox homeostasis. The resulting increase in H2O2 levels in this treatment, relative to the biostimulant treatment alone and control groups, is consistent with compromised membrane integrity under this application schedule [73,79]. These responses align mechanistically with HPPD inhibition by tembotrione, which prevents the conversion of 4-hydroxyphenylpyruvate to homogentisate, thereby impairing plastoquinone and tocopherol biosynthesis, which are essential for carotenoid production and antioxidant defense [80,81,82].
Ascophyllum nodosum-based biostimulants have been shown to enhance stress resilience by reinforcing both enzymatic and non-enzymatic antioxidant systems, increasing pigment content, and reducing lipid peroxidation under various crops and stress conditions [13,79,83,84,85]. Consistent with these findings, the A. nodosum formulation, particularly when combined with tembotrione, preserved membrane integrity and promoted carotenoid accumulation, while activating antioxidant defenses mediated by betaines, polyamines, and phenolic compounds [13,79,83,85]. Comparable modulation of ROS scavengers and stress-responsive gene networks by biostimulants has been observed under drought, salinity, heat, and metal toxicity, suggesting conserved mechanisms of priming and metabolic reprogramming [73,79,84,86,87,88,89]. Through this multifaceted mode of action, which integrates HPPD-detoxification pathways, sustained carotenoid and antioxidant biosynthesis, and enhanced ROS-buffering capacity, the biostimulant may stabilize the photosynthetic apparatus, support cellular repair, and improve plant performance under stress from HPPD-inhibiting herbicides.
The differences observed in morphological and growth traits highlight both the phytotoxic nature of tembotrione and the protective role of A. nodosum-based biostimulants, especially when applied simultaneously. Tembotrione alone and Temb.+Bio 6 DAT caused the most severe phytotoxic injury, whereas simultaneous co-application significantly reduced symptom severity. Neither the control nor the Biostimulant-only plants exhibited visible phytotoxicity, consistent with the notion that A. nodosum extracts do not produce phytotoxic effects under non-stressed conditions [13,14,90]. LAI was severely reduced (>65%) in treatments with tembotrione alone or with delayed biostimulant application, whereas the Control, Biostimulant-only, and simultaneous co-application groups maintained the highest LAI values, indicating preservation of photosynthetically active leaf area. This highlights the importance of aligning biostimulant application with the presence of protective metabolites, such as betaines and phenolic compounds, which help maintain redox balance and support leaf expansion [13,14,16,20,91].
Tembotrione adversely affected plant height, although to a lesser extent than LAI, resulting in an approximately 33% reduction relative to the Control. Biostimulant co-treatments partially mitigated this effect without fully restoring plant height, whereas Biostimulant-treated plants were indistinguishable from the Control [16,92]. Leaf number showed only marginal variation across treatments, with no significant pairwise differences in the post hoc analysis. Similarly, stem, leaf, and root dry masses exhibited no statistically significant differences among groups, despite observable numerical trends and high within-group variability, likely reflecting the brevity of the evaluation period [14,92,93]. Taken together, phytotoxicity ratings and LAI emerged as the most sensitive morphological indicators of tembotrione stress, and both were substantially recovered by simultaneous biostimulant application. Plant height showed intermediate sensitivity, while biomass partitioning remained largely unaffected within the assessment timeframe. This pattern suggests tembotrione primarily disrupts assimilatory surface development rather than carbon allocation, consistent with earlier reports on HPPD-inhibitor herbicides causing photosynthetic impairment and reduced leaf expansion [13,14,20,90]. These findings reinforce that optimal timing of A. nodosum-based biostimulant application is critical for maximizing protection against herbicide-induced stress.
Grain yield components and overall productivity were strongly modulated by the treatments, revealing pronounced source–sink adjustments under tembotrione stress. Tembotrione alone markedly reduced the grain number per plant, whereas the increase in HGW under tembotrione treatment alone reflected compensatory individual grain filling under reduced sink competition rather than a direct yield-promoting effect. The simultaneous co-application of the A. nodosum-based biostimulant partially restored the grain number with no corresponding reduction in the HGW. Similar protective yield responses to A. nodosum under stress have been reported in soybean, barley, tomato, and other crops, where improved photosynthesis, water status, and antioxidant capacity translate into a higher grain number and sustained unit grain weight [13,49,94,95,96]. This pattern indicates that the biostimulant attenuates early phytotoxic injury and sustains reproductive sink strength, likely by maintaining photosynthetic performance and assimilate supply during grain filling [13,94,96,97].
Plant yield differed significantly among treatments. The Biostimulant alone increased grain number per plant and final yield compared to that of the control, consistent with evidence that A. nodosum extracts enhance gas exchange, chlorophyll content, and source–sink coordination, thereby boosting yield even in the absence of severe stress [13,95,98,99]. In contrast, the statistical groupings (Figure 6C) reveal that Tembotrione alone, Temb.+Bio 6 DAT, and Temb.+Bio Simult. were all assigned to group b, together with the Control, indicating that none of the tembotrione-containing treatments produced yields significantly different from the untreated Control, despite numerically lower means. This absence of statistically significant yield reduction under tembotrione stress is consistent with broader evidence that biostimulants can contribute to yield stability across crops and environments through enhanced nutrient use efficiency, assimilate partitioning, and stress tolerance [100,101,102], and supports the view that seaweed-based biostimulants can contribute to more sustainable cropping systems by buffering yield losses under abiotic and chemical stress [100,101,102].
Overall, biostimulant application alone substantially increased grain number per plant and yield relative to the Control, reflecting improved photosynthetic capacity and assimilate availability during reproductive development [13,90,94,95,98]. Neither combined regime fully restored yield to biostimulant alone values, with the 6 DAT schedule showing the weakest recovery, underscoring the importance of application timing for maximizing protective effects [49,94]. The strong association typically observed between grain number and gas-exchange traits supports the hypothesis that tembotrione-driven reductions in PSII efficiency and stomatal conductance are the primary pathways limiting grain productivity in cereals [95,97,103,104]. Furthermore, the negative relationship between grain number per plant and HGW under tembotrione alone is consistent with a compensatory shift towards maintaining individual grain filling when sink size is constrained—a trade-off widely documented in cereals under stress [95,103].
The physiological and agronomic responses documented in sorghum are consistent with findings reported for other crops exposed to herbicide-induced oxidative stress. Maize tolerates triketone herbicides because CYP81A-family cytochrome P450s convert mesotrione and tembotrione to non-phytotoxic hydroxylated metabolites before significant carotenoid depletion occurs [4,6]. Crops that lack this constitutive detoxification capacity have historically depended on synthetic safeners that induce endogenous P450s and glutathione-S-transferases; ester-substituted cyclohexenone derivatives, for instance, were recently shown to reduce tembotrione injury in sensitive maize hybrids without compromising weed control. Biostimulants act through a distinct route: rather than accelerating herbicide metabolism, they reinforce antioxidant defences and preserve photosynthetic pigment pools downstream of the initial phytotoxic insult.
The most directly comparable evidence comes from soybean, where the foliar co-application of an A. nodosum-based biostimulant with lactofen, a protoporphyrinogen oxidase inhibitor that also generates ROS-mediated photooxidative damage, attenuated membrane injury and preserved gas-exchange performance via antioxidant-enzyme activation and carotenoid retention [49]. Protective effects of A. nodosum extracts on photosynthetic function have also been reported under oxidative stressors unrelated to herbicides, such as paraquat in Arabidopsis [83], arsenic in rice [17], and drought in soybean [18], which collectively indicate that the redox-stabilising mode of action of these extracts is conserved across plant species and stress types.
Our results in sorghum are consistent with this broader pattern: the Biostimulant treatment alone maintained the highest carotenoid content and the lowest H2O2 accumulation among all treatments, and the simultaneous co-application with tembotrione preserved membrane integrity and leaf area expansion. Two features of the sorghum response nevertheless deserve emphasis. First, unlike maize, sorghum lacks robust constitutive HPPD-inhibitor detoxification [4], which means that the biostimulant-mediated protection documented here depends primarily on downstream antioxidant and photoprotective reinforcement rather than on enhanced herbicide metabolism. Second, to the best of our knowledge, this is among the first studies specifically demonstrating the mitigation of HPPD-inhibitor phytotoxicity by an A. nodosum-based biostimulant in a C4 cereal, and the marked timing-dependence of the protective effect—with simultaneous co-application outperforming delayed (6 DAT) intervention for leaf area preservation—likely reflects the rapid onset of carotenoid depletion in this species. Taken together, these points support the view that A. nodosum-based biostimulants exert a conserved, multi-target physiological action against oxidative stressors across crop species, while also indicating that application timing must be optimized according to the intrinsic detoxification capacity and stress kinetics of each crop.
It should be acknowledged that the present study was conducted entirely under greenhouse conditions, a design choice that constrains the direct extrapolation of the findings to field cropping systems. Field environments introduce additional sources of variability that can modify both herbicide phytotoxicity and biostimulant efficacy, such as higher and more variable solar irradiance, fluctuating temperature and humidity, rhizosphere microbial activity, spray drift, and wash-off of foliar products by rainfall. Higher irradiance in the field may intensify HPPD-inhibitor-induced photooxidative damage relative to that observed in the greenhouse, thereby increasing the physiological demand for carotenoid-mediated photoprotection [49,95,105]. The more complex canopy architecture and rhizosphere microbiology of field soils may also affect biostimulant uptake and systemic distribution in ways that a pot-based system cannot reproduce. Another relevant factor is the frequent use of tembotrione in tank mixtures with soil-applied herbicides such as atrazine, which may alter the phytotoxicity profile and, consequently, the extent of mitigation attainable with the biostimulant [95,105]. Multi-site, multi-season field trials across different sorghum genotypes will therefore be needed before these results can support agronomic recommendations for the integration of A. nodosum-based biostimulants in post-emergence herbicide management programs for sorghum.
Economic considerations also warrant discussion. Adding a biostimulant application to an herbicide program raises production costs through the product itself, the extra spray pass, and occasional adjustments to application equipment. In the present experiment, Megafol® was applied at 1.0 L c.p. ha−1, a relatively low input volume, although a formal cost–benefit analysis was beyond the scope of this work. The economic viability of the practice will depend on the yield loss avoided, the prevailing market price of sorghum grain, and the regional cost of the biostimulant [105]. Given that the final yield of the combined treatments did not differ statistically from the untreated control under our greenhouse conditions, a positive economic return would require that the physiological benefits documented here, namely reduced phytotoxicity and preserved leaf area, translate into measurable yield gains in the field, where herbicide-induced stress is usually more severe. Subsequent studies should adopt a formal cost–benefit framework to determine the economic threshold at which biostimulant co-application becomes profitable for sorghum growers, taking into account local input prices, yield expectations, and risk management strategies.

5. Conclusions

The results of this study support the hypothesis that A. nodosum-based biostimulants can act as mitigating agents against oxidative stress and phytotoxicity induced by the herbicide tembotrione in sorghum. The central finding is the biostimulant’s capacity to sustain carotenoid levels and the stability of the photosynthetic apparatus (PSII), potentially counteracting HPPD enzyme inhibition caused by the herbicide. Our findings suggest that the isolated application of the biostimulant upregulated net photosynthesis by 60%, whereas its co-application with the herbicide preserved membrane integrity and leaf area index. However, we note that the efficacy of this mitigation strategy is highly dependent on application timing, as simultaneous co-application proved superior to delayed application (6 DAT). It should be acknowledged that the proposed protective mechanisms are supported by indirect physiological and biochemical evidence; therefore, direct confirmation through molecular analyses, such as gene expression profiling of detoxification enzymes and carotenoid biosynthesis genes, would strengthen mechanistic understanding. From an agronomic perspective, the biostimulant reduced visual injury and restored grain number per plant to control levels under simultaneous co-application; however, the final yield of all tembotrione-containing treatments, including those supplemented with the biostimulant, did not differ statistically from the untreated control, indicating that the observed physiological mitigation did not fully translate into yield gains in our experiment. Therefore, the integration of A. nodosum extracts into the chemical management of sensitive crops represents a potentially viable biotechnological strategy to enhance herbicide selectivity and yield stability. Future studies should investigate the gene expression of efflux transporters and detoxification enzymes to fully elucidate the metabolic pathways modulated by these bioactive compounds in tropical grasses. Additionally, evaluating different biostimulant doses and additional application timings would provide a more comprehensive understanding of the dose–response relationship and optimize the mitigation strategy for field-scale implementation.

Supplementary Materials

The following supporting information can be downloaded at https://www.mdpi.com/article/10.3390/agronomy16090889/s1, Figure S1: Scree plot of the global principal component analysis (PCA) based on 14 key physiological and agronomic variables measured in sorghum plants subjected to Tembotrione herbicide application and biostimulant treatments. Bars represent the percentage of variance explained by each principal component (left axis); the red line indicates cumulative variance (right axis). The dashed horizontal line marks the 80% cumulative variance threshold used as a component retention criterion, jointly applied with the Kaiser criterion (eigenvalue > 1.0). Three components were retained (PC1 = 57.7%, eigenvalue = 8.076; PC2 = 15.0%, eigenvalue = 2.094; PC3 = 9.4%, eigenvalue = 1.322), collectively explaining 82.1% of the total variance.

Author Contributions

Conceptualization, G.B.M. and A.G.d.S.; methodology, M.B.T. and A.C.F.; formal analysis, G.B.M. and W.A.M.; investigation, J.L.S.; resources, G.B.M.; data curation, A.G.d.S.; writing—original draft preparation, U.J.B.d.S.; writing—review and editing, L.C.V.; visualization, L.C.V.; supervision, L.A.B.; project administration, L.A.B.; funding acquisition, M.B.T. All authors have read and agreed to the published version of the manuscript.

Funding

This research received no external funding.

Data Availability Statement

The original contributions presented in this study are included in the article/Supplementary Materials. Further inquiries can be directed to the corresponding author.

Acknowledgments

The authors acknowledge the Ministério de Ciência, Tecnologia e Inovação (MCTI), the Financiadora de Estudos e Projetos (FINEP), the Coordenação de Aperfeiçoamento de Pessoal de Nível Superior (CAPES) for providing a master’s scholarship to Gabriel Bressiane Melo, and the Fundação de Amparo à Pesquisa do Estado de Goiás (FAPEG),the IFGoiano, Rio Verde Campus, for providing infrastructure and supporting the students involved in this study, and the Centro de Excelência em Agricultura Exponencial (CEAGRE). The authors also acknowledge the use of generative AI tools provided by Google (Gemini) for assistance in data interpretation.

Conflicts of Interest

The authors declare no conflicts of interest.

References

  1. Andres, A.; Concenço, G.; Schwanke, A.M.L.; Theisen, G.; Melo, P.T.B.S. Períodos de interferência de plantas daninhas na cultura do sorgo forrageiro em terras baixas. Planta Daninha 2009, 27, 229–234. [Google Scholar] [CrossRef]
  2. Dan, H.A.; Barroso, A.L.L.; Dan, L.G.M.; Procópio, S.O.; Ferreira Filho, W.C.; Menezes, C.C.E. Tolerância do sorgo granífero ao herbicida tembotrione. Planta Daninha 2010, 28, 615–620. [Google Scholar] [CrossRef]
  3. Dille, J.A.; Stahlman, P.W.; Thompson, C.R.; Bean, B.W.; Soltani, N.; Sikkema, P.H. Potential yield loss in grain sorghum (Sorghum bicolor) with weed interference in the United States. Weed Technol. 2020, 34, 624–629. [Google Scholar] [CrossRef]
  4. Pandian, B.A.; Varanasi, A.; Vennapusa, A.R.; Sathishraj, R.; Lin, G.; Zhao, M.; Tunnell, M.; Tesso, T.; Liu, S.; Prasad, P.V.V.; et al. Characterization, genetic analyses, and identification of QTLs conferring metabolic resistance to a 4-hydroxyphenylpyruvate dioxygenase inhibitor in sorghum (Sorghum bicolor). Front. Plant Sci. 2020, 11, 596581. [Google Scholar] [CrossRef]
  5. Hossain, M.S.; Islam, M.N.; Rahman, M.M.; Mostofa, M.G.; Khan, M.A.R. Sorghum: A prospective crop for climatic vulnerability, food and nutritional security. J. Agric. Food Res. 2022, 8, 100300. [Google Scholar] [CrossRef]
  6. Santos, W.F.; Silva, A.G.; Procópio, S.O.; Braz, G.B.P.; Jakelaitis, A. Tolerance of grain sorghum hybrids to tembotrione herbicide. Rev. Caatinga 2025, 38, e12591. [Google Scholar] [CrossRef]
  7. Santos, W.F.; Caldas, J.V.D.S.; Silva, A.G.; Procópio, S.O.; Braz, G.B.P.; Jakelaitis, A. Selectivity of tembotrione + atrazine herbicides for grain sorghum. Rev. Ceres 2024, 71, e71041. [Google Scholar] [CrossRef]
  8. Mansoor, M.M.; Padmaja, B.; Bindhu, G.S.M.; Ramprakash, T. Effect of integrated weed management practices on growth and yield of rabi sorghum (Sorghum bicolor L.). J. Exp. Agric. Int. 2024, 46, 615–621. [Google Scholar] [CrossRef]
  9. Rostami, S.; Jafari, S.; Moeini, Z.; Jaskulak, M.; Keshtgar, L.; Badeenezhad, A.; Azhdarpoor, A.; Rostami, M.; Zorena, K.; Dehghani, M. Current methods and technologies for degradation of atrazine in contaminated soil and water: A review. Environ. Technol. Innov. 2021, 24, 102019. [Google Scholar] [CrossRef]
  10. Pannacci, E.; Bartolini, S. Evaluation of chemical weed control strategies in biomass sorghum. J. Plant Prot. Res. 2023, 58, 404–412. [Google Scholar] [CrossRef]
  11. Verma, A.; Gangaiah, B.; Tonapi, V.A. Efficacy of p-hydroxy-phenyl-pyruvate dioxygenase (HPPD) enzyme-inhibitive tembotrione and topramezone herbicides for weed-management in rainy season grain sorghum (Sorghum bicolor). Indian J. Agron. 2023, 67, 158–164. [Google Scholar] [CrossRef]
  12. Oliveira, M.C.; Gaines, T.A.; Dayan, F.E.; Patterson, E.L.; Jhala, A.J.; Knezevic, S.Z. Reversing resistance to tembotrione in an Amaranthus tuberculatus (var. rudis) population from Nebraska, USA with cytochrome P450 inhibitors. Pest Manag. Sci. 2018, 74, 2296–2305. [Google Scholar] [CrossRef]
  13. Shukla, P.S.; Mantin, E.G.; Adil, M.; Bajpai, S.; Critchley, A.T.; Prithiviraj, B. Ascophyllum nodosum-based biostimulants: Sustainable applications in agriculture for the stimulation of plant growth, stress tolerance, and disease management. Front. Plant Sci. 2019, 10, 655. [Google Scholar] [CrossRef]
  14. Kumari, S.; Sehrawat, K.D.; Phogat, D.; Sehrawat, A.R.; Chaudhary, R.; Sushkova, S.N.; Voloshina, M.S.; Rajput, V.D.; Shmaraeva, A.N.; Marc, R.A.; et al. Ascophyllum nodosum (L.) Le Jolis, a pivotal biostimulant toward sustainable agriculture: A comprehensive review. Agriculture 2023, 13, 1179. [Google Scholar] [CrossRef]
  15. Carmody, N.; Goñi, O.; Łangowski, Ł.; O’Connell, S. Ascophyllum nodosum extract biostimulant processing and its impact on enhancing heat stress tolerance during tomato fruit set. Front. Plant Sci. 2020, 11, 807. [Google Scholar] [CrossRef]
  16. Ali, O.; Ramsubhag, A.; Jayaraman, J. Biostimulatory activities of Ascophyllum nodosum extract in tomato and sweet pepper crops in a tropical environment. PLoS ONE 2019, 14, e0216710. [Google Scholar] [CrossRef]
  17. Hasanuzzaman, M.; Raihan, M.R.H.; Siddika, A.; Rahman, K.; Nahar, K. Supplementation with Ascophyllum nodosum extracts mitigates arsenic toxicity by modulating reactive oxygen species metabolism and reducing oxidative stress in rice. Ecotoxicol. Environ. Saf. 2023, 255, 114819. [Google Scholar] [CrossRef] [PubMed]
  18. Melo, G.B.; Silva, A.G.; Costa, A.C.; Silva, A.A.; Rosa, M.; Bessa, L.A.; Rodrigues, C.R.; Castoldi, G.; Vitorino, L.C. Foliar application of biostimulant mitigates water stress effects on soybean. Agronomy 2024, 14, 414. [Google Scholar] [CrossRef]
  19. Campobenedetto, C.; Agliassa, C.; Mannino, G.; Vigliante, I.; Contartese, V.; Secchi, F.; Bertea, C.M. A biostimulant based on seaweed (Ascophyllum nodosum and Laminaria digitata) and yeast extracts mitigates water stress effects on tomato (Solanum lycopersicum L.). Agriculture 2021, 11, 557. [Google Scholar] [CrossRef]
  20. De Saeger, J.; Van Praet, S.; Vereecke, D.; Park, J.; Jacques, S.; Han, T.; Depuydt, S. Toward the molecular understanding of the action mechanism of Ascophyllum nodosum extracts on plants. J. Appl. Phycol. 2020, 32, 573–597. [Google Scholar] [CrossRef]
  21. Valagro. MEGAFOL BR®: Fertilizante Organomineral Foliar Classe “A”; Valagro: Atibaia, Brazil, 2018; Available online: https://www.agrocultivo.com.br (accessed on 26 March 2026).
  22. Sousa, D.M.G.; Lobato, E. Cerrado: Correção do Solo e Adubação; Embrapa Informação Tecnológica: Brasília, Brazil, 2004. [Google Scholar]
  23. Wellburn, A.R. The spectral determination of chlorophyll a and b, as well as total carotenoids, using various solvents with spectrophotometers of different resolution. J. Plant Physiol. 1994, 144, 307–313. [Google Scholar] [CrossRef]
  24. Genty, B.; Briantais, J.M.; Baker, N.R. The relationship between the quantum yield of photosynthetic electron transport and quenching of chlorophyll fluorescence. Biochim. Biophys. Acta 1989, 990, 87–92. [Google Scholar] [CrossRef]
  25. Bilger, W.; Schreiber, U.; Bock, M. Determination of the quantum efficiency of photosystem II and of non-photochemical quenching of chlorophyll fluorescence in the field. Oecologia 1995, 102, 425–432. [Google Scholar] [CrossRef] [PubMed]
  26. Bilger, W.; Björkman, O. Role of xanthophyll cycle in photoprotection elucidated by measurements of light-induced absorbance changes, fluorescence and photosynthesis in leaves of Hedera canariensis. Photosynth. Res. 1990, 25, 173–185. [Google Scholar] [CrossRef]
  27. Biemelt, S.; Keetman, U.; Albrecht, G. Re-aeration following hypoxia or anoxia leads to activation of the antioxidative defense system in roots of wheat seedlings. Plant Physiol. 1998, 116, 651–658. [Google Scholar] [CrossRef]
  28. Giannopolitis, C.N.; Ries, S.K. Superoxide dismutases: I. Occurrence in higher plants. Plant Physiol. 1977, 59, 309–314. [Google Scholar] [CrossRef]
  29. Havir, E.A.; McHale, N.A. Biochemical and developmental characterization of multiple forms of catalase in tobacco leaves. Plant Physiol. 1987, 84, 450–455. [Google Scholar] [CrossRef]
  30. Fang, W.C.; Kao, C.H. Enhanced peroxidase activity in rice leaves in response to excess iron, copper and zinc. Plant Sci. 2000, 158, 71–76. [Google Scholar] [CrossRef]
  31. Nakano, Y.; Asada, K. Hydrogen peroxide is scavenged by ascorbate-specific peroxidase in spinach chloroplasts. Plant Cell Physiol. 1981, 22, 867–880. [Google Scholar] [CrossRef]
  32. Gay, C.; Gebicki, J.M. A critical evaluation of the effect of sorbitol on the ferric-xylenol orange hydroperoxide assay. Anal. Biochem. 2000, 284, 217–220. [Google Scholar] [CrossRef] [PubMed]
  33. Vasquez-Tello, A.; Zuily-Fodil, Y.; Pham Thi, A.T.; Silva, J.B.V. Electrolyte and Pi leakages and soluble sugar content as physiological tests for screening resistance to water stress in Phaseolus and Vigna species. J. Exp. Bot. 1990, 41, 827–832. [Google Scholar] [CrossRef]
  34. European Weed Research Council (EWRC). Report of the 3rd and 4th meetings of EWRC-I of methods in weed research. Weed Res. 1964, 4, 88. [Google Scholar]
  35. Cosmulescu, S.; Scrieciu, F.; Manda, M. Determination of leaf characteristics in different medlar genotypes using the ImageJ program. Hortic. Sci. 2020, 47, 117–121. [Google Scholar] [CrossRef]
  36. R Core Team. R: A Language and Environment for Statistical Computing; R Foundation for Statistical Computing: Vienna, Austria, 2025; Available online: https://www.R-project.org/ (accessed on 26 March 2026).
  37. Matringe, M.; Sailland, A.; Pelissier, B.; Rolland, A.; Zink, O. p-Hydroxyphenylpyruvate dioxygenase inhibitor-resistant plants. Pest Manag. Sci. 2005, 61, 269–276. [Google Scholar] [CrossRef] [PubMed]
  38. Ndikuryayo, F.; Moosavi, B.; Yang, W.C.; Yang, G.F. 4-Hydroxyphenylpyruvate dioxygenase inhibitors: From chemical biology to agrochemicals. J. Agric. Food Chem. 2017, 65, 8523–8537. [Google Scholar] [CrossRef]
  39. Aarthy, T.; Shyam, C.; Jugulam, M. Rapid metabolism and increased expression of CYP81E8 gene confer high level of resistance to tembotrione in a multiple-resistant Palmer amaranth (Amaranthus palmeri S. Watson). Front. Agron. 2022, 4, 1010292. [Google Scholar] [CrossRef]
  40. Dayan, F.E.; Owens, D.K.; Corniani, N.; Silva, F.M.L.; Watson, S.B.; Howell, J.; Shaner, D.L. Biochemical markers and enzyme assays for herbicide mode of action and resistance studies. Weed Sci. 2015, 63, 23–63. [Google Scholar] [CrossRef]
  41. Wang, Q.; Yu, F.; Xie, Q. Balancing growth and adaptation to stress: Crosstalk between brassinosteroid and abscisic acid signaling. Plant Cell Environ. 2020, 43, 2325–2335. [Google Scholar] [CrossRef]
  42. Nakka, S.; Godar, A.S.; Wani, P.S.; Thompson, C.R.; Peterson, D.E.; Roelofs, J.; Jugulam, M. Physiological and molecular characterization of hydroxyphenylpyruvate dioxygenase (HPPD)-inhibitor resistance in Palmer amaranth (Amaranthus palmeri S. Wats.). Front. Plant Sci. 2017, 8, 555. [Google Scholar] [CrossRef] [PubMed]
  43. Pacheco, A.C.; Sobral, L.A.; Gorni, P.H.; Carvalho, M.E.A. Ascophyllum nodosum extract improves phenolic compound content and antioxidant activity of medicinal and functional food plant Achillea millefolium L. Aust. J. Crop Sci. 2019, 13, 418–423. [Google Scholar] [CrossRef]
  44. Concato, A.C.; Sutorillo, N.T.; Tamagno, W.A.; de Paula, M.O.; Dada, R.A.; Piccini, G.B.; Vanin, A.P.; Alves, C.; Gomes, J.D.; Menegat, A.D.; et al. Effect of herbicides on the activity of antioxidant enzymes and ALA-D in transgenic hybrid corn. Aust. J. Crop Sci. 2022, 16, 45–53. [Google Scholar] [CrossRef]
  45. Kaur, G. Herbicides and its role in induction of oxidative stress: A review. Int. J. Environ. Agric. Biotechnol. 2019, 4, 995–1004. [Google Scholar] [CrossRef]
  46. Gheisary, B.; Fattahi, M.; Alipour, H. Ascophyllum nodosum L. extract alleviates drought stress by enhancing physio-biochemical properties and antioxidant activity in Italian viper’s bugloss (Echium italicum L.). Ind. Crops Prod. 2025, 228, 120864. [Google Scholar] [CrossRef]
  47. Nisler, J.; Kučerová, Z.; Koprna, R.; Sobotka, R.; Slivková, J.; Rossall, S.; Špundová, M.; Husičková, A.; Pilný, J.; Tarkowská, D.; et al. Urea derivative MTU improves stress tolerance and yield in wheat by promoting cyclic electron flow around PSI. Front. Plant Sci. 2023, 14, 1131326. [Google Scholar] [CrossRef] [PubMed]
  48. Kanwal, H.; Shoaib, I.; Noman, A.; Maqsood, M.F.; Naheed, R.; Alzoubi, O.M.; Hashem, M.; Elnour, R.; Alzuaibr, F.M.; Khalid, N.; et al. Biostimulant-mediated cellular repair by improving antioxidant dynamics and osmoregulation against metal stress in canola. Turk. J. Agric. For. 2024, 48, 580–594. [Google Scholar] [CrossRef]
  49. Franzoni, G.; Bulgari, R.; Florio, F.E.; Gozio, E.; Villa, D.; Cocetta, G.; Ferrante, A. Effect of biostimulant raw materials on soybean (Glycine max) crop, when applied alone or in combination with herbicides. Front. Agron. 2023, 5, 1238273. [Google Scholar] [CrossRef]
  50. Capo, L.; Sopegno, A.; Reyneri, A.; Ujvári, G.; Agnolucci, M.; Blandino, M. Agronomic strategies to enhance the early vigor and yield of maize part II: The role of seed applied biostimulant, hybrid, and starter fertilization on crop performance. Front. Plant Sci. 2023, 14, 1240313. [Google Scholar] [CrossRef]
  51. da Silva, A.G.; Melo, G.B.; Costa, A.C.; Rosa, M.; Bessa, L.A.; Teixeira, M.B.; Braz, G.B.P.; Teixeira, I.R.; Vitorino, L.C. Ascophyllum nodosum-based biostimulant mitigates lactofen herbicide phytotoxicity in soybean crops. Int. J. Plant Prod. 2025, 19, 239–254. [Google Scholar] [CrossRef]
  52. Wang, H.; Liu, W.; Jin, T.; Peng, X.; Zhang, L.; Wang, J. Bipyrazone: A new HPPD-inhibiting herbicide in wheat. Sci. Rep. 2020, 10, 5521. [Google Scholar] [CrossRef] [PubMed]
  53. Sherwani, S.I.; Arif, I.A.; Khan, H.A. Modes of action of different classes of herbicides. In Herbicides, Physiology of Action, and Safety; Price, A., Ed.; InTech: Rijeka, Croatia, 2015; pp. 165–186. [Google Scholar]
  54. Baghdadi, A.; Della Lucia, M.C.; Borella, M.; Bertoldo, G.; Ravi, S.; Zegada-Lizarazu, W.; Chiodi, C.; Pagani, E.; Hermans, C.; Stevanato, P.; et al. A dual-omics approach for profiling plant responses to biostimulant applications under controlled and field conditions. Front. Plant Sci. 2022, 13, 983772. [Google Scholar] [CrossRef]
  55. Pereira, L.; Morrison, L.; Shukla, P.S.; Critchley, A.T. A concise review of the brown macroalga Ascophyllum nodosum (Linnaeus) Le Jolis. J. Appl. Phycol. 2020, 32, 3561–3584. [Google Scholar] [CrossRef]
  56. McCurdy, J.D.; McElroy, J.S.; Kopsell, D.A.; Sams, C.E.; Sorochan, J.C. Effects of mesotrione on perennial ryegrass (Lolium perenne L.) carotenoid concentrations under varying environmental conditions. J. Agric. Food Chem. 2008, 56, 9133–9139. [Google Scholar] [CrossRef] [PubMed]
  57. Vítek, P.; Novotná, K.; Hodaňová, P.; Rapantová, B.; Klem, K. Detection of herbicide effects on pigment composition and PSII photochemistry in Helianthus annuus by Raman spectroscopy and chlorophyll a fluorescence. Spectrochim. Acta A Mol. Biomol. Spectrosc. 2017, 170, 234–241. [Google Scholar] [CrossRef]
  58. Battaglino, B.; Grinzato, A.; Pagliano, C. Binding properties of photosynthetic herbicides with the QB site of the D1 protein in plant photosystem II: A combined functional and molecular docking study. Plants 2021, 10, 1501. [Google Scholar] [CrossRef]
  59. Ferroni, L.; Colpo, A.; Baldisserotto, C.; Pancaldi, S. In an ancient vascular plant the intermediate relaxing component of NPQ depends on a reduced stroma: Evidence from dithiothreitol treatment. J. Photochem. Photobiol. B 2021, 215, 112114. [Google Scholar] [CrossRef]
  60. Qiao, M.; Hong, C.; Jiao, Y.; Hou, S.; Gao, H. Impacts of drought on photosynthesis in major food crops and the related mechanisms of plant responses to drought. Plants 2024, 13, 1808. [Google Scholar] [CrossRef]
  61. Wang, Z.; Li, G.; Sun, H.; Ma, L.; Guo, Y.; Zhao, Z.; Gao, H.; Mei, L. Effects of drought stress on photosynthesis and photosynthetic electron transport chain in young apple tree leaves. Biol. Open 2018, 7, bio035279. [Google Scholar] [CrossRef] [PubMed]
  62. Falcioni, R.; Chicati, M.L.; de Oliveira, R.B.; Antunes, W.C.; Hasanuzzaman, M.; Demattê, J.A.M.; Nanni, M.R. Decreased photosynthetic efficiency in Nicotiana tabacum L. under transient heat stress. Plants 2024, 13, 395. [Google Scholar] [CrossRef]
  63. von Caemmerer, S.; Furbank, R.T. Strategies for improving C4 photosynthesis. Curr. Opin. Plant Biol. 2016, 31, 125–134. [Google Scholar] [CrossRef]
  64. Mantlana, K.B.; Arneth, A.; Veenendaal, E.M.; Wohland, P.; Wolski, P.; Kolle, O.; Wagner, M.; Lloyd, J. Photosynthetic properties of C4 plants growing in an African savanna/wetland mosaic. J. Exp. Bot. 2008, 59, 3941–3952. [Google Scholar] [CrossRef][Green Version]
  65. Wahab, A.; Abdi, G.; Saleem, M.H.; Ali, B.; Ullah, S.; Shah, W.; Mumtaz, S.; Yasin, G.; Muresan, C.C.; Marc, R.A. Plants’ physio-biochemical and phyto-hormonal responses to alleviate the adverse effects of drought stress: A comprehensive review. Plants 2022, 11, 1620. [Google Scholar] [CrossRef] [PubMed]
  66. Rottet, S.; Förster, B.; Hee, W.Y.; Rourke, L.M.; Price, G.D.; Long, B.M. Engineered accumulation of bicarbonate in plant chloroplasts: Known knowns and known unknowns. Front. Plant Sci. 2021, 12, 727118. [Google Scholar] [CrossRef]
  67. Kimber, M.S. Carboxysomal carbonic anhydrases. In Carbonic Anhydrase: Mechanism, Regulation, Links to Disease, and Industrial Applications; Frost, S.C., McKenna, R., Eds.; Springer: Dordrecht, The Netherlands, 2014; pp. 89–103. [Google Scholar]
  68. Wang, W.; Xu, L.; Jiang, G.; Li, Z.; Bi, Y.H.; Zhou, Z.G. Characterization of a novel γ-type carbonic anhydrase, Sjγ-CA2, in Saccharina japonica: Insights into carbon concentration mechanism in macroalgae. Int. J. Biol. Macromol. 2024, 263, 130506. [Google Scholar] [CrossRef]
  69. Capó-Bauçà, S.; Galmés, J.; Aguiló-Nicolau, P.; Ramis-Pozuelo, S.; Iñiguez, C. Carbon assimilation in upper subtidal macroalgae is determined by an inverse correlation between Rubisco carboxylation efficiency and CO2 concentrating mechanism effectiveness. New Phytol. 2023, 237, 2027–2038. [Google Scholar] [CrossRef]
  70. Sakoda, K.; Yamori, W.; Groszmann, M.; Evans, J.R. Stomatal, mesophyll conductance, and biochemical limitations to photosynthesis during induction. Plant Physiol. 2021, 185, 146–160. [Google Scholar] [CrossRef]
  71. Wang, Y.; Chan, K.X.; Long, S.P. Towards a dynamic photosynthesis model to guide yield improvement in C4 crops. Plant J. 2021, 107, 343–359. [Google Scholar] [CrossRef] [PubMed]
  72. Rao, M.J.; Duan, M.; Zhou, C.; Jiao, J.; Cheng, P.; Yang, L.; Wei, W.; Shen, Q.; Ji, P.; Yang, Y.; et al. Antioxidant defense system in plants: Reactive oxygen species production, signaling, and scavenging during abiotic stress-induced oxidative damage. Horticulturae 2025, 11, 477. [Google Scholar] [CrossRef]
  73. Hasanuzzaman, M.; Parvin, K.; Bardhan, K.; Nahar, K.; Anee, T.I.; Masud, A.A.C.; Fotopoulos, V. Biostimulants for the regulation of reactive oxygen species metabolism in plants under abiotic stress. Cells 2021, 10, 2537. [Google Scholar] [CrossRef] [PubMed]
  74. Hasanuzzaman, M.; Bhuyan, M.H.M.; Zulfiqar, F.; Raza, A.; Mohsin, S.; Mahmud, J.; Fujita, M.; Fotopoulos, V. Reactive oxygen species and antioxidant defense in plants under abiotic stress: Revisiting the crucial role of a universal defense regulator. Antioxidants 2020, 9, 681. [Google Scholar] [CrossRef]
  75. Raza, A.; Salehi, H.; Rahman, M.A.; Zahid, Z.; Madadkar Haghjou, M.; Najafi-Kakavand, S.; Charagh, S.; Osman, H.S.; Albaqami, M.; Zhuang, Y.; et al. Plant hormones and neurotransmitter interactions mediate antioxidant defenses under induced oxidative stress in plants. Front. Plant Sci. 2022, 13, 961872. [Google Scholar] [CrossRef]
  76. Santaniello, A.; Scartazza, A.; Gresta, F.; Loreti, E.; Biasone, A.; Di Tommaso, D.; Piaggesi, A.; Perata, P. Ascophyllum nodosum seaweed extract alleviates drought stress in Arabidopsis by affecting photosynthetic performance and related gene expression. Front. Plant Sci. 2017, 8, 1362. [Google Scholar] [CrossRef]
  77. Candido, V.; Cantore, V.; Castronuovo, D.; Denora, M.; Schiattone, M.I.; Sergio, L.; Todorovic, M.; Boari, F. Effect of water regime, nitrogen level, and biostimulant application on the water and nitrogen use efficiency of wild rocket [Diplotaxis tenuifolia (L.) DC]. Agronomy 2023, 13, 507. [Google Scholar] [CrossRef]
  78. Chen, P.; Shi, M.; Liu, X.; Wang, X.; Fang, M.; Guo, Z.; Wu, X.; Wang, Y. Comparison of the binding interactions of 4-hydroxyphenylpyruvate dioxygenase inhibitor herbicides with humic acid: Insights from multispectroscopic techniques, DFT and 2D-COS-FTIR. Ecotoxicol. Environ. Saf. 2022, 239, 113699. [Google Scholar] [CrossRef]
  79. Hasanuzzaman, M.; Raihan, M.R.H.; Nowroz, F.; Nahar, K. Insight into the physiological and biochemical mechanisms of biostimulating effect of Ascophyllum nodosum and Moringa oleifera extracts to minimize cadmium-induced oxidative stress in rice. Environ. Sci. Pollut. Res. 2023, 30, 55298–55313. [Google Scholar] [CrossRef] [PubMed]
  80. Lin, H.; Yang, J.; Wang, D.; Hao, G.; Dong, J.; Wang, Y.; Yang, W.; Wu, J.; Zhan, C.; Yang, G. Molecular insights into the mechanism of 4-hydroxyphenylpyruvate dioxygenase inhibition: Enzyme kinetics, X-ray crystallography and computational simulations. FEBS J. 2019, 286, 975–990. [Google Scholar] [CrossRef] [PubMed]
  81. Yang, T.L.; Dong, J.; Wang, X.L.; Dong, J.; Lin, H.Y. Discovery of 4-hydroxyphenylpyruvate dioxygenase inhibitors with novel pharmacophores. Adv. Agrochem 2024, 3, 344–350. [Google Scholar] [CrossRef]
  82. Lin, H.Y.; Dong, J.; Dong, J.; Yang, W.C.; Yang, G.F. Insights into 4-hydroxyphenylpyruvate dioxygenase-inhibitor interactions from comparative structural biology. Trends Biochem. Sci. 2023, 48, 568–584. [Google Scholar] [CrossRef]
  83. Omidbakhshfard, M.A.; Sujeeth, N.; Gupta, S.; Omranian, N.; Guinan, K.J.; Brotman, Y.; Nikoloski, Z.; Fernie, A.R.; Mueller-Roeber, B.; Gechev, T.S. A biostimulant obtained from the seaweed Ascophyllum nodosum protects Arabidopsis thaliana from severe oxidative stress. Int. J. Mol. Sci. 2020, 21, 474. [Google Scholar] [CrossRef]
  84. Irani, H.; ValizadehKaji, B.; Naeini, M.R. Biostimulant-induced drought tolerance in grapevine is associated with physiological and biochemical changes. Chem. Biol. Technol. Agric. 2021, 8, 5. [Google Scholar] [CrossRef]
  85. Shahzad, R.; Harlina, P.W.; Gallego, P.P.; Flexas, J.; Ewas, M.; Leiwen, X.; Karuniawan, A. The seaweed Ascophyllum nodosum-based biostimulant enhances salt stress tolerance in rice (Oryza sativa L.) by remodeling physiological, biochemical, and metabolic responses. J. Plant Interact. 2023, 18, 2266514. [Google Scholar] [CrossRef]
  86. Cerruti, P.; Campobenedetto, C.; Montrucchio, E.; Agliassa, C.; Contartese, V.; Acquadro, A.; Bertea, C.M. Antioxidant activity and comparative RNA-seq analysis support mitigating effects of an algae-based biostimulant on drought stress in tomato plants. Physiol. Plant. 2024, 176, e70007. [Google Scholar] [CrossRef] [PubMed]
  87. Campobenedetto, C.; Grange, E.; Mannino, G.; van Arkel, J.; Beekwilder, J.; Karlova, R.; Garabello, C.; Contartese, V.; Bertea, C.M. A biostimulant seed treatment improved heat stress tolerance during cucumber seed germination by acting on the antioxidant system and glyoxylate cycle. Front. Plant Sci. 2020, 11, 836. [Google Scholar] [CrossRef]
  88. Campobenedetto, C.; Mannino, G.; Agliassa, C.; Acquadro, A.; Contartese, V.; Garabello, C.; Bertea, C.M. Transcriptome analyses and antioxidant activity profiling reveal the role of a lignin-derived biostimulant seed treatment in enhancing heat stress tolerance in soybean. Plants 2020, 9, 1308. [Google Scholar] [CrossRef] [PubMed]
  89. Lephatsi, M.; Nephali, L.; Meyer, V.; Piater, L.A.; Buthelezi, N.; Dubery, I.A.; Opperman, H.; Brand, M.; Huyser, J.; Tugizimana, F. Molecular mechanisms associated with microbial biostimulant-mediated growth enhancement, priming and drought stress tolerance in maize plants. Sci. Rep. 2022, 12, 10450. [Google Scholar] [CrossRef]
  90. Ali, O.; Ramsubhag, A.; Jayaraman, J. Biostimulant properties of seaweed extracts in plants: Implications towards sustainable crop production. Plants 2021, 10, 531. [Google Scholar] [CrossRef]
  91. Sujeeth, N.; Petrov, V.; Guinan, K.J.; Rasul, F.; O’Sullivan, J.T.; Gechev, T.S. Current Insights into the Molecular Mode of Action of Seaweed-Based Biostimulants and the Sustainability of Seaweeds as Raw Material Resources. Int. J. Mol. Sci. 2022, 23, 7654. [Google Scholar] [CrossRef] [PubMed]
  92. Shakya, R.; Capilla, E.; Torres-Pagán, N.; Muñoz, M.; Boscaiu, M.; Lupuţ, I.; Vicente, O.; Verdeguer, M. Effect of Two Biostimulants, Based on Ascophyllum nodosum Extracts, on Strawberry Performance under Mild Drought Stress. Agriculture 2023, 13, 2108. [Google Scholar] [CrossRef]
  93. De Clercq, P.; Pauwels, E.; Top, S.; Steppe, K.; Van Labeke, M.-C. Effect of Seaweed-Based Biostimulants on Growth and Development of Hydrangea paniculata under Continuous or Periodic Drought Stress. Horticulturae 2023, 9, 509. [Google Scholar] [CrossRef]
  94. Jesus, J.F.d.; Santos, A.S.; Sousa, R.O.d.; Fonseca, B.S.F.d.; Ferreira, W.S.; Silva, R.F.d.; Paula-Marinho, S.d.O.; Barroso, P.A.; Luz, M.R.; Alcântara Neto, F.d. Ascophyllum nodosum-Derived Biostimulant Promotes Physiological Conditioning to Increase Soybean Yield in a Semiarid Climate. J. Appl. Phycol. 2024, 36, 3755–3768. [Google Scholar] [CrossRef]
  95. Franzoni, G.; Cocetta, G.; Prinsi, B.; Ferrante, A.; Espen, L. Biostimulants on Crops: Their Impact under Abiotic Stress Conditions. Horticulturae 2022, 8, 189. [Google Scholar] [CrossRef]
  96. Repke, R.A.; Silva, D.M.R.; dos Santos, J.C.C.; de Almeida Silva, M. Increased Soybean Tolerance to High-Temperature through Biostimulant Based on Ascophyllum nodosum (L.) Seaweed Extract. J. Appl. Phycol. 2022, 34, 3205–3218. [Google Scholar] [CrossRef]
  97. Bulgari, R.; Franzoni, G.; Ferrante, A. Biostimulants Application in Horticultural Crops under Abiotic Stress Conditions. Agronomy 2019, 9, 306. [Google Scholar] [CrossRef]
  98. Shahrajabian, M.H.; Chaski, C.; Polyzos, N.; Petropoulos, S.A. Biostimulants Application: A Low Input Cropping Management Tool for Sustainable Farming of Vegetables. Biomolecules 2021, 11, 698. [Google Scholar] [CrossRef]
  99. Espinoza Galaviz, J.Y.; Romero Félix, C.S.; Sánchez Soto, B.H.; Sauceda Acosta, R.H.; Almada Ruíz, V.G.; Lugo Garcia, G.A. Biostimulants on Yield and Its Components in Common Bean (Phaseolus vulgaris L.). Agro Product. 2023, 16, 121–127. [Google Scholar] [CrossRef]
  100. Mandal, S.; Anand, U.; López-Bucio, J.; Radha; Kumar, M.; Lal, M.K.; Tiwari, R.K.; Dey, A. Biostimulants and Environmental Stress Mitigation in Crops: A Novel and Emerging Approach for Agricultural Sustainability under Climate Change. Environ. Res. 2023, 233, 116357. [Google Scholar] [CrossRef]
  101. Di Sario, L.; Boeri, P.; Matus, J.T.; Pizzio, G.A. Plant Biostimulants to Enhance Abiotic Stress Resilience in Crops. Int. J. Mol. Sci. 2025, 26, 1129. [Google Scholar] [CrossRef] [PubMed]
  102. Johnson, R.; Joel, J.M.; Puthur, J.T. Biostimulants: The Futuristic Sustainable Approach for Alleviating Crop Productivity and Abiotic Stress Tolerance. J. Plant Growth Regul. 2024, 43, 659–674. [Google Scholar] [CrossRef]
  103. Li, J.; Van Gerrewey, T.; Geelen, D. A Meta-Analysis of Biostimulant Yield Effectiveness in Field Trials. Front. Plant Sci. 2022, 13, 836702. [Google Scholar] [CrossRef] [PubMed]
  104. Gazoulis, I.; Kanatas, P.; Antonopoulos, N.; Kokkini, M.; Tsekoura, A.; Demirtzoglou, T.; Travlos, I. The Integrated Effects of Biostimulant Application, Mechanical Weed Control, and Herbicide Application on Weed Growth and Maize (Zea mays L.) Yield. Agronomy 2023, 13, 2614. [Google Scholar] [CrossRef]
  105. Kanatas, P.; Travlos, I.; Gazoulis, I.; Antonopoulos, N.; Tataridas, A.; Mpechliouli, N.; Petraki, D. Biostimulants and Herbicides: A Promising Approach towards Green Deal Implementation. Agronomy 2022, 12, 3205. [Google Scholar] [CrossRef]
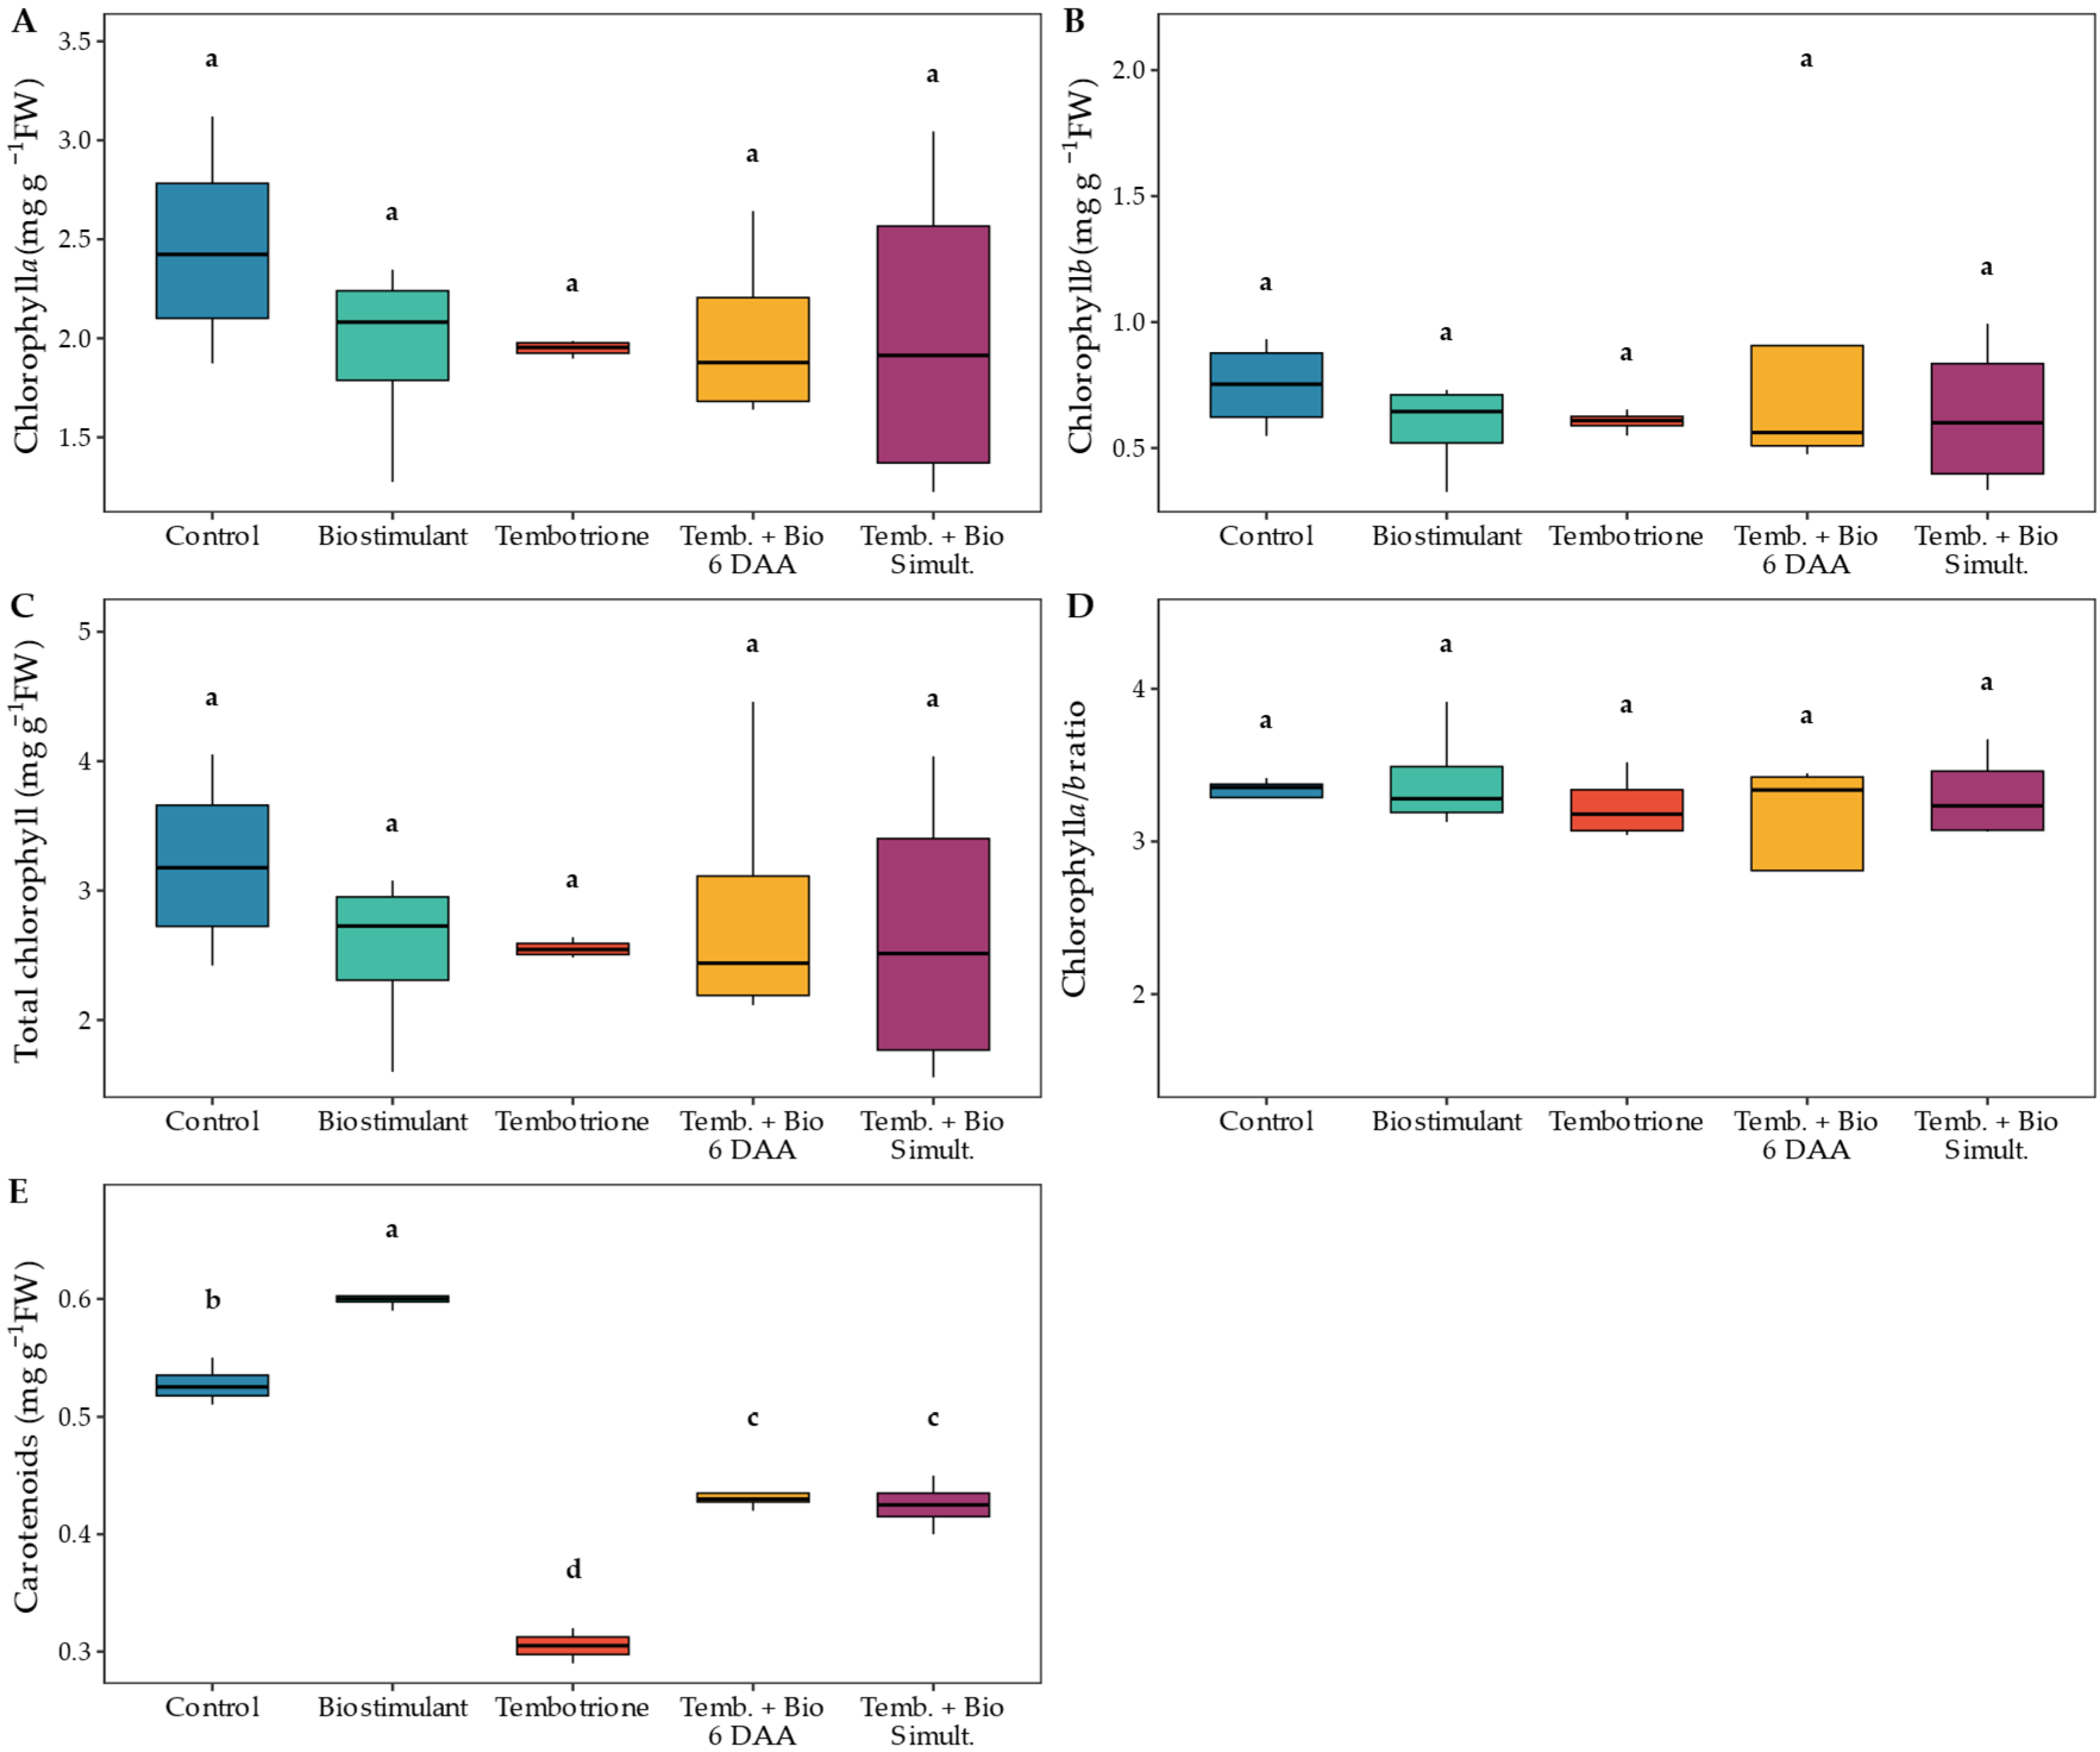
Figure 1. Effects of tembotrione herbicide ± biostimulant on leaf pigment profiles in sorghum plants. Box plots show chlorophyll a (A), chlorophyll b (B), total chlorophyll (C), chlorophyll a/b ratio (D), and carotenoid content (E) in plants subjected to five treatments: Control, Biostimulant, Tembotrione, and Tembotrione + Biostimulant were applied 6 days after the herbicide (Temb.+Bio 6 DAT), and Tembotrione + Biostimulant was applied simultaneously (Temb.+Bio Simult.). Different lowercase letters indicate means that differ significantly according to Tukey’s HSD test (α = 0.05); shared letters indicate no significant difference.
Agronomy 16 00889 g001
Figure 2. Photosynthetic performance of sorghum plants exposed to tembotrione herbicide with or without a biostimulant. Box plots show (A) the effective quantum yield of PS II photochemistry (ΦPSII); (B) the electron transport rate (ETR); (C) non-photochemical quenching (NPQ), and (D) the maximum quantum yield of PSII (Fv/Fm) for five treatments: Control, Biostimulant, Tembotrione, and Tembotrione + Biostimulant applied 6 days after the herbicide (Temb.+Bio 6 DAT), and Tembotrione + Biostimulant applied simultaneously (Temb.+Bio Simult.). Different lowercase letters indicate means that differ significantly according to Tukey’s HSD test (α = 0.05); shared letters indicate no significant difference.
Agronomy 16 00889 g002
Figure 3. Leaf gas exchange responses of sorghum plants exposed to tembotrione herbicide with or without a biostimulant. Box plots show (A) net photosynthesis (A), (B) transpiration rate (E), (C) stomatal conductance (gsw), (D) the ratio of internal to ambient CO2 concentration (Ci/Ca), (E) carboxylation efficiency (A/Ci), and (F) water-use efficiency (WUE) across five treatments: Control, Biostimulant, Tembotrione, and Tembotrione + Biostimulant applied 6 days after herbicide (Temb.+Bio 6 DAT), and Tembotrione + Biostimulant applied simultaneously (Temb.+Bio Simult.). Different lowercase letters indicate means that are significantly different according to Tukey’s HSD test (α = 0.05); shared letters denote no significant difference.
Agronomy 16 00889 g003
Figure 4. Antioxidant enzyme activities and oxidative stress markers in sorghum plants exposed to tembotrione herbicide with or without a biostimulant. Box plots show (A) superoxide dismutase (SOD; U mg−1 protein), (B) catalase (CAT; µmol H2O2 min−1 mg−1 protein), (C) peroxidase (POX; µmol H2O2 min−1 mg−1 protein), (D) ascorbate peroxidase (APX; µmol AsA min−1 mg−1 protein), (E) hydrogen peroxide content (H2O2; µmol g−1 FW), and (F) electrolyte leakage (EL; %) for five treatments: Control, Biostimulant, Tembotrione, and Tembotrione + Biostimulant applied 6 days after the herbicide (Temb.+Bio 6 DAT), and Tembotrione + Biostimulant applied simultaneously (Temb.+Bio Simult.). Different lowercase letters above the boxes indicate means that are significantly different according to Tukey’s Honest Significant Difference test (α = 0.05); shared letters denote no significant difference.
Agronomy 16 00889 g004
Figure 5. Effects of tembotrione herbicide with or without a biostimulant on sorghum plants’ morphological and growth traits. Box plots show (A) phytotoxicity grade (GF; scale 1–6), (B) leaf area index (LAI; cm2 cm−2), (C) plant height (PH; cm), (D) leaf number per plant (LN), (E) stem dry mass (SDM; g plant−1), (F) leaf dry mass (LDM; g plant−1), and (G) root dry mass (RDM; g plant−1) for five treatments: Control, Biostimulant, Tembotrione, and Tembotrione + Biostimulant applied 6 days after herbicide (Temb.+Bio 6 DAT), and Tembotrione + Biostimulant applied simultaneously (Temb.+Bio Simult.). Different lowercase letters above the boxes indicate means that differ significantly according to Tukey’s honest significant difference test (α = 0.05); shared letters denote no significant difference.
Agronomy 16 00889 g005
Figure 6. Effects of tembotrione herbicide with or without a biostimulant on grain yield components and sorghum plant productivity. Box plots display (A) number of grains per plant (NGP; grains plant−1), (B) hundred-grain weight (HGW; g 100 grains−1), and (C) plant yield (g plant−1) for five treatments: Control, Biostimulant, Tembotrione, and Tembotrione + Biostimulant applied 6 days after the herbicide (Temb.+Bio 6 DAT), and Tembotrione + Biostimulant applied simultaneously (Temb.+Bio Simult.). Different lowercase letters above the boxes indicate means that differ significantly according to Tukey’s honestly significant difference test (α = 0.05); shared letters indicate no significant difference.
Agronomy 16 00889 g006
Figure 7. Global PCA biplot of 14 key physiological and agronomic variables and the visual aspect of sorghum plants at the V4 phenological stage, using five treatments: Control, Biostimulant, Tembotrione, and Tembotrione + Biostimulant applied 6 d after treatment (6 DAT), and Tembotrione + Biostimulant applied simultaneously (Simult.). Arrows represent variable loadings onto PC1 (57.7% of variance) and PC2 (15.0% of variance); arrow direction and length indicate the direction and magnitude of each variable’s contribution to the principal components. Shaded ellipses represent 95% confidence regions (t-distribution) for each treatment group. Variables with positive PC1 loadings (H2O2, phytotoxicity grade—GF, NPQ, and electrolyte leakage—TLE) reflect oxidative stress and photoinhibition responses, whereas negative PC1 loadings (carotenoids, net CO2 assimilation—A, ΦPSII, and grain yield—PROD) indicate photosynthetic efficiency and productivity. PC2 primarily captures water-use efficiency (WUE) and antioxidant defense capacity (SOD). Treatments: Control (blue); Biostimulant (green); Tembotrione (red); Temb.+Bio 6 DAT (orange); and Temb.+Bio Simult. (purple).
Agronomy 16 00889 g007
Figure 8. Thematic PCA biplots for (A) Photosynthetic Pigments, (B) Chlorophyll Fluorescence, (C) Gas Exchange, and (D) Antioxidant System and Oxidative Stress. Each panel displays treatment scores and variable loadings onto the first two principal components, with the percentage of variance explained indicated on each axis. Shaded ellipses represent 95% confidence regions (t-distribution) for each treatment group.
Agronomy 16 00889 g008
Figure 9. Thematic PCA biplots for (A) vegetative growth and (B) yield components. Each panel displays treatment scores and variable loadings onto the first two principal components, with the percentage of variance explained indicated on each axis. Shaded ellipses represent 95% confidence regions (t-distribution) for each treatment group.
Agronomy 16 00889 g009
Disclaimer/Publisher’s Note: The statements, opinions and data contained in all publications are solely those of the individual author(s) and contributor(s) and not of MDPI and/or the editor(s). MDPI and/or the editor(s) disclaim responsibility for any injury to people or property resulting from any ideas, methods, instructions or products referred to in the content.