Article

Can We Grow Sweet Cherry Trees in Pots? Quality Assessment of Fruits Produced in Tunnels Under Different Regimes of Fertigation and Fertilisation


by
Milica Fotirić Akšić
1,
Dragana Dabić Zagorac
2,
Marko Kitanović
1,
Kristina Đorđević
3,
Maja Natić
4,
Oddmund Frøynes
5 and
Mekjell Meland
5,6,*
1
Faculty of Agriculture, University of Belgrade, Nemanjina 6, 11000 Belgrade, Serbia
2
Innovative Centre of the Faculty of Chemistry, University of Belgrade, Studentski Trg 12–16, 11000 Belgrade, Serbia
3
Faculty of Forestry, University of Belgrade, Kneza Višeslava 1, 11000 Belgrade, Serbia
4
Faculty of Chemistry, University of Belgrade, Studentski Trg 12–16, 11000 Belgrade, Serbia
5
Department of Horticulture, Norwegian Institute of Bioeconomy Research, NIBIO, N-5781 Ullensvang, Norway
6
FruitResearch AS, Brattespevegen 3, N-5773 Hovland, Norway
*
Author to whom correspondence should be addressed.
Agronomy 2026, 16(9), 890; https://doi.org/10.3390/agronomy16090890
Submission received: 22 January 2026 / Revised: 17 April 2026 / Accepted: 23 April 2026 / Published: 28 April 2026
(This article belongs to the Section Horticultural and Floricultural Crops)

Abstract

Commercial production of sweet cherries is possible up to approximately 60° N latitude in Norway and is among the most economically important fruit crops in the country. The harvest is late, but yields are very high, and the fruit is intended solely for the fresh market. The objective of this study was to assess whether sweet cherry can be grown in pots and to determine fruit quality (sugar, acid, polyphenol, and mineral content) of three sweet cherry cultivars (‘Van’, ‘Lapins’, and ‘Regina’) grown in high tunnels with varying levels of fertigation (F) and the application of slow-release (SR) fertilisers. Trees were planted in 35 L plastic bags, trained as spindle trees, with a spacing of 1 × 2.5 m (4000 trees/ha). The tunnel was covered with polythene from flowering until harvest. Fruit produced in pots had low levels of sugars and acids and high levels of phenolic acids and flavonoids, while the mineral content depended on treatment and cultivar. The main sugar components (glucose and fructose), the sweetness index, phenolic acids (chlorogenic acid and ferulic acid), flavanols (catechin, rutin, quercetin, and hyperoside), and minerals (P, K, Mg, Ca, and Na) were much higher in the F treatment. SR treatments were more effective in increasing the content of acids (shikimic, malic, and quinic) and total phenolic content (TPC). Radical scavenging activity (RSA) and total sugars showed no statistically significant differences between the treatments studied. ‘Lapins’ fruit obtained from the fertigation regimes (when Kristalon brown + Calcinit + Magnesium-sulphate were added from mid-April to 1 September and plain water for the rest of the season, up to an electric conductivity (EC) of 0.5 and 1.0) contained the highest levels of minerals (P, K, Mg, Ca). The ‘Van’ cultivar from F treatments, especially VF2 (when Kristalon brown + Calcinit + Magnesium-sulphate were added from mid-April to 1 September and plain water for the rest of the season, with EC 1.0) and VF3 (when Kristalon brown is added in July, Kristalon brown + Calcinit + Magnesium-sulphate in August, and plain water for the rest of the season) had the highest sweetness index, glucose, fructose, chlorogenic acid, ferulic acid, and hyperoside in sweet cherry fruit. ‘Regina’ under the RSR1 (50 g Multicote and 30 g chalk lime per tree) and RSR2 regimes (100 g Multicote and 30 g chalk lime per tree) produced fruit with the highest acid components, RSA and TPC. This suggests that sweet cherry trees can be grown in pots under high tunnels, but nutrition should be adjusted for each cultivar according to its physiological responses to specific microclimate conditions.

1. Introduction

Sweet cherry (Prunus avium L.) is a member of the Rosaceae family and is among the most important temperate fruit species, cultivated for its distinctive taste, nutritional value, and numerous health benefits [1]. According to FAOSTAT [2], global sweet cherry production has increased in recent years and, in 2023, amounted to over 2.9 million tonnes. Asia is the largest producing region, accounting for 44.3% of world production, while the leading producing countries are Turkey, Chile, and the United States. Sweet cherries are seasonal, with a short harvest period, appearing on the market in late spring and early summer, and are mainly consumed fresh [3]. Commercial production of sweet cherries is possible up to about 60° N latitude in Norway. The sweet cherry harvest season in Norway is later than in other European countries and is aimed solely at the fresh market. The season runs from the end of July through August. There is strong demand for all Norwegian cherries, and retail prices are high for premium, large fruits (10–15 Euro/kg). The fruits have a good balance of sugar and acid and a very fresh taste. Norwegian production is small; in 2023, it was 553 tonnes (31% of all sweet cherries consumed), and the following year, 847 tonnes (41%) [4]. However, the weather often limits the production of large crops of high-quality cherries. Fruit set is sometimes problematic due to poor weather conditions during bloom, and rain, shortly before or during harvest, may cause significant losses of harvestable cherries due to fruit cracking and fungal diseases.
To optimise growing conditions and prevent rain-induced cracking, most growers now use plastic rain covers. Rain-induced fruit cracking in cherries remains a problem internationally. The most common production ways in Norway are the use of multibay high tunnel systems and retractable rain covers. Covered orchard tunnel systems not only exclude rain but also allow additional agronomic and environmental manipulation including tree growth, vigor and fruiting [5].
Protected cultivation of sweet cherries in high tunnels advances harvest, resulting in higher yields of larger fruits with less fruit cracking compared to trees grown in open fields [6]. In Norway, multi-bay high tunnels accessible to tractors are currently the most important production technology for sweet cherries. They are constructed from steel bows attached to metal posts and are covered with greenhouse-grade polyethylene. The tunnels are covered before bloom, and the covers are removed when harvest is completed (beginning of September). Beehives are installed outside the tunnels. The trees are irrigated by an external drip irrigation system designed to provide nutrients through fertigation [7]. Yields are higher compared to open land. In a high tunnel study, the cultivar Sweetheart/Colt produced 23.5 tonnes per hectare in the fifth leaf [6]. In general, sweet cherry high-tunnel production yields larger fruits and higher cropping than open-field production.
The introduction of dwarfing rootstocks Gisela 3 and Gisela 5 has enabled growers to cultivate cherry trees in containers in greenhouses, giving them better control over the temperature regime and fruit maturity. However, this type of cherry cultivation requires significant investments in construction and equipment for the regulation of irrigation and fertigation [8]. Economic calculations for sweet cherry production were conducted for various training systems and cultivars grown in high tunnels and greenhouses, with trees planted both in soil and in pots. Sweet cherry production is labour-intensive, primarily due to training and pruning, plastic covering of the high tunnels, and especially hand harvesting. Spindle trees produced the highest yields, and the cultivar ‘Lapins’ was among the most productive. Calculations showed that growing cherry trees in pots resulted in higher yields per area than growing them in soil. Economic returns were greater when all expenses, such as management and labour costs, were deducted. This is mainly due to higher planting densities per area when growing sweet cherry trees in pots. However, management skills are more demanding, as it is necessary to supply the trees with water and minerals using a computer-based fertigation mixer [9]. Sweet cherry is a non-climacteric fruit that produces very little ethylene during ripening [10]. Most fruits are consumed fresh, while some are processed into concentrated juices, jams, brines, jellies, dried, frozen, or canned products, and alcoholic beverages, marketed throughout the year or used as a source of natural pigments [11,12]. They are rich in various phytonutrients and bioactive compounds that contribute to health benefits [13]. Carbohydrates are the main chemical compounds in cherries, consisting of dietary fiber and sugars. Total sugars range from 11–15% [14], with glucose present in the largest amounts, followed by fructose [15,16]. The predominant organic acid is malic acid [17], followed by citric acid, while shikimic and fumaric acids are present in much smaller amounts [1]. Sugars and organic acids are the main contributors to soluble solid content, with their ratio playing a key role in flavor and taste [18]. Environmental factors, genetic differences, and maturity stage significantly influence attributes such as the fruit sweetness/sourness ratio and firmness, making some cultivars ideal for fresh consumption, while others are better suited for processing into dried, pickled, jam, marmalade, fruit juice, or canned products [19].
Since phenolic compounds occur in all fruits as a diverse group of secondary metabolites [20], they receive special attention due to their antioxidant properties and notable anti-inflammatory effects, as well as their roles in cardiovascular health, cancer prevention, and anti-obesity and anti-diabetes activities [3,21,22,23]. Kelebek and Selli [15] identified a total of eleven phenolic compounds in sweet cherry cultivars, including hydroxycinnamic acids, anthocyanins, flavan-3-ols, and flavonol compounds. Anthocyanins are concentrated in the fruit skin (exocarp); their content increases during ripening and, together with other polyphenolics, color the cherry skin from green to red [18,23,24]. As with sugars and organic acids, climatic conditions can also influence the phenolic compound content in sweet cherry fruits [1,21,25]. Furthermore, the results obtained by Kazazic et al. [26] indicate that the content of bioactive compounds in the fruits of the investigated cultivars is significantly influenced by the rootstocks studied, as well as by the cultivar–rootstock interaction. Cherries also contain significant amounts of potassium [14] and ascorbic acid (vitamin C), while other minerals (phosphorus, calcium, magnesium, and sodium) and vitamins (vitamin B complex, vitamin A, and vitamin E) are present in very small quantities [27].
Our idea began ten years ago with former tomato growers in Norway who abandoned their primary production and began testing the cultivation of sweet cherry trees in pot substrates within greenhouses. This enabled control of the temperature regime and allowed prediction of fruit maturity. The growing concept was based on the traditional technique used in open fields, with the same cultivars grafted onto dwarfing rootstocks. As the soil volume was limited, the supply of water and minerals had to be much more precise. However, constructing greenhouses was expensive. A more affordable alternative was to grow cherry trees in pots in high tunnels, while still applying greenhouse growing technology. To our knowledge, this is the first comprehensive study of the chemical profile of sweet cherries grown in pots under high tunnels in a fully controlled environment. The aim of this study was to explore the sugar, acid, polyphenol, and mineral profiles of three sweet cherry cultivars produced in containers under plastic cover in a high-tunnel system with different levels of fertigation and fertilisation.

2. Materials and Methods

2.1. Plant Material and Experimental Design

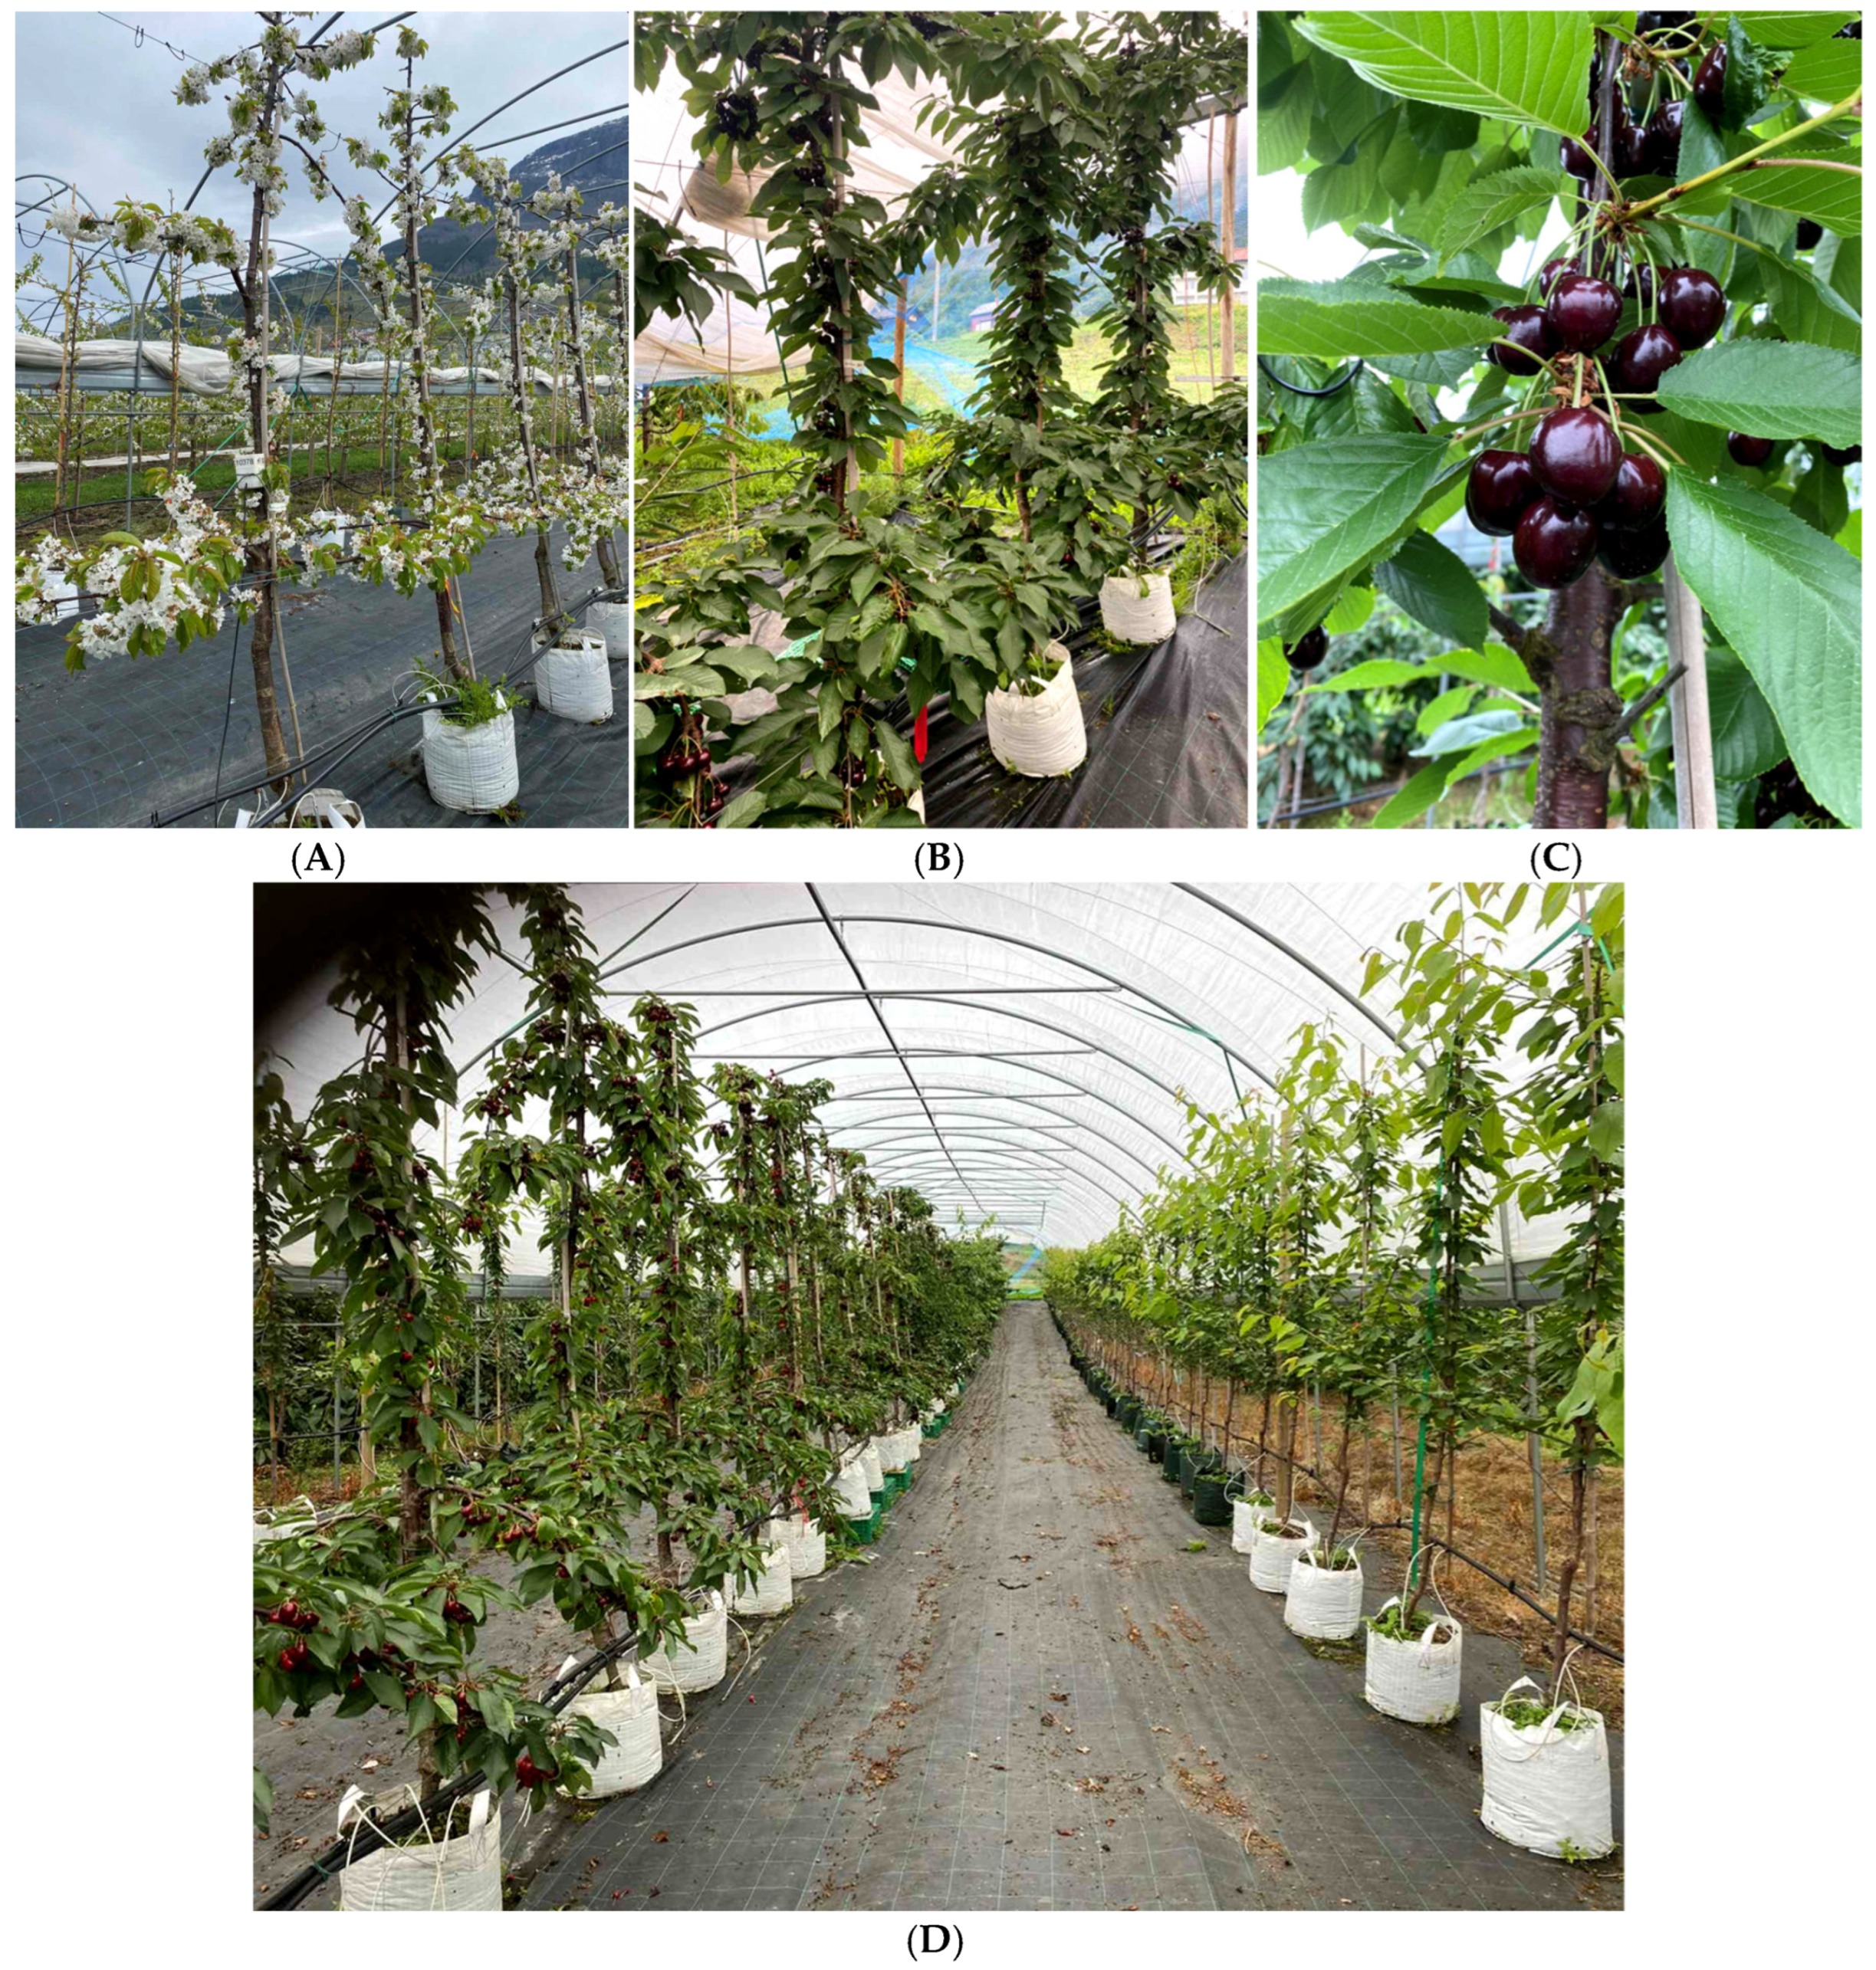
The field trials were conducted at the experimental farm of NIBIO Ullensvang, Western Norway (60°19′31.4″ N, 6°39′30.9″ E) during 2022–2023. The area experiences long days, with day length during midsummer reaching almost 19 h. Sunrise is around 04:00, and sunset is at 23:00. On 1 May, the day length is nearly 16 h, increasing to almost 17 h on 1 August. However, actual sunlight hours (direct sun) are shorter than total daylight hours due to cloud cover and the surrounding mountains in the Hardangerfjord region, which rise up to 1500 m above sea level on both sides of the fjord. The experiment was organised in a Haygrove multibay tunnel, which was covered with polythene. The light transmission of the cover exceeds 87% when the polythene is new [28]. Three sweet cherry cultivars—‘Lapins’, ‘Regina’, and ‘Van’—were grafted onto Gisela 5 rootstock and planted in 2017 as two-year-old feathered trees in white 35-L bags (Figure 1). The growth medium consisted of equal parts peat, perlite, and coconut fibre, and was well-draining. Tree spacing was 1 × 2.5 m (4000 trees/ha), and the trees were trained as spindle trees connected to wires and poles along the tree rows. The tree rows were oriented east–west on a slope with an inclination of about 10% towards the Hardanger fjord side (west) and the mountain side (east) of the orchard. Trees were notched at swelling buds to promote branching in April 2018 and 2019. Later, branches were tied down, and top shoots pruned to keep the trees within the allotted space. Bee hives installed just outside the tunnel served as pollinating insects. Trees grown in tunnel environments experienced limited problems with various pests, and cherry aphids were controlled with pesticides. The tunnel was covered with polythene after flowering to ensure good pollination. The covering period lasted from the beginning of June until harvest, which was completed around 1 September. The tunnel had 1 m open sections along the sides and was open for ventilation. At the top of each pot, two drippers were installed and connected to a PRIVA computer-based fertigation mixer (https://www.priva.com) (Priva Scandinavia AB, Malmö, Sweden). This fertilisation mixer supplied the pots with water and minerals, and was connected to a weather station outside the tunnel monitoring temperature and radiation. Each pot received between 0.5 L and 3 L of water or fertigation per day, starting from mid-April. The amount supplied increased on warm days to match the trees’ evaporative demand. To ensure sufficient water and mineral supply to the pots at different temperatures, the PRIVA computer- based fertigation device was programmed to provide a 10% overflow of water running out of the pots. The number of watering or fertigation events per day ranged from a minimum of 2 to a maximum of 15 on sunny and warm days. To supply the trees with water and minerals, two different regimes were tested: fertigation and slow-release fertiliser (Table 1). Both regimes were arranged in a randomised complete block design. The slow-release (SR) regime included four treatments, while the ferigation (F) regime had three. Each treatment was represented by five trees, but we used only three. The cultivars ‘Lapins’, ‘Regina’, and ‘Van’ were included in both regimes. The schematic of the experimental layout for cultivar ‘Van’ is added in Figure S1. The experimental design for the other two cultivars is the same.
The amounts of fertilisers (stock solutions) mixed in the two 1000 L tanks for the fertilisation study were as follows: Tank A contained Kristalon Brown (3% N, 4.8% P, 31% K, 2.4% Mg, 11% S and microelements)—30 kg, and magnesium sulphate (10% Mg, 13% S)—50 kg; Tank B contained Calsinit (15.5% N, 19% Ca)—50 kg. The slow-release fertiliser MulticoteTM 4 (Haifa, Mechelen, Belgium) (4 months longevity) had the following composition: 14% N, 14% P, 18% K, plus micronutrients. Chalk lime contained 95% to 99% calcium carbonate (CaCO3).
Flowering in spring 2022 was early for Norwegian conditions. Full bloom, defined as at least 50% of flowers open, occurred on 1 May for the cultivars ‘Lapins’ and ‘Van’, and on 7 May for ‘Regina’. The following year, flowering was delayed, with full bloom on 12 May for ‘Lapins’, 14 May for ‘Van’, and 16 May for ‘Regina’. In 2022, harvest dates for these three cultivars were 26 July for ‘Van’, 1 August for ‘Regina’, and 9 August for ‘Lapins’. The following year, harvest occurred on 24 July for ‘Van’, 31 July for ‘Regina’, and 3 August for ‘Lapins’. After harvesting, 15 fruits per tree were picked (3 trees per treatment × 15 fruits), totaling 45 fruits per treatment. The fruits were dried in an oven at 40 °C for about 10 days. After drying, the fruits were kept in the dark in paper bags. Before analysis, the samples were ground into powder using an analytical mill (A 10 basic Analytical mill, IKA-Werke GmbH & Co. (Staufen im Breisgau, Germany). The samples were measured in duplicate and used for further analysis. All results are expressed on the dry weight (DW) of the sample.

2.2. Reagents and Standards

All standards for sugar, sugar alcohols, organic acids, and polyphenols were purchased from Sigma-Aldrich (St. Louis, MO, USA). Trolox (6-hydroxy-2,5,7,8-tetramethylchroman-2-carboxylic acid), 50% sodium hydroxide, sodium acetate trihydrate, methanol, acetonitrile (HPLC grade), and formic acid (MS grade) were also obtained from Sigma-Aldrich (St. Louis, MO, USA). Folin–Ciocalteu reagent and sodium carbonate were purchased from Carlo Erba (Val de Reuil, France). 2,2-Diphenyl-1-picrylhydrazyl·(DPPH) was purchased from Fluka AG (Buch, Switzerland). A Thermo Fisher TKA (Bremen, Germany) MicroPure water purification system was used to obtain ultrapure water (0.055 µS/cm) for preparing aqueous solutions of blanks and standards. Syringe filters (13 mm, PTFE membrane, 0.22 μm and 0.45 μm) were purchased from Supelco (Bellefonte, PA, USA).

2.3. Preparation of Sample Extracts

To obtain the extracts used for the determination of TPC, RSA (Radical-Scavenging Activity), and the content of individual polyphenols, 0.5 g of each ground dry sweet cherry sample was mixed with 25 mL of a methanol/water solution (70/30, v/v) containing 0.1% HCl. Extraction was performed according to the procedure described in the literature [28]. All extractions were carried out in triplicate, and the extracts were filtered through 0.45 μm membrane filters (Syringe Filter, PTFE, Supelco) before analysis.
For the analysis of sugars, sugar alcohols, and organic acids, 0.5 g of each sample was mixed with 50 mL of ultrapure water (0.055 µS/cm). Extraction was performed using an ultrasonic bath, and the preparation procedure was described in detail in our previous study [29]. The extracts prepared in this way were used for the analysis of sugar alcohols, minor sugars, and organic acids. All extractions were carried out in triplicate, and the extracts were filtered through 0.22 μm membrane filters (Syringe Filter, PTFE, Supelco) before analysis. For the analysis of major sugars (glucose, fructose, and sucrose), the prepared extracts were diluted 100-fold.
For elemental analysis, samples were prepared using microwave digestion. The procedure for preparing samples for elemental analysis was explained in detail in our previous paper [30].

2.4. Determination of Total Phenolic Content (TPC) and Radical-Scavenging Activity (RSA)

TPC and RSA were determined using spectrophotometric methods: the Folin–Ciocalteu method and the DPPH assay, respectively. The procedures for TPC and RSA analyses are described in detail in our previous paper [31]. TPC values were expressed as grams of gallic acid equivalent (GAE) per kilogram of dry weight (DW), while the RSA results were expressed as mmol Trolox equivalent (TE) per kilogram of DW.

2.5. Determination of Polyphenol Profile

Quantification of individual polyphenols in the sweet cherry extracts was performed using a Vanquish UHPLC system equipped with a diode array detector (DAD) coupled to a TSQ Fortis triple-quadrupole mass spectrometer (Thermo Fisher Scientific, Bremen, Germany), operated with a heated electrospray ionisation (HESI) source in negative ionisation mode. Elution was carried out on an Accucore aQ C18 column (Thermo Fisher Scientific, Bremen, Germany). A detailed description of the mobile phase, stationary phase, and elution conditions is provided in our previous work [32].

2.6. Analysis of Sugar, Sugar Alcohol, and Organic Acid Contents

Sugar, sugar alcohol, and organic acid analyses were performed using a Dionex ICS 3000 (Dionex, Sunnyvale, CA, USA). The Dionex ICS 3000 system, coupled with a pulsed amperometric detector, was used to determine the sugar and sugar alcohol contents. For organic acid analysis, the Dionex ICS 3000 DP LC was coupled with a conductivity detector. The performance of the ion chromatography device, the characteristics of the analytical columns, the composition of the mobile phases, and the elution conditions were described in our previous study [30]. The total sweetness index (TSI) was calculated to determine the sweetness perception of fruits. The TSI was expressed so that each sugar is estimated relative to sucrose, resulting in the following equation:
TSI = (1.00 × [sucrose]) + (0.76 × [glucose]) + (1.50 × [fructose]).

2.7. Elemental Analysis

Element concentrations were determined by ICP-MS (Thermo Fisher Scientific, Cambridge, UK) analysis in sweet cherry fruit samples. For calibration curve construction, a series of calibration standards was prepared using single-component ICP-MS standards. Each curve consisted of seven levels, including zero, for which a solution of nitric acid and hydrogen peroxide in water was used. During sample analysis, the purity of the digestion cuvettes was tested by adding the same amount of acid and peroxide as for the samples into an empty cuvette. This testing was repeated for each digestion series. Additionally, curves were checked with a multi-component Quality Check (QC) solution. It should be noted that, for potassium determination, the sample solutions needed to be diluted tenfold.

2.8. Statistical Analysis

Data were analysed by general analysis of variance (ANOVA) using Minitab 16 statistical software (Minitab Ltd., Coventry, UK). All results are presented as the arithmetic mean of two years (three replicates per year) ± standard deviation. Tukey’s test was used to detect significant differences (p ≤ 0.05) among the mean values. This test was performed using MS Excel (Microsoft Office 2016 Professional).
Principal component analysis (PCA) was carried out using the PLS Toolbox software, Version 7.12.0, package for MATLAB (Budapest, Hungary), as described in our previous paper [32]. All data were group-scaled prior to PCA.

3. Results and Discussion

The interaction of genetics with agricultural practices, rootstocks, geographic locations, environmental factors (in winter, early spring, and during fruit growth), growth regulators, yields, and storage techniques significantly affects the final fruit quality [33,34]. Cultivars or genotypes with the lowest yields produce fruits of the highest quality [35]. Average yields of sweet cherries grown with slow-release (SR) fertilisers were approximately 8 t/ha, while those with fertigation (F) treatments were about 25.5 t/ha. For the interaction between cultivars and treatments, the lowest overall yields were observed in SR for the ‘Regina’ cultivar (approximately 1.5 t/ha), while the highest were in F for ‘Regina’ (approximately 31.7 t/ha).

3.1. Sugar Composition

It is well known that sugars are the main chemical compounds responsible for sweetness and, as such, represent one of the most important parameters contributing to fruit taste and consumer acceptability [36]. In total, 12 sugars were detected: three monosaccharides (glucose, fructose, and arabinose), five disaccharides (sucrose, maltose, isomaltose, melibiose, and turanose), one oligosaccharide (raffinose), and three sugar alcohols (erythritol, sorbitol, and mannitol) (Table 2). The total sugar content ranged from 12.7 g/100 g dry weight (DW) in LSR3 to 18.96 g/100 g DW in VSR2. When comparing slow-release (SR) and fertigation (F) treatments, the total sugar content was almost the same (Table 2). Regarding cultivars, excluding treatments, ‘Van’ had the highest total sugar content, while ‘Lapins’ had the lowest. To our knowledge, no one has previously grown sweet cherries in pots under plastic tunnels, so there are no real data for comparison. Our results are higher than those obtained by El Kettabi et al. [37], who grew 19 cherry accessions under Moroccan conditions in a conventional production system (in soil, in open field), where total sugars varied from 2.24 mg/100 g DW (‘Napoleon’) to 44.45 mg/100 g DW (‘Marmotte’). Zhou et al. [38], however, quantified the total soluble sugar content on a dry weight basis in fruits of numerous accessions of Chinese cherry (P. pseudocerasus), which ranged from 381.33 to 698.62 g·kg−1 DW with an average value of 563.52 g/kg DW.
A cherry cultivar trial was performed at the experimental farm at NIBIO Ullensvang during 2010–2016. In total, 14 cherry cultivars and advanced selections released by the Pacific Agri-Food Research Centre (PARC-Summerland), Canada, were tested, and the main cultivar in Norway, ‘Lapins’, served as the control [7]. The main fruit quality characteristics, like fruit weight, firmness, soluble solids, and tasting scores, were recorded. On average, for three years (2014–2016) for Lapins, the soluble solids content was 16.2%, and the tasting scores were 5.8. Fruit taste was evaluated by trained panelists and assessed using a 9-point scale, where 1 = uneatable and 9 = excellent taste.
Our results numerically overlap with the values determined by Usenik et al. [1], who reported total sugars of sweet cherries ‘Hedelfinger’, ‘Kordia’ and ‘Regina’ grown with or without rain cover in Slovenia ranging from 184 to 268 g/kg FW; by Kelebek and Selli [15] who studied ‘Van’, ‘Noir de Guben’, ‘Larian’, and ‘0–900 Ziraa’ in Turkey, and found total sugars varying from 108 to 113 g/kg FW; and by Skrzyński et al. [39], who investigated 14 different sweet cherry cultivars grown in Poland (143–208 g/kg FW). However, a major difference is that all these authors analysed fresh fruit, whereas we analysed dried fruit. These discrepancies may be due to the limitations of this cherry growing system, whose primary objective was to prevent rain-induced fruit cracking caused by frequent rainfall during the ripening period [40]. In addition, reduced light availability (shading), impaired tree development, poorer fruit color, and reduced photosynthetic activity—which in turn results in lower accumulation of sugars and bioactive compounds in the fruit [41]—are major disadvantages that lead to other negative effects in covered sweet cherry production. Several studies support this conclusion, not only regarding sugars but also other chemical compounds. Most experiments reported reduced sugar content in fruit when trees are grown under tunnels compared with open-field production systems [42,43,44,45,46], although some studies reported the opposite, i.e., higher [47,48,49], or similar contents of these compounds compared to fruit from trees grown under open-field conditions [50]. To better understand this, it should be emphasised that although this system offers numerous advantages beyond rain exclusion—such as reduced wind, increased temperature, earlier ripening, and reduced incidence of diseases and pests [40,41,43,51]—it also has certain drawbacks.
Glucose and fructose were by far the most abundant sugars in all analysed samples, with very similar contents ranging from 3.9 (VSR3) to 6.0 (VSR2) g/100 g DW for glucose and from 3.4 (LSR1) to 6.3 (VF2) g/100 g DW for fructose (Table 2). Our results are much lower than those reported by Kiprovski et al. [52], who found that sweet cherry fruits contained up to 443 g·kg−1 DW glucose, up to 398.9 g·kg−1 DW fructose, and up to 47.6 g·kg−1 DW sucrose in healthy and Monilinia laxa-infected fruits. Even higher values were reported by Zhou et al. [38], who determined several times higher concentrations: 15.5 to 46.4 g/100 g DW for glucose, and 14.3 to 33.8 g/100 g DW for fructose in P. pseudocerasus. These discrepancies are probably due to differences in cultivars, climatic conditions, and production systems. In addition to the relatively uniform range in which these two sugars varied, no clear predominance of one over the other was observed. With respect to fertigation (F), the cultivar ‘Regina’ showed higher glucose than fructose in all three treatments, whereas in the cultivar ‘Van’, the opposite trend was observed. When comparing SR and F treatments, more pronounced differences were observed in fructose content, with higher values recorded in the F treatment, where the fructose content did not fall below 5 g/100 g DW. These two sugars are typically dominant in cherry fruits, as reported in previous studies [1,2,3,16,53,54,55]. These authors reported clearly higher glucose content compared to fructose, in contrast to our results, where more than a third of all samples had higher fructose than glucose. However, it is not uncommon for fructose to be present in dominant concentrations in cherry fruits. Dolenc and Štampar [56] reported higher fructose content based on the glucose to fructose ratio, which was 0.9. Serrano et al. [17] showed a linear accumulation throughout the developmental stages in sweet cherry fruits, with fructose having a higher content (8.43%) than glucose (6.57%). Acero et al. [11], in a more recent study, also reported higher concentrations of fructose.
In addition to these two major sugars, which are typically present in dominant amounts in Prunus fruits, two disaccharides also stood out, with contents in certain samples exceeding 1 g/100 g: maltose, which ranked third in abundance (0.93–3.33 g/100 g), and melibiose (0.025–1.49 g/100 g). SR and F treatments differed significantly in maltose content, with higher levels observed in the SR treatments in the cultivar ‘Van’. In our samples, sucrose was present only in trace amounts (<1 g/100 g), ranging from 0.007 g/100 g DW (RF1) to 0.56 g/100 g DW (VSR4), with the former treatment showing a higher sucrose content than the latter (Table 2). Our results are much lower than those obtained by Kiprovski et al. [52], where sweet cherry fruits contained 20–47.6 g·kg−1 DW and 19.2–38.6 g·kg−1 DW sucrose in healthy and Monilinia laxa-infected fruits, respectively. This is consistent with most reports on sucrose composition in sweet cherry, where, in some cases, it was not detected at all [53,54,55,56,57].
In addition, the ratio of different sugars affects fruit flavor, with fructose being the sweetest sugar [58]. Based on the glucose, fructose, and sucrose contents, the sweetness index was calculated, ranging from 8.52 (LSR1) to 13.08 (RSR4). Among cultivars, excluding treatments, ‘Van’ had the highest sweetness index (12.27), while ‘Lapins’ had the lowest (10.94). Among treatments, excluding cultivars studied, F showed a higher sweetness index.
In species of the Rosaceae family, including sweet cherry, sorbitol is the dominant transport carbohydrate in the phloem (up to 80%) rather than sucrose [59,60,61]. Sucrose is enzymatically cleaved into glucose and fructose, either after direct transport to the fruit or prior to transport [61,62]. Consequently, ripe fruits predominantly accumulate hexoses (glucose and fructose), while sucrose remains at low or undetectable levels. The other detected sugars were also present in much lower amounts, with values below 1 g/100 g.
Additionally, sugar alcohols (polyols) are present in the fruits, with sorbitol being the most abundant (0.61–0.94 g/100 g), followed by slightly lower levels of mannitol (0.51–0.64 g/100 g), and considerably lower amounts of erythritol (0.003–0.401 g/100 g) (Table 2). The cultivar ‘Van’ had the highest sorbitol and mannitol contents under the SR treatment, while ‘Regina’ showed the highest contents of these sugars under the F treatment. Sorbitol and mannitol are the two most widespread polyols in plants [63]. Sugar alcohols—primarily sorbitol—play a very important role in carbohydrate metabolism [57], particularly in the transport of sugars from leaves (source tissues) to fruits (sink tissues) [63]. In addition, sorbitol has been reported to accumulate in plant tissues at higher levels under abiotic stress conditions, such as drought, cold, and micronutrient deficiency [64].
Mannitol may contribute to the osmotic tolerance of fruit cells by helping to maintain turgor and water balance [65], while its ability to scavenge reactive oxygen species further protects cellular membranes and increases resistance to abiotic stress [66,67].

3.2. Organic Acids Composition

Organic acids, together with sugars, contribute most to the final fruit flavor, as the ratio between these two groups of compounds determines fruit sweetness and acidity [68]. Nine acids were detected in the analysed samples, with the total acid content showing significant variation and exhibiting both the lowest and highest values in the cultivar ‘Regina’, but under different treatments: 48.74 mg/kg DW under the fertigation treatment (RF1) and 221.14 mg/kg DW under the slow-release treatment (RSR1) (Table 3). Regarding treatments, slow-release fertilisation produced fruits with a higher level of total acids, while among cultivars, ‘Van’ had the most acidic fruit. The lowest average content (57.35 mg/kg DW) was observed in the cultivar ‘Regina’ under the fertigation treatment, while the highest content was recorded in ‘Van’ (139.25 mg/kg DW) under the slow-release treatment.
Compared to the literature, our values are considerably lower, even when our dry-weight-based (DW) results are compared with fresh-weight-based data (FW). The total organic acid content reported by Usenik et al. [1] ranged between 3670 and 8660 mg/kg FW. In the study by Kelebek and Selli [15], this content ranged from 12,010 to 14,170 mg/kg FW. An even higher content was reported by Hayaloglu and Demir [16], where the cultivar Bing reached as much as 54,110 mg/kg FW. The main difference between our results and those of the other mentioned studies is that our trees were grown in pots in tunnels, whereas in other studies, trees were grown in open-field conditions and in soil, using standard irrigation and fertilisation practices.
There are also studies that have evaluated fruit quality in cherries grown under protected systems similar to ours, where acid levels were significantly lower than the previously mentioned results, further confirming the reduced accumulation of primary metabolites under such growing conditions. For example, Palacios-Peralta et al. [45] reported total acid contents ranging from 1190 to 1510 mg/kg FW. Other authors have also reported lower organic acid contents of sweet cherries grown under plastic compared to fruits grown in open-field conditions [41,43,69,70]. Nevertheless, even these values remained substantially higher than those obtained in our study. The closest organic acid content to the present study is reported by Mahmood et al. [71] with 380 mg/100 g FW in fully ripened fruits. However, no study has used pots for sweet cherry cultivation, which may be one of the reasons for such low results.
When examining the organic acid profile, several notable differences are evident. The literature identifies malic acid as the dominant organic acid in the fruits of this species [1,10,15,16,72], with its proportion of total organic acid content ranging from 65% [16] to as much as 98% [73]. In our samples, acid contents varied significantly, and three acids—quinic, malic, and shikimic—accounted for the largest proportion; however, malic acid was not dominant in all samples (Table 3). Mahmood et al. [71] reported ascorbic acid as the dominant organic acid in sweet cherry fruits, with malic acid being the fourth most abundant. As with total acid content, a parallel can also be drawn between slow-release and fertigation treatments; under slow-release treatments, all three cultivars were characterised by a dominant quinic acid content, while malic acid alternated with shikimic acid as the second most abundant acid. Only in two samples (VSR4 and RSR1) were quinic and malic acid contents equal, amounting to 32.0 mg/kg DW and 86.0 mg/kg DW, respectively (Table 3). Under fertigation treatments, however, the situation was different, as malic acid was the most abundant acid in four out of nine samples. F1 treatments, regardless of cultivar, resulted in a higher quinic acid content compared to malic acid, whereas F2 and F3 treatments in the cultivar ‘Van’, the F3 treatment in ‘Lapins’, and the F2 treatment in ‘Regina’ exhibited higher malic acid contents. Analogous to total acids, the cultivar ‘Regina’ exhibited both the lowest (F treatment) and highest (SR treatment) average contents of quinic and malic acids. ‘Regina’ also showed the greatest variation in malic acid content across both treatments, ranging from 10 mg/kg (RSR3) to 86 mg/kg (RSR1) under the SR treatment, and from 12 to 28 mg/kg under the F treatment (RF3 and RF2, respectively). Differences related to treatments were most clearly observed for shikimic acid. Fruits from fertigation treatments contained significantly lower amounts of this acid, with the exception of ‘Lapins’, specifically LF2, which contained 13.4 mg/kg (Table 3). In contrast, slow-release treatments resulted in substantially higher shikimic acid contents, with ‘Van’ exhibiting the highest values; notably, VSR1 and VSR2 even had higher shikimic acid contents (54.0 mg/kg and 53.0 mg/kg, respectively) than malic acid (49.0 mg/kg and 44.0 mg/kg, respectively) (Table 3). Among the remaining organic acids—namely D-galacturonic, glucuronic, succinic, maleic, citric, and isocitric acids—succinic acid showed somewhat higher contents, reaching up to 5.3 mg/kg DW (LSR1), whereas the others were present only in trace amounts. Regarding citric acid, the cultivar ‘Lapins’ stood out, as it exhibited the highest contents across all three fertigation treatments (average 2.08 mg/kg).
The effects of mineral nutrition on the accumulation of acids (and sugars) in stone fruits are largely indirect, mediated through changes in canopy development and source–sink relationships [74]. It should also be noted that the ripening stage and environmental factors, such as light availability, temperature, water supply, and rhizosphere conditions, strongly influence fruit quality [74]. The literature reports positive effects of slow-release fertilisers, particularly on yield and fruit quality, due to the controlled and slower release of nutrients [75,76].
Slow-release fertilisation resulted in higher total organic acid contents and a dominance of quinic acid. In contrast, fertigation, which constantly delivered water-soluble nutrients through irrigation with controlled electrical conductivity (EC), led to greater variability in organic acid composition and a partial shift towards malic acid dominance, accompanied by lower total acid contents. Neilsen et al. [77] stated that high nitrogen (N) applications, as provided by the fertigation system, decreased fruit titratable acidity (TA) in sweet cherries.
Zhang et al. [70] compared open-field and greenhouse cultivation and found that environmental factors and external space can alter most compounds in cherries. Cherries grown in open-field conditions were more favourable for the accumulation of phenolic acids, flavonoids, alkaloids, terpenoids, lipids, lignans, coumarins, and non-volatile flavor compounds, and exhibited higher acidity. Due to the highly unique maritime climate of western Norway, characterised by high precipitation and a shortened growing season [78], cherry cultivation is limited to protected and controlled growing systems. These systems overcome obstacles that would otherwise prevent profitable and successful cherry production in these regions [40,41,51]; however, they may result in lower accumulation and greater variability of primary metabolites in fruits, particularly acids, which are known to have low heritability and are strongly influenced by environmental conditions [55,79]. As mentioned earlier, in this study, cherry trees were grown under high-tunnel conditions and planted in pots. This system is highly advanced and allows for a high degree of control over external conditions. Under these conditions, root volume is limited, so water and nutrient supply must be extremely precise to enable successful production [51]. Additionally, slightly dry conditions are known to promote the development of higher-quality fruits due to increases in organic acids, sugars, and soluble solids [80]. Under conditions of extremely high humidity caused by irrigation or fertigation, combined with lower evaporation in high tunnels compared to open fields, the contents of these compounds are reduced, which explains why fruits grown in open-field conditions exhibited higher sugar and organic acid contents [70].

3.3. Phenolic Composition

Sweet cherries are known to contain significant amounts of polyphenols, including phenolic acids and flavonoids, such as quercetin, its derivatives, and anthocyanins [1,21,81]. Gonçalves et al. [12] identified 46 phenolic compounds in various sweet cherry cultivars.
In this study, varying levels of phenolic acids and flavonoids were observed across different cultivars and treatments. The dataset showed clear differences between slow release (SR) and fertigation (F) treatments in the accumulation of phenolic acids and flavonoids in the cultivars ‘Van’, ‘Regina’, and ‘Lapins’ (Table 4).
Among the phenolics, chlorogenic acid was the most abundant, ranging from 42 mg/kg DW (RSR1) to 430 mg/kg DW (VF3) (Table 4). This contrasts with Jakobek et al. [82], who reported neochlorogenic acid as the most abundant, and Milinović et al. [83], who found p–coumaroylquinic acid to be highest. According to Canan et al. [84], eight sweet cherry cultivars and one genotype contained high levels of gallic, vanillic, and ellagic acids, while chlorogenic and protocatechuic acids were found at lower levels. These discrepancies could be due to differences in climate, production system, and cultivar studied. Regarding phenolic acid content (Table 4), the effect of slow release compared to fertigation was evident in the levels of chlorogenic acid (1.55-fold), ferulic acid (1.4-fold), and caffeic acid (8.7-fold), all of which were higher in F treatments.
Regarding phenolic acid content (Table 4), the effect of slow release compared to fertigation was evident in the levels of chlorogenic acid (1.55-fold), ferulic (1.4-fold), and caffeic acid (8.7-fold), all of which were higher in F treatments.
Additionally, SR-treated samples tended to have higher vanillic acid content compared to the fertigation treatment. In the slow-release treatment (SR), caffeic acid was absent in ‘Van’ and most ‘Lapins’ samples (except in LSR2). Ferulic acid was highest in RSR1 (6.6 mg/kg DW) and lowest in RSR4 (2.6 mg/kg DW). Similarly, the amount of vanillic acid was highest in RSR1 (9.2 mg/kg DW), while the lowest content was found in RSR3 (4.1 mg/kg DW), which is higher than in sweet cherry cultivars analysed by Canan et al. [84].
For the SR treatments, chlorogenic acid ranged from 42 mg/kg DW (RSR1) to 237 mg/kg DW (LSR2), while fertigation treatments also significantly affected chlorogenic acid levels in ‘Van’ (VF) and ‘Lapins’ (LF). The ‘Van’ cultivar VF3 exhibited exceptionally high chlorogenic acid levels (430 mg/kg DW). Our results are several times higher than those reported in 24 different sweet cherry cultivars in the study by Ballistreri et al. [57]. Gonçalves et al. [21] reported that chlorogenic acid tends to increase as cherries ripen from early to fully ripe stages, contributing to their antioxidant capacity. According to Rashidinejad et al. [85], by comparing fresh and processed sweet cherry cultivars, chlorogenic acid ranged from 1.86 mg/100 g FW (‘Sweetheart’) to 3.86 mg/100 g FW (processed ‘Kordia’). In the same study, it was shown that processed ‘Kordia’, ‘Lapins’, and ‘Sweetheart’ cultivars had significantly higher chlorogenic acid content than their fresh counterparts (p < 0.05).
In the fertigation treatment, p-coumaric acid ranged from LF3 (0.14 mg/kg DW) to VF2 (1.59 mg/kg DW), which is consistent with Canan et al. [84], where the highest level of this phenolic acid was 5.03 mg/100 g FW in one sweet cherry genotype. Much higher values were reported by Kelebek and Selli [15] for p-coumaric acid in the ‘0900 Ziraat’ cultivar (13.72 mg/100 g FW), and even higher for the ‘Larian’ cultivar (26.6 mg/100 g FW) in Turkey.
Caffeic acid and ferulic acid were generally present in higher amounts in ‘Van’ samples compared to others, with the highest levels in the VF2 sample, at 5.20 mg/kg DW and 6.70 mg/kg DW, respectively. These values are much higher than those reported by Canan et al. [84], where, among several sweet cherry cultivars, the highest amount of caffeic acid was recorded in Bing (13.76 mg/100 g FW). Vanillic acid was found at similar levels across samples, with no major variation, ranging from LF3 (2.4 mg/kg DW) to LF1 (3.6 mg/kg DW).
For flavonoids (Table 5), the general conclusion was that slow-release treatment promoted quercetin derivatives (quercetin, hyperoside, isorhamnetin), with moderate rutin accumulation, but did not effectively enhance flavanols (catechin, epicatechin). RSR4 (113 mg/kg DW) and RSR3 (131 mg/kg DW) showed the highest levels of rutin. Quercetin was high in ‘Regina’ cherries, with the highest amounts in RSR3 (13.4 mg/kg DW) and RSR2 (9.8 mg/kg DW), which were much higher than in sweet cherries analysed by Canan et al. [84], where the highest quercetin value was observed in the ‘Dalbasti’ cultivar (7.93 mg/100 g FW), and by Jakobek et al. [82] where the amount of quercetin varied from 0.42 to 0.87 mg/kg FW, depending on the rootstock used. In our study, quercetin was not detected in ‘Van’ cherries VSR3 and VSR4, nor in one ‘Lapins’ sample (LSR4).
Fertigation treatment significantly increases the rutin content (highest in ‘Van’ and ‘Regina’), with the highest levels in VF3 (161 mg/kg DW) and VF1 (152 mg/kg DW). The amount of flavonols is affected by cultivar, rootstock, year, and cultivar/rootstock interaction [82]. The two samples with the highest hyperoside levels were LSR2 (28.3 mg/kg DW) and RSR3 (35 mg/kg DW). A very high level of hyperoside was previously found in sour cherry leaves, with the highest content (1815.5 µg/g FW) in the cultivar Kelleris [86], while rutin was one of the main components in leaf samples of P. domestica L. [87].
Other flavonols, including quercetin, hyperoside, and isorhamnetin, were not as dominant as in the SR treatment. Among the fertigation samples, quercetin was highest in VF3 (15.2 mg/kg DW) and RF1 (15.3 mg/kg DW). Interesting results were obtained for the two flavanols, catechin and epicatechin. Fertigation strongly affected flavanol accumulation, particularly in ‘Regina’ cherries. The highest catechin levels were found in RF2 (60 mg/kg DW), RF1 (41 mg/kg DW), and RF3 (37 mg/kg DW), while the highest epicatechin levels were in RF2 (39 mg/kg DW) and VF3 (29 mg/kg DW). In the study by Canan et al. [84], the highest catechin value was noted in the ‘1355’ genotype (8.03 mg/100 g FW), while Kelebek and Salli [15] previously reported a catechin value of 2.92 mg/100 g FW in the 0900 Ziraat cultivar. Both values are much lower than those obtained in our study, which is due to our results being on a dry weight basis, while the other two are on a fresh weight basis. In the slow-release treatment, catechin and epicatechin were mostly absent, with low amounts found only in ‘Regina’ samples (RSR2, RSR3, and RSR4). This suggests that slow-release treatment did not significantly enhance flavanol biosynthesis compared to fertigation.
Regarding cultivars, the highest average TPC was found in ‘Van’ (17.73 g/kg DW), followed by ‘Regina’ (15.93 g/kg DW) and ‘Lapins’ (12.84 g/kg DW), with little variation between treatments. In the slow-release (SR) treatment, the total phenolic content was higher in the ‘Van’ (21.78 g/kg DW) and ‘Regina’ (18.78 g/kg DW) samples compared to the ‘Lapins’ samples. Our data do not agree with Jakobek et al. [82], who found that cv. ‘Lapins’ had a higher total phenol content. In this study, the highest TPC value was obtained in sample RSR1 (33.3 g/kg DW), while the lowest was in LSR1 and LSR3 (8.8 g/kg DW, each). According to Kim et al. [81], the total phenolic content of several sweet cherry cultivars ranged from 92.1 to 146.8 mg GAE/100 g FW, which did not align with the findings of this study, probably due to growing conditions. Vangdal and Slimestad [88] reported that sweet cherry cultivars had a TPC ranging from 23 to 168 mg/100 g FW in a study conducted in Norway, which partly overlapped with our results. In the study by Gonçalves et al. [21], the TPC of several sweet cherry cultivars was higher on vigorous rootstocks (MaxMa 14, CAB 11E, Prunus avium) compared to dwarfing and semi-dwarfing rootstocks (Gisela 5, Edabriz).
The RSA values are similar across all samples, both within the same treatment and between treatments, ranging from 115.7 mmol/TE kg DW (LSR3) to 160.3 mmol/TE kg DW (RSR3). Fertigation treatments produced fruits with, on average, higher RSA levels than slow-release treatments. Among cultivars, ‘Regina’ had, on average, the highest RSA level. Our results are higher than those obtained by Milea et al. [89], who found that in dried sweet cherry skin of the Romanian local cultivar ‘Galaţi’, RSA was 0.60 mmol Trolox/g, and much higher than in the study by Antognoni et al. [88], where the RSA level ranged from 4 mmol/TE kg (‘Marysa’) to 10 mmol/TE kg (‘Gabriel’), but in fresh fruits. This discrepancy may be due to the different cultivars studied and the different production systems applied.

3.4. Elemental Composition

The types of minerals (macro, micro, and trace) and their concentrations are directly linked to the growth and development of plants, as well as to the chemical pathways of primary and secondary metabolism. In addition, they also influence the morphology and biochemical characteristics of plants, affecting the yield and quality of fruit [90,91,92]. The levels of all mineral elements, their interactions, and their active participation in biochemical processes within the plant influence the levels of soluble solids, vitamins, volatiles, and organic acids, which, in turn, determine fruit flesh hardness, color intensity, aroma, transportability, storage tolerance, and many other fruit traits [93,94].
In this study, the elemental composition of sweet cherry fruit samples was investigated to determine the influence of fertilisation and fertigation methods on the content and presence of certain macro and micro elements. A total of 31 elements were quantified. Among all quantified elements, the contents of nine were below the limit of quantification (LOQ). The contents of Li, Be, V, As, Se, Ag, Sn, Te, and Tl were below 0.05 mg/kg. The most abundant element in all examined samples was K (Table 6). This finding is consistent with the literature data [88,89,91]. In general, when comparing individual cultivars under two different fertilisation and fertigation treatments (slow release and fertigation), it was observed that the potassium content was higher in those samples subjected to fertigation. The K content was highest in the ‘Lapins’ samples under fertigation, ranging from 11.02 g/kg DW to 12.90 g/kg DW (LF1, LF2, and LF3). In samples of the same cultivar under SR treatment, the K content ranged from 4.65 to 8.28 g/kg.
Ca and Mg were next in abundance in all samples investigated. Similar to K, the Ca content was higher in samples of the same cultivars under fertigation treatment compared to slow-release treatment, except for sample RF2. The calcium content quantified in sample RF2 was lower than in the RSR samples. The highest amount of Ca was found in sample VF1 (979 mg/kg DW), while the lowest was in sample VSR3 (380 mg/kg DW). Mg ranged from 252 mg/kg DW (LSR2) to 617 mg/kg DW (LF1). Gonçalves et al. [95], analysing 23 sweet cherry cultivars from Fundão, Portugal, determined the highest levels of potassium (K), calcium (Ca), and magnesium (Mg) in sweet cherry fruits, with average contents of 15,929 mg/kg DW, 207 mg/kg DW, and 490 mg/kg DW, respectively. Our results are slightly lower for K, similar for Mg, and slightly higher for Ca. These differences may be due to rain-shelter cultivation, which can affect the mineral content of sweet cherry fruits [96].
Calcium (Ca) level in fruit is associated with high-quality sweet cherries, as it is a component of the cell wall and influences membrane permeability [97]. This cation is mobile only in the xylem, while P, K, and Mg are mobile in the phloem [98,99]. Ca concentration and firmness in sweet cherries are positively correlated but negatively related to the Mg:Ca and K:Ca ratios [100,101]. In our study, ‘Lapins’ fruits from F treatments had, on average, the highest level of Ca (811.0 mg/kg DW), and thus potentially the firmest fruits, while the VSR samples had the lowest average Ca level (425.3 mg/kg DW) and the highest average Mg:Ca (0.87) and K:Ca ratios (17.47), and thus, potentially the softest fruits. Such ratios, especially high K:Ca, have already been correlated with low fruit firmness in strawberries (Fragaria × ananassa Duch.), kiwifruit (Actinidia deliciosa), and apples [102,103,104]. Phosphorus (P) is very immobile in soil but highly mobile in plants, and its role is important for root growth, function, and proper energy cycling in the plant. Due to its presence in protein structures and phospholipids in the cell wall, P is associated with fruit firmness [105]. Sulphur (S) is essential for building proteins, forming chlorophyll, synthesising vitamins, creating coenzymes, and plays roles in photosynthesis, respiration, and stress response [106]. In this study, the contents of P and S were relatively uniform among the samples, indicating that the method of fertilisation has no significant influence on the content of these elements in the fruits of the investigated sweet cherry cultivars. In the slow-release treatment, the phosphorus and sulphur contents in the studied sweet cherry samples ranged from 455 to 904 mg/kg and from 192 to 395 mg/kg, respectively. The amounts of P and S quantified in the samples from fertigation treatments ranged from 533 to 1032 mg/kg and 148 to 433 mg/kg, respectively.
In our study, Cu ranged from 0.7 mg/kg DW (VSR2) to 3.44 mg/kg DW (VF3), the Zn level was from 0.96 mg/kg DW (RSR4) to 5.85 mg/kg DW (VF3), Na from 5.75 mg/kg DW (RSR3) to 27.1 mg/kg DW (VF2), and Fe from 3.98 mg/kg DW (LF3) to 11.2 mg/kg DW (RSR1). Our results are much higher than those obtained by Paulo et al. [107] when analysing the ‘Sweetheart’ cherry cultivar, which is probably due to the different production system applied and the different samples (dry fruits versus fresh fruits). For Na, Zn, and Cu, the fertigation treatments gave higher results, while for Fe, Zn, and Cu, ‘Van’ fruits from fertigations had the highest levels.
Cr, Co, Ni, Mo, Cd, Sb, Ba, Hg, and Pb were quantified at low concentrations and were not present in all samples, except for Ba and Mo, which were quantified in all samples (Table S1). The maximum quantified content of Sb, Hg, and Cd in the studied samples was only 0.1 mg/kg. Co was quantified only in slow-release samples, and Cd was detected in one sample (LSR2). The content of all toxic elements was below the maximum permissible values. Sample VF3 differed from the others by having the highest content of Al, Cu, Zn, and Pb.

3.5. Principal Component Analysis

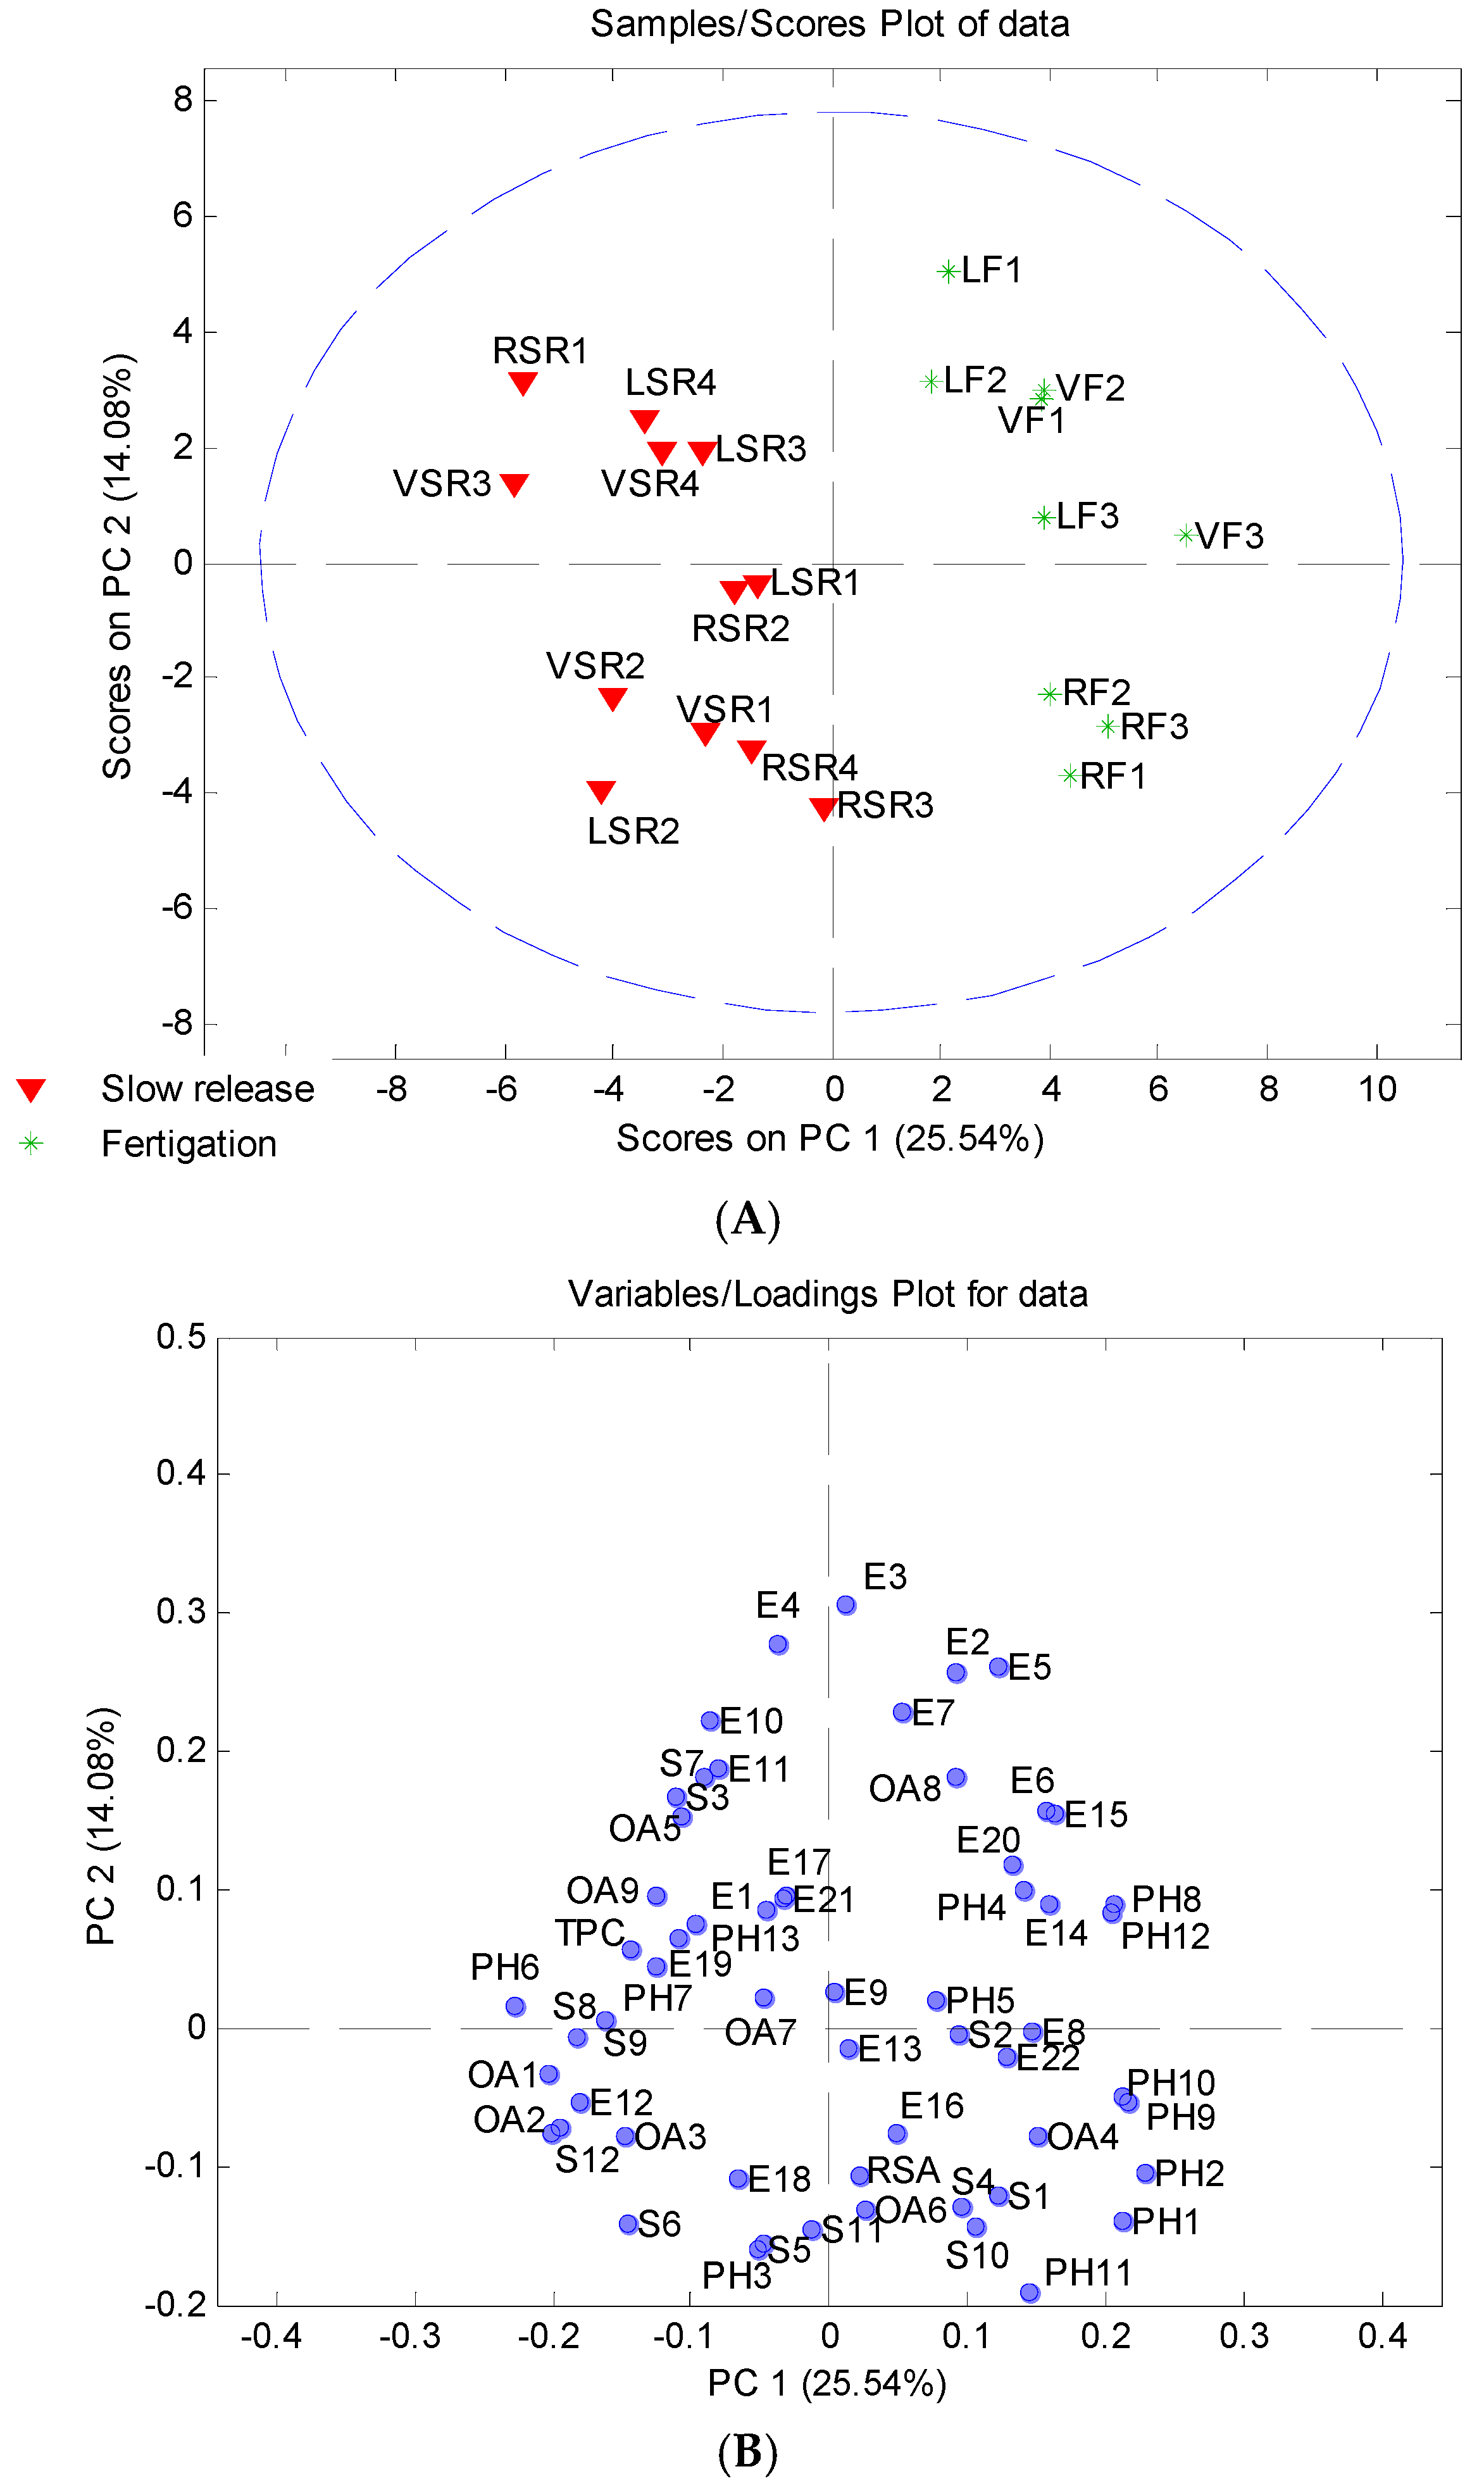
Principal component analysis was performed on elemental content, sugars and sugar alcohols, organic acids and polyphenols (including TPC and RSA) to determine whether the method of fertigation or irrigation influences the chemical composition of the studied cherry samples. The first three components of the resulting PCA model account for 51.2% of the total variability. The first component explains 25.5%, the second 14.1%, and the third 11.6% of the total variability. The score plots shown in Figure 2A display a clear separation of slow release (SR) from fertigation (F) samples along the PC1 axis. Based on the loading plots (Figure 2B), it can be concluded that the separation of samples subjected to F treatment is due to higher contents of rutin (PH2), isorhamnetin-3-O-rutinoside (PH8), catechin (PH9), epicatechin (PH10), and chlorogenic acid (PH12). Grouping of these compounds is expected, as they all strongly correlate with a plant extract’s overall antioxidant capacity, which has previously been demonstrated in apple and jujube [108,109]. Additionally, among the F samples, the ‘Regina’ samples are separated from the ‘Lapins’ and ‘Van’ samples along the PC2 axis. The higher content of catechin (PH9) and epicatechin (PH10) in the ‘Regina’ samples, as well as the higher content of Mg (E2), P (E3), K (E5), Ca (E6), and B (E7) in the ‘Lapins’ and ‘Van’ samples, are responsible for this separation.
The results of the PCA performed separately on four data sets (polyphenols, sugars and sugar alcohols, organic acids, and elements) are presented in Figure S2. According to this figure, the level of polyphenolic components (rutin, catechin, chlorogenic acid, quercetin, epicatechin, and hyperoside) caused the most evident separation between the SR and F samples.
This supports previous reports showing that it is possible to differentiate between sweet cherry genotypes based on their mineral and phenolic constituents [21,110,111]. Zhang et al. [111] also stated that principal component analysis identified Mg, K, and Ca as the key mineral elements in sweet cherry fruits, which are mutually correlated because Mg is a primary component of phytin, pectin, and various enzymes in plants, and plays a role in the transport of K+ and Ca2+.
On the other hand, the separation of the SR samples along the PC1 axis was mainly due to higher levels of quinic acid (OA1), shikimic acid (OA2), vanillic acid (PH6), sucrose (S8), and maltose (S12) in these samples compared to the F samples (Figure 2B). This can be explained by the shikimate pathway, as quinic and shikimic acids are closely related to this pathway, while vanillic acid is a phenolic acid derived from the shikimate pathway via the phenylpropanoid pathway [112]. In addition, Canan et al. [84] established a significant correlation between valilllic acid and sucrose in several sweet cherry cultivars grown in Turkey.

4. Conclusions

This study examined slow-release (SR) and fertigation (F) treatments with different fertiliser concentrations on sweet cherry trees grown in pots under relevant high-tunnel conditions. The sugar and acid profiles observed were much lower than those reported for sweet cherry fruits grown worldwide, whether in open fields or under tunnels with soil, as shown in previous studies. In contrast, levels of phenolic acids and flavonoids were much higher in fruits from these experiments than in the literature. Mineral levels were dependent on both cultivar and treatment. Levels of sugars (glucose and fructose), sweetness index, polyphenols (chlorogenic acid, ferulic acid, quercetin, rutin, catechin, and hyperoside), and macroelements (K, P, Mg, and Ca) were much higher when sweet cherry cultivars were grown under F treatments, while acid components (shikimic, malic, and quinic acid) increased under SR treatments. RSA and total sugars showed no statistically significant differences between the treatments studied. The sugar levels of the fruits were in the same range as those of sweet cherry fruits from trees grown in the ground in high tunnels.
Regardless of treatment, ‘Lapins’ accumulated the highest mineral levels, ‘Van’ the highest total sugars and acid components, while ‘Regina’ had the highest sugar and polyphenolic components. ‘Lapins’ produced fruits with the highest K, Mg, and Ca levels under LF1, while LF2 resulted in the highest P content. The ‘Van’ cultivar from F treatments (VF2 and VF3) had the highest sweetness index, glucose, fructose, chlorogenic acid, ferulic acid, and hyperoside in sweet cherry fruits. Yields in F treatments were very high, with ‘Regina’ producing approximately 31 t/ha, while under RSR1 and RSR2 treatments, this cultivar produced fruits with the highest acid components, RSA, and TPC. Based on all data, PCA analysis confirmed that a distinction between sweet cherry cultivars and treatments could be made.
These findings imply that sweet cherry trees can be grown in pots under high tunnels, which holds significant promise; however, nutrition should be adjusted for each cultivar according to its physiological responses to specific microclimate conditions. This supports future work involving further experiments and diversification of fertilisation and fertigation combinations in the coming years.

Supplementary Materials

The following supporting information can be downloaded at: https://www.mdpi.com/article/10.3390/agronomy16090890/s1. Figure S1. Experimental design of the ‘Van’ cultivar. Figure S2. Principal component analysis performed on polyphenols, TPC, and RSA (A and B), sugars and sugar alcohols (C and D), organic acids (E and F), and elements (G and H). Table S1. The amounts (mg/kg) of minor * elements quantified in dried sweet cherry samples.

Author Contributions

Conceptualisation, M.M. and O.F.; methodology, M.M. and M.F.A.; software, D.D.Z. and M.N.; validation, D.D.Z., K.Đ. and M.N.; formal analysis, D.D.Z. and M.N.; investigation, M.F.A., M.K. and M.N.; resources, M.M. and O.F.; data curation, D.D.Z., M.K., K.Đ. and M.N.; writing—original draft preparation, D.D.Z. and M.K.; writing—review and editing, M.F.A.; visualization, M.K. and K.Đ.; supervision, M.F.A. and M.M.; project administration, M.M.; funding acquisition, M.M. All authors have read and agreed to the published version of the manuscript.

Funding

This research was funded by the Research Council of Norway (project No. 309416).

Data Availability Statement

Data are contained within the article.

Acknowledgments

This study was supported by the Ministry of Science, Technological Development, and Education of the Republic of Serbia (contract numbers: 451-03-66/2026-03/200168; 451-03-66/2026-03/200288; 451-03-65/2026-03/200116) and COST Action CA21142-Fruittree Crop REsponses to Water Deficit and Decision Support Systems Applications (FruitCREWS).

Conflicts of Interest

Author Mekjell Meland was employed by the company FruitResearch AS. The remaining authors declare that the research was conducted in the absence of any commercial or financial relationships that could be construed as a potential conflict of interest.

References

  1. Usenik, V.; Fabčič, J.; Štampar, F. Sugars, organic acids, phenolic composition and antioxidant activity of sweet cherry (Prunus avium L.). Food Chem. 2008, 107, 185–192. [Google Scholar] [CrossRef] [Scilit]
  2. FAOSTAT. 2023. Available online: https://www.fao.org/faostat/en/#data/QCL/visualize (accessed on 25 December 2025).
  3. Blando, F.; Oomah, B.D. Sweet and sour cherries: Origin, distribution, nutritional composition and health benefits. Trends Food Sci. Technol. 2019, 86, 517–529. [Google Scholar] [CrossRef] [Scilit]
  4. OFG 2025. FRUKT-OG GRØNTSTATISTIKK 2024 (Fruit and Green Statistics 2024). Available online: www.frukt.no/globalassets/323704_frukt--og-grontstatistikk-2024_nett_mars.pdf (accessed on 13 March 2026).
  5. Scalisi, A.; O’Connell, M.G.; Stefanelli, D.; Zhou, S.; Pitt, T.; Graetz, D.; Dodds, K.; Han, L.; De Bei, R.; Stanley, J.; et al. Narrow orchard systems for pome and stone fruit—A review. Sci. Hortic. 2024, 338, 113815. [Google Scholar] [CrossRef] [Scilit]
  6. Meland, M.; Maas, F.; Kaiser, C. Effects of irrigation and gibberellic acid on yield and fruit quality of sweet cherry produced in high tunnels. Acta Hortic. 2017, 1177, 307–312. [Google Scholar] [CrossRef] [Scilit]
  7. Meland, M.; Frøynes, O.; Kviklys, D. Performance of Summerland sweet cherry cultivars in Norway. Acta Hortic. 2021, 1327, 273–280. [Google Scholar] [CrossRef] [Scilit]
  8. Meland, M.; Jørgensen, Å. Sweet cherry production in a controlled environment. Acta Hortic. 2019, 1235, 353–358. [Google Scholar] [CrossRef] [Scilit]
  9. Haukås, T.; Klimek, P.; Meland, M. Økonomisk Resultat i Søtkirsebærdyrkinga ved Ulike Dyrkingsformer; NIBIO RAPPORT 2024_10_83; NIBIO: Ås, Norway, 2024; Available online: https://hdl.handle.net/11250/3149625 (accessed on 16 April 2026).
  10. Chockchaisawasdee, S.; Golding, J.B.; Vuong, Q.V.; Papoutsis, K.; Stathopoulos, C.E. Sweet cherry: Composition, postharvest preservation, processing and trends for its future use. Trends Food Sci. Technol. 2016, 55, 72–83. [Google Scholar] [CrossRef] [Scilit]
  11. Acero, N.; Gradillas, A.; Beltran, M.; García, A.; Mingarro, D.M. Comparison of phenolic compounds profile and antioxidant properties of different sweet cherry (Prunus avium L.) varieties. Food Chem. 2019, 279, 260–271. [Google Scholar] [CrossRef] [Scilit]
  12. Gonçalves, A.C.; Rodrigues, M.; Santos, A.O.; Alves, G.; Silva, L.R. Antioxidant Status, Antidiabetic Properties and Effects on Caco-2 Cells of Colored and Non-Colored Enriched Extracts of Sweet Cherry Fruits. Nutrients 2018, 10, 1688. [Google Scholar] [CrossRef] [Scilit]
  13. Gonçalves, A.C.; Bento, C.; Silva, B.; Simões, M.; Silva, L.R. Nutrients, bioactive compounds and bioactivity: The health benefits of sweet cherries (Prunus avium L.). Curr. Nutr. Food Sci. 2019, 15, 208–227. [Google Scholar] [CrossRef] [Scilit]
  14. McCune, L.M.; Kubota, C.; Stendell-Hollis, N.R.; Thomson, C.A. Cherries and health: A review. Crit. Rev. Food Sci. Nutr. 2010, 51, 1–12. [Google Scholar] [CrossRef] [Scilit]
  15. Kelebek, H.; Selli, S. Evaluation of chemical constituents and antioxidant activity of sweet cherry (Prunus avium L.) cultivars. Int. J. Food Sci. Technol. 2011, 46, 2530–2537. [Google Scholar] [CrossRef] [Scilit]
  16. Hayaloglu, A.A.; Demir, N. Physicochemical characteristics, antioxidant activity, organic acid and sugar contents of 12 sweet cherry (Prunus avium L.) cultivars grown in Turkey. J. Food Sci. 2015, 80, C564–C570. [Google Scholar] [CrossRef] [Scilit]
  17. Serrano, M.; Guillén, F.; Martínez-Romero, D.; Castillo, S.; Valero, D. Chemical constituents and antioxidant activity of sweet cherry at different ripening stages. J. Agric. Food Chem. 2005, 53, 2741–2745. [Google Scholar] [CrossRef] [Scilit]
  18. Li, J.; Zhang, C.; Liu, H.; Liu, J.; Jiao, Z. Profiles of sugar and organic acid of fruit juices: A comparative study and implication for authentication. J. Food Qual. 2020, 1, 7236534. [Google Scholar] [CrossRef] [Scilit]
  19. Wani, A.A.; Singh, P.; Gul, K.; Wani, M.H.; Langowski, H.C. Sweet cherry (Prunus avium): Critical factors affecting the composition and shelf life. Food Packag. Shelf Life 2014, 1, 86–99. [Google Scholar] [CrossRef] [Scilit]
  20. Robards, K.; Prenzler, P.D.; Tucker, G.; Swatsitang, P.; Glover, W. Phenolic compounds and their role in oxidative processes in fruits. Food Chem. 1999, 66, 401–436. [Google Scholar] [CrossRef] [Scilit]
  21. Gonçalves, B.; Landbo, A.K.; Knudsen, D.; Silva, A.P.; Moutinho-Pereira, J.; Rosa, E.; Meyer, A.S. Effect of ripeness and postharvest storage on the phenolic profiles of cherries (Prunus avium L.). J. Agric. Food Chem. 2004, 52, 523–530. [Google Scholar] [CrossRef] [Scilit]
  22. González-Gómez, D.; Lozano, M.; Fernández-León, M.F.; Bernalte, M.J.; Ayuso, M.C.; Rodríguez, A.B. Sweet cherry phytochemicals: Identification and characterization by HPLC-DAD/ESI-MS in six sweet-cherry cultivars grown in Valle del Jerte (Spain). J. Food Comp. Anal. 2010, 23, 533–539. [Google Scholar] [CrossRef] [Scilit]
  23. Grigoras, C.G.; Destandau, E.; Zubrzycki, S.; Elfakir, C. Sweet cherries anthocyanins: An environmental friendly extraction and purification method. Sep. Purif. Technol. 2012, 100, 51–58. [Google Scholar] [CrossRef] [Scilit]
  24. Correia, S.; Schouten, R.; Silva, A.P.; Gonçalves, B. Factors affecting quality and health promoting compounds during growth and postharvest life of sweet cherry (Prunus avium L.). Front. Plant Sci. 2017, 8, 2166. [Google Scholar] [CrossRef] [Scilit] [PubMed]
  25. Hallmann, E.; Rozpara, E. The estimation of bioactive compounds content in organic and conventional sweet cherry (Prunus avium L.). J. Res. Appl. Agric. Eng. 2017, 62, 141–145. [Google Scholar]
  26. Kazazic, M.; Mehic, E.; Aliman, J.; Djapo-Lavic, M. The bioactive compounds of sweet cherry fruits influenced by cultivar/rootstock combination. Hort. Sci. 2024, 51, 23–28. [Google Scholar] [CrossRef] [Scilit]
  27. Serradilla, M.J.; Hernández, A.; López-Corrales, M.; Ruiz-Moyano, S.; de Guía Córdoba, M.; Martín, A. Chapter 6—Composition of the Cherry (Prunus avium L. and Prunus cerasus L.; Rosaceae). In Nutritional Composition of Fruit Cultivars; Simmonds, M.S.J., Preedy, V.R., Eds.; Academic Press: Cambridge, MA, USA, 2016; pp. 127–147. [Google Scholar]
  28. Montero, J.I.; Antón, A.; Hernández, J.; Castilla, N. Direct and diffuse light transmission of insect-proof screens and plastic films for cladding greenhouses. Acta Hortic. 2001, 559, 203–210. [Google Scholar] [CrossRef] [Scilit]
  29. Fotirić Akšić, M.; Dabić Zagorac, D.; Gašić, U.; Tosti, T.; Natić, M.; Meland, M. Analysis of Apple Fruit (Malus × domestica Borkh.) Quality Attributes Obtained from Organic and Integrated Production Systems. Sustainability 2022, 14, 5300. [Google Scholar] [CrossRef] [Scilit]
  30. Natić, M.; Dabić Zagorac, D.; Jakanovski, M.; Smailagić, A.; Čolić, S.; Meland, M.; Fotirić Akšić, M. Fruit Quality Attributes of Organically Grown Norwegian Apples Are Affected by Cultivar and Location. Plants 2024, 13, 147. [Google Scholar] [CrossRef] [Scilit]
  31. Sredojević, M.; Rabrenović, B.; Pejić, L.; Fotirić Akšić, M.; Dabić Zagorac, D.; Ćirić, I.; Malenov, D.; Relić, D.; Natić, M. Techno-functional properties and gastrointestinal polyphenol release of defatted raspberry seed cake. Food Biosci. 2025, 68, 106636. [Google Scholar] [CrossRef] [Scilit]
  32. Fotirić Akšić, M.; Dabić Zagorac, D.; Sredojević, M.; Milivojević, J.; Gašić, U.; Meland, M.; Natić, M. Chemometric Characterization of Strawberries and Blueberries according to Their Phenolic Profile: Combined Effect of Cultivar and Cultivation System. Molecules 2019, 24, 4310. [Google Scholar] [CrossRef] [Scilit] [PubMed]
  33. Gonçalves, B.; Moutinho-Pereira, J.; Santos, A.; Silva, A.P.; Barcelar, E.; Correira, C.; Rosa, E. Scion-rootstock interaction affects the physiology and fruit quality of sweet cherry. Tree Physiol. 2006, 26, 93–104. [Google Scholar] [CrossRef] [Scilit]
  34. Serrano, M.; Díaz-Mula, H.M.; Zapata, P.J.; Castillo, S.; Guillén, F.; Martínez-Romero, D.; Valverde, J.M.; Valero, D. Maturity stage at harvest determines the fruit quality and antioxidant potential after storage of sweet cherry cultivars. J. Agric. Food Chem. 2009, 57, 3240–3246. [Google Scholar] [CrossRef] [Scilit] [PubMed]
  35. Szpadzik, E.; Krupa, T.; Niemiec, W.; Jadczuk-Tobjasz, E. Yielding and fruit quality of selected sweet cherry (Prunus avium) cultivars in the conditions of central Poland. Acta Sci. Pol. Hortorum Cultus 2019, 18, 117–126. [Google Scholar] [CrossRef] [Scilit]
  36. Sánchez-Rodríguez, L.; Ali, N.S.; Cano-Lamadrid, M.; Noguera-Artiaga, L.; Lipan, L.; Carbonell-Barrachina, Á.A.; Sendra, E. Flavors and aromas. In Postharvest Physiology and Biochemistry of Fruits and Vegetables; Yahia, E.M., Ed.; Woodhead Publishing: Cambridge, UK, 2019; pp. 385–404. [Google Scholar]
  37. El Kettabi, Z.; Elfazazi, K.; Haddioui, A.; Alaoui, A.; Adiba, A.; El fallah, K.; El-rhouttais, C.; Charafi, J. Determination and comparison of biochemical characteristics in an ex-situ collection of sweet cherry cultivars in Morocco. Discov. Food 2025, 5, 175. [Google Scholar] [CrossRef] [Scilit]
  38. Zhou, J.; Yang, S.; Ma, Y.; Liu, Z.; Tu, H.; Wang, H.; Wang, X. Soluble sugar and organic acid composition and flavor evaluation of Chinese cherry fruits. Food Chem. X 2023, 20, 100953. [Google Scholar] [CrossRef] [Scilit]
  39. Skrzyński, J.; Leja, M.; Gonkiewicz, A.; Banach, P. Cultivar effect on the sweet cherry antioxidant and some chemical attributes. Folia Hortic. 2016, 28, 95–102. [Google Scholar] [CrossRef] [Scilit]
  40. Lang, G.A. Tree fruit production in high tunnels: Current status and case study of sweet cherries. Acta Hortic. 2013, 987, 73–81. [Google Scholar] [CrossRef] [Scilit]
  41. Lang, G.A. Growing sweet cherries under plastic covers and tunnels: Physiological aspects and practical considerations. Acta Hortic. 2009, 1020, 303–312. [Google Scholar] [CrossRef] [Scilit]
  42. Schmitz-Eiberger, M.A.; Blanke, M.M. Bioactive components in forced sweet cherry fruit (Prunus avium L.), antioxidative capacity and allergenic potential as dependent on cultivation under cover. LWT-Food Sci. Technol. 2012, 46, 388–392. [Google Scholar] [CrossRef] [Scilit]
  43. Blanco, V.; Zoffoli, J.P.; Ayala, M. High tunnel cultivation of sweet cherry (Prunus avium L.): Physiological and production variables. Sci. Hortic. 2019, 251, 108–117. [Google Scholar] [CrossRef] [Scilit]
  44. Bustamante, M.; Muñoz, A.; Romero, I.; Osorio, P.; Mánquez, S.; Arriola, R.; Ribera-Fonseca, A. Impact of potassium pre-harvest applications on fruit quality and condition of sweet cherry (Prunus avium L.) cultivated under plastic covers in southern Chile orchards. Plants 2021, 10, 2778. [Google Scholar] [CrossRef] [Scilit] [PubMed]
  45. Palacios-Peralta, C.; Ruiz, A.; Ercoli, S.; Reyes-Díaz, M.; Bustamante, M.; Muñoz, A.; Ribera-Fonseca, A. Plastic covers and potassium pre-harvest sprays and their influence on antioxidant properties, phenolic profile, and organic acids composition of sweet cherry fruits cultivated in Southern Chile. Plants 2022, 12, 50. [Google Scholar] [CrossRef] [Scilit]
  46. Palma, M.; Sepúlveda, Á.; Yuri, J.A. Effect of plastic roof and high tunnel on microclimate, physiology, vegetative growth and fruit characteristics of ‘Santina’ sweet cherry. Sci. Hortic. 2023, 317, 112037. [Google Scholar] [CrossRef] [Scilit]
  47. Usenik, V.; Zadravec, P.; Stampar, F. Influence of rain protective tree covering on sweet cherry fruit quality. Euro J. Hortic. Sci. 2009, 74, 49. [Google Scholar] [CrossRef] [Scilit]
  48. Blanke, M.M.; Balmer, M. Cultivation of sweet cherry under rain covers. Acta Hortic. 2008, 795, 479–484. [Google Scholar] [CrossRef] [Scilit]
  49. Børve, J.; Skaar, E.; Sekse, L.; Meland, M.; Vangdal, E. Rain protective covering of sweet cherry trees—Effects of different covering methods on fruit quality and microclimate. HortTech 2003, 13, 143–148. [Google Scholar] [CrossRef] [Scilit]
  50. Overbeck, V.; Schmitz, M.; Blanke, M. Targeted forcing improves quality, nutritional and health value of sweet cherry fruit. J. Sci. Food Agric. 2017, 97, 3649–3655. [Google Scholar] [CrossRef] [Scilit]
  51. Meland, M.; Frøynes, O.; Kaiser, C. High tunnel production systems improve yields and fruit size of sweet cherry. Acta Hortic. 2017, 1161, 117–124. [Google Scholar] [CrossRef] [Scilit]
  52. Kiprovski, B.; Borković, B.; Malenčić, Đ.; Veberič, R.; Štampar, F.; Mikulič-Petkovšek, M. Postharvest changes in primary and secondary metabolites of sweet cherry cultivars induced by Monilinia laxa. Postharvest Biol. Technol. 2018, 144, 46–54. [Google Scholar] [CrossRef] [Scilit]
  53. Ma, C.; Sun, Z.; Chen, C.; Zhang, L.; Zhu, S. Simultaneous separation and determination of fructose, sorbitol, glucose and sucrose in fruits by HPLC–ELSD. Food Chem. 2014, 145, 784–788. [Google Scholar] [CrossRef] [Scilit]
  54. Serradilla, M.J.; Fotiric Akšić, M.; Manganaris, G.A.; Ercisli, S.; González-Gómez, D.; Valero, D. Fruit chemistry, nutritional benefits and social aspects of cherries. In Cherries: Botany, Production and Uses; Quero-García, J., Iezzoni, A., Puławska, J., Lang, G., Eds.; CABI: Wallingford, UK, 2017; pp. 420–441. [Google Scholar]
  55. Gracia, C.; Calle, A.; Gasic, K.; Arias, E.; Wünsch, A. Genetic and QTL analyses of sugar and acid content in sweet cherry (Prunus avium L.). Hortic. Res. 2025, 12, uhae310. [Google Scholar] [CrossRef] [Scilit]
  56. Dolenc, K.; Štampar, F. Determining the quality of different cherry cultivars using the HPLC method. Acta Hortic. 1998, 468, 705–712. [Google Scholar] [CrossRef] [Scilit]
  57. Ballistreri, G.; Continella, A.; Gentile, A.; Amenta, M.; Fabroni, S.; Rapisarda, P. Fruit quality and bioactive compounds relevant to human health of sweet cherry (Prunus avium L.) cultivars grown in Italy. Food Chem. 2013, 140, 630–638. [Google Scholar] [CrossRef] [Scilit]
  58. Desnoues, E.; Gibon, Y.; Baldazzi, V.; Signoret, V.; Génard, M.; Quilot-Turion, B. Profiling sugar metabolism during fruit development in a peach progeny with different fructose-to-glucose ratios. BMC Plant Biol. 2014, 14, 336. [Google Scholar] [CrossRef] [Scilit]
  59. Gao, Z.; Maurousset, L.; Lemoine, R.; Yoo, S.D.; Van Nocker, S.; Loescher, W. Cloning, expression, and characterization of sorbitol transporters from developing sour cherry fruit and leaf sink tissues. Plant Physiol. 2003, 131, 1566–1575. [Google Scholar] [CrossRef] [Scilit] [PubMed]
  60. Li, L.; Li, M.; Wu, J.; Yin, H.; Dunwell, J.M.; Zhang, S. Genome-wide identification and comparative evolutionary analysis of sorbitol metabolism pathway genes in four Rosaceae species and three model plants. BMC Plant Biol. 2022, 22, 341. [Google Scholar] [CrossRef] [Scilit]
  61. Su, J.; Zhu, L.C.; Liu, X.; Peng, Y.J.; Ma, B.Q.; Ma, F.W.; Li, M.J. Research Progress on Sugar Metabolism and Concentration Regulation in Fruit. J. Fruit. Sci. 2022, 39, 266–279. (In Chinese) [Google Scholar]
  62. Walker, R.P.; Famiani, F. Organic acids in fruits: Metabolism, functions and contents. Hortic. Rev. 2018, 45, 371–430. [Google Scholar]
  63. Noiraud, N.; Maurousset, L.; Lemoine, R. Transport of polyols in higher plants. Plant Physiol. Biochem. 2001, 39, 717–728. [Google Scholar] [CrossRef] [Scilit]
  64. Suzuki, N.; Rivero, R.M.; Shulaev, V.; Blumwald, E.; Mittler, R. Abiotic and biotic stress combinations. New Phytol. 2014, 203, 32–43. [Google Scholar] [CrossRef] [Scilit] [PubMed]
  65. Grimm, E.; Knoche, M. Sweet cherry skin has a less negative osmotic potential than the flesh. J. Am. Soc. Hortic. Sci. 2015, 140, 472–479. [Google Scholar] [CrossRef] [Scilit]
  66. Conde, A.; Silva, P.; Agasse, A.; Conde, C.; Gerós, H. Mannitol transport and mannitol dehydrogenase activities are coordinated in Olea europaea under salt and osmotic stresses. Plant Cell Physiol. 2011, 52, 1766–1775. [Google Scholar] [CrossRef] [Scilit]
  67. Mahmoud, T.S.M.; Rohim, F.M.; Elsayed, S.I.; Saleh, S.A. Enhancing growth and productivity of ‘Anna’ apple orchards: Mitigating abiotic stresses through Moringa leaf extract and mannitol foliar application at critical stages. Appl. Fruit. Sci. 2024, 66, 373–383. [Google Scholar] [CrossRef] [Scilit]
  68. Fan, X.; Zhao, H.; Wang, X.; Cao, J.; Jiang, W. Sugar and organic acid composition of apricot and their contribution to sensory quality and consumer satisfaction. Sci. Hortic. 2017, 225, 553–560. [Google Scholar] [CrossRef] [Scilit]
  69. Blanco, V.; Zoffoli, J.P.; Ayala, M. Eco-physiological response, water productivity and fruit quality of sweet cherry trees under high tunnels. Sci. Hortic. 2021, 286, 110180. [Google Scholar] [CrossRef] [Scilit]
  70. Zhang, W.; Zhu, D.; Mao, J.; Du, H.; Qin, H.; Wang, J.; Bai, B. Insight into flavor difference of cherry (Prunus avium L.) grown in facility environment and outdoors through metabolomics and correlation analysis. Food Chem. X 2024, 24, 101802. [Google Scholar] [CrossRef] [Scilit]
  71. Mahmood, T.; Anwar, F.; Abbas, M.; Boyce, M.C.; Saari, N. Compositional variation in sugars and organic acids at different maturity stages in selected small fruits from Pakistan. Int. J. Mol. Sci. 2012, 13, 1380–1392. [Google Scholar] [CrossRef] [Scilit]
  72. Wang, H.; Lu, J.; Chen, L.; Deng, L.; Xu, R.; Cao, J.; Jiang, W.; Zhang, Y.; Wang, B. Integrative Comparison of Variations in Taste, Aroma, and Sensory Characteristics Among Four Sweet Cherry Cultivars to Explore Quality Differences During Storage. Foods 2025, 14, 3432. [Google Scholar] [CrossRef] [Scilit]
  73. Liu, C.; Chen, L.; Qi, X.; Song, L.; Wang, M.; Han, S.; Li, M. Malate accumulation and transcriptome patterns during fruit development in sweet Cherry (Prunus avium L.). BMC Plant Biol. 2025, 25, 1548. [Google Scholar] [CrossRef] [Scilit] [PubMed]
  74. Falchi, R.; Bonghi, C.; Drincovich, M.F.; Famiani, F.; Lara, M.V.; Walker, R.P.; Vizzotto, G. Sugar Metabolism in Stone Fruit: Source-Sink Relationships and Environmental and Agronomical Effects. Front. Plant Sci. 2020, 11, 573982. [Google Scholar] [CrossRef] [Scilit]
  75. Wei, X.; Chen, J.; Gao, B.; Wang, Z. Chapter 39—Role of controlled and slow release fertilizers in fruit crop nutrition. In Fruit Crops; Srivastava, A.K., Hu, C., Eds.; Elsevier: Oxford, UK, 2020; pp. 555–566. [Google Scholar]
  76. Mohamed, M.H.; Petropoulos, S.A.; Ali, M.M.E. The application of nitrogen fertilization and foliar spraying with calcium and boron affects growth aspects, chemical composition, productivity and fruit quality of strawberry plants. Horticulturae 2021, 7, 257. [Google Scholar] [CrossRef] [Scilit]
  77. Neilsen, G.; Kappel, F.; Neilsen, D. Fertigation and crop load affect yield, nutrition, and fruit quality of ‘Lapins’ sweet cherry on Gisela 5 rootstock. HortScience 2007, 42, 1456–1462. [Google Scholar] [CrossRef] [Scilit]
  78. Ličina, V.; Krogstad, T.; Fotirić Akšić, M.; Meland, M. Apple Growing in Norway—Ecologic Factors, Current Fertilization Practices and Fruit Quality: A Case Study. Horticulturae 2024, 10, 233. [Google Scholar] [CrossRef] [Scilit]
  79. Calle, A.; Wünsch, A. Multiple-population QTL mapping of maturity and fruit-quality traits reveals LG4 region as a breeding target in sweet cherry (Prunus avium L.). Hortic. Res. 2020, 7, 127. [Google Scholar] [CrossRef] [Scilit]
  80. Yang, S.; Meng, Z.; Li, Y.; Chen, R.; Yang, Y.; Zhao, Z. Evaluation of Physiological Characteristics, Soluble Sugars, Organic Acids and Volatile Compounds in ‘Orin’ Apples (Malus domestica) at Different Ripening Stages. Molecules 2021, 26, 807. [Google Scholar] [CrossRef] [Scilit]
  81. Kim, D.O.; Heo, H.J.; Kim, Y.J.; Yang, H.S.; Lee, C.Y. Sweet and sour cherry phenolics and their protective effects on neuronal cells. J. Agric. Food Chem. 2005, 53, 9921–9927. [Google Scholar] [CrossRef] [Scilit]
  82. Jakobek, L.; Šeruga, M.; Voća, S.; Šindrak, Z.; Dobričević, N. Flavonol and phenolic acid composition of sweet cherries (cv. Lapins) produced on six different vegetative rootstocks. Sci. Hortic. 2009, 123, 23–28. [Google Scholar] [CrossRef] [Scilit]
  83. Milinović, B.; Dragović-Uzelac, V.; Halapija Kazija, D.; Jelačić, T.; Vujević, P.; Čiček, D.; Biško, A.; Čmelik, Z. Influence of four different dwarfing rootstocks on phenolic acids and anthocyanin composition of sweet cherry (Prunus avium L.) cvs. ‘Kordia’ and ‘Regina’. J. Appl. Bot. Food Qual. 2016, 89, 29–37. [Google Scholar]
  84. Canan, I.; Gundogdu, M.; Ercisli, S.; Berk, S.; Saracoglu, O. Biochemical characteristics of sweet cherry germplasm in Turkey. Prog. Nutr. 2019, 21, 672–679. [Google Scholar]
  85. Rashidinejad, A.; Ahmmed, F.; Lister, C.; Stoklosinski, H. Functional Potential of Sweet Cherry Cultivars Grown in New Zealand: Effects of Processing on Nutritional and Bioactive Properties. Foods 2025, 14, 3749. [Google Scholar] [CrossRef] [Scilit]
  86. Zymonė, K.; Liaudanskas, M.; Lanauskas, J.; Nagelytė, M.; Janulis, V. Variability in the Qualitative and Quantitative Composition of Phenolic Compounds and the In Vitro Antioxidant Activity of Sour Cherry (Prunus cerasus L.) Leaves. Antioxidants 2024, 13, 553. [Google Scholar] [CrossRef] [Scilit] [PubMed]
  87. Lenchyk, L. Determination of Phenolic Compounds in Prunus Domestica Leaves Extract. Scr. Sci. Pharm. 2015, 2, 31–35. [Google Scholar] [CrossRef] [Scilit]
  88. Vangdal, E.; Slimestad, R. Methods to determine antioxidative capacity in fruit. J. Fruit. Ornam. Plant Res. 2006, 14, 2. [Google Scholar]
  89. Milea, A.Ș.; Vasile, A.M.; Cîrciumaru, A.; Dumitrașcu, L.; Barbu, V.; Râpeanu, G.; Bahrim, G.E.; Stănciuc, N. Valorizations of Sweet Cherries Skins Phytochemicals by Extraction, Microencapsulation and Development of Value-Added Food Products. Foods 2019, 8, 188. [Google Scholar] [CrossRef] [Scilit] [PubMed]
  90. Antognoni, F.; Potente, G.; Mandrioli, R.; Angeloni, C.; Freschi, M.; Malaguti, M.; Hrelia, S.; Lugli, S.; Gennari, F.; Muzzi, E.; et al. Fruit Quality Characterization of New Sweet Cherry Cultivars as a Good Source of Bioactive Phenolic Compounds with Antioxidant and Neuroprotective Potential. Antioxidants 2020, 9, 677. [Google Scholar] [CrossRef] [Scilit]
  91. Czech, A.; Zarycka, E.; Yanovych, D.; Zasadna, Z.; Grzegorczyk, I.; Kłys, S. Mineral content of the pulp and peel of various citrus fruit cultivars. Biol. Trace Elem. Res. 2020, 193, 555–563. [Google Scholar] [CrossRef] [Scilit]
  92. Zhang, H.; Wu, Y.; Hou, Q.; Tu, K.; Li, Q.; Wen, X. Trace macroelement content and speciation analysis in leaves of sweet cherry trees by elemental analysis and X-ray photoelectron spectroscopy. Spectrosc. Lett. 2020, 53, 572–579. [Google Scholar] [CrossRef] [Scilit]
  93. Fenn, M.A.; Giovannoni, J.J. Phytohormones in fruit development and maturation. Plant J. 2021, 105, 446–458. [Google Scholar] [CrossRef] [Scilit]
  94. Singh, V.; Singh, J.; Kushwaha, R.; Singh, M.; Kumar, S.; Rai, A.K. Assessment of antioxidant activity, minerals and chemical constituents of edible mahua (Madhuca longifolia) flower and fruit of using principal component analysis. Nutr. Food Sci. 2021, 51, 387–411. [Google Scholar] [CrossRef] [Scilit]
  95. Gonçalves, A.C.; Campos, G.; Pinto, E.; Oliveira, A.S.; Almeida, A.; de Pinho, P.G.; Alves, G.; Silva, L.R. Essential and non-essential elements, and volatile organic compounds for the discrimination of twenty-three sweet cherry cultivars from Fundão, Portugal. Food Chem. 2022, 367, 130503. [Google Scholar] [CrossRef] [Scilit]
  96. Kafle, G.K.; Khot, L.R.; Zhou, J.; Bahlol, H.Y.; Si, Y. Towards precision spray applications to prevent rain-induced sweet cherry cracking: Understanding calcium washout due to rain and fruit cracking susceptibility. Sci. Hortic. 2016, 203, 152–157. [Google Scholar] [CrossRef] [Scilit]
  97. Correia, S.; Queirós, F.; Ferreira, H.; Morais, M.C.; Afonso, S.; Silva, A.P.; Gonçalves, B. Foliar Application of Calcium and Growth Regulators Modulate Sweet Cherry (Prunus avium L.) Tree Performance. Plants 2020, 9, 410. [Google Scholar] [CrossRef] [Scilit]
  98. Lambers, H.; Chapin, F.S.; Pons, T. Plant Physiological and Ecology, 2nd ed.; Springer: New York, NY, USA, 2008; pp. 151–161. [Google Scholar]
  99. White, P.J. Long-Distance Transport in the Xylem and Phloem. In Marschner’s Mineral Nutrition of Higher Plants; Marschner, P., Ed.; Elsevier Ltd.: Amsterdam, The Netherlands, 2012; pp. 49–70. [Google Scholar]
  100. Michailidis, M.; Karagiannis, E.; Tanou, G.; Sarrou, E.; Stavridou, E.; Ganopoulos, I.; Karamanol, K.; Madesis, P.; Martens, S.; Molassiotis, A. An Integrated Metabolomic and Gene Expression Analysis Identifies Heat and Calcium Metabolic Networks Underlying Postharvest Sweet Cherry Fruit Senescence. Planta 2019, 250, 2009–2022. [Google Scholar] [CrossRef] [Scilit]
  101. Matteo, M.; Zoffoli, J.P.; Ayala, M. Calcium Sprays and Crop Load Reduction Increase Fruit Quality and Postharvest Storage in Sweet Cherry (Prunus avium L.). Agronomy 2022, 12, 829. [Google Scholar] [CrossRef] [Scilit]
  102. Masoud, H.; Mousa, A.; Javad, N.M. Different K:Ca ratios affected fruit color and quality of strawberry ‘Selva’ in soilless system. J. Plant Nutr. 2018, 41, 243–252. [Google Scholar]
  103. Torkashvand, A.M.; Ahmadi, A.; Nikravesh, N.L. Prediction of kiwifruit firmness using fruit mineral nutrient concentration by artificial neural network (ANN) and multiple linear regressions (MLR). J. Integr. Agric. 2017, 16, 1634–1644. [Google Scholar] [CrossRef] [Scilit]
  104. Dilmaghani, M.R.; Malakouti, M.J.; Neilsen, G.H.; Fallahi, E. Interactive Effects of Potassium and Calcium on K/Ca Ratio and Its Consequences on Apple Fruit Quality in Calcareous Soils of Iran. J. Plant Nutr. 2005, 27, 1149–1162. [Google Scholar] [CrossRef] [Scilit]
  105. Engels, C.; Kirkby, E.; White, P. Mineral Nutrition, Yield and Source–Sink Relationships. In Marschner’s Mineral Nutrition of Higher Plants; Marschner, P., Ed.; Elsevier Ltd.: Amsterdam, The Netherlands, 2012; pp. 85–134. [Google Scholar]
  106. Narayan, O.P.; Kumar, P.; Yadav, B.; Dua, M.; Johri, A.K. Sulfur nutrition and its role in plant growth and development. Plant Signal Behav. 2023, 18, 2030082. [Google Scholar] [CrossRef] [Scilit] [PubMed]
  107. Paulo, L.; Antunes, P.; Miguel-Pintado, C. Mineral composition of ‘Sweetheart’ cherry using inductively coupled plasma atomic emission spectroscopy. Acta Hortic. 2017, 1161, 555–560. [Google Scholar] [CrossRef] [Scilit]
  108. Jeelani, S.M.; Yasmin, S.; Lone, A.H.; Mir, J.I.; Irfan, M.; Dinkar, V.; Raja, W.H.; Nabi, S.U.; Verma, M.K.; Malik, G.; et al. Differential quantity of key bioactive compounds and their antioxidative potential in novel apple genotypes: A correlative study for potential therapeutics. Heliyon 2025, 21, e42148. [Google Scholar] [CrossRef] [Scilit]
  109. Xue, X.; Zhao, A.; Wang, Y.; Ren, H.; Du, J.; Li, D.; Li, Y. Composition and content of phenolic acids and flavonoids among the different varieties, development stages, and tissues of Chinese Jujube (Ziziphus jujuba Mill.). PLoS ONE 2021, 16, e0254058. [Google Scholar] [CrossRef] [Scilit] [PubMed]
  110. Hayaloglu, A.A.; Demir, N. Phenolic compounds, volatiles, and sensory characteristics of twelve sweet cherry (Prunus avium L.) cultivars grown in Turkey: Phenolics and volatiles in sweet cherry. J. Food Sci. 2016, 81, 7–18. [Google Scholar] [CrossRef] [Scilit]
  111. Zhang, H.; Zhang, N.; Wang, L.; Li, Q. Correlation Analysis and Comprehensive Evaluation of the Mineral Element Content of Sweet Cherry Fruit at Three Developmental Stages Under Three Cultivation Patterns. Int. J. Fruit Sci. 2025, 25, 1–13. [Google Scholar] [CrossRef] [Scilit]
  112. Guo, J.; Carrington, Y.; Alber, A.; Ehlting, J. Molecular characterization of quinate and shikimate metabolism in Populus trichocarpa. J. Biol. Chem. 2014, 289, 23846–23858. [Google Scholar] [CrossRef] [Scilit] [PubMed]
Figure 1. Sweet cherry growing in pots. (A)—Flowering sweet cherry spindle trees grown in bags in a multibay plastic tunnel in Ullensvang, Norway; (B)—mature fruits of the sweet cherry cultivar ‘Van’ grown on spindle trees in bags; (C)—the sweet cherry cultivar ‘Regina’ grown in bags ready for harvest; (D)—high density and fertigated plantings of sweet cherry trees grown in bags in a multibay plastic tunnel.
Agronomy 16 00890 g001
Figure 2. PCA performed on sugar and sugar alcohol, organic acid, polyphenol, and elemental contents quantified in sweet cherry samples: (A) PCA score plot and (B) PCA loading plot. (OA1—Quinic acid; OA2—Shikimic acid; OA3—D-Galacturonic acid; OA4—Glucuronic acid; OA5—Malic acid; OA6—Succinic acid; OA7—Maleic acid; OA8—Citric acid; OA9—Isocitric acid; PH1—Quercetin; PH2—Rutin; PH3—p-Coumaric acid; PH4—Caffeic acid; PH5—Ferulic acid; PH6—Vanillic acid; PH7—Galangin; PH8—Isorhamnetin-3-O-rutinoside; PH9—Catechin; PH10—Epicatechin; PH11—Hyperoside; PH12—Chlorogenic acid; PH13—Isorhamnetin; S1—Glucose; S2—Fructose; S3—Eritritol; S4—Sorbitol; S5—Manitol; S6—Arabinose; S7—Melibiose; S8—Sucrose; S9—Isomaltose; S10—Raffinose; S11—Turanose; S12—Maltose; E1—Na; E2—Mg; E3—P; E4—S; E5—K; E6—Ca; E7—B; E8—Al; E9—Cr; E10—Mn; E11—Fe; E12—Co; E13—Ni; E14—Cu; E15—Zn; E16—Sr; E17—Mo; E18—Cd; E19—Sb; E20—Ba; E21—Hg; E22—Pb).
Agronomy 16 00890 g002
Table 1. Treatments of slow-release fertilisation (SR) and fertigation (F) regimes of sweet cherry ‘Van’ (V), ‘Lapins’ (L), and ‘Regina’ (R) cultivars grown in pots in high tunnels.
TreatmentCultivarCodeFertilisersECRegime of Fertilisation and Irrigation
Slow release‘Van’VSR150 g Multicote and 30 g chalk lime per treeThe slow-release fertiliser and the chalk lime were added to the top of the pots in Mid-April each spring. Only plain water was given during the seasons to 1 October. The amounts and frequency of water given per pot were based on daily evaporation.
VSR2100 g Multicote and 30 g chalk lime per tree
VSR3150 g Multicote and 30 g chalk lime per tree
VSR4200 g Multicote and 30 g chalk lime per tree
‘Lapins’LSR150 g Multicote and 30 g chalk lime per tree
LSR2100 g Multicote and 30 g chalk lime per tree
LSR3150 g Multicote and 30 g chalk lime per tree
LSR4200 g Multicote and 30 g chalk lime per tree
‘Regina’RSR150 g Multicote and 30 g chalk lime per tree
RSR2100 g Multicote and 30 g chalk lime per tree
RSR3150 g Multicote and 30 g chalk lime per tree
RSR4200 g Multicote and 30 g chalk lime per tree
Fertigation‘Van’VF1Kristalon brown + Calcinit + Magnesium-sulphate (KCM)0.5KCM from Mid-April to 1 September, plain water for the rest of the season
VF2Kristalon brown + Calcinit + Magnesium-sulphate (KCM)1.0KCM from Mid-April to 1 September, plain water for the rest of the season
VF3Kristalon brown + Calcinit + Magnesium-sulphate (KCM)0.5KCM from Mid-April to 1 July, only Kristalon in July, KCM in August, and plain water for the rest of the season
‘Lapins’LF1Kristalon brown + Calcinit + Magnesium-sulphate (KCM)0.5KCM from Mid-April to 1 September, plain water for the rest of the season
LF2Kristalon brown + Calcinit + Magnesium-sulphate (KCM)1.0KCM from Mid-April to 1 September, plain water for the rest of the season
LF3Kristalon brown + Calcinit + Magnesium-sulphate (KCM)0.5KCM from Mid-April to 1 July, only Kristalon in July, KCM in August, and plain water for the rest of the season
‘Regina’RF1Kristalon brown + Calcinit + Magnesium-sulphate (KCM)0.5KCM from Mid-April to 1 September, plain water for the rest of the season
RF2Kristalon brown + Calcinit + Magnesium-sulphate (KCM)1.0KCM from Mid-April to 1 September, plain water for the rest of the season
RF3Kristalon brown + Calcinit + Magnesium-sulphate (KCM)0.5KCM from Mid-April to 1 July, only Kristalon in July, KCM in August, and plain water for the rest of the season
Table 2. Sugar and sugar alcohol contents (g/100 g DW) quantified in investigated sweet cherry samples.
SampleSugarsSugar AlcoholsSum
GlucoseFructoseArabinoseMelibioseSucroseIsomaltoseRaffinoseTuranoseMaltoseEritritolSorbitolManitol
Cultivar
V5.1 ± 0.2 ab*5.4 ± 0.3 a0.032 ± 0.001 a0.63 ± 0.02 a0.37 ± 0.03 a0.25 ± 0.01 a0.53 ± 0.04 b0.70 ± 0.01 b1.99 ± 0.040.205 ± 0.003 b0.71 ± 0.02 b0.59 ± 0.02 ab16.430
L4.7 ± 0.2 b4.7 ± 0.3 b0.023 ± 0.001 b0.66 ± 0.02 a0.28 ± 0.03 b0.19 ± 0.01 b0.45 ± 0.04 c0.59 ± 0.005 c1.39 ± 0.040.282 ± 0.003 a0.68 ± 0.02 c0.58 ± 0.02 b14.583
R5.2 ± 0.2 a5.3± 0.3 a0.028 ± 0.001 ab0.48 ± 0.02 b0.15 ± 0.01 c0.23 ± 0.01 ab0.66 ± 0.04 a0.76 ± 0.01 a1.32 ± 0.040.093 ± 0.001 c0.77 ± 0.02 a0.60 ± 0.02 a15.626
Fertilisation Type
SR4.8 ± 0.2 b4.8± 0.3 b0.035 ± 0.001 a0.66 ± 0.02 a0.37 ± 0.03 a0.33 ± 0.01 a0.48 ± 0.04 b0.68 ± 0.01 a1.98 ± 0.040.226 ± 0.003 a0.68 ± 0.02 b0.60 ± 0.02 b15.630
F5.3 ± 0.2 a5.5± 0.4 a0.018 ± 0.001 b0.50 ± 0.02 b0.13 ± 0.01 b0.08 ± 0.005 b0.64 ± 0.04 a0.68 ± 0.01 a1.02 ± 0.030.151 ± 0.002 b0.77 ± 0.03 a0.58 ± 0.02 a15.434
Cultivar × Fertilisation Type
VSR5.1 ± 0.2 c5.0 ± 0.3 b0.044 ± 0.001 a0.59 ± 0.02 c0.47 ± 0.03 a0.38 ± 0.02 b0.53 ± 0.04 d0.74 ± 0.01 b2.77 ± 0.050.271 ± 0.002 b0.74 ± 0.03 b0.62 ± 0.02 a17.185
LSR4.3 ± 0.2 e4.2 ± 0.30.028 ± 0.001 c0.73 ± 0.03 a0.41 ± 0.03 b0.22 ± 0.01 c0.29 ± 0.03 e0.50 ± 0.01 e1.63 ± 0.040.308 ± 0.003 a0.63 ± 0.02 d0.59 ± 0.02 b13.898
RSR4.9 ± 0.2 d5.3 ± 0.3 b0.033 ± 0.001 b0.67 ± 0.03 b0.23 ± 0.03 c0.40 ± 0.02 a0.62 ± 0.05 c0.80 ± 0.01 a1.54 ± 0.040.097 ± 0.001 e0.68 ± 0.02 c0.59 ± 0.02 b15.808
VF5.0 ± 0.2 c5.9 ± 0.4 a0.017 ± 0.001 d0.69 ± 0.03 b0.24 ± 0.03 c0.08 ± 0.005 e0.54 ± 0.04 d0.64 ± 0.01 d0.96 ± 0.040.116 ± 0.001 d0.67 ± 0.02 c0.56 ± 0.02 c15.423
LF5.3 ± 0.2 b5.4 ± 0.4 b0.017 ± 0.001 d0.57 ± 0.02 c0.10 ± 0.01 d0.15 ± 0.01 d0.67 ± 0.05 b0.70 ± 0.01 c1.07 ± 0.030.248 ± 0.003 c0.75 ± 0.03 b0.57 ± 0.02 c15.497
RF5.7 ± 0.2 a5.4 ± 0.3 b0.020 ± 0.001 d0.23 ± 0.02 d0.04 ± 0.01 e0.009 ± 0.005 f0.71 ± 0.04 a0.69 ± 0.01 c1.02 ± 0.030.088 ± 0.001 f0.89 ± 0.03 a0.62± 0.02 a15.383
Cultivar × Fertilisation Type × Treatment
VSR15.1 ± 0.2 d4.6 ± 0.3 cd0.041 ± 0.001 c0.34 ± 0.01 j0.53 ± 0.04 ab0.26 ± 0.01 ef0.69 ± 0.04 b1.00 ± 0.01 b2.72 ± 0.05 b0.109 ± 0.001 l0.79 ± 0.03 cd0.61 ± 0.02 abcd16.79
VSR26.0 ± 0.2 a5.7 ± 0.4 ab0.064 ± 0.002 ab0.025 ± 0.001 p0.45 ± 0.04 c0.40 ± 0.01 d0.77 ± 0.05 ab0.73 ± 0.01 e3.33 ± 0.06 a0.167 ± 0.002 i0.74 ± 0.02 de0.60 ± 0.02 abcd18.96
VSR33.9 ± 0.2 h5.3 ± 0.4 bc0.066 ± 0.002 a1.15 ± 0.03 c0.34 ± 0.03 de0.81 ± 0.02 a0.35 ± 0.02 e0.86 ± 0.01 d2.32 ± 0.04 c0.401 ± 0.005 a0.78 ± 0.02 d0.64 ± 0.02 a16.91
VSR45.3 ± 0.2 bcd4.3 ± 0.3 de0.004 ± 0.001 l0.83 ± 0.02 d0.56 ± 0.05 a0.037 ± 0.001 d0.30 ± 0.02 f0.36 ± 0.005 i2.70 ± 0.05 b0.408 ± 0.005 a0.64 ± 0.02 gh0.62 ± 0.02 abc16.08
LSR14.0 ± 0.2 gh3.4 ± 0.2 f0.013 ± 0.001 k1.11 ± 0.03 c0.38 ± 0.03 d0.016 ± 0.001 l0.24 ± 0.01 g0.31 ± 0.004 k1.51 ± 0.03 f0.369 ± 0.004 c0.61 ± 0.02 h0.57 ± 0.02 de12.45
LSR24.9 ± 0.2 de5.3 ± 0.4 bc0.060 ± 0.002 b0.71 ± 0.02 e0.46 ± 0.04 bc0.57 ± 0.02 c0.56 ± 0.03 c1.12 ± 0.01 a1.93 ± 0.04 d0.247 ± 0.003 e0.65 ± 0.02 gh0.64 ± 0.02 a17.17
LSR34.2 ± 0.2 fgh3.9 ± 0.3 ef0.014 ± 0.001 k0.84 ± 0.02 d0.34 ± 0.03 de0.010 ± 0.001 n0.22 ± 0.01 h0.32 ± 0.004 j1.24 ± 0.02 h0.378 ± 0.004 b0.63 ± 0.02 gh0.53 ± 0.02 ef12.7
LSR44.2 ± 0.2 fgh4.3 ± 0.3 d0.023 ± 0.001 h0.27 ± 0.01 l0.45 ± 0.04 c0.28 ± 0.01 e0.15 ± 0.01 i0.25 ± 0.003 l1.85 ± 0.04 d0.238 ± 0.003 f0.62 ± 0.02 h0.60 ± 0.02 abcd13.27
RSR14.2 ± 0.2 fgh5.4 ± 0.4 b0.031 ± 0.001 e1.49 ± 0.04 a0.30 ± 0.02 ef0.63 ± 0.02 b0.57 ± 0.04 c0.66 ± 0.01 f1.67 ± 0.03 e0.064 ± 0.001 n0.70 ± 0.02 ef0.57 ± 0.02 de16.29
RSR25.5 ± 0.2 bcd5.7 ± 0.4 ab0.043 ± 0.002 c0.41 ± 0.01 h0.060 ± 0.005 jk0.25 ± 0.01 f0.55 ± 0.03 c0.96 ± 0.01 b1.61 ± 0.03 e0.187 ± 0.002 h0.71 ± 0.02 ef0.63 ± 0.02 ab16.61
RSR34.4 ± 0.2 fg4.2 ± 0.3 de0.033 ± 0.001 d0.22 ± 0.01 n0.51 ± 0.04 bc0.106 ± 0.003 i0.83 ± 0.05 a0.97 ± 0.01 b1.43 ± 0.03 g0.003 ± 0.001 r0.67 ± 0.02 fg0.62 ± 0.02 abc13.9
RSR45.3 ± 0.2 bcd6.0 ± 0.4 ab0.025 ± 0.001 g0.56 ± 0.02 f0.055 ± 0.004 k0.62 ± 0.02 b0.54 ± 0.03 c0.62 ± 0.01 g1.46 ± 0.03 g0.135 ± 0.002 j0.64 ± 0.02 gh0.54 ± 0.02 ef16.43
VF15.2 ± 0.2 cd5.8 ± 0.4 ab0.013 ± 0.001 k1.30 ± 0.04 b0.28 ± 0.02 f0.071 ± 0.002 j0.59 ± 0.04 c0.67 ± 0.01 f0.96 ± 0.02 m0.116 ± 0.001 k0.64 ± 0.02 gh0.58 ± 0.02 cd16.16
VF24.9 ± 0.2 de5.6 ± 0.4 ab0.019 ± 0.001 ij0.45 ± 0.01 g0.28 ± 0.02 f0.113 ± 0.003 h0.44 ± 0.03 d0.62 ± 0.01 g0.92 ± 0.02 n0.218 ± 0.003 g0.72 ± 0.02 e0.57 ± 0.02 d14.77
VF35.0 ± 0.2 d6.3 ± 0.4 a0.020 ± 0.001 i0.31 ± 0.01 k0.17 ± 0.01 h0.064 ± 0.002 k0.59 ± 0.04 c0.63 ± 0.01 g1.01 ± 0.02 l0.015 ± 0.001 q0.65 ± 0.02 gh0.54 ± 0.02 e15.34
LF14.5 ± 0.2 ef5.1 ± 0.4 bc0.014 ± 0.001 k1.16 ± 0.03 c0.22 ± 0.02 g0.24 ± 0.01 f0.74 ± 0.05 ab0.85 ± 0.01 d1.10 ± 0.02 ij0.351 ± 0.004 d0.64 ± 0.02 gh0.51 ± 0.02 f15.48
LF25.6 ± 0.2 abc5.6 ± 0.4 ab0.018 ± 0.001 j0.21 ± 0.01 n0.07 ± 0.01 ij0.19 ± 0.01 g0.68 ± 0.04 b0.63 ± 0.01 g1.04 ± 0.02 kl0.358 ± 0.004 d0.66 ± 0.02 fgh0.59 ± 0.02 bcd15.63
LF35.7 ± 0.2 ab5.4 ± 0.4 b0.019 ± 0.001 ij0.34 ± 0.01 j0.022 ± 0.002 g0.005 ± 0.001 o0.58 ± 0.04 c0.63 ± 0.01 g1.07 ± 0.02 jk0.036 ± 0.001 p0.94 ± 0.03 a0.61 ± 0.02 abcd15.38
RF15.7 ± 0.2 ab5.5 ± 0.4 ab0.028 ± 0.001 f0.37 ± 0.01 i0.007 ± 0.001 l0.012 ± 0.001 m0.71 ± 0.04 b0.89 ± 0.01 c1.11 ± 0.02 i0.048 ± 0.001 o0.89 ± 0.03 ab0.61 ± 0.02 abcd15.86
RF25.8 ± 0.2 ab5.3 ± 0.4 bc0.014 ± 0.001 k0.24 ± 0.01 m0.030 ± 0.002 ef0.003 ± 0.001 p0.70 ± 0.04 b0.74 ± 0.01 e0.93 ± 0.02 n0.106 ± 0.001 m0.84 ± 0.03 bc0.60 ± 0.02 abcd15.24
RF35.6 ± 0.2 abc5.3 ± 0.4 bc0.019 ± 0.001 ij0.093 ± 0.003 o0.08 ± 0.01 i0.012 ± 0.001 m0.73 ± 0.05 b0.45 ± 0.01 h1.03 ± 0.02 l0.109 ± 0.001 l0.93 ± 0.03 a0.64 ± 0.02 a15.05
* Different letters within the same column indicate statistically significant difference at p < 0.05 by Tukey’s test.
Table 3. Organic acid content (mg/kg DW) quantified in investigated sweet cherry samples.
Sample/
Compound
Quinic AcidShikimic AcidD-Galacturonic AcidGlucuronic AcidMalic AcidSuccinic AcidMaleic AcidCitric AcidIsocitric Acid
Cultivar
V45 ± 2 a*22.5 ± 0.5 a0.44 ± 0.02 b2.39 ± 0.3 b41 ± 4 a2.6 ± 0.3 b0.396 ± 0.007 b0.92 ± 0.030.09 ± 0.01 b
L45 ± 2 a15.4 ± 0.3 b0.44 ± 0.02 b1.53 ± 0.1 c35 ± 3 b2.6 ± 0.3 b0.187 ± 0.004 c1.24 ± 0.030.18 ± 0.02 a
R47 ± 2 a14.2 ± 0.3 b1.01 ± 0.05 a5.10 ± 0.4 a29 ± 2 c3.4 ± 0.3 a0.751 ± 0.01 a0.63 ± 0.020.12 ± 0.02 ab
Fertilisation Type
SR57 ± 3 a26.8 ± 0.7 a0.92 ± 0.05 a1.37 ± 0.1 b38 ± 3 a2.9 ± 0.3 a0.604 ± 0.009 a0.70 ± 0.020.15 ± 0.02 a
F31 ± 2 b4.8 ± 0.01 b0.25 ± 0.01 b5.19 ± 0.4 a32 ± 3 b2.8 ± 0.3 a0.231± 0.007 b1.24 ± 0.030.10 ± 0.02 b
Cultivar × Fertilisation Type
VSR56 ± 2 b37.4 ± 0.7 a0.65 ± 0.03 b0.48 ± 0.04 e41 ± 4 a2.9 ± 0.3 b0.284 ± 0.007 c0.74 ± 0.020.15 ± 0.02 c
LSR50 ± 2 c21.0 ± 0.3 b0.48 ± 0.02 c0.37 ± 0.04 f34 ± 3 b3.0 ± 0.3 b0.265 ± 0.008 c0.62 ± 0.020.12 ± 0.02 c
RSR65 ± 3 a22.1 ± 0.3 b1.61 ± 0.06 a3.25 ± 0.3 c37 ± 3 b2.9 ± 0.3 b1.264 ± 0.02 a0.75 ± 0.020.19 ± 0.02 b
VF31 ± 1 e2.6 ± 0.01 d0.16 ± 0.01 f4.93 ± 0.4 b41 ± 4 a2.3 ± 0.3 c0.545 ± 0.008 b1.17 ± 0.03-
LF37 ± 1 d8.0 ± 0.2 c0.38 ± 0.02 d3.08 ± 0.3 d36 ± 3 b2.1 ± 0.2 c0.083 ± 0.002 d2.08 ± 0.050.26 ± 0.02 a
RF23 ± 1 f3.8 ± 0.01 d0.21 ± 0.02 e7.57 ± 0.5 a18 ± 1 c4.1 ± 0.3 a0.066 ± 0.002 d0.48 ± 0.010.04 ± 0.01 d
Cultivar × Fertilisation type × Treatment
VSR166 ± 2 c54 ± 1 a0.66 ± 0.03 f0.48 ± 0.04 l49 ± 5 b3.6 ± 0.5 cde0.350 ± 0.008 e1.28 ± 0.03 d0.14 ± 0.02 f
VSR265 ± 2 cd53 ± 1 a0.68 ± 0.03 f0.45 ± 0.03 l44 ± 4 bc2.3 ± 0.3 gh0.341 ± 0.007 e0.70 ± 0.02 i0.11 ± 0.02 f
VSR360 ± 2 e31.2 ± 0.7 d1.16 ± 0.05 d0.39 ± 0.03 m40 ± 4 cd1.4 ± 0.2 jk0.275 ± 0.006 f0.371 ± 0.008 m0.36 ± 0.05 b
VSR432 ± 1 j11.4 ± 0.3 i0.105 ± 0.005 n0.59 ± 0.04 k32 ± 3 def4.1 ± 0.5 bc0.171 ± 0.004 i0.61 ± 0.01 jk-
LSR128 ± 1 k10.7 ± 0.2 j0.096 ± 0.004 o0.24 ± 0.02 n24 ± 2 g5.3 ± 0.7 a0.183 ± 0.004 h0.53 ± 0.01 l-
LSR275 ± 3 b37.1 ± 0.8 c1.23 ± 0.05 d0.61 ± 0.04 jk49 ± 5 b1.9 ± 0.3 hi0.48 ± 0.01 d0.292 ± 0.006 n0.30 ± 0.04 b
LSR336 ± 1 i13.7 ± 0.3 h0.152 ± 0.007 m0.25 ± 0.02 n27 ± 3 fg3.6 ± 0.5 cde0.168 ± 0.004 i0.76 ± 0.02 h-
LSR461 ± 2 de22.6 ± 0.5 e0.45 ± 0.02 g0.38 ± 0.03 m37 ± 4 cde1.2 ± 0.2 k0.227 ± 0.005 g0.89 ± 0.02 g0.19 ± 0.03 e
RSR186 ± 3 a39.9 ± 0.9 b2.18 ± 0.09 a0.72 ± 0.05 i86 ± 9 a4.3 ± 0.6 abc0.97 ± 0.02 c0.60 ± 0.01 k0.48 ± 0.07 a
RSR257 ± 2 e20.7 ± 0.5 f0.86 ± 0.04 e1.27 ± 0.09 h39 ± 4 cd-3.88 ± 0.08 a1.08 ± 0.02 f0.11 ± 0.02 f
RSR350 ± 2 f10.8 ± 0.2 j1.44 ± 0.06 c5.3 ± 0.4 d10 ± 1 k3.5 ± 0.5 cde0.115 ± 0.002 j0.68 ± 0.01 i0.07 ± 0.01 g
RSR467 ± 2 c16.9 ± 0.4 g1.97 ± 0.08 b5.7 ± 0.4 d14 ± 1 h3.9 ± 0.5 bcd0.090 ± 0.002 m0.62 ± 0.01 j0.08 ± 0.01 g
VF144 ± 2 g3.17 ± 0.07 o-10.6 ± 0.8 b36 ± 4 de2.5 ± 0.3 fg1.46 ± 0.03 b0.90 ± 0.02 g-
VF224.1 ± 0.8 m0.291 ± 0.007 q0.32 ± 0.01 i3.5 ± 0.3 e42 ± 4 bcd1.6 ± 0.2 ij0.099 ± 0.002 l1.16 ± 0.02 e-
VF326.1 ± 0.9 l4.3 ± 0.1 l0.171 ± 0.007 l0.69 ± 0.05 ij45 ± 4 bc2.9 ± 0.4 efg0.075 ± 0.002 o1.44 ± 0.03 c-
LF138 ± 1 h6.5 ± 0.1 k0.25 ± 0.01 j2.8 ± 0.2 f36 ± 4 de0.7 ± 0.1 l0.081 ± 0.002 n2.20 ± 0.05 a0.28 ± 0.04 bc
LF245 ± 2 g13.4 ± 0.3 h0.69 ± 0.03 f0.75 ± 0.06 i41 ± 4 bcd2.4 ± 0.3 fgh0.108 ± 0.002 k2.27 ± 0.05 a0.28 ± 0.04 bc
LF329 ± 1 k4.0 ± 0.1 m0.192 ± 0.008 k5.7 ± 0.4 d31 ± 3 ef3.1 ± 0.4 def0.059 ± 0.001 q1.77 ± 0.04 b0.23 ± 0.03 ce
RF122.3 ± 0.8 n1.22 ± 0.03 p-6.8 ± 0.5 c13 ± 1 hi5.0 ± 0.7 ab0.067 ± 0.001 p0.358 ± 0.008 m-
RF222.6 ± 0.8 n3.35 ± 0.08 n0.39 ± 0.02 h1.9 ± 0.1 g28 ± 3 fg3.3 ± 0.4 cde0.112 ± 0.002 jk1.09 ± 0.02 f0.13 ± 0.02 f
RF325.4 ± 0.9 lm6.8 ± 0.2 k0.24 ± 0.01 j14 ± 1 a12 ± 1 j4.1 ± 0.5 bc0.020 ± 0.000 r--
* Different letters within the same column indicate statistically significant difference at p < 0.05 by Tukey’s test. “-” stands for an amount below the LOQ.
Table 4. Amounts of phenolic acids (mg/kg DW), TPC (g GAE/kg DW), and RSA (mmol/TE kg DW) determined in the dried sweet cherry samples.
Sample/CompoundPhenolic AcidTPCRSA
p-Coumaric
Acid
Caffeic
Acid
Ferulic
Acid
Vanilic
Acid
Chlorogenic
Acid
Cultivar
V0.98 ± 0.06 b*1.63 ± 0.054.9 ± 0.4 b4.9 ± 0.3 b227 ± 7 b17.7 ± 0.4 a133 ± 4 b
L0.79 ± 0.05 c0.17 ± 0.013.7 ± 0.2 c5.5 ± 0.4 a239 ± 7 a12.8 ± 0.3 b139 ± 5 b
R2.21 ± 0.3 a0.26 ± 0.015.3 ± 0.3 a4.9 ± 0.4 b148 ± 5 c17.9 ± 0.4 a153 ± 7 a
Fertilisation Type
SR1.79 ± 0.07 a0.08 ± 0.0054.3 ± 0.3 b6.6 ± 0.4 b116 ± 5 b18.1 ± 0.4 a141 ± 5 a
F0.72 ± 0.06 b1.49 ± 0.055.1 ± 0.3 a3.0 ± 0.2 a323 ± 8 a13.6 ± 0.3 b143 ± 5 a
Cultivar × Fertilisation Type
VSR0.81 ± 0.05 d-4.2 ± 0.2 b6.0 ± 0.4 c103 ± 5 e21.8 ± 0.6 a131 ± 5 c
LSR1.12 ± 0.07 c0.05 ± 0.0053.6 ± 0.2 a7.5 ± 0.5 a143 ± 5 d10.3 ± 0.3 d136 ± 5 c
RSR3.43 ± 0.5 a0.20 ± 0.015.1 ± 0.4 c6.5 ± 0.4 b103 ± 5 c22.2 ± 0.5 a156 ± 7 a
VF1.21 ± 0.07 b3.80 ± 0.45.9 ± 0.4 d3.3 ± 0.2 d393 ± 9 a12.3 ± 0.3 c135 ± 6 c
LF0.35 ± 0.03 f0.33 ± 0.023.8 ± 0.3 ab2.9 ± 0.2 d367 ± 9 b16.2 ± 0.4 b144 ± 6 b
RF0.59 ± 0.04 e0.34 ± 0.025.6 ± 0.4 d2.8 ± 0.2 d207 ± 7 c12.1 ± 0.3 c149 ± 7 ab
Cultivar × Fertilisation Type × Treatment
VSR11.43 ± 0.07 e-4.0 ± 0.3 ef6.3 ± 0.4 d184 ± 4 g19.2 ± 0.4 ef134 ± 9 fghi
VSR20.92 ± 0.06 h-4.0 ± 0.2 ef6.2 ± 0.3 d117 ± 5 l20.6 ± 0.4 c127 ± 7 i
VSR30.31 ± 0.03 l-4.7 ± 0.3 d5.5 ± 0.2 e48 ± 2 p26.7 ± 0.4 b127 ± 9 hi
VSR40.58 ± 0.04 j-3.9 ± 0.2 ef6.0 ± 0.3 d61 ± 3 o20.6 ± 0.6 cd135 ± 2 hi
LSR10.93 ± 0.04 h-3.2 ± 0.3 g6.6 ± 0.4 cd142 ± 5 i8.8 ± 0.1 m136 ± 9 fghi
LSR22.2 ± 0.3 c0.20 ± 0.01 f4.2 ± 0.2 e7.8 ± 0.5 b237 ± 7 e10.8 ± 0.4 l145 ± 5 efg
LSR30.86 ± 0.05 h-2.6 ± 0.2 h7.7 ± 0.4 b122 ± 4 kl8.8 ± 0.4 m115.7 ± 0.6 j
LSR40.49 ± 0.02 k-4.2 ± 0.4 e7.8 ± 0.5 b69 ± 2 n12.8 ± 0.5 j147 ± 8 cdefg
RSR11.22 ± 0.07 g-6.6 ± 0.5 a9.2 ± 0.6 a42 ± 2 q33.3 ± 1.3 a165 ± 2 a
RSR23.5 ± 0.5 b0.11 ± 0.01 g5.6 ± 0.3 bc7.3 ± 0.4 bc101 ± 5 m18.4 ± 0.7 f147 ± 5 def
RSR33.5 ± 0.3 b-3.8 ± 0.2 ef4.1 ± 0.2 f138 ± 8 ij17.5 ± 0.5 fg160.3 ± 0.1 b
RSR45.5 ± 0.6 a0.67 ± 0.05 e4.3 ± 0.3 e5.2 ± 0.3 e130 ± 6 jk19.6 ± 0.5 de152 ± 1 d
VF10.78 ± 0.02 i2.3 ± 0.6 c5.0 ± 0.4 cd3.5 ± 0.2 g325 ± 9 d11.5 ± 0.4 kl131 ± 9 ghi
VF21.59 ± 0.07 d5.2 ± 0.9 a6.7 ± 0.3 a3.4 ± 0.1 g425 ± 8 a12.3 ± 0.6 j140 ± 10 efghi
VF31.26 ± 0.04 cf3.9 ± 0.4 b5.9 ± 0.2 b3.1 ± 0.2 h430 ± 10 a13.2 ± 0.6 j135 ± 6 ghi
LF10.72 ± 0.06 i0.80 ± 0.07 d3.9 ± 0.1 ef3.6 ± 0.2 g355 ± 9 c17.0 ± 0.6 gh127 ± 6 i
LF20.19 ± 0.02 m0.19 ± 0.02 f3.9 ± 0.2 ef2.7 ± 0.1 i366 ± 9 bc16.5 ± 0.6 h152 ± 3 ce
LF30.14 ± 0.01 n-3.6 ± 0.2 fg2.4 ± 0.1 j380 ± 10 b15.2 ± 0.6 i153 ± 2 cd
RF10.51 ± 0.04 jk0.21 ± 0.01 f5.0 ± 0.3 cd2.6 ± 0.2 ij172 ± 5 h11.6 ± 0.4 k156 ± 3 c
RF20.76 ± 0.03 i0.73 ± 0.03 de6.5 ± 0.4 a2.6 ± 0.2 ij231 ± 4 e12.4 ± 0.3 j144 ± 9 efgh
RF30.50 ± 0.02 k0.08 ± 0.01 h5.2 ± 0.3 cd3.1 ± 0.2 h219 ± 8 f12.4 ± 0.3 j147 ± 3 ef
* Different letters within the same column indicate statistically significant difference at p < 0.05 by Tukey’s test. “-” stands for an amount below the LOQ.
Table 5. Contents of flavonoids (mg/kg DW) quantified in the dried sweet cherry samples.
Sample/
Compound
Flavonoids
QuercetinRutinGalanginIsorhamnetin-3-O-RutinosideCatechinEpicatechinHyperosideIsorhamnetin
Cultivar
V6.4 ± 0.2 b*85 ± 3 b0.46 ± 0.004 c1.00 ± 0.04 b9.5 ± 0.9 b7.4 ± 0.8 b14.9 ± 0.9 c1.48 ± 0.05
L6.8 ± 0.2 b84 ± 3 b1.56 ± 0.08 b1.27 ± 0.04 a8.6 ± 0.9 b3.7 ± 0.4 c18.1 ± 1 b2.82 ± 0.1
R10.2 ± 0.5 a114 ± 3 a2.80 ± 0.2 a0.69 ± 0.03 c21.1 ± 1.4 a12.1 ± 1 a20.5 ± 1 a2.51 ± 0.15
Fertilisation Type
SR5.1 ± 0.1 b65 ± 3 b2.54 ± 0.2 a0.16 ± 0.01 b0.8 ± 0.1 b-14.0 ± 0.9 b2.56 ± 0.1
F11.4 ± 0.6 a133 ± 4 a0.36 ± 0.004 b2.10 ± 0.2 a29.5 ± 2 a18.1 ± 1.322.9 ± 1.1 a1.88 ± 0.05
Cultivar × Fertilisation Type
VSR2.3 ± 0.1 f39 ± 1 e-0.18 ± 0.01 d--10.2 ± 0.8 f1.29 ± 0.05
LSR4.7 ± 0.1 e63 ± 2 d2.73 ± 0.2 b0.30 ± 0.01 d--17.0 ± 0.9 d3.25 ± 0.2
RSR8.3 ± 0.4 d93 ± 4 c4.90 ± 0.4 a-2.5 ± 0.2 d-14.9 ± 0.9 e3.15 ± 0.15
VF11.9 ± 0.6 b146 ± 6 a1.07 ± 0.07 c2.10 ± 0.2 b22.3 ± 1.5 b17.2 ± 1.3 b21.1 ± 1 b1.75 ± 0.05
LF9.5 ± 0.5 c111 ± 5 b-2.57 ± 0.2 a20.1 ± 1.5 c8.7 ± 0.8 c19.6 ± 0.9 c2.25 ± 0.1
RF12.8 ± 0.5 a143 ± 6 a-1.62 ± 0.09 c46.0 ± 2.5 a28.3 ± 1.7 a28.0 ± 1.5 a1.65 ± 0.05
Cultivar × Fertilisation Type × Treatment
VSR17.7 ± 0.3 i80 ± 3 g-0.71 ± 0.03 g--35 ± 2 ab1.33 ± 0.07 k
VSR21.3 ± 0.1 l39 ± 1 j----4.3 ± 0.7 j1.46 ± 0.05 j
VSR3-10 ±1 m-----1.29 ± 0.08 k
VSR4-25.6 ± 0.8 k----1.58 ± 0.09 m1.06 ± 0.04 l
LSR16.1 ± 0.2 j75 ± 2 h----26 ± 2 d3.6 ± 0.1 b
LSR28.9 ± 0.5 fg101 ± 3 f5.0 ± 0.4 b1.18 ± 0.04 f--28.3 ± 0.8 cd3.3 ± 0.2 c
LSR33.7 ± 0.2 k53.6 ± 0.9 i3.1 ± 0.2 c---13.8 ± 0.9 i3.6 ± 0.2 bc
LSR4-21.1 ± 0.7 l2.8 ± 0.2 c----2.5 ± 0.1 e
RSR11.0 ± 0.1 m21.6 ± 0.4 l10.8 ± 0.6 a---3.4 ± 0.2 k5.6 ± 0.3 a
RSR29.8 ± 0.4 e105 ± 2 f4.9 ± 0.2 b-2.4 ± 0.2 k-2.8 ± 0.2 l2.8 ± 0.1 d
RSR313.4 ± 0.3 b131 ± 4 d2.2 ± 0.1 d-4.2 ± 0.3 i-35 ± 1 a2.0 ± 0.1 g
RSR48.8 ± 0.1 f113 ± 2 e1.70 ± 0.09 e-3.2 ± 0.3 j-18.3 ± 0.7 g2.2 ± 0.1 f
VF111.2 ± 0.2 d152 ± 5 b1.60 ± 0.07 e2.4 ± 0.1 bc13.0 ± 0.4 g10.6 ± 0.8 f20 ± 1 f1.55 ± 0.07 ij
VF29.2 ± 0.5 ef126 ± 4 d1.60 ± 0.08 e1.93 ± 0.08 d17.8 ± 0.8 f12 ± 1 f16.2 ± 0.8 h1.70 ± 0.06 h
VF315.2 ± 0.6 a161 ± 6 a-1.97 ± 0.07 d36 ± 1 c29 ± 2 b27 ± 1 d2.0 ± 0.1 g
LF18.00 ± 0.3 hi105 ± 4 f-2.7 ± 0.2 ab20.6 ± 0.7 e6.8 ± 0.5 g19 ± 1 fg2.6 ± 0.1 e
LF28.4 ± 0.2 gh105 ± 3 f-2.1 ± 0.2 cd10.8 ± 0.9 h5.4 ± 0.3 h12.9 ± 0.7 i2.05 ± 0.09 fg
LF312.2 ± 0.3 c124 ± 4 d-2.9 ± 0.2 a29 ± 2 d14 ± 1 e27 ± 2 cd2.1 ± 0.1 fg
RF115.3 ± 0.4 a144 ±5 bc-1.48 ± 0.08 e41 ± 2 b21 ± 1 d32 ± 2 b1.9 ± 0.1 g
RF212.0 ± 0.2 c143 ±3 c-1.92 ± 0.07 d60 ± 2 a39 ± 2 a29 ± 1 c1.50 ± 0.07 ij
RF311.1 ± 0.3 d141 ± 2 c-1.46 ± 0.06 e37 ± 3 bc25 ± 1 c23 ± 1 e1.56 ± 0.03 i
* Different letters within the same column indicate statistically significant difference at p < 0.05 by Tukey’s test. “-” stands for an amount below the LOQ.
Table 6. Elemental profiles * (mg/kg) of investigated dry sweet cherry samples.
Sample/
Element
NaMgPSKCaBAlMnFeCuZnSr
Cultivar
V23.3 ± 0.8 a*437 ± 5 ab700 ± 5 b305 ± 3 b8516 ± 60 b596 ± 6 c15.91 ± 0.6 a25.23 ± 0.7 a4.55 ± 0.09 b9.2 ± 0.4 a1.64 ± 0.04 a2.50 ± 0.04 a10.6 ± 0.3 b
L15.4 ± 0.5 c449 ± 7 a802 ± 6 a318 ± 3 a9137 ± 80 a663 ± 6 a 15.94 ± 0.6 a13.66 ± 0.2 c5.16 ± 0.10 a7.6 ± 0.2 b1.39 ± 0.03 b1.94 ± 0.04 b10.8 ± 0.3 b
R17.8 ± 0.5 b430 ± 6 b651 ± 4 c225 ± 2 c7714 ± 35 c629 ± 5 b13.41 ± 0.4 b17.04 ± 0.2 b3.80 ± 0.08 c8.0 ± 0.3 b1.31 ± 0.03 b1.72 ± 0.04 c12.7 ± 0.4 a
Fertilisation Type
SR19.0 ± 0.5 a387 ± 6 b678 ± 5 b274 ± 2 b7270 ± 30 b526 ± 5 b14.12 ± 0.5 b12.83 ± 0.2 b4.69 ± 0.09 a8.7 ± 0.4 a1.18 ± 0.03 b1.44 ± 0.03 b11.1 ± 0.3 b
F18.6 ± 0.5 a508 ± 7 a770 ± 5 a294 ± 2 a10,037 ± 90 a766 ± 6 a16.39 ± 0.6 a26.39 ± 0.7 a4.25 ± 0.09 a7.8 ± 0.3 b1.81 ± 0.04 a2.86 ± 0.04 a11.7 ± 0.3 a
Cultivar × Fertilisation Type
VSR26.8 ± 0.8 a372 ± 6 d678 ± 5 c312 ± 3 b7503 ± 40 d434 ± 5 e14.33 ± 0.3 b7.16 ± 0.1 f4.68 ± 0.09 bc9.2 ± 0.4 ab1.10 ± 0.03 d1.36 ± 0.03 e11.2 ± 0.3 b
LSR13.2 ± 0.4 c354 ± 6 e671 ± 6 c261 ± 2 d7223 ± 40 e538 ± 5 d13.88 ± 0.3 c16.82 ± 0.2 c5.37± 0.10 a8.1 ± 0.4 c1.40 ± 0.04 c1.36 ± 0.0311.5 ± 0.3 b
RSR17.2 ± 0.5 b434 ± 6 c686 ± 6 c250 ± 2 e7085 ± 30 f608 ± 5 c14.15 ± 0.5 bc14.53 ± 0.2 d4.02 ± 0.09 c8.7 ± 0.5 b1.04 ± 0.03 d1.61 ± 0.03 d10.6 ± 0.2 c
VF18.7 ± 0.6 b524 ± 7 b729 ± 7 b295 ± 2 c9867 ± 70 b811 ± 6 a18.03 ± 0.7 a49.33 ± 0.8 a4.37 ± 0.09 c9.4 ± 0.4 a2.37 ± 0.05 a4.01 ± 0.06 a9.8 ± 0.2 d
LF18.4 ± 0.5 b576 ± 7 a976 ± 8 a394 ± 2 a11,690 ± 90 a830 ± 7 a18.70 ± 0.7 a9.44 ± 0.1 e4.87 ± 0.09 ab6.9 ± 0.2 d1.38 ± 0.03 c2.71 ± 0.04 b9.8 ± 0.2 d
RF18.6 ± 0.5 b425 ± 5 c604 ± 5 d193 ± 1 f8553 ± 60 c658 ± 5 b12.43 ± 0.4 d20.39 ± 0.7 b3.52± 0.08 d7.1 ± 0.2 d1.69 ± 0.04 b1.86 ± 0.04 c15.4 ± 0.5 a
Cultivar × Fertilisation Type × Treatment
VSR123.4 ± 0.8 c326 ± 5 l486 ± 3 n192 ± 2 o7140 ± 40 m472 ± 4 l13.8 ± 0.4 hi9.3 ± 0.1 j4.59 ± 0.09 e6.1 ± 0.2 i0.95 ± 0.02 lm1.14 ± 0.03 l11.3 ± 0.3 gh
VSR226.3 ± 0.7 b364 ± 6 k608 ± 6 j288 ± 1 h7220 ± 50 m424 ± 5 n12.5 ± 0.3 j6.1 ± 0.07 l3.85 ± 0.07 gh6.4 ± 0.2 i0.70 ± 0.01 o1.24 ± 0.02 k11.9 ± 0.4 efg
VSR337 ± 1 a414 ± 4 i747 ± 5 g374 ± 4 c8080 ± 60 h380 ± 3 p18.8 ± 0.5 cd5.7 ± 0.06 m5.38 ± 0.08 c10.1 ± 0.4 c0.89 ± 0.02 n1.56 ± 0.03 g9.6 ± 0.2 ij
VSR420.3 ± 0.6 d385 ± 7 j871 ± 9 d395 ± 2 b7570 ± 30 k460 ± 5 m12.2 ± 0.2 jk7.5 ± 0.2 k4.88 ± 0.06 d14.0 ± 0.4 a1.84 ± 0.04 d1.51 ± 0.03 gh11.8 ± 0.2 ef
LSR115.3 ± 0.5 g326 ± 5 l700 ± 8 h223 ± 2 kl7920 ± 20 i493 ± 4 k14.2 ± 0.3 h44.8 ± 0.9 b3.85 ± 0.04 h6.4 ± 0.2 i1.32 ± 0.03 i1.36 ± 0.02 j14.1 ± 0.3 c
LSR28.0 ± 0.2 k252 ± 4 n455 ± 2 o197 ± 1 n4650 ± 20 p418 ± 4 n9.5 ± 0.08 m3.37 ± 0.04 q3.72 ± 0.047.5 ± 0.2 fg1.28 ± 0.02 i1.10 ± 0.02 l8.5 ± 0.2 k
LSR39.7 ± 0.3 j425 ± 3 h753 ± 6 g303 ± 3 g8040 ± 60 h543 ± 5 j14.4 ± 0.3 h2.51 ± 0.036.4 ± 0.5 b7.9 ± 0.3 ef1.41 ± 0.03 h1.52 ± 0.01 h11.4 ± 0.3 fg
LSR419.7 ± 0.5 d411 ± 7 i776 ± 6 f321 ± 2 f8280 ± 80 g696 ± 7 g17.4 ± 0.5 ef16.6 ± 0.2 h7.5 ± 0.4 a10.7 ± 0.4 bc1.57 ± 0.03 g1.45 ± 0.02 i12.0 ± 0.2 e
RSR120.5 ± 0.5 d568 ± 7 c904 ± 8 c347 ± 3 d9380 ± 80 e621 ± 6 i13.3 ± 0.2 i3.12 ± 0.03 r4.71 ± 0.08 e11.2 ± 0.4 b1.15 ± 0.02 j2.34 ± 0.04 d11.4 ± 0.2 g
RSR235.6 ± 0.8 a499 ± 6 e745 ± 5 g224 ± 1 k7430 ± 30 l746 ± 7 f13.8 ± 0.3 hi3.18 ± 0.04 r3.72 ± 0.0610.2 ± 0.3 c1.10 ± 0.02 k1.50 ± 0.03 h11.0 ± 0.1 h
RSR35.75 ± 0.09 m368 ± 5 k594 ± 2 k221 ± 2 l6370 ± 40 n609 ± 7 i11.5 ± 0.2 l25.0 ± 0.9 f3.70 ± 0.057.3 ± 0.2 g0.97 ± 0.02 l1.65 ± 0.03 f11.6 ± 0.2 fg
RSR46.8 ± 0.2 l301 ± 3 m501 ± 3 m206 ± 2 m5160 ± 40 o455 ± 3 m18.0 ± 0.5 de26.8 ± 0.7 e3.95 ± 0.06 g6.2 ± 0.2 i0.92 ± 0.02 mn0.96 ± 0.02 m8.5 ± 0.1 k
VF118.6 ± 0.6 e610 ± 7 ab835 ± 9 e339 ± 4 e10,560 ± 90 d959 ± 8 b19.9 ± 0.6 b44.4 ± 0.7 b5.34 ± 0.07 c9.0 ± 0.3 d1.73 ± 0.04 e2.59 ± 0.04 c11.7 ± 0.2 ef
VF227.1 ± 0.7 b600 ± 9 b746 ± 8 g306 ± 2 g11,280 ± 80 b780 ± 6 d19.1 ± 0.4 bc37.5 ± 0.5 d4.32 ± 0.07 f10.8 ± 0.4 bc1.94 ± 0.05 c3.58 ± 0.05 b9.8 ± 0.2 i
VF310.4 ± 0.4 i363 ± 4 k607 ± 5 j240 ± 1 j7760 ± 30 j674 ± 5 h15.1 ± 0.3 g66.1 ± 0.9 a3.46 ± 0.058.3 ± 0.3 e3.44 ± 0.09 a5.85 ± 0.08 a8.0 ± 0.2 l
LF114.9 ± 0.5 g617 ± 5 a994 ± 8 b347 ± 4 de12,900 ± 100 a979 ± 6 a17.8 ± 0.5 e4.06 ± 0.05 o5.9 ± 0.1 b8.2 ± 0.3 e1.64 ± 0.04 f3.66 ± 0.06 b11.8 ± 0.3 ef
LF217.2 ± 0.6 f576 ± 8 c1032 ± 8 a433 ± 4 a11,020 ± 80 c740 ± 6 f21.8 ± 0.8 a20.7 ± 0.8 g4.34 ± 0.08 f8.5 ± 0.4 de1.42 ± 0.04 h1.87 ± 0.03 e8.2 ± 0.1 l
LF323.0 ± 0.6 c535 ± 6 d902 ± 7 c401 ± 5 b11,150 ± 70 bc790 ± 8 d16.5 ± 0.6 f3.57 ± 0.01 p4.38 ± 0.07 f3.98 ± 0.1 j1.09 ± 0.03 k2.61 ± 0.04 c9.3 ± 0.2 j
RF112.0 ± 0.3 h449 ± 5 f533 ± 4 l149 ± 1 p8380 ± 70 g825 ± 8 c11.8 ± 0.3 kl14.0 ± 0.2 i3.73 ± 0.056.9 ± 0.2 h1.28 ± 0.03 i1.61 ± 0.02 f12.9 ± 0.1 d
RF217.0 ± 0.3 f393 ± 3 j679 ± 7 i282 ± 2 i9150 ± 60 f387 ± 2 o12.0 ± 0.2 k4.36 ± 0.03 n2.97 ± 0.047.3 ± 0.3 gh1.62 ± 0.04 fg1.64 ± 0.02 f15.8 ± 0.3 b
RF326.9 ± 0.7 b432 ± 4 g601 ± 3 j148 ± 1 p8130 ± 50 h763 ± 8 e13.5 ± 0.3 i42.8 ± 0.8 c3.85 ± 0.04 h7.2 ± 0.3 gh2.16 ± 0.05 b2.33 ± 0.04 d17.6 ± 0.4 a
* The amounts of Cr, Co, Ni, Mo, Cd, Sb, Ba, Hg, and Pb were presented in Table S1 (concentrations were below 1.00 mg/kg). The contents of Li, Be, V, As, Se, Ag, Sn, Te, and Tl were below the LOQ (<0.05 mg/kg). * Different letters within the same column indicate statistically significant difference at p < 0.05 by Tukey’s test.
Disclaimer/Publisher’s Note: The statements, opinions and data contained in all publications are solely those of the individual author(s) and contributor(s) and not of MDPI and/or the editor(s). MDPI and/or the editor(s) disclaim responsibility for any injury to people or property resulting from any ideas, methods, instructions or products referred to in the content.