Article

Spatiotemporal Dynamics and Environmental Gradient Associations of Soil Salinity in Oasis Croplands of Xinjiang: A Four-Year Observational Study (2018–2021)


1
College of Resources and Environment, Xinjiang Agricultural University, Urumqi 830052, China
2
Xinjiang Uygur Autonomous Region Cultivated Land Quality Monitoring and Protection Center, Urumqi 830009, China
3
Key Laboratory of Digital Earth Science, Aerospace Information Research Institute, Chinese Academy of Sciences, Beijing 100094, China
4
Xinjiang Engineering Technology Research Center of Soil Big Data, Urumqi 830052, China
5
The Green Production Engineering Technology Research Center of Xinjiang Planting Industry, Urumqi 830052, China
6
Xinjiang Key Laboratory of Soil and Plant Ecological Processes, Urumqi 830052, China
*
Author to whom correspondence should be addressed.
Agronomy 2026, 16(9), 848; https://doi.org/10.3390/agronomy16090848
Submission received: 26 February 2026 / Revised: 27 March 2026 / Accepted: 20 April 2026 / Published: 22 April 2026

Abstract

Soil salinization constrains the sustainability of irrigated oasis agriculture in arid regions. Using repeated post-harvest monitoring of 125 fixed cropland sites in Bachu County, southern Xinjiang, from 2018 to 2021, this study investigated the short-term spatiotemporal variability of topsoil total salt content (TSC) and pH. Descriptive statistics, one-way ANOVA with Tukey’s HSD test, Universal Kriging interpolation, class-transition analysis, hotspot recurrence, centroid migration, and principal component analysis were used to characterize temporal variation, spatial structure, and environmental gradient associations. TSC showed a mitigation–rebound sequence, decreasing to 4.88 ± 5.21 g kg−1 in 2020 and increasing to 6.90 ± 5.93 g kg−1 in 2021, whereas pH increased first and then declined. Salinity remained consistently concentrated in downstream cropland, while pH showed weaker and more year-dependent zonal differentiation. Class-transition analysis revealed marked salinity reorganization in 2021, mainly driven by conversion from lower-salinity classes to moderately and severely saline classes. Severe-salinity hotspots were temporally intermittent but spatially recurrent in the downstream zone, whereas high-pH hotspots were short-lived and mainly confined to the upstream zone. PCA further showed that TSC and pH were aligned with different environmental gradient combinations. Overall, the four-year sequence should be interpreted as short-term interannual variability rather than a robust long-term sequence. These results indicate that TSC and pH should not be treated as interchangeable indicators in oasis cropland assessment, and they provide a transferable basis for zone-specific salinity monitoring and management, with priority given to persistent downstream sink areas.

1. Introduction

Soil salinization remains one of the most persistent constraints on irrigated agriculture worldwide, and recent syntheses increasingly treat it as a multi-scale process linking pore-scale salt transport, profile-scale redistribution, and land-management responses rather than as a simple surface-soil problem [1,2,3]. In drylands, this risk is further amplified by warming-driven aridity, altered rainfall seasonality, and growing dependence on groundwater within increasingly stressed water-resource systems [4,5,6].
In arid oasis croplands of Xinjiang, irrigation development is superimposed on strong evaporation, shallow or fluctuating groundwater, and imperfect drainage, so salt accumulation is tightly coupled with irrigation–drainage design and subsurface regulation [7,8,9]. Recent regional studies have further shown that groundwater mineralization, groundwater depth, topographic position, and spatially varying hydrological settings can jointly control the distribution of salinity across southern Xinjiang and other inland endorheic systems [10,11,12]. Evidence from the Wei-Ku/Werigan–Kuqa oasis systems and the Tarim Basin also indicates that salinity patterns can vary with soil depth and that subsurface or root-zone salinity often records broader groundwater and water-cycle dynamics rather than surface conditions alone [13,14,15].
At the same time, remote-sensing-based salinity studies have markedly improved the spatial resolution and predictive accuracy of mapping by combining Sentinel-2 data, environmental covariates, thermal infrared information, and feature-space approaches [16,17,18]. Multitemporal and sensor-diversified strategies have further advanced salinity monitoring by identifying optimal observation windows, mining time-series features, and extending quantitative retrieval to radar-based pathways [19,20,21]. However, most of these advances are still map-oriented: they are effective for identifying where salinity is high, but much less informative about whether hotspots are shifting across the landscape or repeatedly re-forming within the same structural accumulation corridors [22,23]. A second unresolved issue is interpretive: total salt content (TSC) and soil pH are often reported together, but salinity, sodicity, and pH do not represent the same soil constraints and therefore require differentiated interpretation [24,25]. This distinction is especially relevant in cropland systems because pH may follow its own spatiotemporal trajectory under climate, buffering capacity, and management controls, as shown by recent national- and Xinjiang-scale studies of cropland soil pH [26,27].
Bachu County therefore provides an appropriate setting to ask a management-relevant question that remains insufficiently resolved in oasis croplands: whether the same downstream parcels repeatedly re-enter high-salinity states even when the oasis-wide mean appears to improve. To address this problem, this study used repeated post-harvest observations from 125 fixed cropland sites in Bachu County, southern Xinjiang, during 2018–2021 to characterize the short-term interannual variability of topsoil TSC and pH. Two working hypotheses were tested: first, although TSC may fluctuate substantially among years, severe-salinity hotspots remain spatially constrained within downstream accumulation corridors of the oasis cropland system; second, TSC and pH align with partly different environmental gradients and therefore should not be interpreted as equivalent indicators of salinity risk. On this basis, the objectives were to quantify the interannual variability of TSC and pH, evaluate hotspot recurrence and centroid migration of salinity risk, and compare the environmental-gradient associations of TSC and pH to support spatially differentiated monitoring and management in arid oasis agriculture. The novelty of this study is threefold. First, it uses repeated fixed-site observations rather than a single-date map to distinguish short-term salinity fluctuation from spatially recurrent downstream accumulation. Second, it explicitly integrates hotspot recurrence and centroid migration to determine whether severe-salinity areas shift across the landscape or repeatedly re-form within the same structural accumulation corridors. Third, it evaluates TSC and pH within the same analytical framework, thereby showing that the two indicators reflect partly different environmental alignments and should not be treated as interchangeable proxies in oasis salinity assessment.

2. Materials and Methods

2.1. Study Area

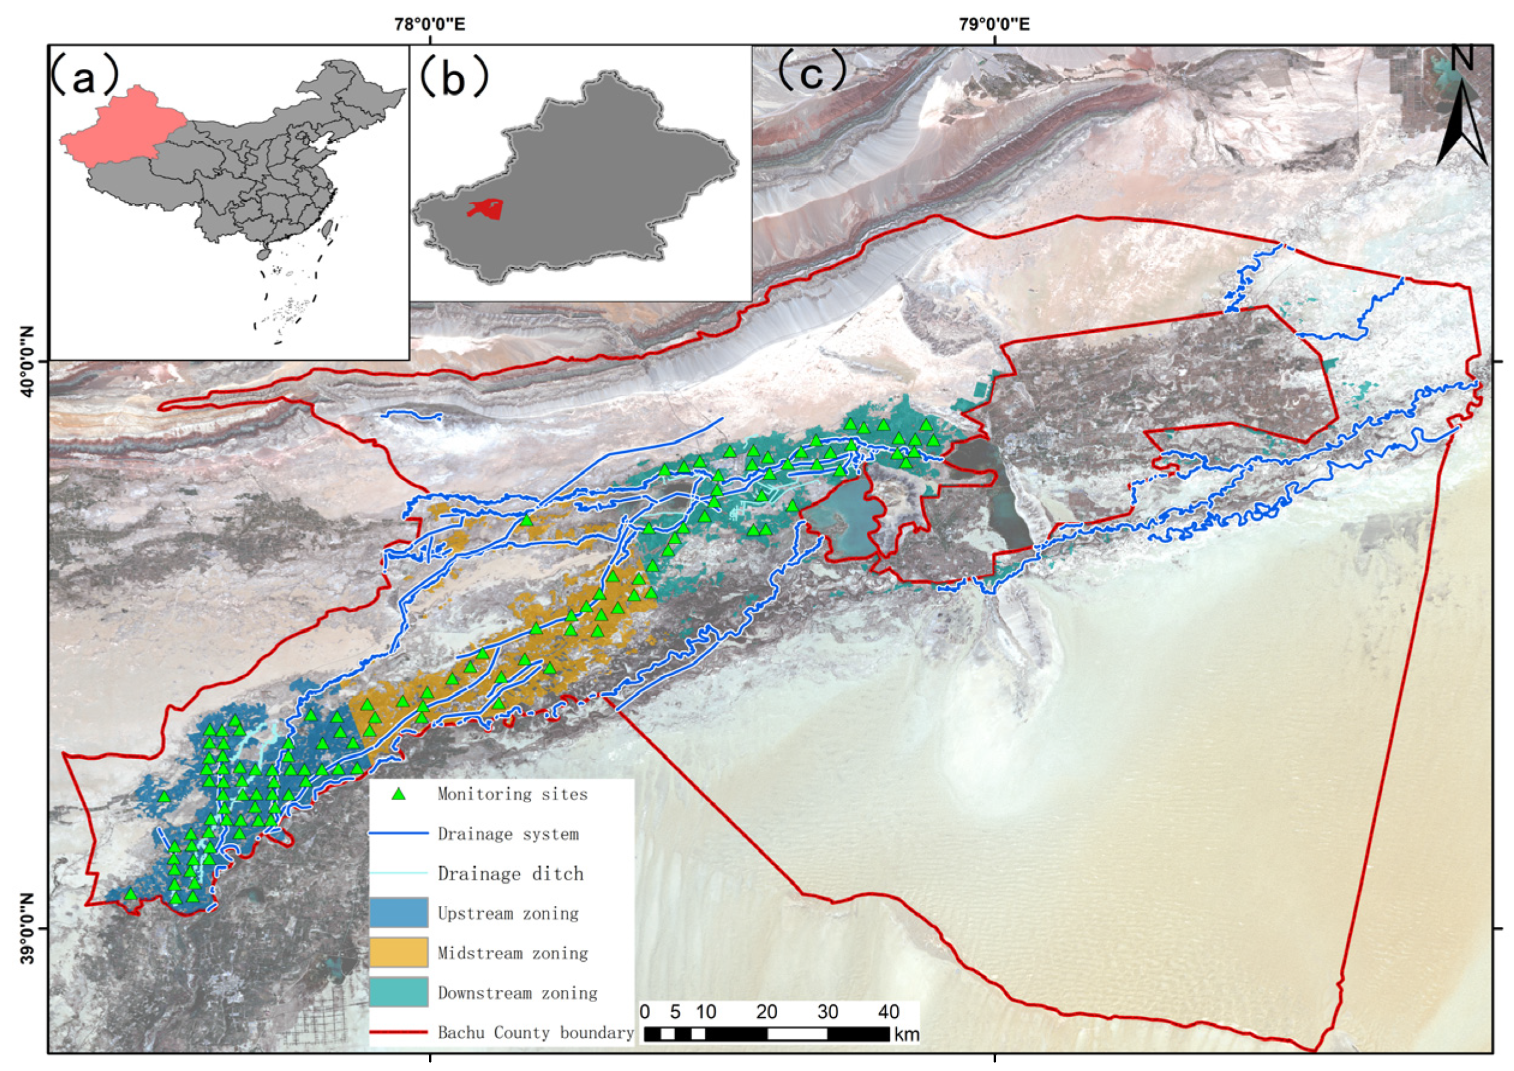
This study was conducted in Bachu County, Kashgar Prefecture, Xinjiang, China (77°22′30″–79°56′15″ E, 38°47′30″–40°17′30″ N), a typical irrigated oasis located in the lower reaches of the Yarkant and Kashgar river systems. In this study, Bachu County was divided into upstream, midstream, and downstream zones along the main river based on elevation, slope, the drainage network, and the distribution of cropland (Figure 1). The region has an arid climate with low precipitation (74.7 mm) and high evaporative demand (2233 mm). Cropland soils are mainly grey desert and aeolian sandy soils derived from alluvial–aeolian materials and are generally calcareous, weakly alkaline to alkaline, and low in organic matter. Cotton is the dominant crop, with wheat and maize also cultivated under canal irrigation, drip irrigation, and fertigation.

2.2. Data Collection and Measurement

2.2.1. Soil Data Collection

A total of 125 fixed sites were established to comprehensively capture the local variability in soil types, fertility gradients, and topographic conditions. These sites were sampled repeatedly during the post-harvest period (October–November) in 2018, 2019, 2020, and 2021. The 125 sites used in this study are part of a long-term fixed soil monitoring network in Bachu County. The site layout considered major differences in topographic position, land-use type, soil type, and elevation across the county. As a result, this network is sufficiently representative of the main cultivated areas of Bachu County and can effectively reflect regional spatiotemporal changes in soil salinization. At each site, 7 soil samples were collected from the 0–20 cm layer and subsequently composited into a single mixed sample. All soil samples were air-dried and passed through a 2 mm sieve prior to laboratory analysis. Total salt content (TSC) was quantified using the gravimetric dry-residue method, for which the analytical coefficient of variation (CV) was 6.42%, while soil pH was measured via a potentiometric approach. For soil nutrient analyses, the contents of organic matter (OM), total nitrogen (TN), available nitrogen (AN), available phosphorus (AP), and available potassium (AK) were determined following standardized wet-chemistry protocols [28,29].

2.2.2. Spatial Data Collection

The sources and spatial resolutions of the terrain, climate, and groundwater datasets used in this study for 2018–2021 are shown in Table 1. Specifically, annual precipitation was aggregated from Climate Hazards Group InfraRed Precipitation with Station (CHIRPS) data. Evapotranspiration (ET) and land surface temperature (LST) were derived from Moderate Resolution Imaging Spectroradiometer (MODIS) land products, specifically MOD16A2GF and MOD11A2, archived and distributed by the NASA Land Processes Distributed Active Archive Center (LP DAAC), U.S. Geological Survey Earth Resources Observation and Science (EROS) Center, Sioux Falls, SD, USA. NDVI was derived from Landsat surface reflectance composites. Slope gradient and topographic wetness index (TWI) were calculated based on digital elevation model (DEM) data. In addition, groundwater-depth records from 15 monitoring stations, spatial zoning maps of groundwater total dissolved solids (TDS), and drainage-network data were obtained from management datasets provided by the Agriculture Bureau of Bachu County.

2.3. Data Processing

2.3.1. Spatial Harmonization and Masks

All spatial layers were reprojected to a common metric coordinate system (UTM Zone 44N) and aligned to a unified raster grid. A county boundary mask and a cropland mask were applied to constrain raster calculations, zoning, mapping, and area statistics to cropland within Bachu County.

2.3.2. Annual Compositing of Dynamic Covariates

Annual precipitation was aggregated from CHIRPS daily data. Annual evapotranspiration (ET) and land surface temperature (LST) were composited from MODIS products for each year (2018–2021). NDVI was derived from Landsat surface reflectance (SR) annual composites at 30 m. All annual layers were resampled to the common grid prior to spatial overlay, zonal summaries, and point extraction.

2.3.3. Terrain and Hydrological Data

To characterize the potential spatial redistribution and accumulation of water along the terrain, the topographic wetness index (TWI) was derived from DEM-based upslope contributing area and local slope gradient according to the original formulation of Beven and Kirkby, as expressed in Equation (1):
T W I = ln ( A s tan β )
where As denotes upslope contributing area and β denotes local slope angle.
Distances to the main river and to the drainage/canal network were calculated using Euclidean distance transforms.
Groundwater depth zoning polygons were rasterized to the common grid. Polygon attributes were converted to continuous mid-values and stored as GWdepth (m). Groundwater mineralization zoning polygons were rasterized to the common grid. Polygon attributes were converted to continuous mid-values and stored as ECD (mg L−1). Coverage and value ranges were checked on cropland prior to zonal statistics and modeling.

2.3.4. Spatial Interpolation Parameters

Annual raster surfaces of TSC and pH were generated in ArcGIS 10.8 using Universal Kriging after projection to UTM Zone 44N. A log transformation and a constant pattern term were applied to both variables. The fitted semivariogram for both TSC and pH was the stable model. For TSC, the fitted model had a nugget of 0.3855, a sill of 0.4049, a range of 0.0442, and a shape parameter of 1.1211. For pH, the fitted model had a nugget of 0.0011, a partial sill of 0.0003, a range of 0.0710, and a shape parameter of 2.0 [30]. Model performance was evaluated by cross-validation using RMSE, MAE, and cross-validated R2. The TSC surface yielded RMSE = 6.522, MAE = 4.810 g kg−1, and R2 = 0.092, whereas the pH surface yielded RMSE = 0.280, MAE = 0.222, and R2 = 0.032. These interpolated annual surfaces were subsequently used for spatial pattern mapping, class-transition analysis, hotspot recurrence, and centroid migration [31,32].

2.3.5. Salinity Classification, Hotspots, and Point-Wise Extraction

TSC (g kg−1) was classified into five salinity levels following the Third National Soil Survey criteria for Xinjiang (Table 2) [33]. Hotspots were defined as TSC ≥ 10 g kg−1 and extreme cores as TSC ≥ 16 g kg−1. Soil pH was classified into four acidity–alkalinity levels according to Table 2 [34].

2.4. Statistical and Spatial Analysis

Spatial interpolation was performed using the Universal Kriging method within the geostatistical analysis module of ArcGIS (v10.8; Esri, Redlands, CA, USA), establishing a unified spatial analysis benchmark. Descriptive statistics and significance tests for interannual and interzone variations in TSC and pH were conducted using R (v4.5.2; R Foundation for Statistical Computing, Vienna, Austria) with the package tidyverse. One-way analysis of variance (ANOVA) was applied to compare differences in soil salinity and pH across years and zones. Principal Component Analysis (PCA) was used as an exploratory dimensionality reduction method to summarize the structure of the primary multivariate environmental gradients. Spatial raster computations, classification, centroid migration, and hotspot identification were implemented in Python (Anaconda; v3.12.4) using the rasterio, geopandas, plotly, NumPy, and pandas packages.
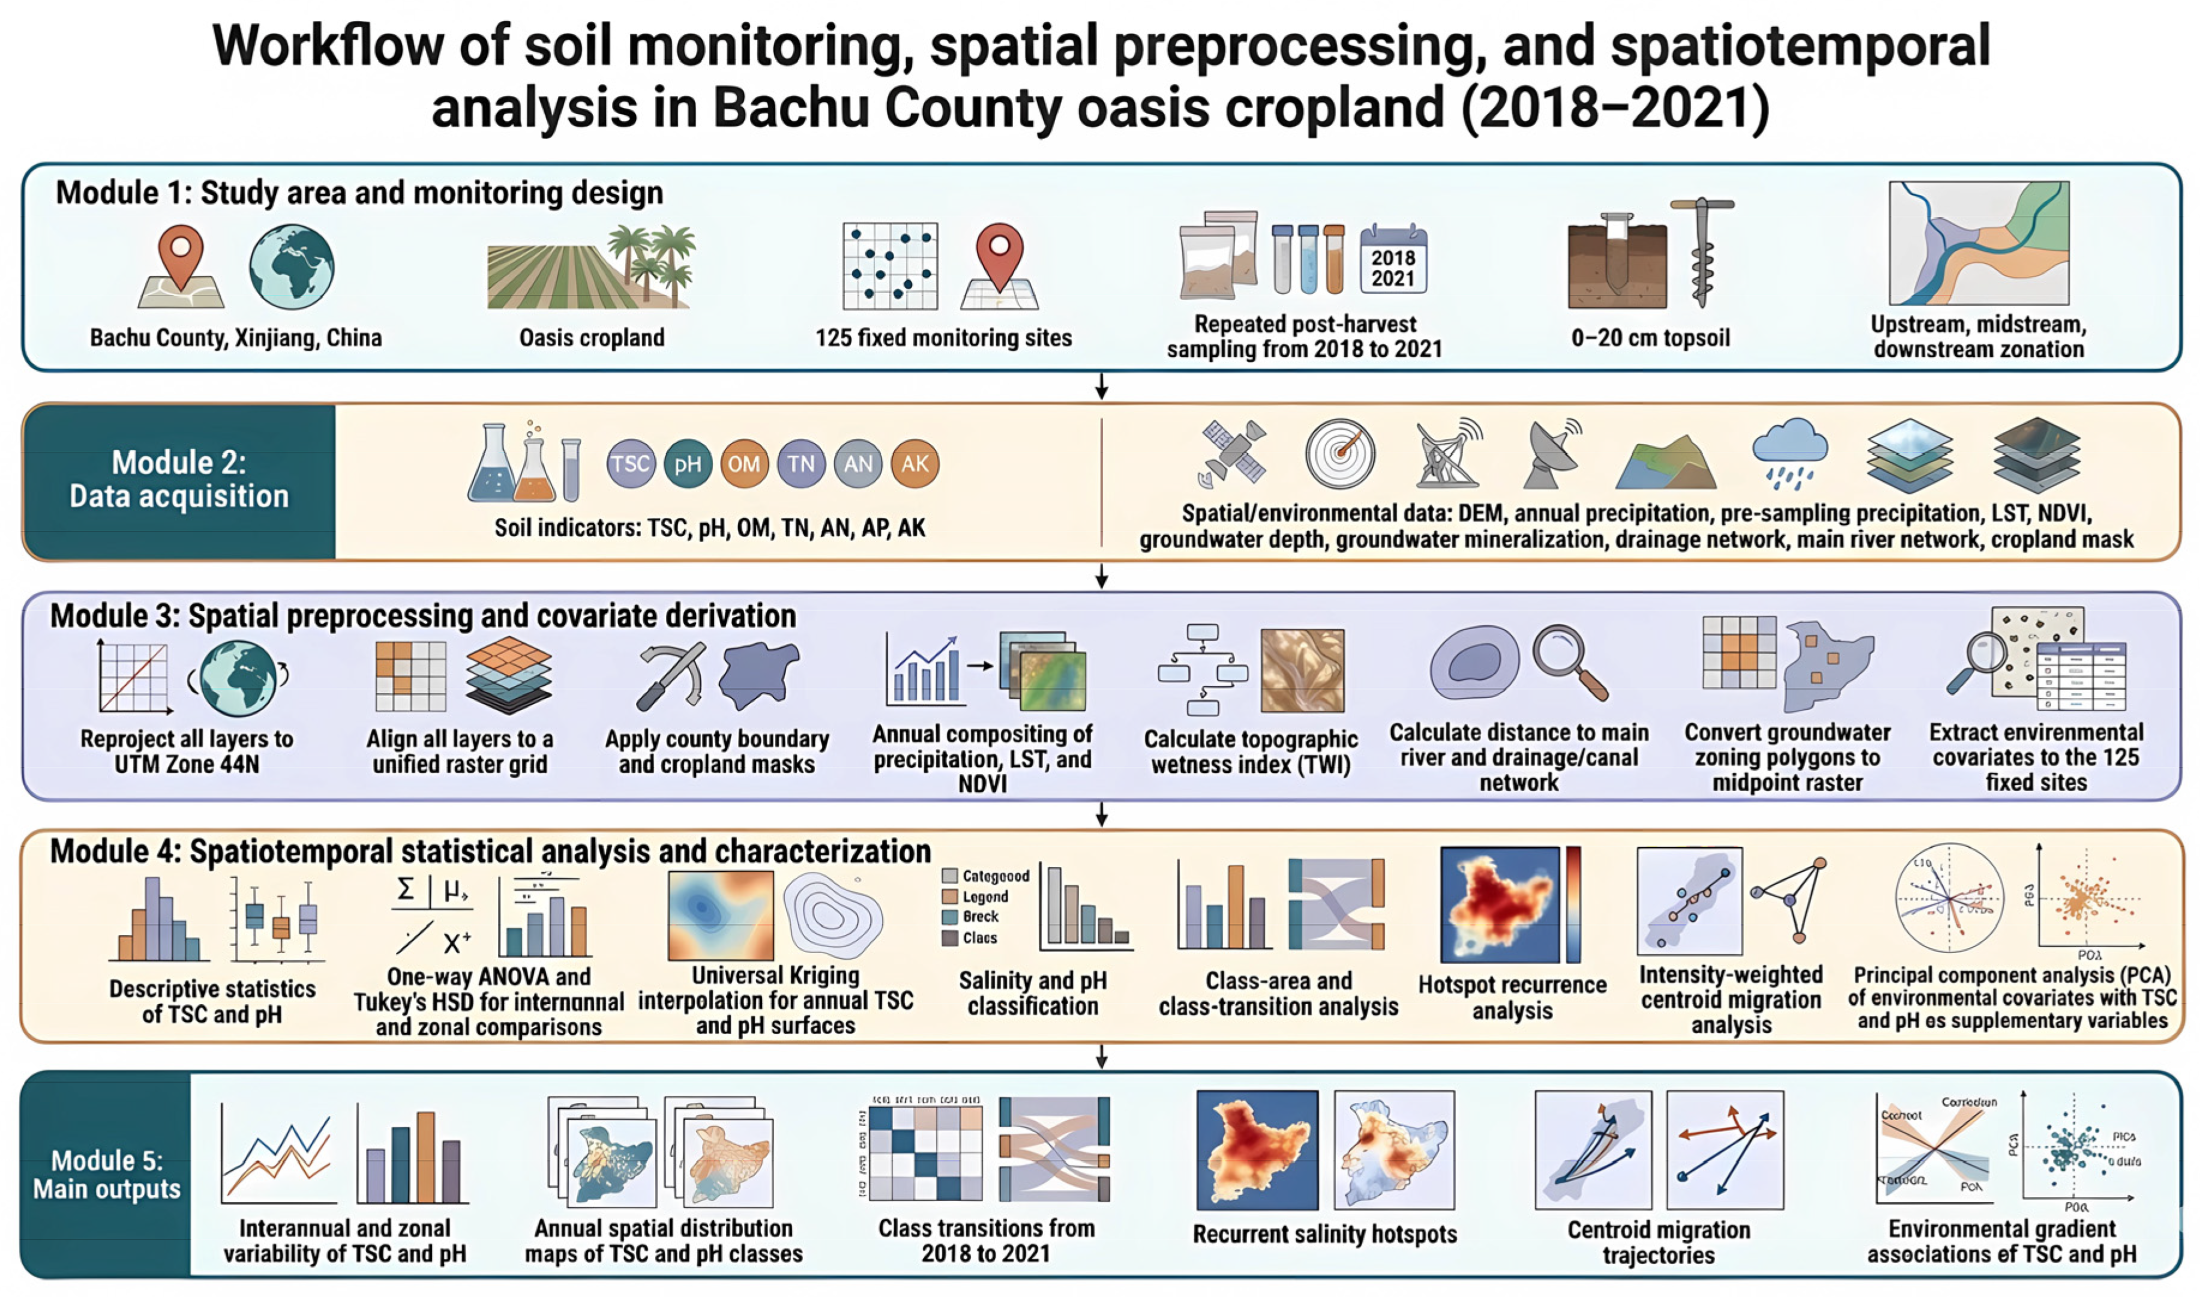
The overall workflow of soil monitoring, spatial preprocessing, and spatiotemporal analysis in this study is summarized in Figure 2.

3. Results

3.1. Interannual and Zonal Statistical Analysis of Topsoil Total Salt Content and Soil pH in Oasis Cropland

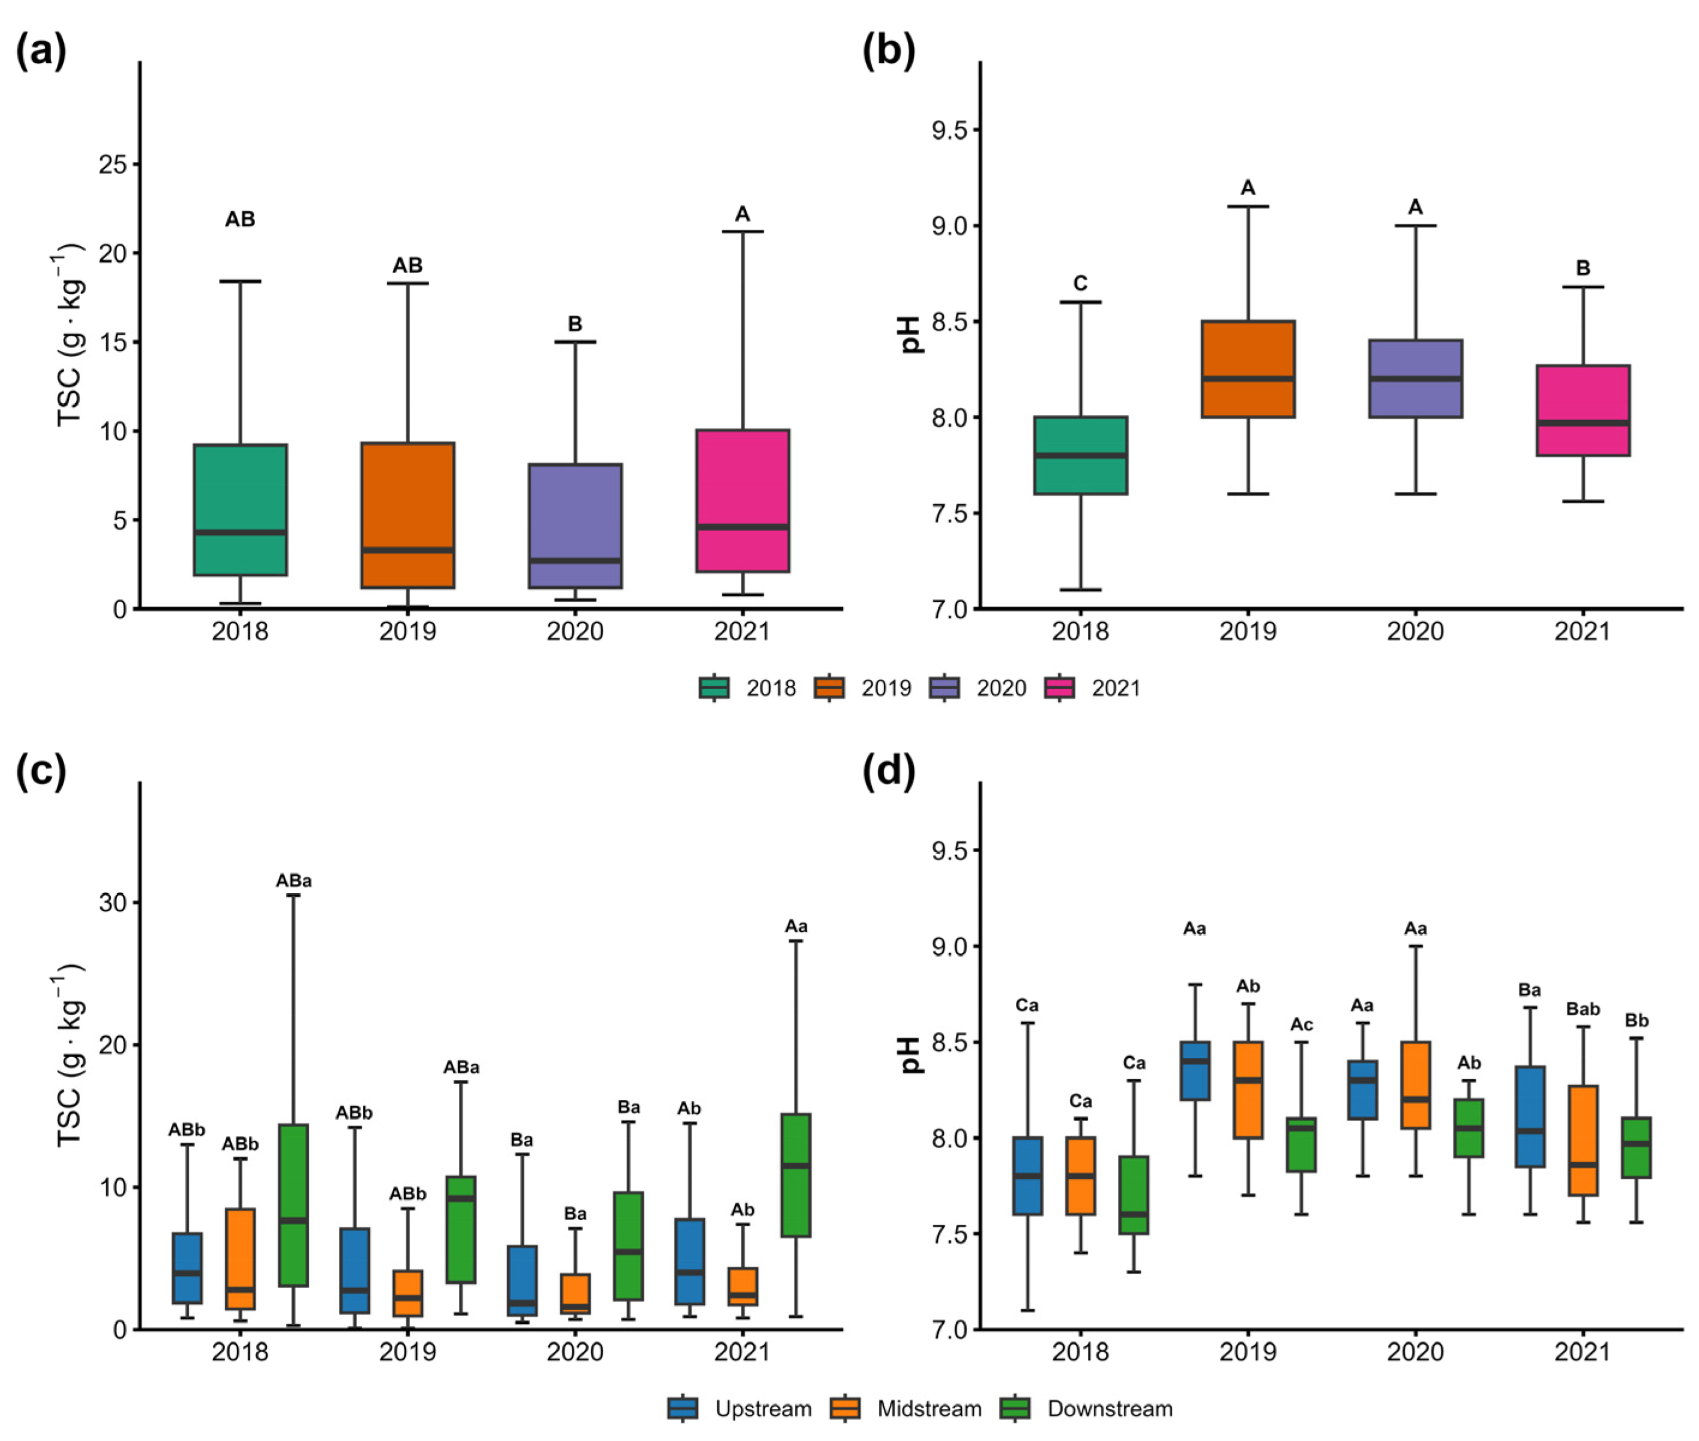
Figure 3 summarizes the interannual and zonal variability of TSC and pH in oasis cropland from 2018 to 2021. At the oasis scale, TSC exhibited a pattern of initial decline followed by an increase (Figure 3a). Specifically, the average TSC in 2020 was 4.88 ± 5.21 g kg−1, significantly lower than the 6.71 ± 6.56 g kg−1 observed in 2018 (p < 0.05). Conversely, the average TSC in 2021 rose to 6.90 ± 5.93 g kg−1, which was significantly higher than that in 2020 (p < 0.05). Regarding spatial distribution, TSC generally followed a sequence of downstream > upstream > midstream, particularly in 2018 (Figure 3c). The average TSC in the downstream region reached 10.07 ± 8.48 g kg−1, significantly higher than the 5.33 ± 4.85 g kg−1 in the upstream and 5.06 ± 5.11 g kg−1 in the midstream regions (p < 0.05). From 2019 to 2021, this spatial pattern persisted, with downstream TSC remaining significantly higher than that of both upstream and midstream regions. This indicates that while TSC varies between years, it also exhibits strong spatial heterogeneity in different parts of the oasis. Overall, TSC showed a clear tendency to concentrate in downstream cropland.
Soil pH exhibited an initial increase followed by a decline from 2018 to 2021 (Figure 3b). The average pH values in 2019 (8.25 ± 0.33) and 2020 (8.19 ± 0.25) were significantly higher than those in 2021 (8.02 ± 0.30) and 2018 (7.75 ± 0.28) (p < 0.05). Spatially, pH generally presented a distribution sequence of upstream > midstream > downstream from 2019 to 2021 (Figure 3d). In 2018, no significant differences in pH were observed among the different zones. However, in 2019, the pH in the upstream (8.41 ± 0.32) was significantly higher than that in the midstream (8.25 ± 0.29) and downstream (8.01 ± 0.21) (p < 0.05). Similarly, in 2020, pH levels in the upstream (8.25 ± 0.22) and midstream (8.28 ± 0.28) were significantly higher than in the downstream (8.04 ± 0.17) (p < 0.05). By 2021, although pH values decreased across all zones, the upstream (8.10 ± 0.30) and midstream (7.95 ± 0.31) remained higher than the downstream (7.95 ± 0.27). This indicates that soil pH in oasis cropland was influenced primarily by interannual variation, whereas differences among zones remained comparatively stable. Across the oasis, soil pH in the upstream zone was generally higher than that in the midstream and downstream zones.

3.2. Spatiotemporal Class Structure and Transition Patterns of TSC and pH in Oasis Cropland

3.2.1. Annual Spatial Class Patterns of TSC and pH

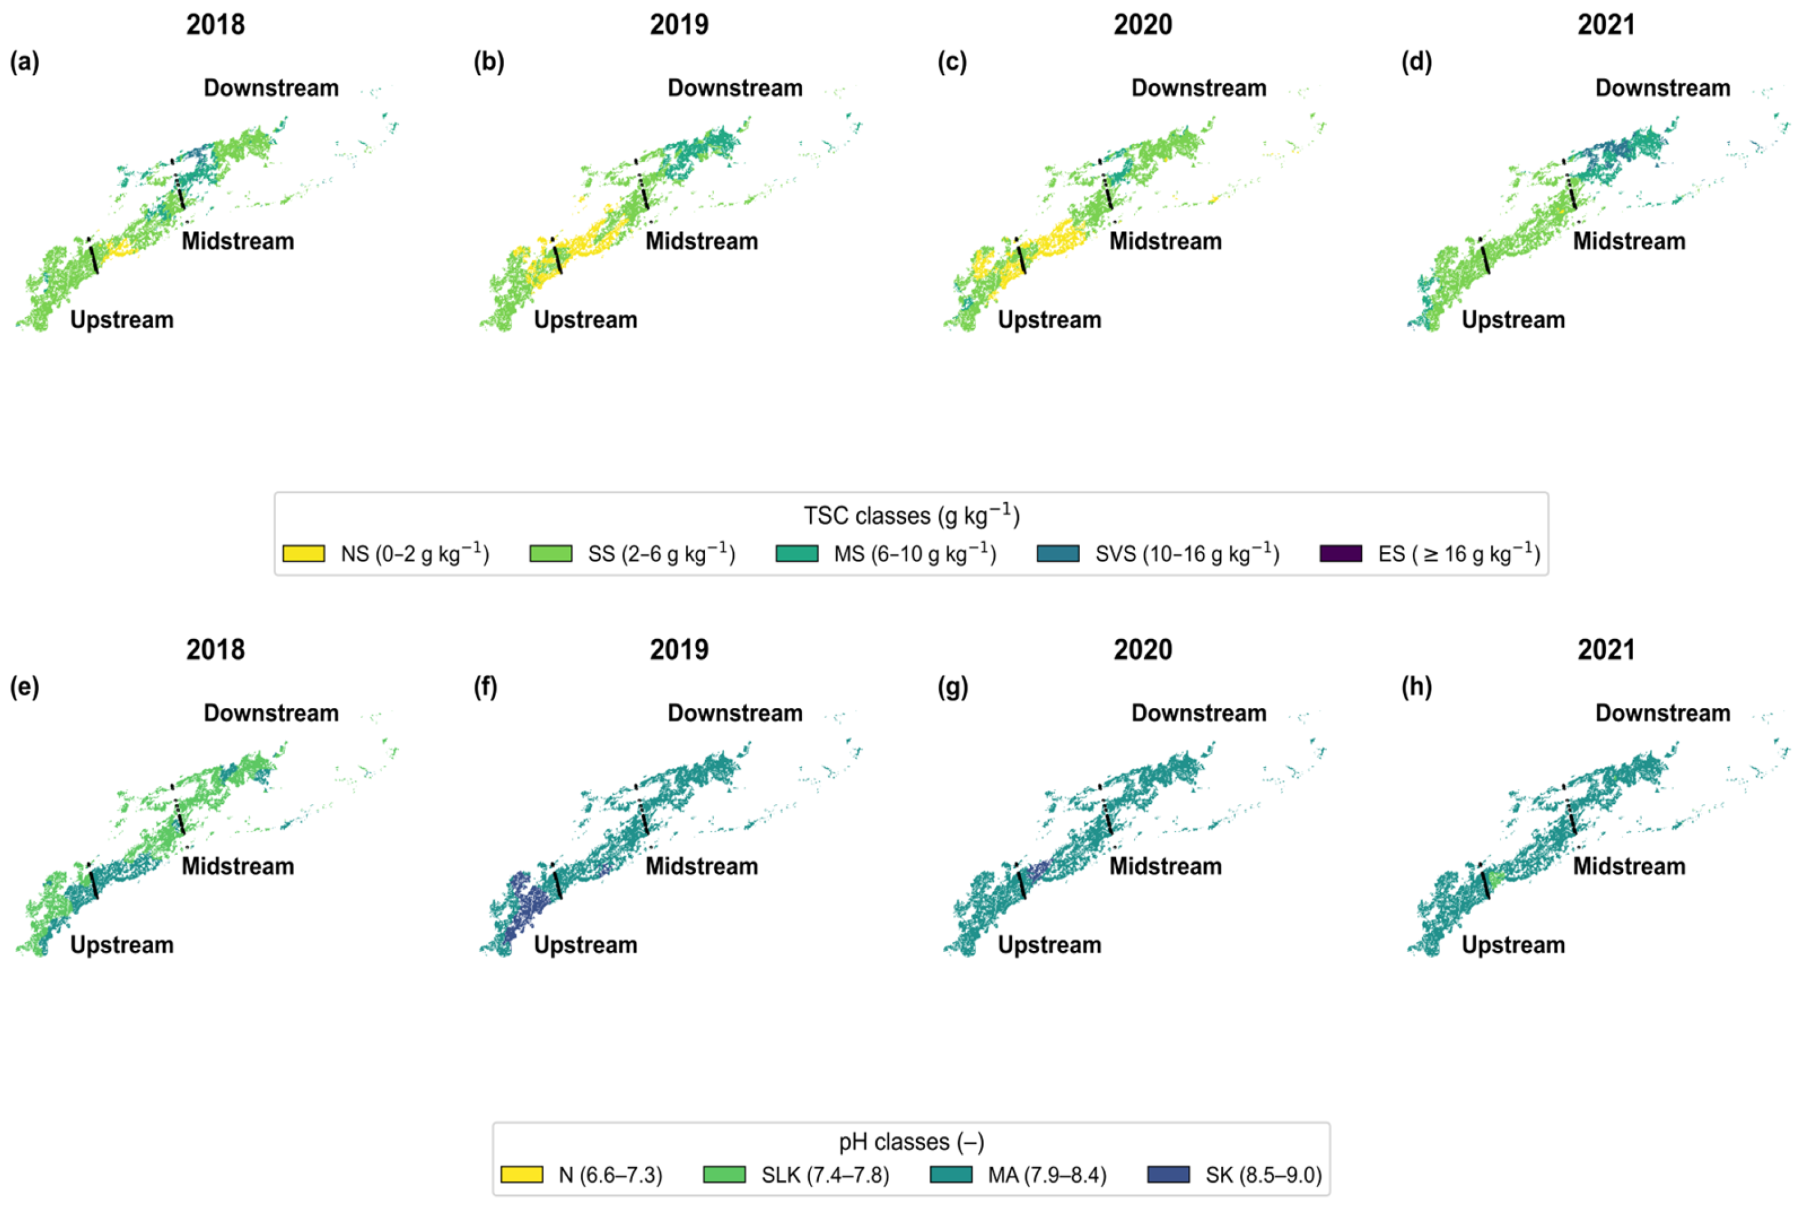
Figure 4 shows that the spatial class pattern of TSC remained strongly heterogeneous during 2018–2021 and was consistently organized along the upstream–midstream–downstream gradient. At the county scale, the slightly saline (SS) class remained dominant throughout the study period, covering 1355.38, 1064.69, 1244.13, and 1163.56 km2 from 2018 to 2021, respectively. Higher-salinity classes were mainly concentrated in downstream cropland. In 2018, the downstream zone already contained substantial moderately saline (MS) and severely saline (SVS) areas. In 2019, downstream cropland became predominantly MS. This pattern weakened temporarily in 2020, when non-saline (NS) land expanded markedly, but intensified again in 2021, when downstream cropland showed a clear increase in MS, SVS, and extremely saline (ES) classes. In contrast, the upstream and midstream zones remained dominated by lower-salinity classes. Overall, the annual maps indicate that stronger salinity expression was repeatedly concentrated in the downstream part of the oasis.
In contrast, the pH class pattern was simpler and more spatially uniform after 2019. No neutral (N) pixels were mapped during 2018–2021. In 2018, the county scale was dominated by the slightly alkaline (SLK) class (1222.00 km2), whereas from 2019 onward, the moderately alkaline (MA) class became dominant, reaching 1495.94, 1737.81, and 1754.25 km2 in 2019, 2020, and 2021, respectively. The strongly alkaline (SK) class occurred only locally and temporarily, mainly in the upstream zone in 2019 and the midstream zone in 2020, before disappearing in 2021. Therefore, unlike TSC, pH did not show a persistent downstream concentration pattern, but instead evolved toward widespread MA dominance across the oasis.

3.2.2. Areal Composition and Interannual Class Transitions of TSC and pH

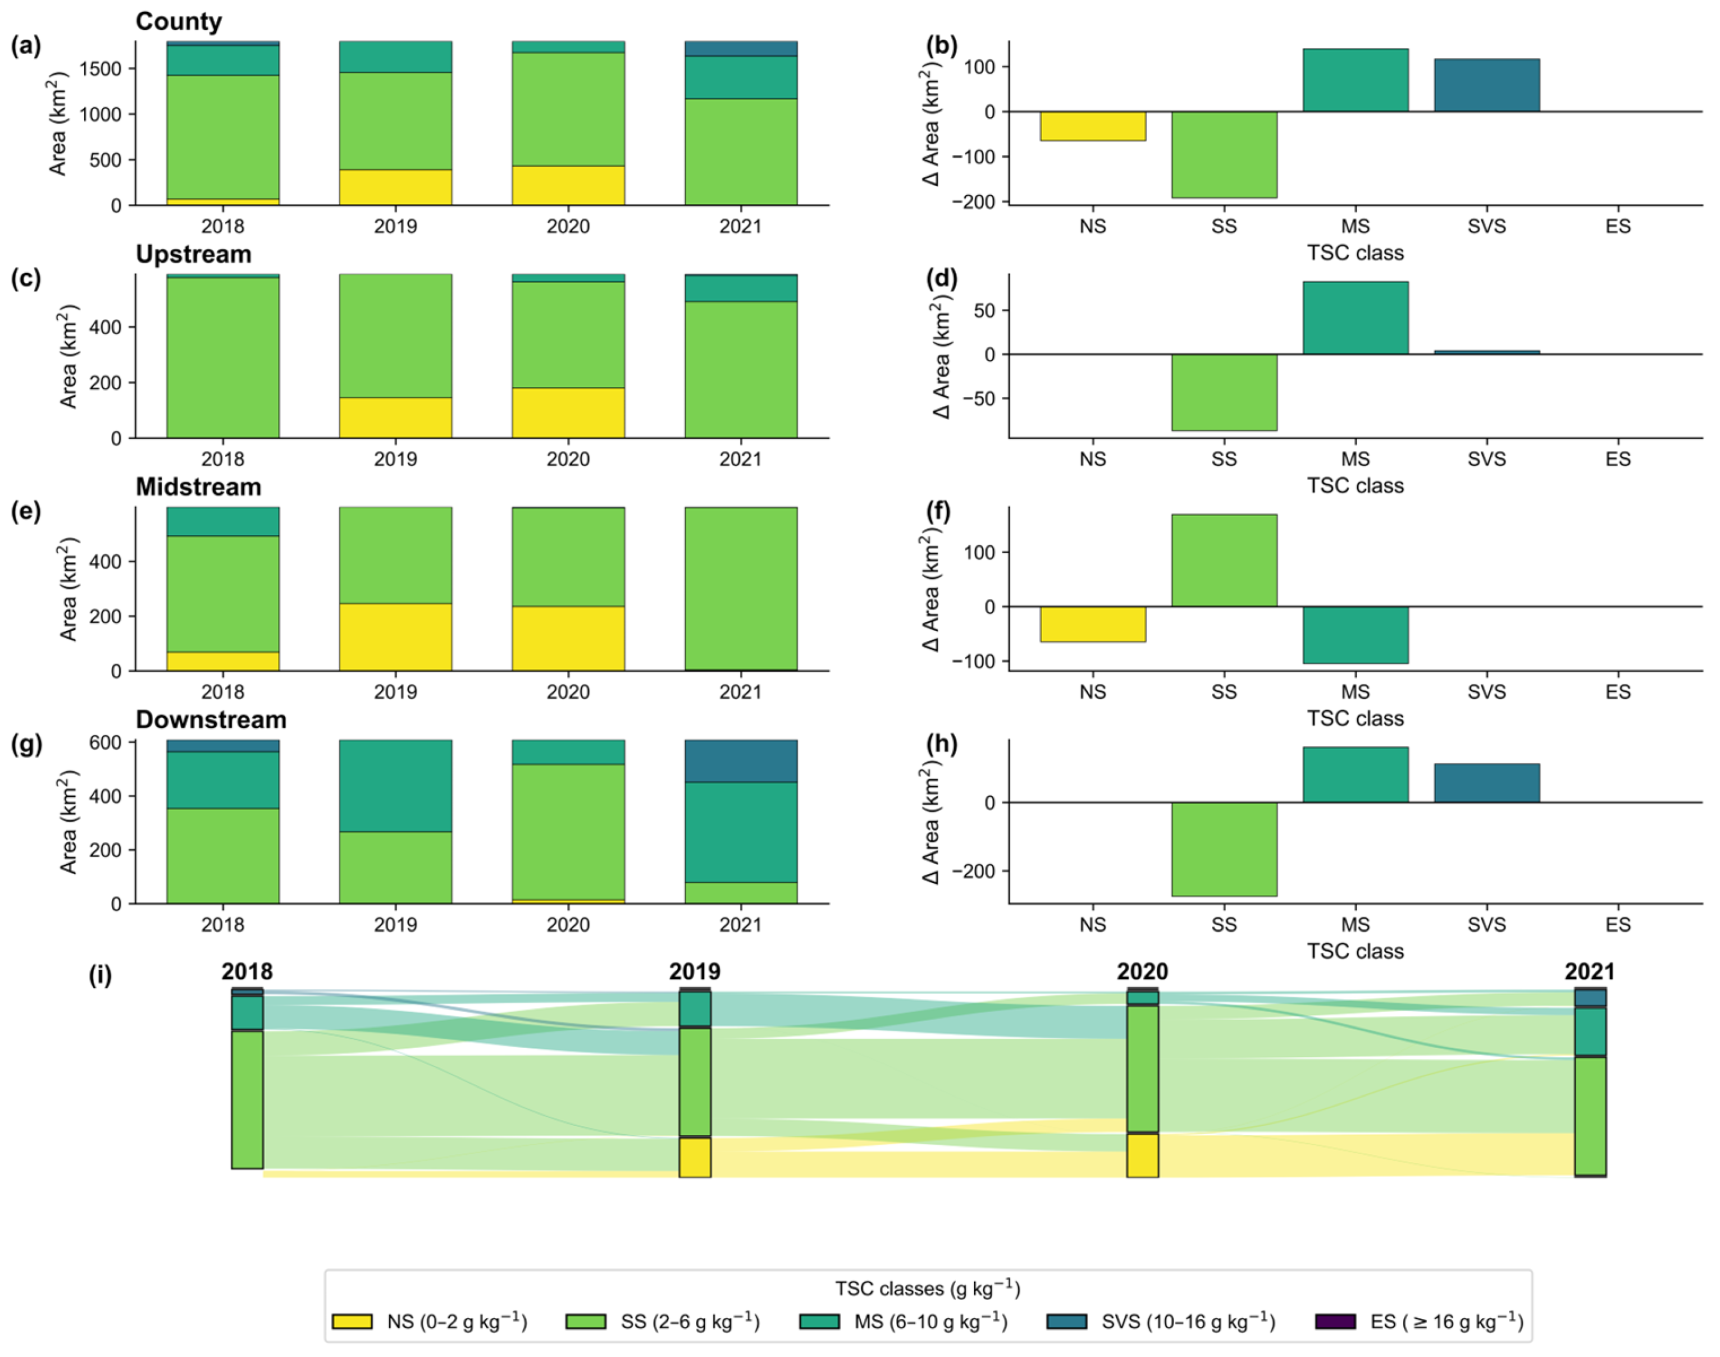
Figure 5 shows that the TSC class structure underwent substantial interannual reorganization. At the county scale, SS remained the dominant class in all four years, but the balance among salinity classes changed markedly. From 2018 to 2020, NS expanded from 68.63 to 430.63 km2, while MS and SVS decreased. This pattern reversed sharply in 2021, when NS declined to 3.94 km2, whereas MS and SVS increased to 468.38 and 160.88 km2, respectively, and ES appeared in a very small area. The transition results show that the 2020–2021 rebound was mainly driven by conversions from lower-salinity to higher-salinity classes, especially NS → SS, SS → MS, and SS → SVS. This reorganization was most pronounced in the downstream zone, where SS decreased sharply and higher-salinity classes expanded substantially. By comparison, the upstream zone showed only a moderate increase in MS, while the midstream zone remained largely dominated by SS. These results indicate that the county-scale mitigation–rebound sequence was mainly driven by strong downstream reorganization.
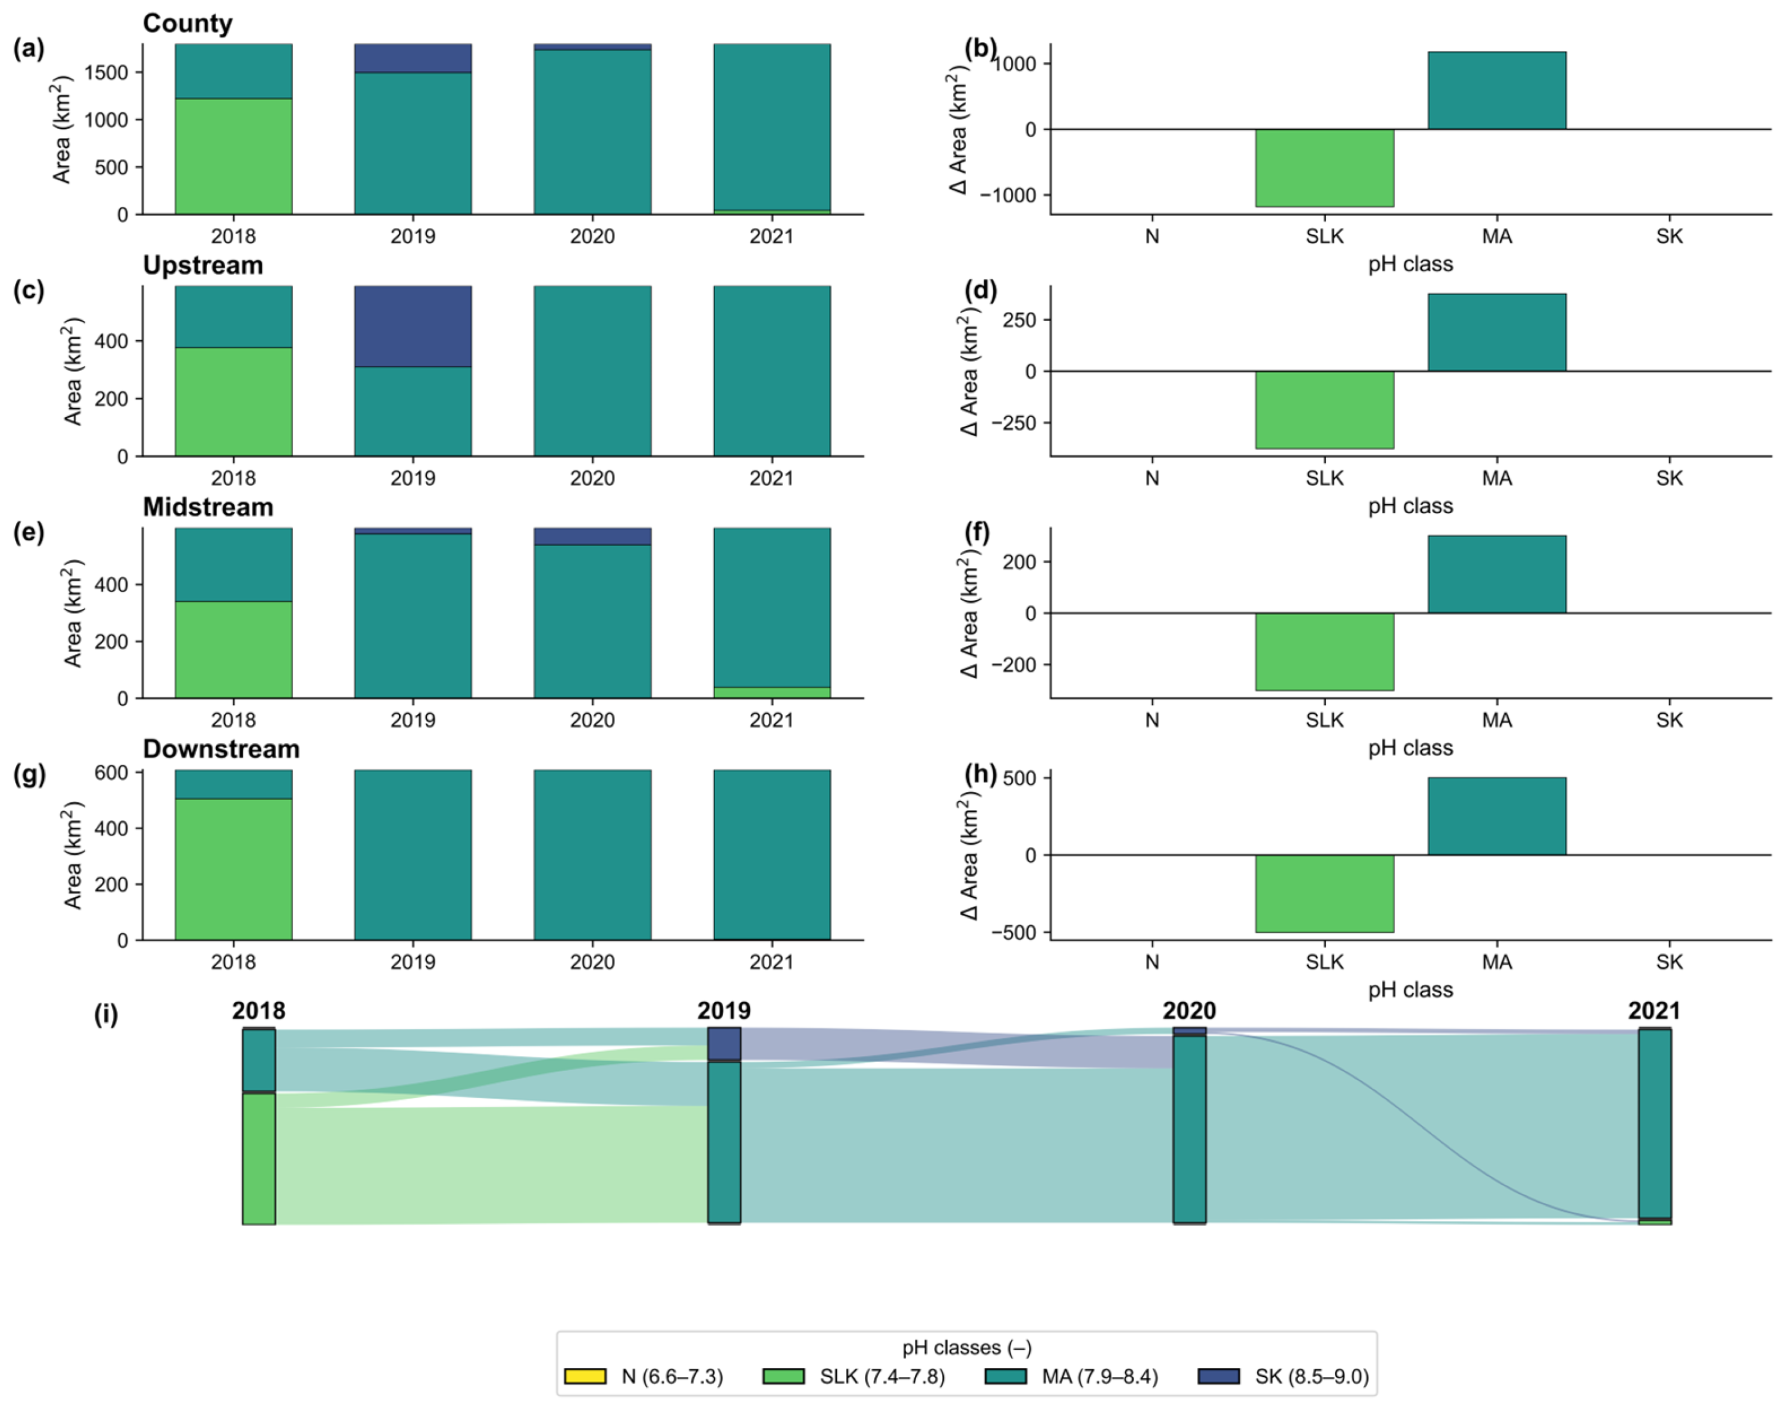
Compared with TSC, Figure 6 shows a much more constrained pH class structure and weaker class turnover. At the county scale, the mapped pH pattern shifted from SLK-dominant in 2018 to MA-dominant in 2019–2021. Specifically, SLK occupied 1222.00 km2 in 2018 but disappeared in 2019–2020 and reappeared only over 42.69 km2 in 2021. In contrast, MA increased from 574.94 km2 in 2018 to 1495.94 km2 in 2019 and remained dominant thereafter. SK was only temporary, covering 301.00 km2 in 2019 and 59.13 km2 in 2020, before disappearing in 2021. The main transition pathway over 2018–2021 was SLK → MA, indicating that pH evolution was dominated by redistribution among adjacent alkaline classes rather than by persistent expansion of the highest category. Overall, pH transitions were more limited and spatially localized than those of TSC.

3.3. Hotspot Recurrence and Centroid Migration of TSC and pH

3.3.1. Hotspot Recurrence

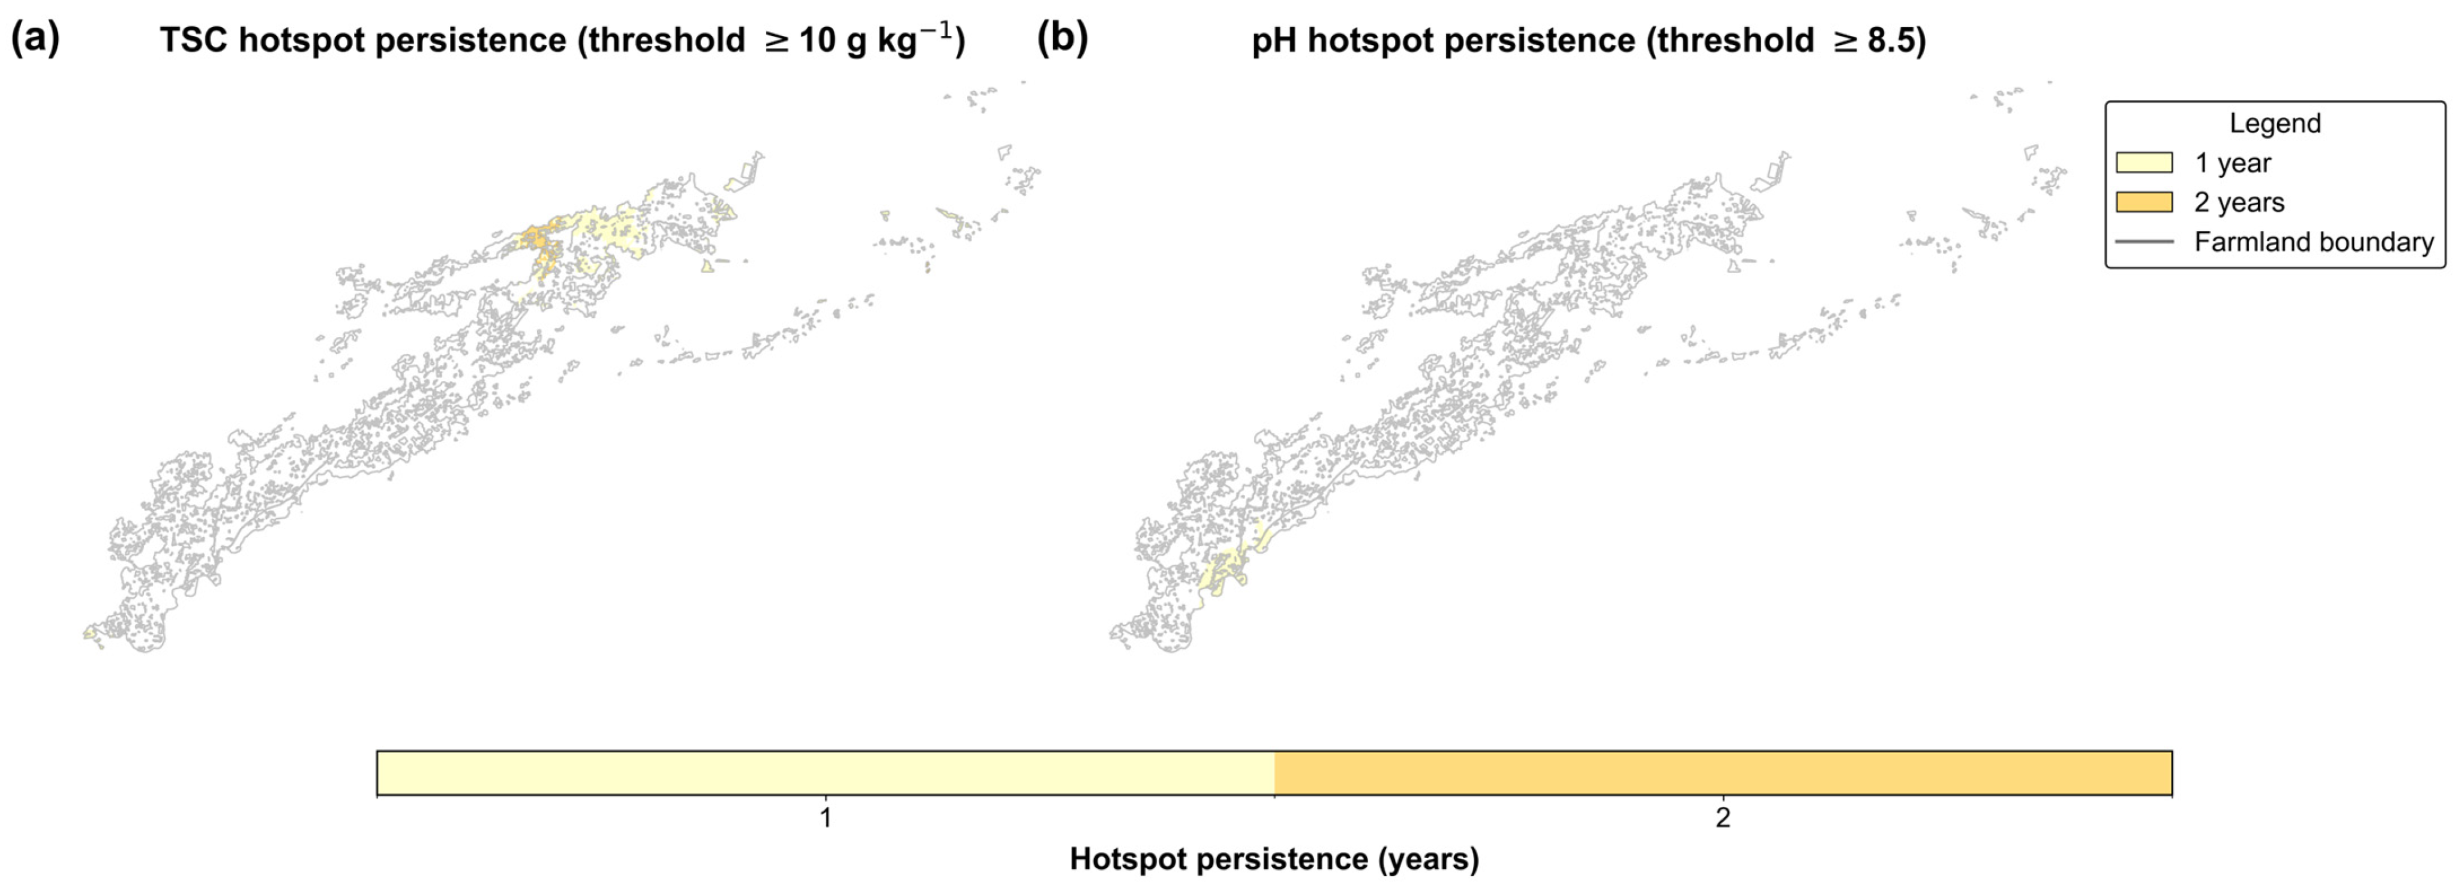
Figure 7 shows a clear contrast between the hotspot behavior of TSC and that of pH. For TSC, hotspot occurrence was temporally intermittent but spatially recurrent. Severe-salinity hotspots covered 36.38 km2 in 2018, of which 99.6% occurred in downstream cropland. No TSC hotspots were detected in 2019 or 2020. In 2021, they reappeared and expanded to 143.15 km2, with 139.66 km2 again concentrated in the downstream zone. No severe-salinity hotspots were identified in the midstream zone throughout 2018–2021. These results indicate that TSC hotspots varied strongly among years in area, but remained spatially constrained to the downstream part of the oasis cropland system.
By contrast, pH hotspots showed much weaker recurrence. Areas with pH ≥ 8.5 were detected only in 2019, covering 53.30 km2 at the county scale. These hotspots were concentrated mainly in the upstream zone, where they accounted for 8.77% of cropland, with only limited occurrence in the midstream zone and none in the downstream zone. Therefore, unlike TSC hotspots, high-pH hotspots did not show repeated reappearance in the same spatial sector over the four-year period, but instead represented a short-lived upstream alkalinity anomaly.

3.3.2. Intensity-Weighted Centroid Migration of Hotspots

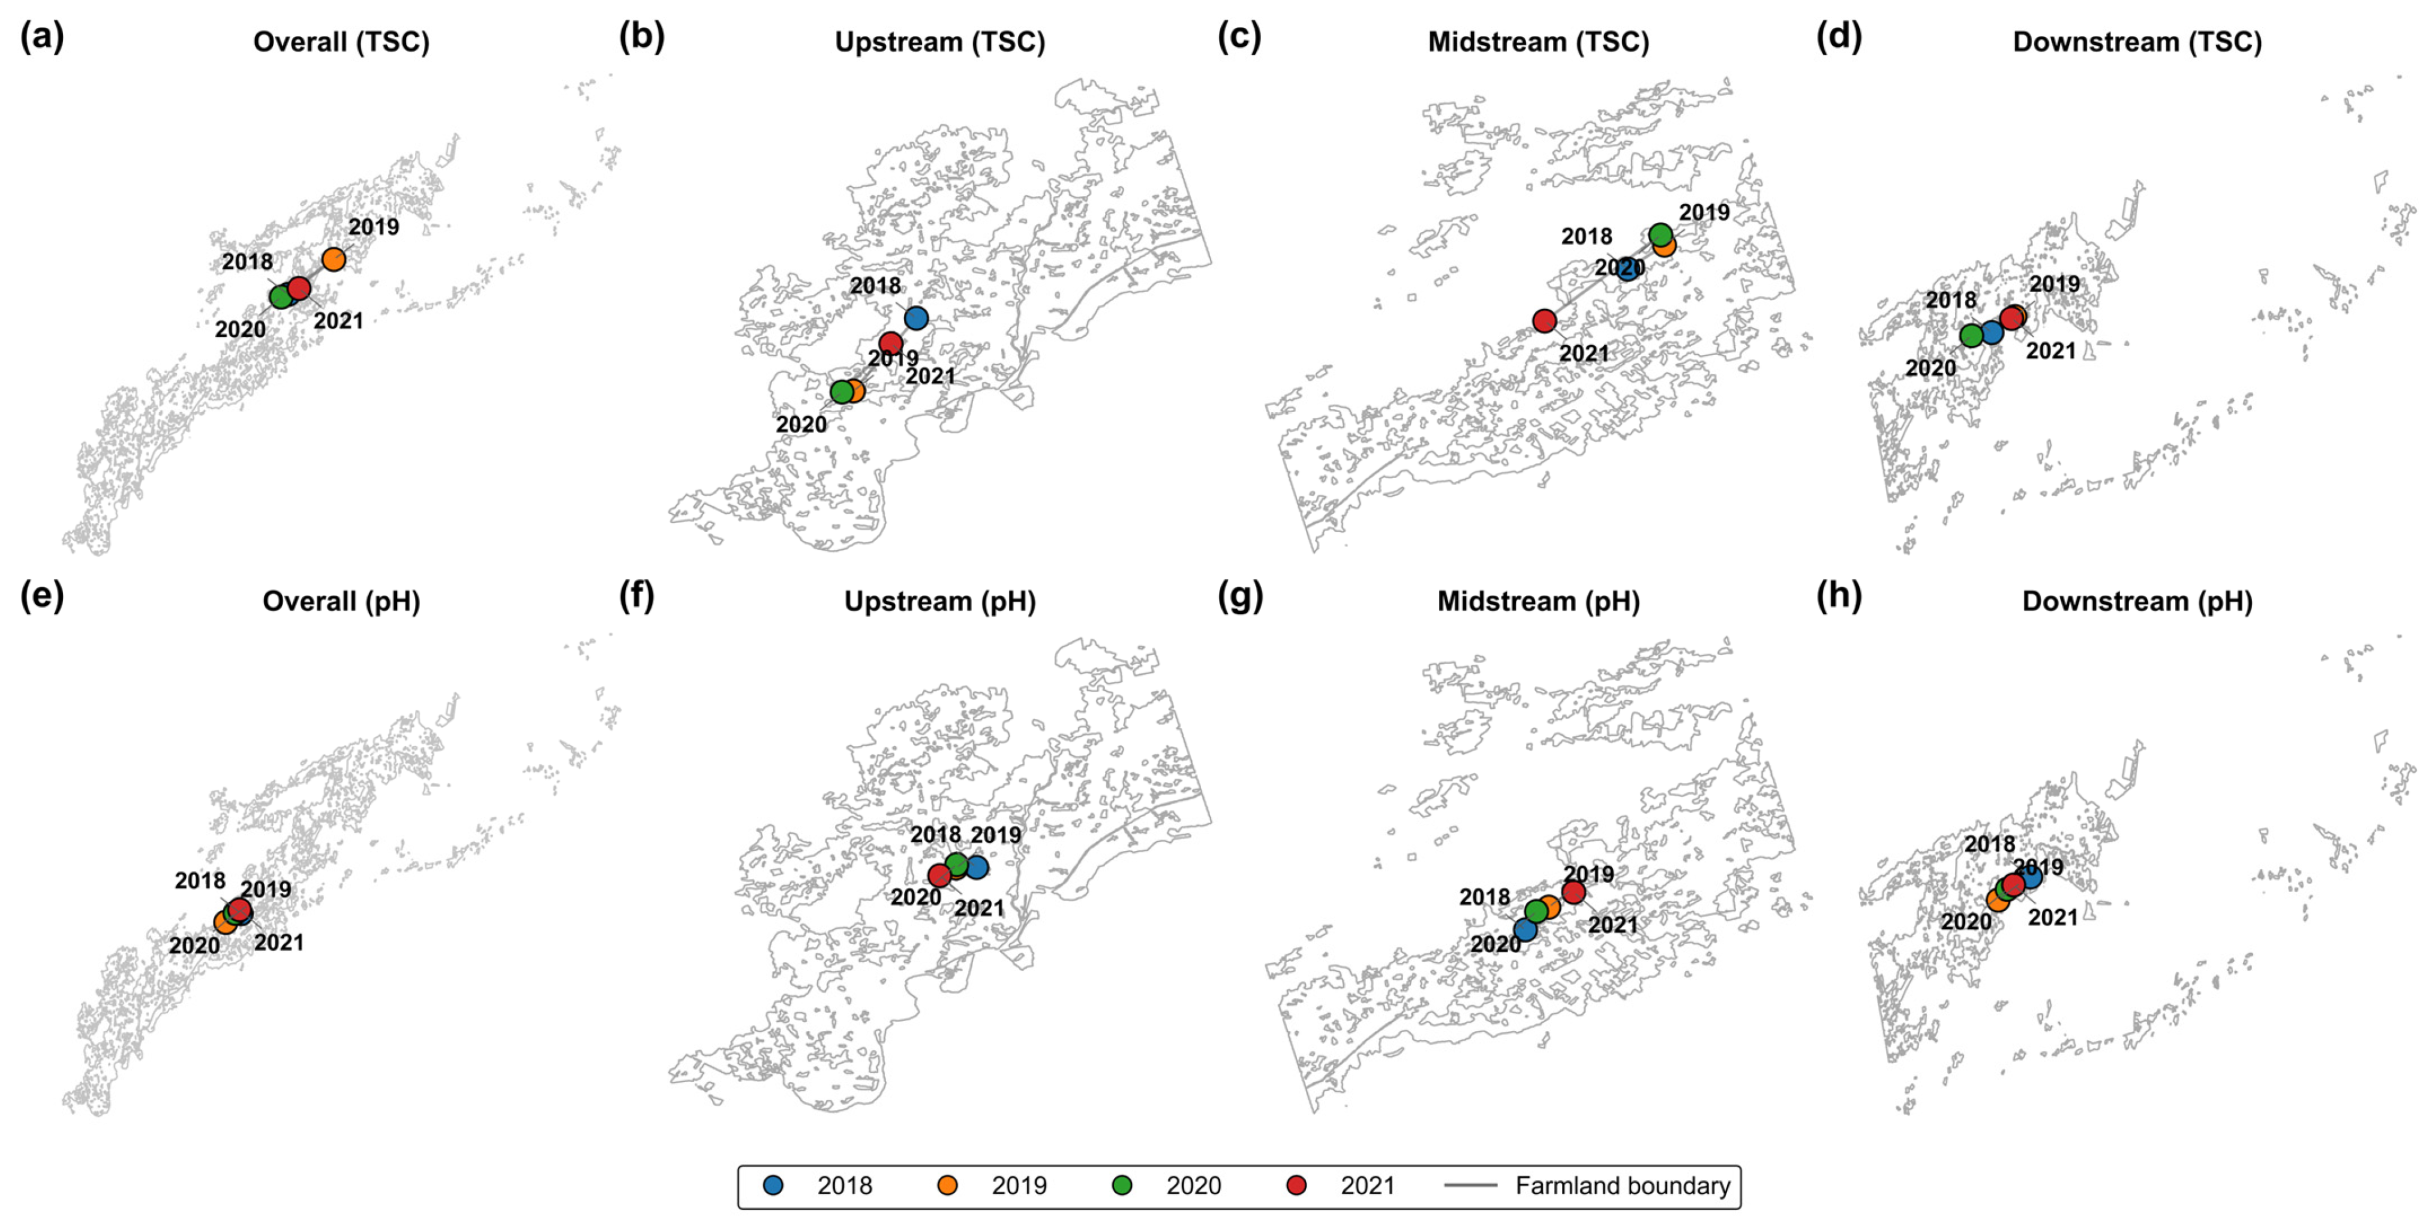
The intensity-weighted centroids of TSC and pH were used to summarize interannual shifts in the spatial focus of salinity and alkalinity (Figure 8; Table 3). At the county scale, TSC centroids showed substantial interannual oscillation, with annual displacements of 18.30, 20.66, and 6.53 km during 2018–2019, 2019–2020, and 2020–2021, respectively. However, the net displacement across 2018–2021 was only 4.10 km. This contrast between relatively large annual movement and small net shift indicates that the spatial focus of salinity oscillated within a constrained spatial envelope rather than migrating systematically across the oasis. At the zonal scale, the largest net displacement occurred in the midstream zone (9.64 km), whereas the upstream and downstream zones remained lower at 3.12 km and 4.66 km, respectively.
Compared with TSC, pH centroids were more spatially stable at the county scale. Annual displacements decreased from 5.78 km to 4.03 km and then to 1.60 km, while the net displacement over 2018–2021 was only 1.11 km. At the zonal scale, the midstream zone again showed the largest net shift (6.20 km), whereas the upstream and downstream zones remained smaller (2.92 km and 3.73 km, respectively). Taken together, the hotspot maps and centroid trajectories indicate stronger interannual spatial variability for salinity than for pH, but they also show that the salinity focus did not undergo sustained directional migration. Instead, high-risk salinity areas repeatedly re-emerged within a structurally constrained downstream sink zone.

3.4. Environmental Gradient Structure of TSC and pH in PCA Space

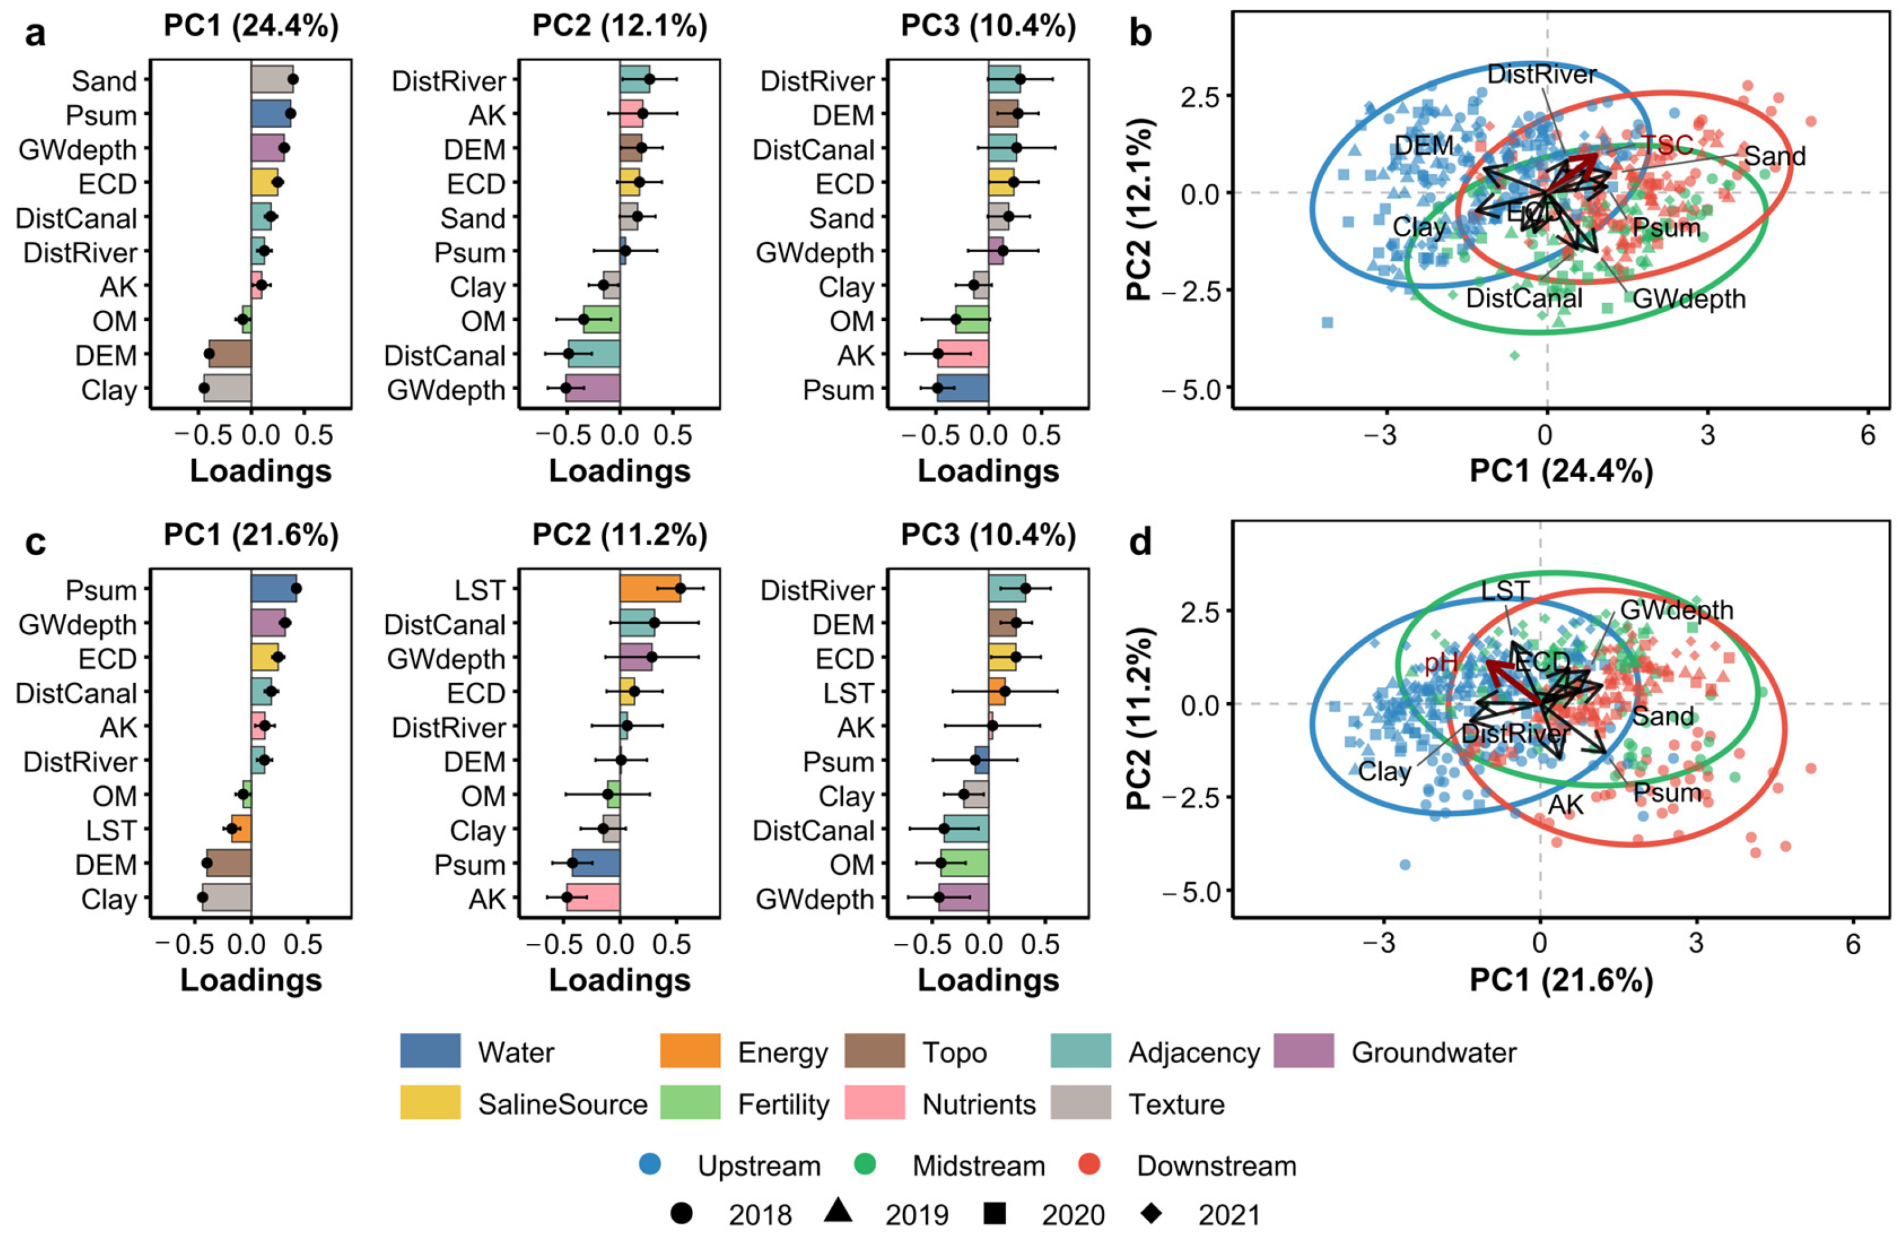
Figure 9 summarizes the principal component analysis (PCA) of environmental covariates, with TSC and pH projected as supplementary variables to visualize their alignment with the dominant multivariate gradients. The first three principal components explained 47.0% of the total variance in the TSC-related dataset and 43.3% in the pH-related dataset. In both analyses, PC1 explained 21.6–24.4% of the variance and represented a broad longitudinal texture–topography gradient across the oasis, with positive loadings associated mainly with sand content and total precipitation, and negative loadings associated mainly with clay content and elevation. This axis separated downstream sites from upstream sites along the PC1 direction. PC2 explained 11.2–12.1% of the variance, but its environmental meaning differed between the two PCA spaces. In the TSC-related PCA, PC2 was more closely associated with groundwater depth and distance to canals, whereas in the pH-related PCA it was more strongly associated with land surface temperature. PC3 explained 10.4% of the variance in both analyses and reflected secondary variation related to nutrient background and river proximity. Overall, these axes describe broad environmental organization across the oasis rather than direct causal controls on soil properties.
The supplementary projections further indicate that TSC and pH occupied different positions within the same multivariate gradient space. TSC was positively correlated with both PC1 (r = 0.299) and PC2 (r = 0.318), and its vector projected toward the upper-right quadrant of the PC1–PC2 plane, close to the downstream cluster. In contrast, pH was negatively correlated with PC1 (r = −0.320) but positively correlated with PC2 (r = 0.356), and its vector projected toward the upper-left quadrant, closer to the upstream cluster. These contrasting projection directions indicate that TSC and pH were aligned with partly different combinations of environmental gradients across the oasis. However, because the supplementary correlations with PC1 and PC2 were only modest (|r| ≈ 0.30–0.36), the PCA biplots should be interpreted as showing coarse multivariate alignment rather than strong or exhaustive explanation of TSC and pH variation. In this sense, salinity was more closely aligned with the downstream texture–hydrology gradient, whereas pH was more closely aligned with an upstream-oriented gradient that included a stronger thermal component.

4. Discussion

The decrease in TSC from 2018 to 2020, followed by the marked rebound in 2021, should be interpreted as a short-term interannual sequence rather than as a robust long-term trend. When considered together with the annual and pre-sampling precipitation information, the 2021 rebound is more plausibly interpreted as a response to short-term hydroclimatic forcing superimposed on a sensitive irrigation–groundwater system, rather than as evidence of directional long-term deterioration [35,36,37,38]. In arid irrigated regions, small shifts in leaching opportunity, drainage efficiency, groundwater depth, and seasonal water–salt redistribution can rapidly alter topsoil salt expression, especially where leaching thresholds are not stably maintained [39,40,41,42]. This interpretation is also consistent with studies showing that water-saving practices can improve salinity status in some years while still leaving the system vulnerable to rebound under less favorable water-balance conditions [43,44,45].
A central finding of this study is that severe salinity risk did not migrate freely across the oasis, but repeatedly re-emerged in the downstream cropland belt. Therefore, the absence of TSC hotspots (≥10 g kg−1) in 2019 and 2020 should not be interpreted as permanent removal of salinity risk, but as temporary weakening of threshold exceedance within the same downstream accumulation structure [46,47]. This interpretation is consistent with studies on groundwater salinity showing that different spatiotemporal behaviors, evaporative concentrations, and oasis lowland positions can maintain latent downstream salinization risk even when hotspot extent contracts in particular years [48]. It is also supported by drainage and saline-irrigation studies showing that threshold exceedance can vary strongly from year to year, while the same poorly drained sectors remain structurally vulnerable to renewed salt accumulation [49,50,51,52,53].
TSC and pH did not respond in parallel. TSC showed sharper class reorganization, stronger downstream concentration, and repeated hotspot recurrence, whereas pH was more spatially restricted and temporally short-lived. This divergence is reasonable because soluble salts respond rapidly to irrigation, leaching, evaporation, and shallow groundwater exchange, while soil pH is comparatively buffered by carbonate chemistry, soil properties, climatic setting, and vegetation-related processes [54,55,56,57]. Therefore, pH may complement TSC in diagnosis, but it should not be used as a direct surrogate for salinity severity in oasis cropland assessment.
The practical implication is that downstream cropland should be prioritized not only for routine monitoring, but also for coordinated salt-export management. Relevant measures include maintaining effective drainage, preserving adequate leaching opportunity under water-saving irrigation, and combining hydrological regulation with soil-improvement practices such as biochar or mixed organic–inorganic amendments where field conditions allow [58,59,60]. In addition, measures such as straw returning, long-term mulched drip-irrigation optimization, and bio-organic fertilizer amendment can improve soil quality, nutrient availability, aggregate stability, and salinity buffering, thereby strengthening the resilience of saline cropland systems [61,62,63]. At the same time, the limitations of this study should be stated clearly: four annual observations are sufficient to describe a mitigation–rebound sequence, but not to establish a statistically robust long-term trend.
Taken together, the results support the first hypothesis that salinity dynamics in oasis cropland are expressed more as spatially constrained interannual reorganization than as free migration across the landscape, as shown by the repeated downstream recurrence of severe-salinity areas despite marked year-to-year fluctuation in hotspot extent. They also support the second hypothesis that TSC and pH reflect partly different environmental responses, because the two indicators differed in class transitions, hotspot behavior, centroid stability, and multivariate environmental alignment. Therefore, the main contribution of this study is not merely to show that TSC and pH should not be interpreted as interchangeable indicators, but to demonstrate that short-term salinity mitigation can coexist with persistent structural vulnerability in downstream cropland, and that oasis soil assessment should integrate temporal fluctuation, spatial recurrence, and indicator-specific interpretation within a zone-based management framework.

5. Conclusions

Topsoil salinity in Bachu oasis cropland showed a clear mitigation–rebound pattern during 2018–2021, but this temporal fluctuation did not translate into free spatial migration. Instead, severe-salinity areas repeatedly re-emerged in downstream cropland, indicating that short-term weakening of salinity intensity can coexist with persistent structural vulnerability in the same part of the oasis. In contrast, pH showed weaker hotspot recurrence, greater spatial stability, and a different multivariate environmental alignment, demonstrating that TSC and pH reflect partly different soil–environment relationships and should not be treated as interchangeable indicators in oasis salinity assessment. The main practical implication is that salinity monitoring and management in arid oasis cropland should not rely only on county-scale annual averages or single-date maps. Greater priority should be given to downstream cropland that repeatedly functions as a salinity sink, and management should combine zone-specific diagnosis with targeted drainage–leaching regulation and soil-improvement measures. More broadly, the results provide a clearer basis for distinguishing transient salinity fluctuation from structurally persistent accumulation, which is essential for identifying where management intervention is most urgently needed in oasis irrigation systems. Future work should extend the observation period and incorporate deeper soil layers and longer hydroclimatic records in order to better resolve long-term salinity evolution and the coupling between surface and subsurface salt dynamics.

Author Contributions

Conceptualization, Y.X., M.T. and H.G.; methodology, Y.X.; software, Y.X.; validation, K.J., H.Y. and M.T.; formal analysis, Y.X.; investigation, Y.X. and K.J.; resources, M.T.; data curation, H.G.; writing—original draft preparation, Y.X.; writing—review and editing, H.Y. and H.G.; visualization, Y.X.; supervision, H.G.; project administration, M.T. and H.G.; funding acquisition, M.T. and H.G. All authors have read and agreed to the published version of the manuscript.

Funding

This research was supported by the Xinjiang Uygur Autonomous Region Key Scientific Research and Development Project ‘Development of Techniques for Reducing Soil Impeding Factors and Novel Amendments for Saline-Alkali Farmland in Xinjiang’ (2023B02002) and the Autonomous Region Key Talent Cultivation Project for Agriculture, Rural Areas and Farmers ‘Research on Sky-Ground Dynamic Monitoring and Improvement Techniques for Soil Salinization in Xinjiang Farmland’ (2024SNGGGCC043).

Data Availability Statement

Restrictions apply to the availability of these data. Data were obtained from the Xinjiang Uygur Autonomous Region Cultivated Land Quality Monitoring and Protection Center and are available from Haibin Gu with the permission of the Xinjiang Uygur Autonomous Region Cultivated Land Quality Monitoring and Protection Center.

Conflicts of Interest

The authors state that there are no known financial conflicts of interest or personal relationships that could have influenced the findings presented in this paper.

References

  1. Shokri, N.; Hassani, A.; Sahimi, M. Multi-Scale Soil Salinization Dynamics from Global to Pore Scale: A Review. Rev. Geophys. 2024, 62, e2023RG000804. [Google Scholar] [CrossRef] [Scilit]
  2. Singh, A. Soil Salinization Management for Sustainable Development: A Review. J. Environ. Manag. 2021, 277, 111383. [Google Scholar] [CrossRef] [Scilit]
  3. Tarolli, P.; Luo, J.; Park, E.; Barcaccia, G.; Masin, R. Soil Salinization in Agriculture: Mitigation and Adaptation Strategies Combining Nature-Based Solutions and Bioengineering. iScience 2024, 27, 108830. [Google Scholar] [CrossRef] [Scilit]
  4. Lian, X.; Piao, S.; Chen, A.; Huntingford, C.; Fu, B.; Li, L.Z.X.; Huang, J.; Sheffield, J.; Berg, A.M.; Keenan, T.F.; et al. Multifaceted Characteristics of Dryland Aridity Changes in a Warming World. Nat. Rev. Earth Environ. 2021, 2, 232–250. [Google Scholar] [CrossRef] [Scilit]
  5. Perri, S.; Molini, A.; Hedin, L.O.; Porporato, A. Contrasting Effects of Aridity and Seasonality on Global Salinization. Nat. Geosci. 2022, 15, 375–381. [Google Scholar] [CrossRef] [Scilit]
  6. Scanlon, B.R.; Fakhreddine, S.; Rateb, A.; De Graaf, I.; Famiglietti, J.; Gleeson, T.; Grafton, R.Q.; Jobbagy, E.; Kebede, S.; Kolusu, S.R.; et al. Global Water Resources and the Role of Groundwater in a Resilient Water Future. Nat. Rev. Earth Environ. 2023, 4, 87–101. [Google Scholar] [CrossRef] [Scilit]
  7. Zhao, J.; Fan, Y.; Xuan, J.; Shi, M.; Wang, D.; Wu, H.; Bi, Y.; Li, Y. Monitoring of Soil Salinization and Analysis of Driving Factors in the Oasis Zone of South Xinjiang. Land 2025, 14, 803. [Google Scholar] [CrossRef] [Scilit]
  8. Seydehmet, J.; Lv, G.-H.; Abliz, A.; Shi, Q.-D.; Abliz, A.; Turup, A. Irrigation Salinity Risk Assessment and Mapping in Arid Oasis, Northwest China. Water 2018, 10, 966. [Google Scholar] [CrossRef] [Scilit]
  9. Wang, Y.; Xiao, D.; Li, Y.; Li, X. Soil Salinity Evolution and Its Relationship with Dynamics of Groundwater in the Oasis of Inland River Basins: Case Study from the Fubei Region of Xinjiang Province, China. Environ. Monit. Assess. 2008, 140, 291–302. [Google Scholar] [CrossRef] [Scilit] [PubMed]
  10. Lv, T.; Kang, S.; Liu, Y.; Bian, M.; Tong, L.; Li, W. Analysis of Driving Factors of Soil Salinity in Southern Xinjiang Irrigation Areas under Dry-Sowing and Wet-Emerging Conditions. Agric. Water Manag. 2025, 322, 109962. [Google Scholar] [CrossRef] [Scilit]
  11. Zeng, T.; Li, Y.; Ma, L.; Kong, L.; Zhang, J.; Abuduwaili, J. Unveiling Latent Interaction Mechanisms Influencing the Spatial Pattern of Soil Salinity in Arid Oases: Insights from Integrated Modeling. CATENA 2025, 250, 108769. [Google Scholar] [CrossRef] [Scilit]
  12. Xiao, Y.; Hu, W.; Zhang, Y.; Zhao, Z.; Qin, G.; Chen, H.; Wang, L.; Yang, S.; Wang, J.; Pei, Q.; et al. Spatiotemporal Variation and Driving Forces of Soil Salinization in the Lower Reach of Arid Endorheic Basins: Critical Role of Lake System and Groundwater Overflow. Agric. Water Manag. 2025, 315, 109568. [Google Scholar] [CrossRef] [Scilit]
  13. Zhang, J.; Ding, J.; Zhang, Z.; Wang, J.; Zeng, X.; Ge, X. Study on the Inversion and Spatiotemporal Variation Mechanism of Soil Salinization at Multiple Depths in Typical Oases in Arid Areas: A Case Study of Wei-Ku Oasis. Agric. Water Manag. 2025, 315, 109542. [Google Scholar] [CrossRef] [Scilit]
  14. Ma, S.; He, B.; Xie, B.; Ge, X.; Han, L. Investigation of the Spatial and Temporal Variation of Soil Salinity Using Google Earth Engine: A Case Study at Werigan–Kuqa Oasis, West China. Sci. Rep. 2023, 13, 2754. [Google Scholar] [CrossRef] [Scilit] [PubMed]
  15. Wang, F.; Wei, Y.; Yang, S. Spatio-Temporal Changes in Subsurface Soil Salinity Based on Electromagnetic Induction and Environmental Covariates at the Tarim River Basin, Southern Xinjiang, China. Comput. Electron. Agric. 2025, 232, 110108. [Google Scholar] [CrossRef] [Scilit]
  16. Ge, X.; Ding, J.; Teng, D.; Wang, J.; Huo, T.; Jin, X.; Wang, J.; He, B.; Han, L. Updated Soil Salinity with Fine Spatial Resolution and High Accuracy: The Synergy of Sentinel-2 MSI, Environmental Covariates and Hybrid Machine Learning Approaches. CATENA 2022, 212, 106054. [Google Scholar] [CrossRef] [Scilit]
  17. Gao, Z.; Li, X.; Zuo, L.; Zou, B.; Wang, B.; Wang, W.J. Unveiling Soil Salinity Patterns in Soda Saline-Alkali Regions Using Sentinel-2 and SDGSAT-1 Thermal Infrared Data. Remote Sens. Environ. 2025, 322, 114708. [Google Scholar] [CrossRef] [Scilit]
  18. Tashpolat, N.; Reheman, A. Monitoring of Soil Salinity in the Weiku Oasis Based on Feature Space Models with Typical Parameters Derived from Sentinel-2 MSI Images. Land 2025, 14, 251. [Google Scholar] [CrossRef] [Scilit]
  19. Xiong, J.; Ge, X.; Ding, J.; Wang, J.; Zhang, Z.; Zhu, C.; Han, L.; Wang, J. Optimal Time-Window for Assessing Soil Salinity via Sentinel-2 Multitemporal Synthetic Data in the Arid Agricultural Regions of China. Ecol. Indic. 2025, 176, 113642. [Google Scholar] [CrossRef] [Scilit]
  20. Shi, S.; Wang, N.; Chen, S.; Hu, B.; Peng, J.; Shi, Z. Digital Mapping of Soil Salinity with Time-Windows Features Optimization and Ensemble Learning Model. Ecol. Inform. 2025, 85, 102982. [Google Scholar] [CrossRef] [Scilit]
  21. Nurmemet, I.; Aihaiti, A.; Aili, Y.; Lv, X.; Li, S.; Qin, Y. Quantitative Retrieval of Soil Salinity in Arid Regions: A Radar Feature Space Approach with Fully Polarimetric SAR Data. Sensors 2025, 25, 2512. [Google Scholar] [CrossRef] [Scilit] [PubMed]
  22. Wang, J.; Ding, J.; Wang, Y.; Ge, X.; Lizaga, I.; Chen, X. Soil Salinization in Drylands: Measure, Monitor, and Manage. Ecol. Indic. 2025, 175, 113608. [Google Scholar] [CrossRef] [Scilit]
  23. Kumar, P.; Tiwari, P.; Biswas, A.; Kumar Srivastava, P. Spatio-Temporal Assessment of Soil Salinization Utilizing Remote Sensing Derivatives, and Prediction Modeling: Implications for Sustainable Development. Geosci. Front. 2024, 15, 101881. [Google Scholar] [CrossRef] [Scilit]
  24. Kramer, I.; Mau, Y. Review: Modeling the Effects of Salinity and Sodicity in Agricultural Systems. Water Resour. Res. 2023, 59, e2023WR034750. [Google Scholar] [CrossRef] [Scilit]
  25. Stavi, I.; Thevs, N.; Priori, S. Soil Salinity and Sodicity in Drylands: A Review of Causes, Effects, Monitoring, and Restoration Measures. Front. Environ. Sci. 2021, 9, 712831. [Google Scholar] [CrossRef] [Scilit]
  26. Chen, Z.; Yin, Y.; Gong, H.; Wang, H.; Ying, H.; Zhang, H.; Cui, Z. National-Scale Assessment of Soil pH Change in Chinese Croplands from 1980 to 2018. Agronomy 2025, 15, 2775. [Google Scholar] [CrossRef] [Scilit]
  27. Zhang, Y.; Ye, H.; Liu, R.; Tang, M.; Nie, C.; Han, X.; Zhao, X.; Wei, P.; Wen, F. Spatial and Temporal Variations of Soil pH in Farmland in Xinjiang, China over the Past Decade. Agriculture 2024, 14, 1048. [Google Scholar] [CrossRef] [Scilit]
  28. Wang, W.; Chen, Y.; Wang, W.; Jiang, J.; Cai, M.; Xu, Y. Evolution Characteristics of Groundwater and Its Response to Climate and Land-Cover Changes in the Oasis of Dried-up River in Tarim Basin. J. Hydrol. 2021, 594, 125644. [Google Scholar] [CrossRef] [Scilit]
  29. Shi, H.; Luo, G.; Sutanudjaja, E.H.; Hellwich, O.; Chen, X.; Ding, J.; Wu, S.; He, X.; Chen, C.; Ochege, F.U.; et al. Recent Impacts of Water Management on Dryland’s Salinization and Degradation Neutralization. Sci. Bull. 2023, 68, 3240–3251. [Google Scholar] [CrossRef] [Scilit]
  30. Goovaerts, P. Geostatistics in Soil Science: State-of-the-Art and Perspectives. Geoderma 1999, 89, 1–45. [Google Scholar] [CrossRef] [Scilit]
  31. Obroślak, R.; Dorozhynskyy, O. Selection of a Semivariogram Model in the Study of Spatial Distribution of Soil Moisture. J. Water Land Dev. 2017, 35, 161–166. [Google Scholar] [CrossRef] [Scilit]
  32. Ho, V.H.; Morita, H.; Bachofer, F.; Ho, T.H. Random Forest Regression Kriging Modeling for Soil Organic Carbon Density Estimation Using Multi-Source Environmental Data in Central Vietnamese Forests. Model. Earth Syst. Environ. 2024, 10, 7137–7158. [Google Scholar] [CrossRef] [Scilit]
  33. Liu, X.; Hu, Y.; Li, X.; Du, R.; Xiang, Y.; Zhang, F. An Interpretable Model for Salinity Inversion Assessment of the South Bank of the Yellow River Based on Optuna Hyperparameter Optimization and XGBoost. Agronomy 2024, 15, 18. [Google Scholar] [CrossRef] [Scilit]
  34. Odutola Oshunsanya, S. Introductory Chapter: Relevance of Soil pH to Agriculture. In Soil pH for Nutrient Availability and Crop Performance; Oshunsanya, S., Ed.; IntechOpen: London, UK, 2019; ISBN 978-1-78985-015-4. [Google Scholar]
  35. Wang, D.; Zhao, C.; Zheng, J.; Zhu, J.; Gui, Z.; Yu, Z. Evolution of Soil Salinity and the Critical Ratio of Drainage to Irrigation (CRDI) in the Weigan Oasis in the Tarim Basin. CATENA 2021, 201, 105210. [Google Scholar] [CrossRef] [Scilit]
  36. Dong, S.; Wang, G.; Kang, Y.; Ma, Q.; Wan, S. Soil Water and Salinity Dynamics under the Improved Drip-Irrigation Scheduling for Ecological Restoration in the Saline Area of Yellow River Basin. Agric. Water Manag. 2022, 264, 107255. [Google Scholar] [CrossRef] [Scilit]
  37. Chen, S.; Mao, X.; Shang, S. Response and Contribution of Shallow Groundwater to Soil Water/Salt Budget and Crop Growth in Layered Soils. Agric. Water Manag. 2022, 266, 107574. [Google Scholar] [CrossRef] [Scilit]
  38. Li, W.; Kang, S.; Du, T.; Ding, R.; Zou, M. Optimal Groundwater Depth and Irrigation Amount Can Mitigate Secondary Salinization in Water-Saving Irrigated Areas in Arid Regions. Agric. Water Manag. 2024, 302, 109007. [Google Scholar] [CrossRef] [Scilit]
  39. Liu, Y.; Hu, Y.; Wei, C.; Zeng, W.; Huang, J.; Ao, C. Synergistic Regulation of Irrigation and Drainage Based on Crop Salt Tolerance and Leaching Threshold. Agric. Water Manag. 2024, 292, 108679. [Google Scholar] [CrossRef] [Scilit]
  40. Liu, J.; Huang, Q.; Li, Z.; Liu, N.; Li, J.; Huang, G. Effect of Autumn Irrigation on Salt Leaching under Subsurface Drainage in an Arid Irrigation District. Water 2023, 15, 2296. [Google Scholar] [CrossRef] [Scilit]
  41. Ramos, T.B.; Liu, M.; Paredes, P.; Shi, H.; Feng, Z.; Lei, H.; Pereira, L.S. Salts Dynamics in Maize Irrigation in the Hetao Plateau Using Static Water Table Lysimeters and HYDRUS-1D with Focus on the Autumn Leaching Irrigation. Agric. Water Manag. 2023, 283, 108306. [Google Scholar] [CrossRef] [Scilit]
  42. Sun, G.; Zhu, Y.; Mao, W.; Li, Y.; Yang, J.; Gao, Z. Development and Application of a Monthly Water and Salt Balance Model for Seasonally Frozen Agricultural and Non-Agricultural Areas with Shallow Groundwater Table. CATENA 2024, 235, 107701. [Google Scholar] [CrossRef] [Scilit]
  43. Xiong, L.; Jiang, Y.; Li, X.; Ren, D.; Huang, G. Long-Term Regional Groundwater Responses and Their Ecological Impacts under Agricultural Water Saving in an Arid Irrigation District, Upper Yellow River Basin. Agric. Water Manag. 2023, 288, 108493. [Google Scholar] [CrossRef] [Scilit]
  44. Luo, P.; Chen, R.; Javed, T.; Zhang, J.; Chen, P.; Yang, J.; Zhang, J.; Wen, Y.; Li, W.; Liu, Q.; et al. Long-Term Integrated Water-Saving Agricultural Practices Enhance Soil Health and Sustain Cotton Yield on Saline-Alkali Reclaimed Lands. Agric. Water Manag. 2025, 319, 109800. [Google Scholar] [CrossRef] [Scilit]
  45. Yu, Q.; Kang, S.; Wu, H.; Song, J.; Wang, H.; Parsons, D. Optimizing Regional Irrigation Management in Arid Saline Areas Using a Process-Based Hydro-Salt-Crop Model and Fallow Strategy. Agric. Water Manag. 2025, 320, 109832. [Google Scholar] [CrossRef] [Scilit]
  46. Cui, G.; Lu, Y.; Zheng, C.; Liu, Z.; Sai, J. Relationship between Soil Salinization and Groundwater Hydration in Yaoba Oasis, Northwest China. Water 2019, 11, 175. [Google Scholar] [CrossRef] [Scilit]
  47. Aboelsoud, H.M.; Habib, A.; Engel, B.; Hashem, A.A.; El-Hassan, W.A.; Govind, A.; Elnashar, A.; Eid, M.; Kheir, A.M.S. The Combined Impact of Shallow Groundwater and Soil Salinity on Evapotranspiration Using Remote Sensing in an Agricultural Alluvial Setting. J. Hydrol. Reg. Stud. 2023, 47, 101372. [Google Scholar] [CrossRef] [Scilit]
  48. Lu, T.; Luo, P.; Wang, J.; Lu, Y.; Huo, A.; Liu, L. Soil Salinity Accumulation and Groundwater Degradation Due to Overexploitation over Recent 40-Year Period in Yaoba Oasis, China. Soil. Tillage Res. 2025, 248, 106398. [Google Scholar] [CrossRef] [Scilit]
  49. Wang, C.; Wu, J.; Zeng, W.; Zhu, Y.; Huang, J. Five-Year Experimental Study on Effectiveness and Sustainability of a Dry Drainage System for Controlling Soil Salinity. Water 2019, 11, 111. [Google Scholar] [CrossRef] [Scilit]
  50. Wu, J.; Zhao, L.; Huang, J.; Yang, J.; Vincent, B.; Bouarfa, S.; Vidal, A. On the Effectiveness of Dry Drainage in Soil Salinity Control. Sci. China Ser. E-Technol. Sci. 2009, 52, 3328–3334. [Google Scholar] [CrossRef] [Scilit]
  51. Feng, G.; Zhang, Z.; Wan, C.; Lu, P.; Bakour, A. Effects of Saline Water Irrigation on Soil Salinity and Yield of Summer Maize (Zea mays L.) in Subsurface Drainage System. Agric. Water Manag. 2017, 193, 205–213. [Google Scholar] [CrossRef] [Scilit]
  52. Feng, G.; Zhu, C.; Wu, Q.; Wang, C.; Zhang, Z.; Mwiya, R.M.; Zhang, L. Evaluating the Impacts of Saline Water Irrigation on Soil Water-Salt and Summer Maize Yield in Subsurface Drainage Condition Using Coupled HYDRUS and EPIC Model. Agric. Water Manag. 2021, 258, 107175. [Google Scholar] [CrossRef] [Scilit]
  53. Yang, Y.; Li, D.; Huang, W.; Zhou, X.; Li, Z.; Dong, X.; Wang, X. Effects of Subsurface Drainage on Soil Salinity and Groundwater Table in Drip Irrigated Cotton Fields in Oasis Regions of Tarim Basin. Agriculture 2022, 12, 2167. [Google Scholar] [CrossRef] [Scilit]
  54. Mosley, L.M.; Rengasamy, P.; Fitzpatrick, R. Soil pH: Techniques, Challenges and Insights from a Global Dataset. Eur. J. Soil Sci. 2024, 75, e70021. [Google Scholar] [CrossRef] [Scilit]
  55. Zhang, Y.-Y.; Wu, W.; Liu, H. Factors Affecting Variations of Soil pH in Different Horizons in Hilly Regions. PLoS ONE 2019, 14, e0218563. [Google Scholar] [CrossRef] [Scilit]
  56. Li, A.; Li, C.; Zhang, Y.; Deng, Q.; Fang, H.; Zhao, B.; Ran, M.; Song, L.; Xue, J.; Tao, Q.; et al. The Driving Factors and Buffering Mechanism Regulating Cropland Soil Acidification across the Sichuan Basin of China. CATENA 2023, 220, 106688. [Google Scholar] [CrossRef] [Scilit]
  57. Liu, H.; Yu, B.; Sun, Z.; He, P.; Dong, Y.; Yang, H. Spatial Variability and Driving Factors of Soil pH in the Desert Grasslands of Northern Xinjiang. Environ. Res. 2025, 276, 121489. [Google Scholar] [CrossRef] [Scilit]
  58. Wang, X.; Ding, J.; Han, L.; Tan, J.; Ge, X.; Nan, Q. Biochar Addition Reduces Salinity in Salt-Affected Soils with No Impact on Soil pH: A Meta-Analysis. Geoderma 2024, 443, 116845. [Google Scholar] [CrossRef] [Scilit]
  59. Elmeknassi, M.; Elghali, A.; De Carvalho, H.W.P.; Laamrani, A.; Benzaazoua, M. A Review of Organic and Inorganic Amendments to Treat Saline-Sodic Soils: Emphasis on Waste Valorization for a Circular Economy Approach. Sci. Total Environ. 2024, 921, 171087. [Google Scholar] [CrossRef] [Scilit]
  60. Lee, X.; Yang, F.; Xing, Y.; Huang, Y.; Xu, L.; Liu, Z.; Holtzman, R.; Kan, I.; Li, Y.; Zhang, L.; et al. Use of Biochar to Manage Soil Salts and Water: Effects and Mechanisms. CATENA 2022, 211, 106018. [Google Scholar] [CrossRef] [Scilit]
  61. Cong, P.; Song, J.; Dong, J.; Su, W.; Feng, W.; Zhang, H. Straw Return Was More Beneficial to Improving Saline Soil Quality and Crop Productivity than Biochar in the Short Term. Front. Plant Sci. 2025, 15, 1517917. [Google Scholar] [CrossRef] [Scilit]
  62. Tan, M.; Li, W.; Zong, R.; Li, X.; Han, Y.; Luo, P.; Dhital, Y.P.; Lin, H.; Li, H.; Wang, Z. Long-Term Mulched Drip Irrigation Enhances the Stability of Soil Aggregates by Increasing Organic Carbon Stock and Reducing Salinity. Soil Tillage Res. 2024, 240, 106069. [Google Scholar] [CrossRef] [Scilit]
  63. Xia, H.; Liu, H.; Gong, P.; Li, P.; Xu, Q.; Zhang, Q.; Yang, C.; Meng, Q. Applying Bio-Organic Fertilizer Improved Saline Alkaline Soil Properties and Cotton Yield in Xinjiang. Sci. Rep. 2025, 15, 13235. [Google Scholar] [CrossRef] [Scilit]
Figure 1. Nested spatial context of the study area and distribution of the 125 fixed cropland monitoring sites in Bachu County, southern Xinjiang, China. (a) Location of Xinjiang in China. (b) Location of Bachu County in Xinjiang. (c) Local study-area map showing the Bachu County boundary, upstream–midstream–downstream zoning, drainage system, drainage ditches, and the 125 fixed cropland monitoring sites.
Agronomy 16 00848 g001
Figure 2. Workflow of soil monitoring, spatial preprocessing, and spatiotemporal analysis of TSC and pH in Bachu County oasis cropland from 2018 to 2021.
Agronomy 16 00848 g002
Figure 3. County-scale and zonal interannual variability of topsoil total salt content (TSC) and soil pH in Bachu County oasis cropland, 2018–2021. Panels (a,b) show county-scale interannual variation in TSC and pH, respectively. Panels (c,d) show zonal variation in TSC and pH across the upstream, midstream, and downstream zones. Box plots show the median and interquartile range. Different uppercase letters in panels (a,b) indicate significant differences among years. In panels (c,d), uppercase letters indicate significant differences among years within the same zone, and lowercase letters indicate significant differences among zones within the same year (one-way ANOVA with Tukey’s HSD test, p < 0.05).
Agronomy 16 00848 g003
Figure 4. Annual spatial class patterns of topsoil total salt content (TSC) and soil pH in Bachu County oasis cropland, 2018–2021. Panels (ad) show the annual spatial class patterns of TSC in 2018, 2019, 2020, and 2021, respectively, and panels (eh) show the corresponding annual spatial class patterns of soil pH. Dashed lines indicate the boundaries among the upstream, midstream, and downstream zones. TSC classes are NS = non-saline, SS = slightly saline, MS = moderately saline, SVS = severely saline, and ES = extremely saline. pH classes are N = neutral, SLK = slightly alkaline, MA = moderately alkaline, and SK = strongly alkaline.
Agronomy 16 00848 g004
Figure 5. County- and zone-level class composition and interannual transition pathways of topsoil total salt content (TSC) in Bachu County oasis cropland, 2018–2021. Panels (a,c,e,g) show the areal composition of TSC classes at the county, upstream, midstream, and downstream scales, respectively. Panels (b,d,f,h) show the corresponding net area changes (ΔArea) between 2018 and 2021 for each TSC class. Panel (i) shows the alluvial transitions of TSC classes across 2018, 2019, 2020, and 2021, with flow width proportional to converted area. TSC classes are NS = non-saline, SS = slightly saline, MS = moderately saline, SVS = severely saline, and ES = extremely saline.
Agronomy 16 00848 g005
Figure 6. County- and zone-level class composition and interannual transition pathways of soil pH in Bachu County oasis cropland, 2018–2021. Panels (a,c,e,g) show the areal composition of pH classes at the county, upstream, midstream, and downstream scales, respectively. Panels (b,d,f,h) show the corresponding net area changes (ΔArea) between 2018 and 2021 for each pH class. Panel (i) shows the alluvial transitions of pH classes across 2018, 2019, 2020, and 2021, with flow width proportional to converted area. pH classes are N = neutral, SLK = slightly alkaline, MA = moderately alkaline, and SK = strongly alkaline.
Agronomy 16 00848 g006
Figure 7. Spatial recurrence of severe-salinity and high-pH hotspots in Bachu County oasis cropland, 2018–2021. Panel (a) shows hotspot recurrence of topsoil total salt content (TSC), defined as TSC ≥ 10 g kg−1, and panel (b) shows hotspot recurrence of soil pH, defined as pH ≥ 8.5. The colour scale indicates the number of years (1–4) in which each cropland pixel exceeded the corresponding threshold during 2018–2021. Grey outlines indicate the cropland boundary.
Agronomy 16 00848 g007
Figure 8. Intensity-weighted centroid migration trajectories of severe-salinity and high-pH hotspots in Bachu County oasis cropland, 2018–2021. Panels (ad) show the centroid migration trajectories of TSC hotspots for the overall cropland, upstream, midstream, and downstream zones, respectively. Panels (eh) show the corresponding centroid migration trajectories of pH hotspots for the same spatial scopes. Points indicate annual centroid positions from 2018 to 2021, and connecting lines indicate interannual migration paths. Grey outlines indicate the cropland boundary within each spatial scope. Centroids were calculated as intensity-weighted centroids from annual raster surfaces.
Agronomy 16 00848 g008
Figure 9. Principal component analysis (PCA) of environmental covariates with supplementary projections of topsoil total salt content (TSC) and soil pH in Bachu County oasis cropland. Panels (a) and (c) show the bootstrap mean loadings (±1.96 × SE) of the principal components for the environmental covariate spaces used in the TSC-related and pH-related analyses, respectively. Panels (b) and (d) show the corresponding PCA biplots, with sites coloured by river reach and shaped by year, while TSC and pH are projected as supplementary variables to visualize their alignment with the dominant multivariate gradients. PCA is interpreted here as an exploratory dimensionality-reduction tool for summarizing multivariate environmental structure rather than as direct evidence of causal drivers.
Agronomy 16 00848 g009
Table 1. Spatial datasets used in this study from 2018 to 2021.
DataSourceSpatial
Resolution
ElevationCopernicus DEM (COPERNICUS/DEM/GLO30)30 m
Precipitation (annual)CHIRPS daily (UCSB-CHG/CHIRPS/DAILY)0.05°
Precipitation (pre-sampling window)CHIRPS daily (UCSB-CHG/CHIRPS/DAILY)0.05°
Annual evapotranspiration (ET)MODIS MOD16A2GF (MODIS/061/MOD16A2GF)500 m
Land surface temperature (LST)MODIS MOD11A2 (MODIS/061/MOD11A2)1 km
Normalized difference vegetation index (NDVI)Landsat SR composites30 m
Groundwater depth (GWdepth)Local management department1 km
Groundwater mineralization (ECD)Local management department1 km
Drainage networkLocal management department1 km
Main river networkLocal management department1 km
Cropland maskLocal management department30 m
Table 2. Classification scheme for topsoil total salt content (TSC) and pH.
IndicatorClass NameRange
TSC, (g·kg−1)Non-saline (NS)0–2 g kg−1
Slightly saline (SS)2–6 g kg−1
Moderately saline (MS)6–10 g kg−1
Severely saline (SVS)10–16 g kg−1
Extremely saline (ES)≥16 g kg−1
pHNeutral (N)6.6–7.3
Slightly alkaline (SLK)7.4–7.8
Moderately alkaline (MA)7.9–8.4
Strongly alkaline (SK)8.5–9.0
Note: pH classes followed the USDA/NRCS soil reaction classes.
Table 3. Hotspot recurrence and intensity-weighted centroid migration metrics for topsoil total salt content (TSC) and soil pH in Bachu County oasis cropland, 2018–2021.
VariableRegionStep Distance, 2018–2019 (km)Step Distance, 2019–2020 (km)Step Distance, 2020–2021 (km)Net Displacement, Net 2018–2021 (km)Net Azimuth (°)
TSCOverall18.3020.666.534.1069.1
Upstream8.610.926.103.12217.9
Midstream4.481.1514.549.64232.7
Downstream5.359.428.734.6664.4
pHOverall5.784.031.601.11325.0
Upstream1.550.371.632.92255.5
Midstream3.241.074.066.2047.4
Downstream7.492.331.473.73252.9
Note: Hotspot area refers to the cropland area exceeding the threshold of TSC ≥ 10 g kg−1 or pH ≥ 8.5 in a given year. Recurrence denotes the number of years (1–4) in which a hotspot was detected at the same pixel during 2018–2021. Step distance denotes centroid displacement between two consecutive years. Net displacement denotes the straight-line distance between the 2018 and 2021 centroids.
Disclaimer/Publisher’s Note: The statements, opinions and data contained in all publications are solely those of the individual author(s) and contributor(s) and not of MDPI and/or the editor(s). MDPI and/or the editor(s) disclaim responsibility for any injury to people or property resulting from any ideas, methods, instructions or products referred to in the content.