Article

Genome-Wide Association Studies Reveal the Complex Genetic Architecture of Grain Number per Spike in Wheat


1
College of Plant Science and Technology, Huazhong Agricultural University, Wuhan 430070, China
2
Institute of Crops Molecular Breeding, Henan Academy of Agricultural Sciences, Zhengzhou 450002, China
3
The Shennong Laboratory, Zhengzhou 450002, China
*
Authors to whom correspondence should be addressed.
Agronomy 2026, 16(8), 786; https://doi.org/10.3390/agronomy16080786
Submission received: 11 March 2026 / Revised: 7 April 2026 / Accepted: 8 April 2026 / Published: 11 April 2026

Abstract

Grain number per spike (GNS) is a key component of wheat yield, yet its genetic architecture remains incompletely understood. This study phenotyped 610 wheat accessions for GNS in four environments and genotyped them using 429,721 single nucleotide polymorphisms (SNPs). The phenotypes were associated with the SNPs using a three-variance multi-locus random-SNP-effect mixed linear model (3VmrMLM) to identify quantitative trait nucleotides (QTNs), as well as QTN-by-environment (QEI) and QTN-by-QTN (QQI) interactions. These genetic components and residual error explained approximately 18%, 31%, 28%, and 23% of the phenotypic variance, respectively. Two and one previously reported genes were found around QTNs and QEIs, respectively. Bioinformatics and haplotype analyses subsequently yielded 25 candidate genes, 22 gene-by-environment interactions (GEIs), and 24 gene-by-gene interactions (GGIs) around the QTNs, QEIs, and QQIs, respectively. Notably, TraesCS1D01G280000, the wheat homolog of OsRopGEF10, was located near a major QTN explaining over 10% of the total phenotypic variation. A gene interaction network constructed from all identified genes highlighted the central role of GGIs in GNS regulation. Environmental variation may reshape the regulatory network through GEIs. Furthermore, superior haplotypes of 12 candidate genes were identified, providing valuable targets for improving wheat yield. Overall, this study dissects the genetic architecture of GNS and offers practical resources for wheat molecular breeding.

1. Introduction

Wheat (Triticum aestivum L.) is one of the most widely cultivated cereal crops worldwide. It provides approximately 20% of the calories and protein consumed by the global population and plays a pivotal role in ensuring global food security [1,2]. Yield is a complex trait influenced by multiple components. However, genetic studies indicate that enhancing grain number per spike (GNS) has a greater impact on final grain yield than other components, such as thousand-grain weight or spike length alone, especially in major wheat-producing regions worldwide [3].
Despite decades of research in wheat genetics, the genetic architecture underlying GNS remains only partially understood. Early studies using biparental mapping populations identified quantitative trait loci (QTLs) for spikelet number and GNS across multiple chromosomes. However, these loci often explain only a modest proportion of total phenotypic variance and have limited in genetic resolution [4,5]. Genome-wide association studies (GWAS) that leverage diverse germplasm panels and high-density single nucleotide polymorphism (SNP) genotyping have expanded the catalog of loci for yield components. For example, GWAS in spring wheat populations have identified numerous QTLs for GNS and related traits, most of which exhibit small to moderate effects [6]. However, conventional GWAS approaches typically analyze single environments and may overlook critical quantitative trait nucleotide (QTN) × environment interactions (QEIs) for stability across diverse field conditions [7,8,9,10].
Moreover, although GNS shows moderate to high heritability under controlled conditions, a significant portion of phenotypic variation is influenced by the environment, which modulates inflorescence meristem activity and floret survival [3,11]. These environmental effects make it more difficult to identify stable loci for marker-assisted selection [12,13]. In addition, epistatic interactions between QTNs can contribute to the so-called “missing heritability” of complex traits, yet they are rarely included in standard GWAS models. This omission may limit the detection of interacting networks of genetic control [14,15].
GNS is a key determinant of wheat yield; however, the identification of underlying genes remains limited. While some QTLs associated with GNS have been reported across the wheat genome, only a few genes have been functionally characterized, reflecting the trait’s genetic complexity [3,16]. This gap between mapped loci and cloned genes hinders the effective utilization of genetic information in molecular breeding.
Additionally, recent methodological advances have improved our ability to simultaneously partition additive and dominant effects, as well as their environmental and epistatic interactions. This offers a more comprehensive understanding of complex trait architectures [17,18]. Furthermore, integrative studies in wheat combining GWAS with regulatory network analysis have identified hundreds of candidate loci for spike architecture by leveraging gene expression data from key developmental stages, such as the double ridge stage and the floret primordia stage [19]. Despite these advances, few studies have systematically compared the genetic signals detected by single-environment, multi-environment, and epistatic GWAS models for GNS. Moreover, identifying superior haplotypes with consistent phenotypic effects across environments remains limited, restricting the practical application of GWAS findings in wheat breeding. Therefore, a comprehensive, integrative analysis is required to better resolve the genetic architecture of GNS by considering environmental effects and genetic interactions simultaneously.
The aim of this study was to systematically dissect the genetic architecture of GNS by jointly identifying QTNs, QEIs, and QTN-by-QTN interactions (QQIs) in a wheat panel of 616 accessions using 3VmrMLM. Additionally, we sought to integrate the identified loci with functional annotations, transcriptomic evidence, and haplotype analyses to prioritize candidate genes and gene-by-environment interactions. Furthermore, we aimed to explore potential gene-by-gene interaction networks underlying QQIs. Finally, we sought to identify superior haplotypes with potential applications for improving wheat yield. Our findings dissect the genetic architecture of GNS and offer practical targets for improving wheat yield.

2. Materials and Methods

2.1. Plant Materials and Field Experiments

The wheat accessions used in this study were derived from an association panel previously reported by Peng et al. [20]. The original panel consisted of 616 accessions. However, after quality control and filtering of phenotypic values, only 610 accessions were retained for this study. Details on these accessions can be found in Peng et al. [20]. The accessions were evaluated across four environments in Henan Province, China, during the 2016–2017 and 2017–2018 growing seasons. Field trials were conducted in Anyang (36.13° N, 114.58° E, 17AY), Jiyuan (35.12° N, 112.28° E, 17JY), and Zhumadian (33.01° N, 114.40° E, 17ZMD) during the 2016–2017 season and in Zhumadian (18ZMD) during the 2017–2018 season. All experiments were arranged in a randomized complete block design with three replicates in each environment. Each accession was grown in a two-row plot of 2 m in length, with a row spacing of 23.33 cm and a plant spacing of 3.33 cm. Field management followed standard local agricultural practices and was consistent across all environments. The experimental sites are located in the primary wheat-growing region of the Huang-Huai Plain in China.

2.2. Phenotypic Data Analysis and Heritability Estimation

GNS was evaluated at physiological maturity. Ten randomly selected spikes per accession were evaluated in each replication, resulting in a total of 30 spikes per accession. The mean value of these spikes was used as the phenotypic value for subsequent analyses. We performed an analysis of variance (ANOVA) using a two-way fixed-effects model implemented in the R function aov, considering genotype and environment as fixed effects. Statistical significance was assessed at p < 0.05. Best linear unbiased prediction (BLUP) was derived from a single linear mixed model fit implemented via the R package lme4 v1.1-37 [21]. In this model, genotype and environment were treated as random effects, and BLUP values were extracted for subsequent analysis. The model was fitted as follows:
y = μ + G + E + ε
where μ is the overall mean, and the random effect includes genotypic effect G, environment effect E, and residual error ε.

2.3. Genotyping and SNP Filtering

Genotyping was performed using the Wheat 660K SNP array [22], yielding 552,470 original SNPs. Missing genotypes were imputed using Beagle v5.2 [23]. The imputation was conducted with default parameter. Quality control was performed using PLINK v1.90 [24]. SNPs with minor allele frequency ≤ 0.05 were removed. After filtering, 429,721 high-quality SNPs were retained for subsequent analyses.

2.4. Linkage Disequilibrium Analysis

Linkage disequilibrium (LD) decay was estimated using PopLDdecay v3.41 [25]. The physical distance corresponding to the LD decay threshold was used to define the candidate gene search window. Based on LD decay results, genes within ±2 Mb of significant QTNs were considered as potentially candidate genes.

2.5. Genome-Wide Association Study

We used a three-variance component multi-locus random-SNP-effect mixed linear model (3VmrMLM) to perform GWAS and detect QTNs, QEIs, and QQIs, respectively, in the single-environment, multi-environment, and epistatic modules [17]. A total of 429,721 SNPs were used for both the single- and multi-environment GWAS. The 3VmrMLM model incorporates all potential genetic effects and controls all possible polygenic backgrounds [17].
To reduce the computational burden and collinearity in the epistasis analysis, we pruned SNPs using PLINK v1.90 with the parameters “—indep-pairwise 2000 200 0.05”. This retained 3656 independent SNPs for QQI detection. We controlled for population structure in all models using eleven principal components (PCs), which were calculated in PLINK v1.9. Each PC explained more than 1% of the total genetic variance and was included as a covariate in the GWAS model. Kinship matrices were estimated using the IIIVmrMLM software v1.0 [18].
The significance thresholds of Bonferroni correction were set at p ≤ 0.05/m for QTNs, QEIs, and QQIs. A LOD score of at least 3.0 was used as the suggested threshold [17,18], where m equals 429,721 for QTNs and QEIs, and 6,683,168 for QQIs.

2.6. Identification of Candidate Genes

To analyze the expression patterns of candidate genes in spike development, transcriptome data for spike and spikelet tissues at the full booting stage and 30% spike emergence stage were obtained from the Wheat Expression Browser (JIC). Potential candidate genes were annotated using AgBase (https://agbase.arizona.edu/, accessed on 2 March 2026) and eggNOG-mapper (https://github.com/jhcepas/eggnog-mapper/, accessed on 3 June 2023). Known rice genes were obtained from the China Rice Data Center (https://ricedata.cn/gene/, accessed on 2 March 2026). Wheat and rice protein sequences were obtained from https://urgi.versailles.inra.fr/ (accessed on 23 March 2023) and http://rice.uga.edu/ (accessed on 16 February 2023) to identify homologous genes using OrthoFinder v2.3.8 [26].
The differential expression of candidate genes around QEIs under environmental stress was further identified based on transcriptome data from public databases [27,28] using the R package DESeq2 v1.38.3 [29] with the criteria of |log2FC| > 1 and p value < 0.05. Potential candidate genes were identified as significant in the haplotype analysis using analysis of variance (ANOVA). The superior haplotype was determined using the least significant difference (LSD) method with a significance level of 0.05. GO enrichment of genes in the gene network was conducted using the GFAP software v1.0 with a p value of less than 0.05.

2.7. Prediction of Gene-by-Gene Interaction (GGI)

The prediction of GGI was conducted using transcriptome data of spike and spikelet, STRING database (https://cn.string-db.org/, accessed on 24 May 2025) and AlphaFold (https://deepmind.google/science/alphafold/alphafold-server/, accessed on 4 March 2026). First, the expression of genes was used to conduct correlation analysis using the R function cor.test. The co-expression of genes was determined with a p value less than 0.05. Second, protein and protein interactions (PPIs) were identified using STRING database (https://cn.string-db.org/, accessed on 24 May 2025). Finally, PPIs were predicted by AlphaFold with pTM exceeding 0.50. The two genes in a gene pair must be around the two QTNs of the QQI, respectively. All identified genes were used to construct the gene network using STRING database to find the hub genes for GNS.

2.8. Proportions of Phenotypic Variance Explained by QTNs, QEIs, and QQIs

The proportions of total phenotypic variance explained (PVE) by each type of locus (QTN, QEI, and QQI) were summarized from the GWAS results using 3VmrMLM. When identifying QTNs from the BLUP values that remove environmental effects, some QTNs may actually be QQIs. Thus, the sum of their PVEs may represent the combined contributions of QTNs and QQIs. When identifying QQIs from the BLUP values, the sum of their PVEs represent the relatively true contribution of QQIs. The sum of the PVEs of QEIs indicates the contribution of QEIs identified in multi-environment joint analysis. Residual variance was estimated using the averages from both BLUP-based and multi-environment joint analyses.
We integrated the QTN, QEI, and QQI variances and residual error into a weighted model to summarize and approximate the PVE of each component.

3. Results

3.1. Phenotypic Variation and Heritability of GNS

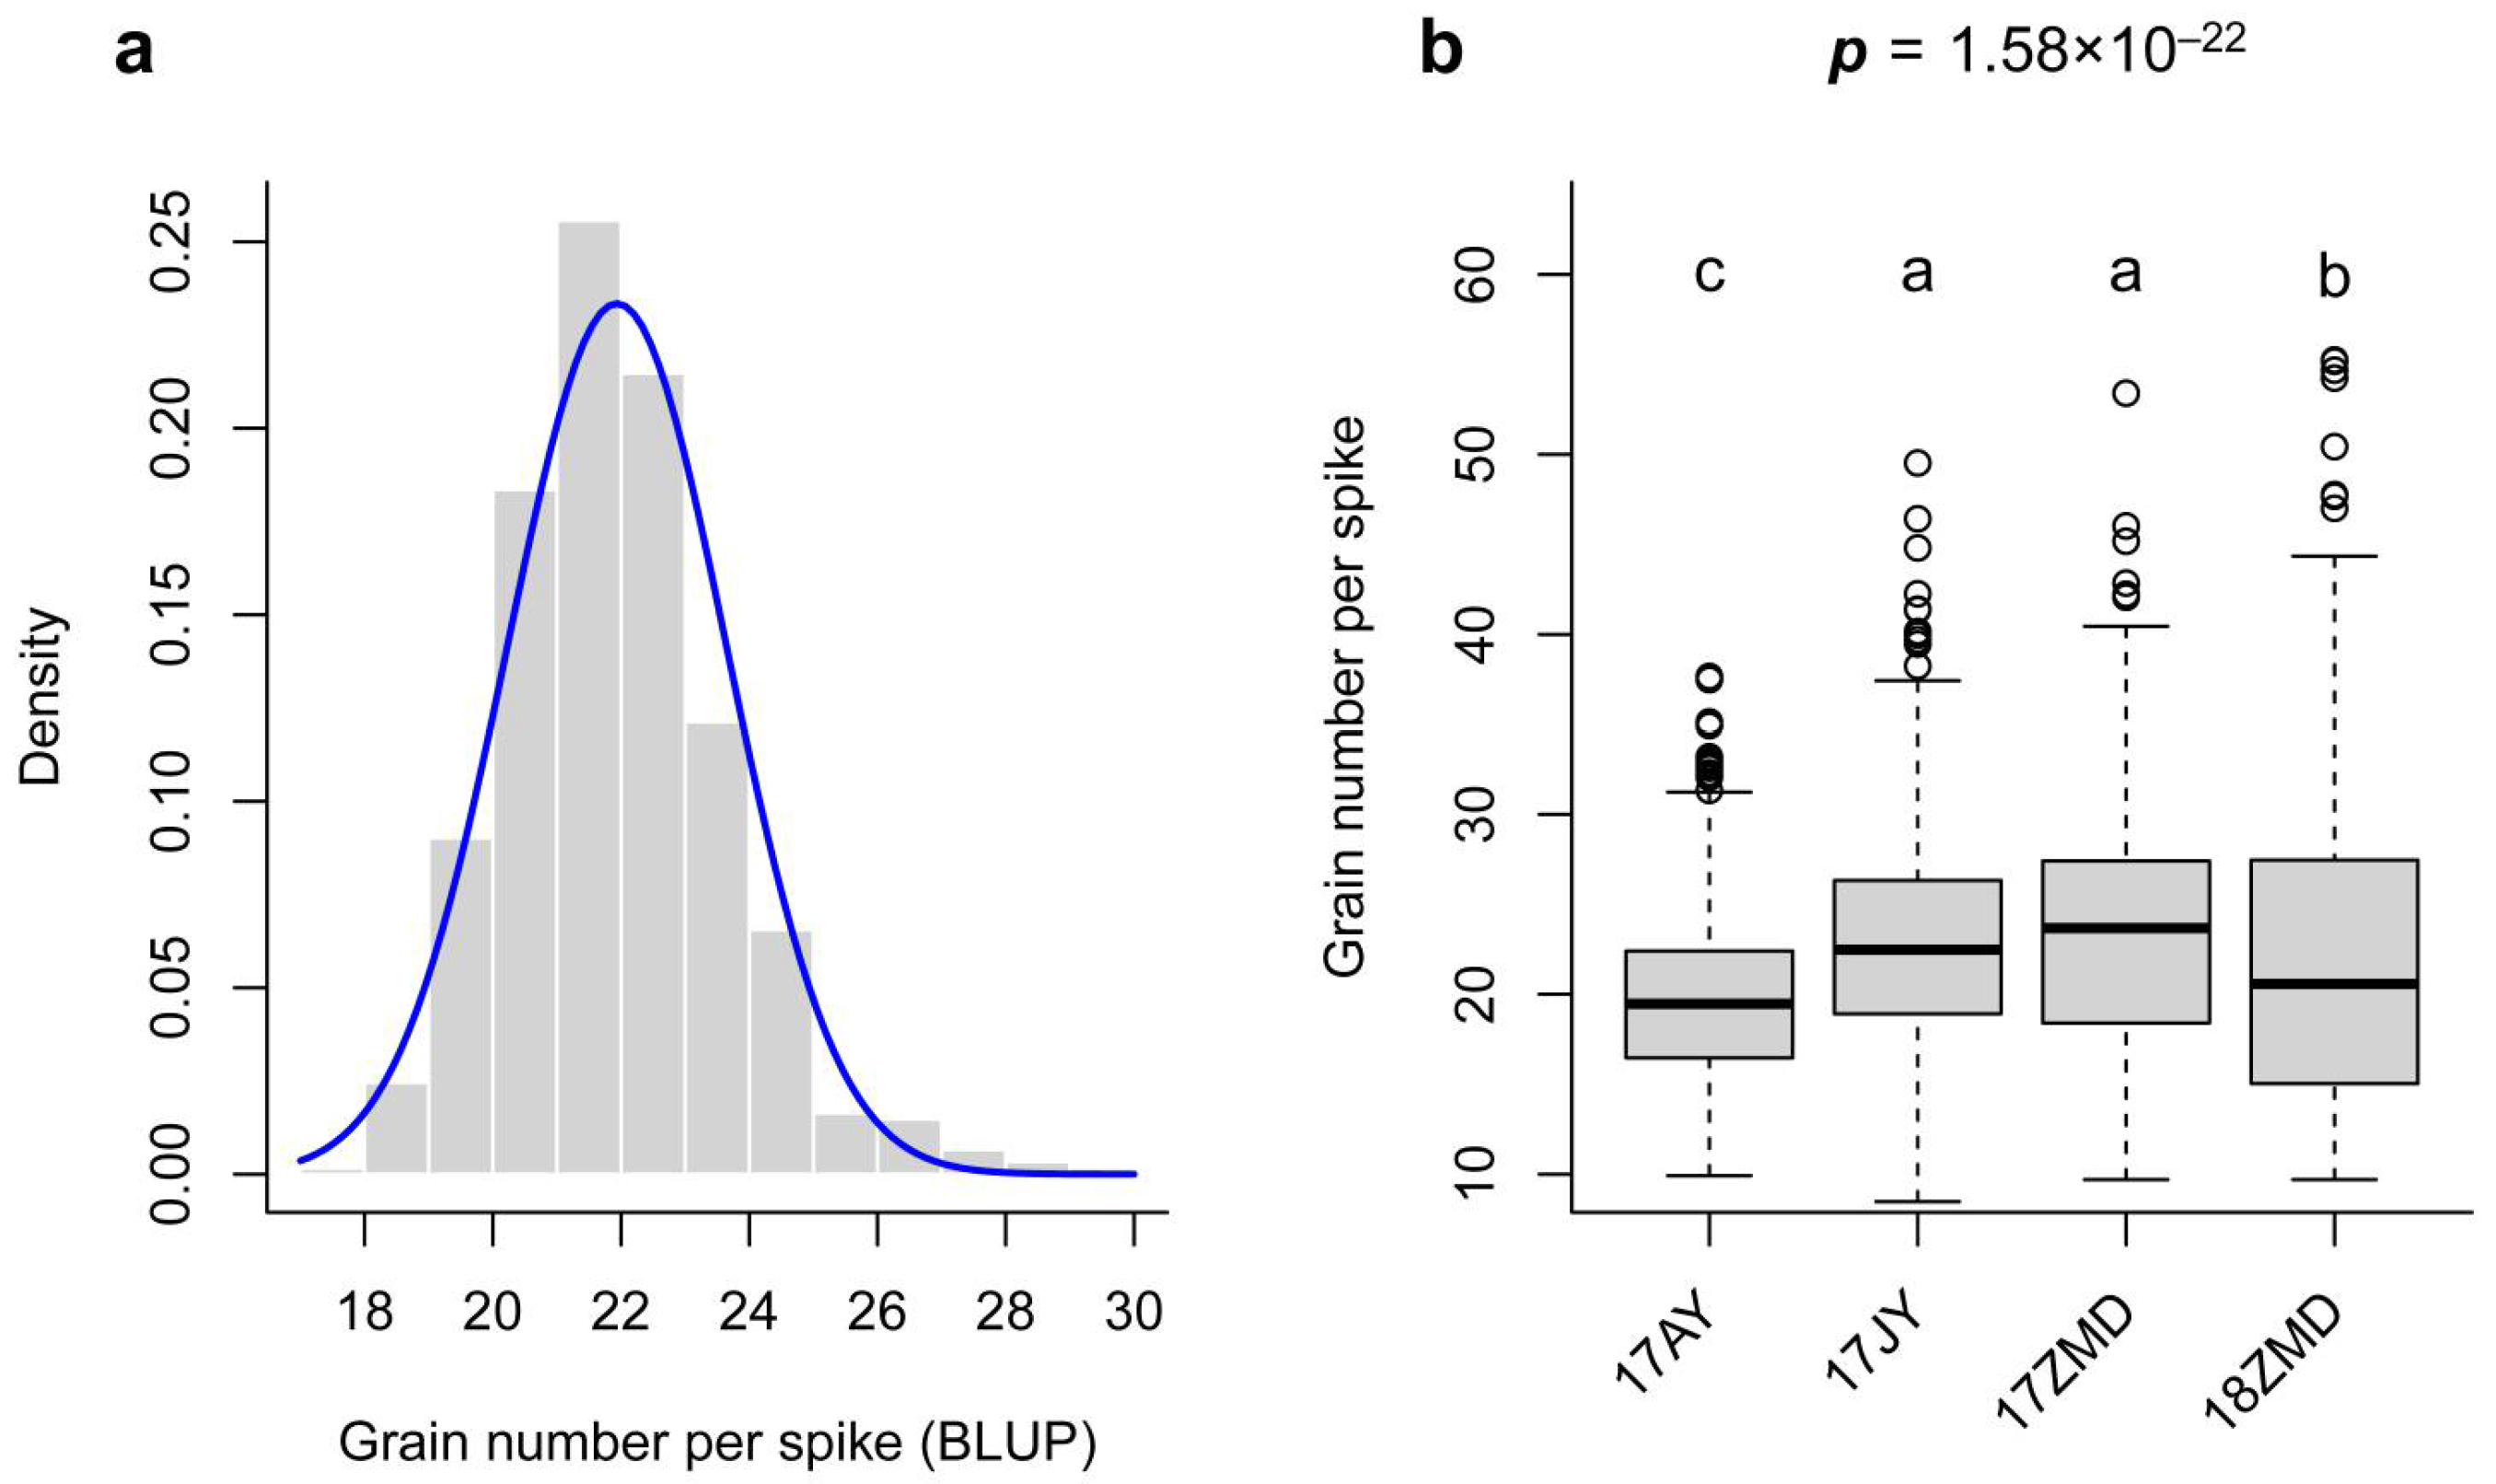
This study measured GNS in Anyang (17AY), Jiyuan (17JY), and Zhumadian (17ZMD) during the 2016–2017 growing season and in Zhumadian (18ZMD) during the 2017–2018 growing season. Using the linear mixed model from the lme4 package, we predicted BLUP values for each genotype to minimize environmental noise and obtain more precise phenotypic values for subsequent GWAS (Figure 1). Two-way ANOVA further demonstrated that genotypic and environmental effects were both highly significant (p < 0.001), indicating that both contributed to total phenotypic variation (Figure 1).

3.2. Detection of QTNs, QEIs and QQIs

We conducted single-environment, multi-environment, and epistatic GWAS using 3VmrMLM to dissect the genetic architecture of GNS.
In the single-environment module, an average of 31 QTNs were detected across the four environments and the BLUP dataset. The average phenotypic variance explained (PVE) by individual QTNs was 2.15%. Eight of these loci were repeatedly detected in at least two environments, suggesting that most loci exhibit environment-specific effects rather than stable expression across environments (Table S1).
In the multi-environment module, 25 QTNs and 25 QEIs were identified (Tables S1 and S2). The total PVE was 28.74% for QTNs and 40.17% for QEIs, indicating that QEIs substantially contribute to the genetic basis of GNS.
For the epistatic analysis, two QTNs and 96 QQIs were identified using 3656 SNPs and the phenotypes of each environment and the BLUP values (Table S3). The average PVE of an individual QQI was 1.95%, indicating that, although each QQI was relatively small, epistasis accounted for 37.44% of the total phenotypic variance.
In summary, QTNs, QEIs, and QQIs accounted for a significant portion of phenotypic variation, supporting the idea that GNS has a complex, multilayered genetic architecture.

3.3. Identification of Candidate Genes Around QTNs

Two previously reported genes, TaARF12-2B and WPI-1-1B, were found around QTNs, revealing the reliability of the results [30,31,32].
Candidate genes were identified around the detected QTNs by retrieving genes located within ±2 Mb of the detected loci based on the LD decay distance. In total, 7292 genes were identified.
To narrow down the list of potential candidate genes, we first performed a homology analysis with previously reported yield-related rice genes. A total of 80 wheat genes showed homology to rice genes previously reported for grain number or inflorescence development (Table S4).
To further refine potentially candidate genes, transcriptome data from spike tissues at the full boot stage and the 30% spike emergence stage were integrated. Genes with TPM expression levels greater than 0.1 in spike tissues were considered expressed. A total of 4400 genes exhibited detectable expression in the spike tissues.
Gene Ontology (GO) annotation was performed on the spike-expressed genes, revealing that 19 of them were involved in biological processes related to reproductive development and floral organ development. These genes were considered functionally relevant to the regulation of GNS.
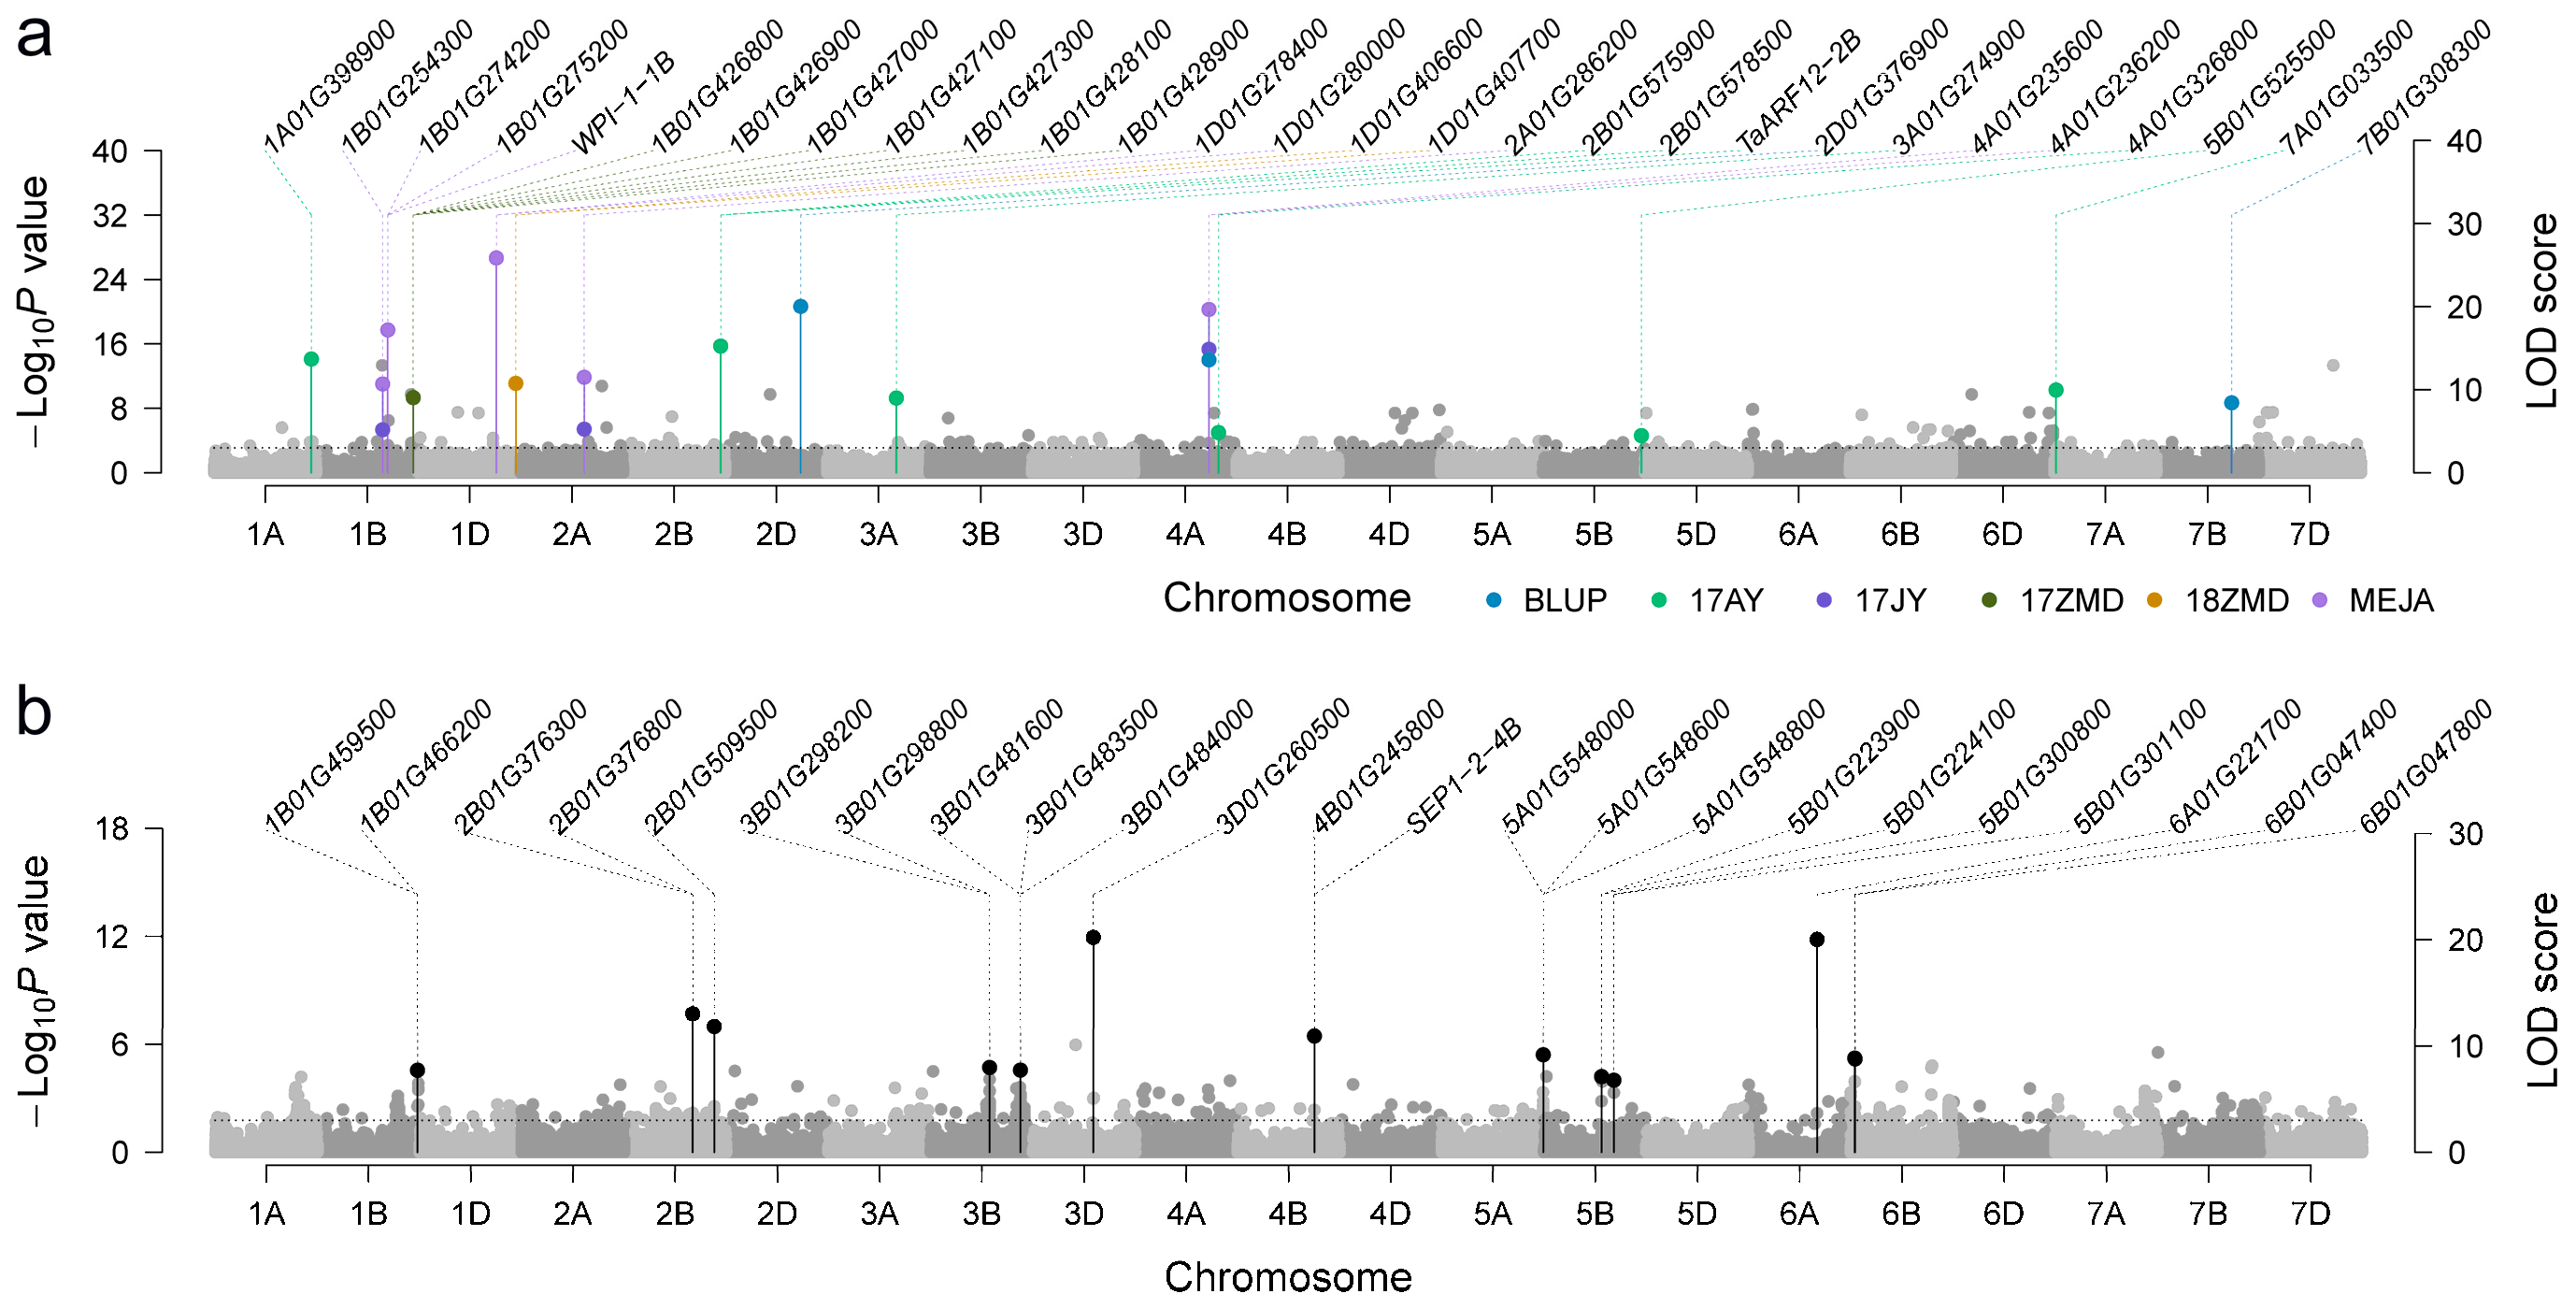
We identified 96 putative candidate genes by integrating homology information with known rice genes and GO functional annotation results. Next, we conducted a haplotype analysis using the gene haplotypes and their corresponding phenotypes. As a result, we identified 25 high-confidence candidate genes for GNS (Figure 2a; Table S5). The Manhattan plots revealed that the candidate genes in the regions with association signals were widely distributed across the wheat genome, suggesting a polygenic architecture. TraesCS1D01G280000, the homolog of OsRopGEF10, is located within a region containing QTNs that account for over 10% of the phenotypic variation (Table S5). OsRopGEF10 regulates the spike development and grain yield in rice [33]. These results provide potential candidates for improving GNS in wheat breeding.

3.4. Identification of Candidate Gene-by-Environment Interactions (GEIs) and GGIs

To further identify candidate GEIs, 992 genes located within ±2 Mb of QEIs were extracted, including one previously reported gene, SEP1-2-4B [31,34]. To determine if these genes exhibited environment-dependent genetic effects, a two-way ANOVA was conducted using haplotypes of the genes and environments as factors. Of the 992 genes, 232 exhibited significant haplotype-by-environment interaction effects (p < 0.05), suggesting potential gene-level environmental responsiveness (Table S6). Of the 232 genes, one was homologous to a previously reported rice gene associated with GNS; nine had functional annotations related to reproductive or developmental processes; and 13 were significantly differentially expressed under environmental stress conditions (|log2FC| > 1, p < 0.05). In summary, 22 high-confidence candidate GEIs were ultimately identified (Table S7; Figure 2b). Figure 2b shows that significant GEIs are distributed across the wheat genome. This also suggests that GNS has a polygenic architecture.
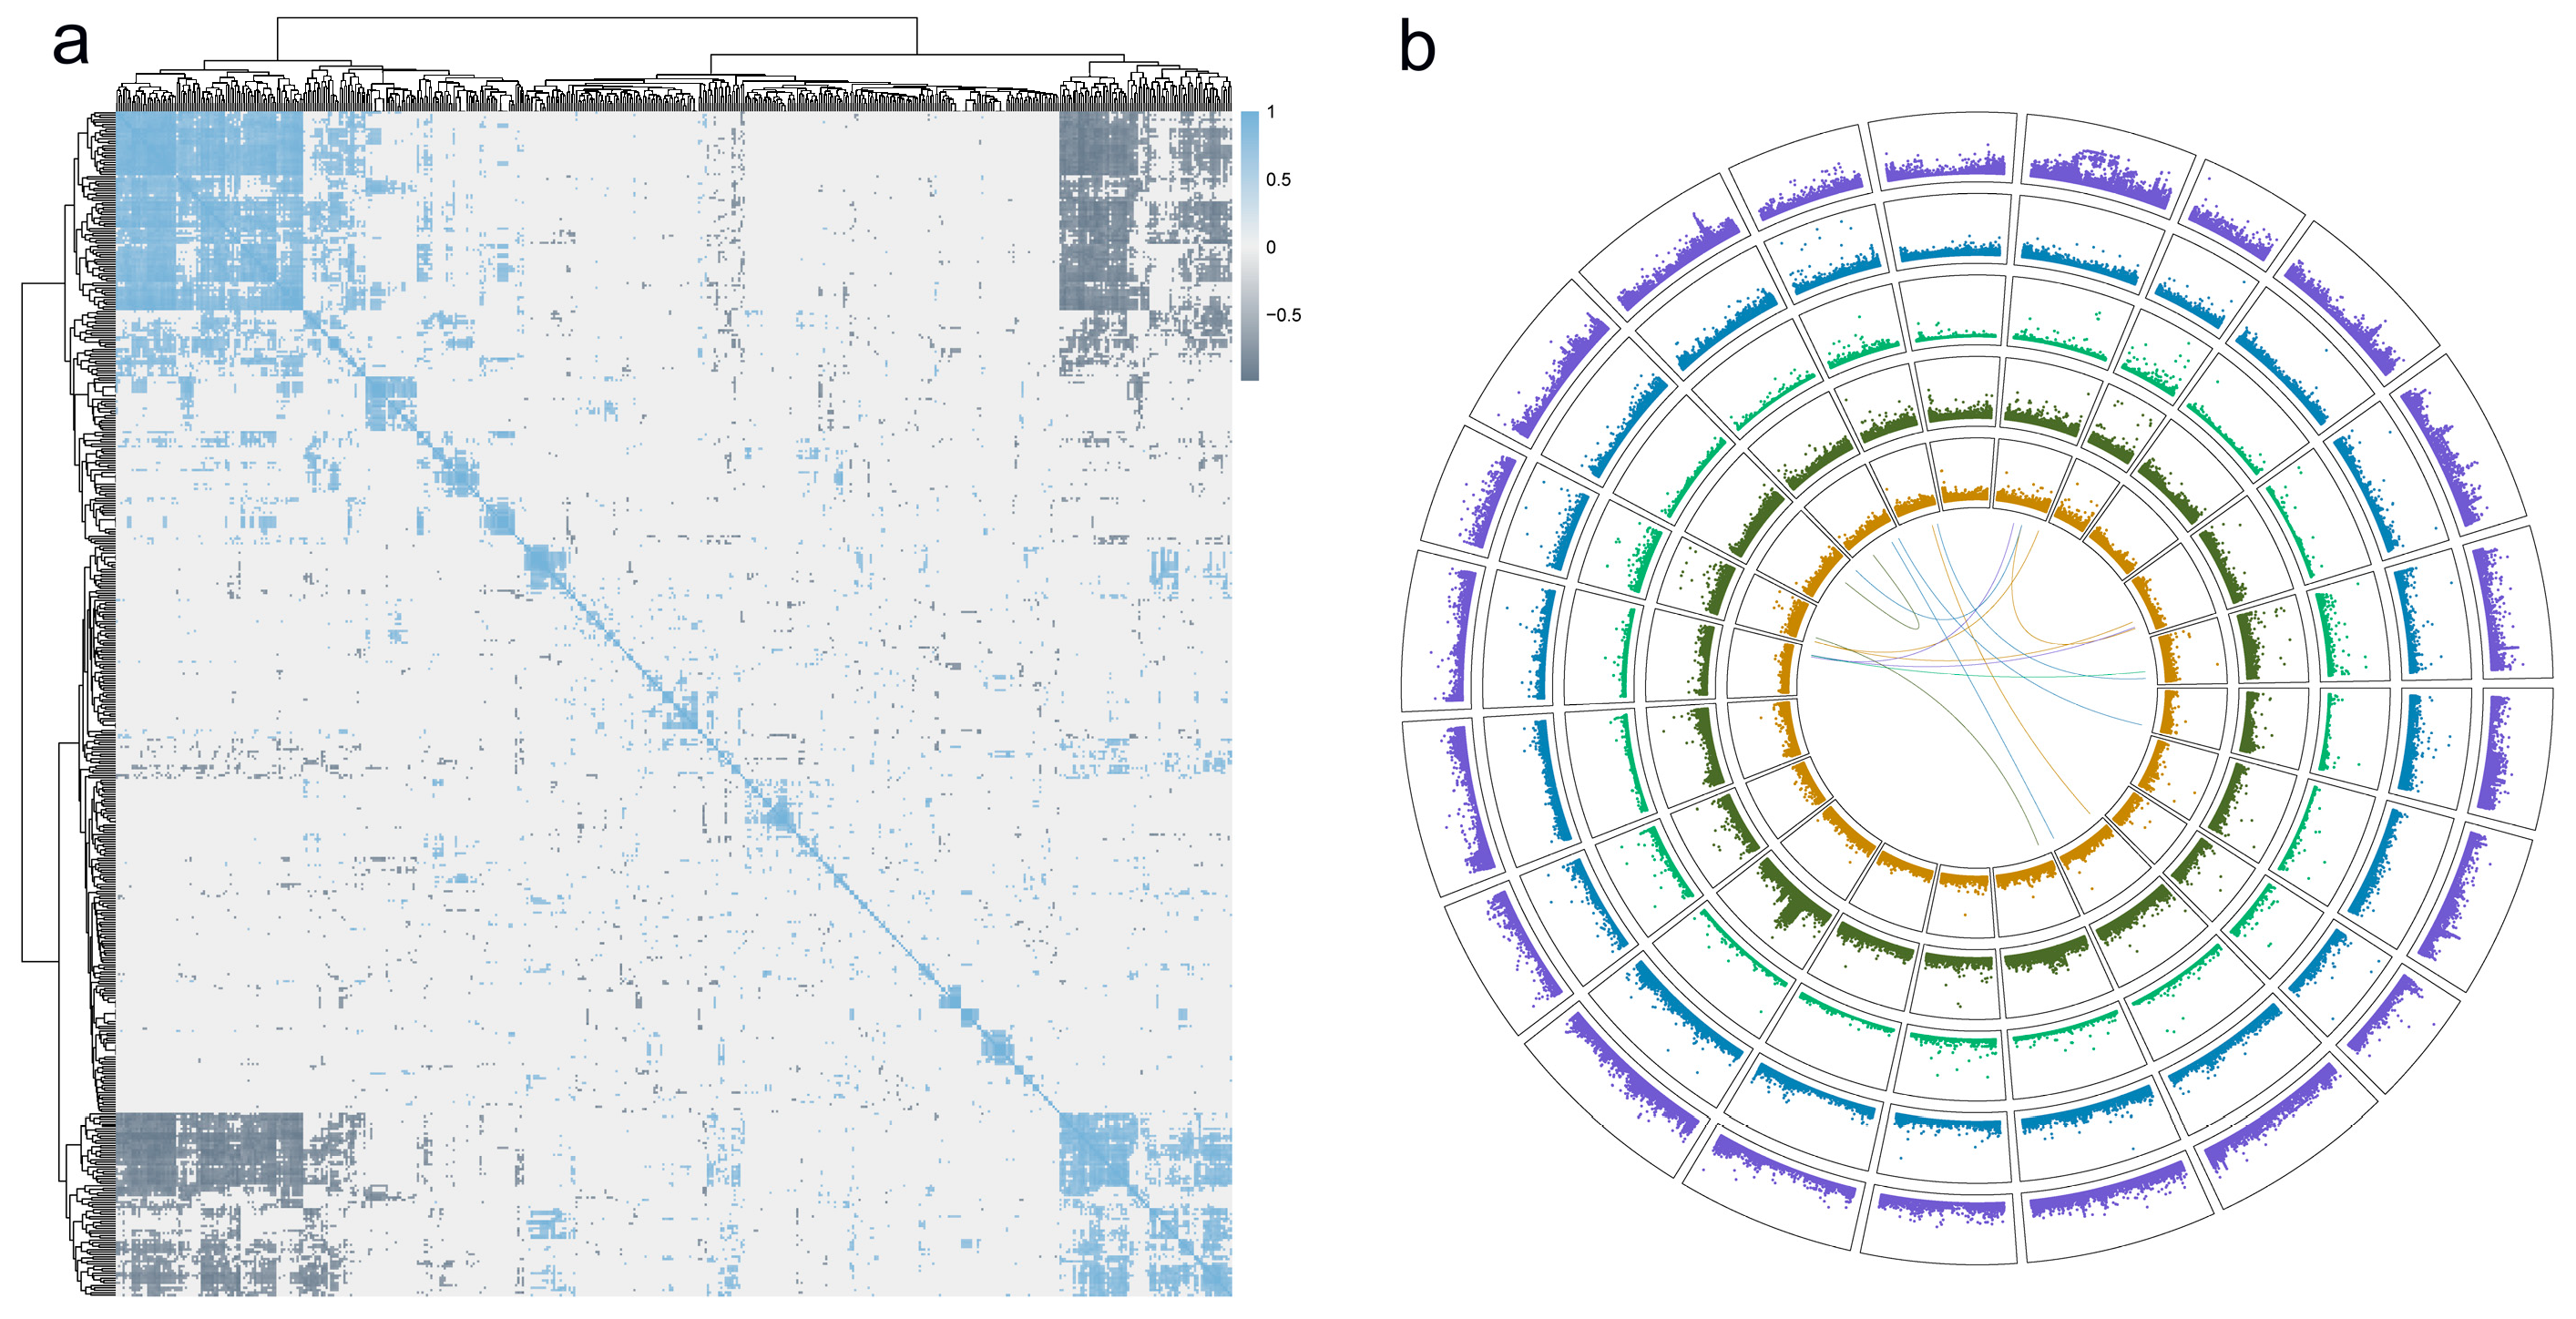
First, candidate genes were collected within ±2 Mb of significant QQIs to identify candidate GGIs. Spike transcriptome data were then used to conduct a co-expression analysis based on the correlation between gene pairs at a 0.05 significance level. Observed correlations ranged from 0.66 to 0.99, averaging 0.78 across all significant gene pairs (Figure 3a). Meanwhile, potential interactions were identified using PPI information from the STRING database. Gene pairs supported by both co-expression and STRING evidence were considered as putative interaction candidates, yielding 175 prioritized gene pairs (Table S8). Subsequently, we conducted a haplotype analysis, revealing 47 GGIs with significant gene haplotype–trait associations (Table S8). Seven gene pairs have relevant annotations when combined with the GO annotation (Table S8).
To further evaluate the structural stability of these interactions, we predicted the protein structures of the 47 gene pairs using AlphaFold (https://deepmind.google/science/alphafold/alphafold-server/, accessed on 4 March 2026). We then used the predicted TM-score (pTM) as an indicator of potential structural compatibility. Gene pairs with a pTM value of at least 0.5 were retained, yielding 18 candidate GGIs, including TraesCS2A01G537100 and TraesCS5B01G409400 (Table S9). These analyses provide an overall multi-layer prioritization framework rather than direct experimental validation. The resulting candidate gene pairs are potential GGIs that may contribute to the genetic architecture of grain number per spike, and require further experimental validation (Figure 3b).

4. Discussion

This study combined the QTNs, QEIs, and QQIs identified in various models and environments to create a final, non-redundant set of 182 QTNs, 25 QEIs and 96 QQIs for GNS in a panel of 610 wheat accessions using 3VmrMLM. Two and one previously reported genes were found around QTNs and QEIs, respectively. Twenty-five candidate genes and 22 candidate GEIs were prioritized by integrating evidence from multiple sources, including haplotype analysis, functional annotation, homology with rice yield-related genes, and transcriptome data. Furthermore, 24 high-confidence GGIs were identified via co-expression analysis, PPI data, and AlphaFold structural predictions. Together, these results reveal the genetic basis of GNS and demonstrate that QTNs, QEIs, and QQIs contribute to trait variation.

4.1. Genetic Architecture of GNS in Wheat

GNS is a major yield component in wheat and exhibits a complex genetic architecture involving both additive and non-additive effects. Numerous linkage and association studies have shown that GNS is controlled by many loci distributed across the wheat genome, each with a small to moderate effect [35,36]. While QTNs explain some trait variation, significant QEIs and QQIs have been documented in wheat and other cereals. This indicates that non-additive and environment-dependent effects substantially contribute to phenotypic variation [37,38]. Compared with previous studies, which typically identified tens of loci for GNS using single-locus GWAS [4,5,37], this study used various modules of 3VmrMLM to identify more QTNs, QEIs, and QQIs, collectively explaining a large proportion of GNS variation across environments (Tables S1–S3). Based on the loci identified under three different modules, we approximately estimated the proportion of phenotypic variance explained by each genetic component. The results indicated that QTNs, QEIs, QQIs, and residual error explained 18%, 31%, 28%, and 23% of the total phenotypic variance, respectively. This pattern highlights the importance of environmental responsiveness and epistatic regulation in the genetic architecture of GNS. Unlike previous GWAS in wheat, which primarily focused on additive QTNs in single-environment GWAS [4,6,39], this study identified additional QEIs and QQIs. These findings provide a more comprehensive understanding of the genetic basis of GNS.

4.2. Candidate Genes and GEIs

By integrating association signals with functional annotations, homologous genes, transcriptome profiles, and haplotype analyses, we were able to prioritize 25 candidate genes and 22 GEIs around QTNs and QEIs, respectively (Figure 2). These genes were expressed in developing spike tissues, consistent with the developmental biology of grain number, in which early inflorescence and floret development determine final spikelet fertility [40]. Identifying eighteen candidate genes or GEIs with rice homologs that are known to regulate panicle or inflorescence architecture strengthens the functional inference. For example, OsRopGEF10 negatively regulates rice panicle development and yield by attenuating the signaling of cytokinin [31]. The wheat gene TraesCS1D01G280000 is a homolog of OsRopGEF10 and is located within a region containing QTNs that account for over 10% of the phenotypic variation (Table S5). Cytokinin signaling plays a critical role in regulating inflorescence development by maintaining meristem activity and promoting floret initiation [41,42]. Elevated cytokinin levels have been shown to enhance spikelet formation and floret survival, thereby increasing the number of fertile florets that ultimately contribute to grain number per spike [41,42]. The candidate gene TraesCS1B01G254300 is homologous to a rice gene NGR5 (or SMOS1) which positively regulates the nitrogen response and influence many important traits, including GNS [43]. GS8, a rice gene, is involved in gibberellin and cytokinin signaling by regulating the expression of genes associated with these pathways, such as OsGA20ox1, OsGA20ox2, and OsCKX1. These genes can influence GNS in rice [44]. Six of the identified candidate genes are wheat homologs of GS8 and are distributed across the three subgenomes: TraesCS1A01G398900, TraesCS1B01G426800, TraesCS1B01G426900, TraesCS1B01G427000, TraesCS1D01G406600, and TraesCS1D01G407700. Three of these genes likely constitute a tandem duplication. Furthermore, haplotype analysis revealed significant differences in GNS among these gene haplotypes, supporting the association between gene haplotypes and phenotypic variation. Integrating multiple lines of evidence layers helps refine candidate lists and provides supportive evidence for their potential biological relevance. Although this study identified several candidate genes based on GWAS and bioinformatics analysis, further functional validation is necessary to confirm their roles in regulating GNS. This validation can be achieved through gene editing or mutant analysis. Additionally, validation in independent populations is necessary to further confirm the stability and applicability of these loci.

4.3. Epistatic Interactions and Gene Networks

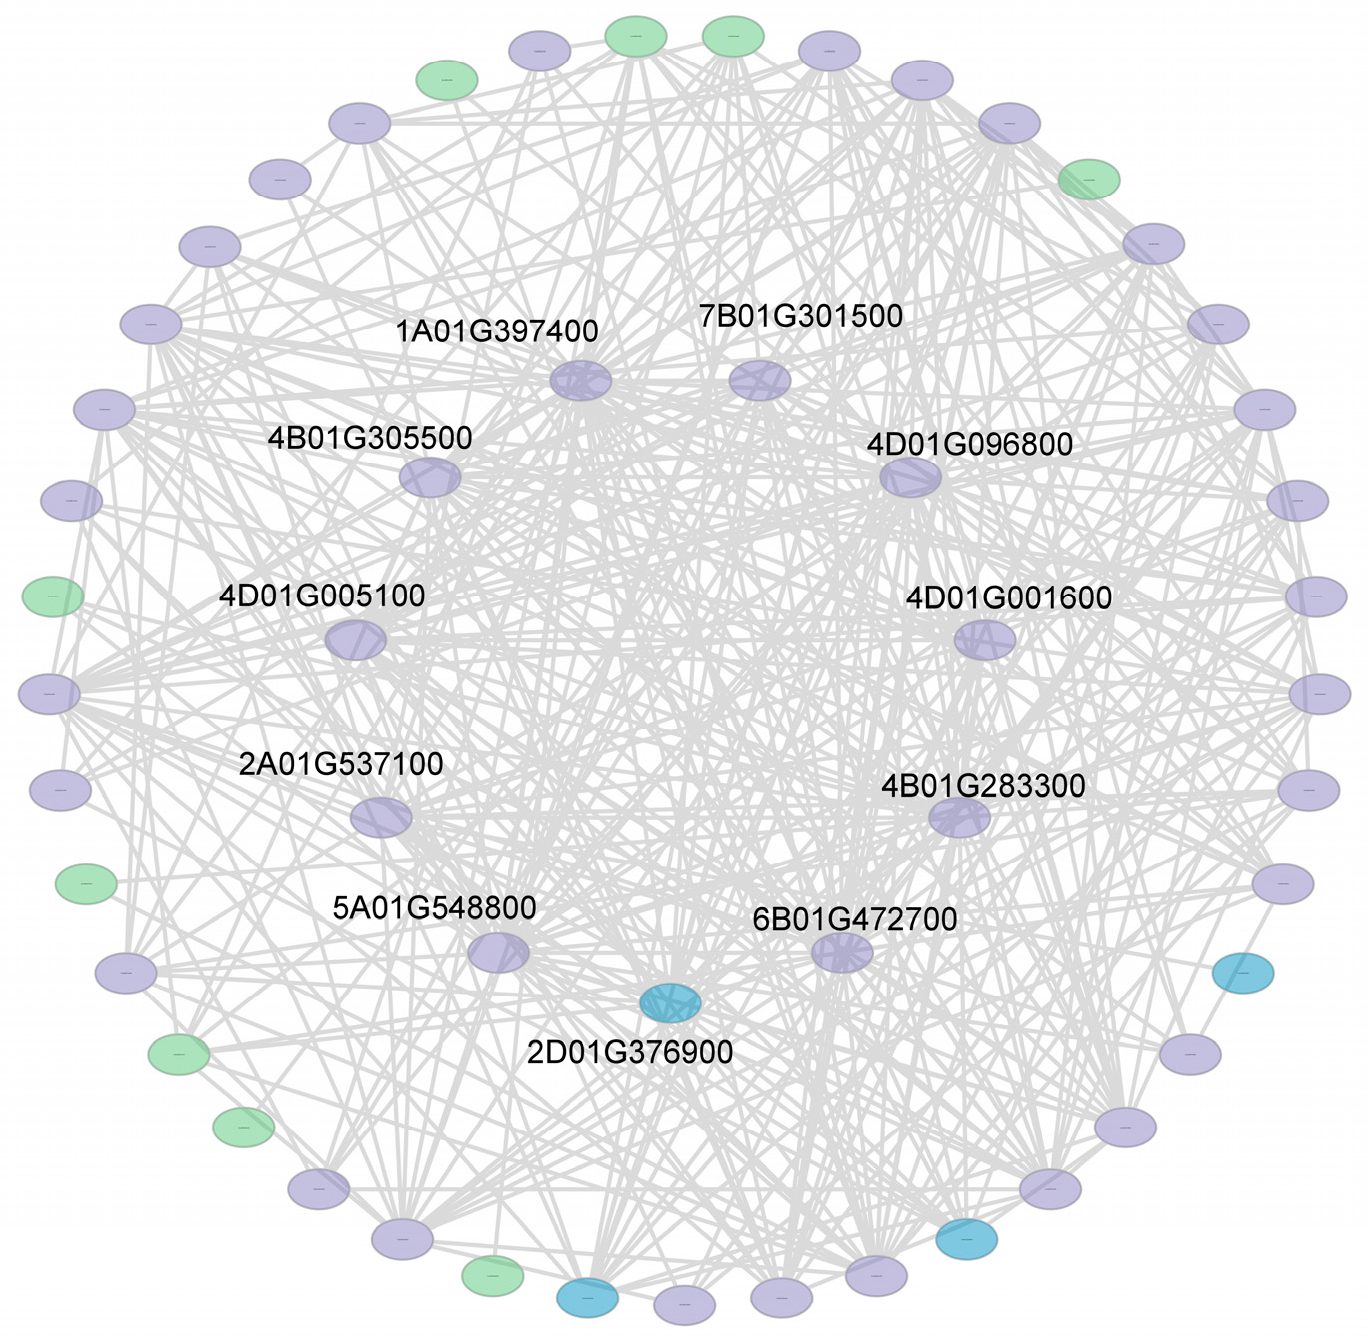
QQIs can contribute to its phenotypic variation (Table S3). Previous studies in wheat and other crops have highlighted the importance of epistasis in yield-related traits, indicating that interacting gene networks can influence trait expression more than individual loci alone [14,45]. In this study, evidence of co-expression, protein interactions, and structural modeling supported 24 candidate GGIs. Additionally, AlphaFold structural modeling was used to evaluate the structural feasibility of predicted PPIs. This approach provided additional support for interaction confidence rather than serving as direct experimental evidence. Combining these GGIs with candidate genes and GEIs, STRING built a gene network with 52 genes (Figure 4). In detail, 39 of the 52 genes were from the candidate GGI genes. Eleven genes were identified as hub genes in the network, with a degree exceeding 20; 10 of these hub genes were from the candidate GGI genes. These results suggest that the identified GGIs may play an important role in the regulatory network. Furthermore, four genes identified as candidate GEIs were also found in the network, suggesting that the environment may influence the network via GEIs. Constructing an interaction network from these GGIs highlights potential hub genes that may coordinate multiple regulatory pathways affecting spike development. Together, these results suggest that epistatic networks are integral to the genetic regulation of GNS.
GO enrichment analysis of the genes in the network revealed several statistically significant functional categories (Table S10). However, most terms were associated with a limited number of genes, which may reduce the robustness of the enrichment results. Notably, some enriched terms, such as the ubiquitin ligase complex, oxidoreductase activity, and the G protein-coupled receptor signaling pathway, are broadly related to protein turnover, metabolic processes, and signal transduction. These biological functions are consistent with the complex regulatory mechanisms underlying GNS. Due to the limited gene representation per term, however, these results should be interpreted with caution and considered as supportive rather than definitive evidence. Furthermore, these candidate interactions are based on integrative bioinformatic evidence and should be considered hypotheses to be validated by further experimental research.

4.4. Superior Haplotypes and Breeding Implications

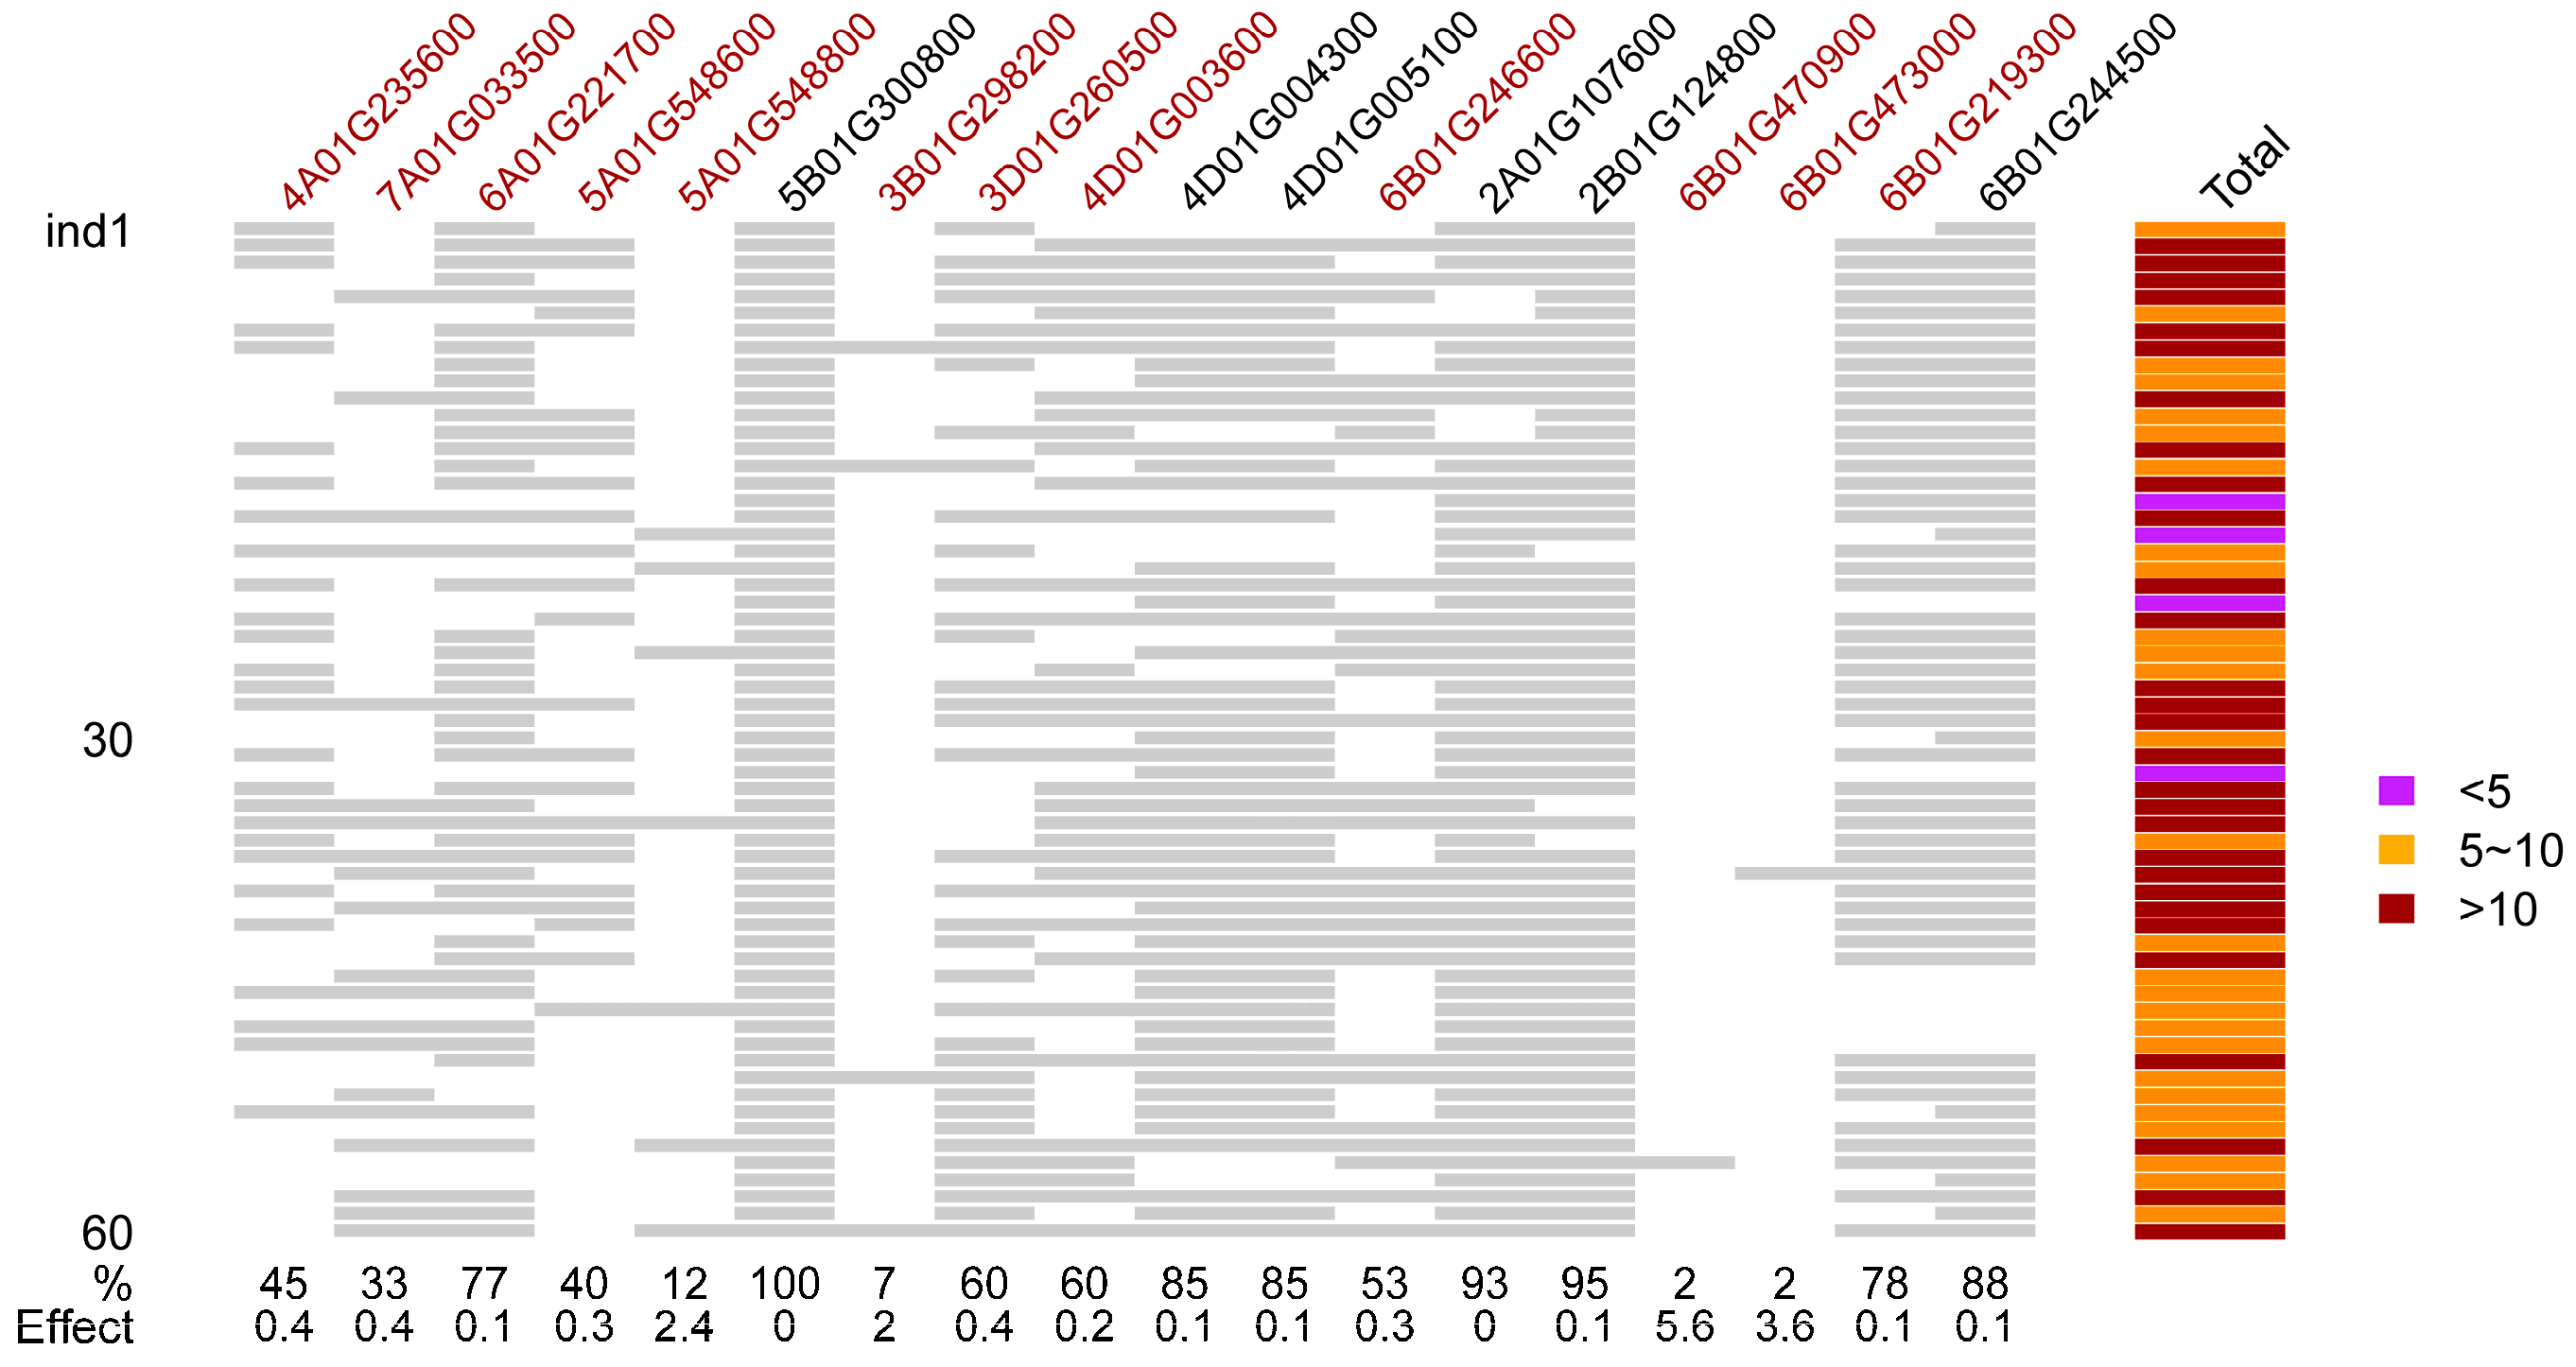
All the genes identified in this study were used to determine the superior haplotypes using the BLUP values through multiple comparisons. A total of 18 superior haplotypes were identified (Figure 5). The frequencies of these superior haplotypes were calculated using the top 10% of accessions with the largest values. This showed that the superior haplotypes of six genes were fully utilized, with frequencies over 0.80. The remaining 12 genes’ superior haplotypes are available for future wheat breeding, with effects ranging from 0.1 to 5.6 (Figure 5). Overall, our findings provide actionable targets for breeding and underscore the utility of multilayer genetic analysis for improving yield.

5. Conclusions

The study showed that QTNs, QEIs, QQIs, and residual error explained approximately 18%, 31%, 28%, and 23% of the total phenotypic variance, respectively. Twenty-five candidate genes and 22 candidate GEIs were prioritized through GWAS, bioinformatics, and haplotype analyses. Furthermore, 24 high-confidence GGIs were identified through co-expression, protein interaction prediction, and AlphaFold. Network construction revealed 11 potential hub genes that regulate spike development and demonstrated the importance of the identified GGIs in the regulatory network. Identifying 12 superior haplotypes provides valuable genetic resources for marker-assisted selection and genomic-enabled breeding. Overall, this study improves our understanding of the complex genetic architecture underlying GNS and provides valuable resources for future functional validation and molecular breeding in wheat.

Supplementary Materials

The following supporting information can be downloaded at: https://www.mdpi.com/article/10.3390/agronomy16080786/s1, Table S1. All QTNs detected to be associated with grain number per spike; Table S2. QTN-by-environment interactions detected by 3VmrMLM; Table S3. QTN-by-QTN interactions detected by 3VmrMLM; Table S4. Genes showed homology to previously reported rice genes around QTNs; Table S5. All the candidate genes identified around QTNs; Table S6. Genes with significant gene haplotype and environment interactions; Table S7. Candidate gene-by-environment interactions identified around QEIs; Table S8. 175 gene-by-gene interactions identified by STRING and gene expression data; Table S9. Interactions predicted by AlphaFold; Table S10. GO annotation of genes in the gene network.

Author Contributions

Formal analysis, Y.C. and Y.X.; investigation, C.P. and H.D.; data curation, Y.C.; writing—original draft, Y.C., Y.Z. and L.H.; writing—review and editing, Y.C., Y.Z. and L.H.; Supervision, L.H. and Y.Z.; Project Administration, L.H. and Y.Z.; Funding Acquisition, L.H. and Y.Z. All authors have read and agreed to the published version of the manuscript.

Funding

This study was supported by the National Natural Science Foundation of China, China (Grant Nos. 32270673 and 32470657), the National Key Research and Development Program of China (Grant No. 2021YFD1200603), and the Key Scientific and Technological Project of Henan Province (Grant No. 262102111135).

Data Availability Statement

The original contributions presented in the study are included in the article; further inquiries can be directed to the corresponding authors.

Acknowledgments

This study was supervised by Weigang Xu, a member of the Chinese Academy of Engineering.

Conflicts of Interest

The authors declare no conflicts of interest.

Abbreviations

The following abbreviations are used in this manuscript:
17AYAnyang in 2016–2017 growing seasons
17JYJiyuan in 2016–2017 growing seasons
17ZMDZhumadian in 2016–2017 growing seasons
18ZMDZhumadian in 2017–2018 growing seasons
ANOVAAnalysis of variance
BLUPBest linear unbiased prediction
GEIGene-by-environment interaction
GGIGene-by-gene interaction
GNSGrain number per spike
GOGene Ontology
GWASGenome-wide association study
LDLinkage disequilibrium
PPIProtein and protein interaction
pTMPredicted TM-score
PVEPhenotypic variance explained
QEIQTN-by-environment interaction
QTNQuantitative trait nucleotides
QQIQTN-by-QTN interaction

References

  1. Curtis, T.Y.; Halford, N.G. Food security: The challenge of increasing wheat yield and the importance of not compromising food safety. Ann. Appl. Biol. 2014, 164, 354–372. [Google Scholar] [CrossRef]
  2. Shewry, P.R.; Hey, S.J. The contribution of wheat to human diet and health. Food Energy Secur. 2015, 4, 178–202. [Google Scholar] [CrossRef] [PubMed]
  3. Ji, Z.; Liu, X.; Yan, F.; Wu, S.; Du, Y. The genetic basis of wheat spike architecture. Agriculture 2025, 15, 1575. [Google Scholar] [CrossRef]
  4. Gao, L.; Meng, C.; Yi, T.; Xu, K.; Cao, H.; Zhang, S.; Yang, X.; Zhao, Y. Genome-wide association study reveals the genetic basis of yield- and quality-related traits in wheat. BMC Plant Biol. 2021, 21, 144. [Google Scholar] [CrossRef]
  5. Lin, Y.; Jiang, X.; Hu, H.; Zhou, K.; Wang, Q.; Yu, S.; Yang, X.; Wang, Z.; Wu, F.; Liu, S.; et al. QTL mapping for grain number per spikelet in wheat using a high-density genetic map. Crop J. 2021, 9, 1108–1114. [Google Scholar] [CrossRef]
  6. Thakur, A.; Dhariwal, R.; Joshi, A.K.; Mishra, V.K.; Sharma, S.; Singh, M.K.; Kumar, S.; Vasistha, N.K. Genome-wide association study for agronomic and yield-related traits in spring wheat (Triticum aestivum L.) germplasm. BMC Plant Biol. 2025, 25, 1499. [Google Scholar] [CrossRef]
  7. Han, X.; Luo, Y.; Shu, G.; Wang, A.; Wang, Y.; Zhang, Y. Phenotypic Plasticity of maize flowering time and plant height using the interactions between QTNs and meteorological factors. Agronomy 2025, 15, 1078. [Google Scholar] [CrossRef]
  8. Han, X.; Wu, X.; Zhang, Y.; Tang, Q.; Zeng, L.; Liu, Y.; Xiang, Y.; Hou, K.; Fang, S.; Lei, W.; et al. Genetic and transcriptome analyses of the effect of genotype-by-environment interactions on Brassica napus seed oil content. Plant Cell 2025, 37, koaf062. [Google Scholar] [CrossRef]
  9. Zhao, Q.; Wang, T.; Pei, F.J.; Chen, Y.; Chang, X.Y.; Mi, J.M.; Zhang, Y.M. Phenotypic plasticity of grain size-related traits in main-crop and ratoon rice. Plant Cell Environ. 2025, 48, 3890–3901. [Google Scholar] [CrossRef] [PubMed]
  10. Chen, Y.; Dong, H.B.; Peng, C.J.; Du, X.J.; Li, C.X.; Han, X.L.; Sun, W.X.; Zhang, Y.M.; Hu, L. Phenotypic plasticity of flowering time and plant height related traits in wheat. BMC Plant Biol. 2025, 25, 636. [Google Scholar] [CrossRef] [PubMed]
  11. Paraiso, F.; Lin, H.; Li, C.; Woods, D.P.; Lan, T.; Tumelty, C.; Debernardi, J.M.; Joe, A.; Dubcovsky, J. LEAFY and WAPO1 jointly regulate spikelet number per spike and floret development in wheat. Development 2024, 151, dev202803. [Google Scholar] [CrossRef]
  12. Jarquín, D.; Crossa, J.; Lacaze, X.; Du Cheyron, P.; Daucourt, J.; Lorgeou, J.; Piraux, F.; Guerreiro, L.; Pérez, P.; Calus, M.; et al. A reaction norm model for genomic selection using high-dimensional genomic and environmental data. Theor. Appl. Genet. 2014, 127, 595–607. [Google Scholar] [CrossRef]
  13. Sukumaran, S.; Crossa, J.; Jarquín, D.; Reynolds, M. Pedigree-based prediction models with genotype × environment interaction in multienvironment trials of CIMMYT wheat. Crop Sci. 2017, 57, 1865–1880. [Google Scholar] [CrossRef]
  14. Mackay, T.F.C. Epistasis and quantitative traits: Using model organisms to study gene–gene interactions. Nat. Rev. Genet. 2014, 15, 22–33. [Google Scholar] [CrossRef] [PubMed]
  15. Sehgal, D.; Autrique, E.; Singh, R.; Ellis, M.; Singh, S.; Dreisigacker, S. Identification of genomic regions for grain yield and yield stability and their epistatic interactions. Sci. Rep. 2017, 7, 41578. [Google Scholar] [CrossRef]
  16. Mizuno, N.; Ishikawa, G.; Kojima, H.; Tougou, M.; Kiribuchi-Otobe, C.; Fujita, M.; Nakamura, K. Genetic mechanisms determining grain number distribution along the spike and their effect on yield components in wheat. Mol. Breed. 2021, 41, 62. [Google Scholar] [CrossRef] [PubMed]
  17. Li, M.; Zhang, Y.W.; Zhang, Z.C.; Xiang, Y.; Liu, M.H.; Zhou, Y.H.; Zuo, J.F.; Zhang, H.Q.; Chen, Y.; Zhang, Y.M. A compressed variance component mixed model for detecting QTNs and QTN-by-environment and QTN-by-QTN interactions in genome-wide association studies. Mol. Plant 2022, 15, 630–650. [Google Scholar] [CrossRef] [PubMed]
  18. Li, M.; Zhang, Y.W.; Xiang, Y.; Liu, M.H.; Zhang, Y.M. IIIVmrMLM: The R and C++ tools associated with 3VmrMLM, a comprehensive GWAS method for dissecting quantitative traits. Mol. Plant 2022, 15, 1251–1253. [Google Scholar] [CrossRef]
  19. Ai, G.; He, C.; Bi, S.; Zhou, Z.; Liu, A.; Hu, X.; Liu, Y.; Jin, L.; Zhou, J.; Zhang, H.; et al. Dissecting the molecular basis of spike traits by integrating gene regulatory networks and genetic variation in wheat. Plant Commun. 2024, 5, 100879. [Google Scholar] [CrossRef]
  20. Peng, C.; Chen, Y.; Han, X.; Dong, H.; Zheng, A.; Du, X.; Chang, X.; Zhao, M.; Qi, X.; Zhang, Y.; et al. Genome-wide analysis reveals the genetic basis of key agronomic traits and modern wheat breeding in Henan Province. Genom. Proteom. Bioinform. 2026, qzag015. [Google Scholar] [CrossRef]
  21. Bates, D.; Mächler, M.; Bolker, B.; Walker, S. Fitting linear mixed-effects models using lme4. J. Stat. Softw. 2015, 67, 1–48. [Google Scholar] [CrossRef]
  22. Sun, C.; Dong, Z.; Zhao, L.; Ren, Y.; Zhang, N.; Chen, F. The wheat 660k SNP array demonstrates great potential for marker-assisted selection in polyploid wheat. Plant Biotechnol. J. 2020, 18, 1354–1360. [Google Scholar] [CrossRef]
  23. Browning, S.R.; Browning, B.L. Rapid and accurate haplotype phasing and missing-data inference for whole-genome association studies by use of localized haplotype clustering. Am. J. Hum. Genet. 2007, 81, 1084–1097. [Google Scholar] [CrossRef]
  24. Chang, C.C.; Chow, C.C.; Tellier, L.C.A.M.; Vattikuti, S.; Purcell, S.M.; Lee, J.J. Second-generation PLINK: Rising to the challenge of larger and richer datasets. GigaScience 2015, 4, 7. [Google Scholar] [CrossRef]
  25. Zhang, C.; Dong, S.S.; Xu, J.Y.; He, W.M.; Yang, T.L. PopLDdecay: A fast and effective tool for linkage disequilibrium decay analysis based on variant call format files. Bioinformatics 2019, 35, 1786–1788. [Google Scholar] [CrossRef]
  26. Emms, D.M.; Kelly, S. OrthoFinder: Solving fundamental biases in whole genome comparisons dramatically improves orthogroup inference accuracy. Genome Biol. 2015, 16, 157. [Google Scholar] [CrossRef]
  27. Liu, Z.; Xin, M.; Qin, J.; Peng, H.; Ni, Z.; Yao, Y.; Sun, Q. Temporal transcriptome profiling reveals expression partitioning of homeologous genes contributing to heat and drought acclimation in wheat (Triticum aestivum L.). BMC Plant Biol. 2015, 15, 152. [Google Scholar] [CrossRef] [PubMed]
  28. Da Ros, L.; Bollina, V.; Soolanayakanahally, R.; Pahari, S.; Elferjani, R.; Kulkarni, M.; Vaid, N.; Risseuw, E.; Cram, D.; Pasha, A.; et al. Multi-omics atlas of combinatorial abiotic stress responses in wheat. Plant J. 2023, 116, 1118–1135. [Google Scholar] [CrossRef]
  29. Love, M.I.; Huber, W.; Anders, S. Moderated estimation of fold change and dispersion for RNA-seq data with DESeq2. Genome Biol. 2014, 15, 550. [Google Scholar] [CrossRef] [PubMed]
  30. Kong, X.; Wang, F.; Wang, Z.; Gao, X.; Geng, S.; Deng, Z.; Zhang, S.; Fu, M.; Cui, D.; Liu, S.; et al. Grain yield improvement by genome editing of TaARF12 that decoupled peduncle and rachis development trajectories via differential regulation of gibberellin signalling in wheat. Plant Biotechnol. J. 2023, 21, 1990–2001. [Google Scholar] [CrossRef] [PubMed]
  31. Schilling, S.; Kennedy, A.; Pan, S.; Jermiin, L.S.; Melzer, R. Genome-wide analysis of MIKC-type MADS-box genes in wheat: Pervasive duplications, functional conservation and putative neofunctionalization. New Phytol. 2020, 225, 511–529. [Google Scholar] [CrossRef]
  32. Hama, E.; Takumi, S.; Ogihara, Y.; Murai, K. Pistillody is caused by alterations to the class-B MADS-box gene expression pattern in alloplasmic wheats. Planta 2004, 218, 712–720. [Google Scholar] [CrossRef] [PubMed]
  33. Li, M.; Feng, L.; Ye, H.; Li, M.; Jin, J.; Tao, L.Z.; Liu, H. OsRopGEF10 attenuates cytokinin signaling to regulate panicle development and grain yield in rice. Rice 2024, 17, 57. [Google Scholar] [CrossRef] [PubMed]
  34. Shitsukawa, N.; Tahira, C.; Kassai, K.; Hirabayashi, C.; Shimizu, T.; Takumi, S.; Mochida, K.; Kawaura, K.; Ogihara, Y.; Murai, K. Genetic and epigenetic alteration among three homoeologous genes of a class E MADS box gene in hexaploid wheat. Plant Cell 2007, 19, 1723–1737. [Google Scholar] [CrossRef] [PubMed]
  35. Sukumaran, S.; Lopes, M.; Dreisigacker, S.; Reynolds, M. Genetic analysis of multi-environmental spring wheat trials identifies genomic regions for locus-specific trade-offs for grain weight and grain number. Theor. Appl. Genet. 2018, 131, 985–998. [Google Scholar] [CrossRef]
  36. Liu, B.; Li, L.; Fu, C.; Zhang, Y.; Bai, B.; Du, J.; Zeng, J.; Bian, Y.; Liu, S.; Song, J.; et al. Genetic dissection of grain morphology and yield components in a wheat line with defective grain filling. Theor. Appl. Genet. 2023, 136, 165. [Google Scholar] [CrossRef]
  37. Raffo, M.A.; Sarup, P.; Guo, X.; Liu, H.; Andersen, J.R.; Orabi, J.; Jahoor, A.; Jensen, J. Improvement of genomic prediction in advanced wheat breeding lines by including additive-by-additive epistasis. Theor. Appl. Genet. 2022, 135, 965–978. [Google Scholar] [CrossRef]
  38. Eltaher, S.; Baenziger, P.S.; Belamkar, V.; Emara, H.A.; Nower, A.A.; Salem, K.F.M.; Alqudah, A.M.; Sallam, A. GWAS revealed effect of genotype × environment interactions for grain yield of Nebraska winter wheat. BMC Genom. 2021, 22, 2. [Google Scholar] [CrossRef]
  39. Malik, P.; Kumar, J.; Sharma, S.; Meher, P.; Balyan, H.; Gupta, P.; Sharma, S. GWAS for main effects and epistatic interactions for grain morphology traits in wheat. Physiol. Mol. Biol. Plants 2022, 28, 651–668. [Google Scholar] [CrossRef]
  40. Kellogg, E.A. Evolutionary history of the grasses. Plant Physiol. 2001, 125, 1198–1205. [Google Scholar] [CrossRef]
  41. Sharma, A.; Prakash, S.; Chattopadhyay, D. Killing two birds with a single stone-genetic manipulation of cytokinin oxidase/dehydrogenase (CKX) genes for enhancing crop productivity and amelioration of drought stress response. Front. Genet. 2022, 13, 941595. [Google Scholar] [CrossRef] [PubMed]
  42. Awale, P.; McSteen, P. Hormonal regulation of inflorescence and intercalary meristems in grasses. Curr. Opin. Plant Biol. 2023, 76, 102451. [Google Scholar] [CrossRef] [PubMed]
  43. Wu, K.; Wang, S.; Song, W.; Zhang, J.; Wang, Y.; Liu, Q.; Yu, J.; Ye, Y.; Li, S.; Chen, J.; et al. Enhanced sustainable green revolution yield via nitrogen-responsive chromatin modulation in rice. Science 2020, 367, eaaz2046. [Google Scholar] [CrossRef]
  44. Ang, Y.; Li, B.; Shen, J.; Li, J.; Zhao, Y.; Li, T.; Sun, H.; Cheng, X.; Wu, F.; Du, M.; et al. The GRAIN SIZE 8-GRAIN LENGTH 10 module controls the grain size in rice by regulating the expression of GA- and CTK-related genes. Plant J. 2025, 122, e70247. [Google Scholar] [CrossRef]
  45. Jiang, Y.; Schmidt, R.H.; Zhao, Y.; Reif, J.C. A quantitative genetic framework highlights the role of epistatic effects for grain-yield heterosis in bread wheat. Nat. Genet. 2017, 49, 1741–1746. [Google Scholar] [CrossRef] [PubMed]
Figure 1. Phenotypic analysis of grain number per spike (GNS) in wheat. (a) Distribution of the best linear unbiased prediction; (b) Comparison of GNS phenotypes across environments using analysis of variance and LSD multiple comparisons at the 0.05 significant level. The blue curve represents the fitted density curve. Different lowercase letters indicate significant differences between groups as determined by LSD multiple comparisons.
Agronomy 16 00786 g001
Figure 2. Manhattan plots of QTNs and QEIs for grain number per spike. (a) Manhattan plot of QTNs. MEJA: multiple environment joint analysis; (b) Manhattan plot of QEIs. In both panels, the dark gray and light gray background points represent the negative logarithmic transformation of the p-value (−log10 (p value)), with p-values obtained from genome-wide scanning in the first step. The colored, highlighted points in panel (a) and black points in panel (b) represent the LOD scores, which was obtained from the likelihood ratio test in the second step. The x-axis shows the chromosomal and physical coordinates of markers. The left y-axis shows −log10 (p value), and the right y-axis shows LOD scores. The gray horizontal line indicates the LOD score threshold of 3.0 for suggested loci. For clarity, the prefix “TraesCS” was removed from the candidate genes.
Agronomy 16 00786 g002
Figure 3. Gene-by-gene interactions for grain number per spike. (a) Correlation analysis of gene expression levels; (b) Distribution of gene-by-gene interactions in the genome. The links and points are colored according to environments: 17AY (blue-purple, #6A5ACD), 17JY (steel blue, #4682B4), 17ZMD (medium sea green, #3CB371), 18ZMD (dark olive green, #556B2F), and BLUP (dark goldenrod, #B8860B).
Agronomy 16 00786 g003
Figure 4. Gene network constructed by STRING database using all the identified genes. Blue, green and purple indicate the genes from candidate genes, gene-by-environment interactions and gene-by-gene interactions, respectively. The “TraesCS” in candidate gene names has been removed.
Agronomy 16 00786 g004
Figure 5. Distribution of superior haplotypes in the top 60 wheat accessions with the largest phenotypes of grain number per spike. The “TraesCS” in gene names has been removed. The effects and its frequencies (%) of superior haplotypes in the top 60 wheat accessions were marked. The gene names in dark red are available for breeding, and the gene names in black are fully used. For each cell, gray fill indicates that the individual carries the superior haplotype for that gene, whereas white fill indicates absence.
Agronomy 16 00786 g005
Disclaimer/Publisher’s Note: The statements, opinions and data contained in all publications are solely those of the individual author(s) and contributor(s) and not of MDPI and/or the editor(s). MDPI and/or the editor(s) disclaim responsibility for any injury to people or property resulting from any ideas, methods, instructions or products referred to in the content.