Article

Effect of Red–Blue Light Ratios on Leaf Development and Steviol Glycoside Production at Different Growth Stages in Hydroponic Stevia

1
Department of Food Science, National Taiwan Ocean University, Keelung 202301, Taiwan
2
Institute of Food Safety and Risk Management, National Taiwan Ocean University, Keelung 202301, Taiwan
*
Authors to whom correspondence should be addressed.
Agronomy 2026, 16(8), 770; https://doi.org/10.3390/agronomy16080770
Submission received: 3 March 2026 / Revised: 3 April 2026 / Accepted: 4 April 2026 / Published: 8 April 2026

Abstract

Stevia is a natural source of high-intensity sweeteners, collectively known as steviol glycosides (SG), which are approximately 300 times sweeter than sucrose and widely used as sugar substitutes. This study examines the impact of five different red-to-blue (R:B) light ratios on SG content and yield in hydroponic Stevia across four growth stages. Results indicate that the highest and lowest leaf dry weights were recorded in the R1B0 (R:B = 1:0) and R0B1 (R:B = 0:1) groups, at 2.88 and 1.98 g/plant, respectively, reflecting a 45.45% difference. The total SG content in dried leaves was highest in R0B1 (196.32 mg/g) and lowest in R1B0 (115.16 mg/g), with a 70.48% variation. The highest and lowest total SG yields (YSG) per square meter were observed in R0B1 (46.56 g/m2) and R50B37 (35.70 g/m2), differing by 30.42%. Stage-specific optimal YSG values were identified, with designated growth stages P1 (early vegetative growth phase), P2 (early leaf development phase), and P3 (late leaf development phase) favoring R4B1 and P4 (leaf senescence phase) favoring R0B1. These findings suggest an optimized lighting strategy for the four growth stages of hydroponic Stevia, sequentially applying R4B1, R4B1, R4B1 and R0B1 to enhance biomass accumulation and SG production at different developmental stages.

1. Introduction

Stevia (Stevia rebaudiana Bertoni) is a perennial short-day crop belonging to the Asteraceae family, characterized by its densely branched shrub-like growth. Native to Paraguay [1], its cultivation has expanded across the Eurasian continent and Canada [2,3]. The optimal growth temperature ranges from 20 to 24 °C [4], with an average plant height of 65–80 cm. It thrives in soil with a pH of 6.5–7.5 [5] and is highly sensitive to water availability, requiring timely irrigation to prevent wilting. In open-field cultivation systems, Stevia productivity can vary substantially depending on region and agronomic conditions. For example, a report from India indicated that Stevia may be harvested approximately 4–6 times per year, with a leaf dry weight of 15–35 g/plant under outdoor conditions [6]. The leaves contain steviol glycosides (SG) [7], which account for 4–20% of the DW [8]. With a sweetness approximately 300 times that of sucrose, SG exhibit high thermal stability, tolerating temperatures up to 200 °C [9]. In Taiwan, Stevia is approved as a food additive in products such as sunflower seeds, candied fruits, ice cream, pastries, and chewing gum, with specific usage regulations [10]. One hectare of farmland can produce 1000–1200 kg of Stevia DW, from which 60–70 kg of stevioside (ST) can be extracted—an equivalent sweetness yield of 18,000–21,000 kg of sucrose [11].
SG are secondary metabolites of Stevia rebaudiana, sharing a common steviol backbone but differing in the type and number of sugar moieties attached at the C13 and C19 positions. These sugar moieties typically include glucose, rhamnose, or xylose, resulting in various glycoside compositions [12,13]. Major SG components identified through chromatographic separation include ST, steviolbioside (STB), rebaudiosides A–F (RA–RF), and dulcoside A (Du) [13]. The contents of ST, RA, rebaudioside C (RC), and Du in Stevia leaves are approximately 4–13% (w/w), 2–4%, 1–2%, and 0.4–0.7% of dry weight (DW), respectively [14]. SG in Stevia rebaudiana leaves originate from the diterpene steviol, which is synthesized through a branch of the gibberellic acid (GA) biosynthetic pathway. Following pathway divergence, kaurenoic acid undergoes hydroxylation by ent-kaurenoic acid 13-hydroxylase (KA13H) to form steviol, which is subsequently catalyzed by a series of UDP-glucosyltransferases (UGTs) to produce various SG [15,16,17].
Hernández et al. [18] reported that light conditions influence SG accumulation in different Stevia varieties, with KA13H, UGT74G1, and UGT76G1 playing key roles in SG biosynthesis and potentially affecting the accumulation of RA and ST. Yoneda et al. [19] investigated the effects of five different light qualities on Stevia cultivation and analyzed the relative transcription levels of SG-related genes. Their findings revealed that in the group treated with the ratio of blue and red light relative intensity (B/R), the expression of ent-kaurene 19-oxidase (KO), UGT74G1, UGT85C2, and UGT76G1 was significantly upregulated under blue light treatment. UGT74G1 primarily converts STB to ST, UGT85C2 facilitates the conversion of steviol to steviolmonoside, and UGT76G1 converts ST to RA. Additionally, the study found that under red and far-red light conditions (R/FR), an R/FR ratio of 1.22 yielded the highest gene expression, highlighting the critical role of light quality in regulating SG biosynthesis.
In plant physiology, beyond the role of chlorophyll in photosynthesis, five specific photoreceptors play a crucial role in regulating plant growth, as well as the synthesis and accumulation of metabolites. These photoreceptors are highly sensitive to light and can absorb and respond to specific wavelengths, even at very low intensities. Paradiso and Proietti [20] synthesized multiple studies categorizing crops into leaf vegetables, fruits, root crops, flowers, and ornamental species, examining the effects of light quality, light intensity, and photoperiod on plant growth, photosynthetic efficiency, and secondary metabolite accumulation. Their findings indicate that a higher proportion of red light generally enhances yield, whereas blue light promotes specific metabolite accumulation such as glucosinolates in cauliflower and of chlorogenic acid in basil and tomato. Also, the synthesis of phenolic compounds in general and anthocyanins in particular, are promoted by blue and UV-B irradiation. The ability of plants to sense and respond to light conditions is fundamental to plant physiology, influencing their adaptation to changing environments through modifications in internal processes. These adaptations include alterations in photosynthetic efficiency, chloroplast size and distribution, leaf morphology (e.g., surface area and thickness), and overall optimization of light capture and CO2 assimilation [21,22,23,24].
Plants possess five major types of photoreceptors, each absorbing distinct wavelengths and exerting specific physiological effects. These include phytochromes (PHYs), which absorb red and far-red light; cryptochromes (CRYs), phototropins (PHOTs), and ZTL/FKF1/LKP2 photoreceptors, which absorb blue and ultraviolet A light; and the UVR8 photoreceptor, which is specific to ultraviolet B light [25]. PHYs primarily regulate the light balance equation of the red-to-far-red (R/FR) ratio [26], which triggers a range of complex physiological responses. These responses include stem and petiole elongation, stomatal density on the abaxial leaf surface, flowering time, and chlorophyll content per leaf [27]. A reduction in the R/FR ratio enhances nutrient allocation, promoting accelerated stem and leaf growth [26]. CRYs play a crucial role in regulating circadian rhythms, metabolite accumulation, and plant adaptability, ultimately influencing crop quality [28,29]. PHOTs are key regulators of photosynthesis, controlling chloroplast rearrangement and density. They enable efficient light absorption at lower intensities while mitigating light-induced damage under high-intensity conditions [30]. In Arabidopsis, FKF1 and LKP2 control the circadian cycle effect [31] and the flowering time influenced by the photoperiod [32].
Shulgina et al. [33] investigated the relationship between different light quality combinations and ST content in Stevia leaves. Their study utilized various spectral compositions, including short-wavelength red (SR, 620 nm), long-wavelength red (LR, 660 nm), far-red (FR, 730 nm), and blue (B) light. Five lighting treatments were applied: SR + LR + FR + B, LR + FR + B, SR + FR + B, SR + LR + B, and SR + LR + FR. Among these treatments, the SR + LR + FR group exhibited the highest cumulative ST content. Ucar et al. [34] examined the effects of red-to-blue (R/B) light ratios on Stevia morphology and overall yield. Three R/B ratios were tested: 30% blue + 70% red, 50% blue + 50% red, and 70% blue + 30% red, with a photosynthetic photon flux density (PPFD) of 150 μmol m−2·s−1 and a 16-h photoperiod. The highest yield was achieved under the 50% blue + 50% red treatment. Son and Oh [35] explored the impact of six red-to-blue light ratios (0B:100R, 13B:87R, 26B:74R, 35B:65R, 47B:53R, and 59B:41R) on red and green leaf lettuce growth under a PPFD of 171 ± 7 μmol m−2·s−1 and a photoperiod of 12 h/day. Their findings indicated that total flavonoid content was highest in treatments with a greater proportion of blue light, specifically at 47B:53R for red leaf lettuce and 59B:41R for green leaf lettuce. Meanwhile, optimal leaf morphology and size were observed in the 0B:100R treatment. Ceunen et al. [36] investigated photoperiod manipulation to enhance SG accumulation. Given that Stevia is a short-day crop, typically requiring 12–13 h of daylight, their study extended the photoperiod by increasing red light exposure at night over a 49-day period. This treatment resulted in a higher accumulation of SG compared to conventional daylight exposure. Modarelli et al. [37] examined the effects of three different light intensities under a fixed red-to-blue light ratio of 4:1. The highest PPFD (389 μmol·m−2·s−1) resulted in the greatest yield for red leaf lettuce.
Numerous studies have explored the effects of varying red-to-blue (R/B) light ratios on vegetable crop yields; however, research on their application to hydroponic Stevia cultivation remains limited. Furthermore, most studies investigating the effects of light quality on Stevia growth and steviol glucoside accumulation have been conducted in field conditions, where isolating individual variables is challenging. Research conducted in controlled environments has primarily focused on in vitro experiments or small-scale studies, which pose significant limitations when extrapolating findings to hydroponic systems for practical applications. Additionally, these studies have predominantly analyzed flavonoid, phenolic, or total steviol glucoside content, without providing a comprehensive investigation into the concentrations of individual steviol glucosides. Specifically, there is a lack of comprehensive studies examining the impact of different R/B light combinations on Stevia leaf yield, the composition and accumulation of SG, and other related parameters. Additionally, little attention has been given to how different growth stages influence the composition of SG in Stevia. This study aims to cultivate Stevia in a high-density hydroponic system (120 plants/m2) under controlled environmental conditions and to optimize leaf yield, as well as the total content and yield of steviol glycosides (SGs), by applying specific red-to-blue (R/B) light ratios tailored to different growth stages. To achieve this, the Stevia growth cycle is divided into four distinct designated stages, with each stage subjected to a specific R/B light ratio to stimulate growth. Key parameters, including fresh leaf weight (FW), DW, and SG content and yield, are analyzed at each stage. The findings of this study are expected to provide valuable insights and practical recommendations for optimizing environmental conditions in hydroponic Stevia cultivation.

2. Materials and Methods

2.1. Plant Material

The hydroponic seedling cultivation was conducted by NuPOLAR-LIGHTS Opto Co., Ltd., located in New Taipei City, Taiwan. The Stevia variety is Criolla, which is a historically established variety in Paraguay and exhibit a characteristic steviol glycoside profile. Seedling containers measuring 60 × 40 × 8 cm (L × W × H) were used in the experiment. The Stevia seedlings were cultivated from seeds under controlled environmental conditions from germination to the seedling stage. The seeds were obtained from the same origin and grower to minimize genetic variation. Before transplantation, seedlings were selected to ensure uniform initial growth, with a height of 7 ± 0.5 cm, and individuals showing abnormal morphology or visible damage were excluded. For each experimental condition, 120 seedlings with comparable growth status were used, and a total of 600 seedlings were cultivated in each batch for subsequent experimental stages. Although a large number of plants were used in each treatment, these plants were considered subsamples within each independent cultivation batch rather than independent experimental units.

2.2. Culture System

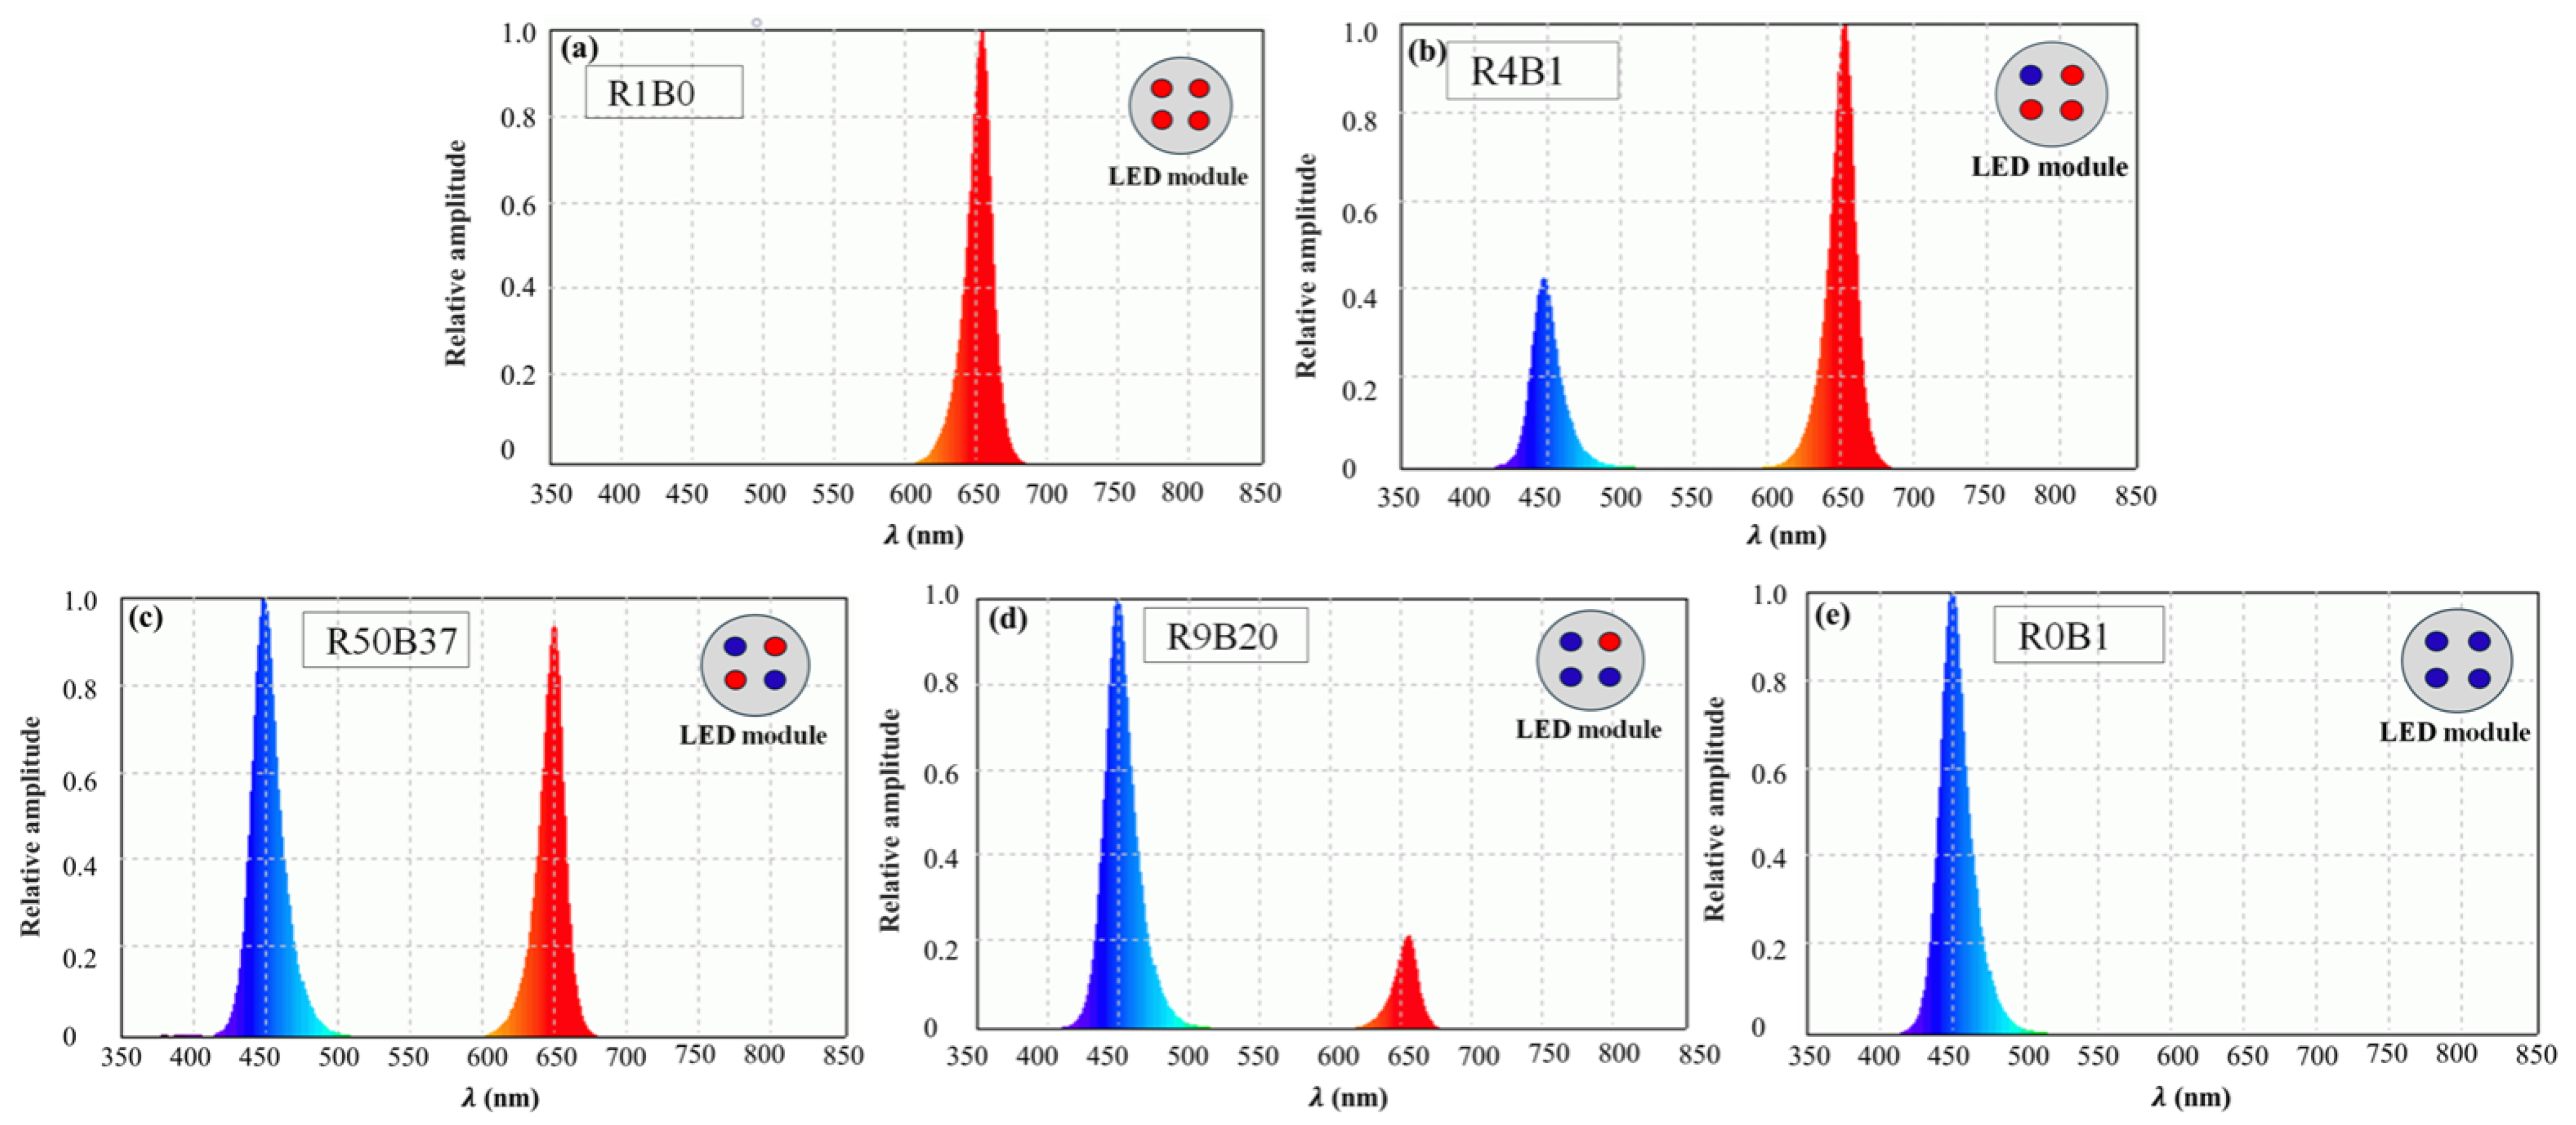
The experimental work was conducted over a total period from 1 September 2023, to 31 January 2026, comprising three independent cultivation batches. In each batch, approximately two months were required for seed germination and seedling establishment, followed by about four months of cultivation until harvest. Thus, each experimental batch lasted approximately six months. All experiments were performed under fully controlled indoor conditions; therefore, seasonal variation was not expected to significantly influence the results. A LED plant growth rack with two layers was employed to examine the effects of five different red-to-blue light ratios on plant growth. Each layer comprised three cultivation compartments, each measuring 100 × 100 × 100 cm (L × W × H). A total of five compartments were utilized in this study, with each compartment equipped with LED modules at the top that emitted different red and blue light spectra. Each module consists of four high-power LEDs, which can be individually adjusted to emit either red or blue light. In the present study, the different light ratios were achieved by configuring the four high-power LEDs in each module as follows: all four as red light, three red and one blue, two red and two blue, one red and three blue, and all four as blue light. The spectral irradiance ratios were measured accordingly, yielding approximate red-to-blue (R:B) ratios of 1:0, 4:1, 50:37, 9:20, and 0:1, which was abbreviated as R1B0 (red to blue light intensity ratio of 1:0), R4B1, R50B37, R9B20, and R0B1, respectively. The spectral output of the LED modules was characterized using a spectroradiometer (LI-1800, LI-COR, Lincoln, NE, USA) in an integrating sphere. Prior to measurement, the instrument was calibrated using a standard reference component according to the manufacturer’s procedure. Because the LED modules were designed with independent red and blue circuits, the red and blue channels were illuminated separately to determine their respective spectral distributions. The light quality spectra for each combination are shown in Figure 1a–e. The relative amplitude on the Y-axis was derived by normalizing the spectral irradiance signals obtained from the measurements, with units expressed as W/m2·nm.
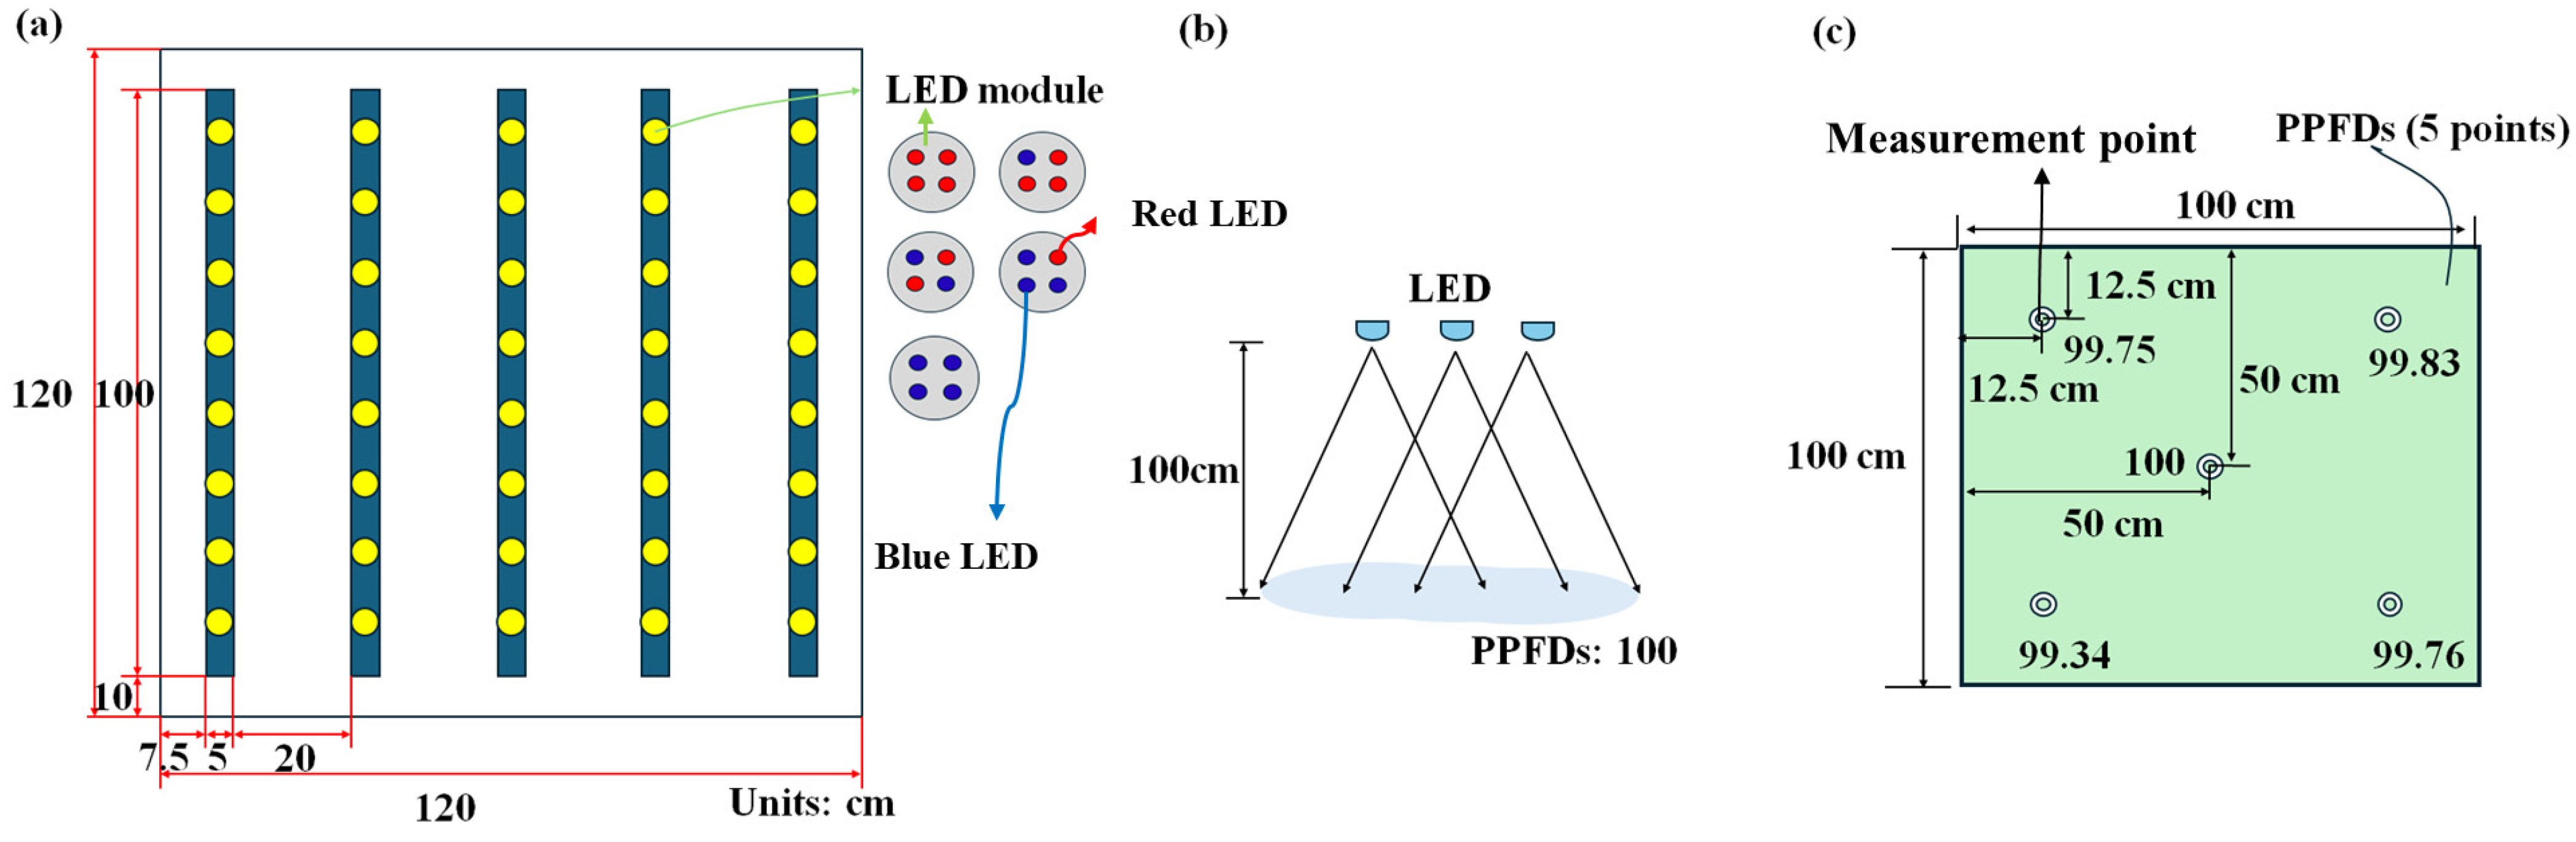
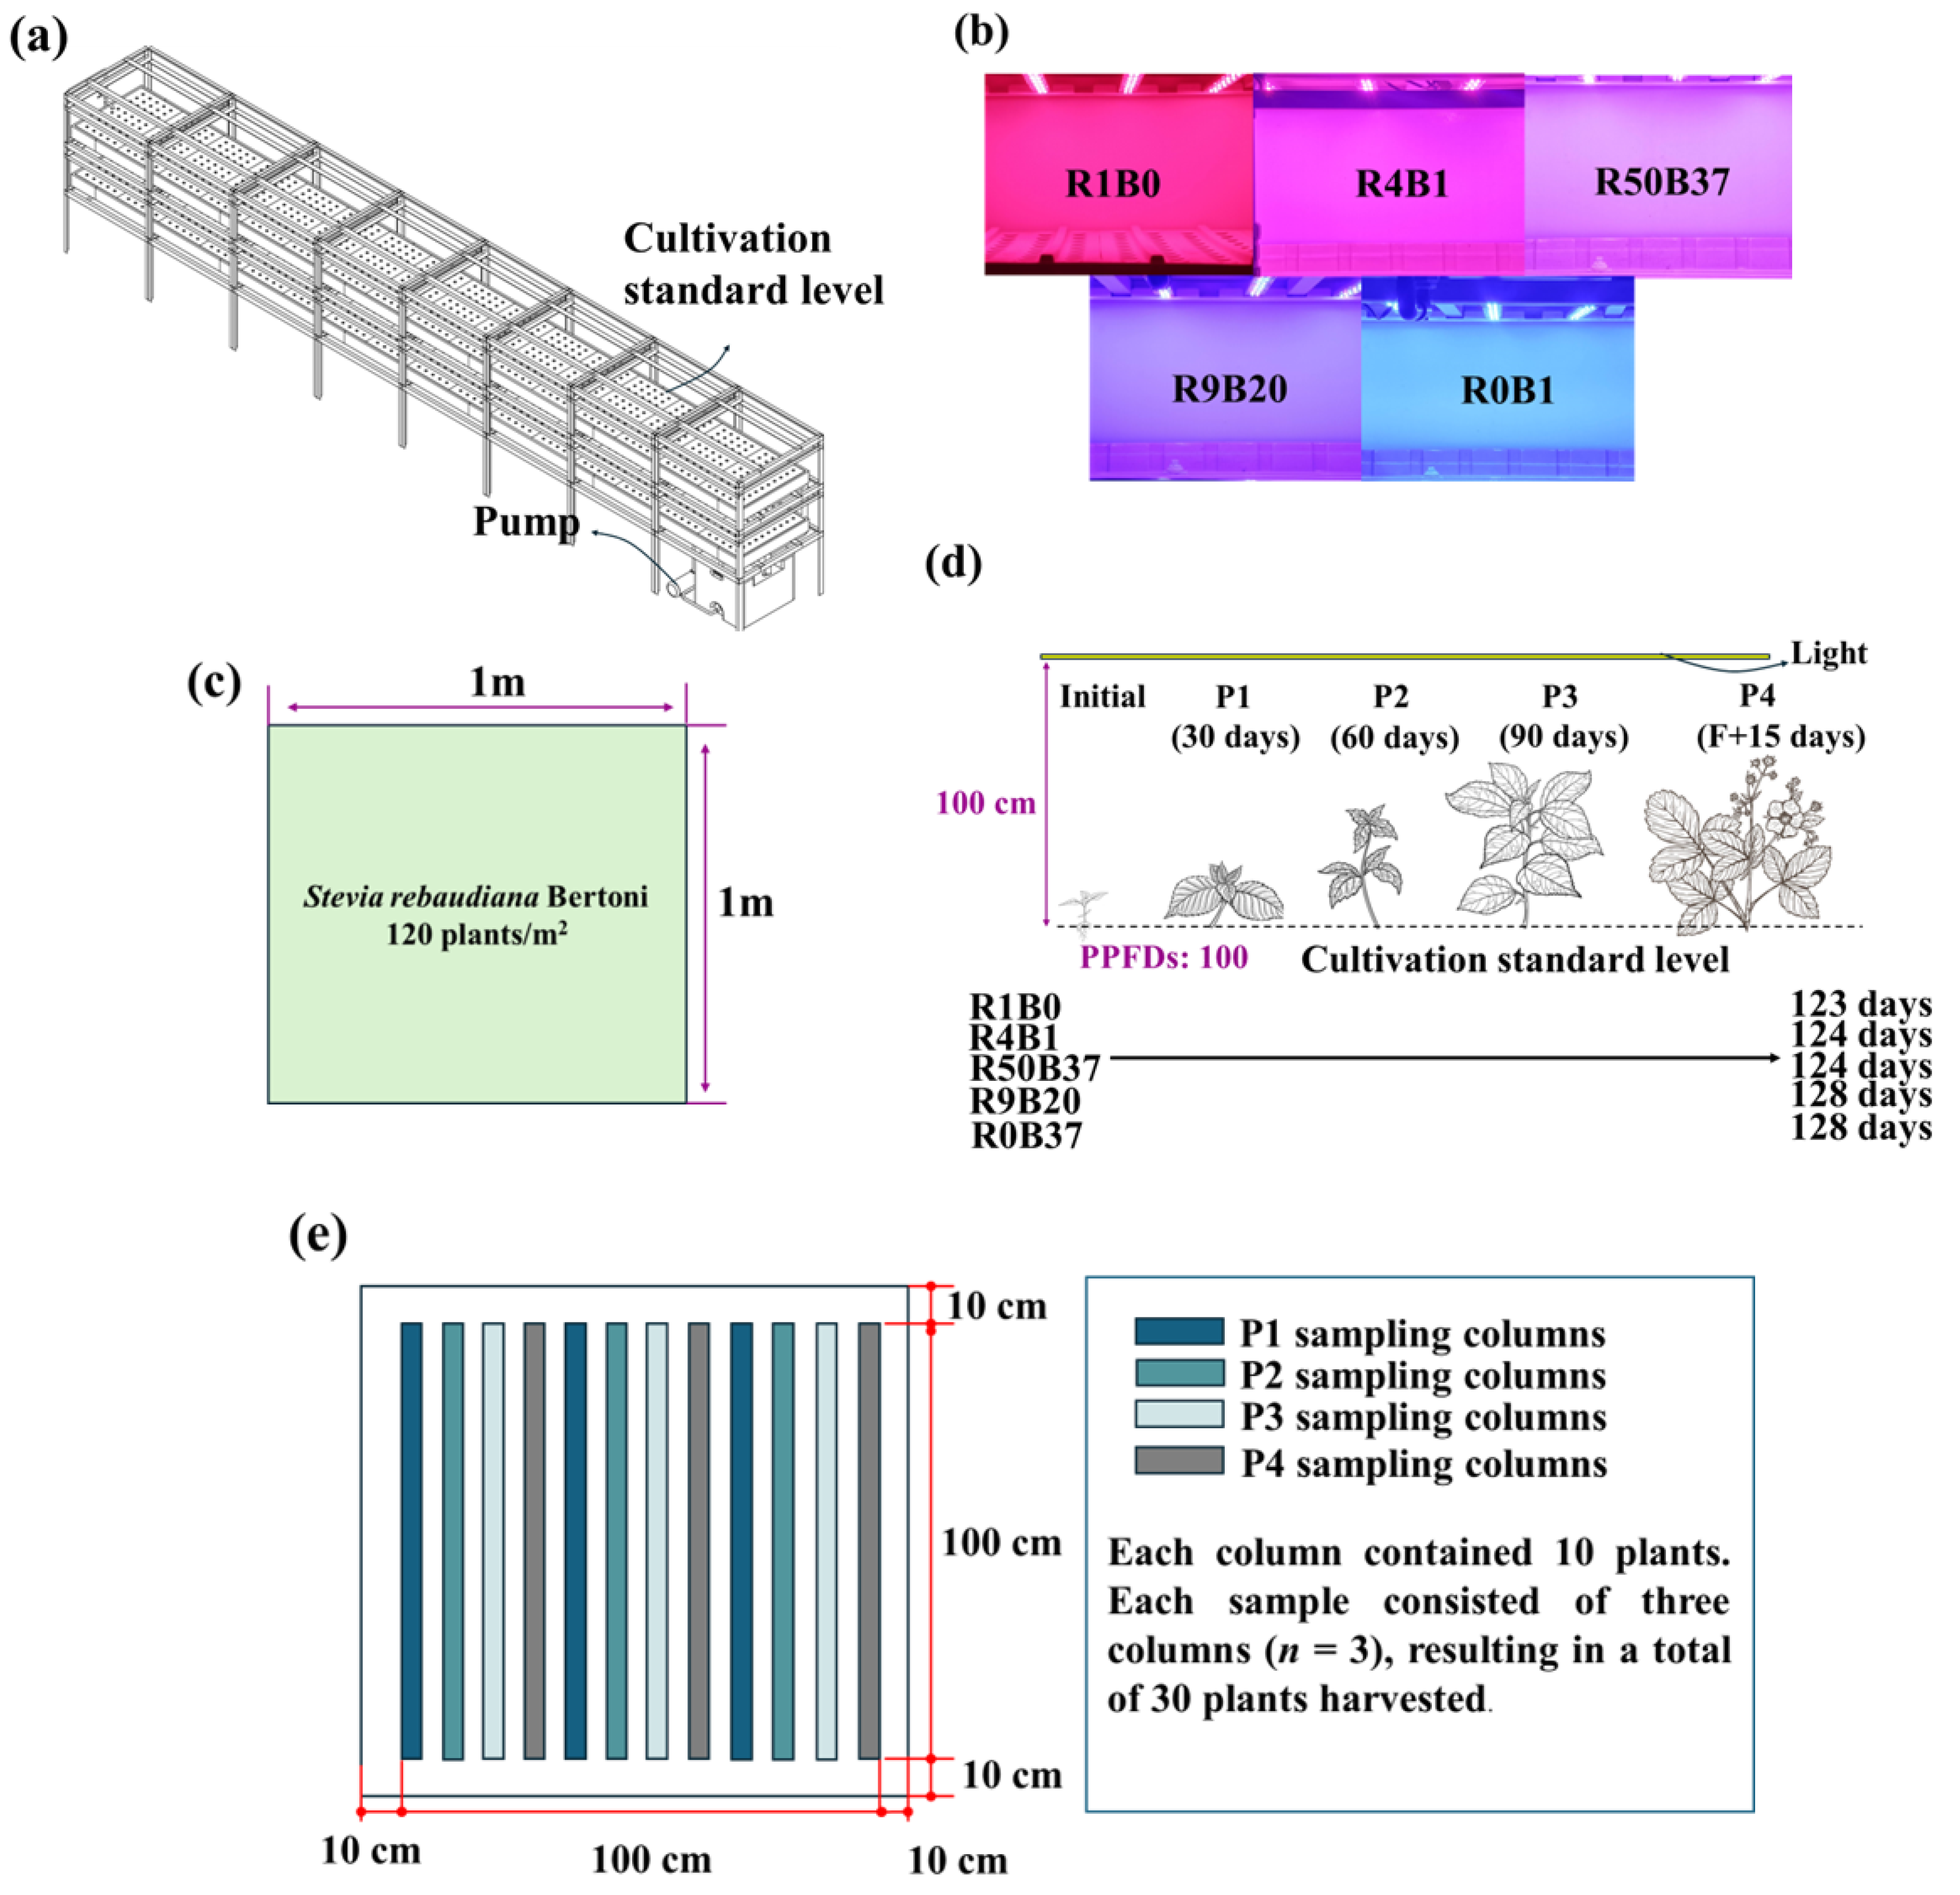
In the top of cultivation chamber, we utilized five lighting strips, each consisting of eight LED modules, with each module containing four high-power LEDs spaced at fixed intervals and having an emission angle of 120° (Figure 2a). The LED modules operated under a constant voltage (V), with the output current (I) controlled accordingly. At a height of 100 cm from the lamp surface to the planting reference surface, the Photosynthetic Photon Flux Density (PPFD) was set at 100 μmol·m−2·s−1 (Figure 2b). Each cultivation area covered 1 square meter (m2). At the cultivation reference plane, PPFD was measured using a Li-190R quantum sensor (LI-COR Inc., Lincoln, NE, USA) connected to a Li-250A light meter [38]. Measurements were performed at nine points across each cultivation area to assess light distribution uniformity. The red and blue channels were illuminated separately, and the corresponding PPFD values were recorded to determine the effective red-to-blue PPFD ratio at the planting surface. The total PPFD was strictly controlled at 100 ± 1 μmol·m−2·s−1 across all treatments; therefore, differences among treatments were attributable to spectral composition rather than light intensity, as depicted in Figure 2c. The entire setup included a hydroponic circulation system to ensure consistent pH and electrical conductivity (EC) across all cultivation environments, as shown in Figure 3a. Figure 3b illustrates the actual setup of the five cultivation areas once the lights were activated. The LED light emission angle was 120 degrees. During the experiment, each of the five treatment areas was individually enclosed, with side barriers in place to prevent light interference. The different light conditions were completely isolated, and the front and rear partitions were only opened during photography.

2.3. Culture and Light Treatments

The whole culturing process took place from 1 October 2023, to 31 January 2026. The controlled environment cultivation room measured 400 × 300 × 350 cm (L × W × H) and maintained an ambient temperature of 25 ± 1 °C and a relative humidity of 75 ± 2%. The lighting conditions were set to provide 16 h of light per day, establishing long-day (LD) conditions. Liquid fertilizer concentrates were prepared by combining solutions A and B (NuPOLAR-LIGHTS Opto Co., Ltd., New Taipei City, Taiwan), diluted with water at a volume ratio of 200:1:1 for solution A to solution B. The EC was monitored and maintained at 1.4 mS/cm, while the pH value was adjusted to stay between 6.8 and 7.2, with daily measurements. Experiments were conducted under each lighting condition in a cultivation area of 1 square meter, with 120 Stevia seedlings planted in each condition. In total, 600 Stevia seedlings were used across the five light-quality conditions, as shown in Figure 3c. The experiment comprised three independent planting batches serving as biological replicates. Each batch included 600 individual plants, yielding a total sample size of 1800 plants. Although a large number of plants were used in each treatment, these plants were considered subsamples within each independent cultivation batch rather than independent experimental units. Based on our preliminary study, Stevia plants typically begin flowering after 3 to 4 months of cultivation. In this study, the growth process was divided into four stages, labeled P1 to P4, with each designated stage lasting 30 days. The general physiological characteristics of Stevia during these designated stages are as follows:
  • P1 (1–30 days): Seedlings (7 cm in height) are transplanted into the hydroponic system. This is the early vegetative growth phase, characterized by slow development and the emergence of new tender leaves.
  • P2 (30–60 days): Early leaf development phase, during which leaf expansion occurs rapidly. The plant produces numerous new leaves, while the number of senescent lower leaves remains relatively low.
  • P3 (60–90 days): Late leaf development phase, where rapid leaf growth continues. A mixture of newly emerged and mature leaves is observed.
  • P4 (Post-flowering +15 days): Leaf senescence phase, occurring 15 days after the emergence of flower buds. At this stage, leaf shrinkage and chlorosis become apparent, with some leaves undergoing wilting and abscission. The specific timing for each experimental group is provided in Figure 3.
At the completion of each predefined growth stage, 30 Stevia plants from each lighting treatment were selected and harvested for subsequent processing, including drying, pulverization, extraction, and SG determination. After the P3 stage, another set of 30 plants per lighting treatment was maintained under the same conditions and allowed to continue growing until the onset of flowering. The time required for the first floral bud to emerge in each light treatment was recorded and defined as F days. A final sampling was then performed 15 days after F days, corresponding to the P4 growth stage. The Stevia growth process is depicted in Figure 3d. During each designated growth stage, fresh leaves were harvested as shown in Figure 3e. For each designated growth stage, samples were collected from three separate columns, with each column containing 10 plants, resulting in a total of 30 plants sampled. These columns were positioned separately within the planting chamber to minimize potential biases caused by location-based variations. The entire planting and sampling process was independently conducted in three separate batches, providing three biological replicates. The fresh weight (FW) and dry weight (DW) were determined using leaf samples only. After harvest, leaves were separated from stems and other plant parts prior to weighing. The fresh weight of the leaves was recorded, after which the samples were dried in a forced-air oven at 60 °C for 24 h until a constant weight was reached, and then reweighed to obtain DW.

2.4. Microwave Extraction

The extraction procedure followed the method outlined by Yilmaz et al. [39], Our preliminary study has validated this method as the most efficient. In this process, 0.5 g of Stevia powder was thoroughly mixed with 10 mL of deionized water. The mixture was then placed in a microwave device, set to a fixed stirring mode, ensuring continuous and consistent agitation during the microwave treatment. Extraction was performed using microwave irradiation at 800 W for 10 s per cycle. Following each irradiation, the mixture was allowed to cool to room temperature for 30 min, and this process was repeated for a total of four cycles. The resulting extract was then centrifuged at 6000 rpm for 10 min and subsequently filtered through a 0.45 µm nylon membrane. The filtrate was freeze-dried under vacuum using a lyophilizer (FD6-8P-L, Kingmech Co., New Taipei City, Taiwan). The obtained dried extract was collected and stored for further analysis. All samples were processed through the extraction procedure within one week after the completion of the cultivation period.

2.5. HPLC Analysis

The concentrations of steviol glycosides (SGs) in Stevia extracts obtained from different lighting treatments and growth stages were determined by high-performance liquid chromatography (HPLC) according to a previously reported method [40]. The HPLC system consisted of a 321 HPLC pump (Gilson, Middleton, WI, USA), a SunArmor NH2 column (5 μm, 4.6 × 250 mm; Osaka, Japan), and a UV–Vis detector-152 (Gilson Inc., Middleton, WI, USA), with the detection wavelength set at 210 nm. Standard calibration curves were prepared using six SG reference compounds (ChromaDex Inc., Irvine, CA, USA) at concentrations of 100–500 μg/mL. The standard solutions were prepared in the mobile phase and stirred for 30 min until complete dissolution was achieved. The mobile phase consisted of acetonitrile and water mixed at a ratio of 80:20 (w/w), with the pH adjusted to 3.0 using phosphoric acid, followed by filtration through a 0.22 μm nylon membrane filter. Prior to use, the mobile phase was degassed in an ultrasonic cleaner (Delta, D9NX-DC200H, 40 kHz, Taipei, Taiwan). Chromatographic separation was carried out at a flow rate of 1.0 mL/min, and the column temperature was maintained at 40 °C using a column oven (Colbox, Taiwan Hipoint, Kaohsiung, Taiwan). Data acquisition was performed using SISC3.2 integration software together with an interface card (EMB50S, Scientific Information Service Co., Ltd., Taipei, Taiwan), and SG concentrations were calculated based on the corresponding calibration curves. All measurements were conducted in triplicate.

2.6. Determination of Extraction Yields, Content of SG in Stevia Leaf, and Overall SG Yields

The Stevia extraction yield (E, %) was calculated by dividing the weight of the lyophilized Stevia rebaudiana leaf extract (LE) by the weight of the Stevia powder (SP), and then expressing the result as a percentage. The formula is as follows:
E (%) = [LE (g)/SP (g)] × 100%
The concentration of each steviol glycoside (SG) was determined by correlating the peak areas obtained from the HPLC chromatograms with the respective calibration curves constructed from the reference standards. Based on these calibration relationships, the concentration of each SG in the extract (C) was calculated. The content of each SG in the lyophilized Stevia extract (H, mg/g) was then derived using the following equation:
H (mg/g) = [C (mg/mL) × V (mL)]/LE (g)
where
  • C represents the concentration of each SG (mg/mL) determined by HPLC analysis.
  • V denotes the volume of solvent used to dissolve the extract powder (mL).
  • LE refers to the mass of lyophilized Stevia rebaudiana leaf extract (g).
The contents of the individual SGs in the lyophilized Stevia extract are expressed as HRu, HDu, HRB, HST, HRC, and HRA, corresponding to rubusoside and the other respective SG compounds. For example, HRu denotes the content of rubusoside, and the remaining abbreviations follow the same notation pattern for their corresponding SGs.
Furthermore, the amount of each SG in Stevia leaves (L) was estimated by multiplying the SG content in the lyophilized extract (H, mg/g) by the extraction yield of Stevia (E, %), as shown in the following equation:
L (mg/g) = H (mg/g) × E (%)
The content of different types of SG in the Stevia leaf (per g) is denoted as LRu, LDu, LRB, LST, LRC, and LRA. Here, LRu represents the content of Rubusoside in the dried Stevia leaves, with the other abbreviations following a similar pattern for the respective SG. LSG represents the total contents of SG in the dried Stevia leaves, calculated as follows:
LSG = LRu + LDu + LRB + LST + LRC + LRA
The yield of steviol glycosides (SGs) per unit cultivation area (Y, mg/m2) was calculated by multiplying the dry leaf weight per Stevia plant (DW, g/plant) by the planting density (D, plants/m2), and subsequently by the SG content in the leaves (L, mg/g). The calculation is expressed as follows:
Y (g/m2) = DW (g/plant) × D (plant/m2) × L (mg/g)/1000
YRu, YDu, YRB, YST, YRC, YRA represent the yield of Rubusoside, Dulcoside A, Rebaudioside B, Stevioside, Rebaudioside C, and Rebaudioside A, respectively, per square meter of cultivation area. YSG represents the total yield of SG per square meter, calculated as follows:
YSG = YRu + YDu + YRB + YST + YRC + YRA
The chemical analysis and data curation process took place from 23 February 2024, to 30 April 2024.

2.7. Statistical Analysis

The experimental results included three biological replicates (batches), each with a subsample size of 10 individual plants, and expressed as mean values with standard deviations (SD, n = 3). A one-way analysis of variance (ANOVA) was employed to assess significant differences among experimental groups, followed by Duncan’s multiple range test (DMRT) for post hoc comparisons at p < 0.05. In the tables and figures, means followed by different letters indicate significant differences according to DMRT, with the comparison structure specified in each corresponding legend or footnote. In addition to one-way ANOVA, a two-way analysis of variance (ANOVA) was performed to evaluate the effects of light treatment, growth stage, and their interaction on FW, DW, LSG, and YSG. All statistical analyses were conducted by using IBM SPSS Statistics for Windows, Version 22.0 (IBM Corp., Armonk, NY, USA).

3. Results and Discussion

3.1. Effect of Light Quality on Biomass

3.1.1. Fresh Weight of Stevia Leaves

Table 1 presents the FW of Stevia at four different designated growth stages under five red-blue light ratio treatments (R1B0, R4B1, R50B37, R9B20, and R0B1). The data indicate that the highest FW was observed under the R1B0 treatment, suggesting optimal growth conditions. In contrast, the lowest FW was recorded under the R0B1 treatment, indicating suboptimal growth. For all treatments (R1B0, R4B1, R50B37, R9B20, and R0B1), the peak FW occurred during the P3 or P4, with maximum FW values of 29.16, 25.64, 21.27, 20.41, and 19.80 g/plant, respectively. As shown in Table 1, during the P1 period, the highest fresh weight (FW) was recorded under the R1B0 treatment at 3.46 g/plant, while the lowest was observed under R0B1 at 1.89 g/plant, resulting in a difference of 83.07%. In the P2 period, R1B0 exhibited the highest FW of 15.61 g/plant, while R0B1 showed the lowest at 8.12 g/plant, reflecting a difference of 92.24%. During the P3 period, R1B0 had the highest FW at 29.16 g/plant, while R0B1 recorded the lowest at 18.07 g/plant, representing a difference of 61.37%. In the P4 period, R1B0 again showed the highest FW of 27.74 g/plant, while R0B1 had the lowest at 19.80 g/plant, with a difference of 40.10%.
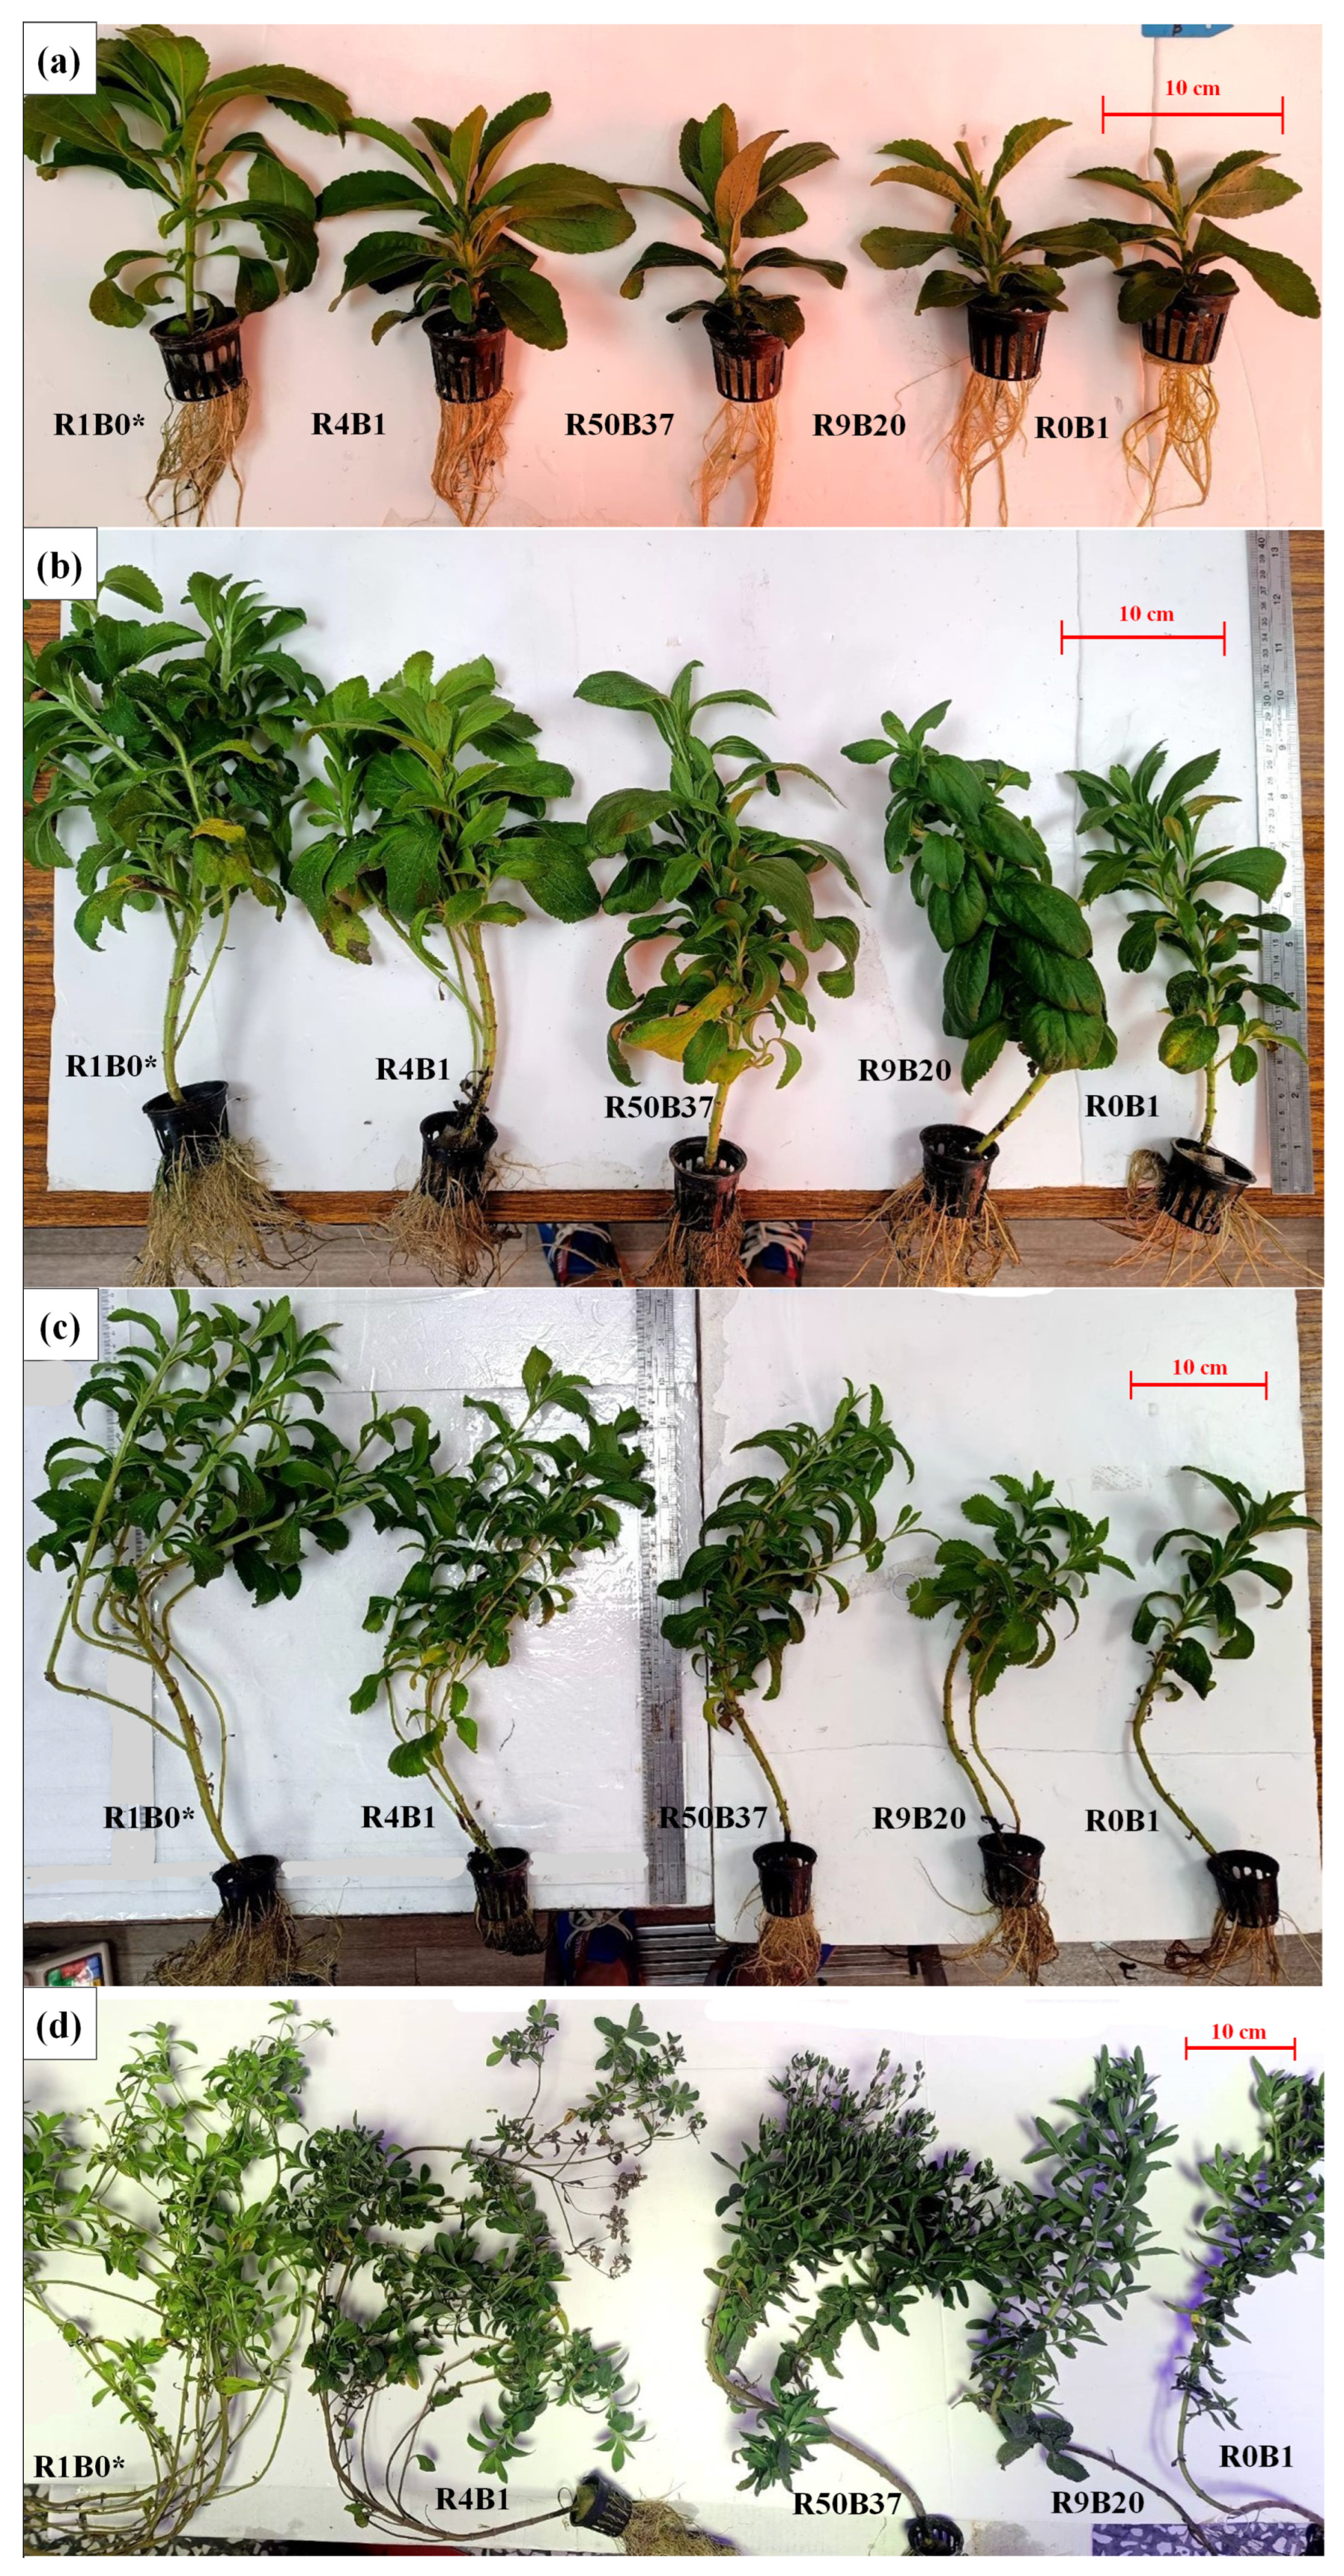
The highest FW of Stevia was observed across all designated growth stages under the five different red-blue light ratio combinations. Among these, the R1B0 treatment produced almost the greatest FW at 29.16 g/plant, while R0B1 resulted in the lowest FW at 19.80 g/plant, reflecting a difference of 47.27%. This finding suggests that the R1B0 light quality condition is optimal for maximizing FW. According to Son and Oh [35], exposure to pure red light enhances the growth of vegetable leaf area. The results of the present study corroborate this, as the FW of Stevia leaves was highest under R1B0, followed by R4B1, R50B37, R9B20, and R0B1 in descending order. These findings indicate that a higher proportion of red light contributes to increased FW yields, highlighting the beneficial effect of red light on Stevia leaf growth. Growth differences across the P1–P4 stages are illustrated in Figure 4a–d. It is worth to mentioned that the sampling method may also be a crucial role to affected the plant growth. It should be noted that canopy structure and light interception vary across growth stages, and early-stage plants may not fully represent the light environment of a developed canopy. However, in this study, each growth stage was analyzed independently, and comparisons were made among light treatments within the same stage. Therefore, the observed differences primarily reflect treatment effects under comparable developmental conditions, rather than systematic bias arising from canopy differences across stages. In the cultivation chamber, each of the five different light conditions included 120 plants. For each growth stage, 30 plants were sampled, which were arranged in three separate columns and cultivated in distinct locations (Figure 3e). The early-stage sampling may prevent us from fully simulating shading effects under full canopy coverage in later growth stages. In line with this, the expected strong shade avoidance response, such as the elongation of aboveground tissues commonly observed under blue light conditions, was not evident in the plant growth presented in Figure 4. We hypothesize that this may be due to this sampling strategy.
The study also revealed variations in flowering time under the five different red-blue light ratios. As illustrated in Figure 3d, the first appearance of the flower bud, designated as day F, occurred in the following order: R1B0, R4B1, R50B37, R9B20, and R0B1. The harvesting time at the P4 stage was set as day F+15, with the respective flowering days occurring on day 123, day 124, day 124, day 128, and day 128. Previous research has shown that the red-to-blue light ratio influences the flowering time of Stevia, with higher blue light content in the spectrum causing a delay in flowering. In contrast, Serfaty et al. [41] reported that, in outdoor Stevia cultivation, both fresh weight and SG yields peaked prior to flowering. However, the present study yielded different findings, as shown in Table 1, where from the P3 to P4 stages, growth either slightly increased or even slightly decreased (as seen in R1B0 and R50B37). These results suggest that varying red-blue light ratios can significantly influence the growth and physiological processes of Stevia. Also, these results are consistent with existing research showing that modifications in spectral power distributions can significantly impact plant growth such as Pachyphytum [42] and Tillandsia ionantha Planch [43].

3.1.2. Dry Weight of Stevia Leaves

Table 2 presents the dry weight (DW) of Stevia rebaudiana leaves, which were harvested and dried using hot air at 60 °C for 24 h, under five different red-blue light ratio combinations at four growth stages. From Table 2, it is evident that DW was highest under the R1B0 treatment and lowest under R0B1. Regardless of the light quality combination, the maximum DW was observed during the P3 or P4 designated growth stages. The maximum DW values for the R1B0, R4B1, R50B37, R9B20, and R0B1 treatments were 2.88, 2.54, 2.13, 2.05, and 1.98 g/plant, respectively. Throughout all four designated growth stages, R1B0 consistently produced the highest DW values, while R0B1 yielded the lowest. In the P1 stage, the DW difference between R1B0 and R0B1 was 78.95%. During the P2 stage, this difference increased to 92.59%. In the P3 stage, the DW difference was 59.12%, and in the P4 stage, the difference was 38.89%. Over the entire growth period, the highest DW was observed under the R1B0 treatment at 2.88 g/plant, while the lowest was found under R0B1 at 1.98 g/plant, representing a maximum difference of 45.45% between the two light quality combinations.
The results of the cultivation study indicate that the dry weight (DW) of Stevia is optimal under the R1B0 light quality condition across all four designated growth periods, while it is lowest under the R0B1 light quality condition. Red and blue light wavelengths are known to be particularly efficient for chlorophyll a and chlorophyll b absorption [44,45]. Consequently, numerous studies have utilized various red-to-blue light ratios to enhance growth in different plant species. Leaf growth, in particular, has been shown to be significantly improved with a higher proportion of red light [35,46,47], which aligns with the findings of the present study regarding both fresh weight (FW) and DW of Stevia leaves.

3.2. The Effect of Varying Red-Blue Light Ratio Combinations and Designated Growth Stages on the Extraction Yield of Stevia

Water was used as the extraction solvent for the microwave extraction process, with a solid-to-liquid ratio of Stevia leaf powder to water set at 1:20. The results, as presented in Table 3, indicate that the extraction yields under the five different red-blue light ratios are quite similar within the same growth period. However, within each light quality combination, extraction yields tend to increase as the growth period progresses. Specifically, for the R1B0 condition, the extraction yield at P1 was 19.20%, while at P4, it increased to 24.37%, reflecting a 26.93% increase. Similarly, for R4B1, the extraction yield at P1 was 19.29%, and at P4, it rose to 24.54%, marking a 27.22% increase. The extraction yield for R50B37 increased from 19.12% at P1 to 24.76% at P4, a rise of 29.50%. For R9B20, the extraction yield at P1 was 18.96%, and at P4, it reached 24.76%, representing a 30.59% increase. The R0B1 condition showed an extraction yield of 19.28% at P1 and 24.94% at P4, with a 29.36% increase. These results suggest that throughout the designated growth stages from P1 to P4, Stevia plants may synthesize and accumulate more water-soluble substances, leading to the highest extraction yield observed at the P4 stage.

3.3. Influence of Varying Red and Blue Light Ratios on the Content of Individual SG (L) in Stevia Leaves

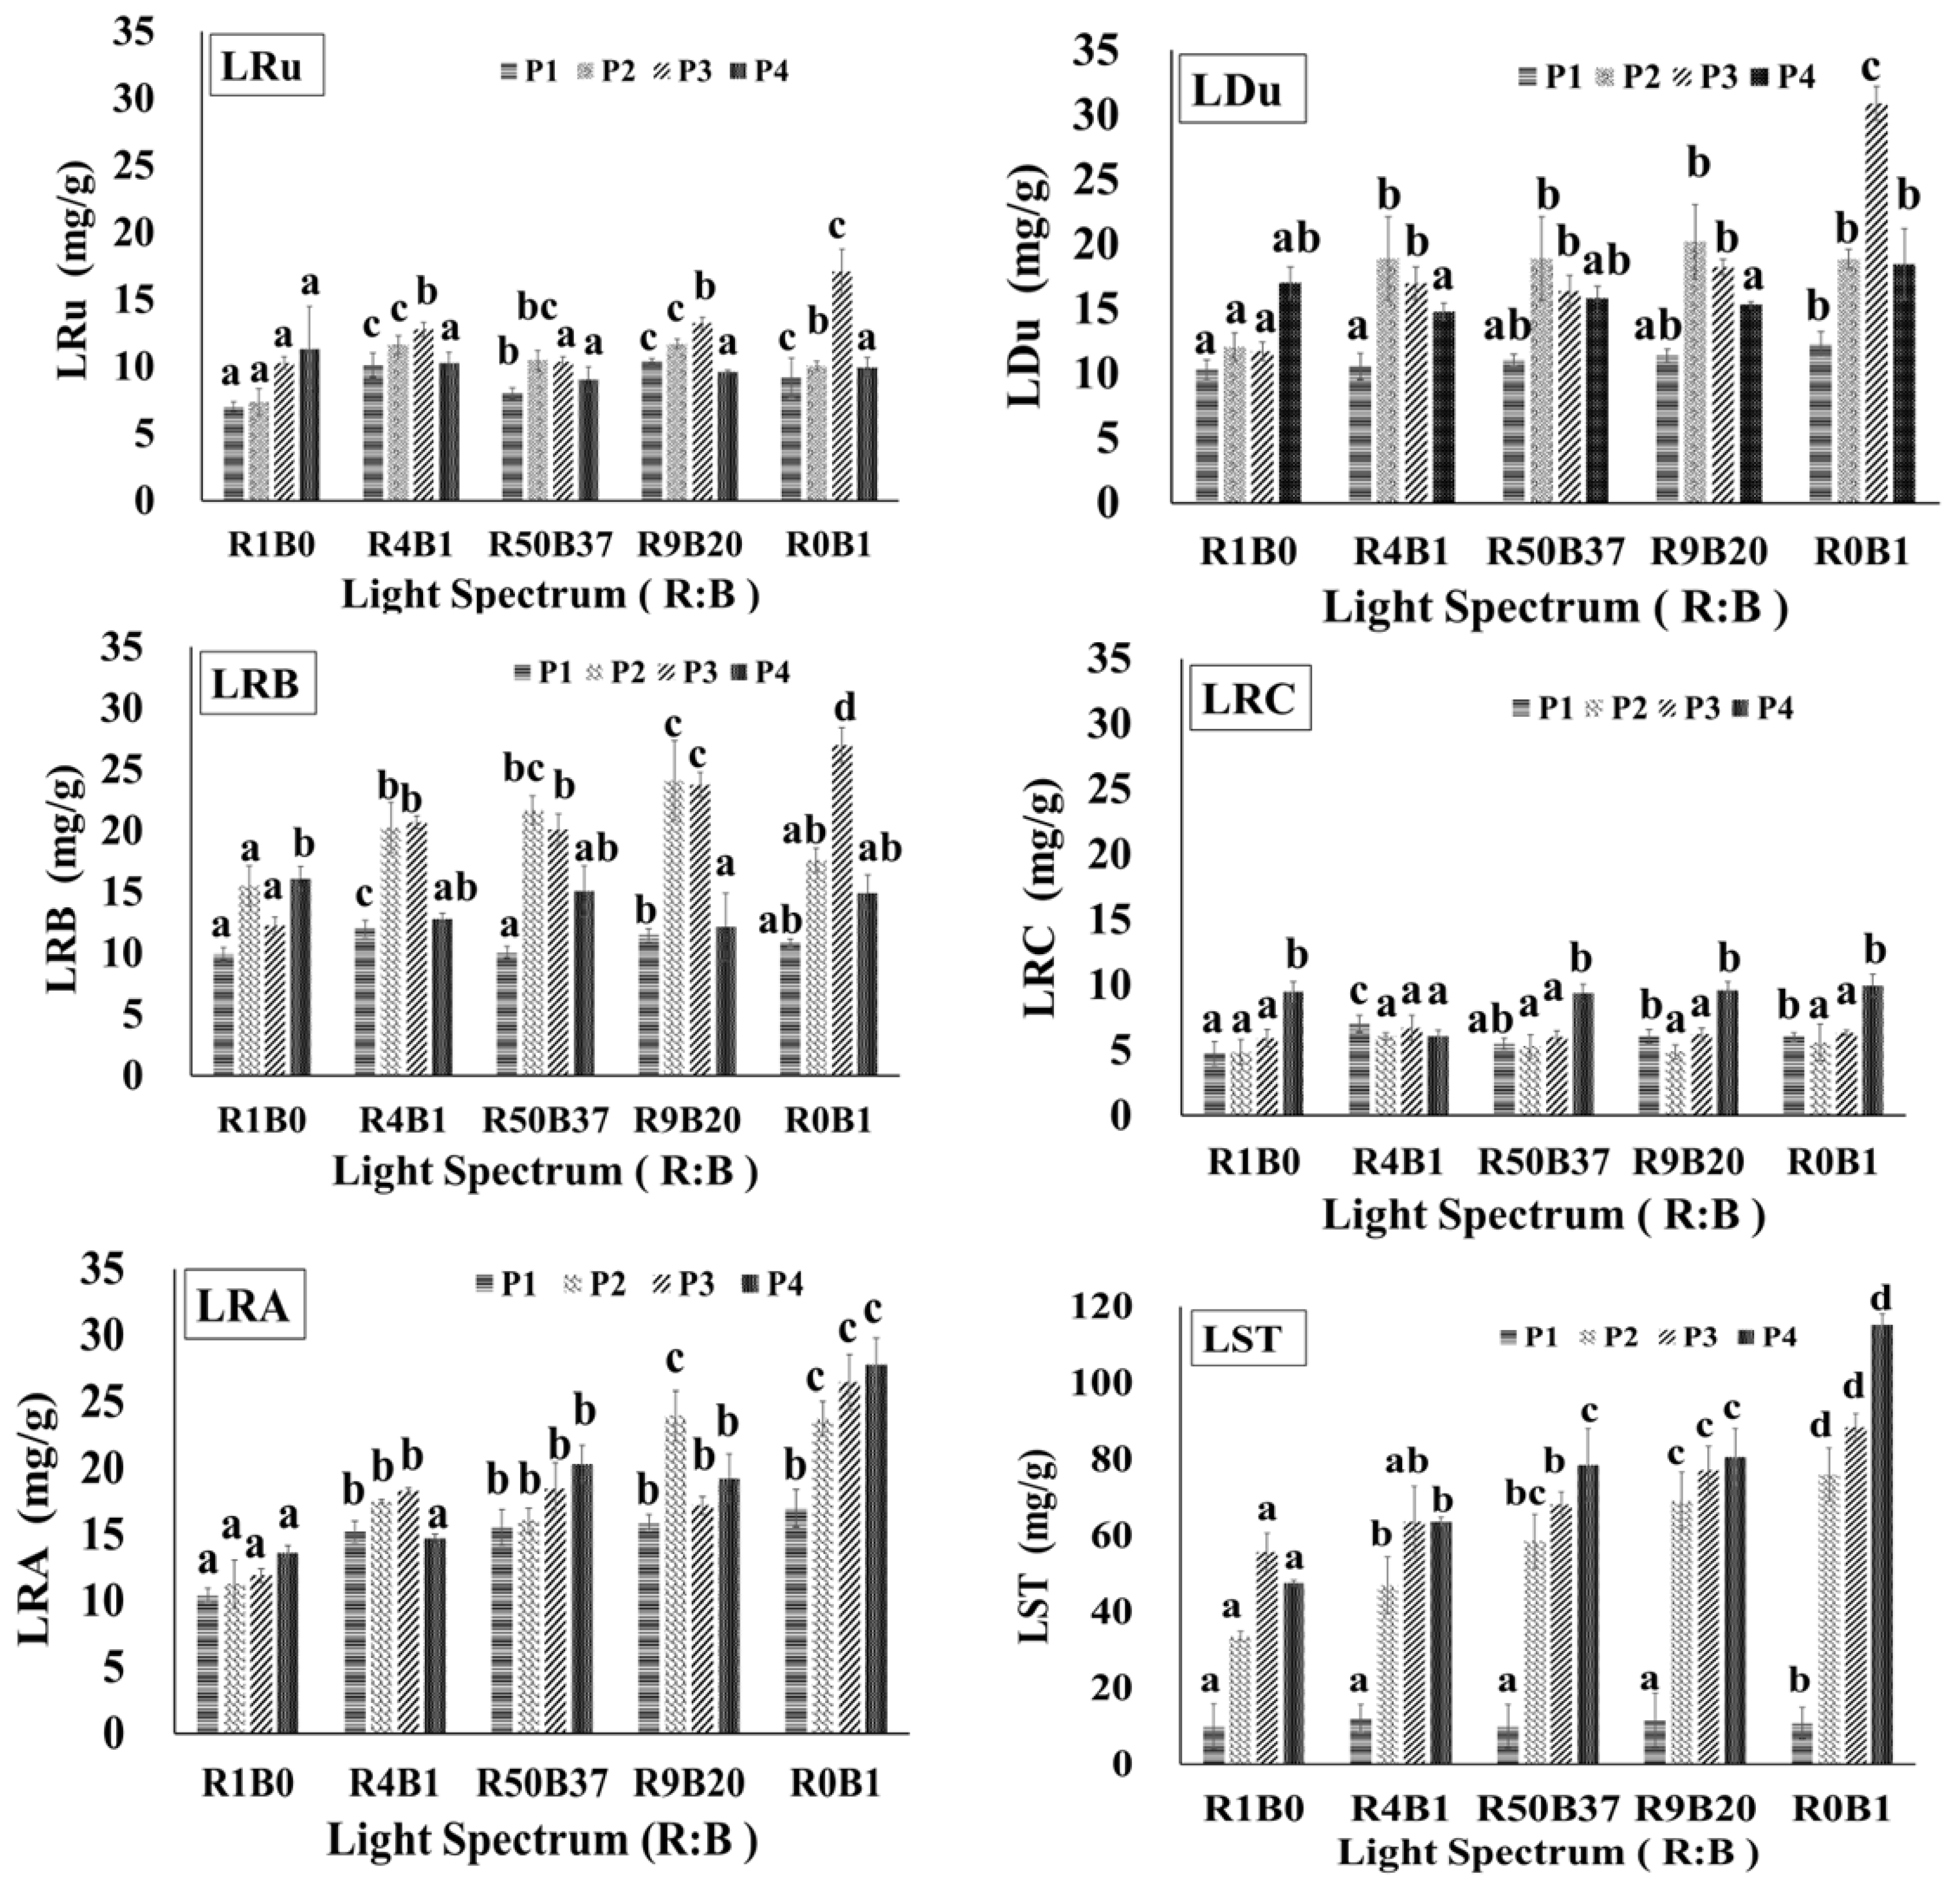
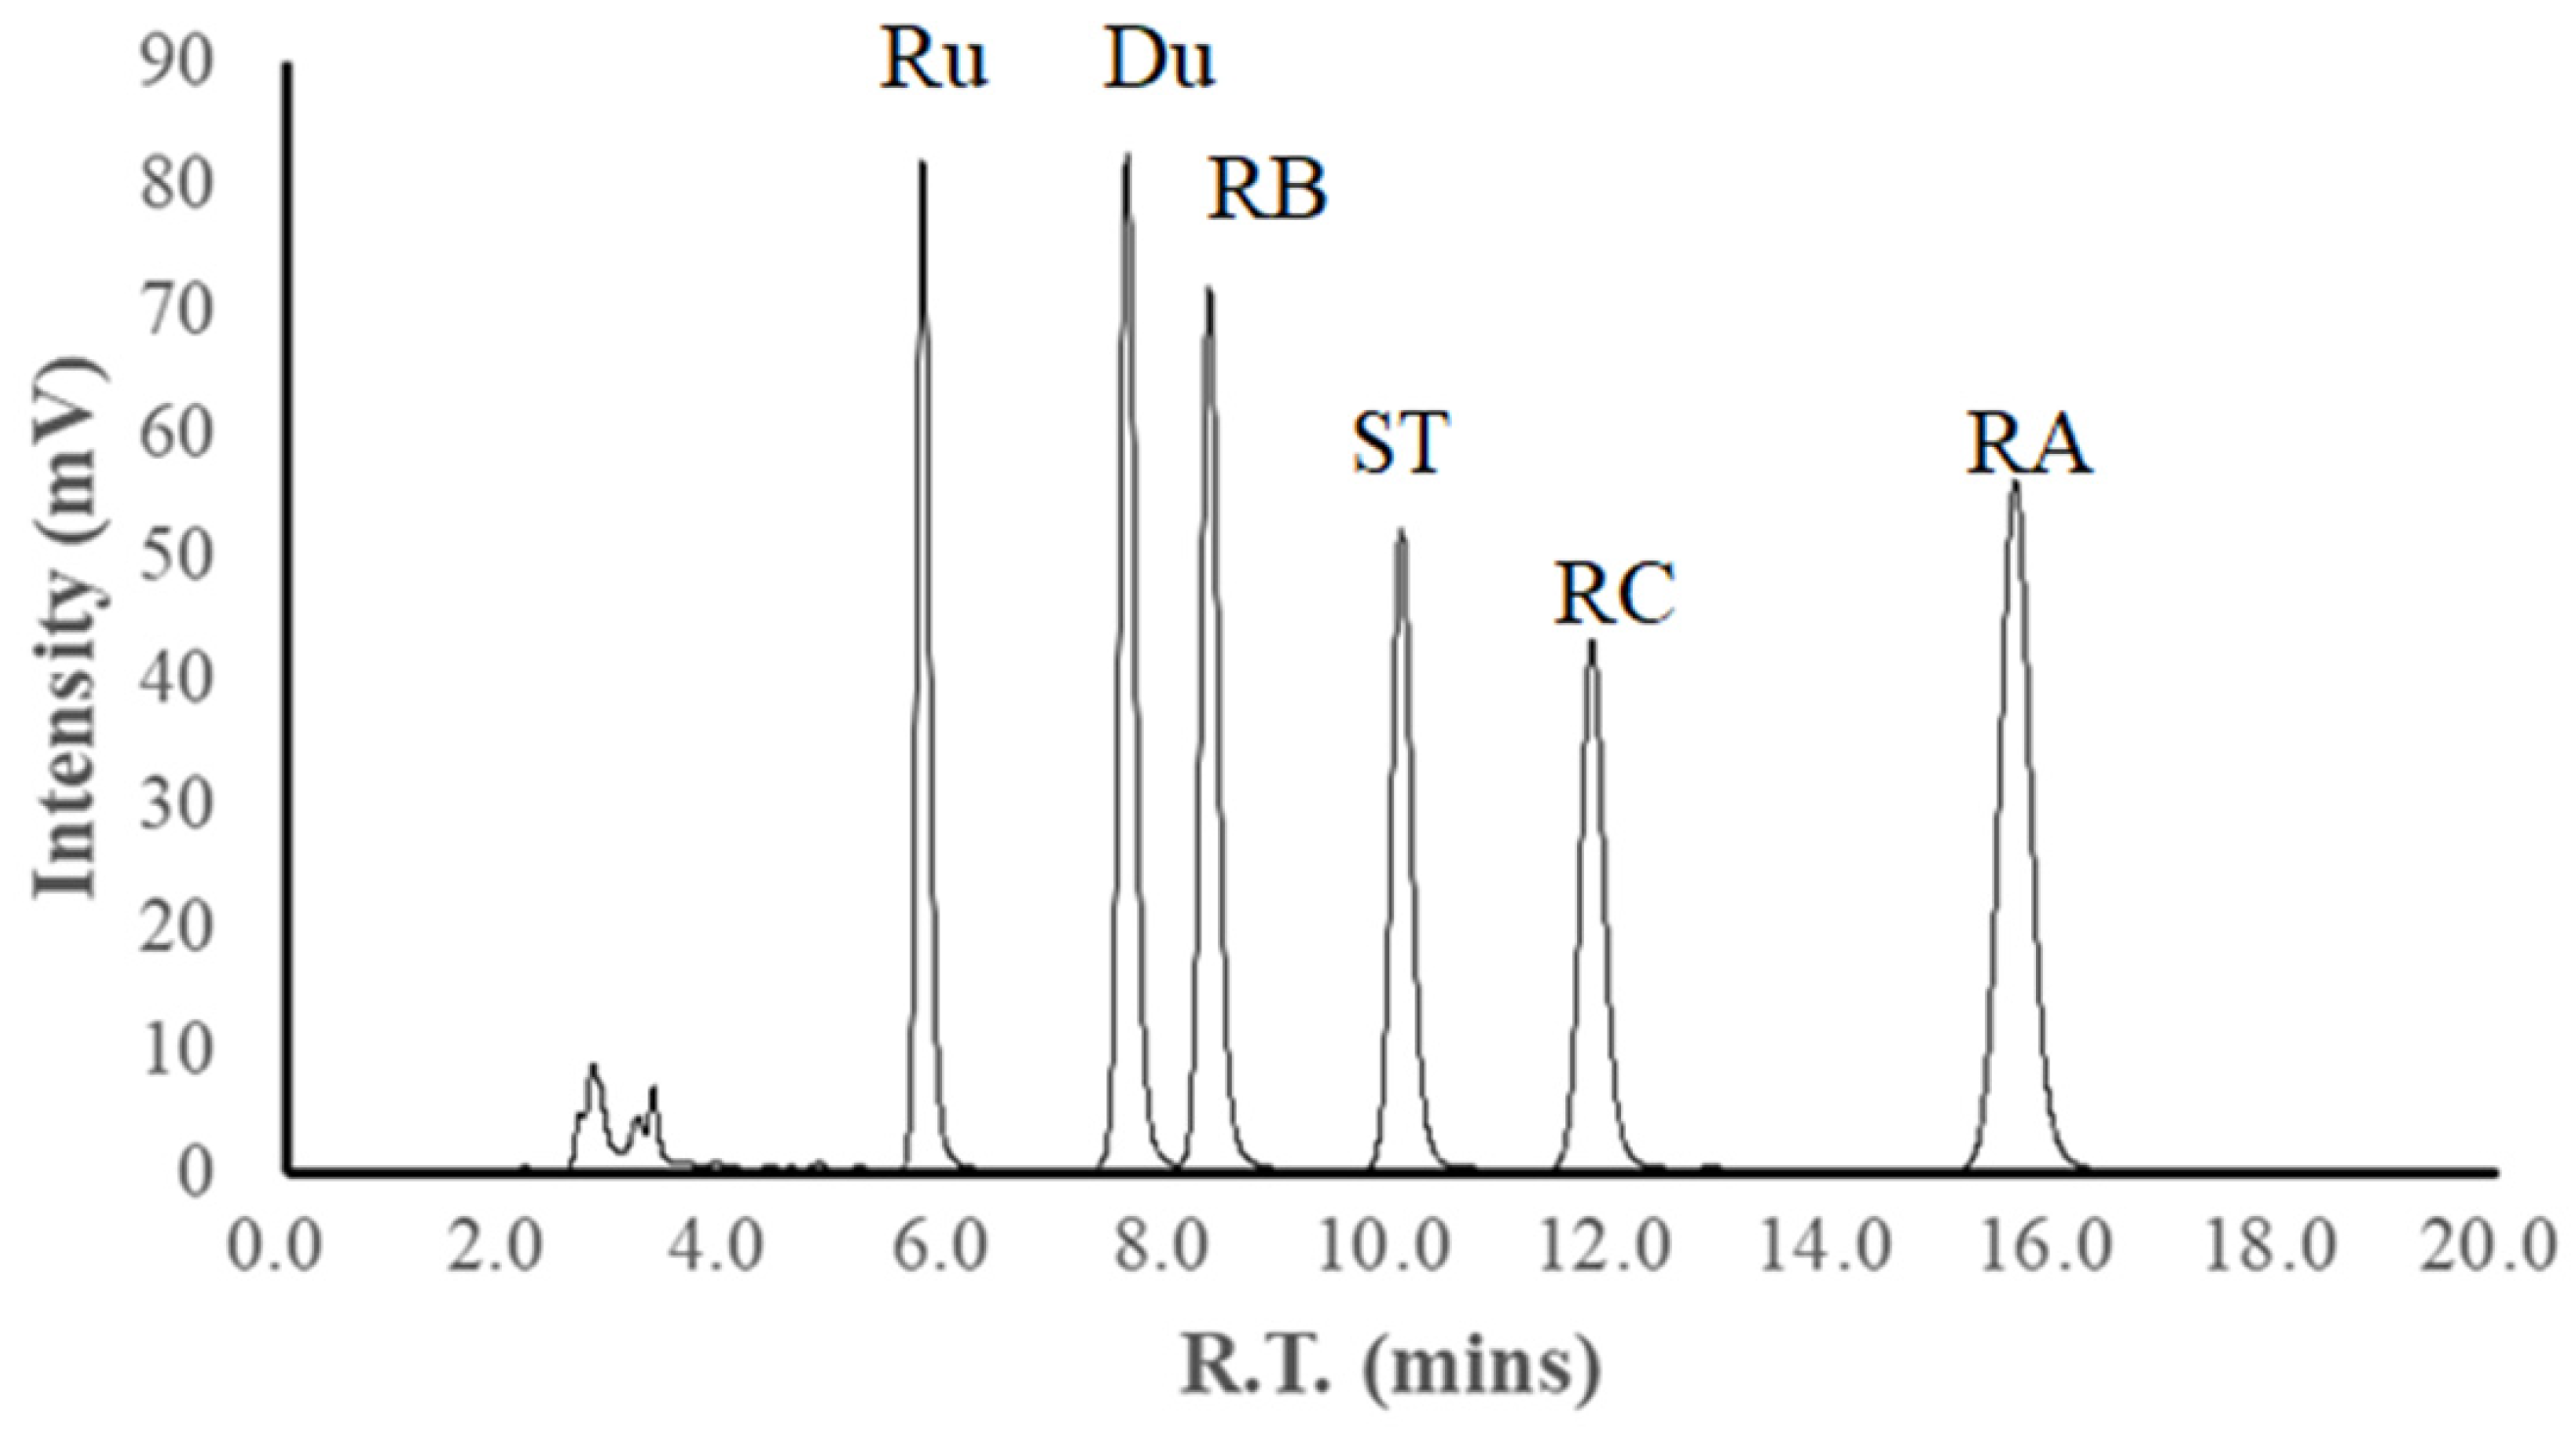
HPLC was employed to determine the concentrations of six SG: Ru, Du, RB, RC, RA, and ST. Due to their distinct retention times, corresponding chromatograms were obtained (Figure 5), which facilitated the analysis of each glycoside’s content in the lyophilized extract (H, mg/g). The SG content in the dried leaves was calculated using formula 3, and the results are presented in Figure 6. The highest concentrations of LRu, LDu, LRB, LRC, LRA, and LST in the dried Stevia leaves were observed in the groups LRuR0B1-P3, LDuR0B1-P3, LRBR0B1-P3, LRCR0B1-P4, LRAR0B1-P4, and LSTR0B1-P4, with values of 17.09, 30.89, 27.02, 9.96, 27.77, and 115.20 mg/g, respectively. Notably, these values were higher in the blue light ratio groups. This trend suggests that blue-light-enriched conditions may promote the accumulation of individual steviol glycosides in Stevia leaves. A possible explanation is that blue light regulates specialized metabolism through blue-light photoreceptors, particularly cryptochromes, which are known to influence metabolite accumulation and transcriptional regulation in plants. Previous studies have also indicated that blue light can enhance the expression of genes involved in SG biosynthesis and increase the accumulation of secondary metabolites in Stevia and other crops [19,48]. Therefore, the higher levels of several SG components observed under the R0B1 treatment may reflect light-quality-mediated metabolic regulation rather than a simple growth effect. In this study, hydroponically cultivated Stevia demonstrated that ST had the highest content among the SG components (Figure 6). This difference may be related to the particular Stevia cultivar employed in the study. Hernández et al. [18] reported that among two Stevia varieties, Morita II and Criolla, rebaudioside A (RA) was the predominant steviol glycoside in Morita II, whereas stevioside (ST) was the major SG present in the Criolla variety.
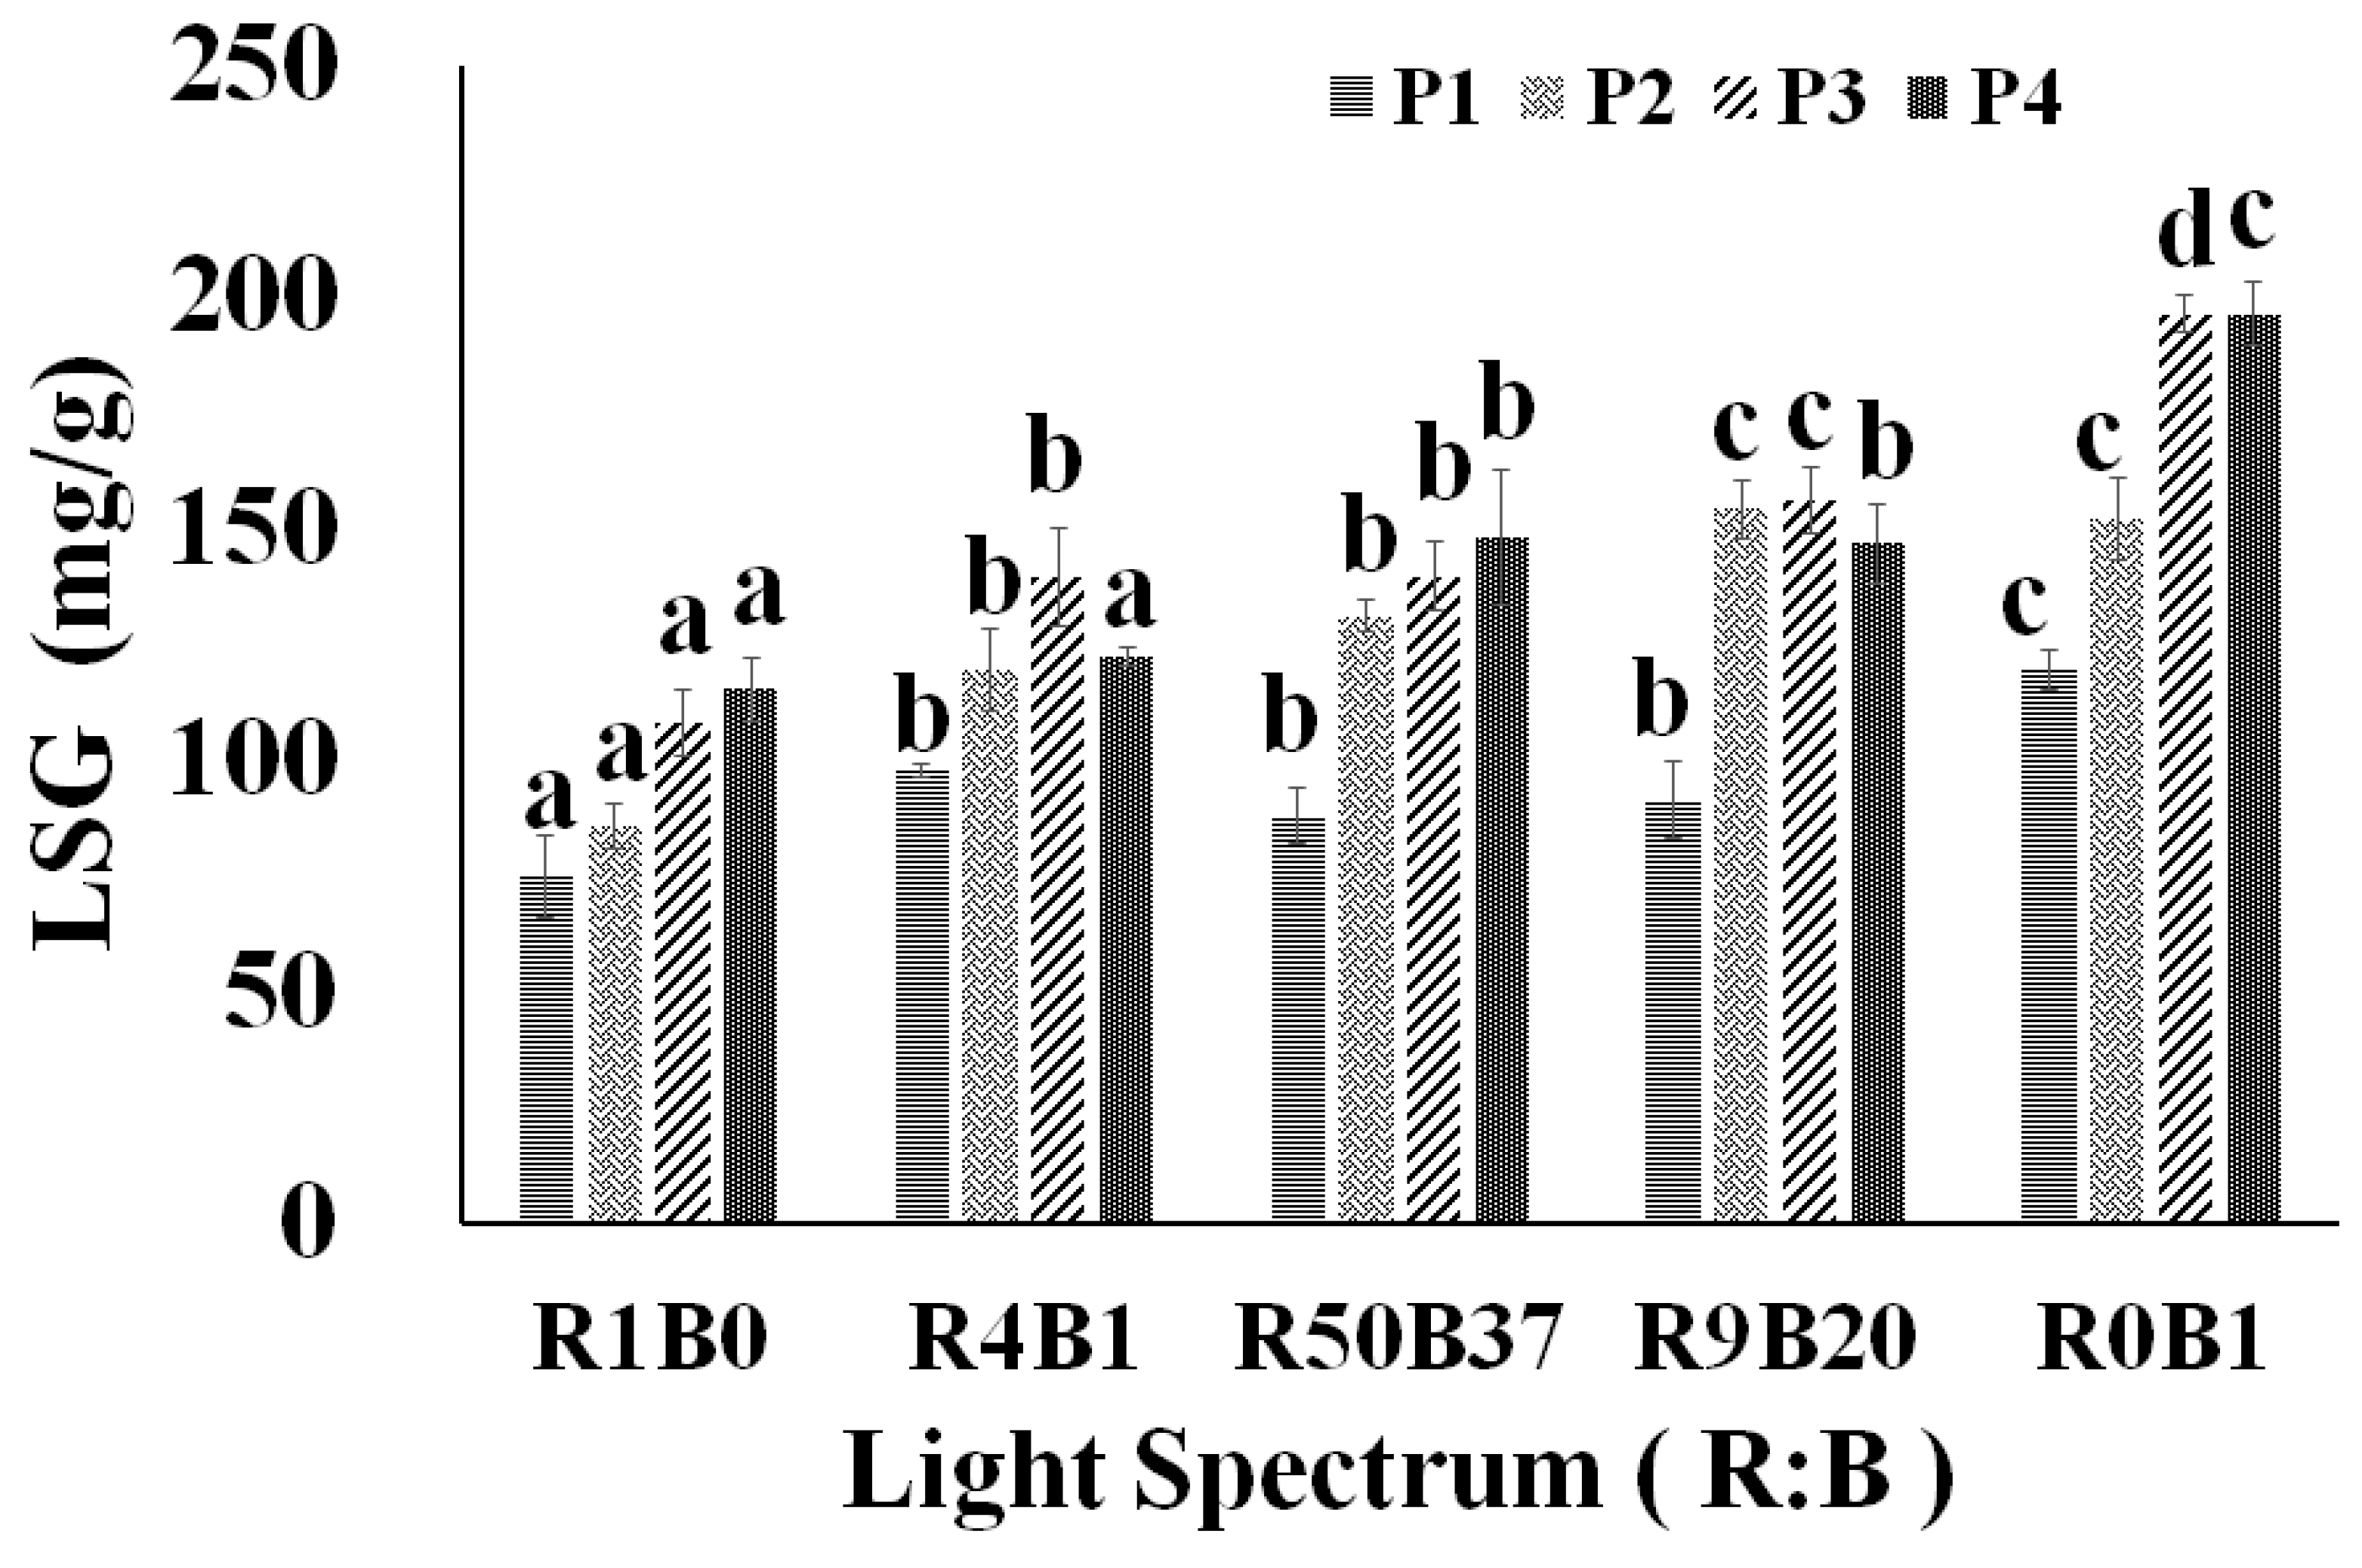
Among the five different red and blue light ratio combinations, the pure blue light group, LSTR0B1-P4, exhibited the highest LST value at 115.20 mg/g, while the pure red light group, LSTR1B0-P3, demonstrated the lowest value at 55.64 mg/g. The groups containing both red and blue light ratios showed intermediate performance levels, with LSTR4B1-P4 (63.72 mg/g), LSTR50B37-P4 (78.49 mg/g), and LSTR9B20-P4 (80.64 mg/g) outperforming the pure red light group. The total content of LSG in each sample was determined by summing the quantities of the six SG. The LSG values for different light qualities and designated growth stages are presented in Figure 7. It was observed that LSG increased with a higher proportion of blue light. Among the five combinations of red and blue light ratios, the pure blue light group had the highest LSG value, which was recorded at 196.32 mg/g in LSGR0B1-P3. In contrast, groups with a higher red light proportion showed lower LSG values. The maximum LSG value for the pure red light group was 115.16 mg/g in LSGR1B0-P4, representing a significant difference of 70.48% when compared to the maximum LSG value in the pure blue light group. The observed increase in LST concentration under the blue-light-dominant condition (R0B1), particularly at the later growth stage (P4), suggests that blue light plays an important role in promoting steviol glycoside accumulation. This may be associated with blue-light-mediated regulation of specialized metabolism, potentially through photoreceptors such as cryptochromes, which are known to influence the expression of genes involved in secondary metabolite biosynthesis. In contrast, the relatively low LST concentration observed under pure red light conditions (R1B0) may be attributed to preferential carbon allocation toward primary growth processes, such as biomass accumulation, rather than secondary metabolite production. This indicates a trade-off between growth and metabolite accumulation under different light qualities. These results highlight the importance of stage-dependent light management. While red-light-dominant conditions may support biomass development during early growth stages, increasing the proportion of blue light during later stages may enhance SG accumulation. Therefore, dynamic adjustment of red-to-blue light ratios could be a practical approach to optimize both yield and metabolite production in Stevia cultivation.
In addition, the findings are consistent with previous studies, which have demonstrated that blue light, serving as a primary absorption band for cryptochromes (CRYs), promotes the accumulation of secondary metabolites [28,29,49]. For instance, Wang et al. [50] demonstrated that blue light applied at three different intensities affected metabolite accumulation in tea plants, with the highest photosynthetic photon flux density (PPFD) treatment (200 μmol·m−2·s−1) promoting lipid metabolism and flavonoid biosynthesis. In addition, Aljafer et al. [48] reported that exposure to blue light (450 nm), as well as a combined treatment of blue light (435 nm) and ultraviolet (UV) radiation, significantly increased ST content. However, UV light exhibited a negative impact on RT accumulation. This finding suggests that the overall synthesis of SGs may not be primarily driven by photoprotection mechanisms. Hashim et al. [51] found that both blue and ultraviolet (UV) light enhanced the content of phenolic and flavonoid compounds in various crops, suggesting that CRYs and UVR8 play key roles in the synthesis and accumulation of secondary metabolites. However, the connection between this phenomenon and the accumulation of SGs in Stevia remains underexplored. The relationship between CRYs, UVR8, and SG accumulation has yet to be clearly established. In the study conducted by Semenova et al. [52], the authors evaluated photoprotective factors, including antioxidant capacity and total flavonoid content, under various light conditions. Their findings indicated no correlation between these factors and SGs content in Stevia, suggesting a consistent lack of association between photoprotective mechanisms and SGs accumulation.
On the other hand, there is also evidence on the regulation effects of blue light on the SGs biosynthesis in transcription level. Yoneda et al. [19] highlighted that genes associated with SG synthesis enzymes exhibited a stronger response to blue light compared to red light. The study evaluated the expression of genes involved in steviol glycoside (SG) biosynthesis under different lighting regimes, including blue/red light ratios ranging from 0.12 to 8.57, as well as various combinations of blue, red, and far-red light. The relative transcription levels of several key genes associated with SG biosynthesis were analyzed across these treatments. Results showed that, among the blue/red light treatments, the highest expression of the kaurene oxidase gene occurred under blue light alone, followed by the treatment with a blue/red ratio of 0.67. Within the SG biosynthetic pathway, UGT74G1 primarily catalyzes the conversion of steviolbioside (STB) into stevioside (ST), UGT85C2 is responsible for converting steviol into steviolmonoside, and UGT76G1 mediates the transformation of ST into rebaudioside A (RA). The relative transcription levels of these genes were greatest under monochromatic blue light, while no significant differences were observed among the other blue/red ratio treatments. These observations indicate that blue light plays a key role in regulating the transcription of enzymes associated with SG biosynthesis. Moreover, the light-dependent regulation of SG-related gene expression appeared to follow trends similar to those reported for photosynthetic responses. Ptak et al. [53] found that the addition of blue or white light, compared with red light alone, significantly increased stomatal density as well as chlorophyll a, chlorophyll b, and carotenoid contents, suggesting an improvement in photosynthetic capacity. These findings imply that SG accumulation in Stevia may be associated with enhanced photosynthetic activity under specific light environments. Nevertheless, additional studies are required to further clarify the mechanistic relationship between photosynthesis and SG biosynthesis.
The differential responses of leaf biomass and steviol glycoside accumulation under varying R:B ratios can be interpreted through light signal perception and carbon allocation mechanisms. Red light, primarily perceived by phytochromes, promotes photosynthetic capacity, leaf expansion, and biomass accumulation, thereby enhancing carbon assimilation and allocation toward primary growth [27]. In contrast, blue light, mediated by cryptochromes and phototropins, plays a critical role in regulating secondary metabolism. Previous studies have shown that blue light can upregulate genes involved in specialized metabolite biosynthesis, including pathways analogous to the methylerythritol phosphate (MEP) pathway and downstream glycosylation processes [29,30].
These findings suggest a trade-off between vegetative growth and secondary metabolite accumulation. Under red-light-dominant conditions, carbon is preferentially allocated to biomass production, resulting in higher leaf dry weight but relatively lower SG concentration. Conversely, increased blue light promotes SG biosynthesis per unit biomass, potentially at the expense of growth.

3.4. The Impact of Various Red and Blue Light Ratio Combinations on Overall Yield SG

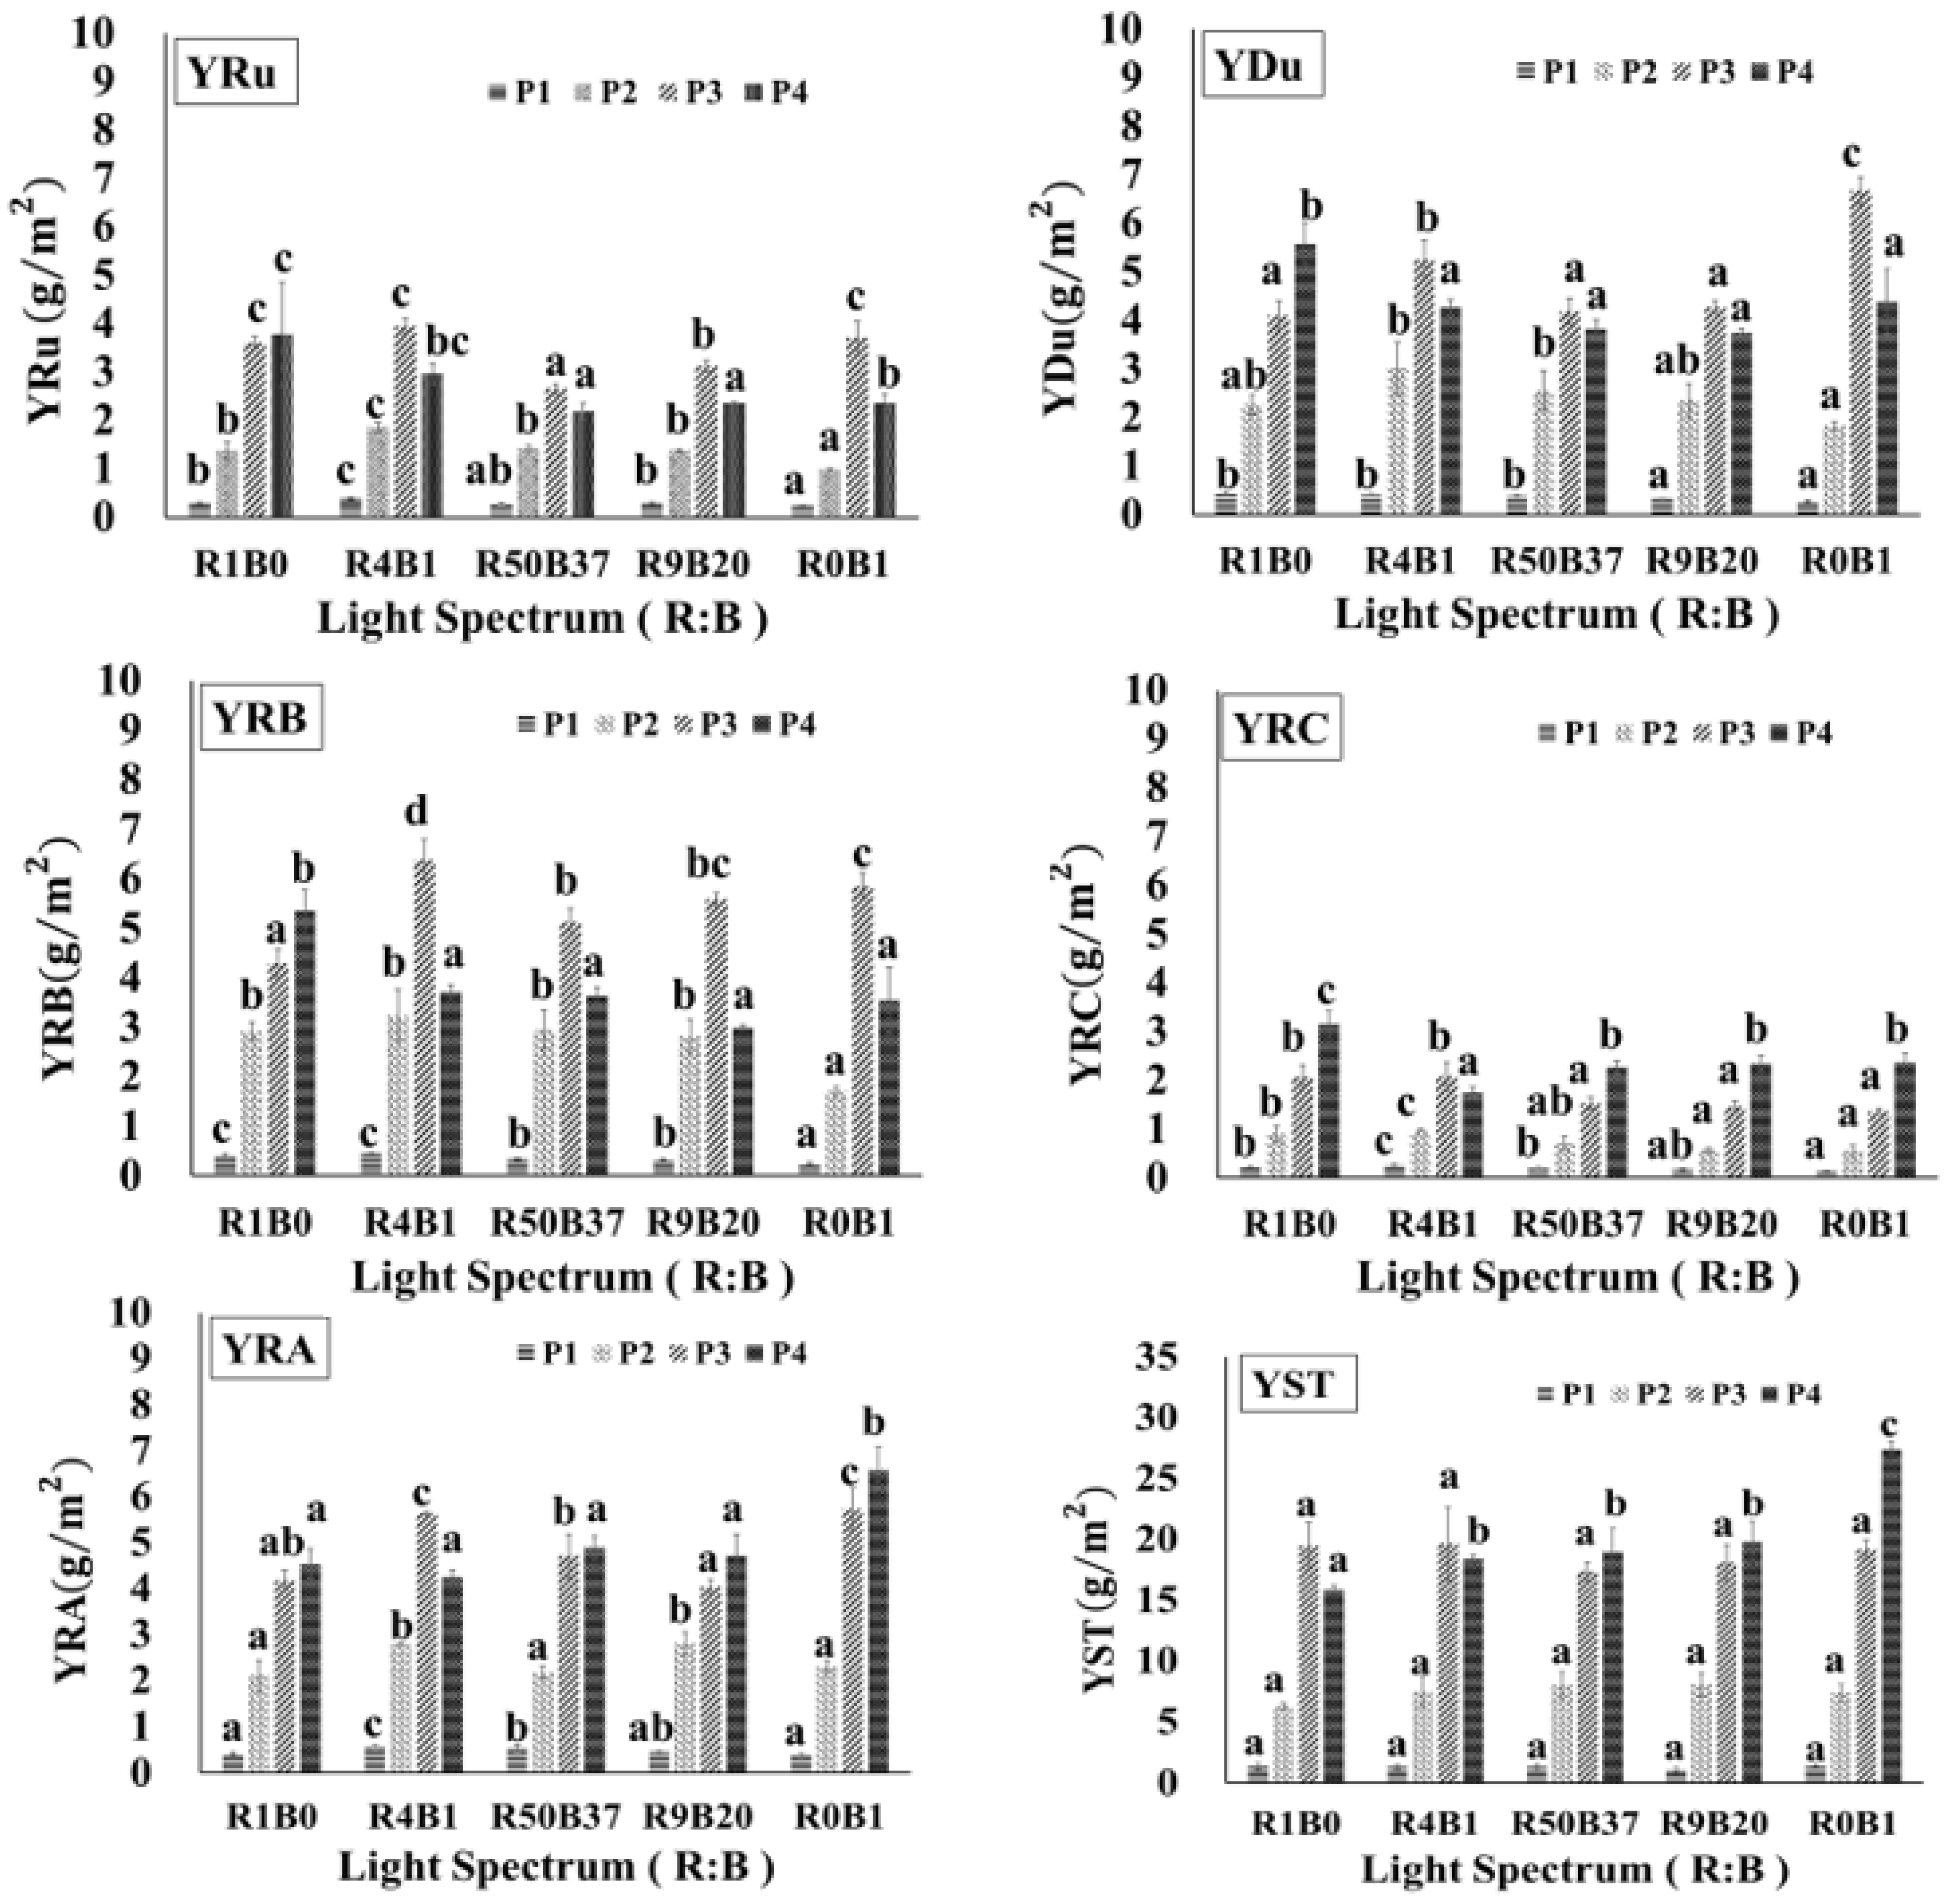
Yield represents a fundamental parameter in agricultural production systems. The present study showed that modifying the proportion of red and blue light can markedly affect several important growth and compositional parameters in Stevia, including fresh weight (FW), dry weight (DW), extraction yield (E), concentration (C), SG content in the lyophilized extract (H), and SG content in dried leaves (L). In addition to light quality, other cultivation factors—such as planting density, air circulation, nutrient solution flow, CO2 availability, and fertilizer formulation—may also influence the concentration, accumulation, and overall yield of steviol glycosides (SG). In this work, the analysis specifically examined different combinations of light spectra while maintaining a fixed planting density of 120 plants m−2. At each designated growth stage (P1–P4), 30 plants were randomly selected for subsequent measurements and analyses. The calculated yield of SG (Y) was based on the assumption of maintaining a constant planting density, with further estimations made by evaluating biomass and the accumulation of each type of SG. The yield per square meter of cultivation area was calculated using Formula (5), with the results presented in Figure 8. The highest yield values for each SG per square meter were observed in the following groups: YRuR1B0-P4, YDuR0B1-P3, YRBR4B1-P3, YRCR1B0-P4, YRAR0B1-P4, and YSTR0B1-P4, with respective values of 3.78, 6.68, 6.38, 3.16, 6.59, and 27.33 g/m2. These maximum yields were attained in the groups with higher red or blue light proportions. Specifically, higher red light ratios resulted in greater DW, while higher blue light ratios enhanced the content of SG in the lyophilized extract (HSG) and dried leaves (LSG). As a result, the groups with higher proportions of red or blue light naturally exhibited higher yields of SG. The differential gene responses reported by Yoneda et al. [19] provide a useful framework for interpreting the present results. In that study, blue-light-enriched conditions significantly upregulated several SG-related genes, including KO, UGT74G1, UGT85C2, and UGT76G1, which are involved in the biosynthetic steps leading to stevioside and rebaudioside formation. These findings suggest that blue light may promote SG accumulation not only through general effects on plant metabolism, but also through transcriptional regulation of key biosynthetic genes. In the present study, the higher accumulation of several SG components under blue-light-enriched conditions is consistent with this proposed regulatory mechanism. However, since gene expression was not directly measured here, this interpretation should be considered supportive rather than confirmatory.
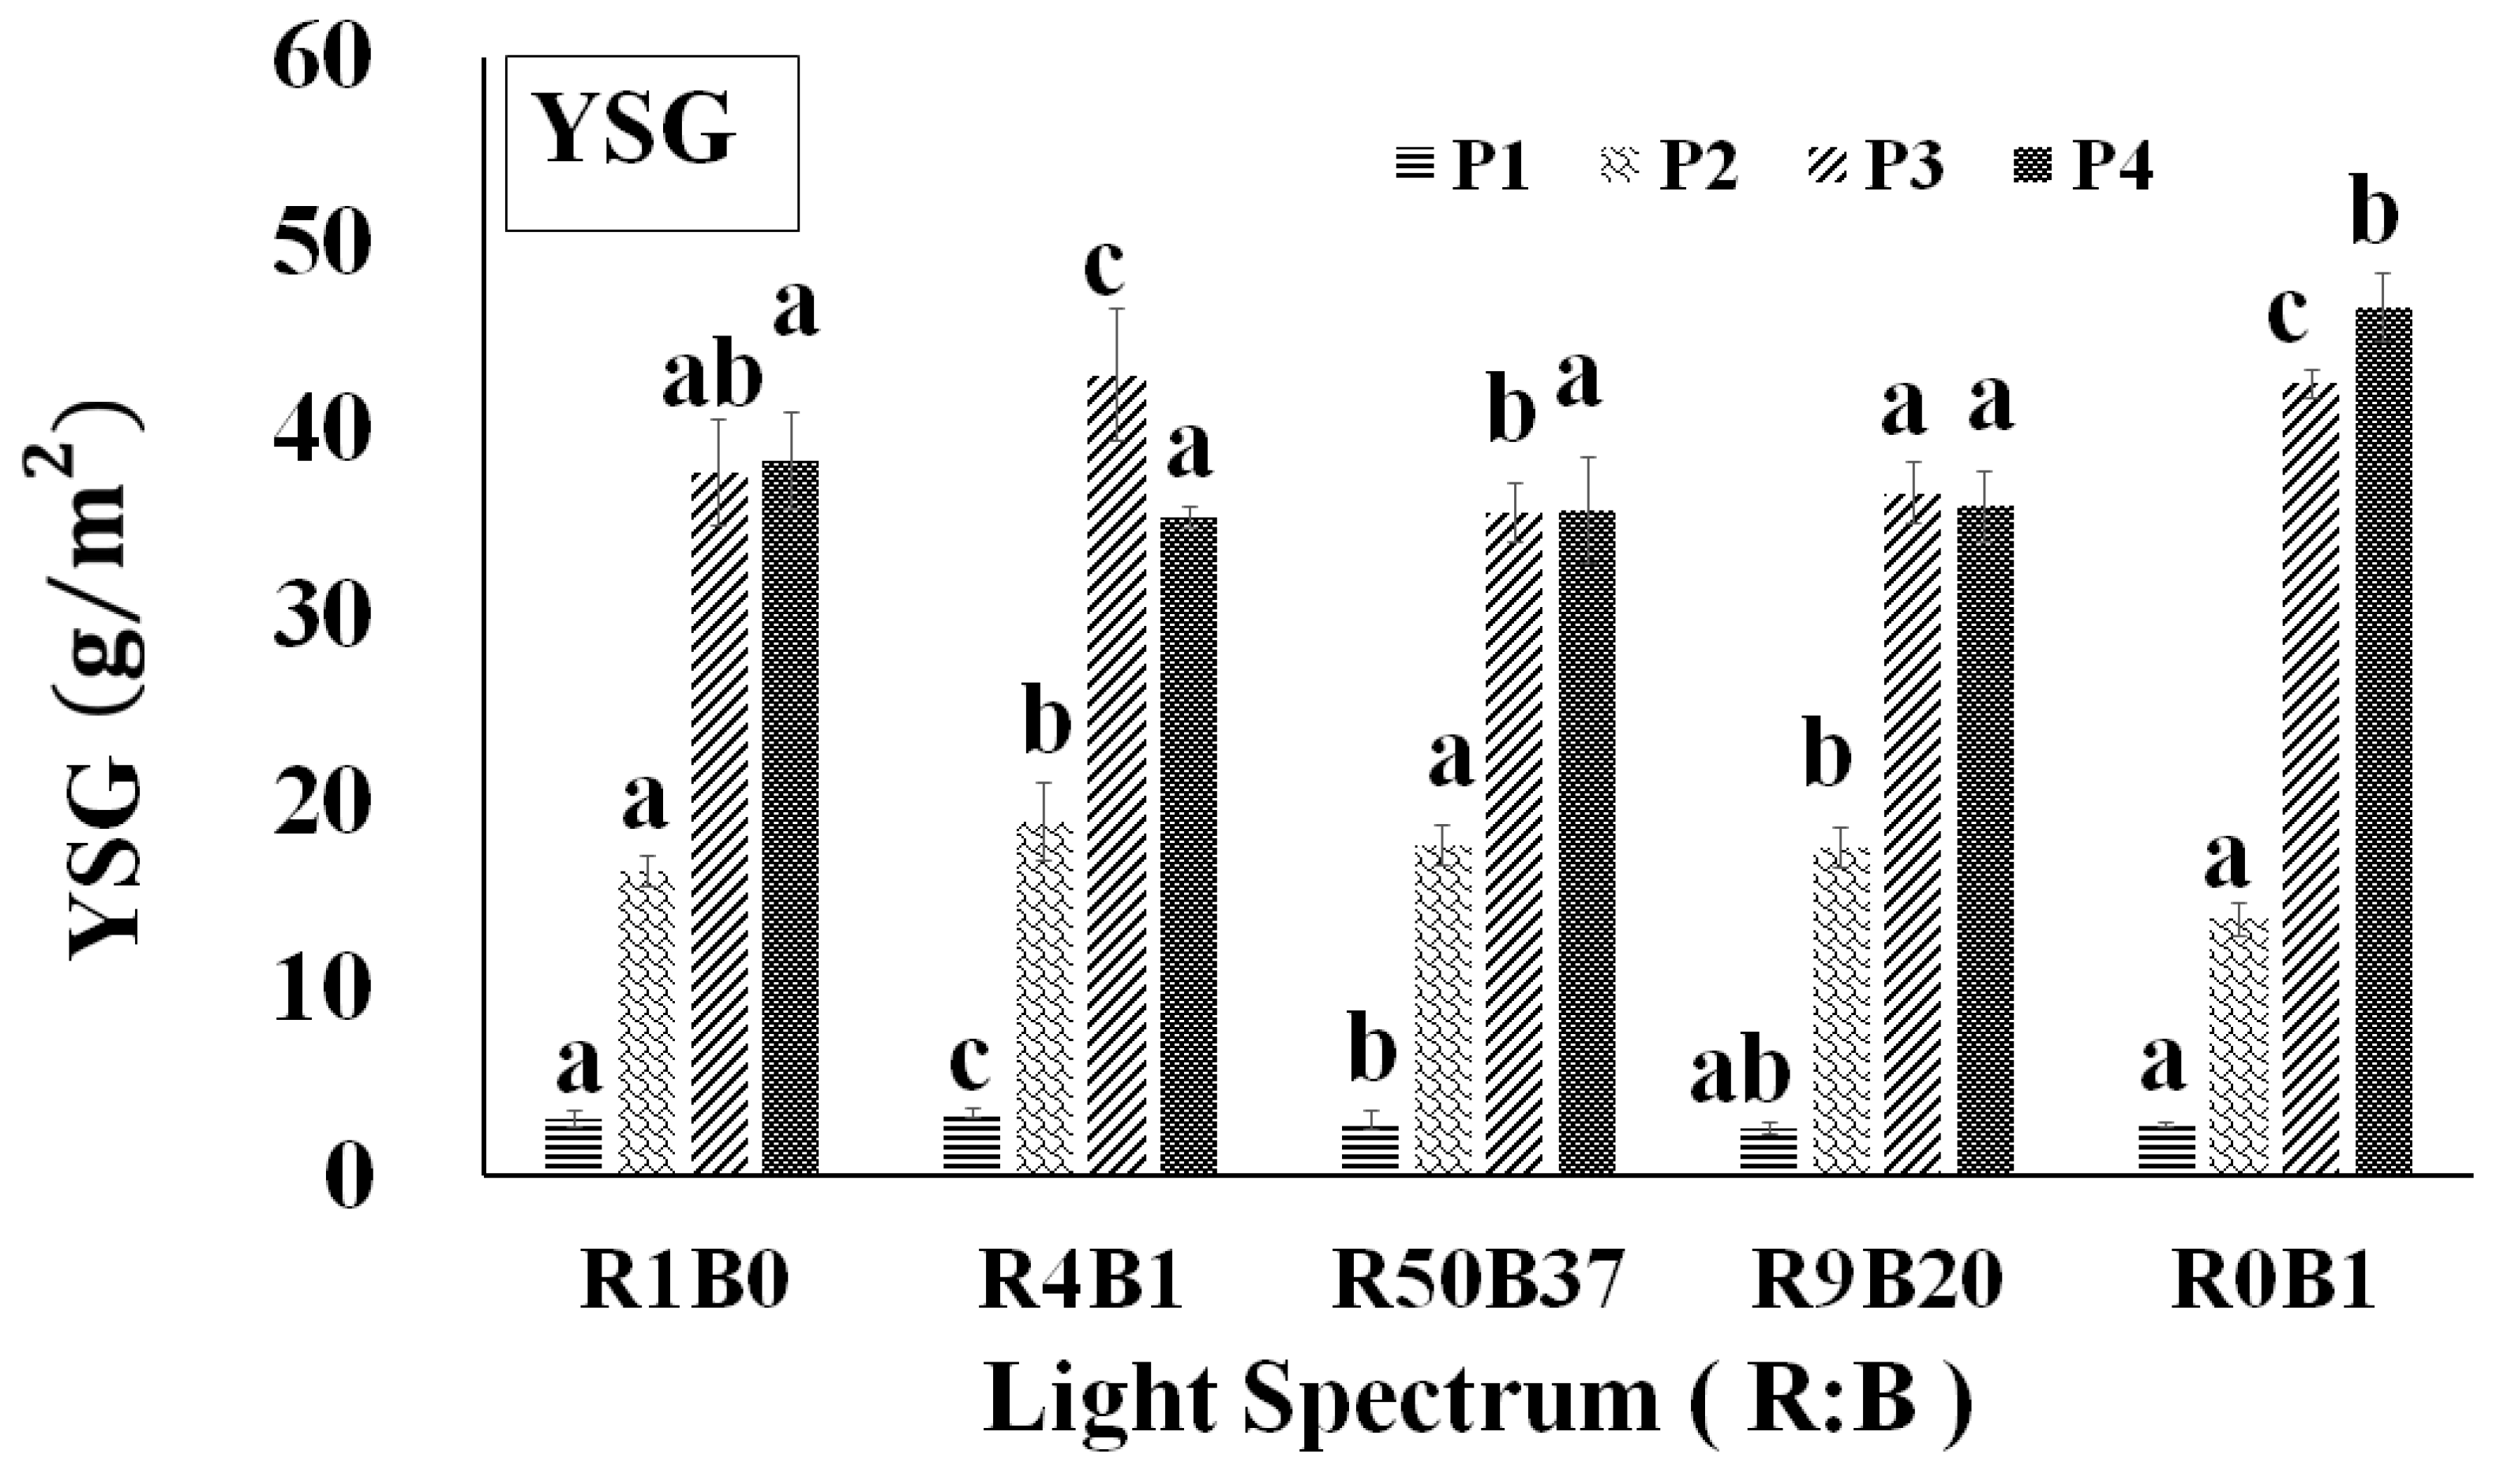
Figure 9 illustrates the total yield of SG (YSG) in Stevia at various designated growth stages under different red and blue light ratio combinations, measured per square meter of cultivation area. The highest YSG was recorded in the R0B1 group at YSGR0B1-P4, with a value of 46.56 g/m2, while the lowest YSG was observed in the R50B37 group at YSGR50B37-P4, at 35.70 g/m2, representing a significant difference of 30.42% difference between the two groups. Additionally, the data from the R50B37 group displayed a concave trend, highlighting the importance of optimizing light quality combinations by adjusting the red-to-blue light ratio to enhance the overall yield of SG. The highest YSG values were observed at different designated growth stages: R4B1 (P1), R4B1 (P2), R4B1 (P3), and R0B1 (P4). These results suggest optimal lighting strategies for various growth phases.
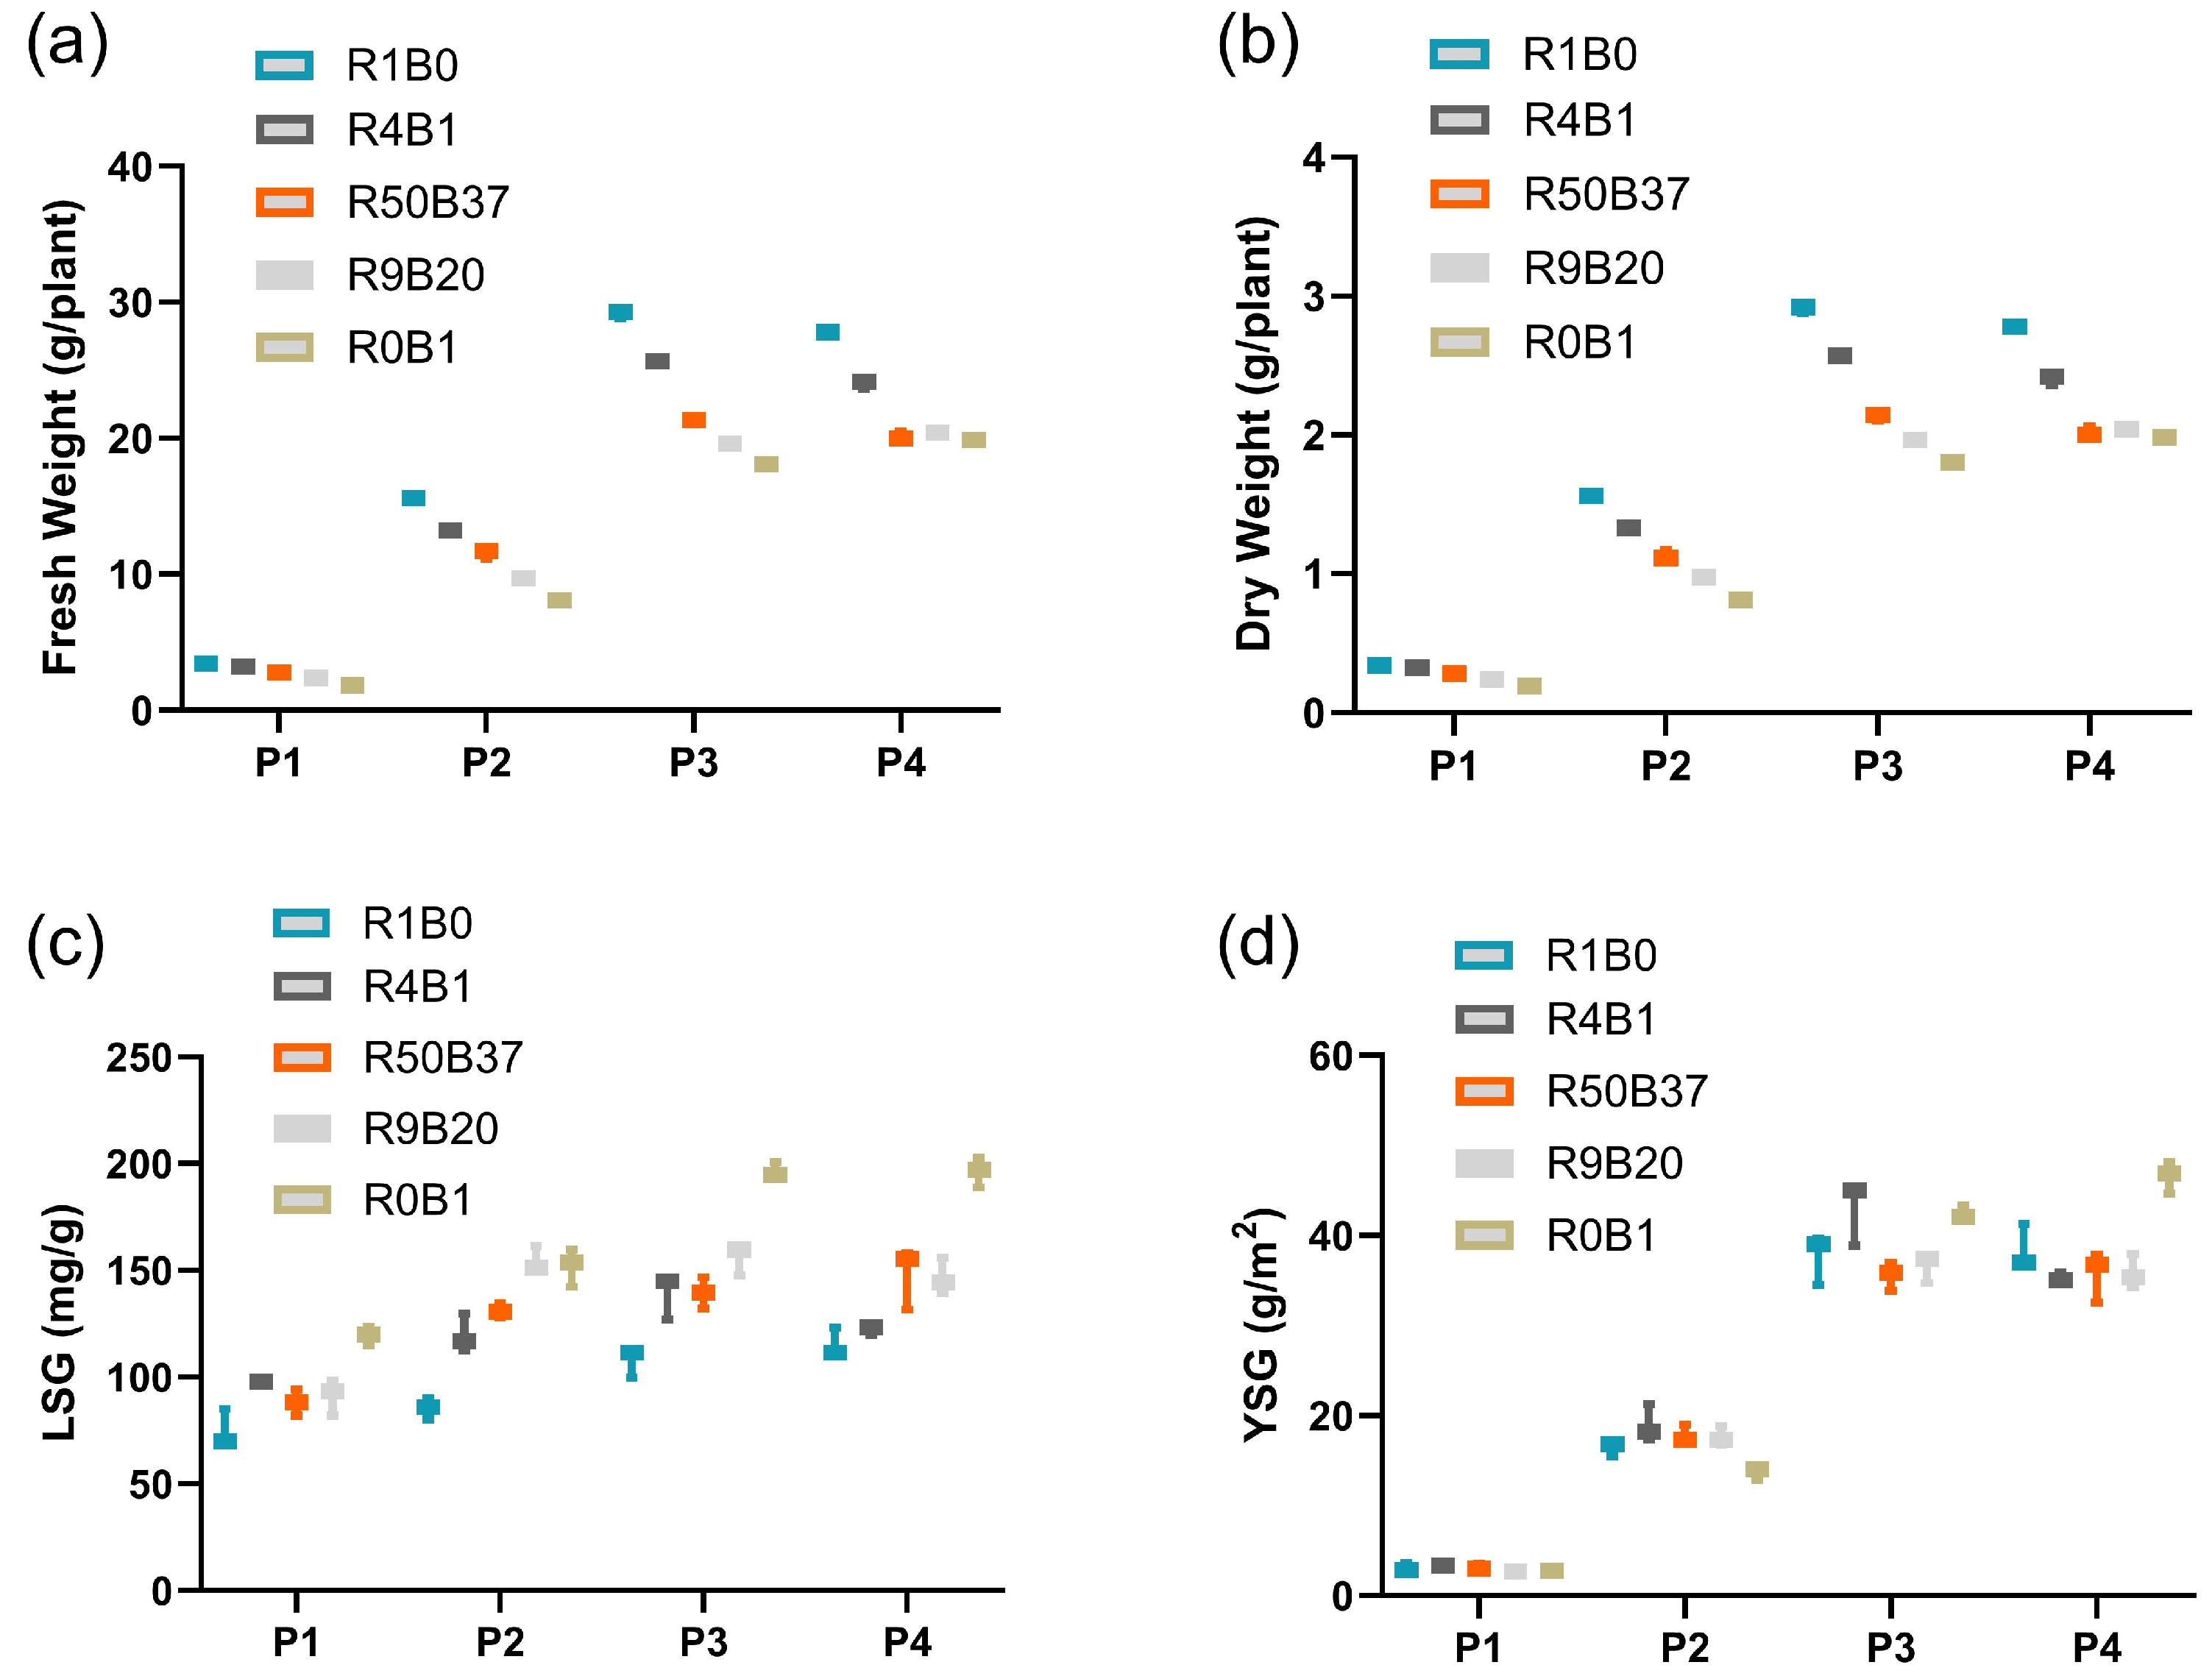
To further evaluate the combined effects of light treatment and growth stage, a two-way ANOVA was conducted for FW, DW, LSG, and YSG (Figure 10). The analysis revealed that both main factors—light treatment and growth stage—had highly significant effects on all measured parameters (p < 0.0001) (Table 4). In addition, a significant interaction between light treatment and growth stage was observed for all variables (p < 0.0001), indicating that the effects of light quality on plant growth and steviol glycoside accumulation were dependent on developmental stage. The significant interaction between light treatment and growth stage indicates that the response of Stevia to spectral composition is not constant throughout development, but rather depends on physiological stage. This supports the concept of stage-dependent light regulation, where red and blue light play different roles in biomass accumulation and secondary metabolite synthesis at different growth stages.
SGs are synthesized through a biosynthesis pathway that initially involves gibberellic acid, with kaurenoids acting as intermediate precursors. Additionally, glucose and sucrose serve as precursors for SG biosynthesis. Ceunen and Geuns [54] highlighted the dynamic correlation between glucose or sucrose as substrates and SGs as products, noting that this relationship is significantly influenced by day length and ontogeny. Their study showed that under long-day (LD) conditions, glucose content doubled after the onset of flower bud formation, while under short-day (SD) conditions, glucose levels either stagnated or slightly decreased. In contrast, Yang et al. [55] observed notable changes in SG content and gene expression across different growth stages. Their results showed that the transcription levels of fifteen genes associated with SG biosynthesis remained relatively low during the rapid vegetative growth phase but increased markedly during the stages of flower-bud initiation and flowering. The authors proposed that enhanced transcription of gibberellin (GA) biosynthesis genes during flower-bud formation may supply additional kaurenoid precursors for SG biosynthesis. This mechanism may account for the observation in the present study that the highest SG yield occurred during the P3 and P4 growth stages.
SG yield (YSG) represents an integrated outcome of both biomass production and metabolite accumulation, as it is determined by the product of leaf dry weight and SG concentration. Therefore, variations in YSG under different light conditions cannot be attributed to a single physiological factor but rather reflect coordinated changes in growth and secondary metabolism. Under red-light-dominant conditions, enhanced photosynthetic efficiency and carbon assimilation promote biomass accumulation, which contributes substantially to YSG, particularly during early growth stages. In contrast, blue-light-enriched conditions enhance SG biosynthesis per unit biomass, likely through the regulation of secondary metabolic pathways, and become increasingly important in later growth stages. This stage-dependent shift indicates a transition in carbon allocation from primary growth to secondary metabolism. Consequently, SG yield is governed by the balance between biomass accumulation and metabolite production, highlighting the importance of integrating physiological and metabolic responses when optimizing light conditions for Stevia cultivation.

4. Conclusions

This study investigated the hydroponic cultivation of Stevia under varying ratios of red and blue light, focusing on the extraction of SG as the primary product. Throughout cultivation period, the R0B1 light condition proved to be effective in P1, P3 and P4, yielding the highest concentrations of SG (both LSG and YSG). When analyzing individual designated growth stages, the highest LSG values were observed as follows: P1 (R0B1), P2 (R9B20), P3 (R0B1), and P4 (R0B1). Similarly, the highest YSG values were found in P1 (R4B1), P2 (R4B1), P3 (R4B1), and P4 (R0B1). Based on these findings, the following sequential light ratios are recommended for optimal hydroponic cultivation of Stevia across the four designated growth stages: R4B1, R4B1, R4B1, and R0B1. To meet the increasing demand for SG and improve the yield of both Stevia leaves and SG, the use of controlled indoor environments, such as plant factories and precision greenhouses, with regulated light quality, presents a promising solution. The applicability of these findings to other plant species/varieties or hydroponic systems should be interpreted with caution, as responses to light quality are likely species-specific and dependent on cultivation conditions. However, the underlying regulatory mechanisms may provide a general reference for light optimization strategies.

Author Contributions

Conceptualization, C.T.C., S.-T.W. and M.-L.T.; methodology, C.T.C., S.-T.W. and M.-L.T.; validation, C.T.C. and M.-L.T.; formal analysis, C.T.C., V.C. and M.A.L.; investigation, C.T.C., V.C. and M.A.L.; resources, C.T.C.; data curation, C.T.C., V.C. and M.A.L.; writing—original draft preparation, C.T.C.; writing—review and editing, S.-T.W. and M.-L.T.; visualization, C.T.C., S.-T.W. and M.-L.T.; supervision, M.-L.T.; project administration, M.-L.T.; funding acquisition, M.-L.T. All authors have read and agreed to the published version of the manuscript.

Funding

The authors gratefully acknowledge the financial support provided by the National Science and Technology Council, Taiwan [NSTC 111-2320-B-019-004-MY3 and 114-2320-B-019-006-MY3].

Data Availability Statement

The original contributions presented in the study are included in the article, further inquiries can be directed to the corresponding author.

Conflicts of Interest

The authors declare no conflicts of interest.

Abbreviations

The following abbreviations are used in this manuscript:
B/RThe ratio of blue and red light relative intensity
CRYsCryptochrome family
DPlanting density (plants/m2)
DWStevia leaves dry weight (g/plant)
E Extraction yield of the Stevia extract (%)
EC Electrical conductivity (mS/cm)
FThe number of days required for the first flower bud to appear (days)
FWStevia leaves fresh weight (g/plant)
HPLCHigh-performance liquid chromatography
KA13HEnt-kaurenoic acid 13-hydroxylase
LEThe weight of the lyophilized Stevia leaf extract (g)
LED Light-emitting diode
PPFD Photosynthetic photon flux density (μmol·m−2·s−1)
PHOTsPhototropin family
PHYsPhytochrome family
RA–RFRebaudioside A-F
SPStevia powder weight (g)
STBSteviolbioside
UGTsA series of uridine 5′-diphospho-glucuronosyltransferases
UVR8UV-resistance locus 8
Coding principles for the abbreviations used in this study:
1st code: Concentration, content, yield
CConcentration of each SG component determined by HPLC.
HContent of each SG component in the lyophilized Stevia extract.
LContent of each SG component in each gram of dried Stevia leaves.
YYield of each SG component per m2 of cultivation area.
2nd code: Steviol glycosides type
RuRubusoside
DuDulcoside A
RBRebaudioside B
STStevioside
RCRebaudioside C
RARebaudioside A
SGTotal SG
3rd code: Light quality
R1B0R/B = 1/0
R4B1R/B = 4/1
R50B37R/B = 50/37
R9B20R/B = 9/20
R0B1R/B = 0/1
4th code: Cultivation period
P130 days
P260 days
P390 days
P4(F + 15) days

References

  1. Soejarto, D.D. Botany of Stevia and Stevia rebaudiana. In Stevia: The Genus Stevia; Kinghorn, A.D., Ed.; Taylor & Francis: London, UK, 2002; pp. 18–39. [Google Scholar]
  2. Hossain, M.A.; Siddique, A.B.; Rahman, S.M.M.; Hossain, M.A. Chemical composition of the essential oils of Stevia rebaudiana Bertoni leaves. Asian J. Tradit. Med. 2010, 5, 56–61. [Google Scholar]
  3. Gardana, C.; Simonetti, P.; Canzi, E.; Zanchi, R.; Pietta, P. Metabolism of stevioside and rebaudioside A from Stevia rebaudiana extracts by human microflora. J. Agric. Food Chem. 2003, 5, 6618–6622. [Google Scholar] [CrossRef]
  4. Singh, S.; Rao, G. Stevia: The herbal sugar of 21st Century. Sugar Tech 2005, 71, 17–24. [Google Scholar] [CrossRef]
  5. Goyal, S.K.; Samsher; Goyal, R.K. Stevia (Stevia rebaudiana) a bio-sweetener: A review. Int. J. Food Sci. Nutr. 2010, 61, 1–10. [Google Scholar] [CrossRef]
  6. Mishra, P.; Singh, R.; Kumar, U.; Prakash, V. Stevia rebaudiana—A magical sweetener. GJBB 2010, 5, 62–74. [Google Scholar]
  7. Madan, S.; Ahmad, S.; Singh, G.N.; Kohli, K.; Kumar, Y.; Singh, R.; Garg, M. Stevia rebaudiana (Bert.) Bertoni—A review. Indian J. Nat. Prod. Resour. 2010, 1, 267–286. [Google Scholar]
  8. Ghanta, S.; Banerjee, A.; Poddar, A.; Chattopadhyay, S. Oxidative DNA damage preventive activity and antioxidant potential of Stevia rebaudiana (Bertoni) Bertoni, a natural sweetener. J. Agric. Food Chem. 2007, 55, 10962–10967. [Google Scholar] [CrossRef]
  9. Lemus-Mondaca, R.; Vega-Gálveza, A.; Zura-Bravoa, L.; Ah-Hen, K. Stevia rebaudiana Bertoni, source of a high-potency natural sweetener: A comprehensive review on the biochemical, nutritional and functional aspects. Food Chem. 2012, 132, 1121–1132. [Google Scholar] [CrossRef] [PubMed]
  10. Taiwan Food and Drug Administration (TFDA). Standards for Specification, Scope, Application and Limitation of Food Additives; Taiwan Food and Drug Administration (TFDA): Taipei, Taiwan, 2020; p. 11-1-012.
  11. Serio, L. La Stevia rebaudiana, une alternative au sucre. Phytothérapie 2010, 8, 26–32. [Google Scholar] [CrossRef]
  12. Kochikyan, V.; Markosyan, A.; Abelyan, L.; Balayan, A.; Abelyan, V. Combined enzymatic modification of stevioside and rebaudioside A. Appl. Biochem. Microbiol. 2006, 42, 31–37. [Google Scholar] [CrossRef]
  13. Geuns, J.M.C. Stevioside. Phytochemistry 2003, 64, 913–921. [Google Scholar] [CrossRef]
  14. Makapugay, H.; Nanayakkara, N.; Kinghorn, A. Improved high performance liquid chromatographic separation of the Stevia rebaudiana sweet diterpene glycosides using linear gradient elution. J. Chromatogr. A 1984, 283, 390–395. [Google Scholar] [CrossRef]
  15. Totté, N.; Van den Ende, W.; Van Damme, E.J.M.; Compernolle, F.; Baboeuf, I.; Geuns, J.M.C. Cloning and heterologous expression of early genes in gibberellin and steviol biosynthesis via the methylerythritol phosphate pathway in Stevia rebaudiana. Can. J. Bot. 2003, 81, 517–522. [Google Scholar] [CrossRef]
  16. Richman, A.; Swanson, A.; Humphrey, T.; Chapman, R.; McGarvey, B.; Pocs, R.; Brandle, J. Functional genomics uncovers three glucosyltransferases involved in the synthesis of the major sweet glucosides of Stevia rebaudiana. Plant J. 2005, 41, 56–67. [Google Scholar] [CrossRef] [PubMed]
  17. Humphrey, T.V.; Richman, A.S.; Menassa, R.; Brandle, J.E. Spatial organization of four enzymes from Stevia rebaudiana that are involved in steviol glycoside synthesis. Plant Mol. Biol. 2006, 61, 47–62. [Google Scholar] [CrossRef]
  18. Hernández, K.V.; Moreno-Romero, J.; de la Torre, M.H.; Manríquez, C.P.; Leal, D.R.; Martínez-Garcia, J.F. Effect of light intensity on steviol glycosides production in leaves of Stevia rebaudiana plants. Phytochchemistry 2022, 194, 113027. [Google Scholar] [CrossRef]
  19. Yoneda, Y.; Nakashima, H.; Miyasaka, J.; Ohdoi, K.; Shimizu, H. Impact of blue, red, and far-red light treatments on gene expression and steviol glycoside accumulation in Stevia rebaudiana. Phytochchemistry 2017, 137, 57–65. [Google Scholar] [CrossRef]
  20. Paradiso, R.; Proietti, S. Light-quality manipulation to control plant growth and photomorphogenesis in greenhouse horticulture: The state of the art and opportunities of modern LED systems. J. Plant Growth Regul. 2022, 41, 742–780. [Google Scholar] [CrossRef]
  21. Terashima, I.; Hanba, Y.T.; Tazoe, Y.; Vyas, P.; Yano, S. Irradiance and phenotype: Comparative eco-development of sun and shade leaves in relation to photosynthetic CO2 diffusion. J. Exp. Bot. 2006, 57, 343–354. [Google Scholar] [CrossRef]
  22. Athanasiou, K.; Dyson, B.C.; Webster, R.E.; Johnson, G.N. Dynamic acclimation of photosynthesis increases plant fitness in changing environments. Plant Physiol. 2010, 152, 366–373. [Google Scholar] [CrossRef]
  23. Kono, M.; Terashima, I. Long-term and short-term responses of the photosynthetic electron transport to fluctuating light. J. Photochem. Photobiol. B. 2014, 137, 89–99. [Google Scholar] [CrossRef]
  24. Vialet-Chabrand, S.; Matthews, J.S.; Simkin, A.J.; Raines, C.A.; Lawson, T. Importance of fluctuations in light on plant photosynthetic acclimation. Plant Physiol. 2017, 173, 2163–2179. [Google Scholar] [CrossRef] [PubMed]
  25. Wu, D.; Hu, Q.; Yan, Z.; Chen, W.; Yan, C.; Huang, X.; Zhang, J.; Yang, P.; Deng, H.; Wang, J.; et al. Structural basis of ultraviolet B perception by UVR8. Nature 2012, 484, 214–219. [Google Scholar] [CrossRef] [PubMed]
  26. Demotes-Mainard, S.; Péron, T.; Corot, A.; Bertheloot, J.; Le Gourrierec, J.; Pelleschi-Travier, S.; Crespel, L.; Morel, P.; Huché-Thélier, L.; Boumaza, R.; et al. Plant responses to red and far-red lights, applications in horticulture. Environ. Exp. Bot. 2016, 121, 4–21. [Google Scholar] [CrossRef]
  27. Casal, J.J. Photoreceptor signaling networks in plant responses to shade. Annu. Rev. Plant Biol. 2013, 64, 403–427. [Google Scholar] [CrossRef]
  28. Giliberto, L.; Perrotta, G.; Pallara, P.; Weller, J.L.; Fraser, P.D.; Bramley, P.M.; Fiore, A.; Tavazza, M.; Giuliano, G. Manipulation of the blue light photoreceptor cryptochrome 2 in tomato affects vegetative development, flowering time, and fruit antioxidant content. Plant Physiol. 2005, 137, 199–208. [Google Scholar] [CrossRef]
  29. Mawphlang, O.; Kharshiing, E.V. Photoreceptor mediated plant growth responses: Implications for photoreceptor engineering toward improved performance in crops. Front. Plant Sci. 2017, 8, 1181. [Google Scholar] [CrossRef] [PubMed]
  30. Boccalandro, H.E.; Giordano, C.V.; Ploschuk, E.L.; Piccoli, P.N.; Bottini, R.; Casal, J.J. Phototropins but not cryptochromes mediate the blue light-specific promotion of stomatal conductance, while both enhance photosynthesis and transpiration under full sun light. Plant Physiol. 2012, 158, 475–1484. [Google Scholar] [CrossRef]
  31. Baudry, A.; Ito, S.; Song, Y.H.; Strait, A.A.; Kiba, T.; Lu, S.; Henriques, R.; Pruneda, J.L.; Chua, N. F-box proteins FKF1 and LKP2 act in concert with ZEITLUPE to control Arabidopsis clock progression. Plant Cell 2010, 22, 606–622. [Google Scholar] [CrossRef]
  32. Song, G.; Jia, M.; Chen, K.; Kong, X.; Khattak, B.; Xie, C.; Li, A.; Mao, L. CRISPR/Cas9: A powerful tool for crop genome editing. Crop J. 2016, 4, 75–82. [Google Scholar] [CrossRef]
  33. Shulgina, A.A.; Kalashnikova, E.A.; Tarakanov, I.G.; Kirakosyan, R.N.; Cherednichenko, M.Y.; Polivanova, O.B.; Baranova, E.N.; Khaliluev, M.R. Influence of light conditions and medium composition on morphophysiological characteristics of Stevia rebaudiana Bertoni in vitro and in vivo. Horticulturae 2021, 7, 195. [Google Scholar] [CrossRef]
  34. Ucar, E.; Caglayan, N.; Turgut, K. The effects of various LED light wavelengths to the physiological and morphological parameters of Stevia (Stevia rebaudiana) Bertoni. Not. Sci. Biol. 2016, 8, 354–359. [Google Scholar] [CrossRef][Green Version]
  35. Son, K.H.; Oh, M.M. Leaf shape, growth, and antioxidant phenolic compounds of two lettuce cultivars grown under various combinations of blue and red light-emitting diodes. HortScience 2013, 48, 988–995. [Google Scholar] [CrossRef]
  36. Ceunen, S.; Werbrouck, S.; Geuns, J.M.C. Stimulation of steviol glycoside accumulation in Stevia rebaudiana by red LED light. J. Plant Physiol. 2012, 169, 749–752. [Google Scholar] [CrossRef]
  37. Modarelli, G.C.; Paradiso, R.; Arena, C.; Pascale, S.D.; Labeke, M.C.V. High light intensity from blue-red LEDs enhance photosynthetic performance, plant growth, and optical properties of red lettuce in controlled environment. Horticulturae 2022, 8, 114. [Google Scholar] [CrossRef]
  38. Kang, L.K.; Huang, Y.J.; Lim, W.T.; Hsu, P.H.; Hwang, P.A. Growth, pigment content, antioxidant activity, and phytoene desaturase gene expression in Caulerpa lentillifera grown under different combinations of blue and red light-emitting diodes. J. Appl. Phycol. 2020, 32, 1971–1982. [Google Scholar] [CrossRef]
  39. Yılmaz, F.M.; Görgüç, A.; Uygun, Ö.; Bircan, C. Steviol glycosides and polyphenols extraction from Stevia rebaudiana Bertoni leaves using maceration, microwave and ultrasound-assisted techniques. Sep. Sci. Technol. 2020, 56, 936–948. [Google Scholar] [CrossRef]
  40. FAO/WHO. Steviol glycosides from Stevia rebaudiana Bertoni. In Proceedings of the FAO Joint FAO/WHO Expert Committee on Food Additives (JECFA) Monographs 20, JECFA, 84th Meeting, Rome, Italy, 6–15 June 2017. [Google Scholar]
  41. Serfaty, M.; Ibdah, M.; Fischer, R.; Chaimovitsh, D.; Saranga, Y.; Dudai, N. Dynamics of yield components and stevioside production in Stevia rebaudiana grown under different planting times, plant stands and harvest regime. Ind. Crops Prod. 2013, 50, 731–736. [Google Scholar] [CrossRef]
  42. Lee, J.H.; Nam, S.Y. Vegetative propagation of six Pachyphytum species as influenced by different led light qualities. Hortic. Sci. Technol. 2023, 3, 237–249. [Google Scholar] [CrossRef]
  43. Lee, J.H.; Jang, I.T.; Kim, E.A.; Shin, E.J.; Lee, S.; Lee, M.; Nam, S.Y. Evaluating the influence of various light spectra on the growth and morphological responses of air plant (Tillandsia ionantha Planch.) grown under non-substrate and restricted irrigation conditions in a controlled environment facility. J. Agric. Life Environ. Sci. 2024, 36, 546–561. [Google Scholar]
  44. Frank, S.R. The effectiveness of the spectrum in chlorophyll formation. J. Gen. Physiol. 1946, 29, 157–179. [Google Scholar] [CrossRef]
  45. Zhang, J.; Han, C.; Liu, Z. Absorption spectrum estimating rice chlorophyll concentration: Perliminary investigations. J. Plant Breed. Crop Sci. 2009, 1, 223–229. [Google Scholar]
  46. Stutte, G.W.; Edney, S.; Skerritt, T. Photoregulation of bioprotectant content of red leaf lettuce with light-emitting diodes. HortScience 2009, 44, 79–82. [Google Scholar] [CrossRef]
  47. Naznin, M.T.; Lefsrud, M.; Gravel, V.; Azad, M.O.K. Blue light added with red LEDs enhance growth characteristics, pigments content, and antioxidant capacity in lettuce, spinach, kale, basil, and sweet pepper in a controlled environment. Plants 2019, 8, 93. [Google Scholar] [CrossRef] [PubMed]
  48. Aljafer, N.; Alrajhi, A.; Anderson von Trampe, T.; Vevers, W.; Fauset, S.; Rihan, H.Z. The impact of LED light spectra on the growth, yield, physiology, and sweetness compound of Stevia rebaudiana. Biology 2025, 14, 108. [Google Scholar] [CrossRef]
  49. Thoma, F.; Somborn-Schulz, A.; Schlehuber, D.; Keuter, V.; Deerberg, G. Effects of light on secondary metabolites in selected leafy greens: A review. Front. Plant Sci. 2020, 11, 497. [Google Scholar] [CrossRef]
  50. Wang, P.; Chen, S.; Gu, M.; Chen, X.; Chen, X.; Yang, J.; Zhao, F.; Ye, N. Exploration of the effects of different blue LED light intensities on flavonoid and lipid metabolism in tea plants via transcriptomics and metabolomics. Int. J. Mol. Sci. 2020, 21, 4606. [Google Scholar] [CrossRef]
  51. Hashim, M.; Ahmad, B.; Drouet, S.; Hano, C.; Abbasi, B.H.; Anjum, S. Comparative effects of different light sources on the production of key secondary metabolites in plants in vitro cultures. Plants 2021, 10, 1521. [Google Scholar] [CrossRef] [PubMed]
  52. Semenova, N.A.; Ivanitskikh, A.S.; Uyutova, N.I.; Smirnov, A.A.; Proshkin, Y.A.; Burynin, D.A.; Kachan, S.A.; Sokolov, A.V.; Dorokhov, A.S.; Chilingaryan, N.O. Effect of UV stress on the antioxidant capacity, photosynthetic activity, flavonoid and steviol glycoside accumulation of Stevia rebaudiana Bertoni. Horticulturae 2024, 10, 210. [Google Scholar] [CrossRef]
  53. Ptak, A.; Szewczyk, A.; Simlat, M.; Pawłowska, B.; Warchoł, M. LED light improves shoot multiplication, steviol glycosides and phenolic compounds biosynthesis in Stevia rebaudiana Bertoni in vitro culture. Sci. Rep. 2024, 14, 30860. [Google Scholar] [CrossRef] [PubMed]
  54. Ceunen, S.; Geuns, J.M.C. Glucose, sucrose, and steviol glycoside accumulation in Stevia rebaudiana grown under different photoperiods. Biol. Plant. 2013, 57, 390–394. [Google Scholar] [CrossRef]
  55. Yang, Y.; Huang, S.; Han, Y.; Yuan, H.; Gu, C.; Wang, Z. Environmental cues induce changes of steviol glycosides contents and transcription of corresponding biosynthetic genes in Stevia rebaudiana. Plant. Physiol. Biochem. 2015, 86, 174–180. [Google Scholar] [CrossRef] [PubMed]
Figure 1. Light qualities and their corresponding spectrums utilized in this study. (a) The red to blue light ratio is 1:0, designated as R1B0; (b) The red to blue light ratio is 4:1, designated as R4B1; (c) The red to blue light ratio is 50:37, designated as R50B37; (d) The red to blue light ratio is 9:20, designated as R9B20; (e) The red to blue light ratio is 0:1, designated as R0B1. Blue light has a wavelength of 450 nm, and red light has a wavelength of 655 nm.
Agronomy 16 00770 g001
Figure 2. The illustrations show (a) the scheme for the establishment of LED instrument, (b) the variation in photosynthetic photon flux density (PPFD, μmol·m−2·s−1) in relation to cultivation standard level, and (c) the position of PPFD measuring points and the uniformity of PPFD distribution as measured at the cultivation reference point.
Agronomy 16 00770 g002
Figure 3. The figure presents the hydroponic recirculating cultivation system and related experimental design. Panel (a) illustrates the system configuration, while (b) shows the lighting arrangement under illumination. Panel (c) indicates the cultivation density, and (d) displays four develop-mental stages of Stevia, including the flowering period and the corresponding photosynthetic photon flux density (PPFD). Panel (e) outlines the experimental grouping scheme and the sam-pling strategy applied in this study. The abbreviations R1B0, R4B1, R50B37, R9B20, R0B1, and P1–P4 are explained in the list of abbreviations.
Agronomy 16 00770 g003
Figure 4. The photographs illustrate Stevia plants cultivated under different growth and light conditions: (a) during growth period P1, (b) during growth period P2, (c) during growth period P3, and (d) during growth period P4. * The abbreviations R1B0, R4B1, R50B37, R9B20, R0B1, and P1–P4 are defined in the abbreviations list.
Agronomy 16 00770 g004
Figure 5. HPLC chromatograms of the Stevia extract and SG standards spiked into the extract are shown after dissolution in the mobile phase (80% ACN:20% H2O). The abbreviations CRu, CDu, CRB, CST, CRC, and CRA are explained in the list of abbreviations.
Agronomy 16 00770 g005
Figure 6. The levels of individual SGs in dried Stevia leaves cultivated under different light spectrum treatments are presented. The abbreviations R1B0, R4B1, R50B37, R9B20, R0B1, P1–P4, LRu, LDu, LRB, LST, LRC, and LRA are defined in the list of abbreviations. Data are presented as mean ± SD for each light treatment at each designated growth stage, based on three independent experiments (n = 3). Error bars represent SD for all groups. Within the same designated growth stage, bars labeled with different letters (a–d) indicate significant differences among light treatments according to Duncan’s multiple range test (p < 0.05).
Agronomy 16 00770 g006
Figure 7. The total steviol glycoside content (LSG, mg/g) in dried Stevia leaves is presented. R1B0: R/B = 1/0; R4B1: R/B = 4/1; R50B37: R/B = 50/37; R9B20: R/B = 9/20; R0B1: R/B = 0/1; P1: 30 days; P2: 60 days; P3: 90 days; P4: (F + 15) days; LSG: the total contents of SG in the dried leaves. Data are presented as mean ± SD for each light treatment at each designated growth stage, based on three independent experiments (n = 3). Error bars represent SD for all groups. Within the same designated growth stage, bars labeled with different letters (a–d) indicate significant differences among light treatments according to Duncan’s multiple range test (p < 0.05).
Agronomy 16 00770 g007
Figure 8. The yield of individual steviol glycosides (SGs) obtained from Stevia leaf extracts per square meter of cultivation area under different light spectrum treatments is presented. The abbreviations R1B0, R4B1, R50B37, R9B20, R0B1, P1–P4, YRu, YDu, YRB, YST, YRC, and YRA are defined in the list of abbreviations. Data are presented as mean ± SD for each light treatment at each designated growth stage, based on three independent experiments (n = 3). Error bars represent SD for all groups. Within the same designated growth stage, bars labeled with different letters (a–d) indicate significant differences among light treatments according to Duncan’s multiple range test (p < 0.05).
Agronomy 16 00770 g008
Figure 9. The yield of steviol glycosides (SGs) obtained from Stevia leaf extracts per square meter of cultivation area under different light spectrum treatments is presented. The abbreviations R1B0, R4B1, R50B37, R9B20, R0B1, P1–P4, and YSG are defined in the list of abbreviations. Data are presented as mean ± SD for each light treatment at each designated growth stage, based on three independent experiments (n = 3). Error bars represent SD for all groups. Within the same designated growth stage, bars labeled with different letters (a–c) indicate significant differences among light treatments according to Duncan’s multiple range test (p < 0.05).
Agronomy 16 00770 g009
Figure 10. Interaction effects of light treatment and growth stage on (a) FW, (b) DW, (c) LSG, and (d) YSG. Values are presented as mean ± SD (n = 3 independent cultivation batches). The in-teraction between light treatment and growth stage was analyzed using two-way ANOVA, and all effects were significant (p < 0.0001).
Agronomy 16 00770 g010
Table 1. The fresh weight (FW, g per plant) of Stevia leaves was measured across different designated growth stages (P1–P4) under various light spectrum treatments.
Light SpectrumP1 **P2P3P4
R1B0 *3.46 ± 0.04 e15.61 ± 0.06 e29.16 ± 0.31 e27.74 ± 0.23 d
R4B13.15 ± 0.13 d13.26 ± 0.08 d25.64 ± 0.25 d24.03 ± 0.37 c
R50B372.82 ± 0.21 c11.53 ± 0.34 c21.27 ± 0.22 c20.07 ± 0.38 b
R9B202.38 ± 0.46 b9.76 ± 0.15 b19.57 ± 0.08 b20.41 ± 0.13 ab
R0B11.89 ± 0.06 a8.12 ± 0.09 a18.07 ± 0.08 a19.80 ± 0.07 a
* R1B0: The ratio of red to blue light intensity is equal to 1:0 (R/B = 1/0), R4B1: R/B = 4/1, R50B37: R/B = 50/37, R9B20: R/B = 9/20, R0B1: R/B = 0/1. ** P1, P2, P3, and P4 correspond to 30, 60, 90, and (F + 15) days, respectively. F represents the time at which the first flower bud appeared. All data are expressed as mean ± SD, calculated for each light treatment at each designated growth stage, based on three independent experiments (n = 3). Different letters (a–e) within the same column indicate significant differences among light treatments within the same growth stage according to Duncan’s multiple range test (p < 0.05).
Table 2. Dry weight (DW, g/plant) of Stevia leaves during different designated growth periods (P1–P4) under various light spectrum conditions.
Light SpectrumP1P2P3P4
R1B0 *0.34 ± 0.01 e1.56 ± 0.01 e2.88 ± 0.31 e2.75 ± 0.02 d
R4B10.30 ± 0.12 d1.32 ± 0.01 d2.54 ± 0.02 d2.43 ± 0.04 c
R50B370.26 ± 0.03 c1.11 ± 0.35 c2.13 ± 0.02 c2.02 ± 0.05 b
R9B200.24 ± 0.01 b0.97 ± 0.15 b1.96 ± 0.01 b2.05 ± 0.01 ab
R0B10.19 ± 0.06 a0.81 ± 0.05 a1.81 ± 0.01 a1.98 ± 0.01 a
* R1B0, R4B1, R50B37, R9B20, R0B1 and P1–P4 have been described in abbreviations list. All data are expressed as mean ± SD, calculated for each light treatment at each designated growth stage, based on three independent experiments (n = 3). Different letters (a–e) within the same column indicate significant differences among light treatments within the same growth stage according to Duncan’s multiple range test (p < 0.05).
Table 3. The extraction yield (E, %) of Stevia grown under different light spectrum treatments was evaluated at multiple designated growth stages (P1–P4).
Light SpectrumP1P2P3P4
R1B0 *19.20 ± 0.24 a21.69 ± 1.29 b23.28 ± 0.63 c24.37 ± 2.12 c
R4B119.29 ± 1.00 a22.12 ± 0.73 b23.50 ± 0.41 c24.54 ± 0.32 c
R50B3719.12 ± 0.36 a22.44 ± 0.42 b23.25 ± 0.42 c24.59 ± 0.42 d
R9B2018.96 ± 0.18 a22.69 ± 0.46 b23.87 ± 0.17 c24.76 ± 0.38 d
R0B119.28 ± 0.26 a22.95 ± 0.38 b24.00 ± 0.28 c24.94 ± 0.64 d
* R1B0, R4B1, R50B37, R9B20, R0B1 and P1–P4 have been described in abbreviations list. All data are expressed as mean ± SD, calculated for each light treatment at each designated growth stage, based on three independent experiments (n = 3). Different letters (a–d) within the same column indicate significant differences among light treatments within the same growth stage according to Duncan’s multiple range test (p < 0.05).
Table 4. Two-way ANOVA results for the effects of light treatment and growth stage on FW, DW, LSG, and YSG.
Source of VariationDFF (DFn, DFd)p Value
Fresh WeightInteraction12F (12, 40) = 233.4<0.0001
R/B ratio3F (3, 40) = 34,713<0.0001
Growth stage4F (4, 40) = 2440<0.0001
Residual40
Dry WeightInteraction12F (12, 40) = 220.4<0.0001
R/B ratio3F (3, 40) = 32,655<0.0001
Growth stage4F (4, 40) = 2311<0.0001
Residual40
LSGInteraction12F (12, 40) = 8.634<0.0001
R/B ratio3F (3, 40) = 165.2<0.0001
Growth stage4F (4, 40) = 141.4<0.0001
Residual40
YSGInteraction12F (12, 40) = 10.55<0.0001
R/B ratio3F (3, 40) = 1635<0.0001
Growth stage4F (4, 40) = 8.742<0.0001
Residual40
All values were analyzed using a two-way analysis of variance (ANOVA), with light treatment (red-to-blue ratio) and growth stage (P1–P4) as fixed factors. The interaction between light treatment and growth stage was also included in the model.
Disclaimer/Publisher’s Note: The statements, opinions and data contained in all publications are solely those of the individual author(s) and contributor(s) and not of MDPI and/or the editor(s). MDPI and/or the editor(s) disclaim responsibility for any injury to people or property resulting from any ideas, methods, instructions or products referred to in the content.