1. Introduction
Agriculture, forestry, and other land use (AFOLU) contribute to 22% of the global greenhouse gas (GHG) emissions to the atmosphere. These emissions represent the second largest source of GHG, preceded by the energy sector, accounting for ~70% of global emissions [
1].
Carbon dioxide (CO
2) is by far the GHG with the greatest emissions to the atmosphere. However, despite its relatively lower emission rates, nitrous oxide (N
2O) has a warming effect that is 273 times greater [
2], with an important participation in agricultural emissions. It is produced mainly from nitrogen (N) fertilizers, animal excreta and plant residues, accounting for about 1/3 of total GHG emissions from this sector [
3].
Nitrogen fertilization is a key factor for biomass production in pasturelands, especially in the low-fertility, acidic soils of tropical regions. As an example, unfertilized pastures exhibit reduced growth rates and a lower capacity of grasses to sequester CO
2 from the atmosphere through photosynthesis [
4]. This pattern is well illustrated by field studies in the Brazilian Savanna, where degraded
Brachiaria pastures showed marked improvements in dry matter production only when N was supplied, and particularly when N was combined with phosphorus fertilizer, while unfertilized controls remained at low productivity [
5]. However, the use of N fertilizers also increases N
2O emissions [
4], largely due to low N use efficiency (NUE) [
6]. The inefficiency often results from the improper application of the 4R N nutrient stewardship principles (using the right source, at the right rate, at the right time, and in the right place) [
7].
N
2O is a byproduct of several natural processes within the N cycle, and its production is generally incremented with N fertilization. The nitrification process, in which ammonium (NH
4+) oxidation forms nitrate (NO
3−) and emits N
2O, is dominant under aerobic conditions. On the other hand, the denitrification process gains importance with O
2 limitation, when NO
3− undergoes a four-step reduction to nitrogen gas (N
2), during which N
2O is produced and may be emitted to the atmosphere. Nitrifiers and denitrifiers include representatives from the domains Bacteria, Archaea, and even some Fungi [
4,
8]. Alongside N
2O, ammonia (NH
3) volatilization is another wasteful pathway of the N cycle in pasturelands due to soil urease activity. The process occurs with the breakdown of urea into NH
3 and carbon dioxide (CO
2). This way, NH
3 can be lost to the atmosphere through volatilization or be converted into plant-available NH
4+ [
9]. Even though moisture is essential for N to become available to plants, it can also enhance microbial activity and biological processes related to N
2O and NH
3 production. As a result, greater N losses may occur, sometimes leading to changes in the corresponding fractions that are emitted to the atmosphere [
10]. Such fractions have methodological importance for national inventories, as annual emissions are calculated by applying them to the amounts of N reported in the activity data. The fraction of N from fertilizers that are lost as NH
3 is expressed as FracGASF, while the fraction emitted to the atmosphere as N
2O is defined as EF1, according to the IPCC Guidelines for National GHG Inventories [
11]. In fact, FracGASF also includes NOx emissions, which are generally an order of magnitude lower. Therefore, in this study, FracGASF refers to NH
3 volatilization losses.
The global default FracGASF of 10% and the EF1 value of 1% are recommended when country-specific data are not available [
11]. However, Brazilian field experiments indicate that the IPCC default FracGASF may underestimate NH
3 volatilization, as up to 25% of the applied N might be lost when urea was surface-applied over crop residues [
12]. In contrast, the opposite pattern is observed for direct N
2O emissions, which are frequently lower than the IPCC default, typically ranging from 0.2% to 0.8% under tropical conditions [
13]. Recent studies from other South American biomes, such as the Colombian tropical rainforest [
14] and the Amazon [
15], also report EF1 values close to 0.3% in pasture systems.
Spatial and temporal variability in NH
3 and N
2O emissions from agricultural soils is practically a rule of thumb, largely driven by interactions within the soil–plant–environment continuum. For instance, N
2O emissions often increase exponentially when N application rates exceed short-term plant demand [
16]. Differences in microbial activity across soils and environments, such as those observed when comparing tropical and temperate regions, or even distinct biomes within the same country (e.g., humid versus drier conditions), also help explain the contrasting gaseous N emission fractions reported in the literature [
17]. In clayey Oxisols, typical of tropical environments and dominant across the edaphic savannas of Brazil, N dynamics are strongly regulated by the physical protection of soil organic matter within microaggregates and by rapid microbial turnover under warm and seasonally moist conditions. According to Denef et al. [
18], most aggregate-associated carbon is stabilized within mineral fractions rather than particulate pools, highlighting the dominant role of organo-mineral interactions in these highly weathered soils. These interactions, together with the stable granular structure of Oxisols, contribute to high porosity and efficient drainage [
19], which favor aerobic processes such as nitrification. At the same time, Pessoa, and Libardi [
19] underscore the coexistence of microanaerobic niches within aggregates, which can sustain conditions for localized denitrification, contributing to spatially heterogeneous N transformations. Additionally, low native fertility and strong P limitation can constrain microbial activity and modulate N cycling. Altogether, these characteristics create a soil environment that differs markedly from temperate soils, with important implications for N fertilizer efficiency and N losses.
Therefore, understanding the different N pathways is important to elaborate mitigation strategies for different cropping systems.
The objectives of this study were to evaluate N2O emissions and NH3 volatilization in an Oxisol cultivated with palisadegrass (Brachiaria brizantha cv. Piatã) under increasing urea application rates in the Brazilian Savanna during late summer and early fall.
2. Materials and Methods
This study was conducted at the Experimental Farm Santa Rita (FESR) of the Agricultural Research Company of Minas Gerais (EPAMIG) in Prudente de Morais, Minas Gerais, Brazil (19°28′ S; 44°15′ W, 732 m a.s.l). The area is classified as a tropical savanna (i.e.,
Cerrado) with a dry season (May–September) and a wet season (October–April), which is also classified as Aw climate according to the Köppen–Geiger classification system [
20]. The average annual temperature is 22.9 °C, with 24.4 °C in summer and 22 °C in winter.
The soil in the experimental area is classified as a clayey Red-Yellow Latosol, according to the Brazilian Soil Classification System [
18] and is very likely equivalent to a Typic Haplorthox in the USDA Soil Taxonomy. Soil samples were collected in April 2022 for chemical characterization (
Table 1). The soil presented a bulk density of 0.91 Mg m
−3 in the 0–0.05 m layer.
Brachiaria brizantha cv. Piatã (Palisadegrass) was sown in November 2020 at a rate of 6.0 kg ha
−1 of pure live seeds. The soil was properly fertilized at sowing, and a maintenance fertilization with phosphorus (P) and potassium (K) was carried out before the beginning of the experimental treatments, based on the results of soil analysis.
The research area was divided into 20 plots of 3 m2 each in a randomized complete block design, with four fertilizer N rates (0, 50, 75 and 100 kg N ha−1) as urea and five replicates. To evaluate the effects, two cycles in the transition period (late summer and fall) were evaluated. The N fertilizer was broadcasted in the experimental area at 08:00 h at the beginning of each evaluation cycle. The 1st cycle occurred from February 2nd to March 13th (39 d) and the 2nd cycle from March 27th to May 10th (44 d) 2023.
The cycle period was determined based on pasture growth (35 cm) or the plant’s reproductive stage, whichever came first. Before each cycle began, the Brachiaria brizantha cv. Piatã pasture was harvested to a 20 cm stubble height using an FS 56 gas trimmer (Stihl, Waiblingen, Germany) to ensure uniform regrowth among plots. At the end of each cycle, forage samples were harvested at a 3 cm stubble height from two 0.5 × 1.0 m quadrats within a representative portion of each plot. Samples were dried in a forced-air oven at 55 °C to a constant weight, weighed, and ground in a Wiley mill to pass a 1 mm screen.
For N
2O measurements, a steel chamber base (40 cm × 60 cm), consisting of an open frame with 5 cm high walls, was inserted into the soil to its full height (5 cm) in the center of each plot. A PVC tray of the same dimensions but 9.2 cm high, covered with double-sided reflective heat foam for insulation, was coupled to the chamber base during gas monitoring. Sampling began one day before N application (D0), with the monitoring fertilizer effects starting on the day of application (D1). Samples were collected for five consecutive days during the first week, once every two days, and once a week, and subsequently adjusted based on weather conditions; wet periods prompted more frequent sampling. Rainfall events exceeding 10 mm within 24 h triggered sampling on three consecutive days [
22].
Gas samples were collected over a 40 min period at 0, 20, and 40 min intervals between 0800 and 1100 h [
23]. A 60 mL syringe was used to extract 15 mL of headspace gas and transfer it into a pre-evacuated 12 mL exetainer vial (Labco, Lampeter, UK). The overpressure prevents contamination from ambient air.
N2O concentrations were analyzed using a gas chromatograph (GC-2014, Shimadzu, Kyoto, Japan) equipped with an electron capture detector. The injector, column, and detector temperatures were set to 250 °C, 80 °C, and 325 °C, respectively. Ultrapure N2 was used as the carrier gas at a flow rate of 25 mL min−1. N2O fluxes were calculated based on the linear accumulation of gas, chamber volume and area, and adjustments for temperature and pressure.
Soil samples were taken from the 0–10 cm layer for gravimetric water content and from the 0–20 cm layer for inorganic N (ammonium [NH
4+] and nitrate [NO
3−]) one day before fertilization (D0) and weekly thereafter. Volumetric soil moisture was determined following AOAC method no. 934.01 [
24], and inorganic N samples were immediately frozen before NH
4+ and NO
3− analysis.
Ammonia volatilization was estimated using a semi-open static chamber following the method described by Martins et al. [
25]. Briefly, a PET chamber was inserted into the soil and housed a foam strip (250 mm × 25 mm × 3 mm) suspended over a 60 mL plastic pot filled with a 10 mL solution of 1.0 mol dm
−3 H
2SO
4 + 2% glycerin. Foam strips and pots were replaced every two days from the day of fertilization until harvest. To extract NH
3, the contents were diluted in 40 mL of deionized water and shaken in a TE-1400 orbital shaker (Tecnal, Piracicaba, Brazil) at 220 rpm for 15 min. The NH
4+ concentration was determined using a UV 1800 spectrophotometer (Shimadzu, Tokyo, Japan), at 647 nm [
26].
A recovery efficiency of 57% was assumed for the chamber system; therefore, NH
3 fluxes were adjusted using a correction factor of 1.74, following Araujo et al. [
27], to estimate total NH
3 losses. The NH
3 losses were calculated based on the ratio of volatilized N-NH
3 to applied N and adjusted for the control.
Daily N
2O fluxes (mg N m
−2 d
−1) were calculated using a linear model, as per Jantalia et al. [
28] and Equation (1).
where
f is the N
2O fluxes (mg N m
−2 h
−1), ∆
C/∆
t represents the N
2O concentration in the chamber during deployment time (mmol mol
−1 h
−1),
V and
A represent the volume (L) and area (m
2) of the chamber, respectively,
m is the molecular mass of N in N
2O, and
Vm is the molar volume of the gas (L mol
−1).
The cumulative fluxes were calculated by linear interpolation between successive sampling dates using the trapezoidal rule [
28]. The emission factor (EF, N
2O-N emitted as % of applied N) was calculated using Equation (2):
where
EF refers to the emission factor, expressed on a percentage basis; kg N-N
2O in treatment represents the cumulative N-N
2O emissions from urea treated plots during the study period (kg m
−2), N
2O-N control is the cumulative N
2O-N emissions from the control plots (kg m
−2), and kg N applied is the N application rate (kg N ha
−1).
The statistical analyses of N
2O flux, NH
3 volatilization, soil NO
3−, and NH
4+ were performed separately for Cycle 1 and Cycle 2 using non-parametric Kruskal–Wallis tests, followed by post hoc Dunn tests to assess treatment differences (
p < 0.05) [
29]. The data for biomass was submitted to analysis of variance (ANOVA) once normality (Shapiro–Wilk) and homogeneity (Bartlett) tests were carried out. Results were presented as mean ± standard error. Cumulative N
2O was evaluated by linear regression as a function of the nitrogen application rates. All statistical analyses were performed using R software (ver. 4.5.2,
https://www.R-project.org/; R Core Team 2025) [
30].
3. Results and Discussion
3.1. Forage Biomass and Agronomic Efficiency
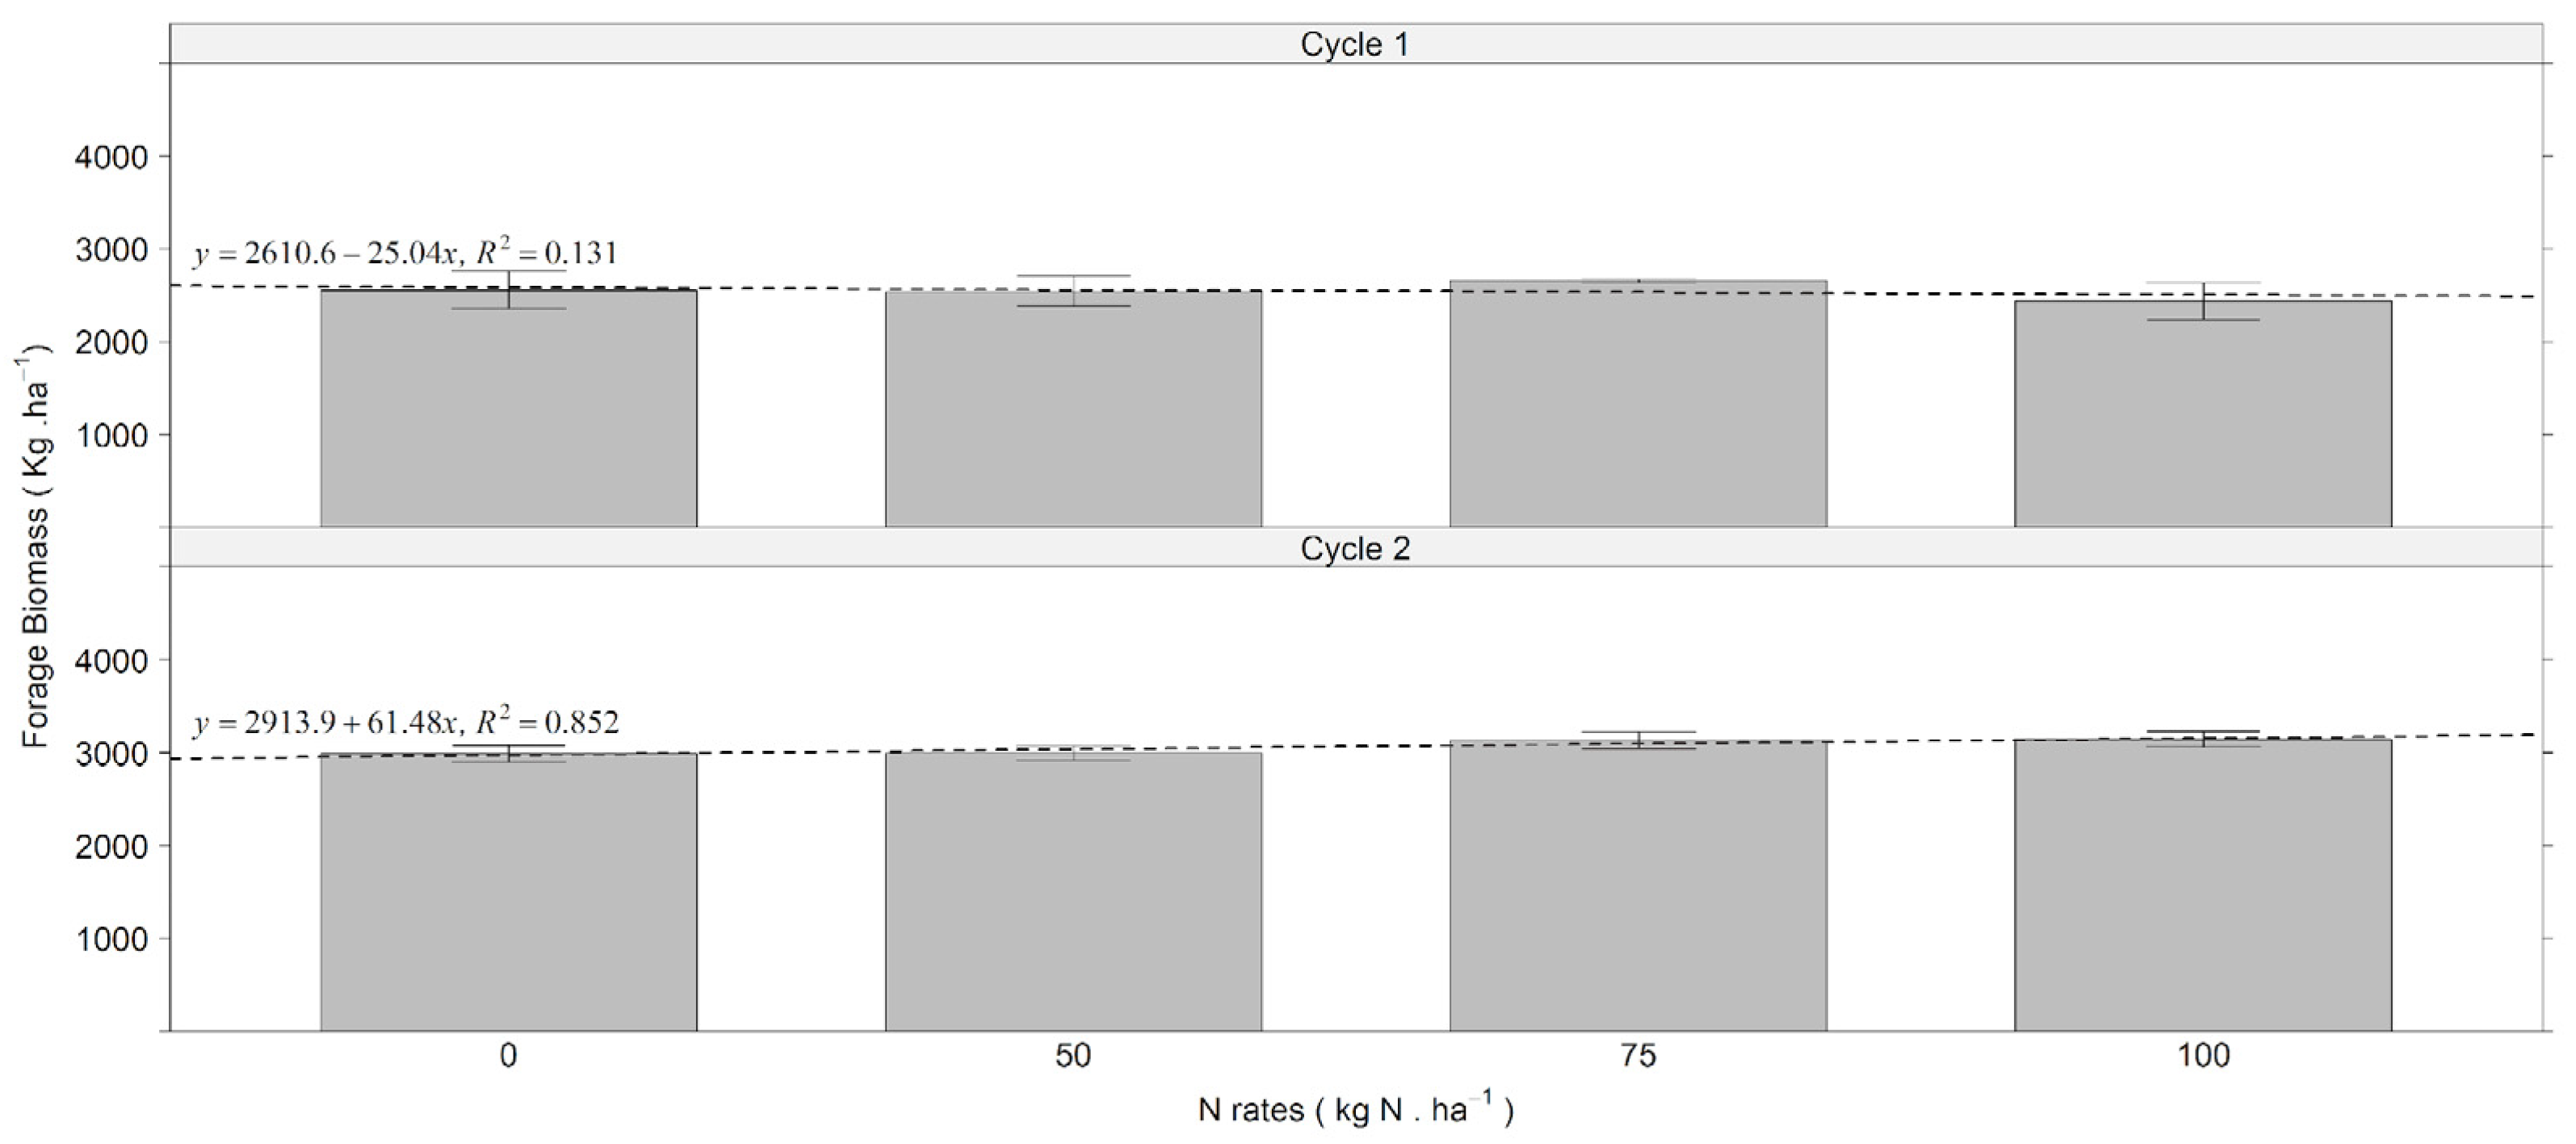
Forage biomass responses to N fertilization differed markedly between cycles (
Figure 1). In Cycle 1, mean forage yields ranged from approximately 2500 to 2700 kg ha
−1 among N treatments, and the effect of N rate was not significant (
p = 0.817). The regression equation (y = 2610.6 − 25.04x; R
2 = 0.131) indicated a weak and negative trend, although the relationship between N rate and biomass production was not statistically significant. This indicates that N fertilization under Cycle 1 conditions did not translate into measurable biomass gains. That likely happened due to irregular rainfall and elevated temperatures that limited nutrient uptake. Negative or near-zero agronomic efficiency values have been reported in pasture systems when environmental conditions limit plant growth or nutrient uptake, particularly under intermittent soil drying or when endogenous soil N supply partially satisfies plant demand [
12]. Such conditions highlight the risk of applying fertilizer when water is the primary growth-limiting factor, as biomass response becomes negligible, while the potential for N losses through volatilization and denitrification increases. This weak relationship (R
2 = 0.13) indicates that variation in biomass during Cycle 1 was largely independent of fertilizer rate. This lack of difference may be also associated with low N availability after urea broadcast, potentially caused by increased temperature or low rainfall [
12].
In addition, in highly weathered Oxisols, organic N associated with mineral fractions represents a substantial reservoir of nitrogen [
18]. Under tropical conditions characterized by warm temperatures and seasonal moisture, rapid organic matter turnover may contribute to plant N supply [
31]. Under such circumstances, endogenous soil N cycling can partially satisfy plant requirements and attenuate short-term responsiveness to fertilizer inputs, particularly during early regrowth phases.
By Cycle 2, N fertilization significantly affected forage biomass (
p < 0.001), although the visual differences among treatments were small (means 2989.6–3148.4 kg ha
−1;
Figure 1). The regression (y = 2913.9 + 61.48x; R
2 = 0.852) indicated that yields rose by ~6.15 kg forage per kg N applied, a positive AE that is consistent with previous reports for
Brachiaria pastures under adequate rainfall (4–8 kg forage/kg N) [
32]. The much stronger regression fit (R
2 = 0.852) suggests that N availability became a dominant driver of biomass accumulation once environmental constraints were reduced. Although Cycle 2 received less total rainfall than Cycle 1, precipitation was more evenly distributed over time, maintaining moderate soil moisture, preventing short drying periods that can temporarily restrict nutrient uptake and plant growth. This cumulative effect likely reflects improved root development, tiller stimulation, and better synchronization between N availability and plant demand at more advanced stages of growth [
32].
The response pattern suggests that while N addition may enhance growth, the marginal gains in biomass beyond moderate N rates (75 kg N ha
−1) were small, thus showing diminishing returns at greater fertilization levels, likely due to physiological saturation or other environmental constraints; this suggests that biomass accumulation was also influenced by factors other than N availability alone [
33]. Possible reasons include environmental variability masking treatment effects [
32].
The contrasting biomass responses between cycles were more closely related to the distribution of rainfall events than to total precipitation. In Cycle 2, rainfall occurred at more regular intervals, which likely maintained more stable soil moisture conditions and favored plant growth and nutrient uptake. In contrast, the more irregular rainfall pattern observed in Cycle 1 may have limited the efficiency of fertilizer use. In addition to rainfall patterns, endogenous soil N cycling and canopy structural characteristics, such as light interception and stand density [
34], may also have influenced biomass accumulation.
3.2. Weather Conditions
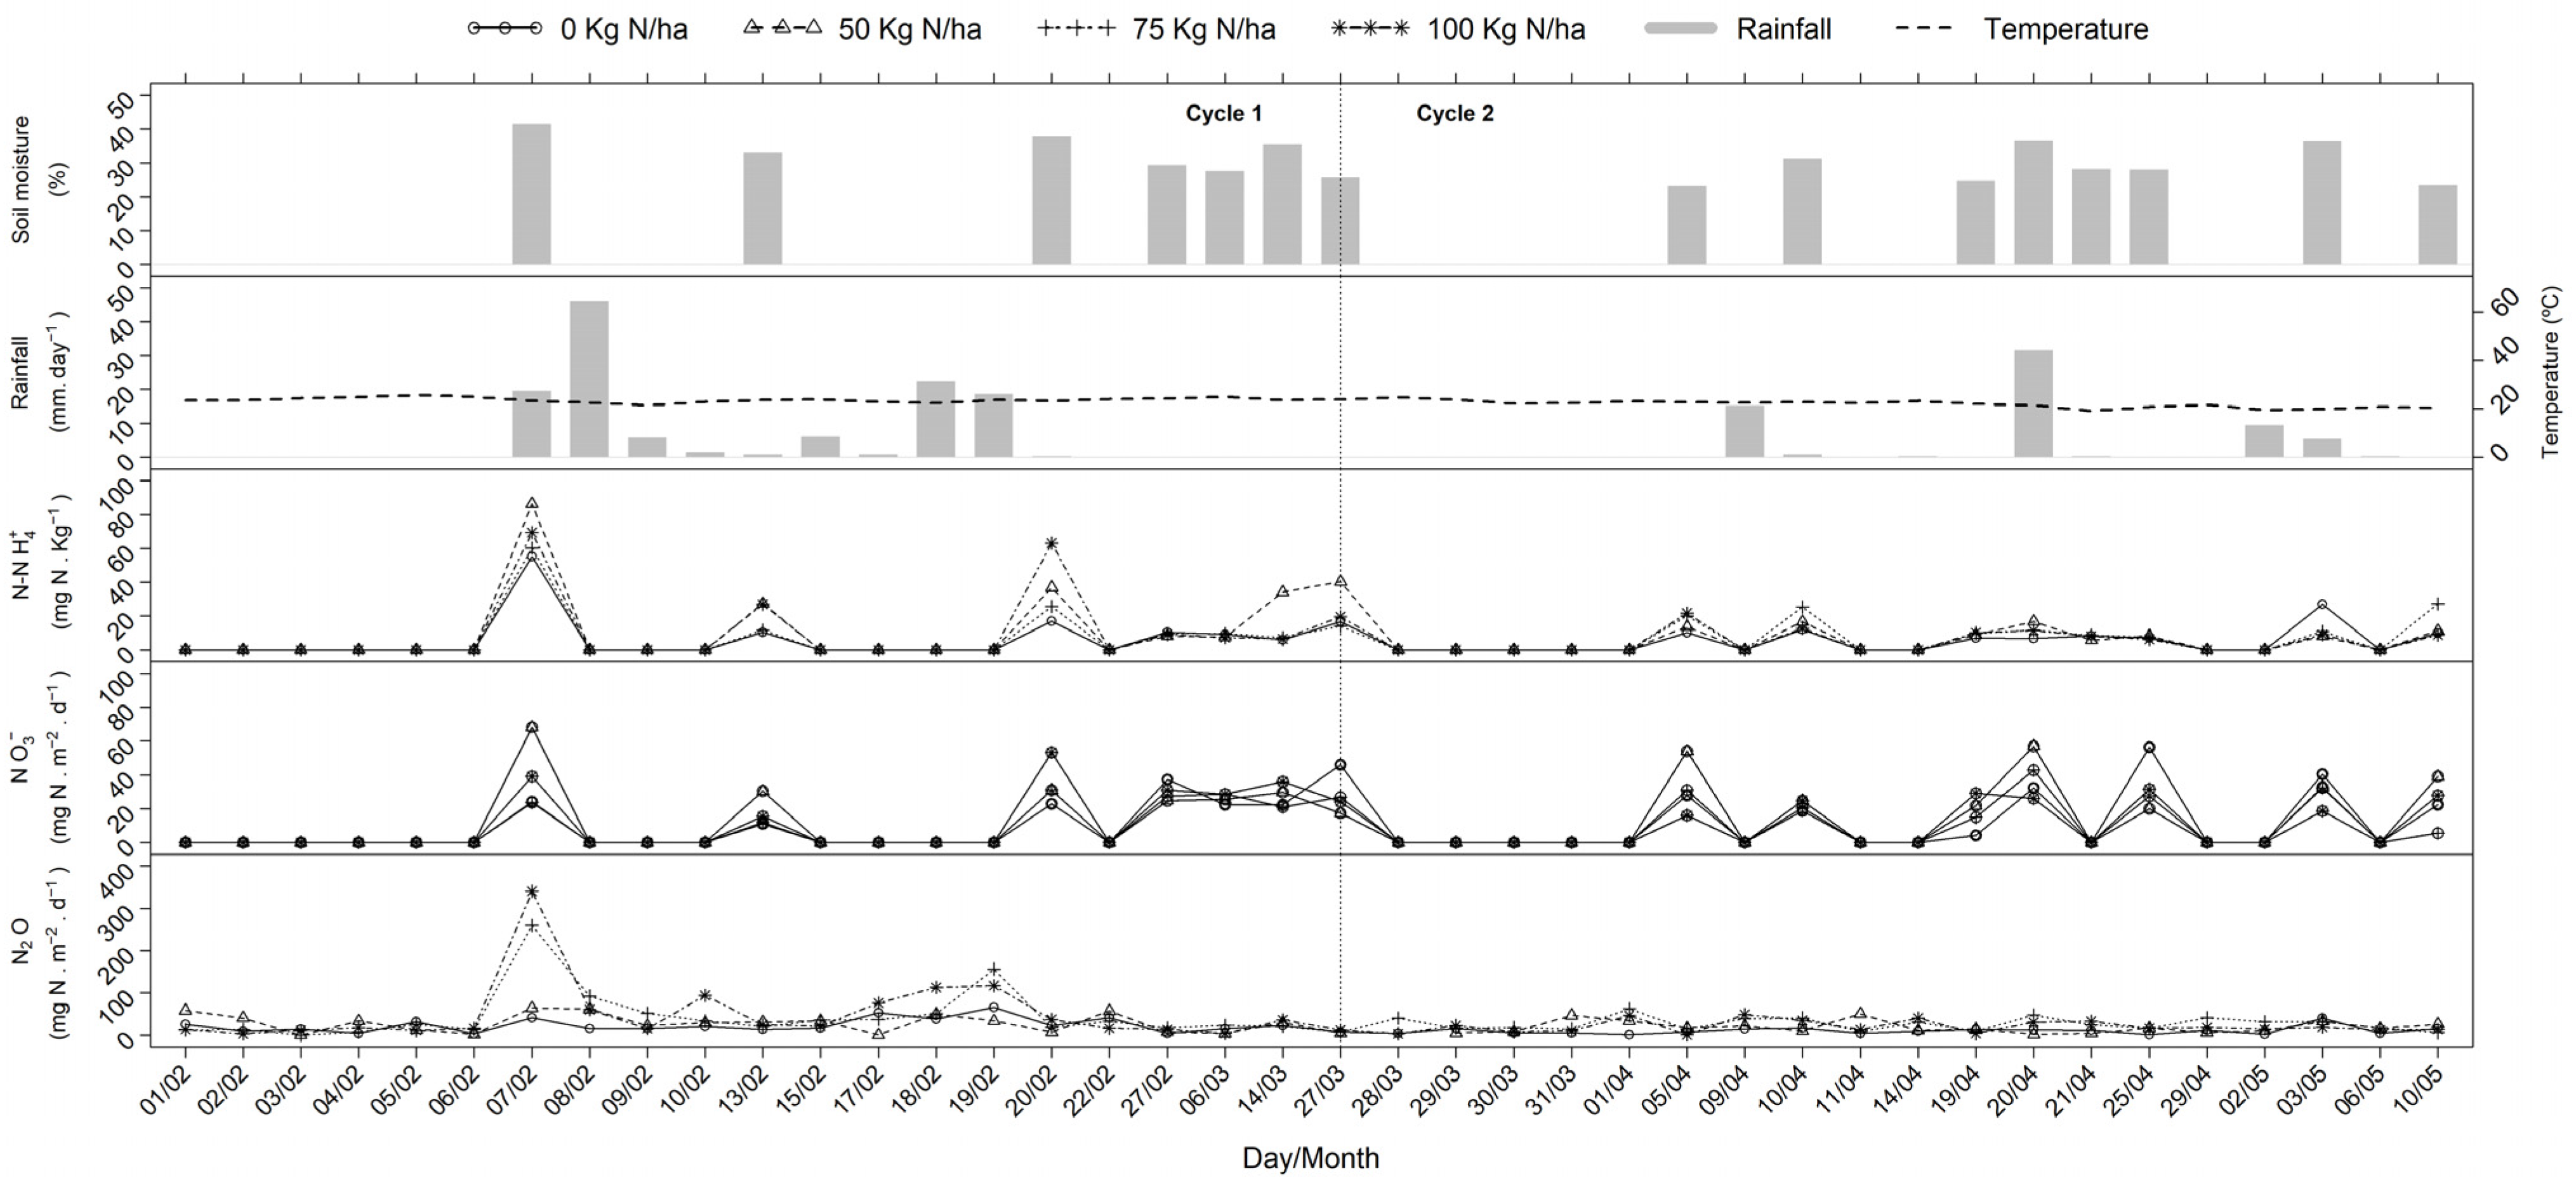
The rainfall and temperature were obtained from a weather station ~900 m from the experiment site and are shown on
Figure 2. Since the experiment was conducted during the late summer and early fall transition, there was a greater incidence of rainfall for Cycle 1 than Cycle 2 (
Figure 2), with less moisture from late March through May. The average temperature was approximately the same (~25 °C) for both sampling periods.
3.3. Nitrous Oxide Emissions
The N
2O fluxes for Cycle 1 (
Figure 2) did not differ among treatments (
p > 0.05). Peak emissions were observed on February 7th, with a N
2O flux of 340.46 mg N m
−2 for the 100 kg N ha
−1 treatment, followed by 259.62 mg N m
−2 for the 75 kg N ha
−1. The second highest N
2O emission was recorded on February 18th (112.62 mg N m
−2) and February 19th (117.12 mg N m
−2) for the 100 kg N ha
−1 treatment, followed by 156.41 mg N m
−2 for 75 kg N ha
−1. These elevated fluxes were likely associated with recent N application and a significant rainfall event (
Figure 2).
Emission peaks coincided with increases in soil moisture following rainfall events exceeding 30%. The largest peak occurred after ~70 mm of rainfall, when soil moisture approached 45% and mineral N concentrations were elevated (NH4+ ≈ 90 mg N kg−1; NO3− ≈ 80 mg N kg−1), resulting in N2O fluxes of about 340 mg N m−2 d−1. In contrast, rainfall events below 20 mm were associated with fluxes generally below 80 mg N m−2 d−1, indicating a strong influence of rainfall magnitude on emission intensity.
These elevated fluxes coincided with rainfall-induced increases in soil moisture (>30%), creating anaerobic microsites that are favorable to denitrification. The pattern reflects the activity of facultative anaerobic microorganisms such as
Pseudomonas,
Bacillus, and
Rhodobacter, which are stimulated by oxygen depletion, elevated soil moisture, and organic carbon availability under tropical rainy season conditions [
17].
Temporal variations in N
2O fluxes were strongly associated with fluctuations in soil mineral N (NH
4+ and NO
3−) and soil moisture. Shortly after fertilization, NH
4+ concentrations rose sharply and were followed by transient increases in NO
3−, coinciding with the major emission peaks. The temporal pattern suggests that nitrification supplied NO
3−, which later supported denitrification. The largest N
2O peaks followed rainfall events that increased soil moisture and reduced oxygen diffusion in soil micropores. Rainfall events enhanced this coupling by increasing soil moisture and restricting oxygen diffusion, thereby stimulating denitrifying microbes. During drier periods, both mineral N pools and N
2O fluxes declined to baseline concentrations, demonstrating that soil moisture regulates the occurrence of emissions, whereas mineral N availability also determines their intensity [
15,
35,
36]. In this study, soil bulk density remained below 1.0 g cm
−3 across treatments, suggesting that soil compaction was minimal and unlikely to be a major driver of N
2O emissions under the conditions evaluated.
In addition to emissions originating from fertilizer, evidence from isotopic studies indicates that N fertilization can stimulate N
2O emissions derived from native soil N pools. Xu et al. [
35] demonstrated that fertilizer addition primed gross N mineralization and increased N
2O production from unlabeled soil N, while Takeda et al. [
36] reported enhanced N
2O emissions from both fertilizer and soil-derived N following N inputs due to changes in microbial activity and redox conditions. These findings support established conceptual frameworks describing how fertilizer-induced increases in substrate availability and microbial respiration can promote denitrification of pre-existing soil NO
3− [
17].
In Cycle 2, emissions were markedly lower and did not differ among N treatments (p > 0.05). Reduced and more irregular rainfall limited soil moisture and microbial activity, producing predominantly aerobic conditions that constrained both nitrification and denitrification. During this cycle, rainfall events were generally below 20 mm, and soil mineral N concentrations remained below ~40 mg N kg−1, with N2O fluxes rarely exceeding 80 mg N m−2 d−1. In contrast, the largest emission peak in Cycle 1 reached approximately 340 mg N m−2 d−1, indicating substantially lower emission intensity during Cycle 2 and highlighting the role of rainfall and mineral N availability in regulating N2O fluxes. Consequently, gaseous N losses declined, aligning with the greater agronomic efficiency observed in Cycle 2. This seasonal contrast confirms that intra-annual rainfall variability and soil moisture dynamics are the primary regulators of N2O fluxes in tropical pastures of the Brazilian Savanna.
3.4. Soil Nitrogen: Ammonium and Nitrate
Ammonium concentrations ranged from 35.1 to 68.2 mg N kg
−1 across treatments and collection times (
Figure 2). However, the Kruskal–Wallis test revealed no differences (
p > 0.05) among treatments in any of the sampling events. This lack of statistical difference may reflect the increased variability and rapid transformation of NH
4+ in the soil, driven by microbial nitrification, immobilization, and plant uptake, especially under tropical field conditions, where NH
4+ availability can change within days after fertilization [
17]. Thus, while transient increases in NH
4+ were observed, these values did not persist long enough to separate treatments statistically.
Similarly, NO
3− concentrations ranged from 42.8 to 68.2 mg N kg
−1, with the greatest value also being recorded in the 50 kg N ha
−1 treatment. However, no significant differences were detected among treatments across the sampling period (Kruskal–Wallis,
p > 0.05). This lack of separation likely reflects the mobility of nitrate, which is prone to leaching under rainfall and subject to rapid plant uptake and microbial reduction. Under rainfed tropical conditions, environmental variability often outweighs treatment effects [
37], diluting statistical differences. Importantly, the rapid turnover of NO
3− highlights its central role as a substrate for denitrification, linking soil mineral N pools to N
2O emission dynamics [
38].
These findings emphasize that soil mineral N alone may not reflect total N availability or use efficiency, especially in dynamic systems like tropical pastures. Instead, it should be interpreted in the context of plant productivity, microbial turnover, and gaseous losses to ensure accurate assessments of N fate and cycling in agroecosystems.
3.5. Total Emissions of Nitrous Oxide
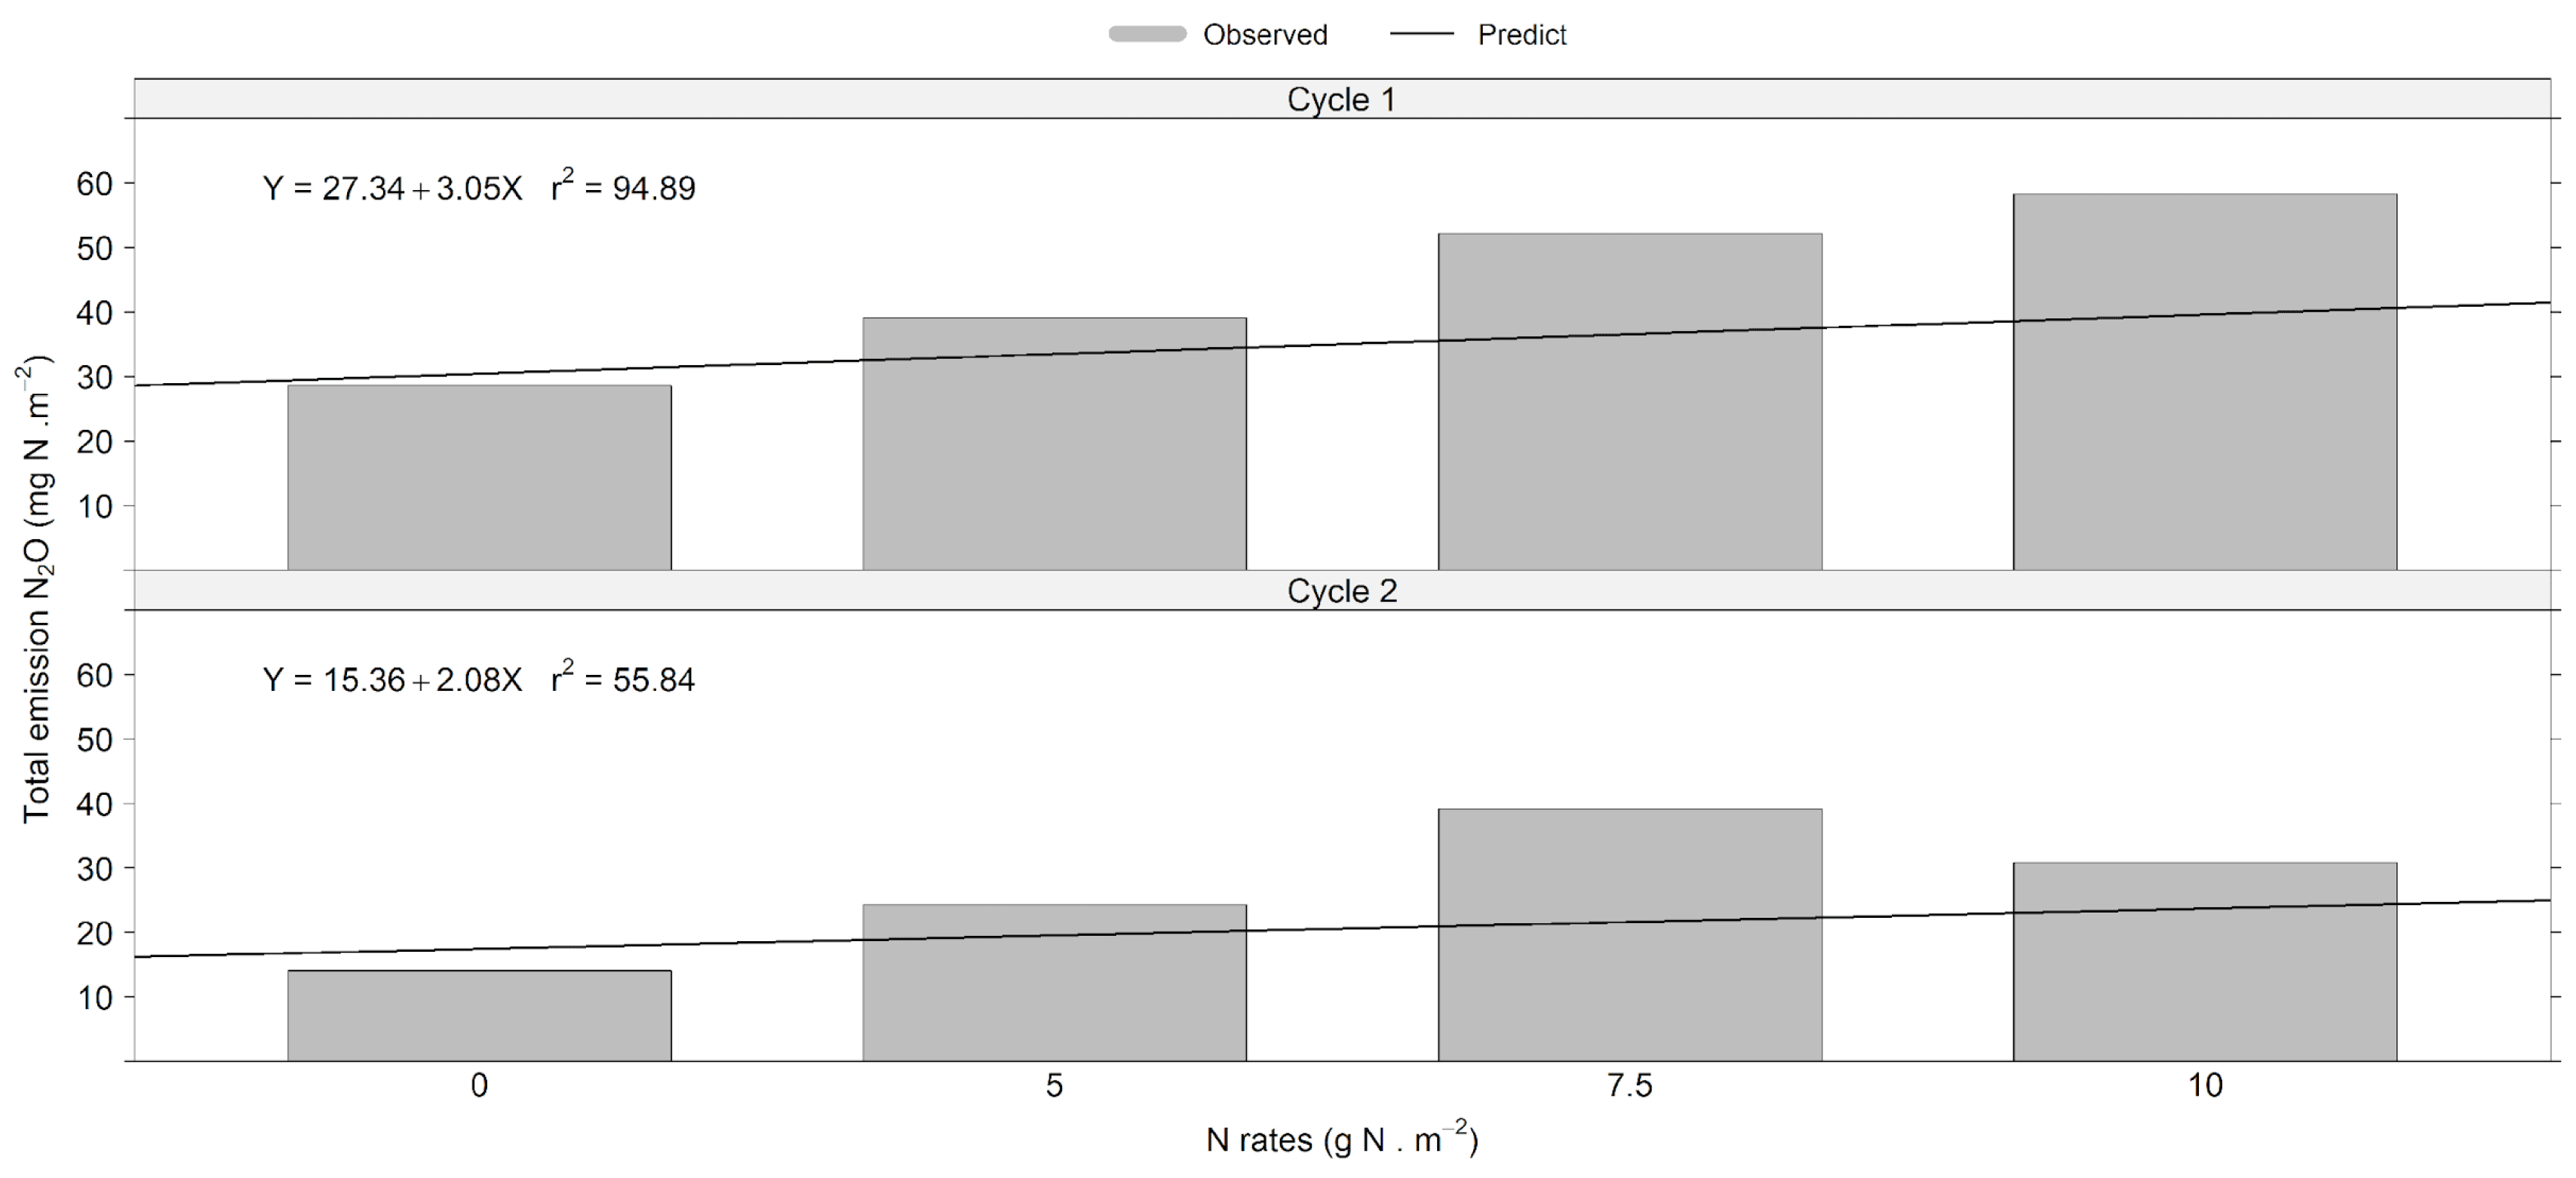
A linear regression between applied N and total N
2O emissions showed that for every gram of added N, approximately 3.05 and 2.08 mg N
2O-N were emitted during Cycles 1 and 2, respectively (
p < 0.05) (
Figure 3). This indicates that N
2O losses per unit of applied N were about 47% greater in Cycle 1 than in Cycle 2, which is well aligned with N
2O fluxes (
Figure 3). The greater emissions during Cycle 1 were likely associated with higher soil moisture and potentially greater microbial activity and denitrification potential.
These values correspond to emission factors of approximately 0.31% and 0.21% of the applied N for Cycles 1 and 2, respectively. Even in Cycle 1, when rainfall events increased soil moisture and generated clear N
2O emission peaks, the overall emission response remained well below the IPCC Tier 1 default value of 1% [
11]. This pattern suggests that rainfall events triggered short-lived emission pulses rather than sustained conditions for prolonged N
2O production.
Although total emissions increased with greater N rates, the overall response was not significant (p > 0.05), reflecting the increased temporal and spatial variability that is commonly observed in tropical systems. Nevertheless, the dose-dependent trend suggests that greater N availability under wetter soil conditions promotes cumulative N2O release.
Corrêa et al. [
37] also found EF below 0.3% in the transition area between Atlantic Forest and Cerrado (Brazilian Savanna) in
Brachiaria Marandu fertilized with urea, which was similar to the results of Nascimento et al. [
15] in the Amazon for urea rates of 40 and 80 kg N ha
−1. Collectively, these results suggest that the IPCC Tier 1 default value of 1% for Brazil overestimates N
2O emissions from tropical pastures, with most empirical studies reporting values threefold lower or more. Even lower emissions were found by Sousa et al. [
39], who observed emissions of approximately 235.71 mg N-N
2O per kg N applied in native vegetation areas of the Brazilian Savanna, while the IPCC default values for tropical pastures range from 471 to 1570 mg N
2O per kg N applied [
40].
Several factors likely explain the lower EF values observed in this study, including the use of moderate N rates (up to 100 kg N ha
−1), the well-drained and acidic characteristics of the soil (
Table 1), and specific climatic conditions of the Brazilian Savanna in Minas Gerais. The granular structure of Oxisols, which confers high porosity and enhances water infiltration, shorten the period during which soils remain water-filled [
41], as well as the rapid turnover of organic matter driven by warm and humid conditions during the rainy season [
31]. Possibly, these conditions reduced the occurrence of denitrification hotspots and consequently N
2O emissions. Dry conditions towards off-season further constrain the gas production [
17]. Moreover, the capacity of
Brachiaria brizantha cv. Piatã to suppress nitrifying microbes through biological nitrification inhibition (BNI) may have contributed to reduced N
2O losses [
42].
3.6. Ammonia Volatilization
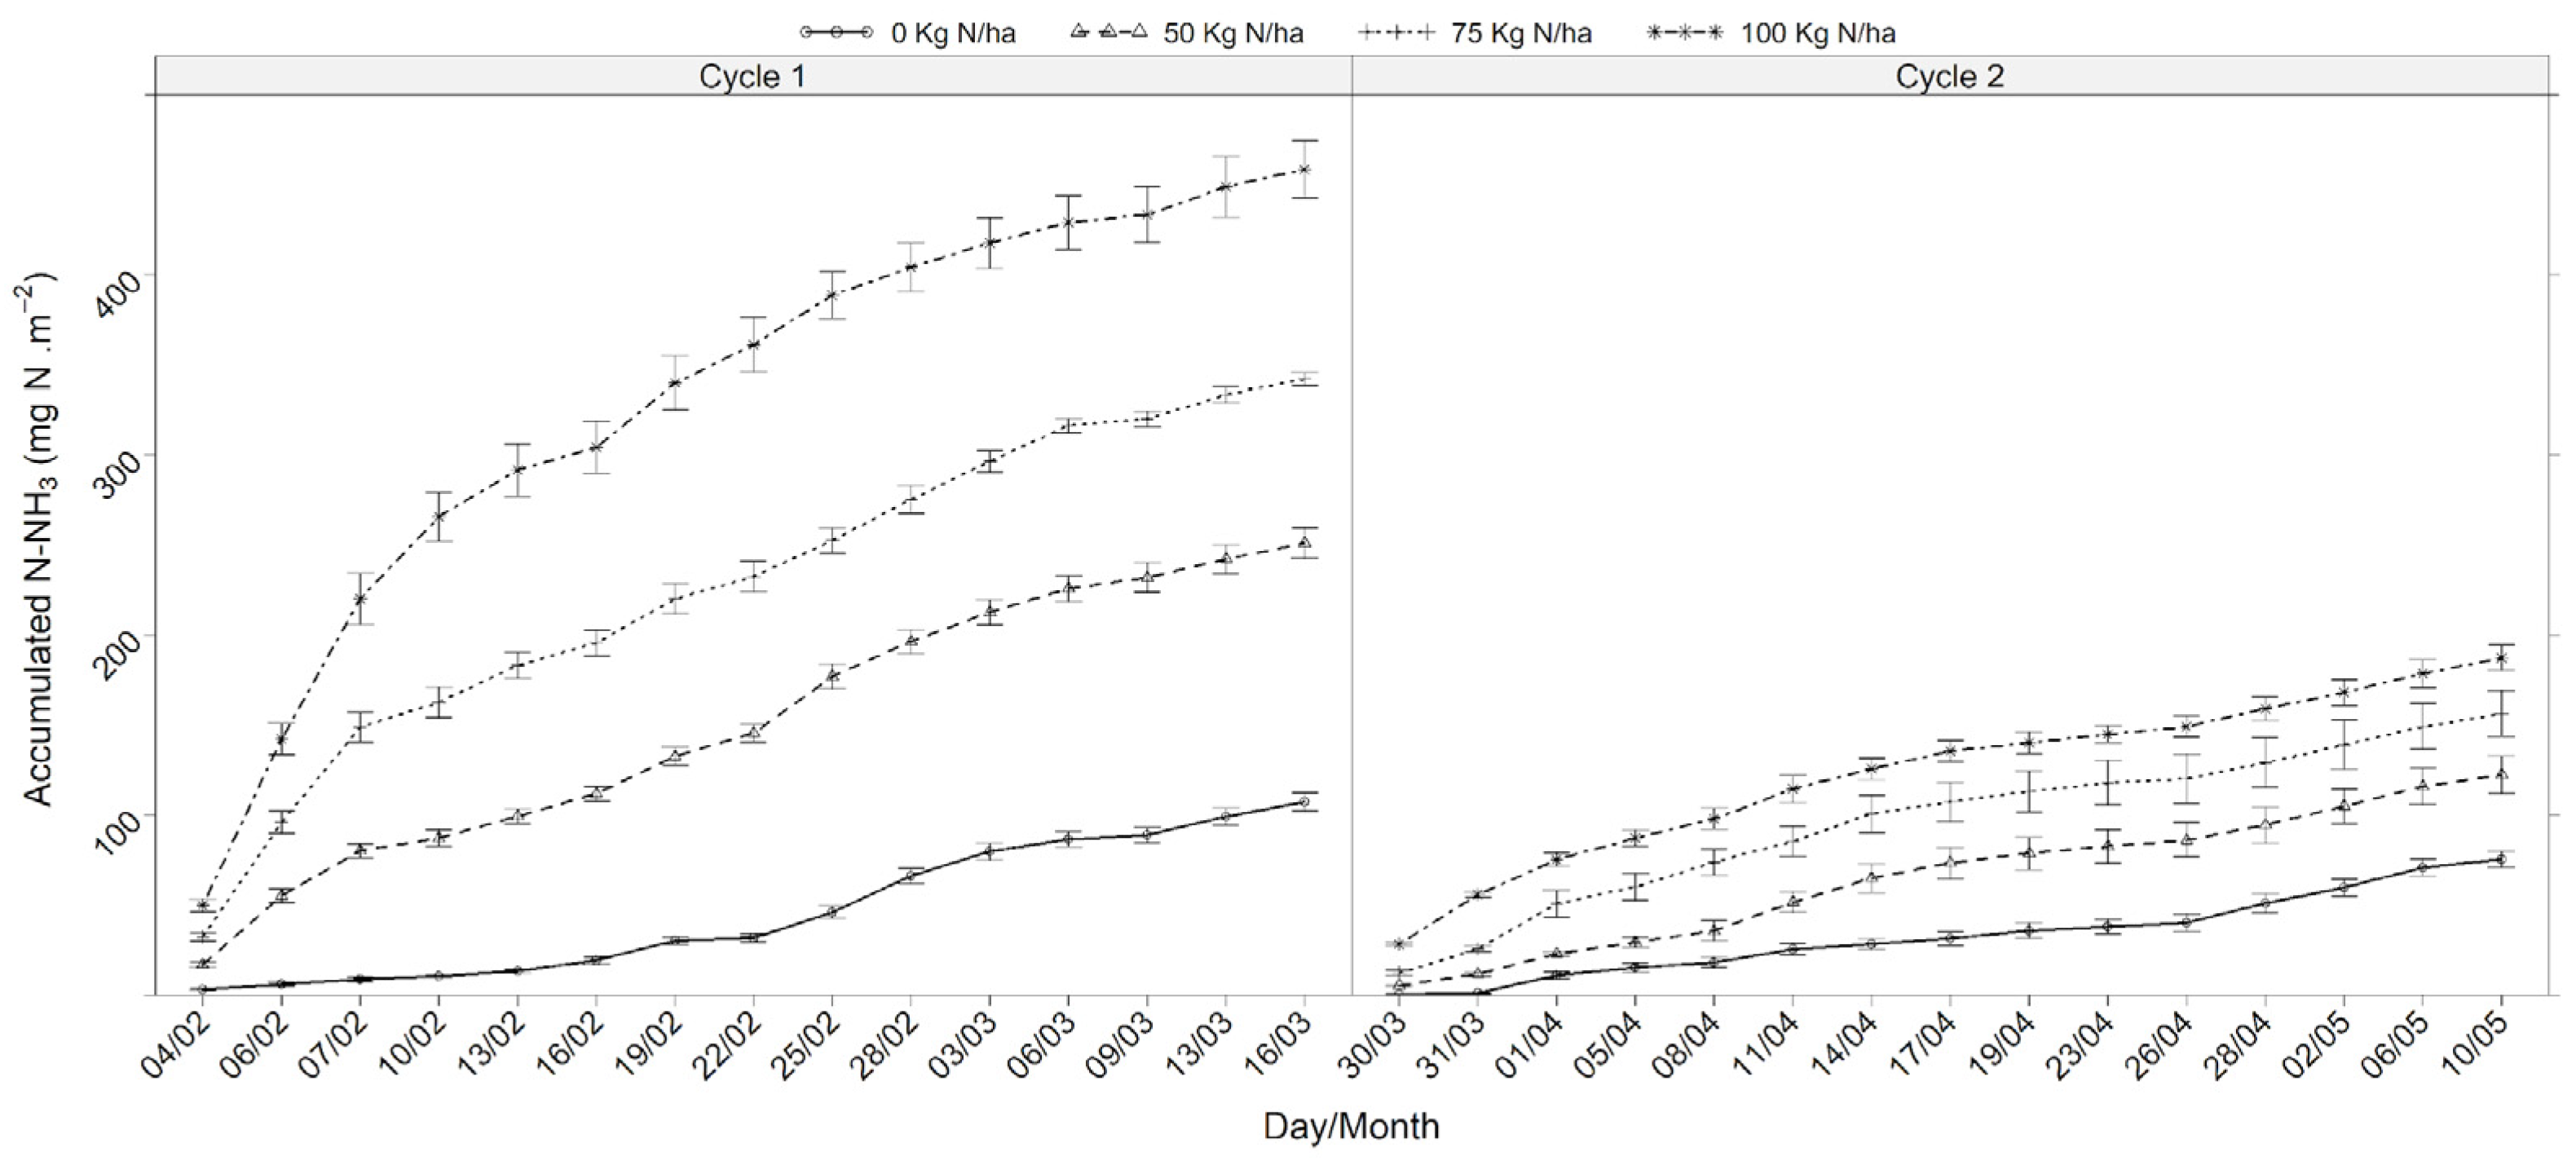
Across both Cycle 1 and Cycle 2 (
Figure 4), cumulative NH
3 losses increased consistently with the N rate, reaching 106.8, 277.4, 346.4, and 374.9 mg m
−2 for 0, 50, 75, and 100 kg N ha
−1, respectively. These findings confirm the strong influence of fertilizer input on volatilization magnitude, a well-documented pattern under tropical conditions due to increased temperatures, rainfall, and urease activity [
12].
The Kruskal–Wallis test revealed differences (
p < 0.05) among treatments in multiple sampling events, particularly from the first to fourth collections in both cycles. For instance, in 04/02 (Cycle 1), treatments receiving 75 and 100 kg N ha
−1 formed statistically distinct groups from the control and 50 kg N ha
−1, reflecting their greater NH
3 losses. This pattern persisted in subsequent samplings, although the statistical separation between treatments diminished in later data collections, suggesting that volatilization tends to be greater immediately after N application, a temporal dynamic that was previously described by Marschner [
33] and is typical of urea-based fertilization under warm, moist conditions.
Interestingly, while treatments 75 and 100 kg N ha
−1 showed greater NH
3 losses, these were not always different between them, particularly in later samplings of Cycle 2. This pattern reflects the non-linear emission response that is often observed in fertilizer studies, where NH
3 losses do not increase proportionally with N input [
12]. This behavior indicates a saturation-like response rather than a proportional increase in emissions with increasing N rates. Mechanistically, as volatilization progresses, NH
3 loss becomes increasingly controlled by the physical transfer of the gas from the soil surface into the atmosphere, rather than by the amount of remaining N fertilizer. The movement of NH
3 across the thin layer of air that forms immediately above the soil surface is inherently slow, meaning that gas diffusion itself becomes the limiting step [
43]. Following urea hydrolysis, NH
4+ at the soil surface remains in equilibrium with NH
3, allowing even small residual ammoniacal N pools to sustain low but persistent volatilization fluxes over time [
43]. Under these conditions, even when fertilizer-derived N remains in the system, emission rates are constrained by diffusive resistance rather than substrate availability. Simultaneously, the amount of plant-available ammoniacal N (TAN = NH
4+ + NH
3) at the soil surface declines as urea hydrolyzes and TAN is converted, absorbed, or volatilized, reducing the concentration gradient that drives emissions [
43]. Together, the decline in surface TAN and the increasing dominance of physical transfer limitations explain both the convergence of NH
3 losses at higher N rates and the persistence of low-intensity emissions throughout the experimental cycles, even in the absence of a clear plateau in cumulative volatilization.
The control treatment (0 kg N ha
−1) consistently formed its own group with significantly lower NH
3 losses, reflecting baseline emissions associated with microbial mineralization of native soil organic matter [
25,
27]. Although considerably smaller than losses from fertilized plots, these background fluxes confirm that NH
3 volatilization occurs even in the absence of fertilizer N and represents an inherent component of N cycling in tropical soils.
From a management perspective, these results reinforce that volatilization is both dose- and time-dependent, with the greatest risk occurring in the days immediately following fertilizer application. Such findings highlight the importance of mitigation strategies, including the use of urease inhibitors, coated or stabilized urea sources, banding, or incorporation of fertilizer into the soil, and especially aligning fertilization with rainfall forecasts. These practices have been shown to substantially reduce NH3 losses in tropical pastures, improving N use efficiency and lowering environmental impacts.
4. Conclusions
Nitrogen fertilization in tropical forage systems affected N cycling pathways, especially by intensifying NH3 losses as application rates increased. Volatilization was dose-dependent and occurred mainly in the days following fertilization, with statistically significant differences being observed in early samplings. Nitrous oxide emissions were modest and closely tied to rainfall patterns, with emission factors being lower than IPCC defaults (1%) and prevalent under the well-drained soils of the Brazilian Savanna biome. Although biomass production improved with N input on Cycle 2, responses leveled off at greater doses, indicating limited efficiency gains.
Importantly, the current research highlights that rainfall variability was a stronger determinant of N2O fluxes than the fertilizer rate itself, as shown by the contrasting responses between cycles. Denitrification was the predominant pathway of N2O production during wet periods, whereas volatilization dominated during the initial post-application phase. Despite improved forage productivity at moderate N inputs (≤75 kg N ha−1), greater doses showed diminishing returns, indicating reduced agronomic efficiency and potential nutrient loss.
Together, these findings provide robust evidence that the current global default emission factors overestimate N2O losses from Brazilian tropical pastures and that region-specific data are essential for more accurate greenhouse gas inventories. From a management perspective, moderate N fertilization (<50–75 kg N ha−1), combined with application timing, can balance forage productivity with reduced N losses. More broadly, Brachiaria-based systems continue to demonstrate a capacity to sustain tropical livestock production while mitigating climate impacts, provided that fertilization practices are adapted to local soil and rainfall conditions.




 ,
,