Article

Chinese Cabbage (Brassica rapa L.) Parameters Describing Agronomic Performances of Fall and Summer Cabbage Ecotypes

1
Department of Environmental Horticulture & Landscape Architecture, College of Life Science & Biotechnology, Dankook University, 119, Dandae-ro, Cheonan-si 31116, Republic of Korea
2
Industrial and Systems Engineering, College of Engineering, Dongguk University-Seoul, 30, Pildong-ro 1 Gil, Jung-gu, Seoul 04620, Republic of Korea
*
Author to whom correspondence should be addressed.
Agronomy 2026, 16(7), 703; https://doi.org/10.3390/agronomy16070703
Submission received: 26 February 2026 / Revised: 24 March 2026 / Accepted: 26 March 2026 / Published: 27 March 2026

Abstract

Intercepted photosynthetically active radiation (IPAR) to biomass method is widely used in plant growth models to simulate biomass accumulation. This method is closely linked to radiation use efficiency (RUE), which can vary by species, cultivars, and location. Although Chinese cabbage (Brassica rapa L.) is a cool-season plant, it is cultivated year-round in South Korea. Therefore, investigating the RUEs of two different ecotypes of Chinese cabbage is crucial for developing accurate plant growth models. In this study, we examined RUEs and other key agronomic characteristics that influence Chinese cabbage growth across different growing seasons. Field studies were conducted to analyze the growth patterns of fall and summer ecotypes and to explore various agronomic traits for developing a leaf area index (LAI) model. Using a multivariate regression method, we developed an LAI model that simulates the leaf area index for both ecotypes across multiple locations in South Korea (R2 = 0.92). A total of 218 field data points collected from 35 sites between 2020 and 2023 were used to estimate the RUEs and LAIs of the fall and summer ecotypes. Results indicated that Chinese cabbage demonstrated more efficient photosynthesis in the fall, with RUEs of 2.3 g MJ−1 for the fall ecotype compared to 1.3 g MJ−1 for the summer ecotype based on regional estimation. This difference may be attributed to lower radiation availability per unit of heat growth during the summer season (0.3 MJ °C−1) compared to the fall (0.78 MJ °C−1). The findings of this study will aid plant modelers and enhance the accuracy of simulations for Chinese cabbage growth.

1. Introduction

Chinese cabbage (Brassica rapa L.) is a vital vegetable in East Asia, with China being the largest producer, followed by India and South Korea. The demand for Chinese cabbage remains steady throughout the year in East Asian countries, as it is a key ingredient in many Asian dishes, such as Kimchi. To meet this consistent demand, various Chinese varieties of Chinese cabbage are cultivated year-round across different regions during spring, summer, fall, and winter [1]. However, while demand stays high, the increasing frequency and intensity of extreme weather events—such as heatwaves, floods, and droughts—due to climate change pose a significant threat to stable cabbage production, resulting in an unstable supply and higher prices. Chinese cabbage is a cool-season leafy vegetable, with optimal growing temperatures between 18 and 20 °C and heading formation temperatures between 15 and 18 °C [2]. Consequently, rising temperatures present substantial challenges for production during the summer and fall months.
Despite the uncertainty in yields caused by weather conditions, there is an urgent need for scientific support to inform decision-making and maintain a stable food supply. Crop models are the primary tools used to assess the impacts of weather conditions on crop productivity, which is a crucial factor in the agricultural supply chain [3]. These models are essential for understanding how cropping systems or soil conditions (e.g., soil components, hydrology) will influence crop yields under varying weather scenarios. Various process-based crop models, such as ALMANAC, APEX, and WOFOST, have been applied to study Chinese cabbage yields [4,5,6]. All models simulate light interception based on crop factors like leaf area index (LAI), plant height, and light extinction coefficient. They then calculate biomass increase based on the amount of plant dry mass produced per unit of intercepted solar radiation (g MJ−1) or the radiation use efficiency (RUE) of each [7]. However, most modeling studies lack direct measurements of RUE, and therefore RUE values are often assumed based on expert judgment during model calibration [4,5,6]. This practice may increase uncertainty and potentially reduce the accuracy and reliability of model prediction [8]. Most modeling studies have primarily measured major parameters for major food crops, such as summer grain crops. For example, ref. [9] measured maize radiation use efficiency (=3.8 g MJ−1) to increase accuracy of model prediction. Investigation of RUE for cool-season leafy vegetables are still in their early stages.
Radiation-use efficiency (RUE) is a crucial factor in crop growth models and can be readily applied based on actual field measurements. However, RUE is influenced by field management techniques, seasonal variations, and geographic locations [5,7]. Various field studies have shown that environmental conditions, such as temperature [10], the composition of incident radiation [11], and vapor pressure deficit [12], significantly affect RUE. Moderate to high temperatures can accelerate vegetable growth, leading to earlier physiological maturity but reduced leaf growth [13]. Elevated temperatures can inhibit CO2 fixation, increase oxygenase activity, and reduce the photosynthesis rate [14]. Similar findings have been observed in Chinese cabbage, where [15] reported a significant decrease in photochemical efficiency with temperatures exceeding 30 °C. In the model, a fixed RUE value is assigned to each species. To accurately simulate Chinese cabbage yields throughout the year, it is essential to understand how RUE values are affected by environmental conditions in different growing seasons (summer and fall). RUE is a key parameter in many dynamic crop growth models and is vital for interpreting crop responses to environmental factors and management practices [16]. Additionally, the leaf area index (LAI) of cabbages will be estimated to develop growth curves for cabbages grown in both summer and fall. This information will be important for creating parameter sets for summer and fall Chinese cabbage in crop growth models.
As we hypothesize that RUE and LAI development play significant roles in determining cabbage yield, there are two main objectives in this study. The first was to estimate RUE and LAI values for summer and fall Chinese cabbage ecotypes grown in multiple locations in South Korea. And the second objective is to investigate the relationships between LAI, RUE, ecotype, and environmental conditions in Chinese cabbage as these insights may enhance our understanding of yield production across different cabbage ecotypes and growing environments. This research will improve the forecasting of Chinese cabbage yield productivity in various seasons and locations throughout South Korea.

2. Materials and Methods

2.1. Investigation of Agronomic Characteristics and Light Extinction Coefficients of Two Chinese Cabbage Ecotypes

To develop the leaf area growth curve, field studies were conducted in the fall (September to November) and summer (April to July) seasons of 2024–2025 at two different farm sites: Site Seongju in Seongju County, North Gyeongsang Province, South Korea (35.88, 128.16), and Site Cheonan in Cheonan City, Chungcheong Province, South Korea (36.77, 127.12). The soil types at Seongju and Cheonan are Namgae and Jisan, respectively. The physical and chemical properties of both soil types are listed in Table 1. The soil type was classified according to the WRB (World Reference Base for Soil Resources) classification system [17]. Both sites had soil pH levels ranging from 6.5 to 7 and lower nitrogen (N) contents, necessitating the application of high rates of nitrogen fertilizer. All plants were fertilized prior to planting and twice during the growing seasons, with total N:P:K rates of 299:170:270 kg ha−1.
Both sites have temperate climate conditions, with average annual total precipitation and mean air temperatures from 2014 to 2023 recorded as 14.26 °C and 1162 mm at Seongju, and 12.67 °C and 925 mm at Cheonan. Since Seongju is located further south than Cheonan, its air temperatures are slightly higher; however, more rainfall was observed at Cheonan.
Four-week-old seedlings were planted in the field in late September, at a density of 4 plants per m2. The plot was arranged as a complete block design with three replicates. The plot size was 80 cm × 300 cm, and the spacing between plants and plots were 50 cm and 60 cm, respectively. Total 10 plants were planted in each plot. 2–3 plants per plot were harvested once a month until early November. To avoid the border effect, plants at the edge were not taken for samples. At each harvest, Photosynthetically Active Radiation (PAR) was measured below the leaf canopy using an ACCUPAR LP-80 Ceptometer (METER Group, Inc., Pullman, WA, USA). The PAR value was used to calculate the fraction of intercepted PAR (FIPAR). Before measuring the light, the Ceptometer should be calibrated through 10 measurements under direct sun lights. And then, at least 6 light measurements were taken both under and above sample canopy in 80 cm × 80 cm area. Light readings were taken between 10:00 and 14:00. More detailed methods for using the Ceptometer can be found in [18]. The fresh total aboveground biomass weight was measured, and the leaf area (cm2) of each plant was assessed using the ImageJ program (v1.53t, NIH, Bethesda, Maryland, USA). Fresh samples were dried at 66 °C until the dry weight stabilized, and the dry weight was then measured. Based on the leaf area, fresh weight, and sampling area, the leaf area index (LAI) for each plant was calculated. The light extinction coefficient (EXT) was calculated (see Equation (1)) as the natural logarithm of the difference between 1 and FIPAR, divided by the calculated LA
E X T = ln 1 F I P A R L A I
The EXT is one of the critical crop parameters that measures how strongly plants in sampling areas were observed to receive light. This calculated value will be used to calculate IPAR in Section 2.3.

2.2. Development of Leaf Area Index Model

To develop the leaf area index (LAI) model, we consider important agronomic traits, including plant height (cm), leaf blade width (cm), and the total number of leaves measured in Section 2.1. This study employs multivariate linear regression (MLR), which includes multiple predictor and response variables, as represented in Equation (2).
L A I = β 0 + β 1 X 1 + β 2 X 2 + β 3 X 3 + ϵ  
where LAI is a response variable; X 1 is plant height (cm); X 2 is leaf blade width (cm); X 3 is the total number of leaves; and ϵ is an error term that follows a normal distribution with a mean of 0 and a standard deviation of σ 2 . The parameter set β = β 0 ,   β 1 , β 2 , β 3 T represents the influence of independent variables, i.e., X = 1 ,   X 1 , X 2 , X 3 T , on LAI and is obtained using the least squares method that minimizes the square of the error function [19].

2.3. Determine of Radiation Use Efficiency (RUEs) of Two Chinese Cabbage Ecotypes

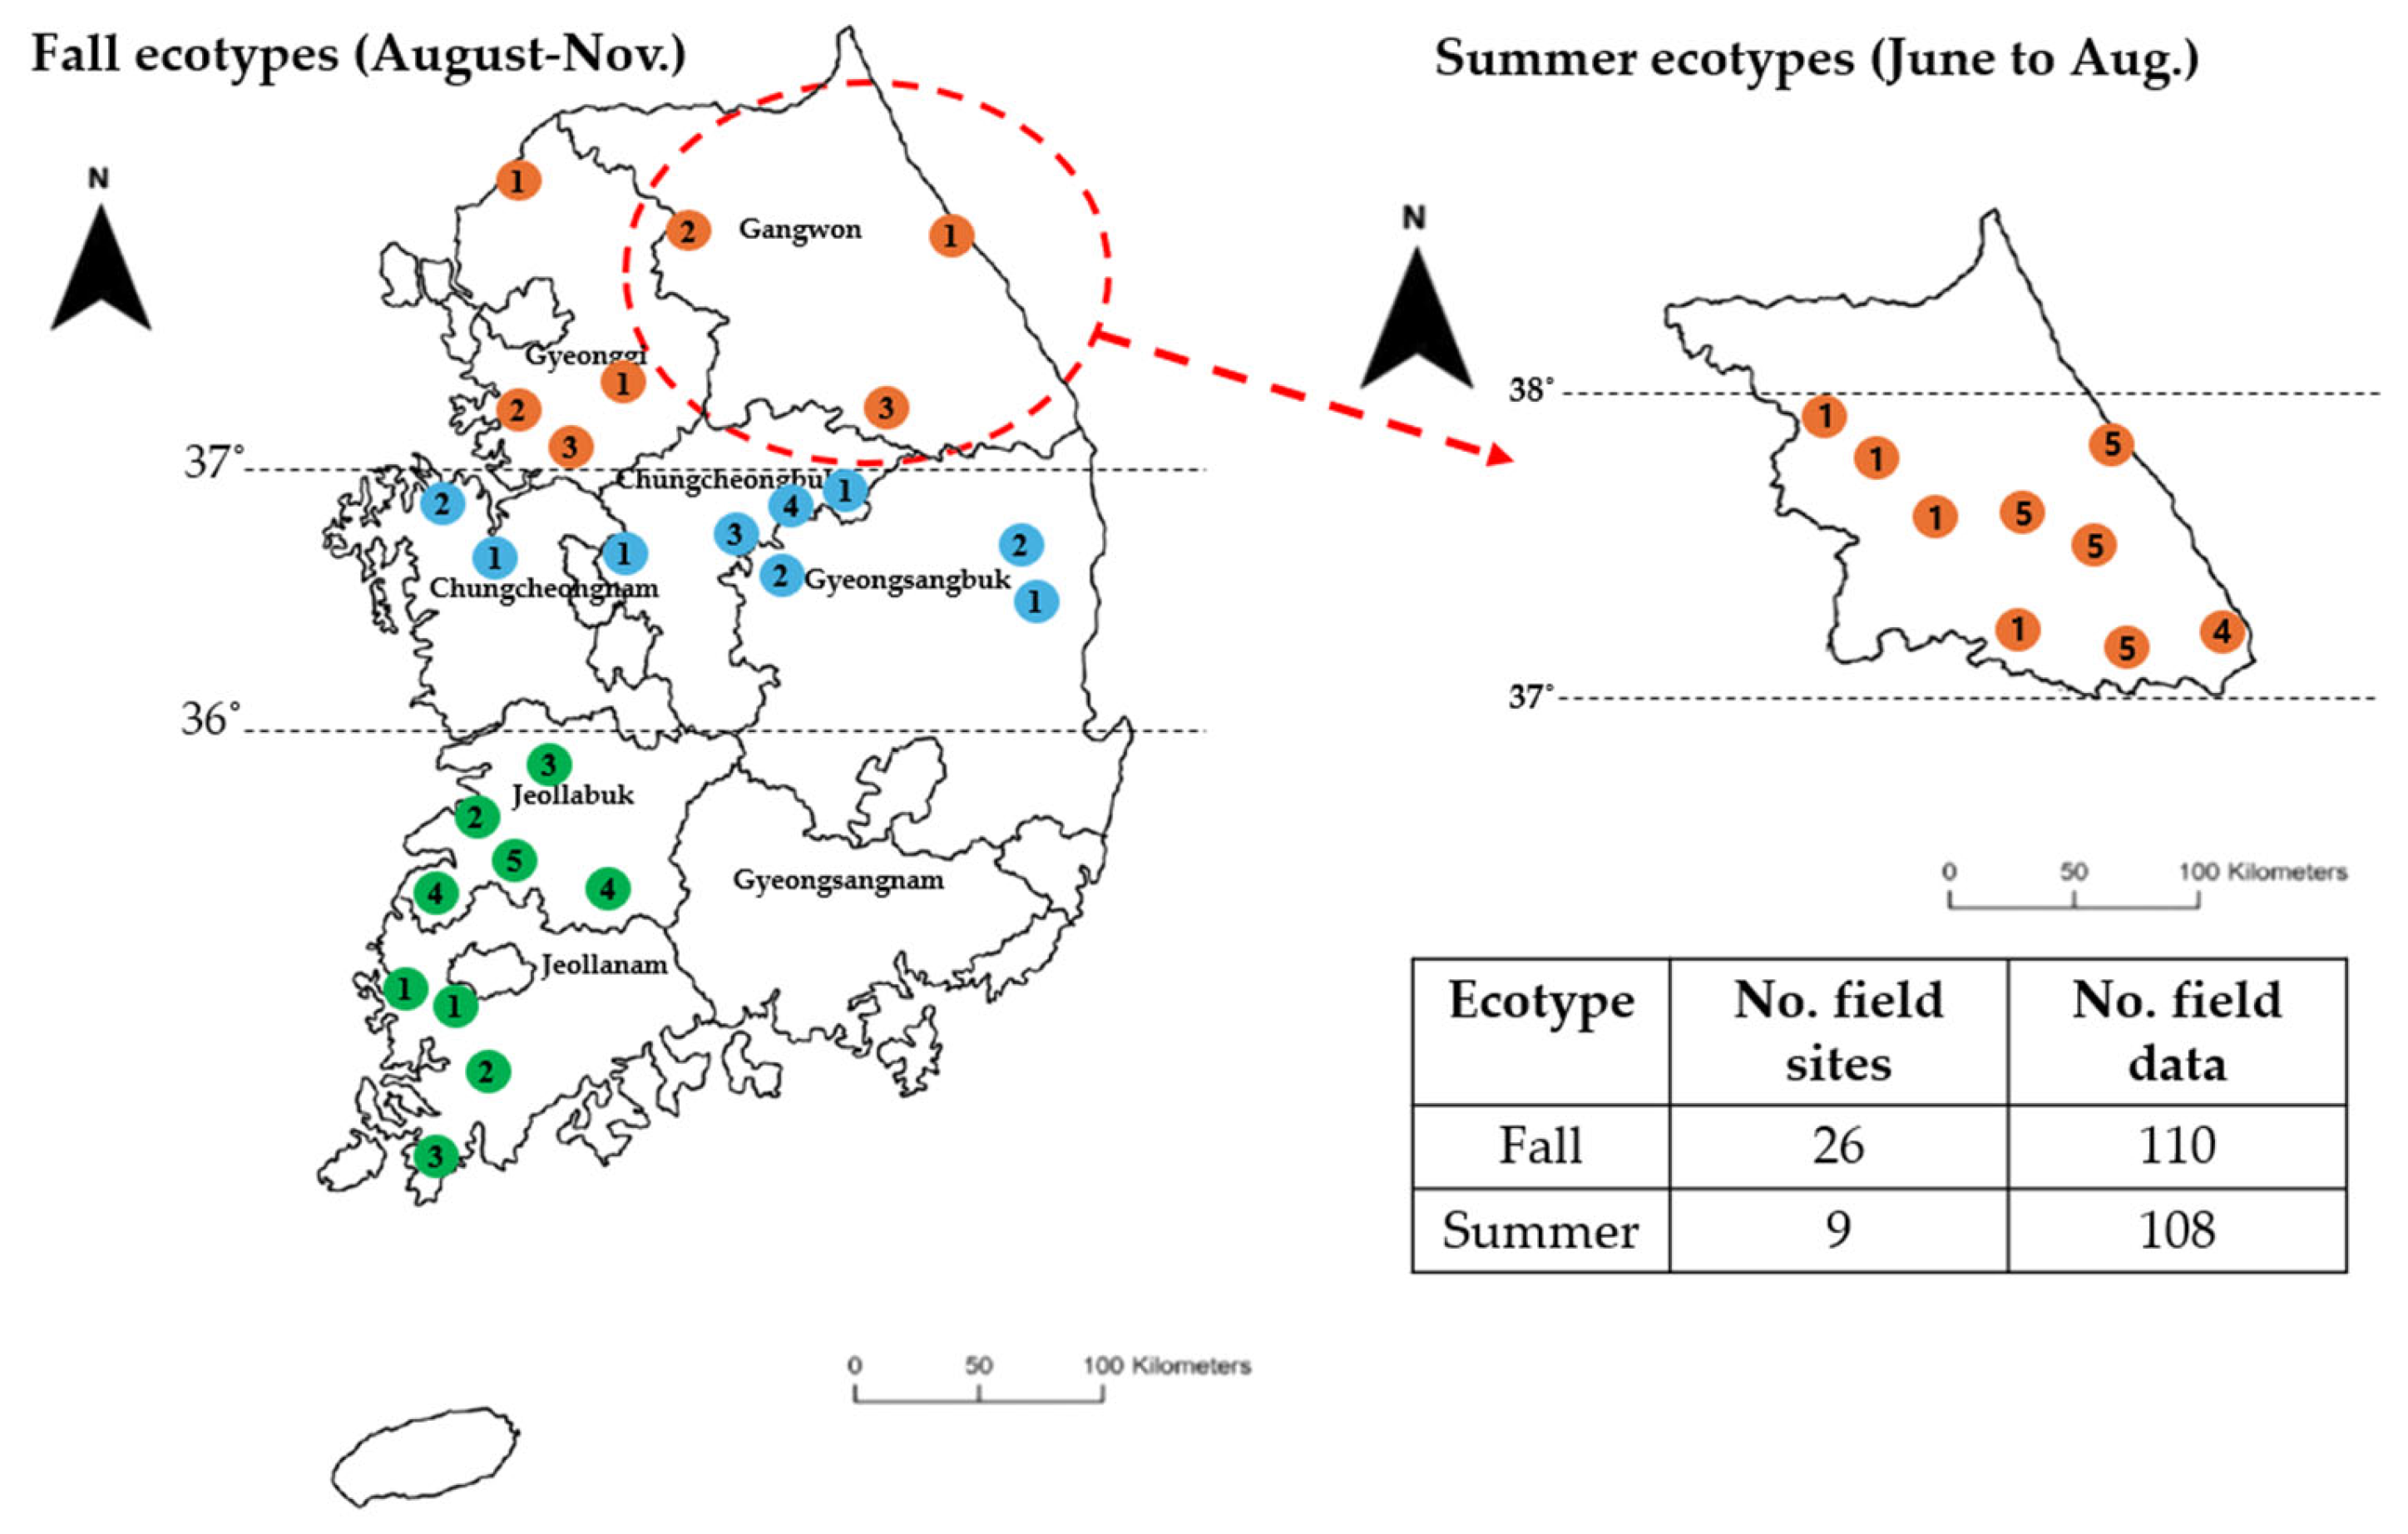
To investigate the relationship between agronomic performances (RUE and LAI) and environmental conditions, field production data collected from multiple years (2020–2023) and locations (a total of 35 sites) were used. This data was gathered by the Korea Rural Economic Institute (KREI). Since the field data was collected from different farmers’ gardens planting various cultivars, five high-yield cultivars commonly planted within each ecotype were selected. A total of 110 field data points collected from 26 different sites were used to estimate radiation use efficiency (RUE) for the fall ecotype, while 108 field data points collected from 9 different sites were used for the summer ecotype. For the fall Chinese cabbage ecotype, the selected cultivars were ‘Cheongomabi,’ ‘Choogwang,’ ‘Whistle Gold,’ ‘Bulam3ho,’ and ‘BulamPlus.’ For the summer ecotype, ‘Suho,’ ‘SummerTop,’ ‘Odae,’ ‘Chungwang,’ and ‘Choogwang’ were chosen. Due to limited data availability, only ecotypes were considered for analysis. Field data were collected across seven provinces: Gangwon, Gyeonggi, Chungcheongbuk, Chungcheongnam, Gyeongsangbuk, Jeollabuk, and Jeollanam in South Korea (Figure 1). In each province, at least two different field sites were investigated.
Due to limited land availability, not all cultivars were planted at the same time or location. Each field site had 1–2 different cultivars planted. The experimental plot was designed as a randomized complete block design, with cultivars as the only treatment factor. Seeds were sown in greenhouse plots at different times based on the planting sites, and 4–5 week old seedlings were then transplanted into open fields. For fall ecotypes, planting dates ranged from late August to early September, while summer ecotypes were planted between late April and early May. The planting and harvest dates for both fall and summer ecotypes are listed in Table 2. Days after transplanting, accumulated heat, total precipitation, and photothermal quotient (PTQ) were averaged for each region of fall and summer ecotypes. Accumulated heat is the sum of average temperatures between transplanting and harvest dates. PTQ is the ratio of radiation to heat units, serving as an index of radiation available per unit of heat growth. The seedling plants were planted at a spacing of 50 cm x 40 cm. The plant density was 3 to 4 plants per m2. Organic fertilizer was applied once prior to transplanting and twice during the growing season. The total application rates of N:P:K were 299:170:270 kg ha−1 for both fall and summer ecotypes.
At harvest, samples were collected from three random small-sized plots (about 3.3 m2 size of plot) in each field trial. Several agronomic traits, including plant height (cm), leaf blade width and length (cm), total number of leaves, and fresh weight per plant (g), were measured. The collected agronomic traits were used as input data for leaf area index models developed in Section 2.2.
The Radiation Use Efficiency (RUE) was calculated (see Equation (4)) from ratio between the produced aboveground dry biomass (AGDM, g DM m−2) and total amount of accumulated IPAR (MJ m−2) during each growing season.
R U E = A G D M i = 1 n I P A R
The aboveground dry weight g m−2 was calculated using moisture contents (93% for fall ecotype and 95% for summer ecotype) measured in Section 2.1 and the number of plants per m2 at each site. Since direct measurements of IPAR at study sites were not available, Beer’s law [20]. was used to estimate it from incoming photosynthetically active radiation (PAR) and L:
I P A R = P A R ( 1 exp k L )
Extinction coefficient (k) was calculated in Section 2.1. The k value was 0.5, which is the average value over fall and summer ecotypes (see Table 3). Linear interpolations of L were used for the days between the date of measurement of L [21]. The incoming PAR is assumed to be the same as 45% of total incoming solar radiation (MJ m−2 day−1) [22,23].
At each study site, total incoming solar radiation (MJ m−2 day−1) was obtained from weather station that was located close to the study site. The weather data can be obtained from Agricultural Weather 365 [24] (Figure 2). Aboveground dry weights of each cultivar were plotted against cumulative IPAR, which was calculated from planting to harvest date across multiple sites and years in South Korea. The line fitted by least-squares regression had a slope equal to the RUE in units of g dry aboveground weight per MJ of IPAR.

2.4. Correlation Analysis on RUEs

To determine the significant factors affecting the RUEs for fall and summer ecotypes, the Pearson correlation coefficient and a significance test (alpha = 0.05) were employed. During the growing seasons, the number of growing days, total radiation (MJ), total precipitation (mm), and accumulated heat were calculated for each individual field study. The number of growing days was defined as the period from transplanting to harvest. Total radiation and total precipitation were computed as the sums of radiation and precipitation from the transplanting to harvest dates. Accumulated heat was calculated as the sum of average temperatures from planting to harvest for each field study. Data from a total of 218 field studies were used for this correlation analysis.

3. Results and Discussion

3.1. Determination of Agronomic Performances of Summer and Fall Chinese Cabbage (Brassica rapa L.) Ecotypes

Generally, fall ecotypes exhibited higher yield components, such as leaf width and number of leaves, compared to summer ecotypes, resulting in greater weights for the fall ecotype (Table 3). This difference can be attributed to the fact that Chinese cabbage is a C3, a cool-season crop that thrives in relatively cool climates, with optimal growth temperatures ranging from 18 to 20 °C [25]. Additionally, the larger leaf length and greater number of leaves in fall ecotypes contributed to a higher leaf area index. The average leaf area index (LAI) for fall ecotypes was 4.3, while for summer ecotypes, it was only 2.5.
Despite the fall ecotype having larger leaves, there was no significant difference in the light extinction coefficients (k) between the two ecotypes, as both exhibited k values around 0.5. This value was used to calculate RUEs in Section 2.3. The light extinction coefficient is a crucial parameter in plant growth models, as k serves as a key indicator of the efficiency with which light penetrates the canopy. However, k can vary based on the physical, chemical, and structural properties of the medium through which light passes. Consequently, many models utilize a constant value for simplicity or due to a lack of data. The measured value can enhance the accuracy of the Chinese cabbage model.
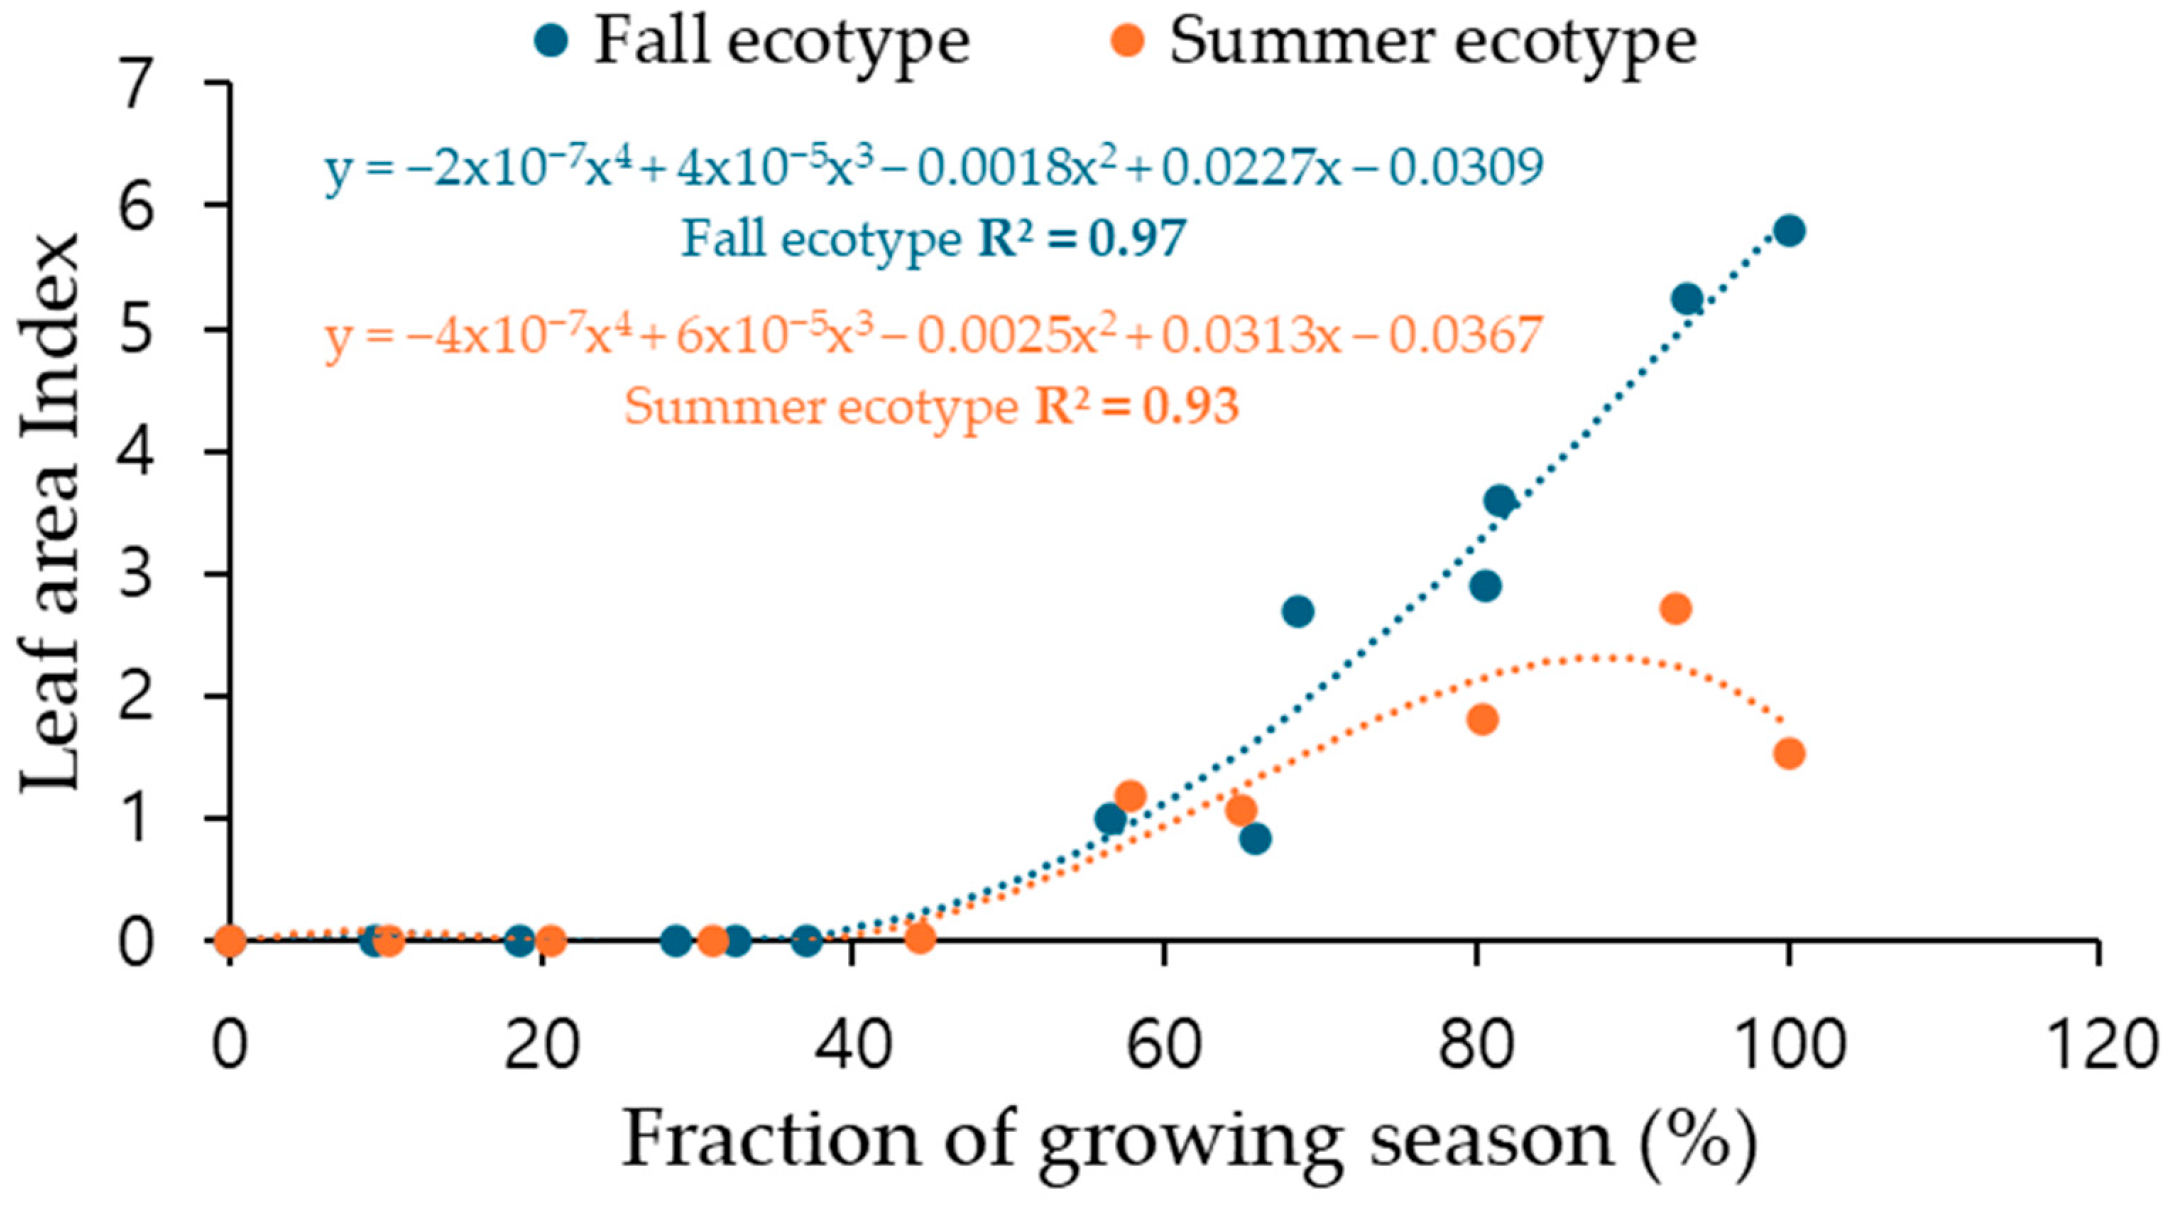
In most models, a sigmoid growth curve (S-curve) model is used to illustrate the pattern of plant development over time. It represents a non-linear growth pattern that initially starts slowly, accelerates rapidly, and then slows down again as the plants reach maturity. Figure 3 shows the growth patterns of both fall and summer ecotypes. Both ecotypes grew slowly until 40% of the growing season and then grew faster after 50% of the growing season. The fall ecotype continuously accelerated its growth until harvest time, while the summer ecotype slowed its growth at 80% of the growing season, which might cause yield reduction in the summer ecotype. This can be related to increases in transpiration rates during the early spring and early summer growing season. Higher temperatures lead plants to transpire faster to decrease leaf temperature [26]. At higher temperatures, water evaporation from plant leaves increases, and the stomata gradually reduces or closes, followed by a decline in transpiration and photosynthesis [27]. In the field measurements, although there was no significant difference observed in moisture content and radiation use efficiency, moisture content in the summer ecotype (95%) was higher than that in the fall ecotype (93%), and the summer ecotype (1.13 g MJ−1) had a relatively lower RUE than the fall ecotype (1.33 g MJ−1) (Table 3).

3.2. Development Leaf Area Index Model for Fall and Summer Chinese Ecotypes

To develop and validate the LAI model, outliers were removed from 288 data points collected according to the experimental design mentioned in Section 2.1, and 212 data points were secured. These were divided into a training dataset and a test dataset in a 1:1 ratio and used for modeling and validation. Table 4 presents the Analysis of Variance (ANOVA) for the LAI model. The test statistic (F-statistic) is 409.7485, and the significance probability 9.7 × 10−57, which is less than the significance level of 0.05. Therefore, the LAI model can be considered significant. Additionally, the coefficient of determination (R2) for the LAI model is 0.92 (adjusted R2 is 0.92), indicating that the model explains 92.35% of the variation in LAI through plant height, leaf blade width, and the total number of leaves, demonstrating high predictive accuracy.
Table 5 presents the results of the significance test for the LAI model coefficients. The LAI model was developed without normalizing the observed values to allow for direct input of field measurements, making it challenging to determine which coefficient—plant height, leaf blade width, leaf blade length, or total number of leaves—is relatively larger. The correlation analysis revealed that plant height, leaf blade width, and leaf blade length had correlations of 0.92, 0.84, and 0.91, respectively, indicating that these are significant variables. Furthermore, as shown in Table 4, the p-values for all independent variables are less than the significance level of 0.05, confirming a linear relationship between the independent variables and LAI at the 95% confidence level.

3.3. Investigation of Significant Factors That Affect Radiation Use Efficiencies (RUEs) in Fall and Summer Chinese Cabbage Ecotypes

Table 6 shows the differences in agronomic characteristics between the fall and summer ecotypes. As mentioned in Section 3.1, Chinese cabbage is generally well adapted to cool weather conditions. As a result, the fall ecotype produced higher fresh and dry biomass than the summer ecotype. The fall ecotype yielded approximately 3.1 kg of fresh biomass per plant, while the summer ecotype produced around 2.4 kg per plant. The dry weight for the fall ecotype (215 g plant−1) was nearly twice that of the summer ecotype (121 g plant−1). Additionally, the fall ecotype had significantly greater height and leaf width, resulting in a higher leaf area index value compared to the summer ecotype (Table 6).
Within fall ecotypes, location significantly affected yield characteristics (Table 7). Plants grown in the southern region (below 37° N) produced higher yields than those grown in northern regions (above 37° N). Plant height and leaf area index gradually increased from the northern region to the southern regions, resulting in similar increases in both fresh and dry yields (Table 7). The yield differences among fall ecotypes may be attributed to variations in environmental conditions, such as precipitation, radiation, and temperature. Planting dates for fall ecotypes vary by region (Table 2). In northern regions, plants were transplanted in mid-August, while in southern regions, planting occurred between late August and early September. Due to early planting in northern regions, the accumulated heat (1281 °C) was highest among the three regions, which may negatively affect yield. As mentioned in Section 3.1, Chinese cabbage is very sensitive to high temperatures; therefore, early planting may lead to increased heat stress, resulting in reduced yields in northern regions.
According to the RUE estimation derived from the relationship between cumulative biomass and intercepted photosynthetically active radiation (IPAR), the RUEs for fall Chinese cabbage ecotypes in the northern region (RUE = 2.08 g MJ−1) were slightly lower than those in the other two regions (RUE = 2.35 and 2.39 g MJ−1). The PTQ for fall ecotypes in the northern region (PTQ = 0.72) was also slightly lower than that of cabbages in the southern regions (PTQ = 0.78 and 0.80) (Table 2). PTQ represents the available radiation per heat unit and can be calculated as solar radiation divided by heat units. Solar radiation drives photosynthesis, while increasing temperatures can reduce photosynthesis. Therefore, PTQ can be used to predict potential crop yield [28]. Consequently, cabbage in the northern region exhibited slightly lower values for both RUE and PTQ, resulting in lower biomass production compared to cabbages in the southern regions (Table 7).
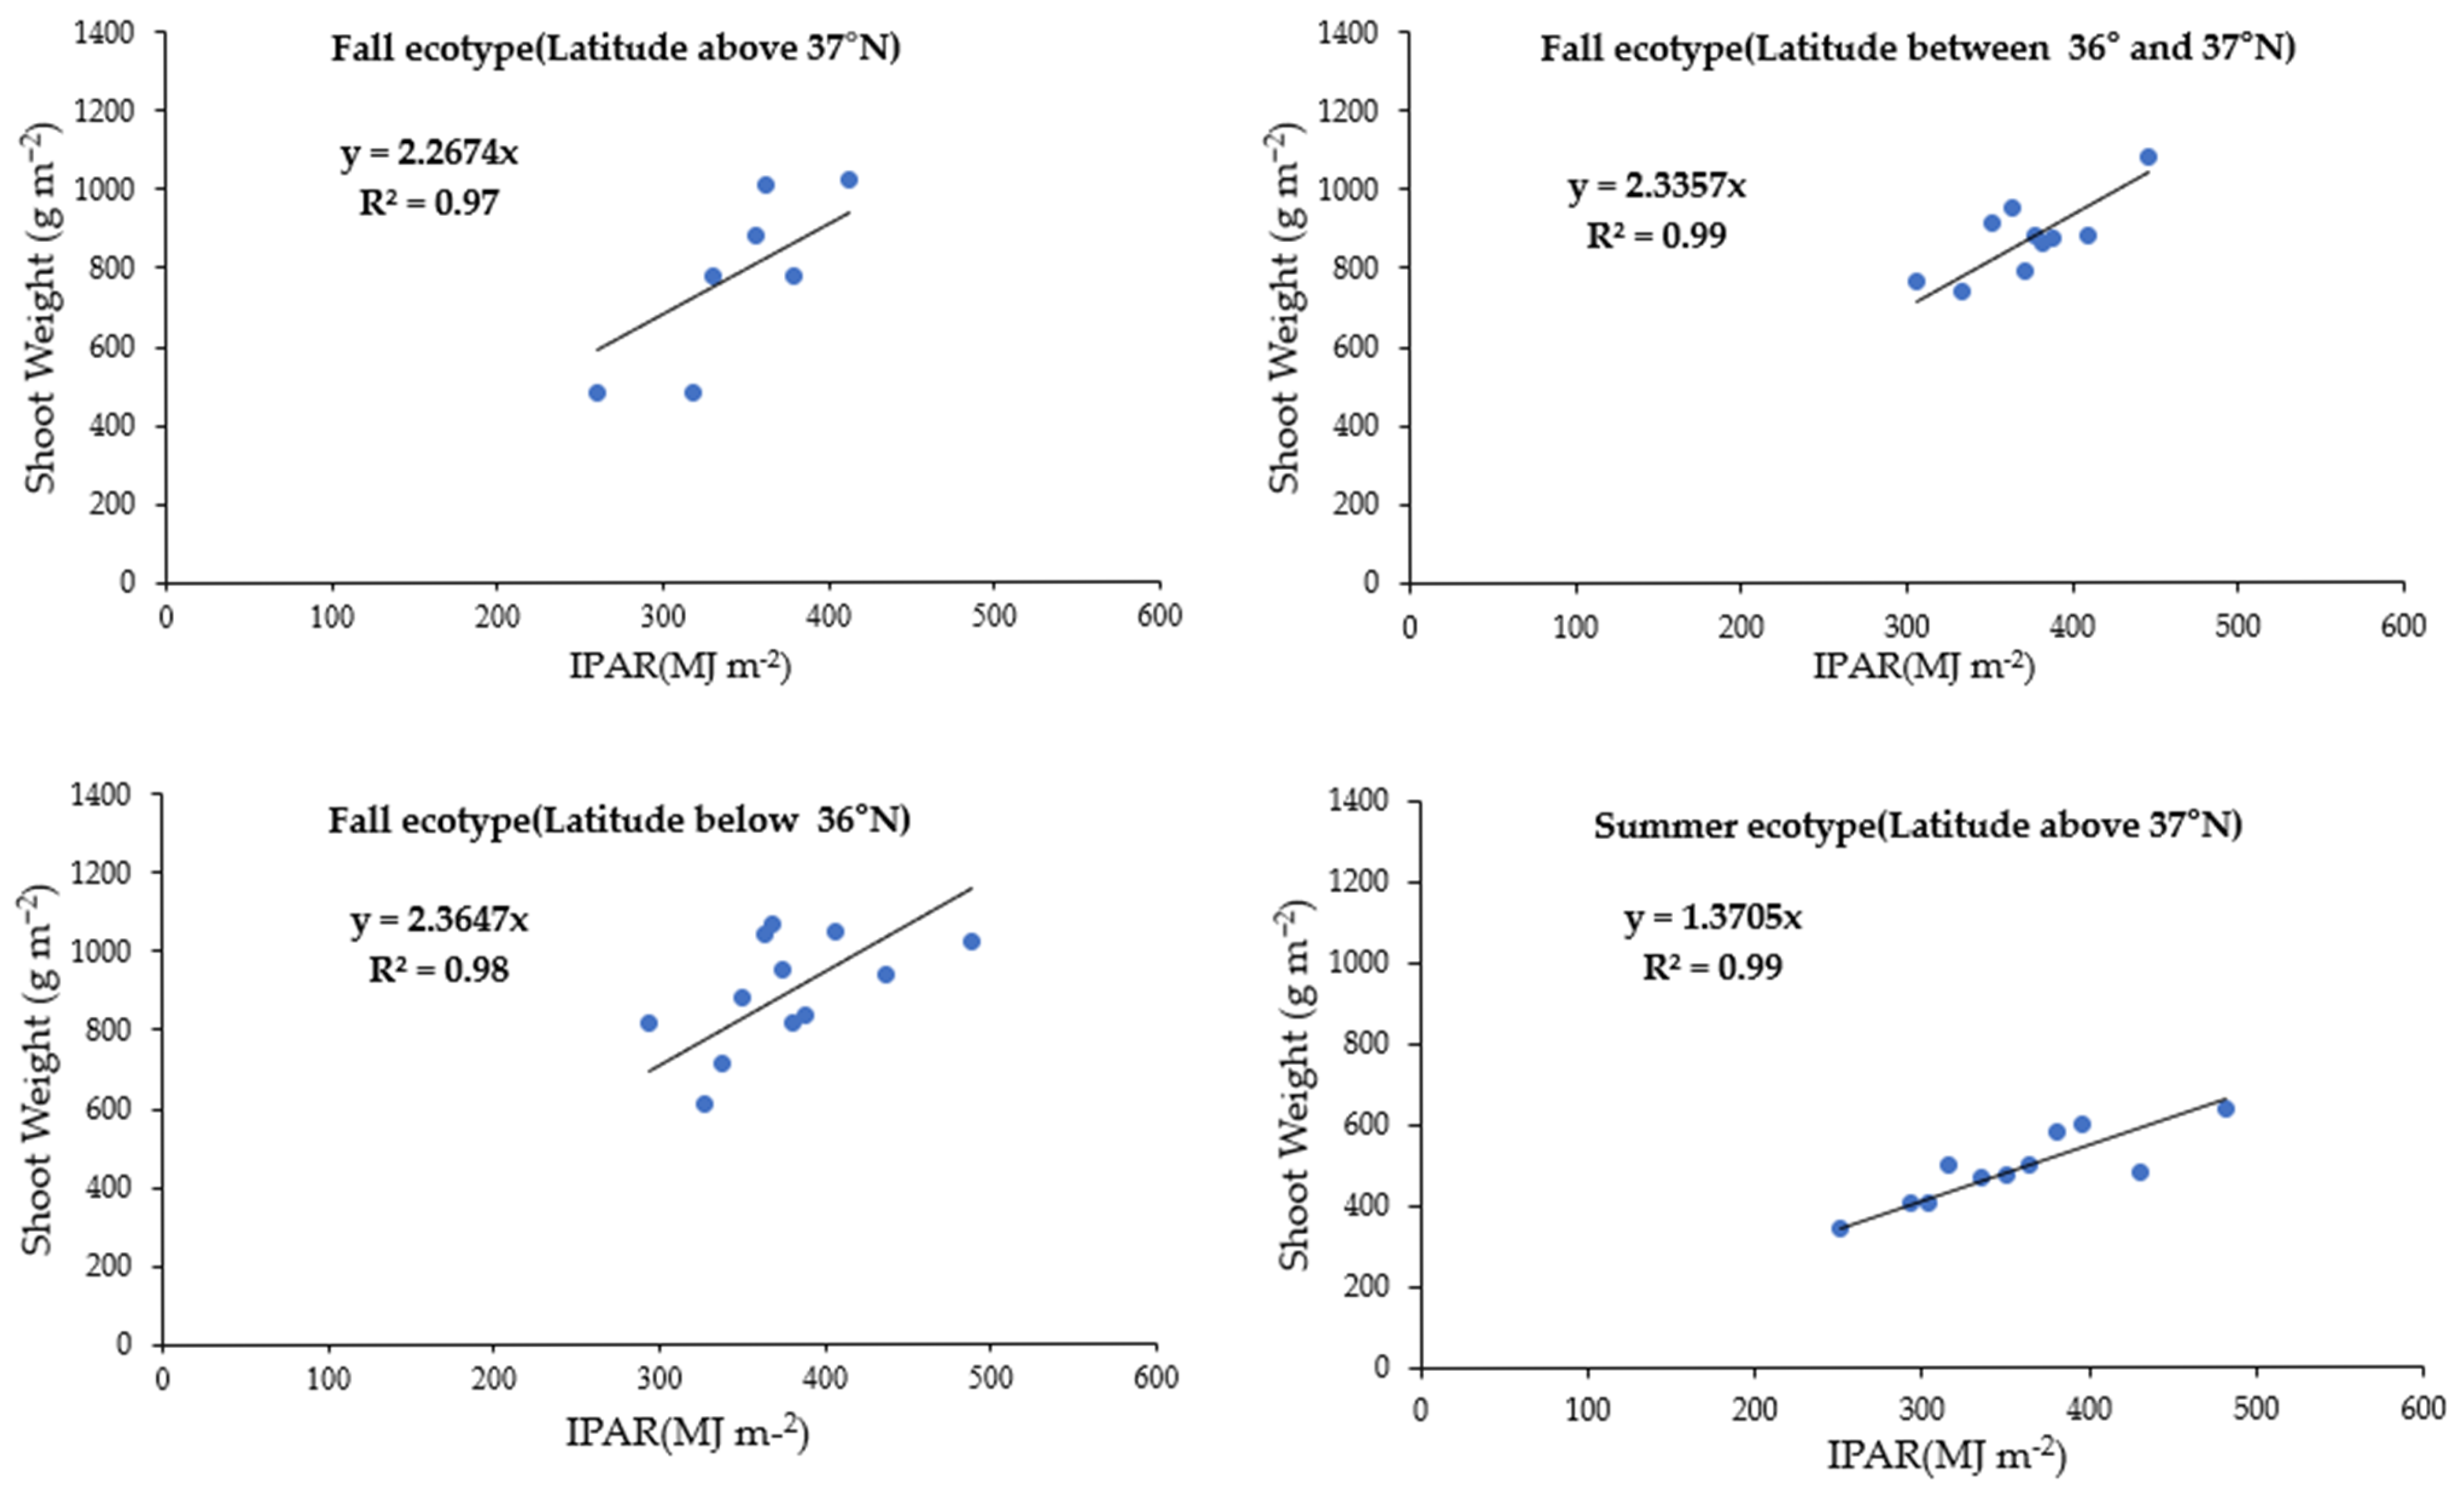
There were significant differences in RUEs between fall and summer ecotypes. The RUEs of the summer ecotype were nearly half that of the fall ecotypes, measuring only 1.3 g MJ−1 (Figure 4). As temperatures increase, plants often utilize more energy for respiration than for photosynthesis [29]. This explains why cabbages during the summer season had lower RUEs compared to the fall season. During the summer, the photothermal quotient (PTQ = 0.37) was significantly lower than that of the fall ecotypes (PTQ > 0.7) (Table 2). The summer ecotype produced a lower biomass of 121 g plant−1 compared to the dry aboveground biomass of fall ecotypes, which was 215 g plant−1 (Table 3).
In overall, radiation use efficiencies of both ecotypes were in range of 1.3 g MJ−1 to 2.35 g MJ−1. Similar results were observed in other Brassica crops including canola (Brassica napus L.), kale (Brassica oleracea), and oilseed (Brassica napus subsp. napus). The RUE values of these species ranged from 1.38 to 2.83 g MJ−1, varying management (e.g., fertilization rates and sowing dates) and environmental conditions [30,31,32]. According to Chakwizira et al. [30], radiation use efficiency (RUE) increased under optimal management and environmental conditions, reaching approximately 2.73 g MJ−1. This indicates that the fall cabbage ecotype likely experienced relatively favorable growing conditions.
To determine the significant factors affecting the RUEs of fall and summer ecotypes, correlation analyses were conducted in this study. The effects of several important environmental factors on the RUEs of summer, fall, and both ecotypes were tested (Table 8). For fall ecotypes, a negative correlation was found with the total radiation during the growing season (−0.299, p = 0.0015), indicating that higher total radiation can lead to lower RUEs in Chinese cabbage. The results suggest that RUEs are more sensitive to total radiation in southern regions, while RUEs of cabbage in northern regions were not significantly affected by total radiation. A similar negative correlation was observed in summer ecotypes (−0.288, p = 0.0025). Similar results were also observed in other studies [11,33,34]. At high radiation levels, photosynthesis becomes light-saturated, which may reduce overall efficiency of radiation use [35].
Accumulated heat also negatively impacted RUEs for both fall and summer ecotypes, indicating that higher temperatures adversely affect RUEs in Chinese cabbage. This finding supports the earlier observation of yield reduction in fall ecotypes at temperatures above 37 °C. Table 2 shows that plants exposed to temperatures above 37 °C had the highest accumulated heat units due to early planting dates, which resulted in yield reduction. For summer ecotypes, RUEs exhibited a negative correlation with growing days, suggesting that longer planting durations in the summer season negatively affect RUEs. Since RUEs and dry aboveground biomass are positively correlated (Figure S1), shortening the growing season may reduce accumulated heat and increase radiation use efficiency, potentially leading to higher yields in the summer season.
As a result, this study has found that radiation uses efficiencies for fall ecotypes in three different regions and summer ecotypes. These measured values can be incorporated into radiation-related parameters within several crop growth models such as APEX. In the APEX model, the parameter WA (biomass–energy ratio, kg ha−1 per MJ m−2) is used to represent the efficiency of converting intercepted solar radiation into biomass. And this value can be set to roughly 10 times the measured RUE value to maintain consistency between radiation units and biomass production calculation [24]. Moreover, the measured RUE values can be used to calibrate or validate crop growth models. WOFOST models calculate changes in RUE in given situations [5]. Comparing measured RUE with calculated RUE from the models can evaluate model performance and improve parameter calibration.

4. Conclusions

Most plant growth models estimate the net increase in crop dry matter by assuming constant production rates per unit of intercepted photosynthetically active radiation (IPAR) in non-stress environments. These models also assume that weight loss due to respiration is proportional to total gross photosynthesis, which is closely linked to radiation use efficiency (RUE). Investigating RUEs for two different ecotypes of Chinese cabbage is crucial for developing a growth model for this crop in the future. Field studies detailed in Section 2.1 show that summer ecotypes accumulate biomass more slowly than fall ecotypes. While the fall ecotype accelerates its growth until harvest, the summer ecotype experiences a slowdown at 80% of the growing season. In Section 2.3, over 200 field data points were analyzed to assess the RUEs of fall and summer ecotypes. Unlike the summer ecotype, the fall ecotype of Chinese cabbage was grown across multiple locations from southern to northern regions in South Korea. RUEs for the fall ecotype were estimated across three different latitudinal regions: above 37° N, between 36 and 37° N, and below 36° N. Other factors, such as irrigation and specific genotypes, were not included in this analysis. However, the differences in RUEs among these regions were minimal compared to the contrast between the summer and fall ecotypes. The RUEs for summer ecotypes (1.3 g MJ−1) were significantly lower than those for fall ecotypes (2.3 g MJ−1). During the summer, the plants receive much less radiation per heat growth (PTQ = 0.38) compared to the fall season (0.8 MJ °C−1). This lower RUE and PTQ in summer ecotypes resulted in reduced biomass accumulation.
As climate change progresses, the frequency and intensity of extreme events like heatwaves, floods, and droughts are on the rise. This increased climate severity has significantly impacted Chinese cabbage yields, prompting interest in developing plant growth models to simulate these weather effects on crop production. The findings of this study will assist modelers in determining the appropriate crop parameter sets for summer and fall ecotypes, thereby enhancing model accuracy. However, due to limited data, other critical factors influencing yield production, such as fertilization vary with changes in cropping management. Therefore, future studies must incorporate crop parameters from different management practices for more accurate modeling.

Supplementary Materials

The following supporting information can be downloaded at: https://www.mdpi.com/article/10.3390/agronomy16070703/s1, Figure S1: Relationship between Radiation use efficiency and dry aboveground biomass of Chinese cabbage grown in fall and summer seasons in South Korea.

Author Contributions

Conceptualization, S.K. (Sumin Kim); methodology, J.H., S.K. (Sumin Kim), D.K. and S.K. (Sojung Kim); validation, J.H., S.K. (Sumin Kim) and S.K. (Sojung Kim); formal analysis, J.H.; investigation, J.H., S.K. (Sumin Kim) and S.K. (Sojung Kim); data curation, J.H. and D.K.; writing—original draft preparation, J.H., S.K. (Sumin Kim) and S.K. (Sojung Kim); writing—review and editing, J.H., S.K. (Sumin Kim), D.K. and S.K. (Sojung Kim); visualization, J.H., S.K. (Sumin Kim) and S.K. (Sojung Kim); supervision, S.K. (Sumin Kim) and S.K. (Sojung Kim); project administration, S.K. (Sumin Kim); funding acquisition, S.K. (Sumin Kim); All authors have read and agreed to the published version of the manuscript.

Funding

This work was carried out with the support of the “Cooperative Research Program for Agriculture Science and Technology Development (Project No. RS-2024-00394437)” funded by the Rural Development Administration, Republic of Korea.

Data Availability Statement

The original contributions presented in this study are included in the article/Supplementary Material. Further inquiries can be directed to the corresponding author.

Conflicts of Interest

The authors declare no conflicts of interest.

References

  1. Son, I.C.; Moon, K.H.; Song, E.Y.; Wi, S.H.; Seo, H.H.; Moon, Y.E.; Reddy, V.; Yang, J.; Sicher, R.; Oh, S. Growth and physiological responses of Chinese cabbage to Different Light Intensity Until Leafy Head Formation. Hortic. Sci. Technol. 2018, 30, 151–160. [Google Scholar] [CrossRef]
  2. Sim, H.S.; Jo, W.J.; Lee, H.J.; Moon, Y.H.; Woo, U.J.; Jung, S.B.; Ahn, S.R.; Kim, S.K. Determination of Optimal Growing Degree Days and Cultivars of Kimchi Cabbage for Growth and Yield during Spring Cultivation under Shading Conditions. Hortic. Sci. Technol. 2021, 39, 714–725. [Google Scholar] [CrossRef]
  3. Nuno, D.B.; Baker, M.M. The Determinants of Agricultural Crop Productivity among Smallholder Households in Haramaya Distinct, Eastern Ethiopia. Grassroots J. Nat. Resour. 2021, 4, 146–153. [Google Scholar] [CrossRef]
  4. Kim, M.K.; Kim, S.M.; Kim, S.J. A hybrid simulation framework for predicting virus impacts on Chinese cabbage yields. Agron. J. 2024, 116, 674–688. [Google Scholar]
  5. Tang, R.; Supit, I.; Zhang, F.; Wang, X.; Zhang, F.; Chen, X.; Chen, X.; Hutjes, R. Rethinking the WOFOST model to simulate growth and development of Chinese cabbage (Brassica rapa L. ssp. pekinensis). Agric. Syst. 2025, 230, 104468. [Google Scholar] [CrossRef]
  6. Kim, D.W.; Back, C.G.; Kim, S.J.; Kim, S.M. Impacts of climate change on Chinese cabbage (Brassica rapa) yields and damages from insects. Agronomy 2025, 15, 1264. [Google Scholar] [CrossRef]
  7. Kiniry, J.R. Radiation-use efficiency and grain yield of maize competing with Johnsongrass. Agron. J. 1994, 86, 554–557. [Google Scholar] [CrossRef]
  8. Wallach, D.; Thorburn, P.J. Estimating uncertainty in crop model predictions: Current situation and future prospects. Eur. J. Agron. 2017, 88, A1–A7. [Google Scholar] [CrossRef]
  9. Lindquist, J.L.; Arkebauer, T.J.; Walters, D.T.; Cassman, K.G. Maize Radiation Use Efficiency under Optimal Growth Conditions. Agron. J. 2005, 97, 72–78. [Google Scholar] [CrossRef]
  10. Bell, M.J.; Wright, G.C.; Hammer, G.L. Night temperature affects radiation-use efficiency in peanut. Crop Sci. 1992, 32, 1329–1335. [Google Scholar] [CrossRef]
  11. Bange, M.P.; Hammer, G.L.; Rickert, K.G. Effect of radiation environment on radiation use efficiency and growth of sunflower. Crop Sci. 1997, 37, 1208–1214. [Google Scholar] [CrossRef]
  12. Stockle, C.O.; Kiniry, J.R. Variability in crop radiation use efficiency associated with vapor pressure deficit. Field Crops Res. 1990, 25, 171–181. [Google Scholar] [CrossRef]
  13. Nahar, K.; Hasanuzzaman, M.; Ahamed, K.U.; Hakeem, K.R.; Ozturk, M.; Fujita, M. Plant responses and tolerance to high temperature stress: Role of exogenous phytoprotectants. In Crop Production and Global Environmental Issues; Hakeem, K.R., Ed.; Springer: Cham, Switzerland, 2015; pp. 385–435. [Google Scholar]
  14. Crafts-Brandner, S.J.; Salvucci, M.E. Rubisco activase constrains the photosynthetic potential of leaves at high temperature and CO2. Proc. Natl. Acad. Sci. USA 2000, 97, 13430–13435. [Google Scholar] [CrossRef]
  15. Wi, S.H.; Lee, H.J.; An, S.; Kim, S.K. Evaluating Growth and Photosynthesis of Kimchi Cabbage According to Extreme Weather Conditions. Agronomy 2020, 10, 1846. [Google Scholar] [CrossRef]
  16. Kemanian, A.R.; Stöckle, C.O.; Huggins, D.R. Variability of barley radiation use efficiency. Crop Sci. 2004, 44, 1662–1672. [Google Scholar] [CrossRef]
  17. IUSS Working Group WRB. World Reference Base for Soil Resources. In International Soil Classification System for Naming Soils and Creating Legends for Soil Maps, 4th ed.; IUSS: Vienna, Austria, 2022; Volume 13. [Google Scholar]
  18. Kiniry, J.R.; Kim, S. A Review of Modeled Water Use Efficiency of Highly Productive Perennial Grasses Useful for Bioenergy. Agronomy 2020, 10, 328. [Google Scholar] [CrossRef]
  19. Kim, S.; Kim, S.; Green, C.H.; Jeong, J. Multivariate polynomial regression modeling of total dissolved-solids in rangeland stormwater runoff in the Colorado River Basin. Environ. Model. Softw. 2022, 157, 105523. [Google Scholar] [CrossRef]
  20. Monsi, M.; Saeki, T. Über den Lichtfaktor in den Pflanzengesellschaften und seine Bedeutung für die Stoffproduktion. Jpn. J. Bot. 1953, 14, 22–52. [Google Scholar]
  21. Kiniry, J.R.; Jones, C.A.; O’Toole, J.C.; Blanchet, R.; Cabelguenne, M.; Spanel, D.A. Radiation use efficiency in biomass accumulation prior to grain-filling for five grain-crop species. Field Crops Res. 1989, 20, 51–64. [Google Scholar] [CrossRef]
  22. Monteith, J.L. Radiation and crops. Exp. Agric. 1965, 1, 241–251. [Google Scholar] [CrossRef]
  23. Meek, D.W.; Hatfield, J.L.; Howell, T.A.; Idso, S.B.; Reginato, R.J. A generalized relationship between photosynthetically active radiation and solar radiation. Agron. J. 1984, 76, 939–945. [Google Scholar] [CrossRef]
  24. Rural Development Administration. AgriculturalWeather 365; Korea Government Ministry: Jeonju, Republic of Korea, 2026; Available online: http://weather.rda.go.kr (accessed on 16 January 2026).
  25. Park, S.H.; Cho, H.R.; Lee, S.B.; Kim, G.K.; Lee, J.S. Practical Cultivation Guidelines for Kimchi Cabbage; Rural Development Administration: Jeonju, Republic of Korea, 2019; Available online: https://www.nongsaro.go.kr/portal/ (accessed on 23 August 2022).
  26. Sadok, W.; Lopez, J.R.; Smith, K.P. Transpiration increases under high-temperature stress: Potential mechanisms, trade-offs and prospects for crop resilience in a warming world. Plant Cell Environ. 2021, 44, 2102–2116. [Google Scholar] [CrossRef] [PubMed]
  27. Scafaro, A.P.; Fan, Y.; Posch, B.C.; Garcia, A.; Coast, O.; Atkin, O.K. Responses of leaf respiration to heatwaves. Plant Cell Environ. 2021, 44, 2090–2101. [Google Scholar] [CrossRef] [PubMed]
  28. Nix, H.A. Climate and crop productivity in Australia. In Climate and Rice; International Rice Research Institute: Los Baños, Philippines, 1976; pp. 495–506. [Google Scholar]
  29. Li, G.; Chen, T.; Feng, B.; Peng, S.; Tao, L.; Fu, G. Respiration, rather than photosynthesis, determines rice yield loss under moderate high-temperature conditions. Front. Plant Sci. 2021, 12, 678653. [Google Scholar] [CrossRef] [PubMed]
  30. Chakwizira, E.; de Ruiter, J.M.; Fletcher, A.L.; Meenken, E.D. Estimating theoretical radiation-use efficiency for kale crops. Grass Forage Sci. 2014, 69, 182–190. [Google Scholar] [CrossRef]
  31. Zahoor, A.; Ahmed, M.; Hassan, F.u.; Shabbir, G.; Ahmad, S. Ontogeny Growth and Radiation Use Efficiency of Canola (Brassica napus L.) Under Various Nitrogen Management Strategies and Contrasting Environments. Int. J. Plant Prod. 2022, 16, 195–208. [Google Scholar] [CrossRef]
  32. Justes, E.; Denoroy, P.; Gabrielle, B.; Gosse, G. Effect of crop nitrogen status and temperature on the radiation use efficiency of winter oilseed rape. Eur. J. Agron. 2000, 13, 165–177. [Google Scholar] [CrossRef]
  33. Sinclair, T.R.; Shiraiwa, T.; Hammer, G.L. Variation in crop radiation-use efficiency with increased diffuse radiation. Crop Sci. 1992, 32, 1281–1284. [Google Scholar] [CrossRef]
  34. Hammer, G.L.; Wright, G.C. A theoretical analysis of nitrogen and radiation effects on radiation use efficiency in peanut (Arachis hypogaea). Aust. J. Agric. Res. 1994, 45, 575–589. [Google Scholar] [CrossRef]
  35. Sheehy, J.E.; Chapas, L.C. The Measurement and Distribution of Irradiance in Clear and Overcast Conditions in Four Temperate Forage Grass Canopies. J. Appl. Ecol. 1976, 13, 831–840. [Google Scholar] [CrossRef]
Figure 1. Geographic distribution of fall and summer ecotypes of Chinese cabbage used in this study. The number of field sites and field data collected from 2020 to 2023 is listed in the table. The numbers within the circles on the map indicate the number of data points collected at each location.
Agronomy 16 00703 g001
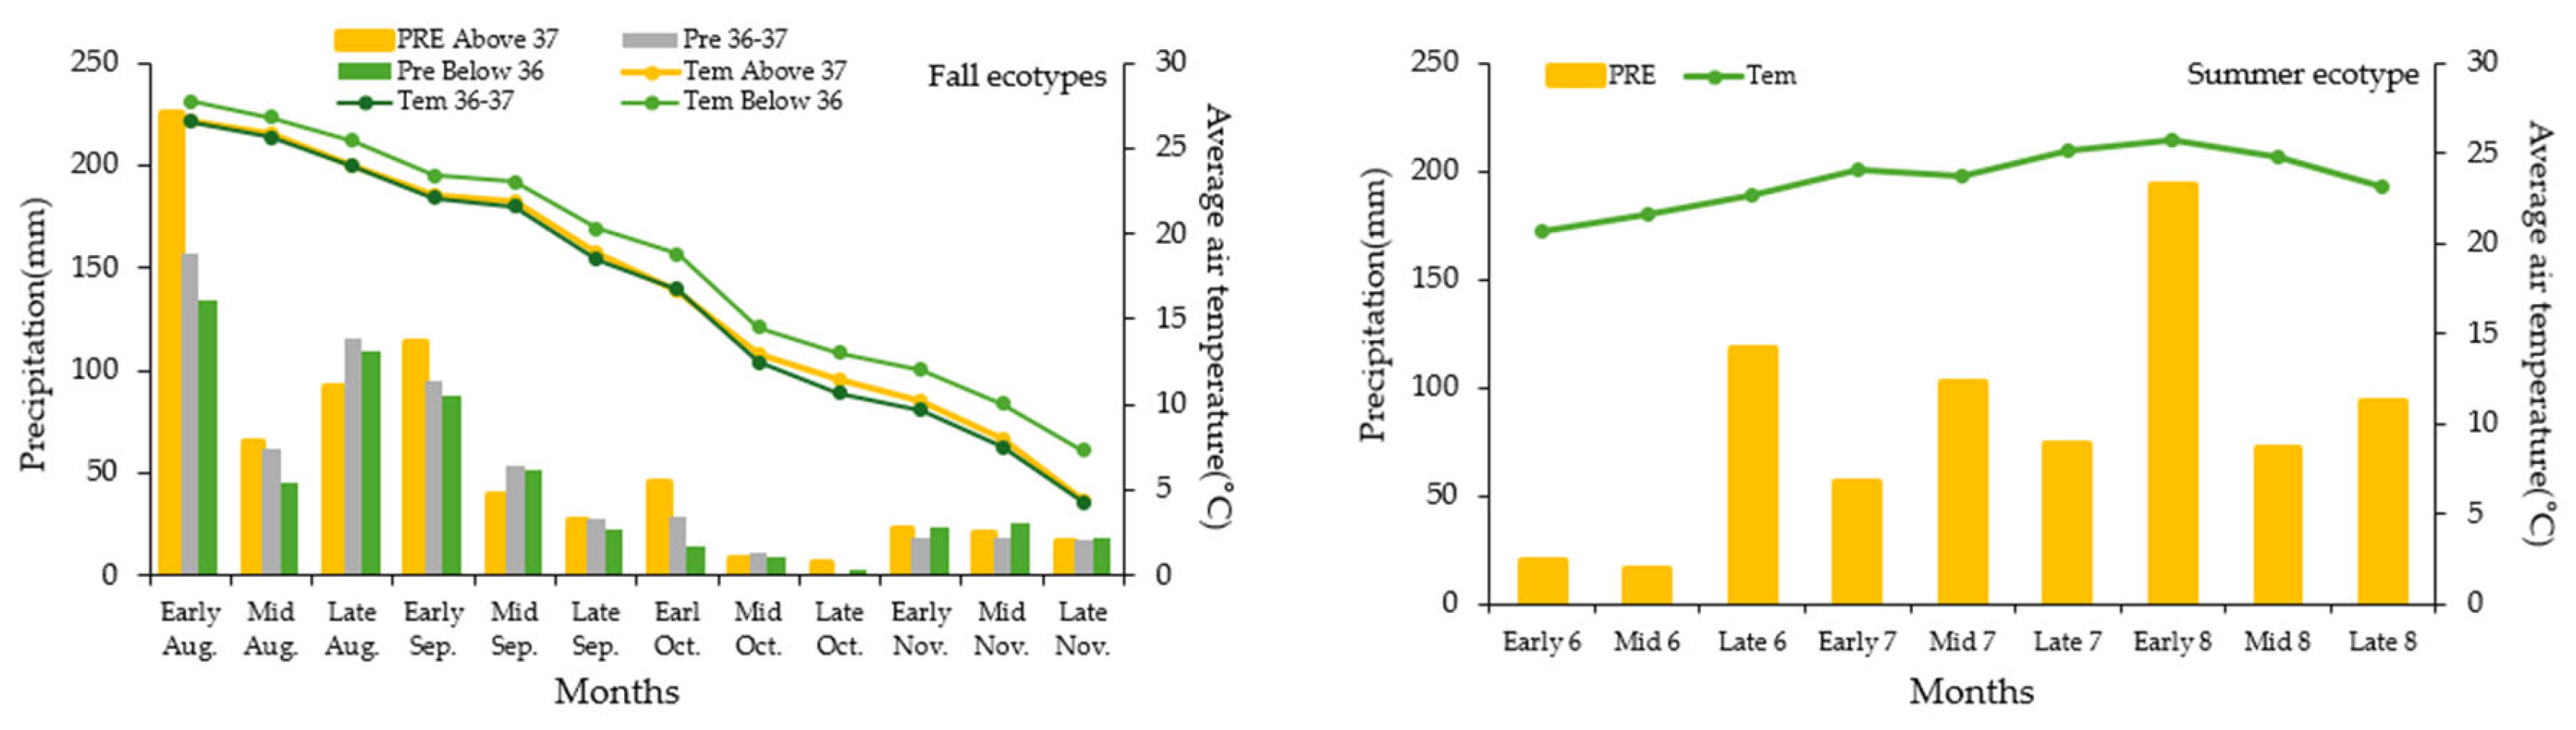
Figure 2. Average temperatures (°C) and total precipitation (mm) of three regions for fall ecotype and one region for summer ecotypes in 2020–2023 [24].
Agronomy 16 00703 g002
Figure 3. Leaf area index developments of Chinese cabbages grown in the fall and summer seasons in South Korea (see text). The blue circle indicates the fall ecotype, and the orange circle indicates the summer ecotype, respectively.
Agronomy 16 00703 g003
Figure 4. Aboveground biomass as a function of cumulative intercepted PAR for fall Chinese cabbage ecotypes in three regions and the summer Chinese ecotype.
Agronomy 16 00703 g004
Table 1. Soil physical and chemical characteristics of Seongju and Cheonan sites in this study. n.a. indicates that data is not available.
SiteName of
Soil
Soil TypepHTotal NOrganic MatterAvailable PKCaMgNa
(g kg−1)(mg kg−1)(cmol(+) kg−1)
SeongjuNamgaeHaplic regosols 6.970.1015.336181.086.001.48n.a
CheonanJisanGleyic Hydragric Anthrosols6.550.34367390.919.323.460.04
Table 2. Transplanting dates, harvest dates, days after transplanting, accumulated heat, and photothermal quotient (PTQ) for fall and summer ecotypes of Chinese cabbage in South Korea.
EcotypeLocation
(Lat.)
Transplanting DatesHarvest
Dates
Days After TransplantingAccumulated Heats
(°C)
Total
Precipitation (mm)
Total
Radiation
(MJ m−2)
PTQ
(MJ °C−1)
FallAbove 37° N21 August31 October7112813319290.72
36–37° N25 August5 November7212142689760.80
Below 36° N5 September14 November7112241809560.78
SummerAbove 37° N16 June17 August6214969875660.38
Table 3. Means and standard deviations (mean ± SD) of agronomic characteristics of Chinese cabbage planted in the fall and summer seasons at study sites in South Korea. RUE refers to radiation use efficiency, while EXT (k) denotes the light extinction coefficient. ANOVA was conducted to assess the effects of ecotypes on each variable at an alpha level of 0.05. n.s. indicates not significant.
EcotypePlant
Height (cm)
Leaf Width (cm)Leaf Length (cm) Number of Leaves Fresh Weight
(kg plant−1)
Dry Weight
(g Plant−1)
Moisture Content (%)Leaf Area IndexRUE
(g MJ−1)
EXT
(k)
Fall 38.9 ± 6.829.4 ± 2.939.1 ± 5.855 ± 192.0 ± 1.2115 ± 4293 ± 24.3 ± 1.81.3 ± 0.40.5 ± 0.1
Summer36.1 ± 3.822.3 ± 2.537.5 ± 2.741 ± 81.6 ± 0.955 ± 2195 ± 42.5 ± 0.51.1 ± 0.40.5 ± 0.4
p-valuen.s.<0.0001n.s.0.0231n.s.0.0002n.s.0.003n.s.n.s.
Table 4. Analysis of Variance (ANOVA) table for the leaf area index model.
CategoryDegrees of
Freedom (df)
Sum of
Squares Error
Mean
Square Error
F-StatisticSignificance F
Regression3351.9611117.3204409.74859.7 × 10−57
Residual10229.20490.2863
Total105381.1660
Table 5. Results of significance test of the LAI model coefficients.
VariablesCoefficientsStandard Errort-Statisticp-Value95% Confidence Interval
Lower BoundUpper Bound
Constant−2.89130.3339−8.66027.4 × 10−14−3.5535−2.2291
Plant height0.07920.01744.54551.5 × 10−50.04460.1138
Leaf blade width
and length
0.07240.01794.05409.9 × 10−50.03700.1078
Total number of leaves0.02270.00249.47431.2 × 10−150.01790.0274
Table 6. Means and standard deviations (mean ± SD) of agronomic characteristics of Chinese cabbage planted in fall and summer seasons at multiple sites in South Korea. ANOVA of the effects of ecotypes on each variable at alpha = 0.05. n.s. means not significant.
EcotypeHeight
(cm)
Leaf Width (cm)Total Number of LeavesFresh Weight (kg plant−1)Dry Weight
(g plant−1)
Leaf Area
Index
Fall40 ± 428 ± 377 ± 103.1 ± 0.8215 ± 574.0 ± 0.6
Summer34 ± 322 ± 377 ± 132.4 ± 0.7121 ± 333.2 ± 0.5
p-value<0.0001<0.0001n.s.<0.0001<0.0001<0.0001
Table 7. Means and standard deviations (mean ± SD) of agronomic characteristics of Chinese cabbage planted in fall seasons at three different locations in South Korea. ANOVA of the effects of location on each variable at alpha = 0.05. n.s. means not significant.
Location (Lat.)Height
(cm)
Leaf Width (cm)Total Number of Leaves Fresh Weight (kg plant−1)Dry Weight
(g plant−1)
Leaf Area
Index
RUE
(g MJ−1)
Above 37° N39 ± 426 ± 370 ± 112.65 ± 0.9184 ± 653.6 ± 0.72.08±0.55
36–37° N40 ± 428 ± 380 ± 93.17 ± 0.7220 ± 504.1 ± 0.62.35±0.50
Below 36° N41 ± 428 ± 377 ± 93.23 ± 0.8224 ± 554.2 ± 0.62.39±0.55
p-value0.0357n.s.0.00080.01820.01820.0060.0717
Table 8. Correlation analysis between environmental variables and radiation use efficiency (RUE) for fall, summer, and both Chinese cabbage ecotypes. Correlation represents the Pearson correlation coefficient, with the p-value indicating significant differences. n.s. indicates no significant differences at alpha = 0.05. Significantly different variables are indicated by numbers in bold.
Variables Fall EcotypeSummer Ecotype
Above 37° N36–37° NBelow 36° NTotalAbove 37° N
Growing daysR0.128−0.166−0.112−0.089−0.387
p-valuen.s.n.s.n.s.n.s.<0.0001
Total radiationR0.158−0.486−0.418−0.299−0.288
p-valuen.s.0.00130.00310.00150.0025
Total precipitationR0.336−0.0760.13−0.018−0.098
p-value0.1367n.s.n.s.n.s.n.s.
Accumulated heatsR0.182−0.198−0.246−0.18−0.235
p-valuen.s.n.s.0.09260.05940.0144
Disclaimer/Publisher’s Note: The statements, opinions and data contained in all publications are solely those of the individual author(s) and contributor(s) and not of MDPI and/or the editor(s). MDPI and/or the editor(s) disclaim responsibility for any injury to people or property resulting from any ideas, methods, instructions or products referred to in the content.