Article

Cross-Sensor Evaluation of ZY1-02E and ZY1-02D Hyperspectral Satellites for Mapping Soil Organic Matter and Texture in the Black Soil Region


1
Land Satellite Remote Sensing Application Center, Ministry of Natural Resources of China, Beijing 100048, China
2
Beijing SatImage Information Technology Co., Ltd., Beijing 100040, China
*
Author to whom correspondence should be addressed.
Agronomy 2026, 16(8), 781; https://doi.org/10.3390/agronomy16080781
Submission received: 26 February 2026 / Revised: 26 March 2026 / Accepted: 9 April 2026 / Published: 10 April 2026

Abstract

Soil health monitoring is critical for the sustainable management of the black soil region, a key resource for global food security. However, traditional field surveys are constrained by high operational costs, limited spatial coverage, and low temporal frequency, making them inadequate for high-resolution and time-sensitive soil monitoring. The recently launched ZY1-02E satellite, equipped with an advanced hyperspectral imager, offers a new potential data source, yet its capability for quantitative soil modelling requires rigorous cross-sensor validation. This study conducts a cross-sensor evaluation of ZY1-02E and its predecessor, ZY1-02D, for mapping soil organic matter (SOM) and soil texture (sand, silt, and clay) in Northeast China. Optimal spectral indices were constructed through exhaustive band combination and correlation screening, and quantitative inversion models were established using a hybrid framework integrating Random Frog feature selection with Gaussian Process Regression (GPR) and Boosting Trees, based on synchronous ground observations. Results demonstrate strong cross-sensor consistency, with spectral indices showing significant linear correlations ( R 2 > 0.65 ) between ZY1-02E and ZY1-02D. Furthermore, the quantitative retrieval models applied to ZY1-02E imagery achieved robust performance, with cross-sensor retrieval consistency exceeding R 2 = 0.60 for all parameters and SOM exhibiting the highest agreement ( R 2 = 0.74 ). These findings confirm the radiometric stability and algorithm transferability of ZY1-02E, demonstrating its capability to generate soil parameter products comparable to ZY1-02D without extensive model recalibration. The validated interoperability of the twin-satellite constellation substantially enhances temporal observation capacity during the narrow bare-soil window, effectively mitigating cloud-induced data gaps in high-latitude agricultural regions. Importantly, the enhanced monitoring framework provides a scalable technical paradigm for high-frequency hyperspectral soil mapping, offering critical spatial decision support for precision fertilization, soil degradation mitigation, and conservation tillage management in the Mollisol belt.

1. Introduction

Soil quality assessment is a fundamental component of sustainable land management and global food security, serving as a critical basis for evaluating ecosystem services, agricultural productivity, and long-term soil resilience [1]. The Northeast China black soil region, recognized as one of the world’s four major Mollisol belts, serves as a vital commercial grain base and acts as a critical guarantee for national food security [2]. Consequently, establishing a reliable and scalable monitoring framework for soil health in this region is essential for stabilizing agricultural production and safeguarding national grain security [3]. Among the various physicochemical properties of soil, Soil Organic Matter (SOM) and soil texture are considered the most essential parameters for agronomic management. SOM content is a primary indicator for diagnosing soil fertility and carbon sequestration capacity [4]. Concurrently, variations in soil texture fractions (sand, silt, and clay) effectively characterize soil structure, directly influencing crop root penetration, hydraulic conductivity, and nutrient retention [5]. Accurate mapping of these two parameters is the prerequisite for implementing precision fertilization and mitigating soil degradation in the Mollisol region.
Traditionally, soil quality surveys in the black soil region have relied on field sampling followed by laboratory analysis and geostatistical interpolation to map spatial distributions [6]. While this approach yields reliable point-based data, it is constrained by long sampling cycles, temporal inconsistency, and high implementation costs, making it insufficient for large-scale, high-frequency macroscopic dynamic monitoring [7]. In recent years, remote sensing technology has played an increasingly prominent role in black soil monitoring [8]. National strategies, such as the Outline of the Black Land Protection Planning and the Implementation Plan for the National Black Land Protection Project, have explicitly emphasized the need for remote sensing dynamic monitoring to track trends in soil quality [9,10]. Quantitative soil remote sensing has emerged as a frontier research direction, aiming to bridge the gap between laboratory spectroscopy and large-scale spatial soil monitoring [11,12]. In particular, hyperspectral remote sensing, characterized by continuous narrow-band spectral acquisition, has demonstrated strong potential for retrieving soil physicochemical properties by capturing subtle absorption features associated with organic matter and clay minerals [13,14].
Despite these advancements, quantitative soil remote sensing in high-latitude agricultural regions faces a critical methodological bottleneck: the extremely narrow “bare-soil window”, which severely limits the acquisition of cloud-free hyperspectral imagery. Satellite imagery must be acquired during the brief spring plowing season before crop emergence. Frequent cloud cover during this period exacerbates the data acquisition challenge, rendering single-satellite missions with long revisit cycles highly vulnerable to missing this critical observational window. The successive launches of the ZY1-02D and ZY1-02E hyperspectral satellites provide a potential technical solution by enabling constellation-based observation strategies with shortened revisit intervals [15,16,17]. The Advanced Hyperspectral Imager (AHSI) onboard the two satellites features 166 spectral bands covering the range from 400 nm to 2500 nm, capturing the subtle absorption characteristics of SOM and clay minerals [18]. More importantly, the spectral configuration of ZY1-02E is similar to that of ZY1-02D, theoretically allowing for a synergistic twin-satellite constellation that can significantly enhance the efficiency of arable land monitoring.
However, although ZY1-02D has been validated for soil property retrieval in several regional studies, the quantitative interoperability and algorithm transferability between ZY1-02D and the newly launched ZY1-02E remain largely unexplored. In particular, whether retrieval models developed from one sensor can be directly transferred to another without significant recalibration remains an open question.
Therefore, this study aims to conduct a comprehensive cross-sensor evaluation of ZY1-02E and ZY1-02D hyperspectral data for characterizing key soil parameters in typical black soil regions. By leveraging soil spectral indices and quantitative inversion models previously developed based on ZY1-02D data and synchronous field measurements, we tested these methods on ZY1-02E imagery. This research analyzes the consistency between the two satellites and evaluates the potential of ZY1-02E for producing high-quality soil spectral products. Ultimately, this research seeks to verify the feasibility of a twin-satellite monitoring framework, providing robust technical and data support for high-frequency precision agriculture and sustainable soil management.

2. Materials and Methods

2.1. Study Area

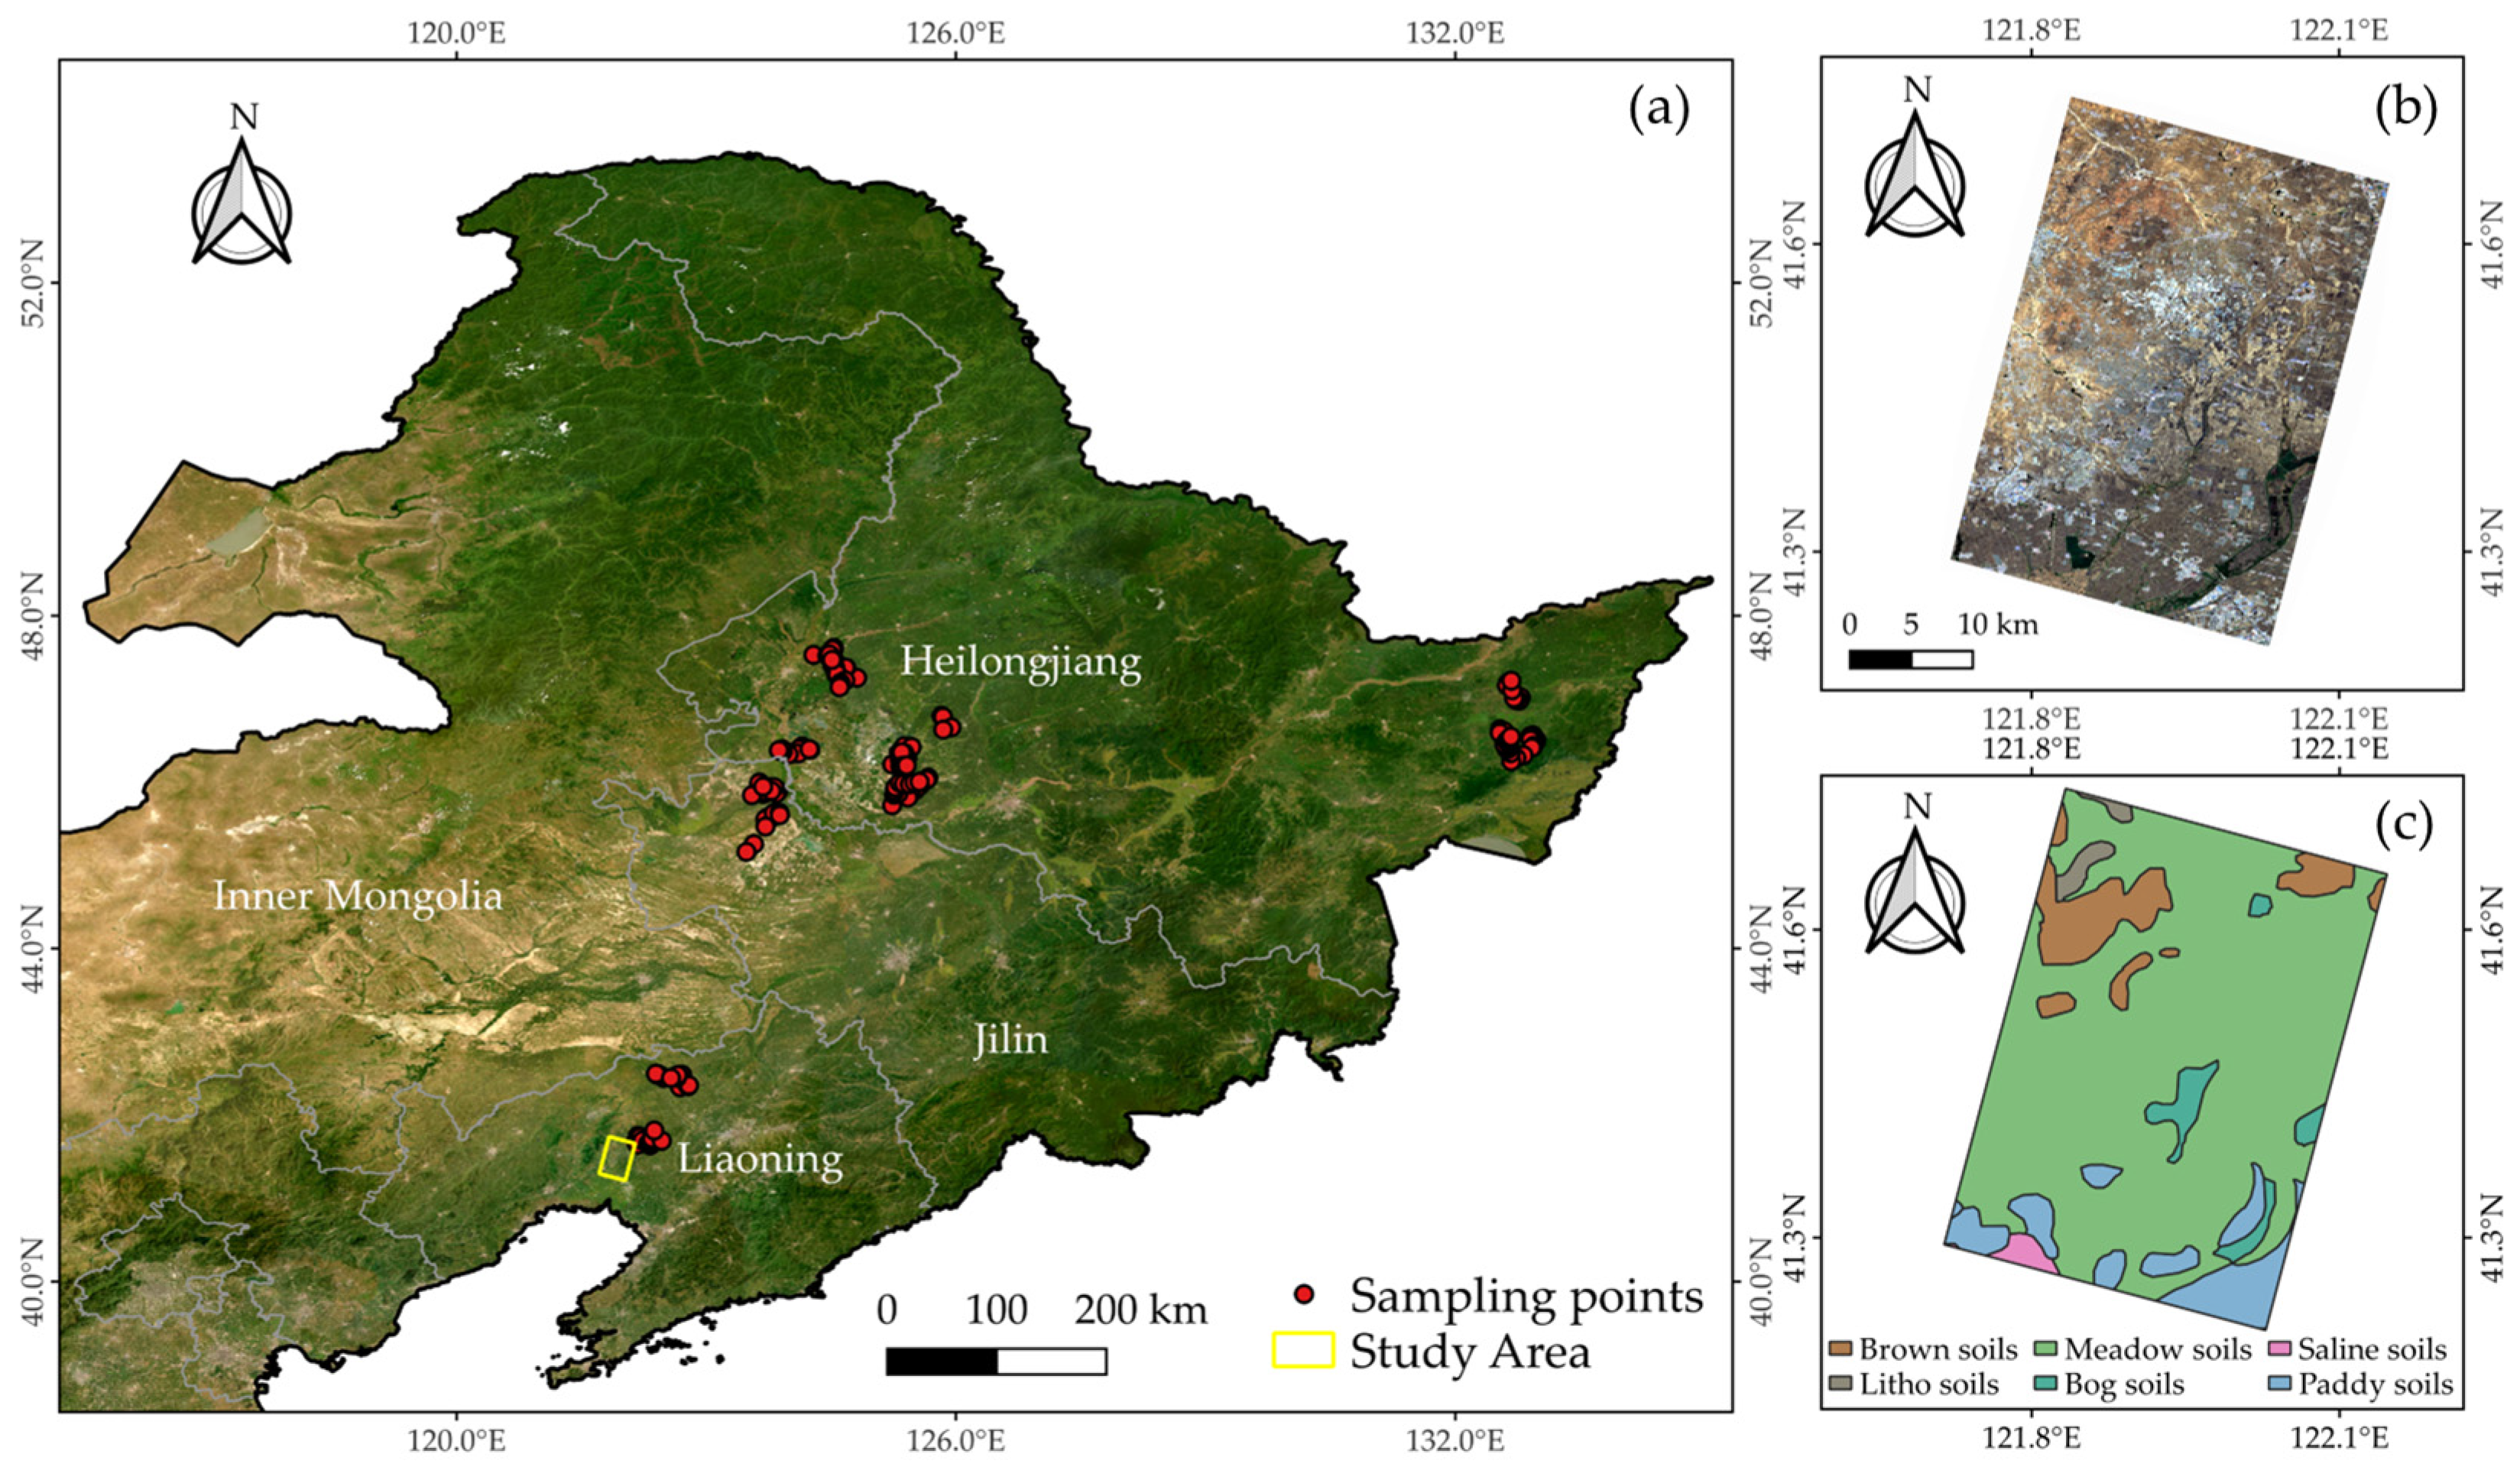
To evaluate the applicability of ZY1-02E hyperspectral data for agronomic applications, a typical agricultural region in the southern part of Northeast China was selected as the study area (Figure 1). Specifically, the study area covers Beizhen City and Heishan County (Jinzhou City), as well as Panshan County (Panjin City) in Liaoning Province.
This area is characterized by relatively flat terrain and deep soil layers, with parent materials primarily consisting of biotite granite and limestone [19]. The dominant soil type is meadow soils, which has developed a uniform clayey texture due to long-term hydrodynamic effects and long-standing agricultural practices. The region experiences a distinct temperate monsoon climate with seasonal freezing and abundant water resources, providing highly favorable conditions for the intensive cultivation of staple and cash crops, including rice, maize, and peanuts.
According to the 2019 National Cultivated Land Quality Grade Bulletin, while the arable land in this region is generally highly productive and free of major obstacle factors, some localized areas have begun to exhibit issues such as mild salinization, gleying, and the thinning of soil fertility layers due to intensive farming. The coexistence of relatively homogeneous parent materials and spatially heterogeneous soil fertility conditions makes this region an appropriate experimental domain for evaluating hyperspectral soil retrieval performance under typical intensive agricultural management systems.

2.2. Data Acquisition and Preprocessing

2.2.1. Satellite Data

The primary remote sensing data source for this study was the ZY1-02E satellite, which carries an AHSI identical to that of the ZY1-02D satellite. The AHSI sensor provides 166 contiguous spectral bands spanning 400–2500 nm, with a spectral resolution of approximately 10 nm in the visible and near-infrared (VNIR) region and 20 nm in the shortwave infrared (SWIR) region, enabling detailed detection of soil absorption features (Table 1). Table S1 compares the center wavelengths of each band of ZY1-02D and ZY1-02E to clarify the spectral similarity between the two sensors and to support the cross-sensor comparison framework used in this study. Six cloud-free ZY1-02E AHSI scenes covering the study area were acquired during the critical bare-soil period (1–7 April 2022), ensuring minimal vegetation interference and optimal soil spectral exposure.
Hyperspectral data preprocessing included radiometric calibration, atmospheric correction using the Fast Line-of-sight Atmospheric Analysis of Hypercubes (FLAASH) module, geometric registration, orthorectification, and image mosaicking. These steps helped minimize radiometric and geometric distortions while improving consistency among two satellites. The preprocessed dataset was then clipped to the study area and uniformly resampled to a spatial resolution of 30 m for subsequent feature extraction and model development [20,21].

2.2.2. Ground Truth Data and Cross-Year Validation Justification

To evaluate the cross-sensor consistency of the retrieval models, a ground-truth dataset collected synchronously with the ZY1-02D overpass (14–21 April 2021) was used. Considering soil types, land-use types, and soil moisture conditions, a total of 173 topsoil samples (0–10 cm) were collected to represent the spatial variability of soil quality in the black soil region. At each sampling site, visible surface debris such as roots, plant residues, and gravel were removed. Five subsamples collected within each plot were then composited to obtain a representative sample.
After collection, the soil samples were air-dried, ground, and passed through a 2 mm sieve prior to laboratory analysis. SOM content was determined using the potassium dichromate volumetric method. Before soil texture analysis, the soil suspensions were pretreated to minimize the influence of particle aggregation on the measurements. Pretreatment included chemical dispersion with sodium hexametaphosphate, supplemented by ultrasonication if necessary to enhance particle disaggregation. After thorough shaking, particle size distribution was measured using laser diffraction, and the contents of sand, silt, and clay were calculated using the United States Department of Agriculture (USDA) soil texture classification system [22].
Although there is a one-year interval between the ground sampling (April 2021) and the ZY1-02E imagery acquisition (April 2022), the utilization of this dataset for cross-sensor validation is scientifically robust. SOM and soil texture are fundamental soil background properties characterized by relatively slow interannual variation under stable land-use conditions [23]. Extensive long-term dynamic monitoring of the Northeast China Mollisol belt indicates that under continuous conventional cultivation, the interannual depletion of SOM is exceedingly gradual. The relative annual decomposition rate typically ranges between 0.17% and 0.5% per year [24], equating to an absolute change of less than 1.5 g/kg per decade. Similarly, soil texture fractions (sand, silt, and clay) are determined by parent material and long-term weathering, remaining highly stable over short timeframes unless subjected to severe catastrophic erosion events, which were not recorded during this period. Consequently, a single-year interval introduces an absolute variance that is statistically negligible [25]. Furthermore, both the ground sampling and ZY1-02E imaging were conducted during the spring tillage season, i.e., the brief bare-soil window in April, when local meteorological records indicated no significant recent rainfall and similar soil dryness. This ensured comparable surface and soil moisture conditions and effectively minimized temporal uncertainty [26].
Table 2 summarizes the statistical characteristics of soil samples. SOM ranged from 6.00 to 76.61 g/kg, with a mean of 27.53 g/kg and a standard deviation of 13.70 g/kg, indicating substantial spatial variability across the study area. The particle size fractions also exhibited relatively wide ranges, with sand, silt, and clay contents varying from 5.10% to 84.80%, 6.75% to 74.10%, and 7.53% to 48.40%, respectively. The coefficients of variation were 0.50 for SOM, 0.59 for sand, 0.40 for silt, and 0.39 for clay, suggesting moderate to relatively high variability among the sampled soils. Before model development, soil sampling points were screened by selecting bare-soil pixels to ensure consistency between ground observations and hyperspectral satellite imagery. The remaining samples were then divided into calibration and validation sets at a ratio of 3:1 in order to preserve the variability of soil properties and to enable accurate evaluation of model performance.

2.3. Methodology

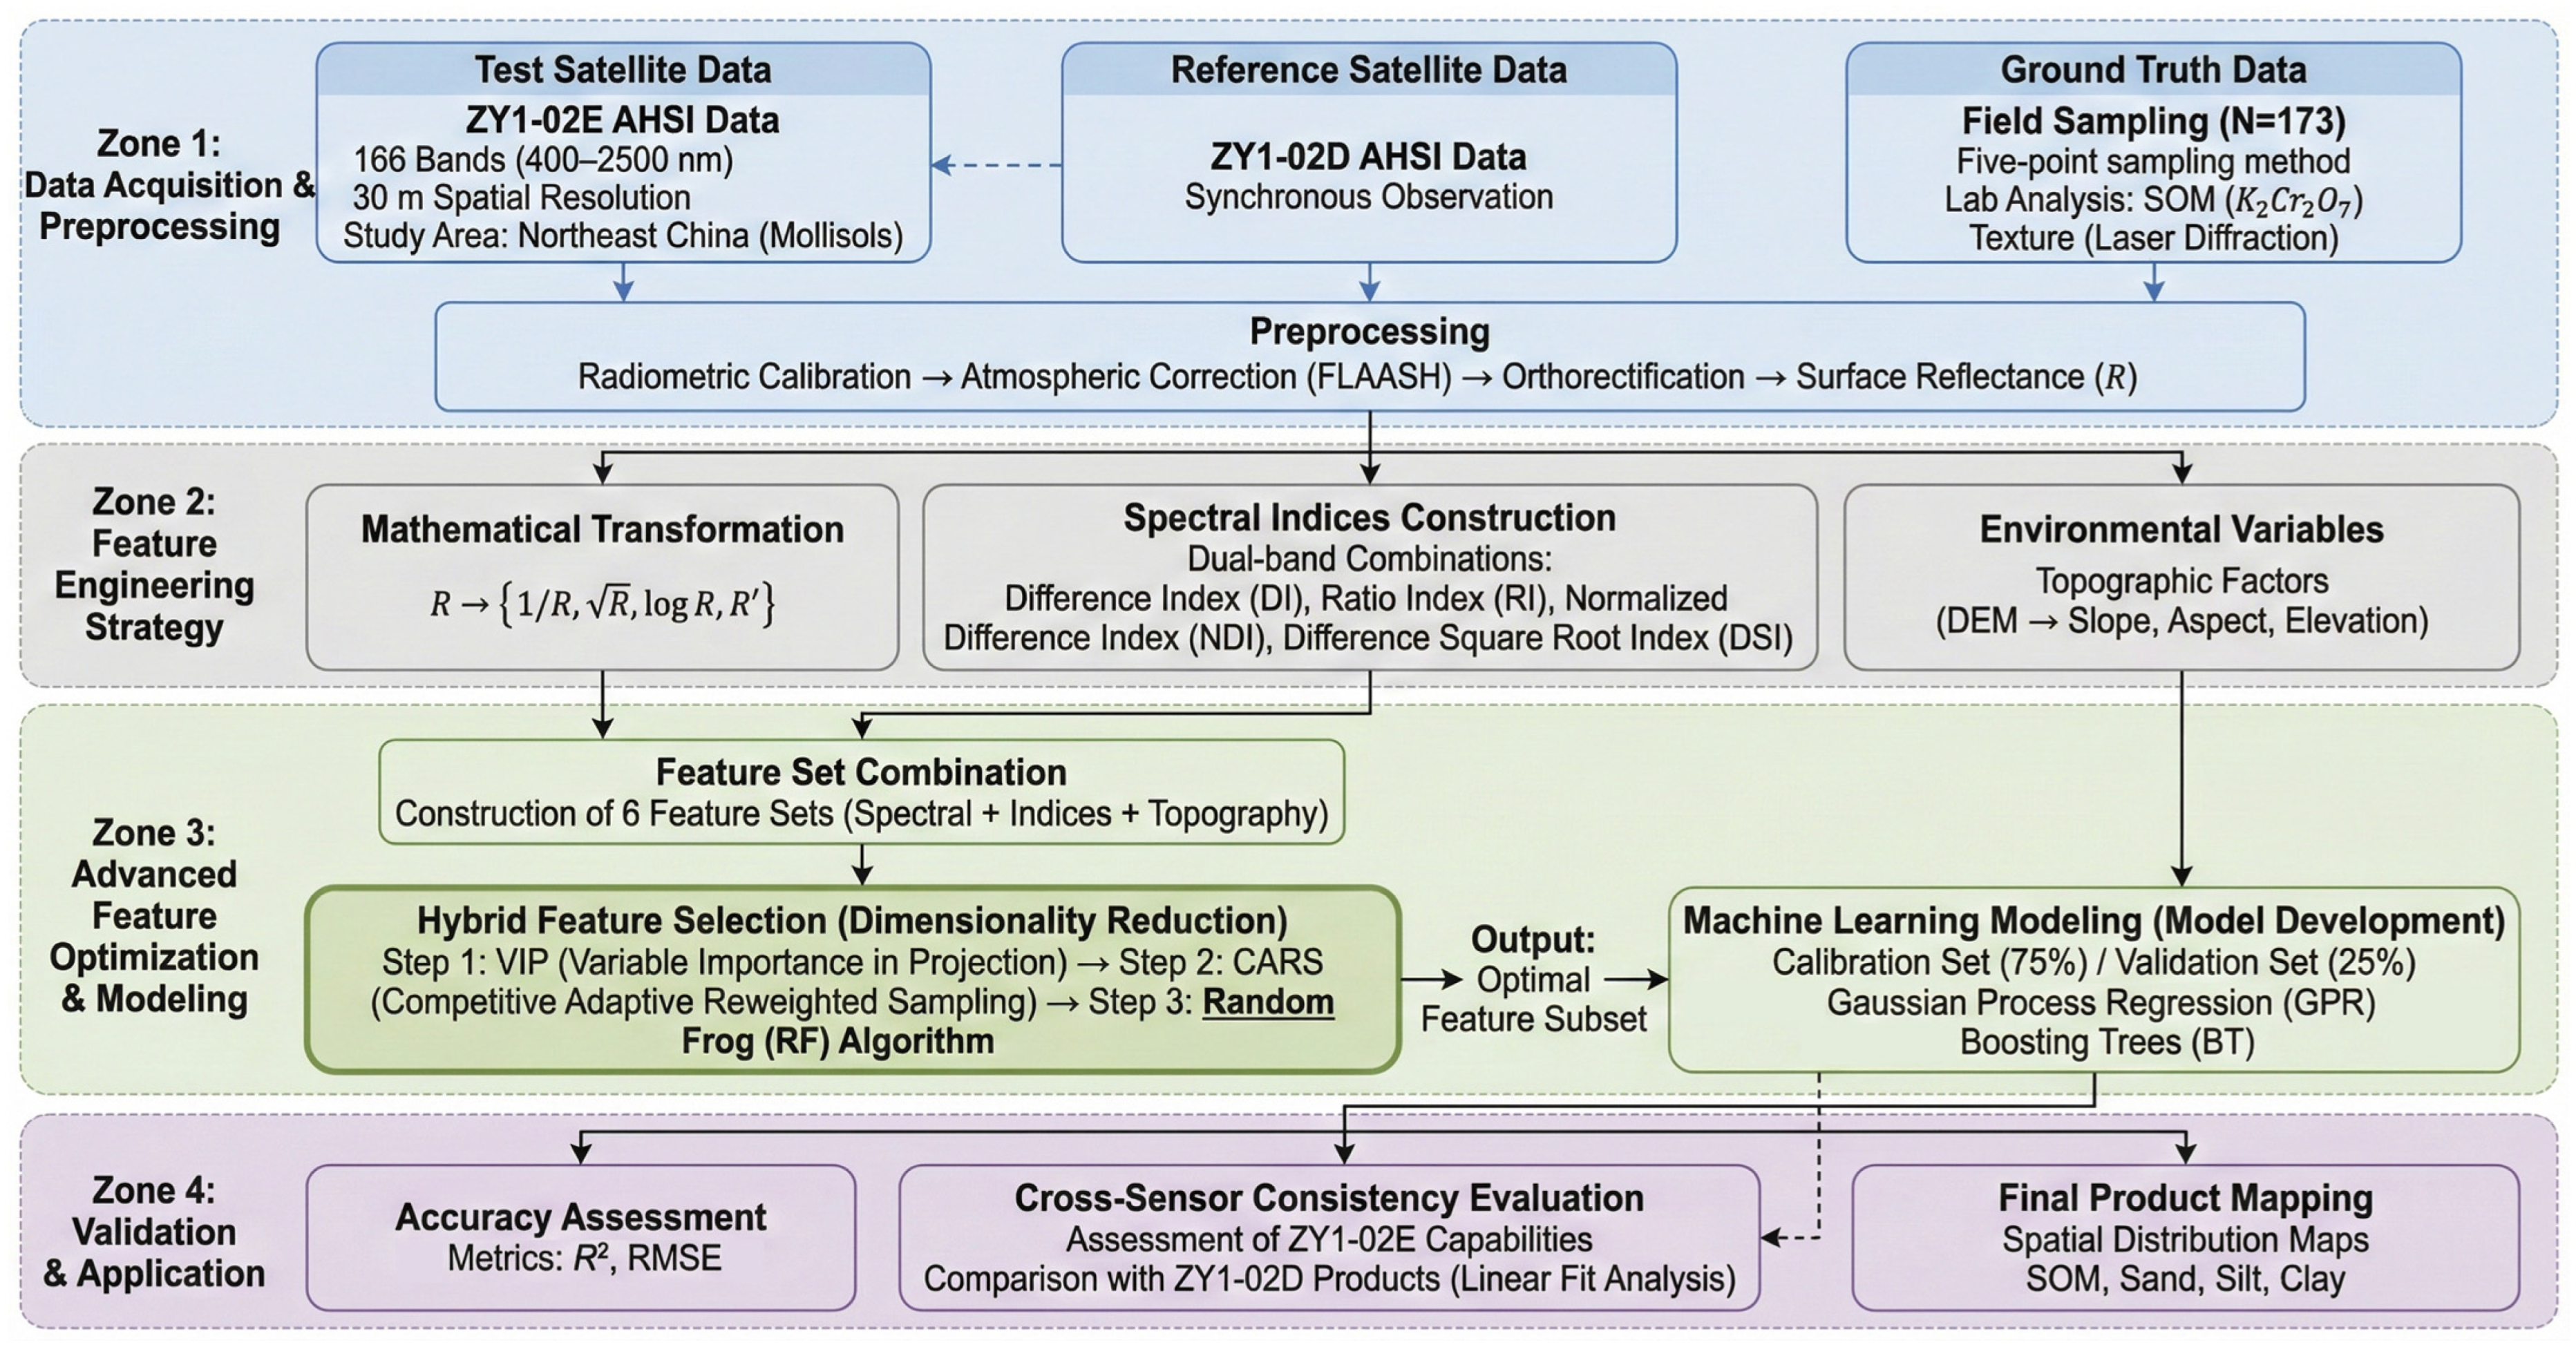
The core methodological framework of this study involves applying the optimal spectral indices and quantitative inversion models—originally developed and rigorously validated using the ZY1-02D synchronous dataset—to the newly acquired ZY1-02E data. This approach allows us to scientifically assess the cross-sensor consistency and retrieval capability of the new satellite payload. The overall methodological workflow is illustrated in Figure 2, highlighting the sequential processes of spectral preprocessing, feature engineering, model training, and cross-sensor validation.
First, AHSI data from both satellites were preprocessed in the same way to generate surface reflectance data. Second, feature datasets were constructed using spectral transformation and dual-band spectral indices construction, topographic factors were extracted using ground truth data. Third, these variables were combined into different feature sets, and a hybrid feature selection method was used to determine the optimal feature subset. Based on the selected features, the machine learning model was calibrated and validated to establish a quantitative relationship between spectral information and soil properties. Finally, the optimal model was applied to ZY1-02E imagery to generate spatial distribution map, cross-sensor consistency was evaluated by comparing mapping results based on ZY1-02E and ZY1-02D.

2.3.1. Construction of Soil Spectral Indices

To amplify the spectral response signals of specific soil properties, we constructed and evaluated various spectral indices for SOM and soil texture fractions (sand, silt, and clay). Initially, the original surface reflectance ( R ) extracted from the ZY1-02D images was transformed into four mathematical forms—Reciprocal ( 1 / R ), Square Root ( R ), Logarithm ( log R ), and First Derivative ( R )—to suppress background noise and enhance characteristic absorption features.
Based on these transformed spectra, all possible two-band combinations across the 400–2500 nm range were exhaustively calculated, resulting in a comprehensive spectral index matrix for each soil parameter. We employed four classic two-band mathematical forms to construct the candidate spectral indices: Difference Index (DI), Ratio Index (RI), Normalized Difference Index (NDI), and Difference Square Root Index (DSI). The specific calculation formulas for these four index types are detailed in Table 3.
Pearson correlation coefficients between the candidate spectral indices and the measured SOM, sand, silt, and clay contents were calculated. The optimal spectral indices were selected based on (1) the highest Pearson correlation coefficient with laboratory-measured soil parameters, (2) statistical significance at p < 0.01, and (3) stability across multiple random subsampling tests to avoid overfitting. Through these steps, the most representative and robust spectral indices for SOM and soil texture fractions were determined, thereby establishing the spectral-index set for subsequent inversion modeling [27]. The finalized formulas for the selected optimal spectral indices are presented in Table 4.
The sensitive bands of the optimal indices were primarily concentrated in the visible to near-infrared region, in broad agreement with the established spectral response mechanisms of SOM and soil texture. Increasing SOM generally darkens the soil surface and decreases reflectance because of the broadband absorption properties of humic substances [28]. In this context, the 560 and 600 nm band combination effectively captures the reflectance decline associated with SOM [29]. In addition, this combination avoids strong absorption interference from iron oxides in the SWIR region, thereby enhancing SOM sensitivity [30].
The spectral responses of soil texture fractions differ markedly according to particle size and composition. Sand, characterized by relatively coarse particles, is mainly governed by particle scattering, surface roughness, and soil brightness. Therefore, it typically exhibits higher reflectance and steeper spectral slopes. Accordingly, the 740 and 525 nm band combination is well suited to representing the broad scattering characteristics associated with sand [31]. By contrast, clay consists of finer particles with strong capacities for water and metal-ion adsorption, and its spectral response is closely linked to mineral composition and hydroxyl-related absorption features. This explains the strong physical significance of the 580 and 735 nm band combination for clay detection [32]. The spectral characteristics of silt are jointly influenced by soil color, aggregate condition, and particle-size mixing ratios. It is therefore commonly manifested as subtle spectral gradient variations in the visible region, which are better captured by normalized difference spectral indices [33].

2.3.2. Quantitative Inversion Modeling Strategy

For the quantitative retrieval of soil parameters, we adopted a synergistic inversion strategy that integrates environmental variables with multidimensional spectral features. From an agronomic perspective, micro-topography profoundly drives surface water runoff and soil erosion in the Mollisol belt, thereby significantly influencing the spatial redistribution of SOM and fine soil particles [34]. Therefore, Digital Elevation Model (DEM) derivatives were introduced. Six distinct feature sets were constructed to optimize the model inputs: (1) Spectral Reflectance alone; (2) Parametric Spectral Features (optimal indices); (3) Spectral Reflectance + Parametric Spectral Features; (4) Spectral Reflectance + Topographic Factors (slope, aspect, elevation); (5) Parametric Spectral Features + Topographic Factors; and (6) a comprehensive combination of all three.
To effectively mitigate the “curse of dimensionality” and multicollinearity inherent in the 166-band hyperspectral data, a robust hybrid feature selection technique was employed. A hierarchical feature selection framework was implemented, in which initial dimensionality reduction was performed using Variable Importance in Projection (VIP) [35] and Competitive Adaptive Reweighted Sampling (CARS) [36] to eliminate redundant wavelengths, followed by Random Frog [37,38,39] selection to identify the most informative and stable subset of predictors. The optimal feature subset was determined by dynamically assessing each feature’s contribution to the coefficients of determination ( R 2 ) and Root Mean Square Error (RMSE). Finally, advanced machine learning algorithms were trained using the optimized feature sets. Through comparative evaluation of multiple candidate models (Table S2), Boosting Trees [40] and Gaussian Process Regression (GPR) [41,42,43] were selected as the optimal predictive models for different soil parameters (Table 5). The hyperparameters of both GPR and Boosting Trees were optimized by grid search combined with five-fold cross-validation within the calibration dataset. The final Boosting Trees model for SOM adopted 30 learning cycles, a learning rate of 0.1, and a minimum leaf size of 8. The final GPR models for clay, sand, and silt were configured with a constant basis function, an exponential kernel function, and standardization of predictors (Table S3). These finalized baseline models were subsequently applied directly to the ZY1-02E surface reflectance imagery to map the spatial distribution of SOM and soil texture, enabling the cross-sensor capability evaluation.

3. Results

3.1. Analysis of Soil Spectral Indices

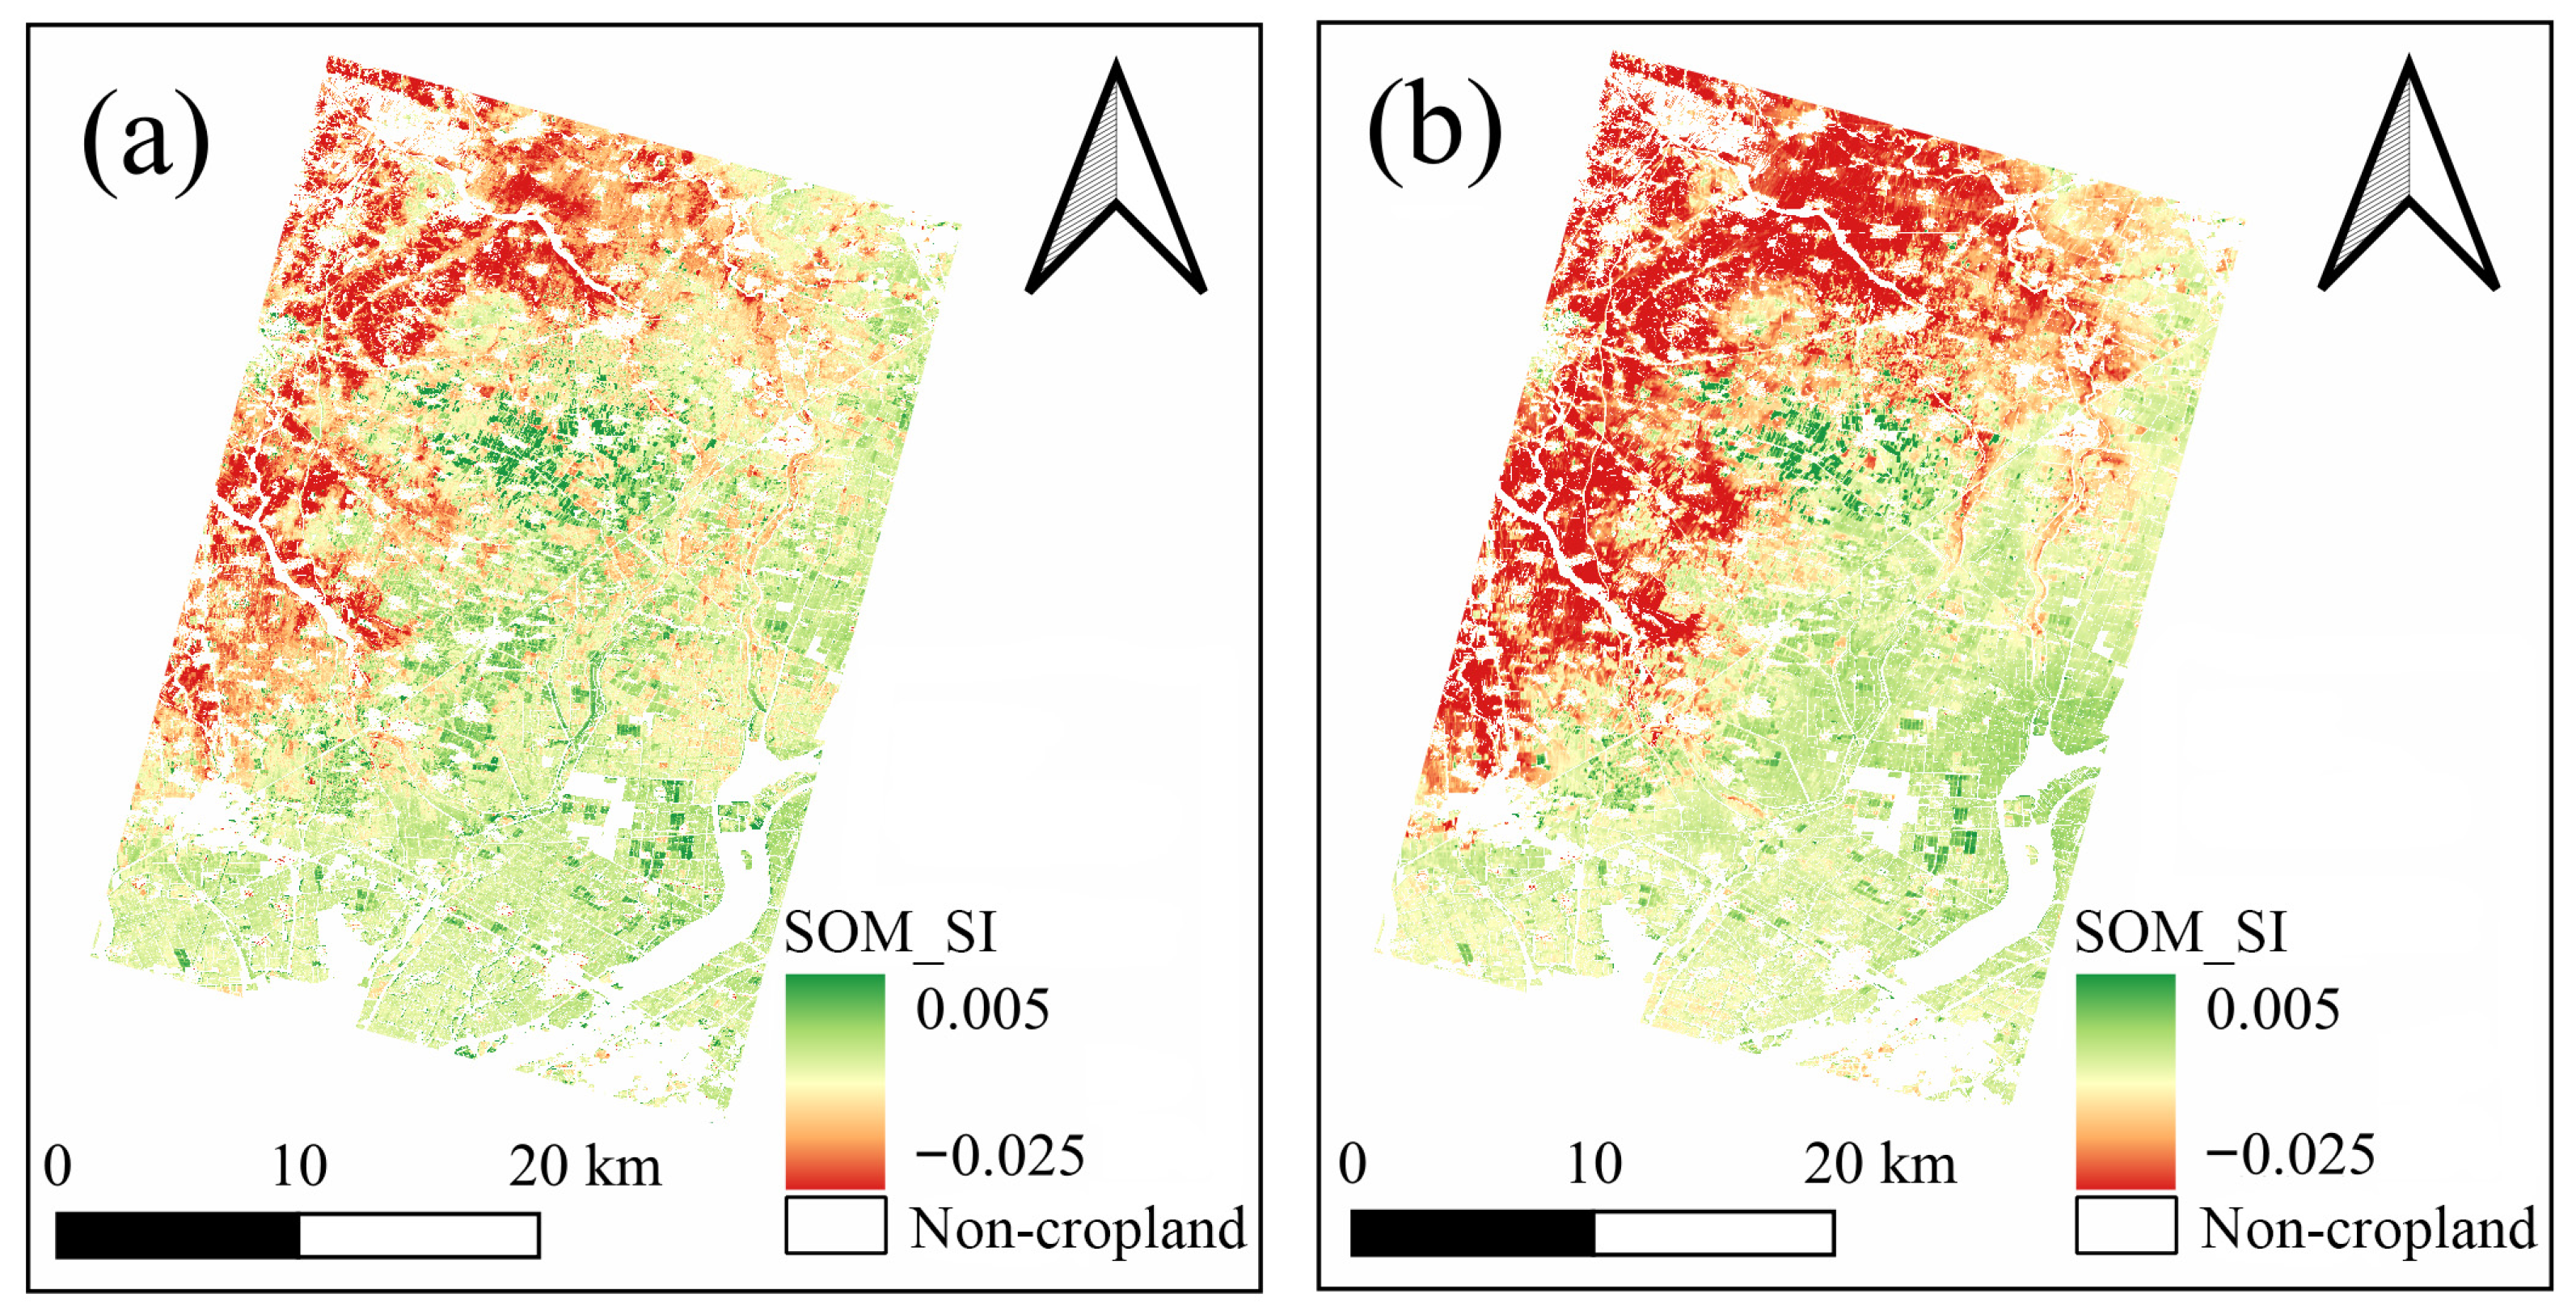
The optimal spectral indices for SOM and soil texture were calculated using ZY1-02E data and compared with those derived from the synchronous ZY1-02D data to assess their spatial consistency. For the SOM spectral index (Figure 3), the results derived from ZY1-02E effectively capture the spatial variation trends within the study area. The index values are predominantly concentrated between −0.025 and 0.005, exhibiting a clear gradient that increases from the northwest to the southeast. This spatial pattern likely reflects the topographic transition and prolonged agricultural practices, where organic matter tends to accumulate in the lower-lying depositional plains in the southeast. A comparative analysis reveals that the ZY1-02E SOM index displays a more distinct hierarchical structure compared to ZY1-02D, with values slightly higher than those of the latter. Overall, the SOM spectral indices calculated from both data sources demonstrate high consistency, supporting their combined use for increasing the frequency of observations in agricultural regions.
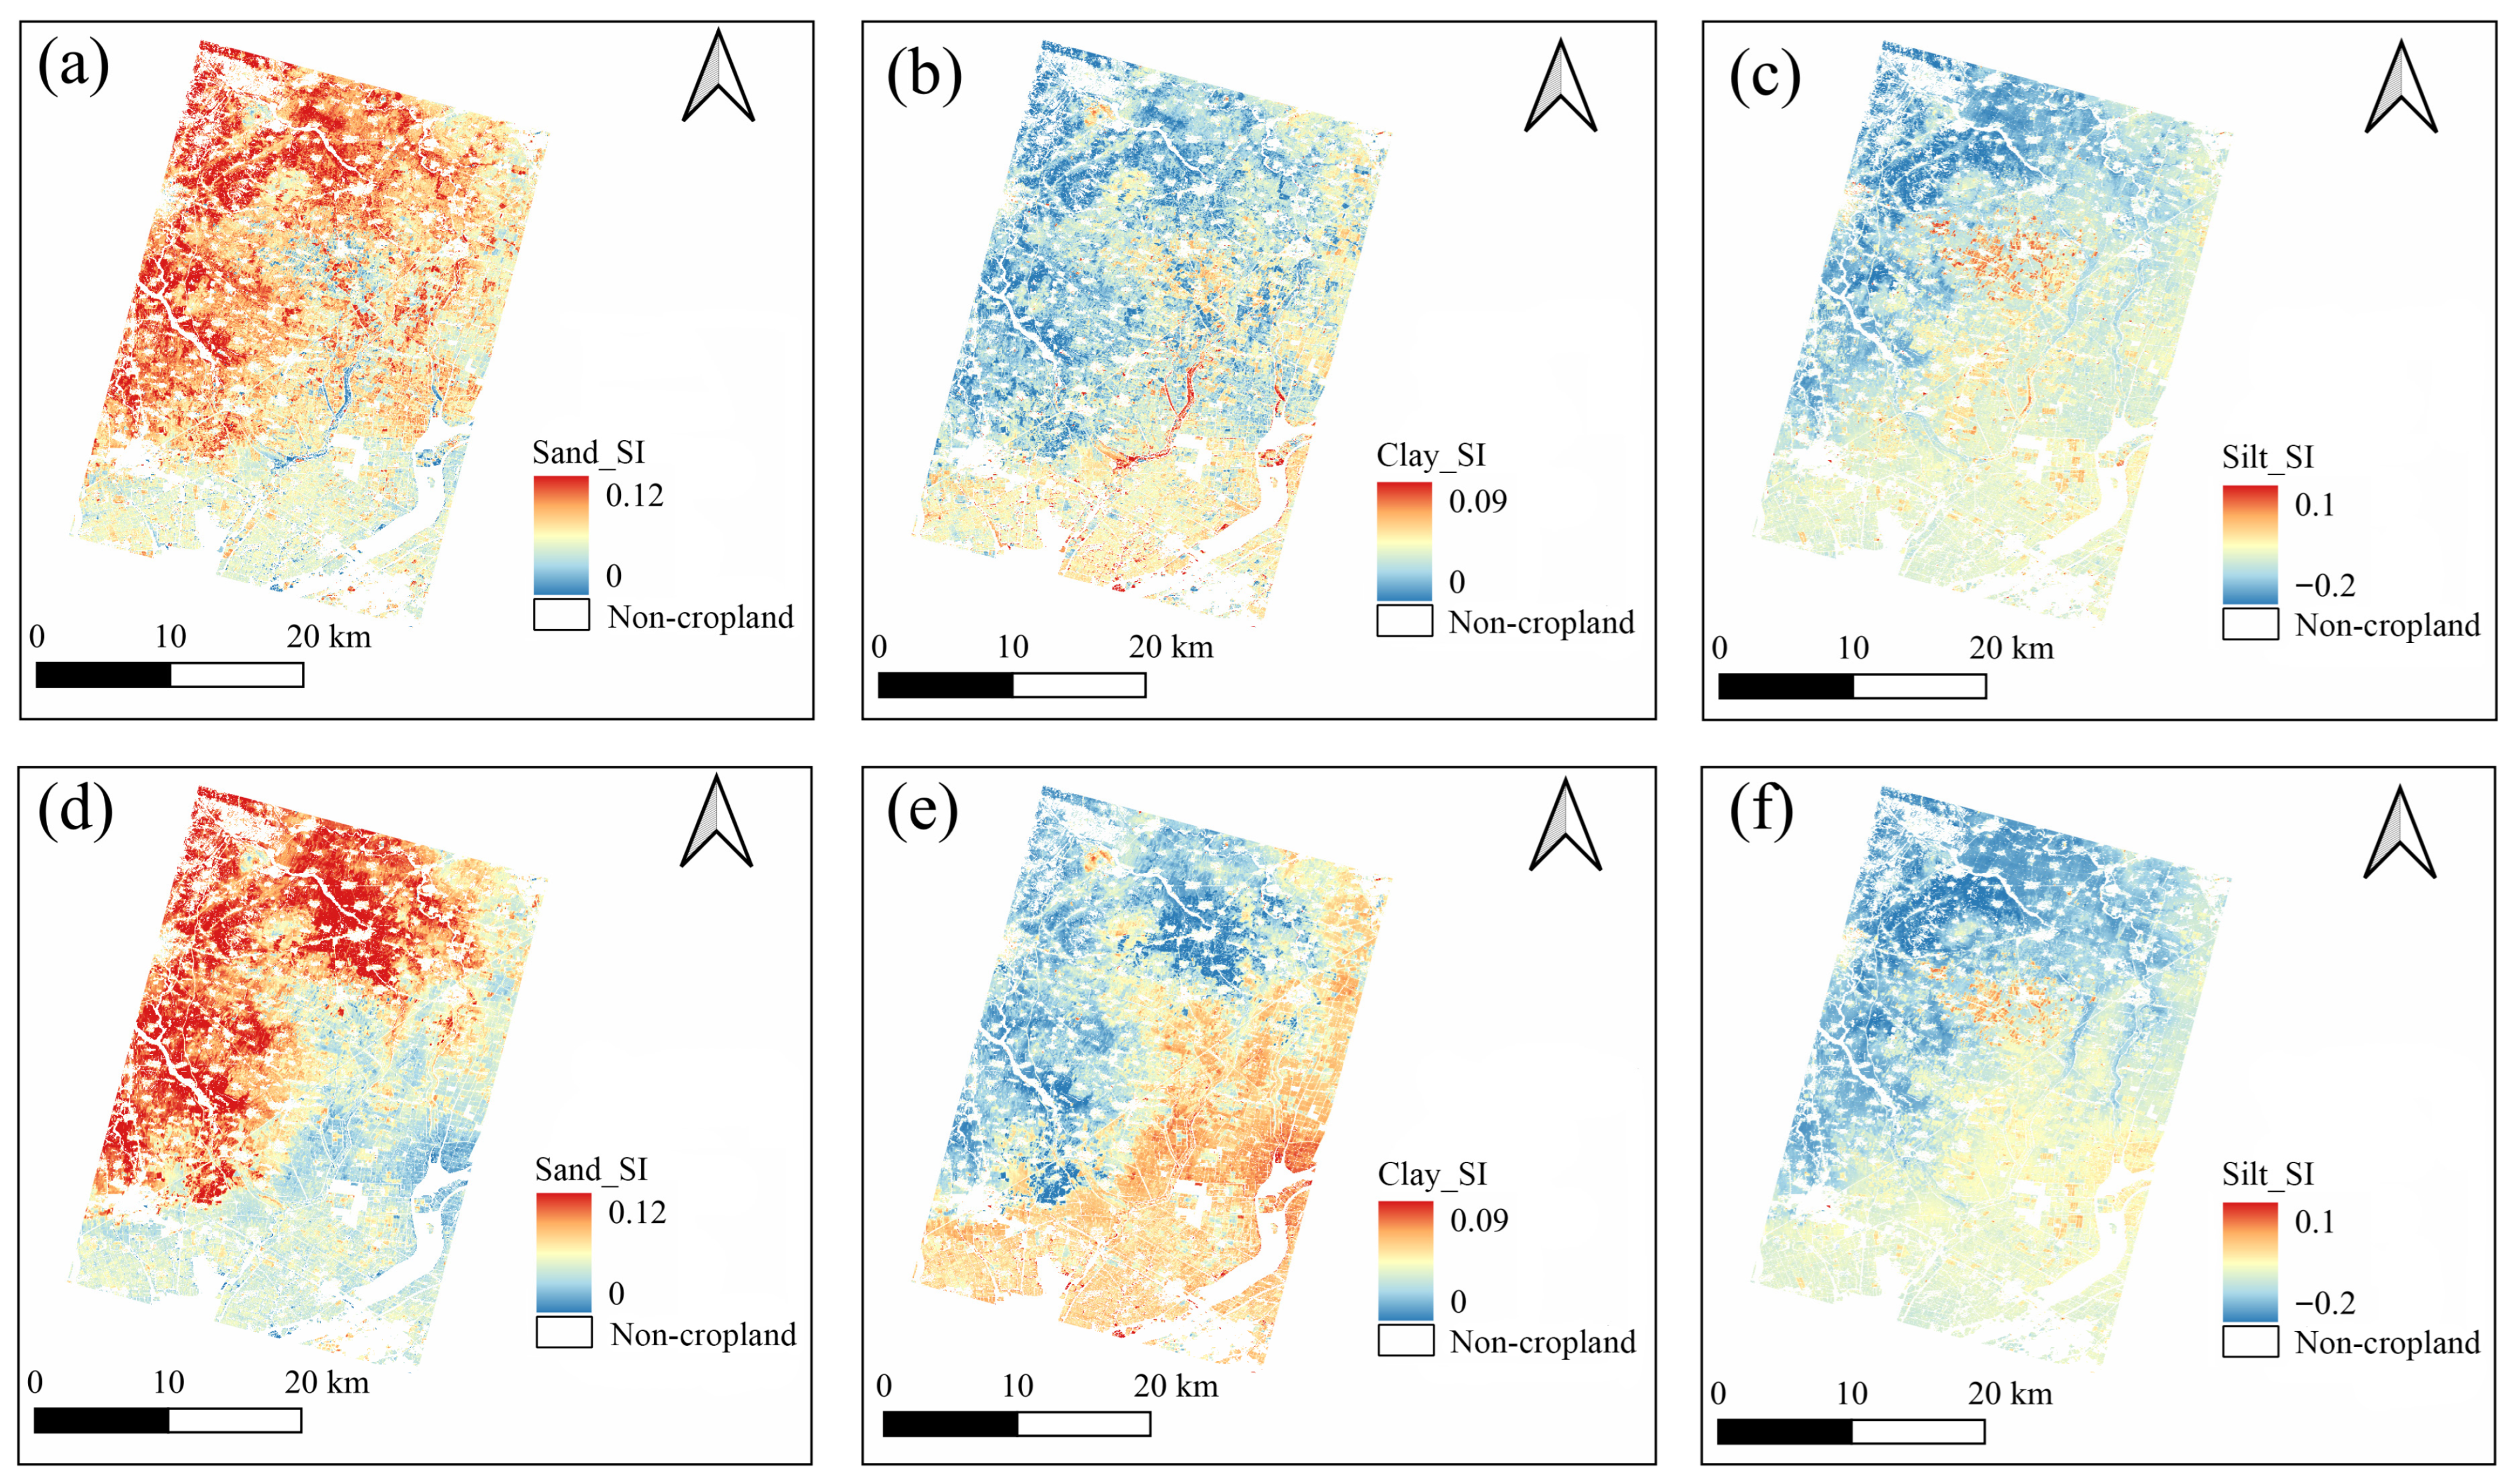
The soil texture spectral indices (sand, clay, and silt) derived from ZY1-02E also accurately reflect the spatial heterogeneity of the cultivated land (Figure 4). All three texture indices clearly delineate numerical differences: the Sand index decreases gradually from northwest to southeast, with most values falling between 0.06 and 0.12; conversely, the Clay and Silt indices increase along the same directional gradient. Specifically, Clay index values are primarily concentrated between 0 and 0.05, while Silt index values range from −0.2 to −0.1. When comparing the two satellites, minor discrepancies are observed in the central region: the ZY1-02E Sand index is marginally higher than that of ZY1-02D, whereas its Clay index is slightly lower. The Silt spectral indices exhibit the highest spatial similarity, with no visually distinct differences between the two sensors.
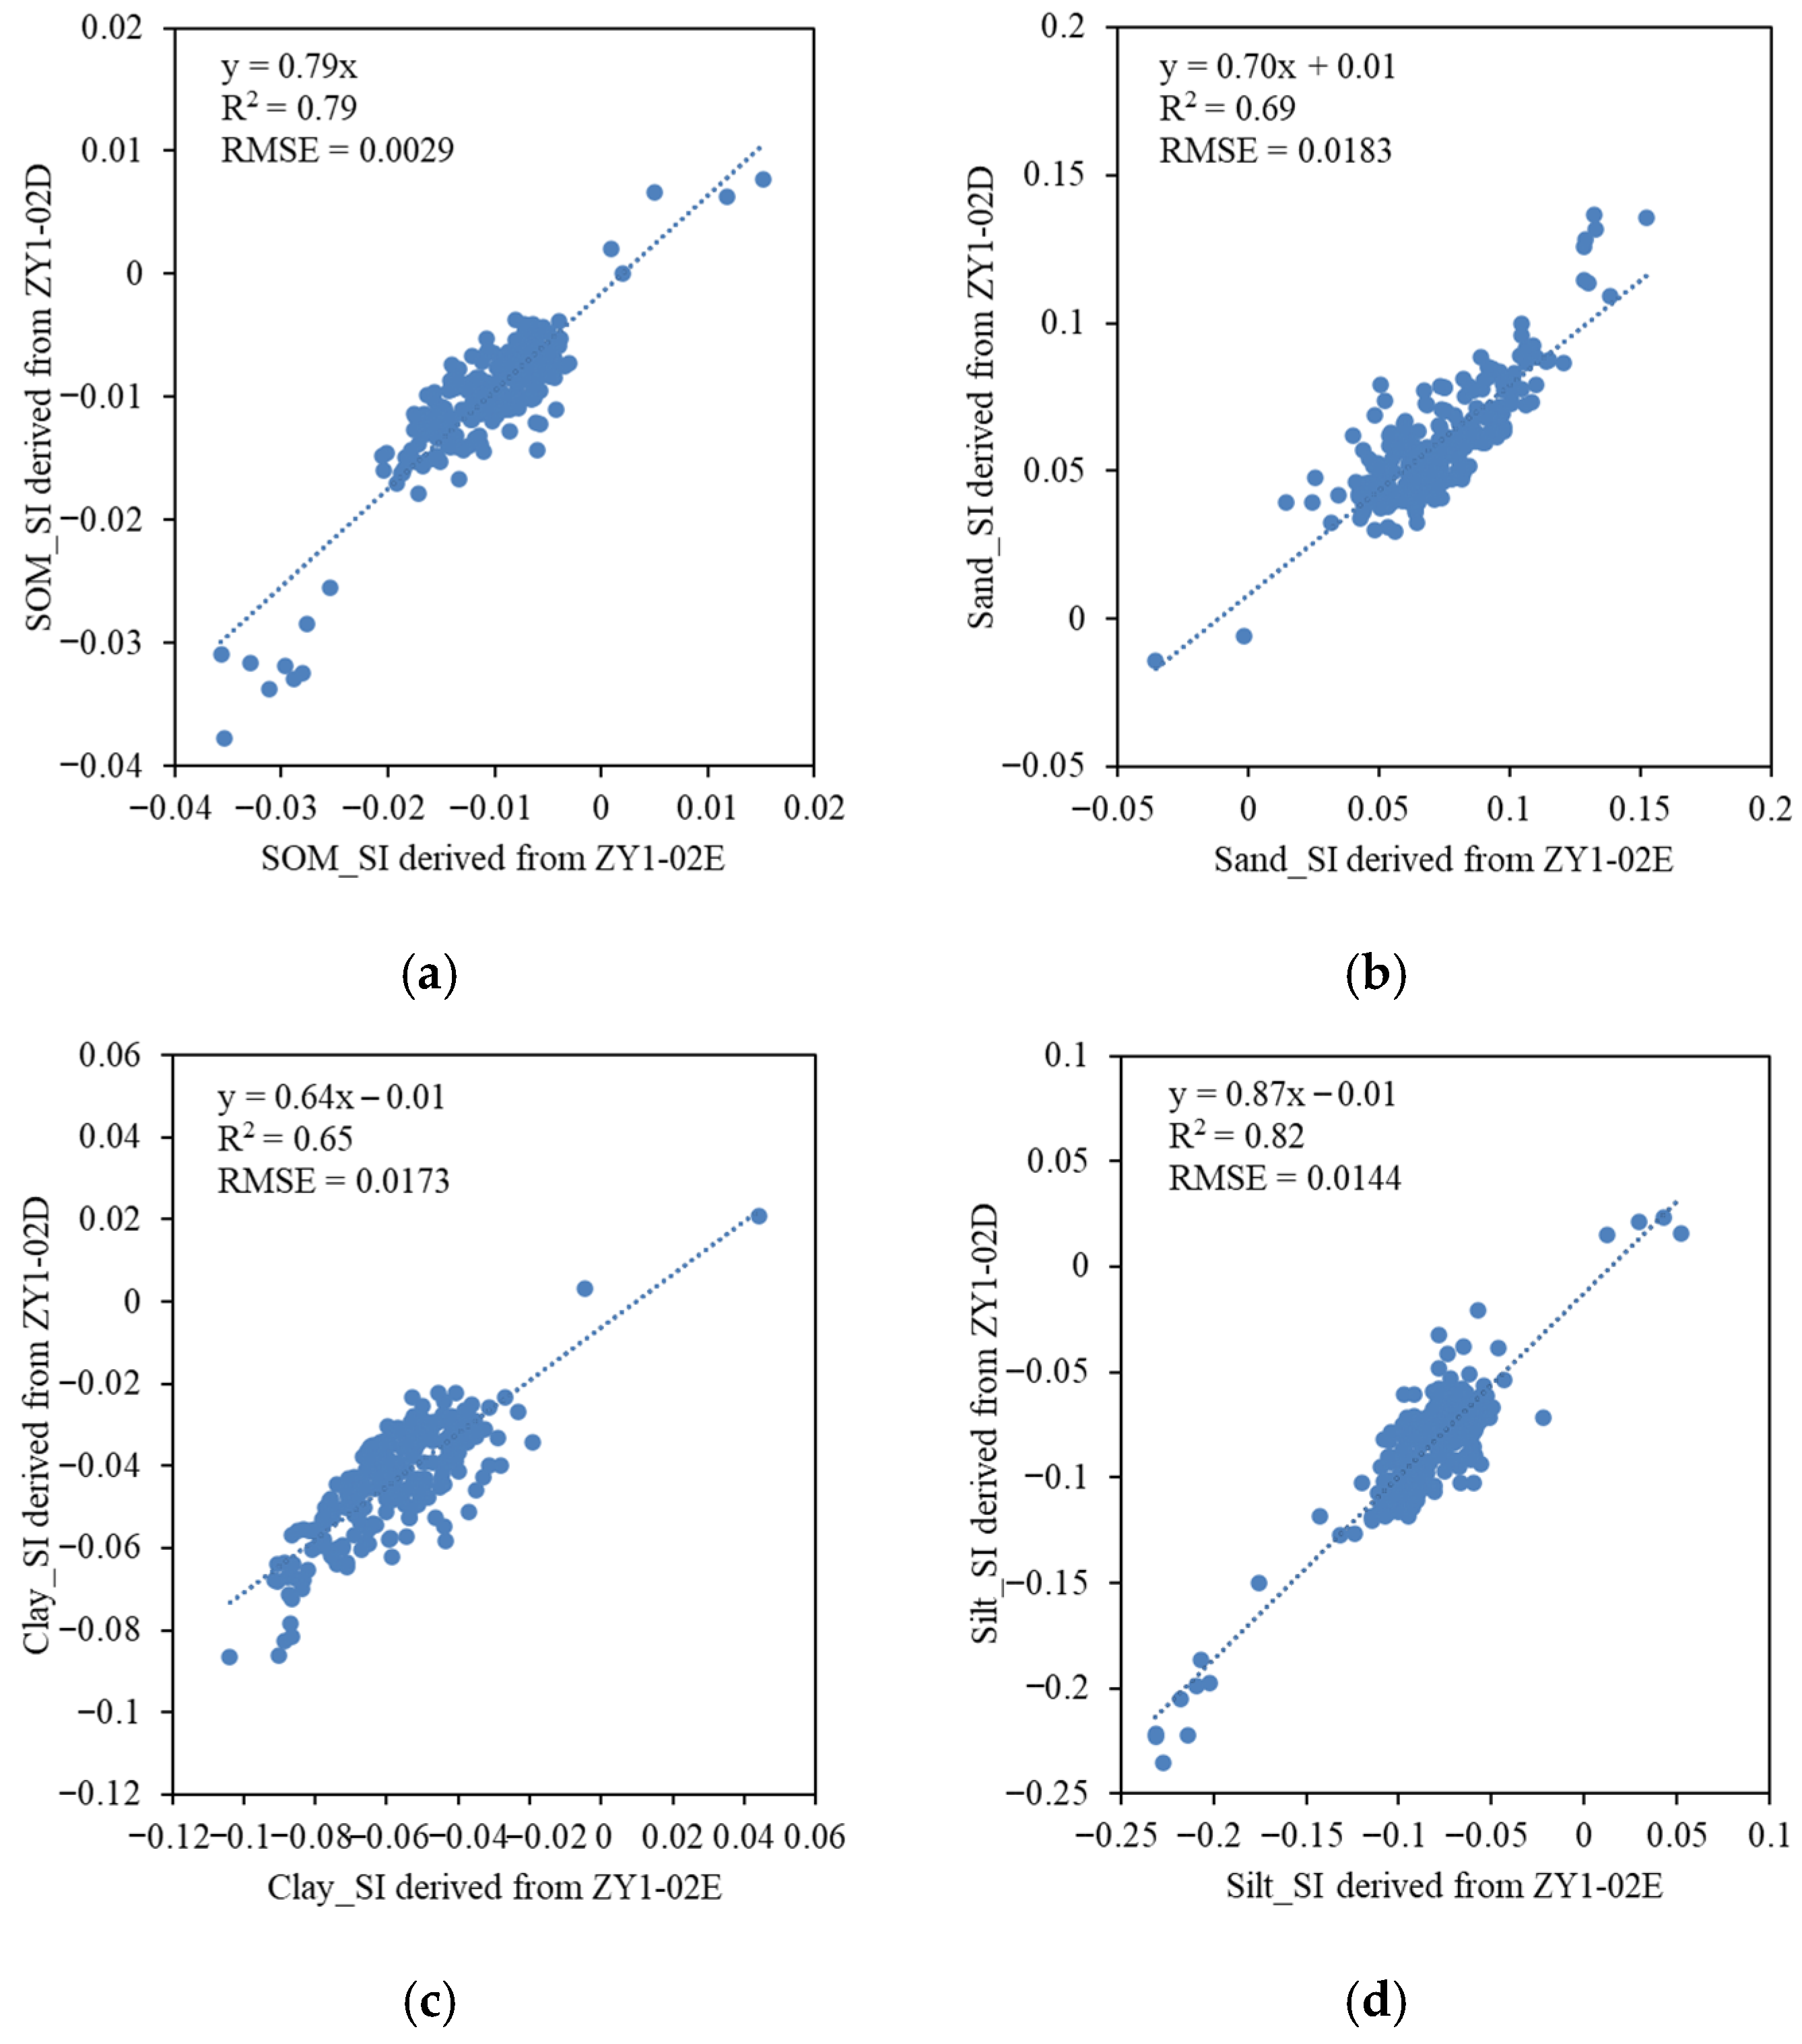
To quantitatively evaluate cross-sensor consistency of the spectral indices, a correlation analysis was conducted using 240 randomly generated bare-soil sample points (Figure 5). All indices exhibited strong linear relationships between ZY1-02E and ZY1-02D, with R2 exceeding 0.65. The SOM and Silt indices demonstrated the highest agreement (R2 = 0.79 and 0.82, respectively), while Sand and Clay indices showed slightly lower but still robust correlations (R2 = 0.69 and 0.65). In addition to correlation strength, the RMSE values further confirmed cross-sensor stability. The RMSE for SOM_SI, Silt_SI, Sand_SI, and Clay_SI were 0.0029, 0.0144, 0.0183, and 0.0173, respectively.
The point-cluster pattern observed in Figure 5 reflects the spatial heterogeneity and local autocorrelation of soil properties within the study area [44,45]. Differences in historical land management units and microtopographic environments may have led to relatively independent soil subgroups, such as organic-rich sedimentary lowlands versus highly eroded backslope areas [46]. Consequently, many samples cluster within a few limited numerical intervals, forming an aggregated distribution in the scatter plot. Given the low RMSE values, this pattern further suggests minimal systematic deviation and strong radiometric consistency between the two hyperspectral sensors.

3.2. Inversion of Key Soil Parameters

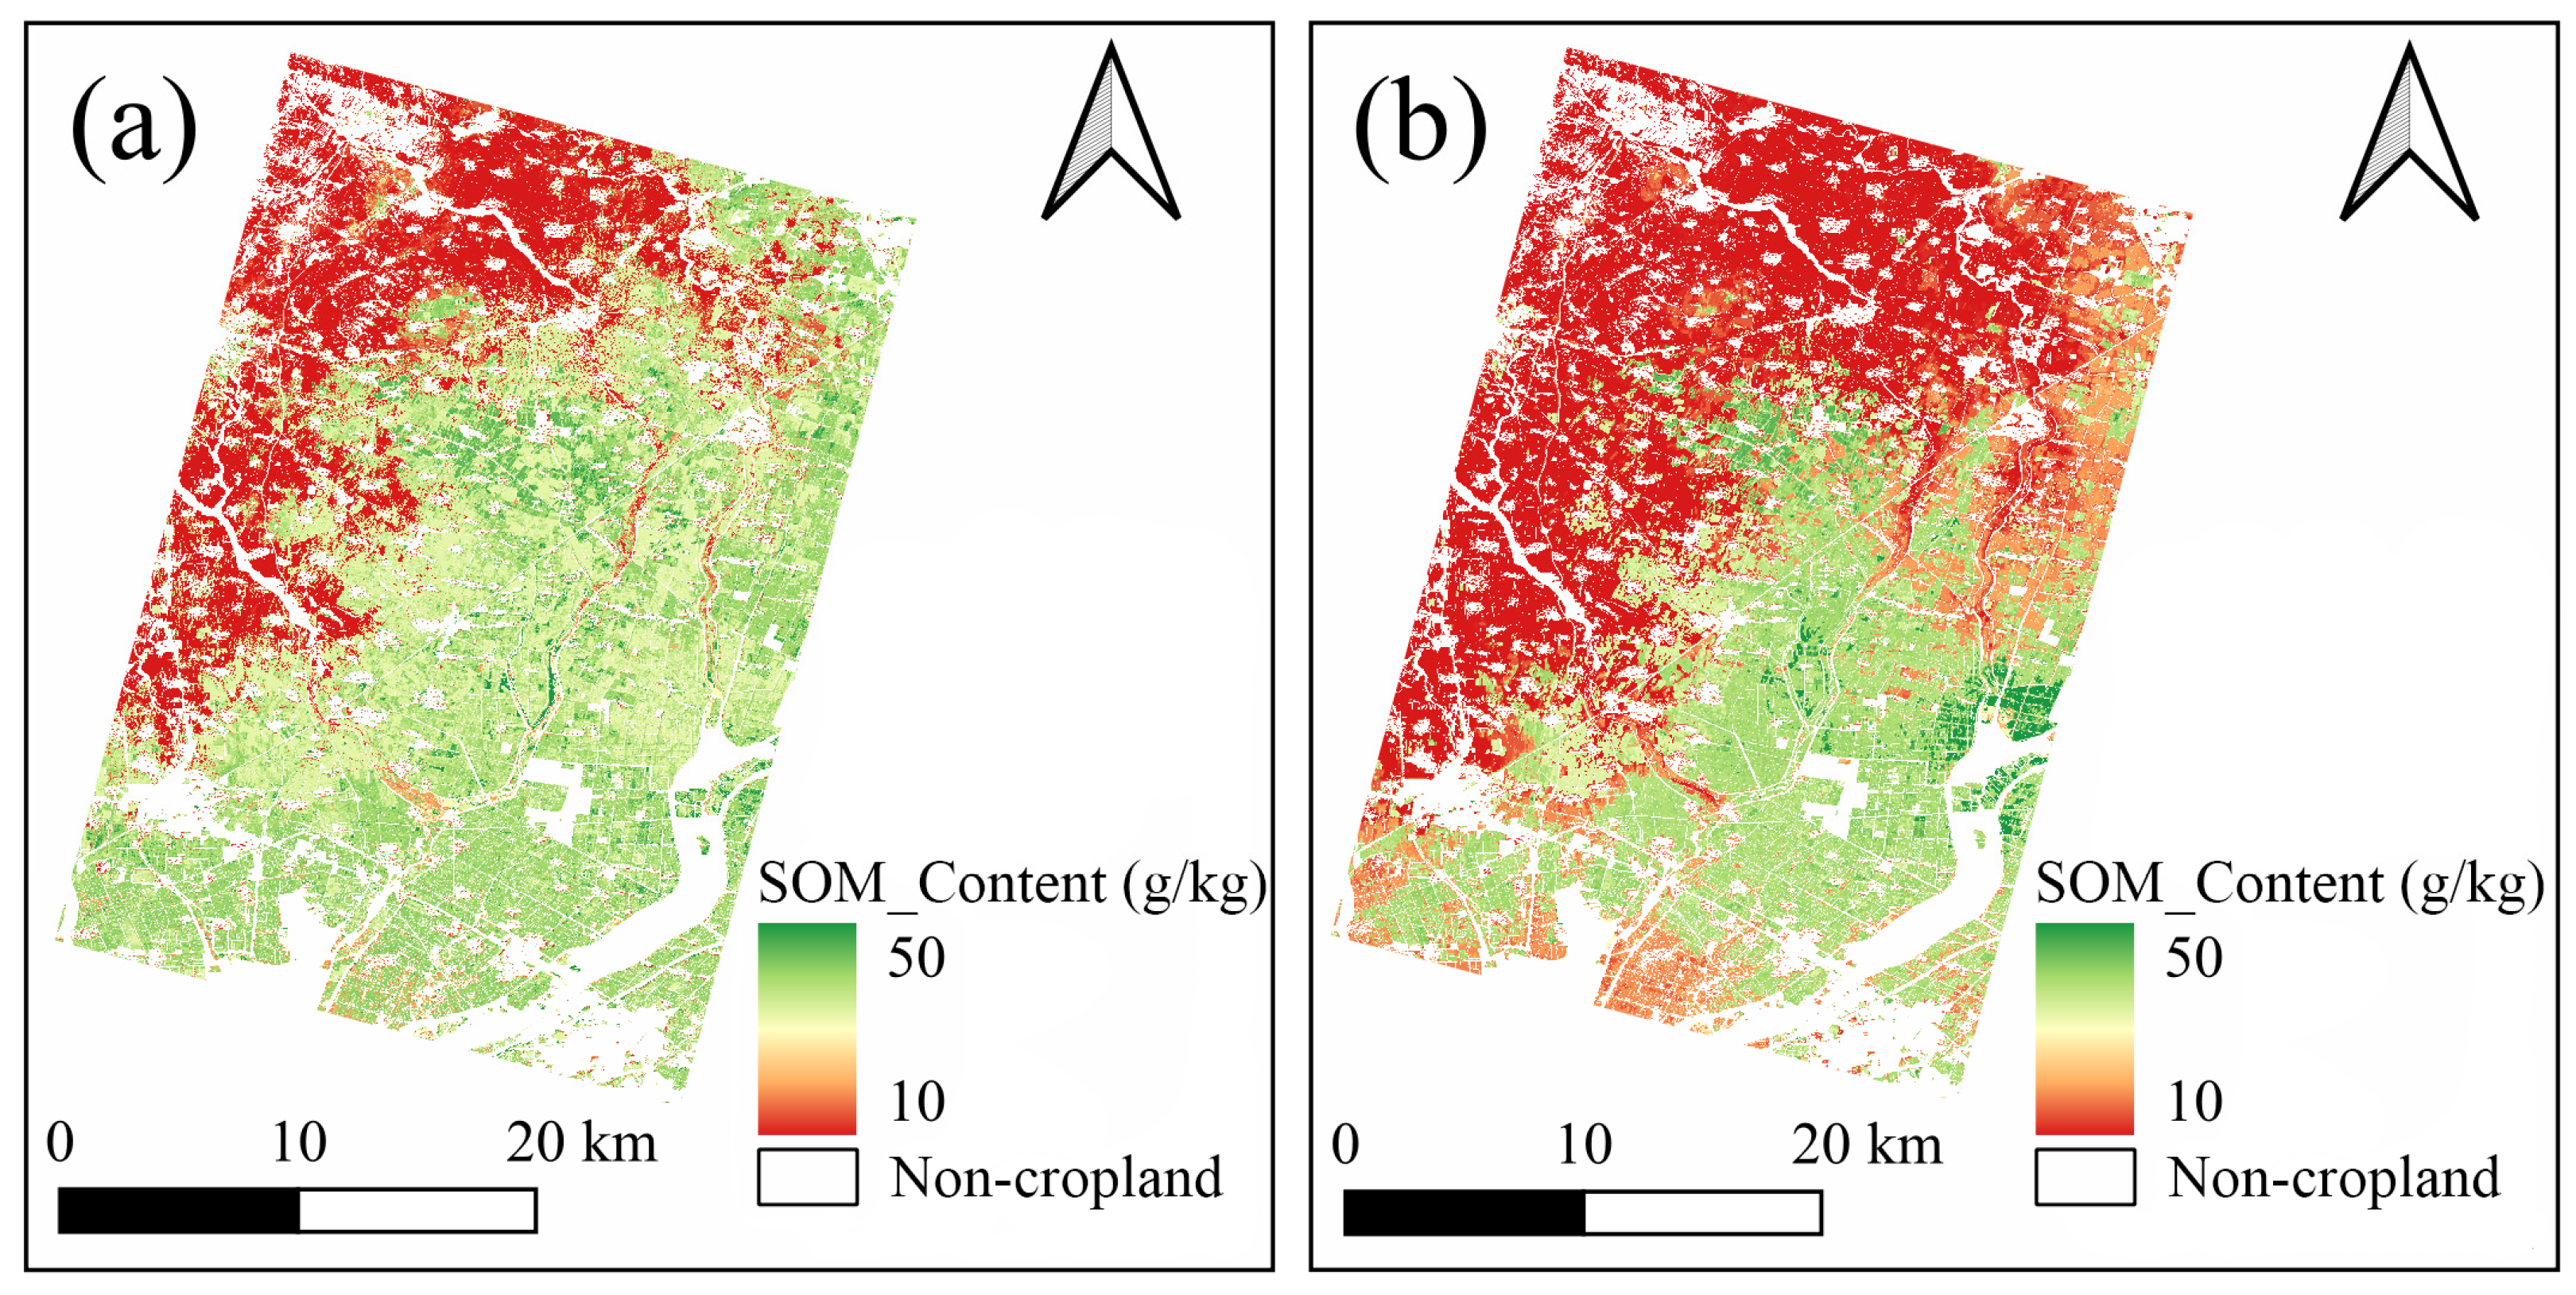
The trained machine learning inversion models for SOM and soil texture were applied to both ZY1-02E and ZY1-02D surface reflectance datasets to generate high-resolution content distribution maps. Regarding SOM content (Figure 6), the retrieval results from ZY1-02E clearly delineate spatial differentiation, showing significantly lower values in the northwest (<30 g/kg) and higher values in the southeast (>40 g/kg). From an agronomic perspective, the >40 g/kg zones indicate highly fertile Mollisols ideal for intensive cropping, whereas the <30 g/kg zones highlight areas that may require targeted organic fertilizer application and conservation tillage. Although a detailed comparison shows that ZY1-02E retrieval values are generally slightly higher than those of ZY1-02D in the southwestern and northeastern parts of the study area, the overall spatial distribution trends are highly consistent. This confirms that ZY1-02E data can effectively characterize the spatial patterns of organic matter.
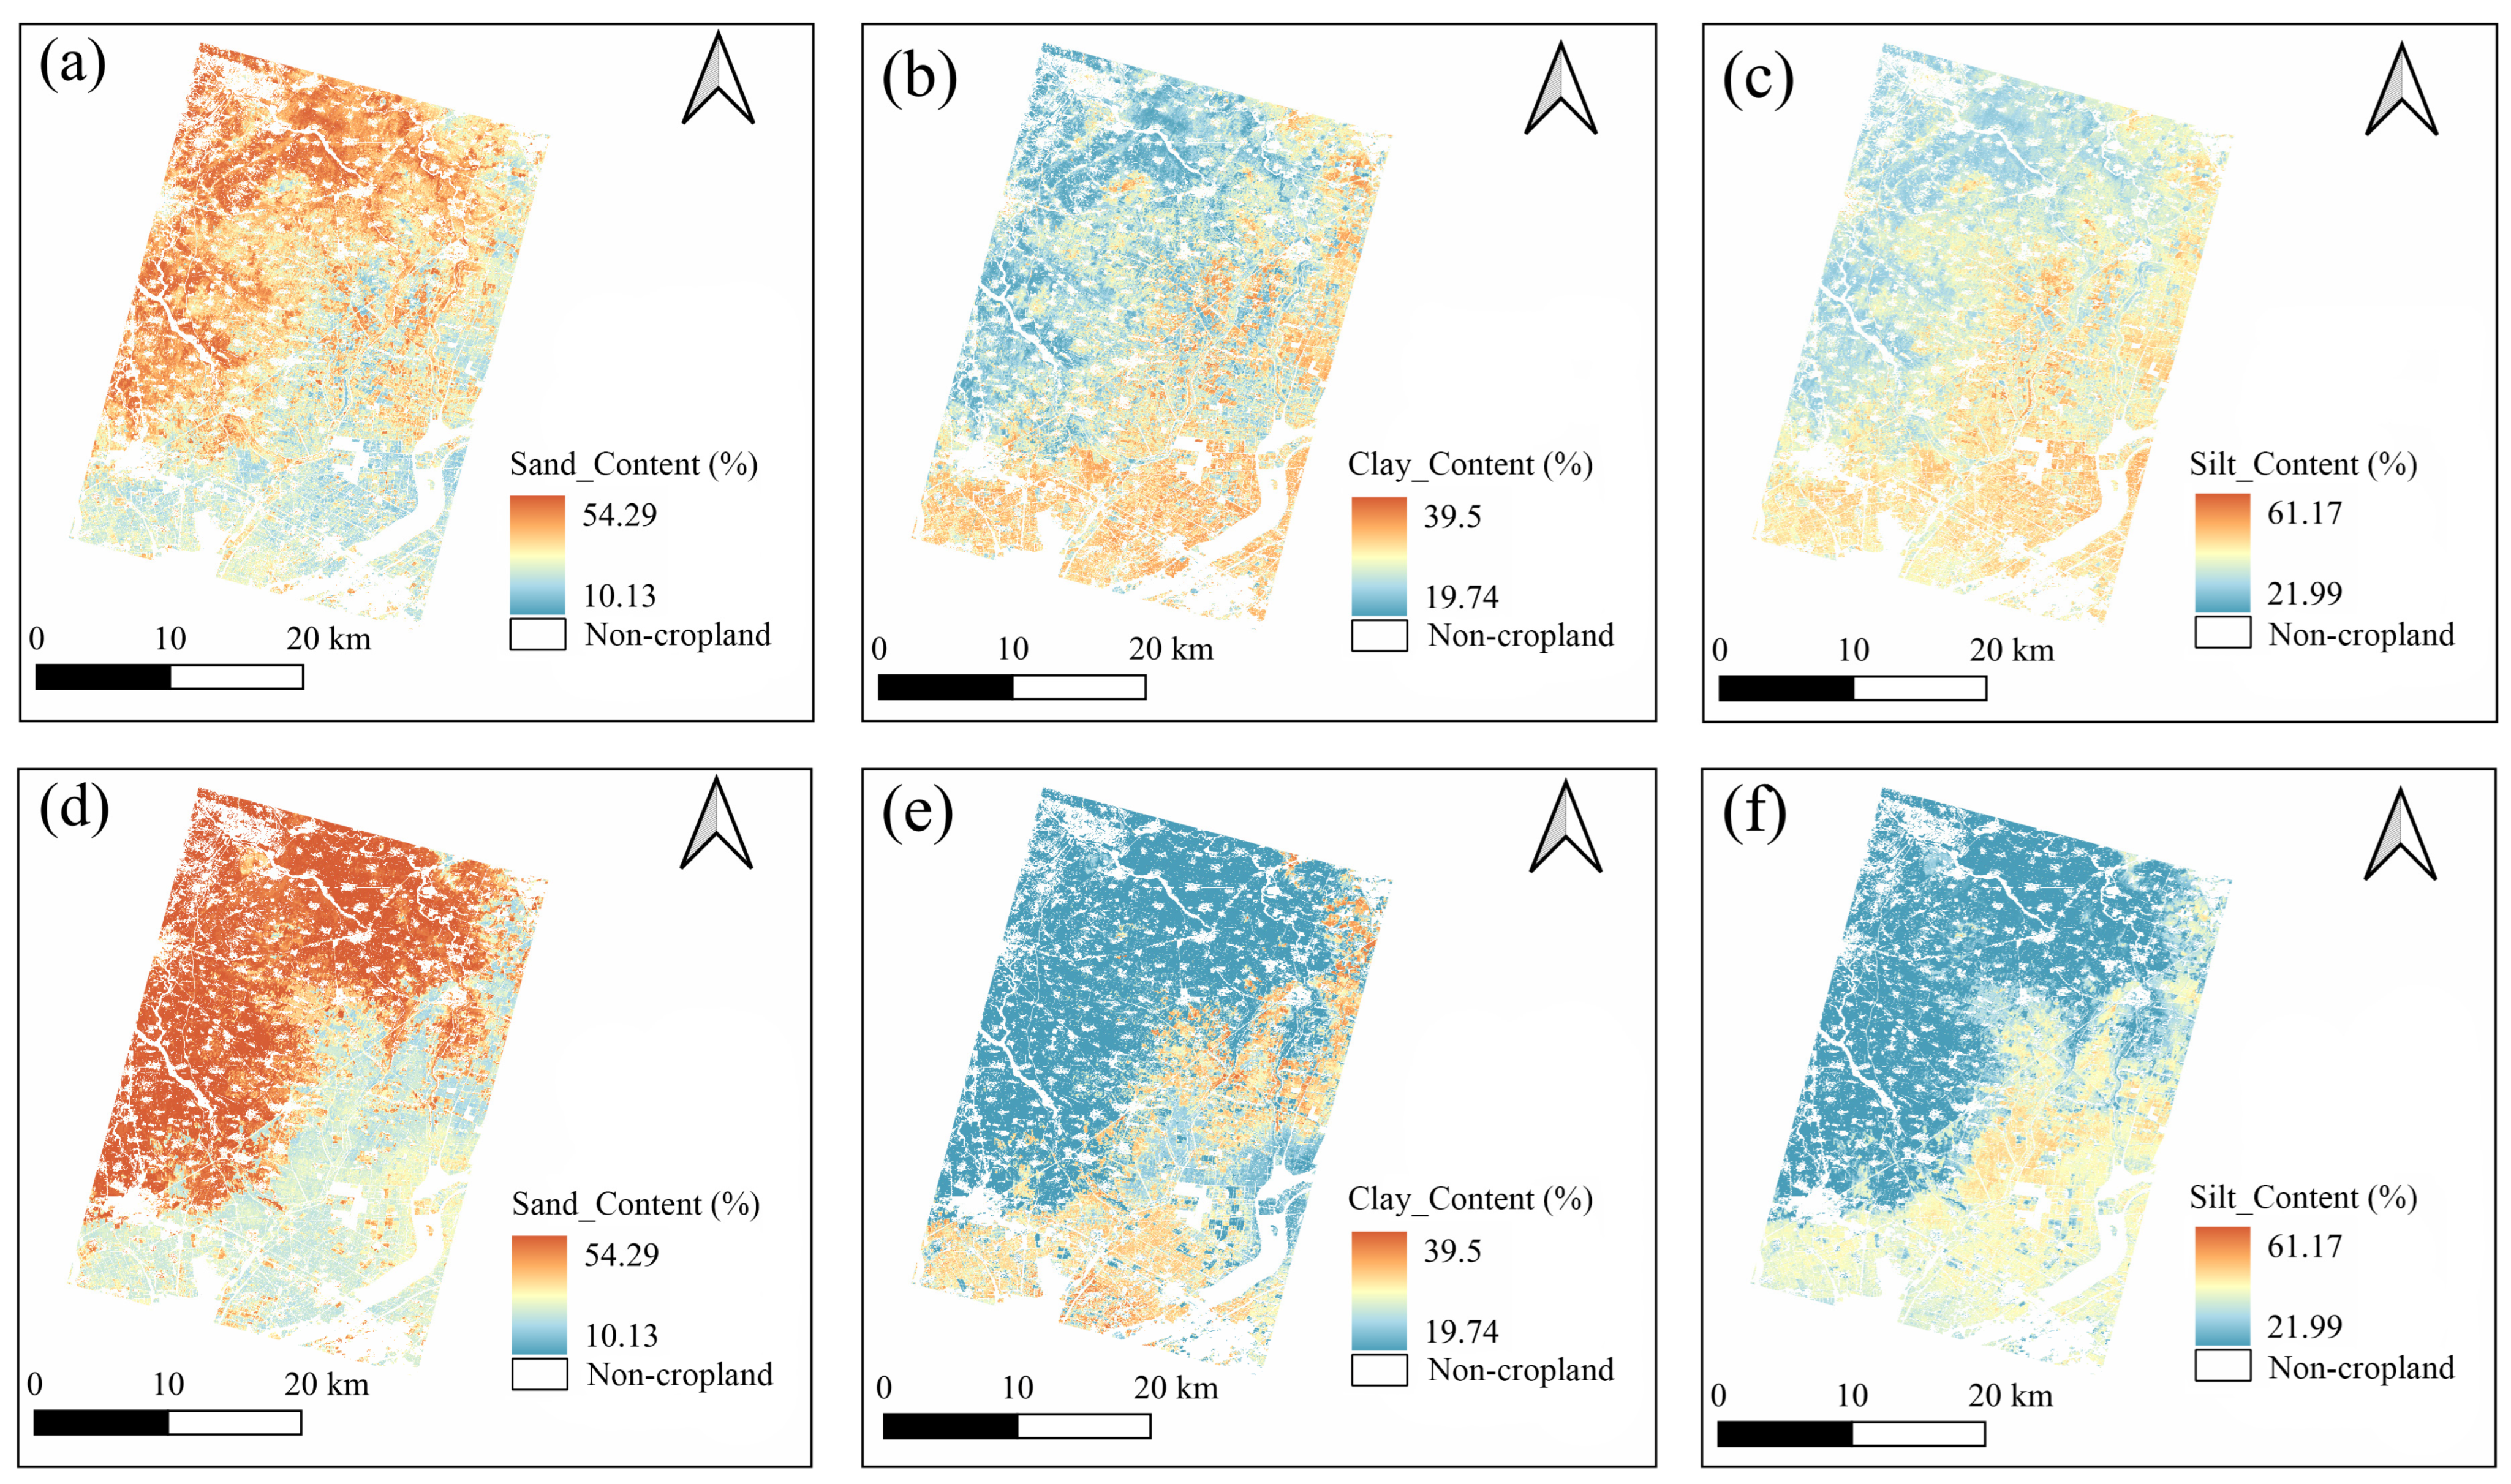
For soil texture content (Figure 7), the ZY1-02E inversion results effectively reflect the spatial variations in the three particle size fractions. The study area exhibits a general trend where soil texture transitions from coarse to fine from northwest to southeast. The northwestern region is dominated by sand particles (>40%), with clay and silt contents mostly remaining below 30%. This higher sand fraction implies lower water retention capacity, making these areas potentially more susceptible to spring droughts. In contrast, the southeastern region is characterized by higher clay (30–40%) and silt (35–60%) contents, with sand content typically falling below 30%, which provides favorable hydraulic conditions for local paddy rice cultivation. Comparing the retrieval results of the two satellites, the ZY1-02E data yields richer detailed information, although its value distribution range is slightly narrower than that of ZY1-02D. Despite these minor differences, the spatial distribution characteristics remain highly consistent.
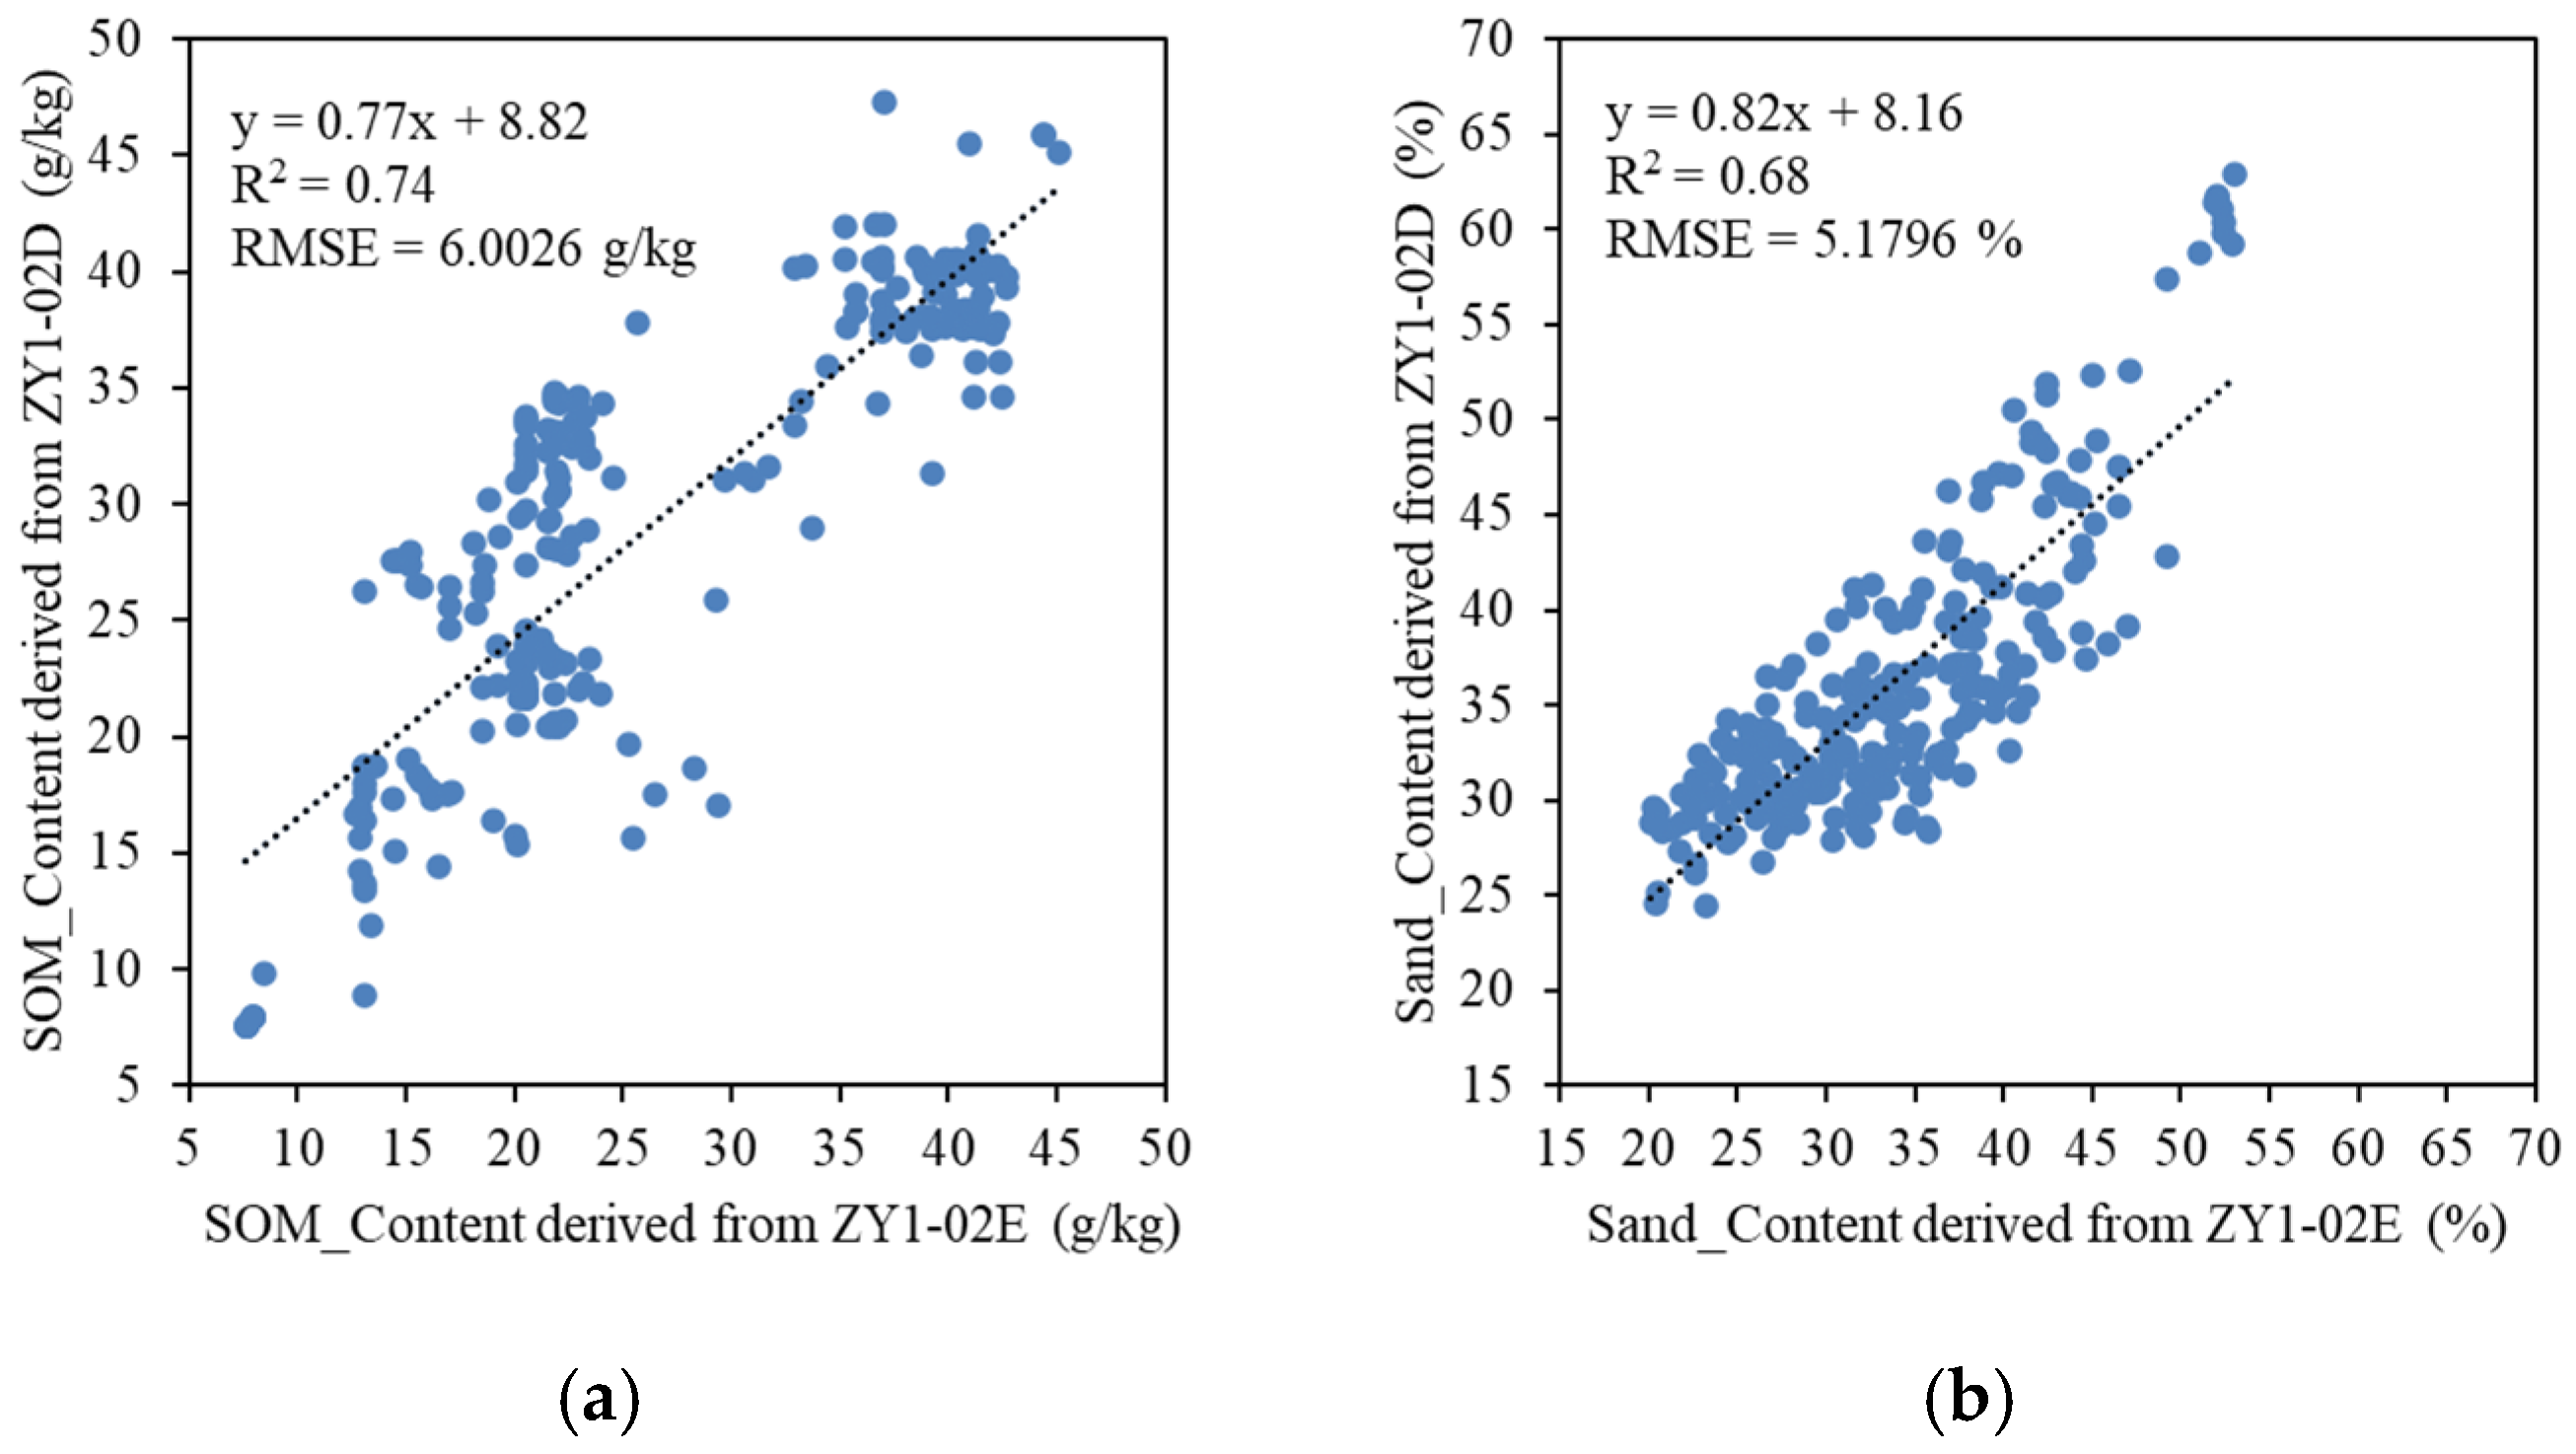
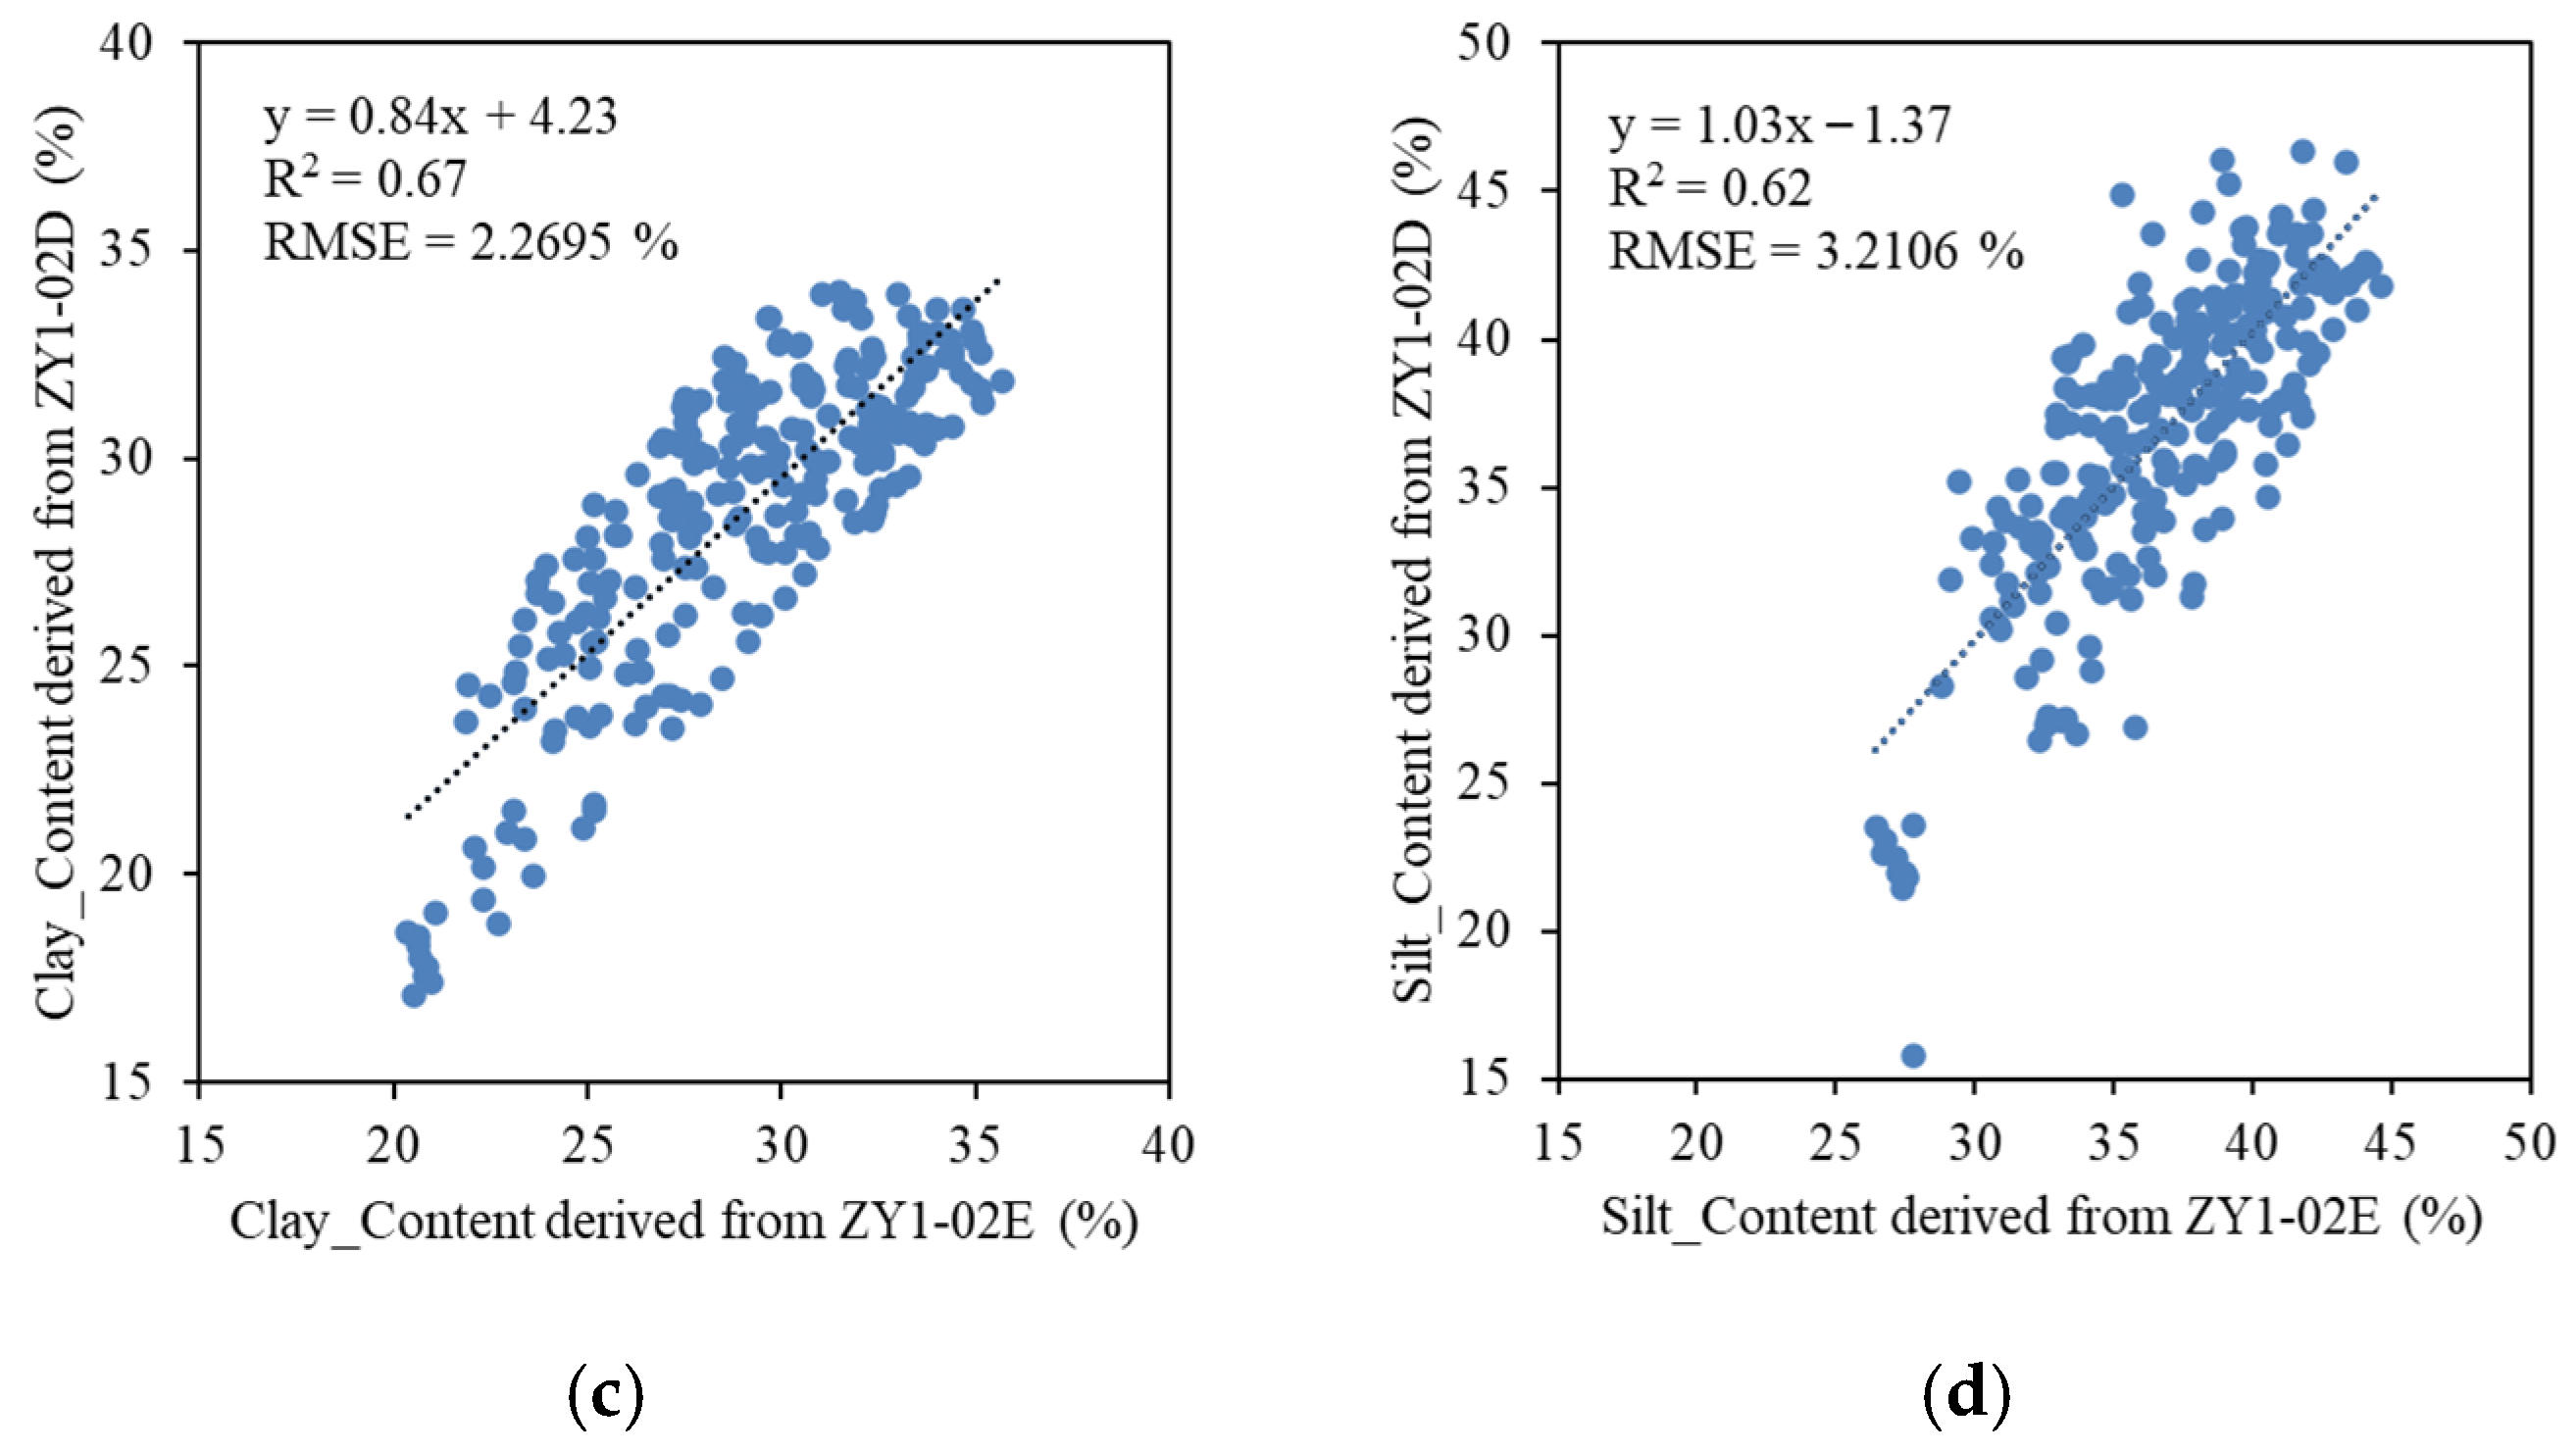
To further assess the consistency of quantitative retrieval results between the two satellites, inversion outputs were compared using 240 randomly selected validation points (Figure 8). All soil parameters exhibited strong linear relationships, with R2 values exceeding 0.60. SOM retrieval showed the highest cross-sensor consistency (R2 = 0.74), followed by Sand (R2 = 0.68) and Clay (R2 = 0.67), while Silt exhibited slightly lower but acceptable agreement (R2 = 0.62). The RMSE values between ZY1-02E and ZY1-02D retrieval results were 6.0026 g/kg for SOM, 3.2106% for Silt, 5.1796% for Sand, and 2.2695% for Clay. Given that SOM values in the study area typically ranged between approximately 20–50 g/kg, and texture fractions varied within 20–60%, these RMSE magnitudes indicate moderate but agronomically acceptable deviations. When expressed as relative deviations, the RMSE values correspond to approximately 12–15% of the typical SOM range and to below 10% for most texture fractions, indicating that cross-sensor discrepancies remain within a practically acceptable threshold for regional soil monitoring applications. Overall, the combination of high R2 and relatively low RMSE confirms the robustness and transferability of the inversion framework across hyperspectral platforms.

4. Discussion

4.1. Performance and Consistency of the ZY1-02E Hyperspectral Sensor

The primary objective of this study was to validate the capability of the newly launched ZY1-02E satellite for quantitative soil mapping in the Mollisol region of Northeast China. The results demonstrate that ZY1-02E yields spectral indices and inversion accuracies highly consistent with ZY1-02D, indicating strong radiometric stability and spectral calibration compatibility between the two AHSI sensors. Cross-sensor comparisons showed that spectral indices achieved significant linear correlations (R2 > 0.65), and the retrieval consistency for SOM reached R2 = 0.74, confirming the reliability of the new platform for soil property characterization.
This high level of agreement is likely attributable to the nearly identical spectral response functions, band configurations, and radiometric calibration protocols adopted by the two satellites. Such consistency minimizes systematic spectral bias and facilitates algorithm transferability across platforms. From a methodological perspective, the findings demonstrate that machine learning-based soil retrieval models trained on one hyperspectral satellite can maintain predictive stability when transferred to another sensor with similar spectral configurations. This supports the development of cross-sensor operational frameworks for constellation-based soil monitoring.
It should be noted, however, that the machine learning models used in this study are fundamentally data-driven and primarily capture statistical relationships between spectral variables and soil properties, rather than directly identifying physicochemical causation. Therefore, although the observed cross-sensor consistency supports the practical transferability of the modeling framework, it should not be interpreted as evidence of a direct causal mechanism linking specific spectral responses to soil property changes. In this regard, the present approach differs from physically based radiative transfer models, which are designed to represent the underlying interaction processes between electromagnetic radiation and soil constituents. This limitation should be considered when extending the framework to other soil backgrounds or environmental conditions.
These results are consistent with recent evaluations of ZY1-02E performance in other remote sensing applications, such as land surface temperature retrieval [47], further confirming the technical robustness of the platform. For agronomic applications, this cross-sensor compatibility implies that spectral libraries, feature engineering strategies, and inversion models previously established for ZY1-02D [15,16] can be adapted to ZY1-02E with minimal recalibration effort. This significantly reduces the time and cost required to establish operational soil monitoring systems and accelerates the transition from experimental validation to routine application.

4.2. Advantages of Hyperspectral Data and Advanced Modelling

The successful retrieval of SOM and soil texture fractions in this study can be attributed to both the intrinsic advantages of hyperspectral data and the robust machine learning framework employed. Compared to multispectral broadband sensors, hyperspectral imagery enables continuous spectral characterization of soil absorption features, particularly in the visible–near-infrared region associated with organic chromophores and in the shortwave infrared region associated with clay minerals and hydroxyl bonds. This continuous narrow-band structure enhances sensitivity to subtle variations in soil composition and improves the separability of correlated soil properties [18]. The integration of advanced feature selection algorithms further strengthened model performance. The hierarchical feature reduction strategy combining VIP, CARS, and Random Frog effectively mitigated the “curse of dimensionality” and reduced multicollinearity inherent in hyperspectral datasets. By isolating the most informative and stable spectral variables, the framework improved model generalization capacity and reduced overfitting risk. These findings align with recent reviews advocating hybrid feature selection–regression frameworks for soil spectroscopy applications [48].
In hyperspectral soil parameter retrieval, dealing with the high dimensionality and severe multicollinearity associated with 166 contiguous spectral bands is the core challenge of model selection. Partial least squares regression (PLSR) has long been used as a robust linear benchmark model; however, comparative studies have shown that it may be insufficient for capturing complex nonlinear perturbations caused by variations in soil moisture, topographic relief, and overlapping absorption features [49]. Support vector regression (SVR) addresses nonlinearity by mapping features into a higher-dimensional space through kernel functions, but its performance is highly sensitive to hyperparameter settings and it cannot directly provide prediction confidence [50]. Decision tree-based methods can effectively control overfitting through bagging, but they may introduce step artifacts into continuous geospatial prediction maps [51]. In contrast, GPR used in this study provides a Bayesian nonparametric method, particularly suitable for hyperspectral soil modeling. GPR flexibly characterizes complex nonlinear spectral–soil relationships by defining a covariance kernel. Secondly, it can directly provide predictive variance, thereby enabling pixel-level uncertainty quantification in spatial prediction maps [41,42,43]. Furthermore, the Boosting Trees algorithm complements this framework by sequentially minimizing residual error along the gradient direction, thereby offering strong predictive accuracy and generalization ability for environmentally heterogeneous datasets [52]. Overall, these comparisons suggest that the selected modeling framework effectively balances nonlinear fitting ability, predictive robustness, and spatial applicability.

4.3. Implications for Regional Soil Health Monitoring and Precision Agriculture

From an agronomic perspective, the most significant contribution of this study lies in validating the operational feasibility of a ZY1 twin-satellite constellation for soil monitoring. In the Northeast China Mollisol belt, soil remote sensing is strictly constrained by the narrow “bare-soil window,” typically occurring between late March and early May. During this brief period, snowmelt, plowing, and pre-sowing operations create optimal exposure of soil surfaces, yet frequent cloud cover often prevents single-satellite systems from acquiring usable hyperspectral imagery. The synergistic operation of ZY1-02D and ZY1-02E effectively shortens the revisit interval and increases the probability of obtaining cloud-free observations during this critical agricultural phase. Rather than merely enhancing temporal resolution, this constellation-based strategy alleviates a long-standing operational constraint in agricultural remote sensing. Improved observation frequency directly supports pre-sowing soil fertility diagnostics, spatial prescription map generation for variable-rate fertilization, and early assessment of winter erosion impacts. Moreover, the establishment of a twin-satellite monitoring framework aligns with national black soil protection strategies by providing timely spatial diagnostics for adaptive soil management. Progress reported for new hyperspectral missions such as EnMAP and PRISMA further suggests that spaceborne imaging spectroscopy is moving toward more operational soil monitoring applications at regional scales [53,54,55]. High-frequency hyperspectral soil mapping enables data-driven interventions aimed at mitigating degradation, optimizing nutrient management, and supporting conservation tillage practices. Thus, beyond technical validation, this study contributes to bridging remote sensing innovation with practical soil governance and sustainable agricultural management.

4.4. Limitations and Future Perspectives

Despite the promising findings, several limitations warrant consideration. First, the cross-sensor validation relied on ground truth data collected one year prior to the ZY1-02E imagery acquisition. Although SOM and soil texture are relatively stable background properties under consistent land-use conditions, subtle interannual variations driven by localized management differences, micro-topographic redistribution, or soil moisture fluctuations cannot be entirely excluded. Future studies incorporating strictly synchronous field campaigns would further enhance validation robustness and eliminate residual temporal uncertainty.
Second, the current framework is optimized for imagery acquired during the bare-soil period with minimal crop residue coverage. In practice, conservation tillage practices such as straw return are increasingly implemented in the black soil region, resulting in mixed soil–residue spectral signatures. Integrating spectral unmixing techniques and residue-sensitive indices will be necessary to extend the applicability of hyperspectral soil retrieval under conservation management systems.
Third, as this framework was explicitly calibrated for bare-soil conditions within the black soil region of Northeast China, its optimal applicability is currently confined to temperate monsoon settings dominated by brown, meadow, and paddy soils. Consequently, caution must be exercised when extrapolating these models to contrasting pedoclimatic zones. Variations in soil mineralogy, climatic regimes, surface roughness, and crop residue cover can significantly alter soil spectral responses, potentially constraining the direct transferability of the framework [56].
Fourth, soil moisture is a major source of uncertainty because it reduces reflectance and strengthens water-related absorption features, especially in the near- and shortwave-infrared regions, thereby influencing the spectral response of soil properties [57]. Recent studies have also shown that soil moisture and related physical properties are key constraints on the spatiotemporal transferability of hyperspectral soil-mapping models when not explicitly corrected [58]. Accordingly, future work should evaluate the framework across contrasting agroecological zones and integrate moisture-normalization or spectral-correction strategies to improve robustness under varying hydrological conditions.

5. Conclusions

This study conducted a systematic cross-sensor evaluation of the newly launched ZY1-02E hyperspectral satellite for soil property mapping in the Mollisol region of Northeast China. By transferring mature spectral indices and machine learning inversion models previously developed for ZY1-02D, we comprehensively assessed the spectral consistency, algorithm transferability, and quantitative retrieval capability of the ZY1-02E AHSI sensor. The results demonstrate strong cross-sensor interoperability between ZY1-02E and ZY1-02D. Spectral indices derived from the two satellites exhibited significant linear correlations (R2 > 0.65), confirming radiometric stability and spectral configuration compatibility. Furthermore, the quantitative retrieval models applied to ZY1-02E imagery achieved robust performance, with cross-sensor consistency exceeding R2 = 0.60 for all evaluated soil parameters and SOM retrieval showing the highest agreement (R2 = 0.74). These findings verify that models trained on ZY1-02D data can be effectively transferred to ZY1-02E without extensive recalibration, supporting the operational continuity of hyperspectral soil monitoring.
Beyond sensor validation, this study establishes a transferable cross-sensor quantitative framework that integrates spectral index construction, hierarchical feature selection, and advanced regression modeling. The demonstrated interoperability between the twin satellites provides a solid technical foundation for constellation-based soil monitoring strategies. By shortening revisit intervals and increasing the probability of acquiring cloud-free imagery during the narrow bare-soil window, the ZY1 twin-satellite system substantially enhances temporal observation capacity in high-latitude agricultural regions. In conclusion, the synergistic application of ZY1-02D and ZY1-02E represents a scalable and operationally feasible paradigm for high-frequency hyperspectral soil mapping. This framework provides critical spatial decision support for precision fertilization, conservation tillage, and soil degradation mitigation, thereby contributing to the sustainable management of black soil resources and the advancement of data-driven precision agriculture.

Supplementary Materials

The following supporting information can be downloaded at https://www.mdpi.com/article/10.3390/agronomy16080781/s1, Table S1: center wavelengths of ZY1-02D and ZY1-02E Advanced Hyperspectral Imager (AHSI) data; Table S2: comparison of four inversion models for soil organic matter (SOM) estimation using the PSF + Topo feature set; Table S3: hyperparameter ranges and final parameter settings of the inversion models.

Author Contributions

Conceptualization, K.S. and H.T.; methodology, K.S. and H.G.; software, H.T.; validation, K.S., H.T. and C.X.; formal analysis, H.G.; investigation, K.S. and C.X.; resources, K.S.; data curation, K.S. and C.X.; writing—original draft preparation, K.S. and H.G.; writing—review and editing, H.T.; visualization, H.G.; supervision, C.X.; project administration, K.S.; funding acquisition, K.S. All authors have read and agreed to the published version of the manuscript.

Funding

This research was funded by the National Key R&D Program of China (2021YFD1500102).

Data Availability Statement

The original contributions presented in this study are included in the article. Further inquiries can be directed to the corresponding author.

Conflicts of Interest

Author He Gu was employed by the company Beijing SatImage Information Technology Co., Ltd. The remaining authors declare that the research was conducted in the absence of any commercial or financial relationships that could be construed as potential conflicts of interest.

References

  1. Liu, J.; Jin, X.; Xu, W.; Sun, W.; Zhou, Z. Influential Factors and Classification of Cultivated Land Fragmentation, and Implications for Future Land Consolidation: A Case Study of Jiangsu Province in Eastern China. Land Use Policy 2019, 88, 104185. [Google Scholar] [CrossRef]
  2. Bao, Y.; Ustin, S.; Meng, X.; Zhang, X.; Liu, H. A Regional-Scale Hyperspectral Prediction Model of Soil Organic Carbon Considering Geomorphic Features. Geoderma 2021, 403, 115263. [Google Scholar] [CrossRef]
  3. Liu, X.; Zhang, X.; Wang, Y.; Sui, Y.; Zhang, S.; Herbert, S.J.; Ding, G. Soil Degradation: A Problem Threatening the Sustainable Development of Agriculture in Northeast China. Plant Soil Environ. 2010, 56, 87–97. [Google Scholar] [CrossRef]
  4. Qiao, X.; Wang, C.; Feng, M.; Pan, J. Hyperspectral Estimation of Soil Organic Matter Based on Different Spectral Preprocessing Techniques. Spectrosc. Lett. 2017, 50, 156–163. [Google Scholar] [CrossRef]
  5. Gholizadeh, A.; Žižala, D.; Saberioon, M.; Borůvka, L. Soil Organic Carbon and Texture Retrieving and Mapping Using Proximal, Airborne and Sentinel-2 Spectral Imaging. Remote Sens. Environ. 2018, 218, 89–103. [Google Scholar] [CrossRef]
  6. Ding, S.; Zhang, X.; Sun, W.; Yang, S. Estimation of Soil Lead Content Based on GF-5 Hyperspectral Images, Considering the Influence of Soil Environmental Factors. J. Soils Sediments 2022, 22, 1431–1445. [Google Scholar] [CrossRef]
  7. Goswami, C.; Singh, J.; Handique, B. Hyperspectral Spectroscopic Study of Soil Properties—A Review. Int. J. Plant Soil Sci. 2020, 32, 14–25. [Google Scholar] [CrossRef]
  8. Xu, X.; Chen, S.; Xu, Z.; Yu, Y.; Zhang, S.; Dai, R. Exploring Appropriate Preprocessing Techniques for Hyperspectral Soil Organic Matter Content Estimation in Black Soil Area. Remote Sens. 2020, 12, 3765. [Google Scholar] [CrossRef]
  9. Du, Z.; Gao, B.; Ou, C.; Du, Z.; Yang, J.; Yu, K. A Quantitative Analysis of Factors Influencing Organic Matter Concentration in the Topsoil of Black Soil in Northeast China Based on Spatial Heterogeneous Patterns. ISPRS Int. J. Geo-Inf. 2021, 10, 348. [Google Scholar] [CrossRef]
  10. Li, H.; Yao, Y.; Zhang, X.; Liu, X.; Xiao, R. Changes in Soil Physical and Hydraulic Properties Following the Conversion of Forest to Cropland in the Black Soil Region of Northeast China. Catena 2021, 198, 104986. [Google Scholar] [CrossRef]
  11. Aboelsoud, H.; Abdelrahman, M.; Kheir, A.; Eid, M.; Ammar, K.; Khalifa, T.; Scopa, A. Quantitative Estimation of Saline-Soil Amelioration Using Remote-Sensing Indices in Arid Land for Better Management. Land 2022, 11, 1041. [Google Scholar] [CrossRef]
  12. Jia, P.; Shang, T.; Zhang, J.; Sun, Y. Inversion of Soil pH during the Dry and Wet Seasons in the Yinbei Region of Ningxia, China, Based on Multi-Source Remote Sensing Data. Geoderma Reg. 2021, 25, e00399. [Google Scholar] [CrossRef]
  13. Ou, D.; Tan, K.; Lai, J.; Du, Q.; Wang, X. Semi-Supervised DNN Regression on Airborne Hyperspectral Imagery for Improved Spatial Soil Properties Prediction. Geoderma 2021, 385, 114875. [Google Scholar] [CrossRef]
  14. Tan, K.; Ma, W.; Chen, L.; Wang, H.; Du, Q.; Du, P.; Yan, B.; Liu, R.; Li, H. Estimating the Distribution Trend of Soil Heavy Metals in Mining Area from HyMap Airborne Hyperspectral Imagery Based on Ensemble Learning. J. Hazard. Mater. 2021, 401, 123288. [Google Scholar] [CrossRef]
  15. Xu, Z.; Chen, S.; Zhu, B.; Yu, Y.; Dai, R. Evaluating the Capability of Satellite Hyperspectral Imager, the ZY1–02D, for Topsoil Nitrogen Content Estimation and Mapping of Farmlands in Black Soil Area, China. Remote Sens. 2022, 14, 1008. [Google Scholar] [CrossRef]
  16. Guo, H.; Zhang, R.; Dai, W.; Zhang, H.; Zhang, C.; Cui, J. Mapping Soil Organic Matter Content Based on Feature Band Selection with ZY1-02D Hyperspectral Satellite Data in the Agricultural Region. Agronomy 2022, 12, 2111. [Google Scholar] [CrossRef]
  17. Shang, K.; Xiao, C.; Gan, F.; Li, H.; Yu, X. Estimation of Soil Copper Content in Mining Area Using ZY1-02D Satellite Hyperspectral Data. J. Appl. Remote Sens. 2021, 15, 042607. [Google Scholar] [CrossRef]
  18. Shi, Y.; Zhao, J.; Song, X.; Wang, H.; Li, H. Hyperspectral Band Selection and Modeling of Soil Organic Matter Content in a Forest Using the Ranger Algorithm. PLoS ONE 2021, 16, e0253385. [Google Scholar] [CrossRef]
  19. Li, Q.; Wei, M.; Dai, H.; Wang, S.; Liu, K. Characteristics of Soil Heavy Metal Pollution and Ecological Risk Assessment of Jinzhou City. Geol. Resour. 2021, 30, 465–472. [Google Scholar] [CrossRef]
  20. Kaufman, Y.J.; Sendra, C. Algorithm for Automatic Atmospheric Corrections to Visible and Near-IR Satellite Imagery. Int. J. Remote Sens. 1988, 9, 1357–1381. [Google Scholar] [CrossRef]
  21. Cooley, T.; Anderson, G.; Felde, G.; Hoke, M.; Ratkowski, A.; Chetwynd, J.; Gardner, J.; Adler-Golden, S.; Matthew, M.; Berk, A.; et al. FLAASH, a MODTRAN4-Based Atmospheric Correction Algorithm, Its Application and Validation. In Proceedings of the IEEE International Geoscience and Remote Sensing Symposium (IGARSS), Toronto, ON, Canada, 24–28 June 2002; Volume 3, pp. 1414–1418. [Google Scholar] [CrossRef]
  22. Tian, L.; Sun, H.; Dong, X.; Wang, Y.; Li, Y. Effects of Swine Wastewater Irrigation on Soil Properties and Accumulation of Heavy Metals and Antibiotics. J. Soils Sediments 2022, 22, 1485–1500. [Google Scholar] [CrossRef]
  23. Zheng, M.; Wang, X.; Li, S.; Zhu, B.; Hou, J.; Song, K. Soil Texture Mapping in Songnen Plain of China Using Sentinel-2 Imagery. Remote Sens. 2023, 15, 5351. [Google Scholar] [CrossRef]
  24. Ding, X.; Han, X.; Liang, Y.; Qiao, Y.; Li, L.; Li, N. Changes in Soil Organic Carbon Pools after 10 Years of Continuous Manuring Combined with Chemical Fertilizer in a Mollisol in China. Soil Tillage Res. 2012, 122, 36–41. [Google Scholar] [CrossRef]
  25. Wang, G.; Qin, W.; Yin, Z.; Zhou, Z.; Han, X. Threshold Effects of Straw Returning Amounts on Bacterial Colonization in Black Soil. Microorganisms 2025, 13, 1797. [Google Scholar] [CrossRef]
  26. Shi, Y.; Yang, F.; Long, H.; Rossiter, D.G.; Zhang, A.; Zhang, G. Provenance of Soil Parent Materials in Relation to Regional Environmental Changes in the Songnen Plain, Northeast China. Geoderma Reg. 2024, 38, e00848. [Google Scholar] [CrossRef]
  27. Shang, K.; Gu, H.; Qin, A.; Xiao, C.; Shen, Q. Research on Spectral Index of Soil Organic Matter in Black Soil for Collaborative Monitoring of Multi-Source Hyperspectral Data. In Earth and Space: From Infrared to Terahertz (ESIT 2022); SPIE: Bellingham, WA, USA, 2023; Volume 12505, pp. 430–436. [Google Scholar] [CrossRef]
  28. Ben-Dor, E.; Irons, J.R.; Epema, G.F. Soil Reflectance. In Manual of Remote Sensing, 3rd ed.; Rencz, A.N., Ed.; John Wiley & Sons: New York, NY, USA, 1999; pp. 111–188. [Google Scholar]
  29. Stoner, E.R.; Baumgardner, M.F. Characteristic Variations in Reflectance of Surface Soils. Soil Sci. Soc. Am. J. 1981, 45, 1161–1165. [Google Scholar] [CrossRef]
  30. Heller Pearlshtien, D.; Ben-Dor, E. Effect of Organic Matter Content on the Spectral Signature of Iron Oxides across the VIS–NIR Spectral Region in Artificial Mixtures: An Example from a Red Soil from Israel. Remote Sens. 2020, 12, 1960. [Google Scholar] [CrossRef]
  31. Rossel, R.V.; Walvoort, D.J.J.; McBratney, A.B.; Janik, L.J.; Skjemstad, J.O. Visible, Near Infrared, Mid Infrared or Combined Diffuse Reflectance Spectroscopy for Simultaneous Assessment of Various Soil Properties. Geoderma 2006, 131, 59–75. [Google Scholar] [CrossRef]
  32. Stenberg, B.; Rossel, R.A.V.; Mouazen, A.M.; Wetterlind, J. Visible and Near Infrared Spectroscopy in Soil Science. Adv. Agron. 2010, 107, 163–215. [Google Scholar] [CrossRef]
  33. Danesh, M.; Bahmanyar, M.A.; Emadi, S.M. Spectral Study of Soil Silt and Detection of Key Wavelengths Using Diffuse Reflectance Spectroscopy in Mazandaran Province, Iran. Commun. Soil Sci. Plant Anal. 2023, 54, 1969–1988. [Google Scholar] [CrossRef]
  34. Hu, Y.; Li, X.; Guo, S.; Gao, X.; Ou, X.; Liu, B. On-Site Soil Dislocation and Localized CNP Degradation: The Real Erosion Risk Faced by Sloped Cropland in Northeastern China. Agric. Ecosyst. Environ. 2020, 302, 107088. [Google Scholar] [CrossRef]
  35. Sarkhosh, M.; Khorshidi, N.; Niazi, A.; Ghasemi, J. Application of Genetic Algorithms for Pixel Selection in Multivariate Image Analysis for a QSAR Study of Trypanocidal Activity for Quinone Compounds and Design New Quinone Compounds. Chemom. Intell. Lab. Syst. 2014, 139, 168–174. [Google Scholar] [CrossRef]
  36. Li, H.; Liang, Y.; Xu, Q.; Cao, D. Key Wavelengths Screening Using Competitive Adaptive Reweighted Sampling Method for Multivariate Calibration. Anal. Chim. Acta 2009, 648, 77–84. [Google Scholar] [CrossRef] [PubMed]
  37. Li, H.; Xu, Q.; Liang, Y. Random Frog: An Efficient Reversible Jump Markov Chain Monte Carlo-Like Approach for Variable Selection with Applications to Gene Selection and Disease Classification. Anal. Chim. Acta 2012, 740, 20–26. [Google Scholar] [CrossRef] [PubMed]
  38. Li, H.; Xu, Q.; Liang, Y. LibPLS: An Integrated Library for Partial Least Squares Regression and Linear Discriminant Analysis. Chemom. Intell. Lab. Syst. 2018, 176, 34–43. [Google Scholar] [CrossRef]
  39. Yao, X.; Yang, W.; Li, M.; Liu, H. Prediction of Total Nitrogen in Soil Based on Random Frog Leaping Wavelet Neural Network. IFAC-PapersOnLine 2018, 51, 660–665. [Google Scholar] [CrossRef]
  40. Friedman, J.H. Greedy Function Approximation: A Gradient Boosting Machine. Ann. Stat. 2001, 29, 1189–1332. [Google Scholar] [CrossRef]
  41. Rasmussen, C.E.; Williams, C.K.I. Gaussian Processes in Machine Learning. Lect. Notes Comput. Sci. 2004, 3176, 63–71. [Google Scholar] [CrossRef]
  42. Kirk, P.; Stumpf, M.P. Gaussian Process Regression Bootstrapping: Exploring the Effects of Uncertainty in Time Course Data. Bioinformatics 2009, 25, 1300–1306. [Google Scholar] [CrossRef]
  43. Duvenaud, D. Automatic Model Construction with Gaussian Processes. Ph.D. Thesis, University of Cambridge, Cambridge, UK, 2014. [Google Scholar]
  44. Anselin, L. Local Indicators of Spatial Association—LISA. Geogr. Anal. 1995, 27, 93–115. [Google Scholar] [CrossRef]
  45. Parent, E.J.; Parent, S.-É.; Parent, L.E. Determining soil particle-size distribution from infrared spectra using machine learning predictions: Methodology and modeling. PLoS ONE 2021, 16, e0233242. [Google Scholar] [CrossRef]
  46. Liu, H.; Wang, J.; Sun, X.; McLaughlin, N.B.; Jia, S.; Liang, A.; Zhang, S. The Driving Mechanism of Soil Organic Carbon Biodegradability in the Black Soil Region of Northeast China. Sci. Total Environ. 2023, 884, 163835. [Google Scholar] [CrossRef] [PubMed]
  47. Wu, P.; Ren, H.; Ye, X.; Wang, J. Estimation of Land Surface Temperature from Chinese ZY1-02E IRS Data. Remote Sens. 2024, 16, 383. [Google Scholar] [CrossRef]
  48. Kwak, G.-H.; Park, N.-W. Prediction of Soil Properties Using Vis-NIR Spectroscopy Combined with Machine Learning: A Review. Sensors 2025, 25, 5045. [Google Scholar] [CrossRef]
  49. Hultquist, C.; Chen, G.; Zhao, K. A Comparison of Gaussian Process Regression, Random Forests and Support Vector Regression for Burn Severity Assessment in Diseased Forests. Remote Sens. Lett. 2014, 5, 875–884. [Google Scholar] [CrossRef]
  50. Smith, H.D.; Dubeux, J.C.B.; Zare, A.; Wilson, C.H. Assessing Transferability of Remote Sensing Pasture Estimates Using Multiple Machine Learning Algorithms and Evaluation Structures. Remote Sens. 2023, 15, 2940. [Google Scholar] [CrossRef]
  51. Verrelst, J.; Camps-Valls, G.; Muñoz-Marí, J.; Rivera, J.P.; Veroustraete, F.; Clevers, J.G.P.W.; Moreno, J. Machine Learning Regression Algorithms for Biophysical Parameter Retrieval: Opportunities for Sentinel-2 and -3. Remote Sens. Environ. 2015, 118, 127–146. [Google Scholar] [CrossRef]
  52. Sigrist, F. Gaussian Process-Boosting. J. Mach. Learn. Res. 2022, 23, 1–46. [Google Scholar]
  53. Pato, P.; Tziolas, N.; Tsakiridis, N.; Zalidis, G. Potential of EnMAP Hyperspectral Imagery for Regional-Scale Soil Organic Matter Mapping. Remote Sens. 2025, 17, 1600. [Google Scholar] [CrossRef]
  54. Chabrillat, S.; Foerster, S.; Segl, K.; Beamish, A.; Brell, M.; Asadzadeh, S.; Milewski, R.; Ward, K.J.; Brosinsky, A.; Koch, K.; et al. The EnMAP Spaceborne Imaging Spectroscopy Mission: Initial Scientific Results Two Years after Launch. Remote Sens. Environ. 2024, 315, 114379. [Google Scholar] [CrossRef]
  55. Cremer, N.; Alonso, K.; Doxani, G.; Chlus, A.; Thompson, D.R.; Brodrick, P.; Townsend, P.A.; Palombo, A.; Santini, F.; Gao, B.-C.; et al. Atmospheric Correction Inter-Comparison eXercise, ACIX-III Land: An Assessment of Atmospheric Correction Processors for EnMAP and PRISMA over Land. Remote Sens. 2025, 17, 3790. [Google Scholar] [CrossRef]
  56. Rossel, R.A.V.; Shen, Z.; Lopez, L.R.; Behrens, T.; Shi, Z.; Wetterlind, J.; Sudduth, K.A.; Stenberg, B.; Guerrero, C.; Gholizadeh, A.; et al. An Imperative for Soil Spectroscopic Modelling Is to Think Global but Fit Local with Transfer Learning. Earth-Sci. Rev. 2024, 254, 104797. [Google Scholar] [CrossRef]
  57. Liu, W.; Baret, F.; Gu, X.; Tong, Q.; Zheng, L.; Zhang, B. Relating Soil Surface Moisture to Reflectance. Remote Sens. Environ. 2002, 81, 238–246. [Google Scholar] [CrossRef]
  58. Sui, Y.; Jiang, R.; Lin, N.; Yu, H.; Zhang, X. Improving the Spatiotemporal Transferability of Hyperspectral Remote Sensing for Estimating Soil Organic Matter by Minimizing the Coupling Effect of Soil Physical Properties on the Spectrum: A Case Study in Northeast China. Agronomy 2024, 14, 1067. [Google Scholar] [CrossRef]
Figure 1. (a) Location of the study area and spatial distribution of soil sampling points in the Southern Region of Northeast China. (b) True-color image of the study area acquired by the ZY1-02E hyperspectral satellite. (c) Soil types of the study area.
Agronomy 16 00781 g001
Figure 2. Flowchart of the overall methodology for cross-sensor evaluation and soil parameter mapping.
Agronomy 16 00781 g002
Figure 3. Spatial distribution comparison of the Soil Organic Matter Spectral Index (SOM_SI) derived from (a) ZY1-02E and (b) ZY1-02D.
Agronomy 16 00781 g003
Figure 4. Spatial distribution comparison of soil texture spectral indices derived from ZY1-02E ((a) Sand_SI; (b) Clay_SI; (c) Silt_SI) and ZY1-02D ((d) Sand_SI; (e) Clay_SI; (f) Silt_SI).
Agronomy 16 00781 g004
Figure 5. Cross-sensor correlation analysis of the spectral indices derived from ZY1-02E and ZY1-02D: (a) SOM_SI, (b) Sand_SI, (c) Clay_SI, and (d) Silt_SI.
Agronomy 16 00781 g005
Figure 6. Spatial distribution maps of Soil Organic Matter (SOM) content retrieved from (a) ZY1-02E and (b) ZY1-02D.
Agronomy 16 00781 g006
Figure 7. Spatial distribution maps of soil texture fractions retrieved from ZY1-02E ((a) Sand; (b) Clay; (c) Silt) and ZY1-02D ((d) Sand; (e) Clay; (f) Silt).
Agronomy 16 00781 g007
Figure 8. Cross-sensor validation and correlation analysis of the retrieved soil parameters between ZY1-02E and ZY1-02D: (a) SOM, (b) Sand, (c) Clay, and (d) Silt.
Agronomy 16 00781 g008aAgronomy 16 00781 g008b
Table 1. The parameters of Advanced Hyperspectral Imager (AHSI) data of ZY1-02D satellite and ZY1-02E satellite.
ParameterAHSI/ZY1-02DAHSI/ZY1-02E
Spectral range400–2500 nm
Number of bands166
Spatial resolution30 m
Spectral resolutionVNIR 10 nm
SWIR 20 nm
Swath width60 km
Orbital period55 days
Table 2. Statistical characteristics of soil sampling points.
SOM (g/kg)Sand (%)Silt (%)Clay (%)
Max76.6184.8074.1048.40
Min6.005.106.757.53
Mean27.5337.6037.1125.28
SD13.7022.1114.979.84
CV0.500.590.400.39
Table 3. Mathematical forms and calculation formulas of the candidate soil spectral indices.
Index TypeAbbreviationCalculation Formula
Difference IndexDI R p R q
Ratio IndexRI R p R q
Normalized Difference IndexNDI R p R q R p + R q
Difference Square Root IndexDSI R p R q R p + R q
Note: R p and R q represent the mathematically transformed spectral reflectance values at any two different wavelengths ( p and q ) within the 400–2500 nm range.
Table 4. Optimal spectral indices and calculation formulas for soil organic matter and texture fractions.
Soil ParameterAbbreviationCalculation Formula
SOMSOM_SI R 560 R 600
SandSand_SI R 740 R 525
ClayClay_SI R 580 R 735
SiltSilt_SI R 525 R 610 R 525 + R 610
Note: R λ represents the spectral reflectance at the wavelength of λ nm.
Table 5. Optimal machine learning inversion models and selected feature sets for different soil parameters.
Soil ParameterInversion ModelFeature Set IDFeature ComponentsNo. of Features
Soil Organic Matter (SOM)Boosting TreesCombination 5PSF + Topo7
Sand FractionGPRCombination 2PSF8
Clay FractionGPRCombination 2PSF5
Silt FractionGPRCombination 2PSF9
Note: GPR: Gaussian Process Regression; PSF: Parametric Spectral Features; Topo: Topographic Factors (Slope, Aspect, Elevation).
Disclaimer/Publisher’s Note: The statements, opinions and data contained in all publications are solely those of the individual author(s) and contributor(s) and not of MDPI and/or the editor(s). MDPI and/or the editor(s) disclaim responsibility for any injury to people or property resulting from any ideas, methods, instructions or products referred to in the content.