Article

Assessing the Impact of Water Stress on Neofusicoccum parvum in Table Grapes Using Proximal Sensing Technologies


1
Department of Agriculture, Food and Environment (Di3A), University of Catania, Via S. Sofia 100, 95123 Catania, Italy
2
International Doctorate in Agricultural, Food and Environmental Science—Di3A, University of Catania, Via S. Sofia 100, 95123 Catania, Italy
*
Author to whom correspondence should be addressed.
Agronomy 2026, 16(7), 696; https://doi.org/10.3390/agronomy16070696

Submission received: 18 February 2026 / Revised: 20 March 2026 / Accepted: 24 March 2026 / Published: 26 March 2026
(This article belongs to the Section Precision and Digital Agriculture)

Abstract

Water availability represents a major limiting factor for crop production, particularly in Mediterranean agroecosystems. In parallel, water-stressed plants are often more susceptible to diseases, including Grapevine Trunk Diseases (GTDs), such as Botryosphaeria Dieback caused by Botryosphaeriaceae species. In Italy, the increasing prevalence of GTDs in young table grape plants and nursery material highlights the need to better understand the interaction between abiotic stress and pathogen dissemination in woody tissues. This study investigated the relationship between different water regimes (WRs) and infections by Neofusicoccum parvum. Grapevine cuttings (Vitis vinifera ‘Italia’ vines grafted onto the rootstock ‘140 Ruggeri’) were subjected to three WRs (20%, 50%, and 100% of crop evapotranspiration, ETc) under controlled environmental conditions and, subsequently, inoculated with mycelial plugs of N. parvum at both the scion and rootstock levels. Plant responses were monitored non-destructively using low-cost proximal sensing tools, including leaf temperature (Tleaf) and the Normalized Difference Vegetation Index (NDVI). Disease development was assessed by measuring internal necrotic lesion extension. Reduced irrigation was associated with increased disease severity, while proximal sensing detected differences in plant physiological responses among water regimes. Overall, the results highlight the interplay between water availability, plant physiological status, and disease severity under controlled conditions.

1. Introduction

Water availability is a significant constraint on agricultural productivity worldwide, with particularly severe implications for Mediterranean agroecosystems. In these regions, irrigated agriculture accounts for more than 70% of freshwater consumption [1,2]. The progressive intensification of climate change, manifested by rising air temperatures, altered rainfall regimes, and more frequent drought events, has further reduced the reliability of water supplies, especially in Sicily (southern Italy) [3,4]. In this context, effective water management aims not only to optimize water use but also to safeguard crop productivity, relying on accurate estimates of crop water requirements based on evapotranspiration (ET) measurements [5,6].
Alongside water scarcity, grapevine cultivation is increasingly affected by Grapevine Trunk Diseases (GTDs), a group of wood diseases responsible for vine decline and reduced vineyard longevity worldwide. Among the fungal pathogens associated with GTDs, N. parvum (a member of the Botryosphaeriaceae family) is highly aggressive and widespread, capable of causing decline, dieback, and internal wood necrosis in grapevine wood [7,8,9,10].
Several studies have demonstrated that water limitation and temperature extremes can significantly impact both grapevine susceptibility and aggressiveness of some pathogens. Water deficit has been reported to exacerbate disease expression caused by Botryosphaeriaceae and other trunk disease pathogens, including Diplodia seriata and Eutypa lata [11,12,13,14]. Similarly, heat and drought stress can act synergistically to exacerbate Botryosphaeria dieback symptoms, highlighting the importance of considering combined stress scenarios in the context of climate change projections [15]. Additionally, pathogen virulence can be modulated by temperature and water stress, which affects infection dynamics and potential geographic distribution [16].
It is important to underline that the expression and severity of GTDs are not solely driven by pathogen virulence but are also strongly influenced by the physiological state of the host. Water deficit conditions, whether climate-driven or imposed through deficit irrigation (DI) practices, can weaken plant defense mechanisms, thereby increasing host susceptibility and accelerating pathogen development before or during infection [9,10,11].
A clear relationship between trunk disease expression, irrigation regimes, and grapevine physiological responses has been described in previous studies [17], highlighting the role of abiotic stress in modulating disease severity. This confirms the role of abiotic stress in shaping disease severity. These findings underscore the importance of understanding GTDs progression under combined stress factors, particularly in controlled experimental settings where abiotic and biotic drivers can be isolated. Furthermore, most sensor-based Botryosphaeriaceae investigations have focused on wine grape cultivars in open-field vineyards, while young table grapevine plants grown under protected Mediterranean systems have been largely overlooked. Additionally, although low-cost thermal and multispectral sensors have shown promising performance in estimating water status [18,19], their application for integrated detection of abiotic-biotic stress interactions in Botryosphaeriaceae remains largely unexplored.
The need to manage water efficiently while minimizing disease risk highlights the importance of monitoring tools that capture plant physiological responses in a timely and non-destructive manner. In this context, the efficient implementation of DI strategies requires continuous indicators of plant water status that can be readily applied under experimental and operational conditions [20,21]. Although reliable, conventional reference methods, such as stem water potential measurements, are time-consuming, labor-intensive, and poorly suited for high-frequency monitoring [22,23].
In this context, proximal sensing techniques have emerged as valuable tools for the non-destructive monitoring of grapevine physiological responses and the early detection of stress. Thermal imaging has proven effective in capturing canopy temperature variations linked to stomatal regulation and transpiration decline under different irrigation regimes [24]. Additionally, systematic reviews confirm growing interest in remote and proximal sensing technologies for grapevine disease detection [25].
Importantly, the adoption of low-cost proximal sensing devices is receiving increasing attention as they may enable scalable stress monitoring solutions for precision viticulture. Performance evaluations of affordable thermal cameras have confirmed their reliability in estimating plant water status under Mediterranean conditions [18]. Similar low-cost multispectral approaches have been successfully tested in deficit-irrigated orchards, demonstrating their potential for irrigation management [19].
Thermal infrared (TIR) and multispectral proximal sensing techniques have emerged as particularly promising tools for this purpose. Infrared thermography enables indirect estimation of plant water status by detecting variations in canopy temperature (Tleaf), which reflect changes in transpiration and stomatal regulation under water-limited conditions [26,27,28,29,30,31,32,33]. Thermal indices derived from Tleaf measurements, most notably the Crop Water Stress Index (CWSI) [19,20,21,22,23,24,25,26,27,28,29,30,31,32,33,34], have been successfully applied across a wide range of crops, including perennial Mediterranean species, demonstrating their robustness as indicators of plant water stress [35,36]. Complementary to TIR, visible–near-infrared (VNIR) multispectral monitoring provides information on plant vigor, chlorophyll content, and overall physiological performance through vegetation indices (VIs), such as the Normalized Difference Vegetation Index (NDVI) [37,38]. These spectral indicators are derived from the characteristic absorption of visible wavelengths by chlorophyll and the strong reflectance in the near-infrared region. This allows subtle changes in canopy structure and function to be detected.
Recent technological advances have facilitated the development of compact, low-cost TIR and VNIR sensors, such as the FLIR ONE Pro and Mapir multispectral sensors. These sensors have proven capable of generating meaningful proxies of crop water status. Their portability and affordability are encouraging their adoption in precision irrigation systems in Mediterranean agricultural areas [19]. However, there is still a significant gap between the availability of these sensor-derived metrics and their translation into more proactive and sustainable strategies for water management and disease mitigation under combined biotic and abiotic stress.
Building on this context, the central hypothesis of the present study is that low-cost proximal sensing tools based on TIR and VNIR data can offer an effective alternative to conventional methods for quantifying plant water status. In detail, aims of this study were: (i) to assess the response of table grape cuttings (Vitis vinifera ‘Italia’ grafted onto ‘140 Ruggeri’) to N. parvum infection under three distinct water regimes (WRs, 20%, 50%, and 100% of ETc; named asT20%, T50%, and T100%), thereby quantifying how water availability influences host susceptibility; and (ii) to develop and validate integrated monitoring protocols based on low-cost thermal and multispectral sensors (FLIR ONE Pro and MAPIR) for the early detection of water stress conditions that may predispose grapevine tissues to pathogen colonization.

2. Materials and Methods

2.1. Experimental Design

The study was performed to assess the combined effects of different WR and pathogen inoculation on the expression of symptoms caused by N. parvum in grapevine wood. A factorial experimental design with two main factors was applied, including: WR (three levels) and pathogen inoculation (yes and no). This design generated six treatment combinations. Each treatment consisted of three plants per replicate, with three biological replicates, resulting in nine plants per treatment, and a total of 54 potted table grape cuttings. Sample plants were considered as experimental units for statistical analysis. The experimental set-up was applied in two separate experiments (named Experiment 1 and 2).
Grafted and rooted cuttings (Vitis vinifera L. cv. ‘Italia’ grafted onto the rootstock ‘140 Ruggeri’) were transplanted into pots filled with a standard growing substrate Vigor Plant® (Vigorplant Italia srl, Fombio (LO), Italy) and maintained in a climate chamber at 25 °C to promote homogeneous scion bud break.
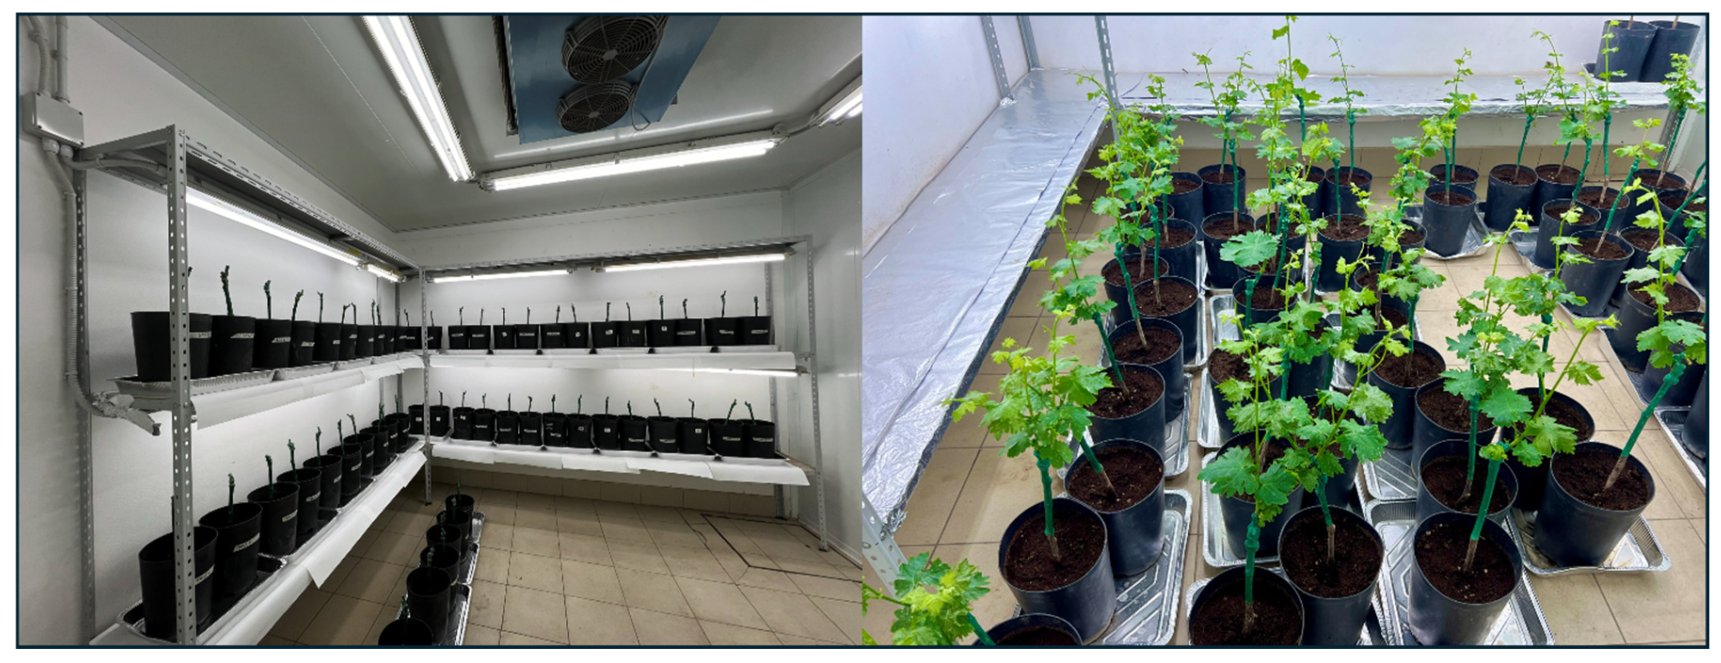
In Experiment 1, table grape cuttings were transplanted on 9 February 2024 and then maintained under controlled environmental conditions until July 2024 (Figure 1). In the second experimental repetition (Experiment 2), an additional set of cuttings was transplanted on 17 October 2024 and cultivated until March 2025 using the same above-reported procedure.
During both experiments, at the emergence of the first leaves, plants were subjected to three WRs based on calculated percentages of crop evapotranspiration (ETc), as follows: (i) full irrigation (FI), where irrigation volume corresponded to 100% of ETc (T100%); (ii) moderate water deficit, supplied at 50% of ETc (T50%); and (iii) severe water deficit, supplied at 20% of ETc (T20%). Irrigation was applied twice per week according to the irrigation scheduling calculated on crop water requirements basis for each WR (Section 2.2).

2.2. Estimation of Crop Water Requirements

In growth chambers and greenhouse-like systems, reference evapotranspiration (ET0) is primarily driven by air temperature (Tair) and incoming solar radiation (Rs) since wind speed and atmospheric variability are limited [39]. Under these stable microclimatic conditions, radiation-based empirical models are commonly used to estimate ET0. Herein, daily ET0 was estimated using the Irmak model [39,40], which is based on mean Tair and Rs as the primary environmental drivers recorded inside the growth chamber according to the following equation:
E T 0 = 0.611 + 0.149 R s + 0.079 T air
where R s is the incident solar radiation (MJ m−2 day−1), and Tair is the mean daily air temperature (°C). ET0 values obtained from Equation (1) were expressed in mm day−1.
In Equation (1), the Tair in the growth chamber was fixed at controlled levels (25 °C), while R s conditions were provided by the manufacture of the artificial internal LED lighting system.
The resulting ET0 and crop coefficient (Kc)values were subsequently used to compute the daily ETc (ETc = ET0 × Kc) following the FAO-56 approach [6]. Irrigation volumes at full irrigation rate (100% ETc) were derived from ETc and expressed in mm per pot. A water reduction of 50% and 20% was applied on the derived full irrigation volume according to the imposed experimental deficits (50% and 20% ETc).
Specific Kc values were adopted and adjusted for the grapevines under study according to crop phenological development. Kc values ranged from 0.30 during the initial growth stage, gradually increased during canopy development (0.31–0.84). The same Kc values were applied to all irrigation treatments at each growth stage during both experiments.

2.3. Proximal Sensing Measurements

Proximal sensing datasets were collected on a monthly basis from April to July 2024 (Experiment 1) and December to March 2025 (Experiment 2) using a portable infrared thermal camera (FLIR ONE Pro, Teledyne FLIR LLC., Arlington, VA, USA) in combination with a multispectral sensor (MAPIR Survey3 RGN, San Diego, CA, USA). The main technical specifications of the thermal and multispectral sensors are summarized in Table 1.
All proximal sensing acquisitions were performed inside a controlled-environment climate chamber under stable illumination and environmental conditions, with the Tair maintained at 25 °C throughout the experimental period.
During each multispectral acquisition session, an image of the calibration target was collected using the same sensor orientation as for canopy imaging to ensure consistent reference conditions. The raw multispectral images were then converted into surface reflectance products in TIFF format using MAPIR Camera Control software (MCC, version 20230123). Then, the Normalized Difference Vegetation Index (NDVI [19]) was calculated in QGIS software (version 3.16).
Similarly, TIR measurements were conducted following the same temporal schedule and reference procedure as the multispectral acquisitions. Thus, TIR images of the entire grapevine canopy were acquired and then exported as raster datasets using the manufacturer’s software [19]. These thermal layers were then processed and standardized in GIS environment. The thermal image processing workflow included the steps described in [19], i.e., from raw thermal data to CSV format and to TIFF images.
Crop water status was assessed by computing the Normalized Difference Vegetation Index (NDVI) in QGIS (v. 3.16) according to Equation (2):
NDVI = (NIR − Red)/(NIR + Red)
NIR and RED represent reflectance values in the near-infrared and red spectral bands, respectively.
Although NDVI can saturate under dense canopy conditions, the limited canopy development of the pot-grown grapevines in this study reduced this constraint, making NDVI a suitable indicator for detecting differences in canopy vigor among treatments.
For both multispectral and thermal imagery, NDVI and Tleaf values were extracted by manually delineating regions of interest (ROIs), exclusively on leaf surfaces directly exposed to artificial illumination within the climate chamber. This avoided shaded areas and mixed pixels along leaf margins, which could introduce artifacts. This manual procedure further contributed to avoiding uncertainty in the multispectral and thermal outputs by avoiding capturing background interference or partially occluded plant structures. In detail, leaf-level thermal and NDVI information was obtained from four fully expanded leaves per plant. The same selection criteria were consistently applied to all plants and measurements to ensure comparability among treatments and experiments. For each leaf, a number of 40 Tc and NDVI pixel values were sampled from the relative thermal and NDVI raster layers. Subsequent statistical analyses were performed as described in the statistical analyses.

2.4. Fungal Isolate and Inoculation Procedure

The experimental design also included a pathogen factor, distinguishing vines inoculated with N. parvum from uninoculated control plants.
N. parvum isolate N. 71 was cultured on Potato Dextrose Agar (PDA; Merck, Darmstadt, Germany) supplemented with streptomycin sulfate (25 mg L−1; PDAS) and incubated at 25 ± 1 °C. Ten-day-old cultures were used for inoculation to ensure uniform fungal vigor. Inoculations were performed on 9 May 2024, following validated protocols commonly adopted in grapevine trunk disease research [41,42]. Each grapevine was inoculated at two anatomically distinct positions: the lignified shoot (scion), above the graft union, and the basal rootstock zone, below the graft union. This dual-site inoculation approach was used to mimic the ability of N. parvum to colonize wounds on both aerial and basal grapevine organs, and to evaluate potential differences in pathogen development across hydraulically and functionally distinct tissues.
Wounds (approximately 6 mm in length) were created using a sterile scalpel by removing the bark and exposing the vascular cambium. A 6 mm mycelial plug taken from the actively growing margin of 10-day-old PDA cultures was placed directly onto the exposed tissue, with the mycelial surface facing the plant. Each inoculation site was covered with a sterile cotton pad moistened with distilled water that had been autoclaved and sealed with Parafilm® to maintain high humidity and encourage infection. Control plants received sterile PDA plugs. Disease severity was assessed by destructive sampling at two time points: Seven days post-inoculation for the scion and 80 days post-inoculation for the rootstock, reflecting the faster symptom development in young scion tissues compared with the slower colonization dynamics typically observed in woody rootstock tissues.
During each sampling, the bark tissue was carefully removed. Lesion length and width were measured in both shoots and rootstocks using precision caliber, and lesion extent was used as a proxy for fungal aggressiveness under the different irrigation regimes. Disease severity was evaluated using an ordinal scale ranging from 0 (no symptoms) to 5 (maximum severity) and expressed as the McKinney Disease Severity Index (MKI, %). The MKI was calculated as
MKI (%) = (Σvᵢ/(N × D)) × 100
where vi is the severity score assigned to each plant, N is the total number of evaluated plants, and D is the maximum value of the severity scale (D = 5).
To confirm pathogen establishment and exclude contamination, fungal re-isolation was carried out from the margins of necrotic tissues. Wood fragments (~0.5 cm) were plated on PDA amended with streptomycin sulfate (25 mg L−1) and incubated at 25 ± 1 °C. Colony morphology was compared with that of the original isolate to fulfill Koch’s postulates.

2.5. Statistical Analysis

Statistical analyses were conducted on proximal sensing variables (NDVI and Tleaf) for assessing the main effects of the WR and pathogen infection, as well as their potential interaction, under the controlled-environment conditions.
The effect of the WR was initially assessed using one-way analysis of variance (ANOVA). When appropriate, two-way ANOVAs were performed considering WR and inoculation period (time: pre and post–inoculation) as fixed factors, along with their interaction (WR × Time), to evaluate whether pathogen infection modulated plant responses across different irrigation levels. Post hoc comparisons among treatment means were performed using Tukey’s Honestly Significant Difference (HSD) test, with p-values < 0.05 considered significant. The F-test was used to assess whether the variability among treatment means was significantly greater than the variability within treatment. When significant F-values were detected (p < 0.05), post hoc mean separation was performed using HSD test. Disease severity data (MKI) were analyzed separately for shoots and rootstocks. For inoculated plants, the effect of the irrigation regime on disease severity was evaluated using one-way ANOVA. MKI percentage values were arcsine square-root transformed prior to ANOVA to meet model assumptions. Homogeneity of variance was evaluated using the diagnostic outputs of the statistical software. When significant effects were detected, mean separation was performed using HSD test (p < 0.05). Non-inoculated control plants that consistently showed no disease symptoms (MKI = 0) were not included in the statistical analysis. Correlation analyses were performed to assess the relationships between Tleaf and NDVI, respectively, and lesion severity. All statistical analyses were conducted using Statistix software (version 9.0). The same statistical analysis was performed separately for both Experiment 1 and 2.

3. Results

3.1. Proximal Sensing Indicators of Water Stress

3.1.1. Thermal Leaf Monitoring

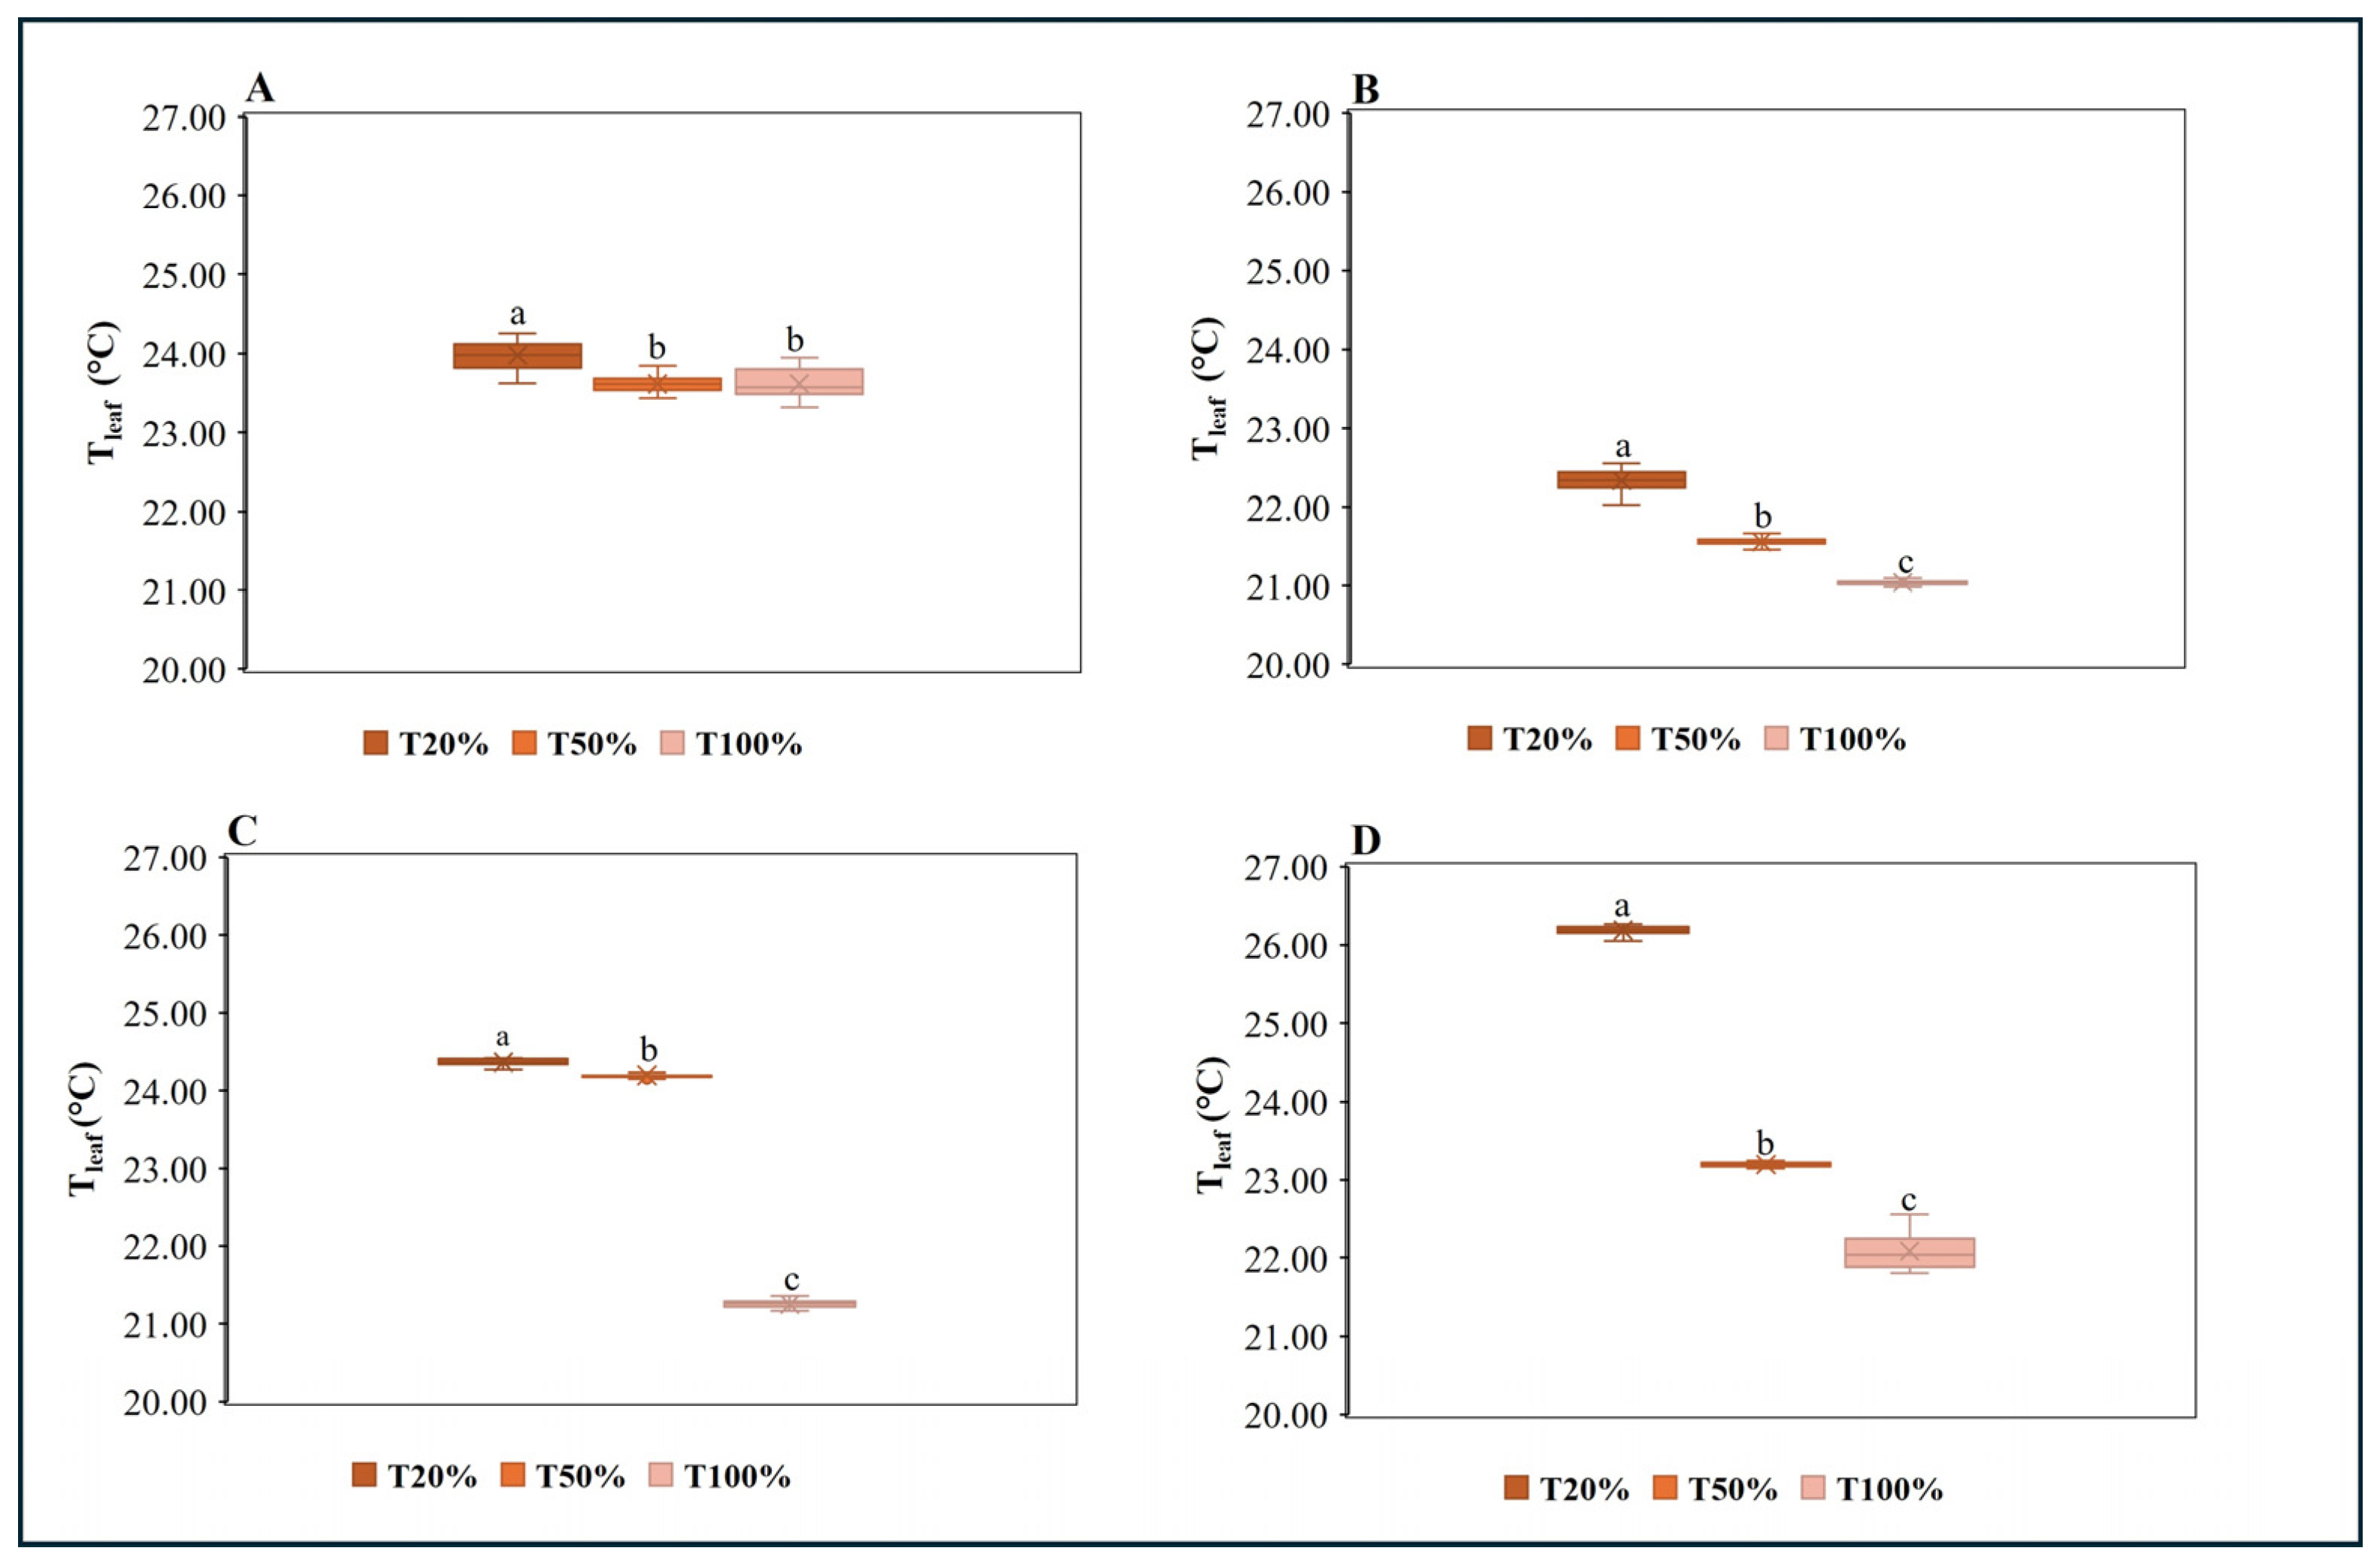
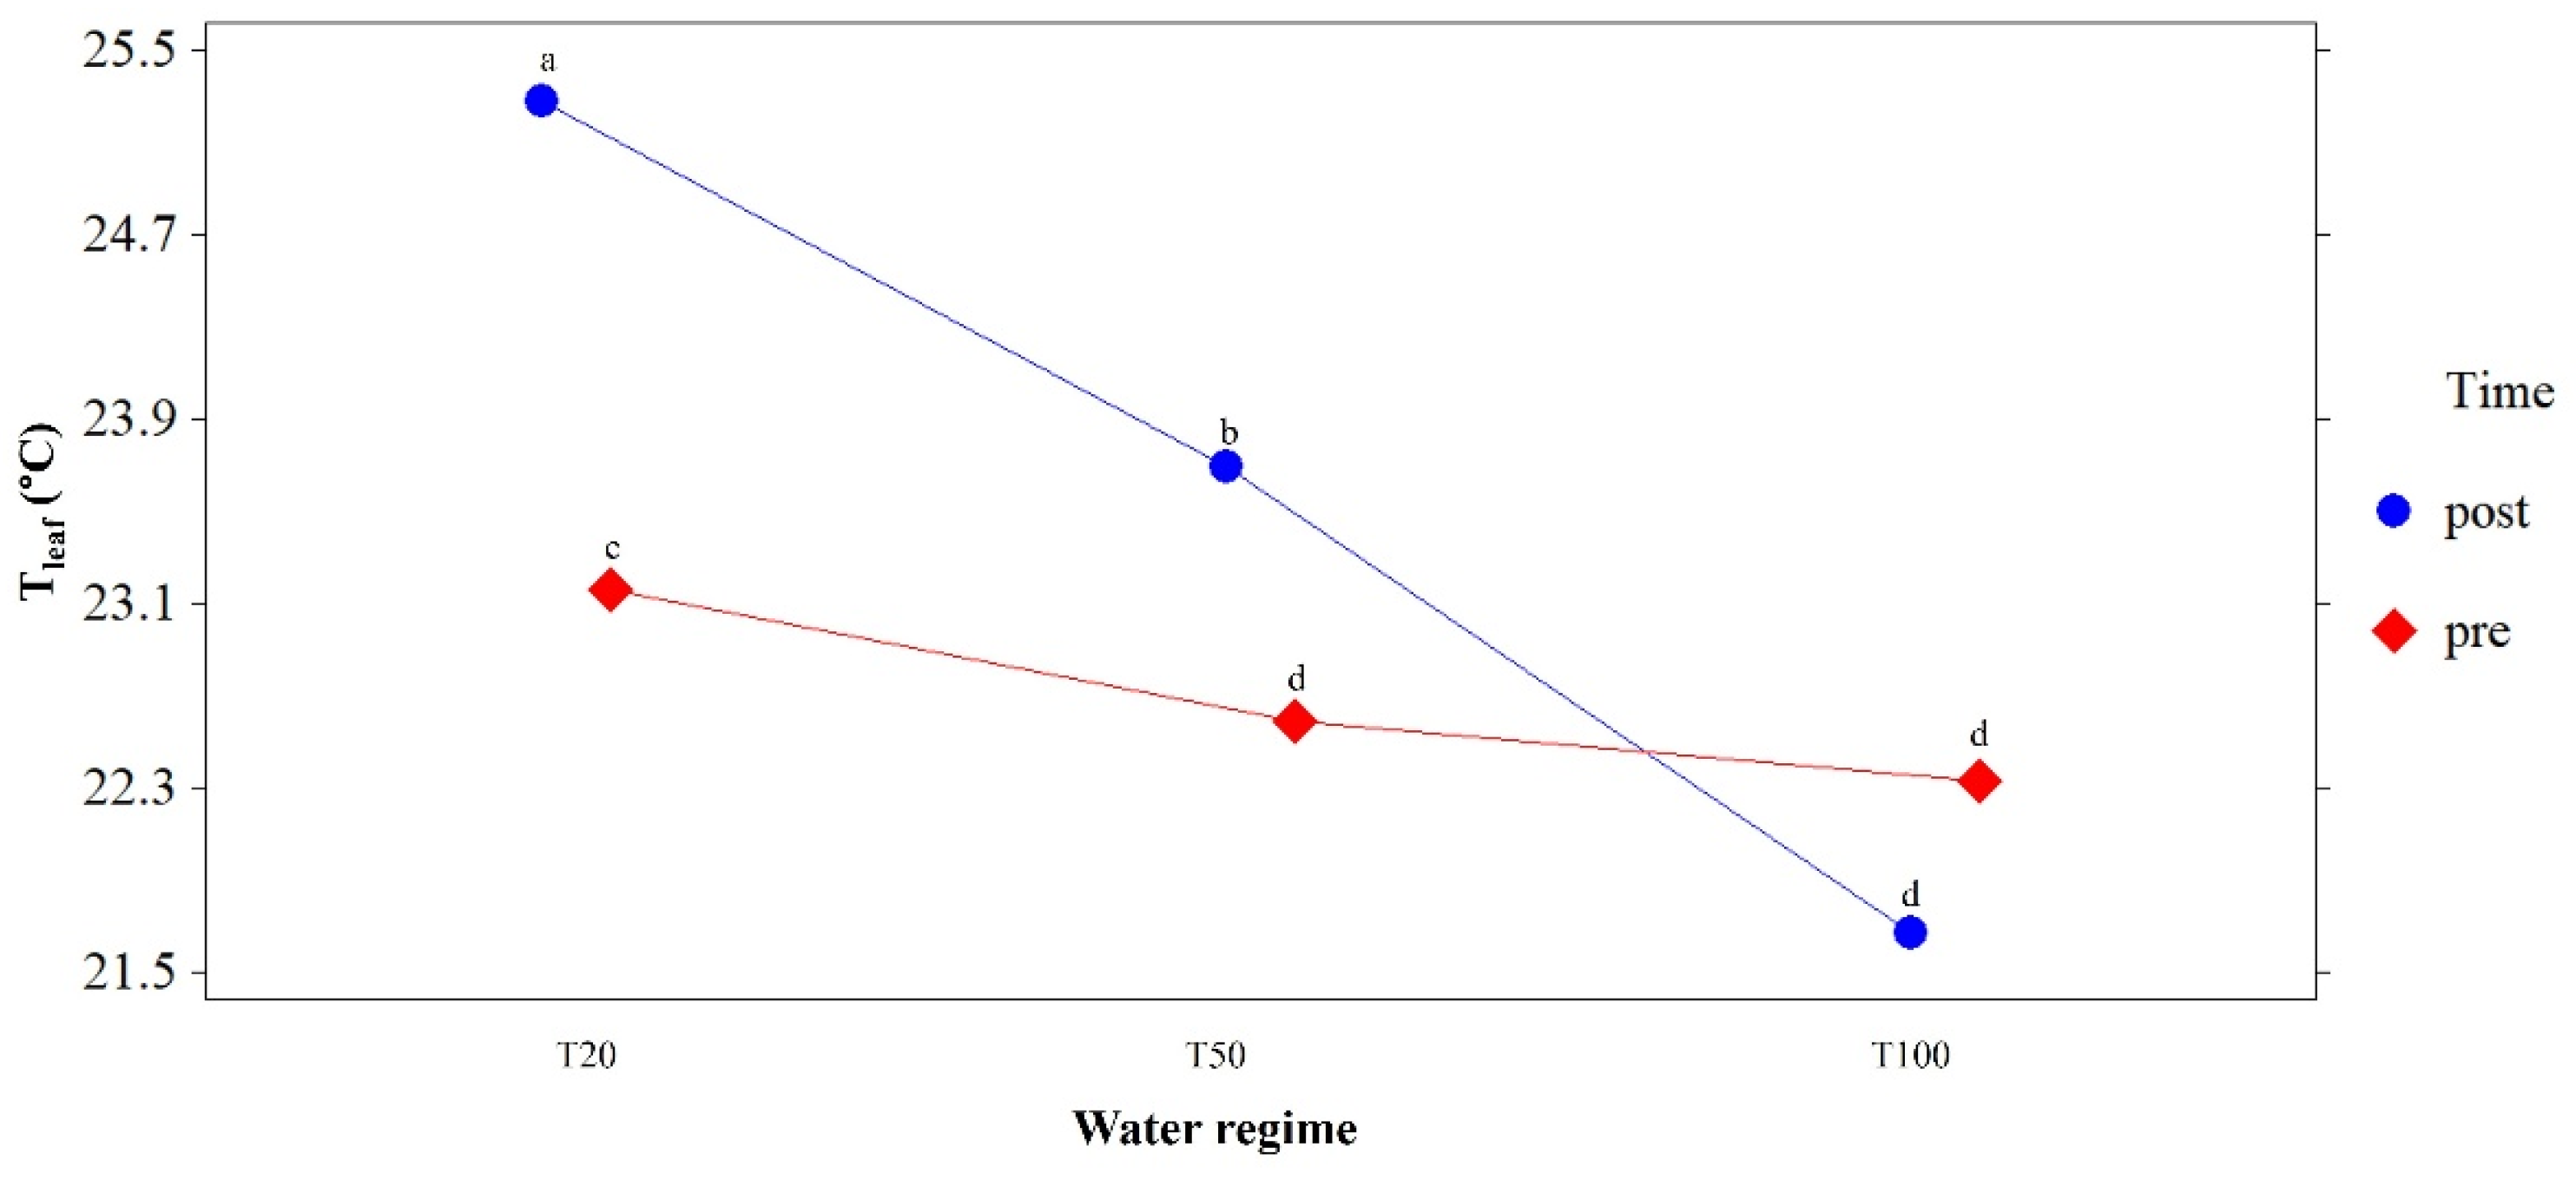
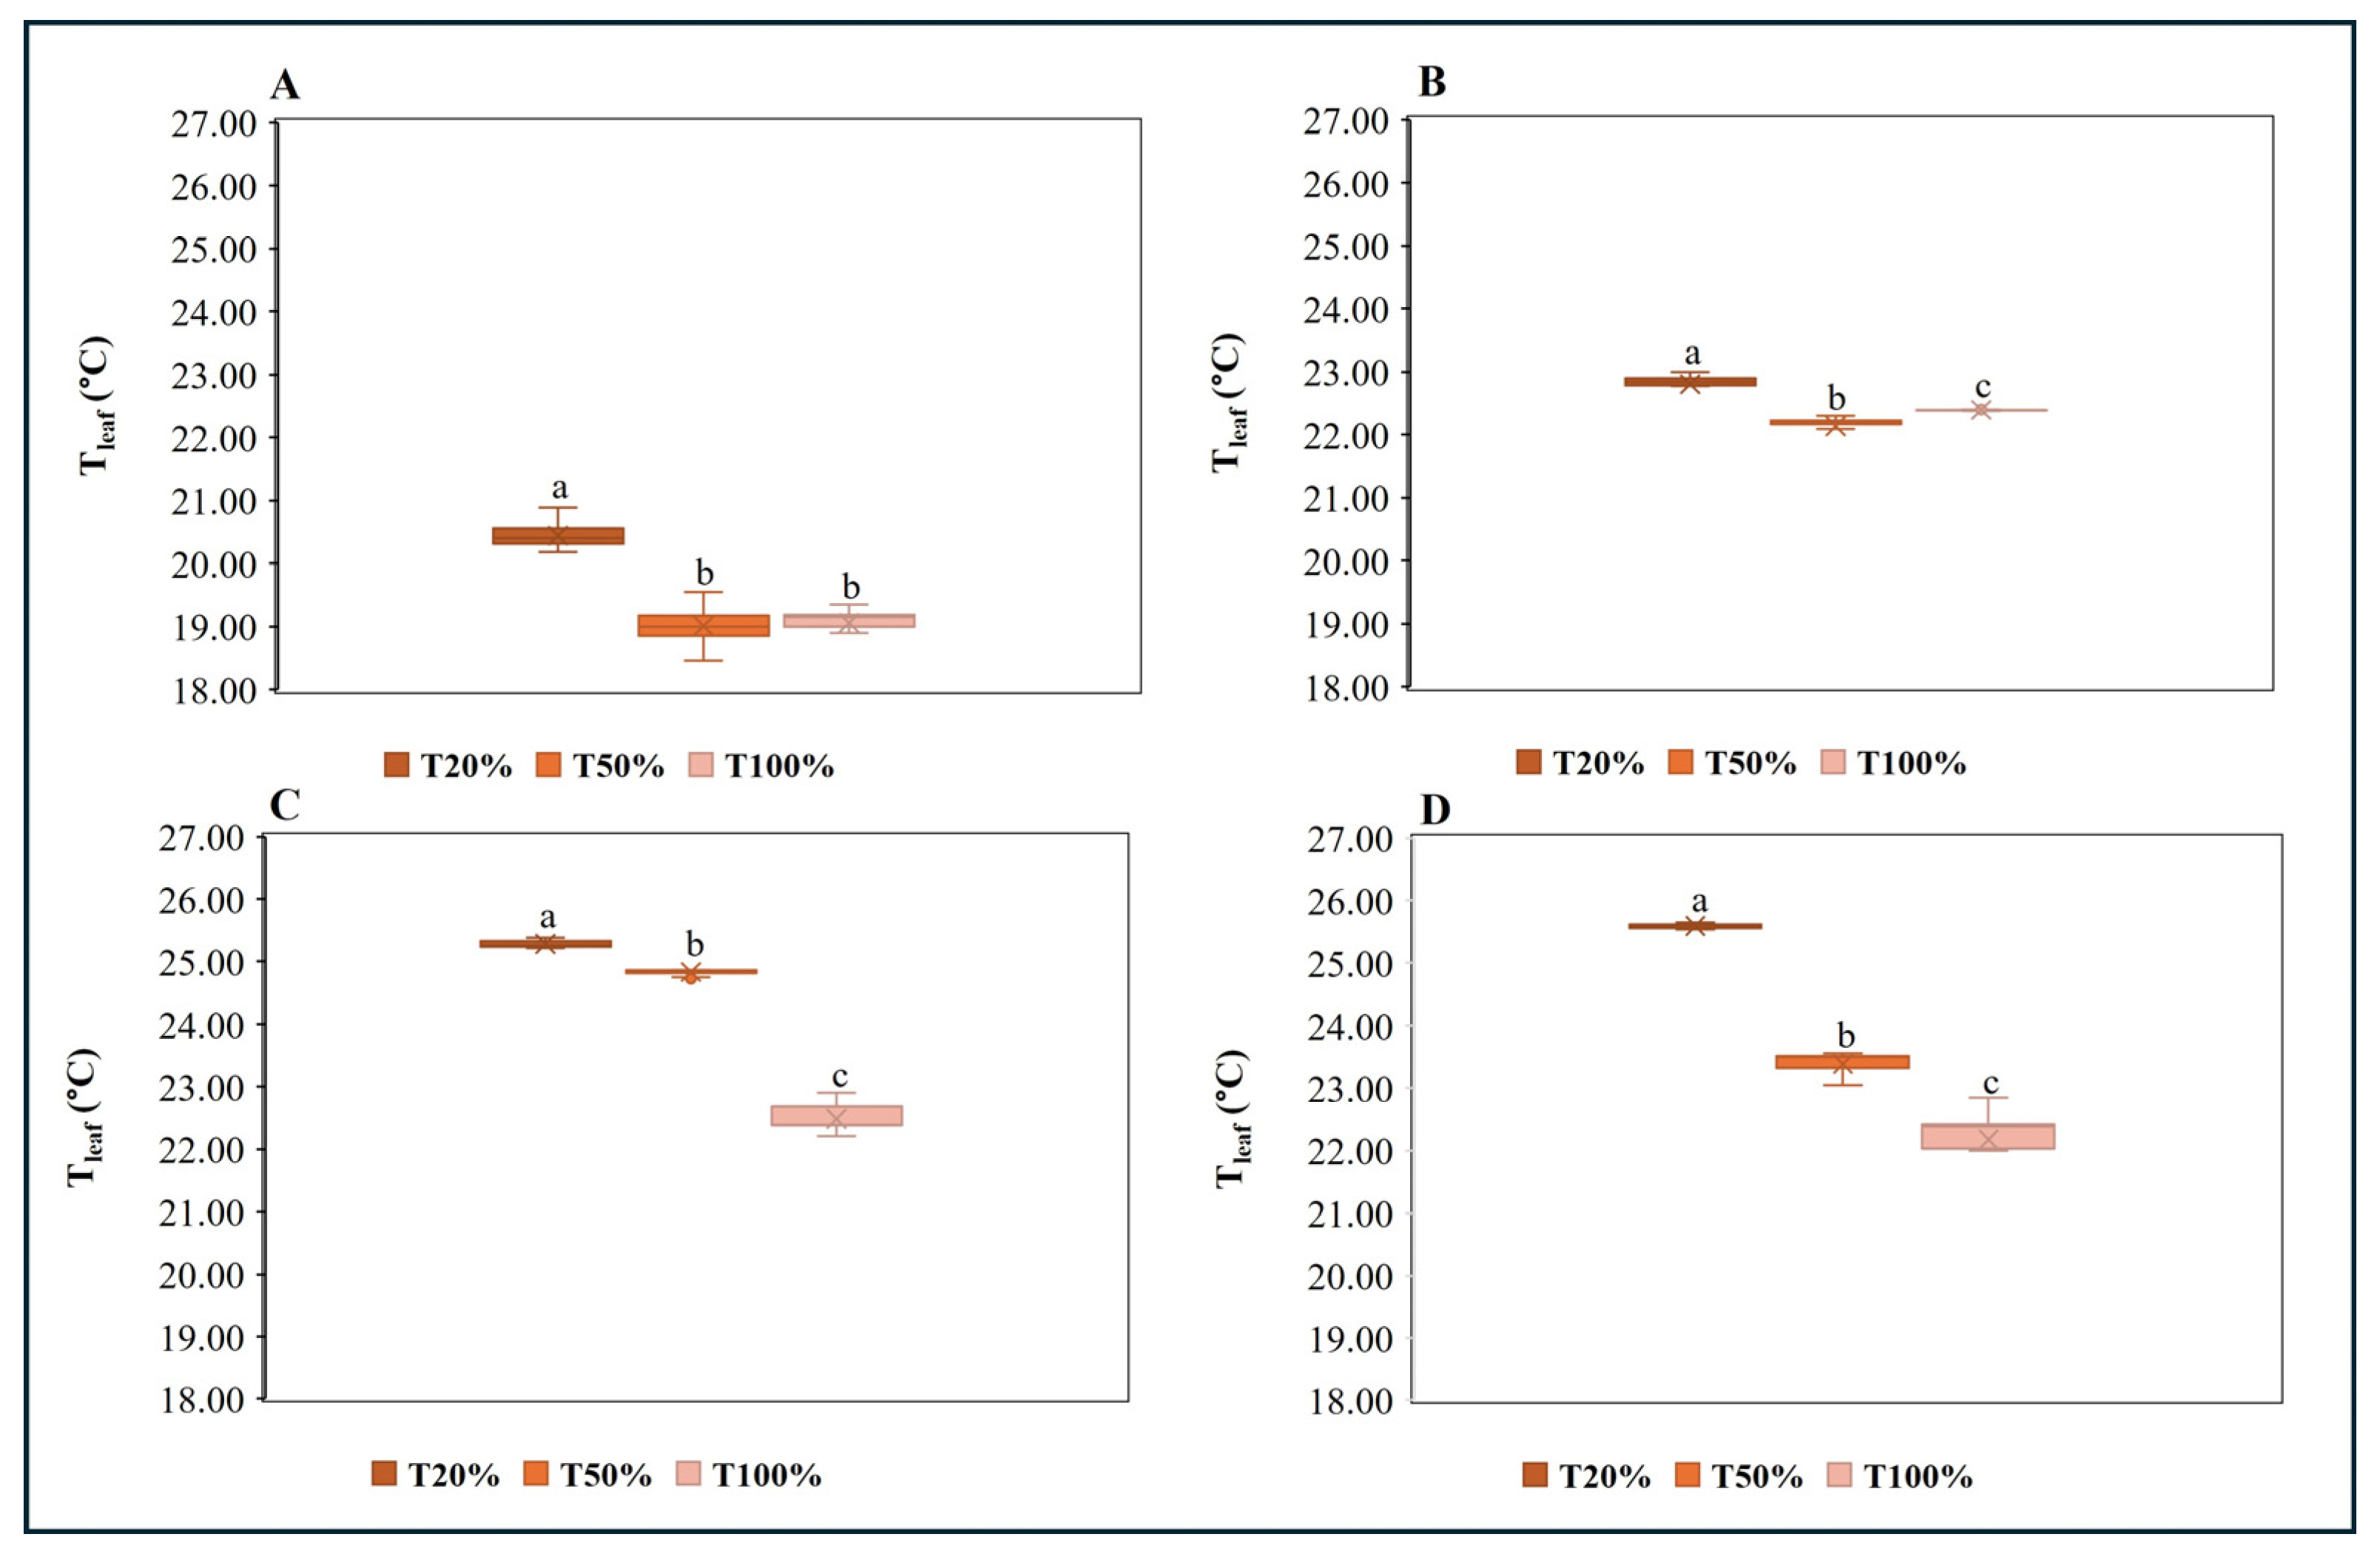
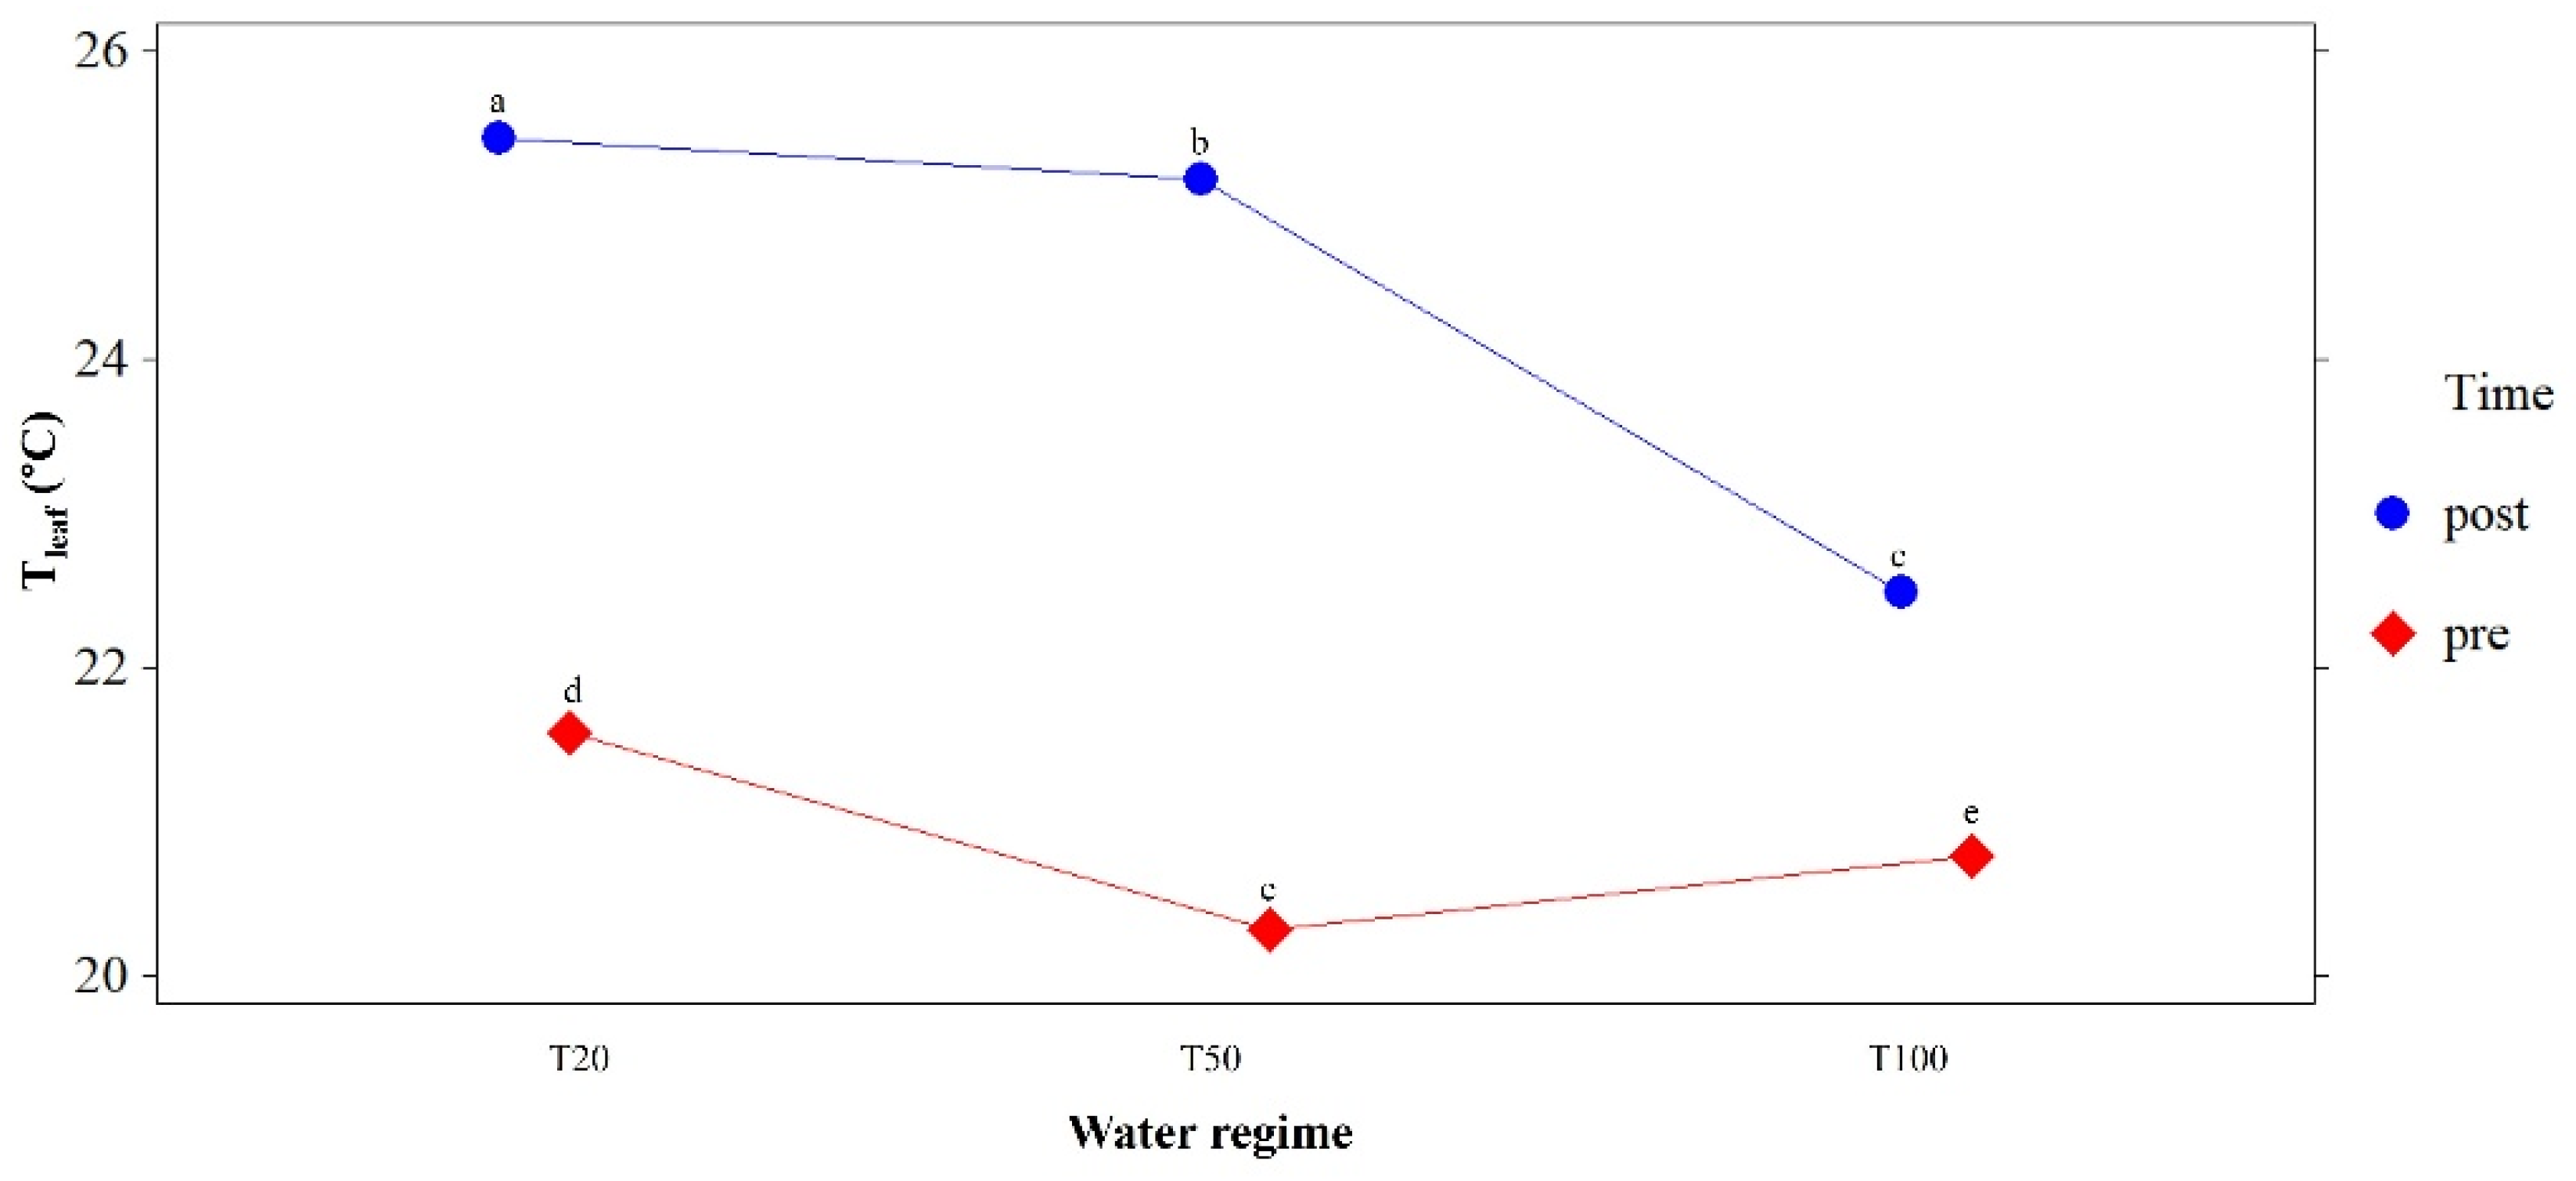
TIR monitoring detected apparent differences in Tleaf among the WRs over both experiments. Across all monitoring dates, Tleaf values followed a consistent gradient with decreasing water availability. During the pre-inoculation period (April and May 2024, Figure 2A,B), differences in Tleaf among WRs were evident. In April, the mean Tleaf values were 23.98 ± 0.18 °C for T20%, 23.61 ± 0.10 °C for T50%, and 23.62 ± 0.10 °C for T100%. In May, the Tleaf values decreased across all WRs, with a relatively similar pattern, resulting in mean values of 22.33 ± 0.12 °C (T20%), 21.56 ± 0.05 °C (T50%), and 21.04 ± 0.03 °C (T100%). Following pathogen inoculation with N. parvum in June and July, Tleaf increased (Figure 2C,D). In June, the mean Tleaf values were 24.36 ± 0.04 °C for T20%, 24.19 ± 0.03 °C for T50%, and 21.25 ± 0.05 °C for T100%, which corresponded to a temperature difference of approximately 3 °C between T20% and T100%. This difference further increased in July, reaching Tleaf values of 26.19 ± 0.05 °C (T20%), 23.19 ± 0.03 °C (T50%), and 22.09 ± 0.21 °C (T100%), indicating in a maximum temperature gap of 4.1 °C between T20% and T100%. Similar behavior was obtained during the second experimental repetition (see Appendix A, Figure A1). Two-way ANOVAs confirmed that Tleaf was significantly affected by WR (F = 247.02, p-value < 0.001) and inoculation period (Time; F = 110.81, p-value < 0.001), with a significant WR × Time interaction (F = 99.19, p-value < 0.001). Post hoc Tukey’s HSD test performed on the WR × Time interaction revealed significant differences among all treatment combinations (p < 0.05; Figure 3). The highest canopy temperature was observed in severely stressed vines after inoculation (T20% post), whereas fully irrigated plants maintained the lowest Tleaf values, particularly in the post-inoculation period. This interaction indicates that the effect of water availability on Tleaf differed between pre- and post-inoculation conditions. Overall, thermal measurements highlighted a progressive divergence in canopy temperature among irrigation regimes over time, particularly during the post-inoculation phase, confirming Tleaf as a sensitive indicator of plant response to water deficit under the imposed experimental conditions. A similar behavior was obtained during the second experimental repetition (see Appendix A, Figure A2).

3.1.2. Multispectral Leaf Monitoring

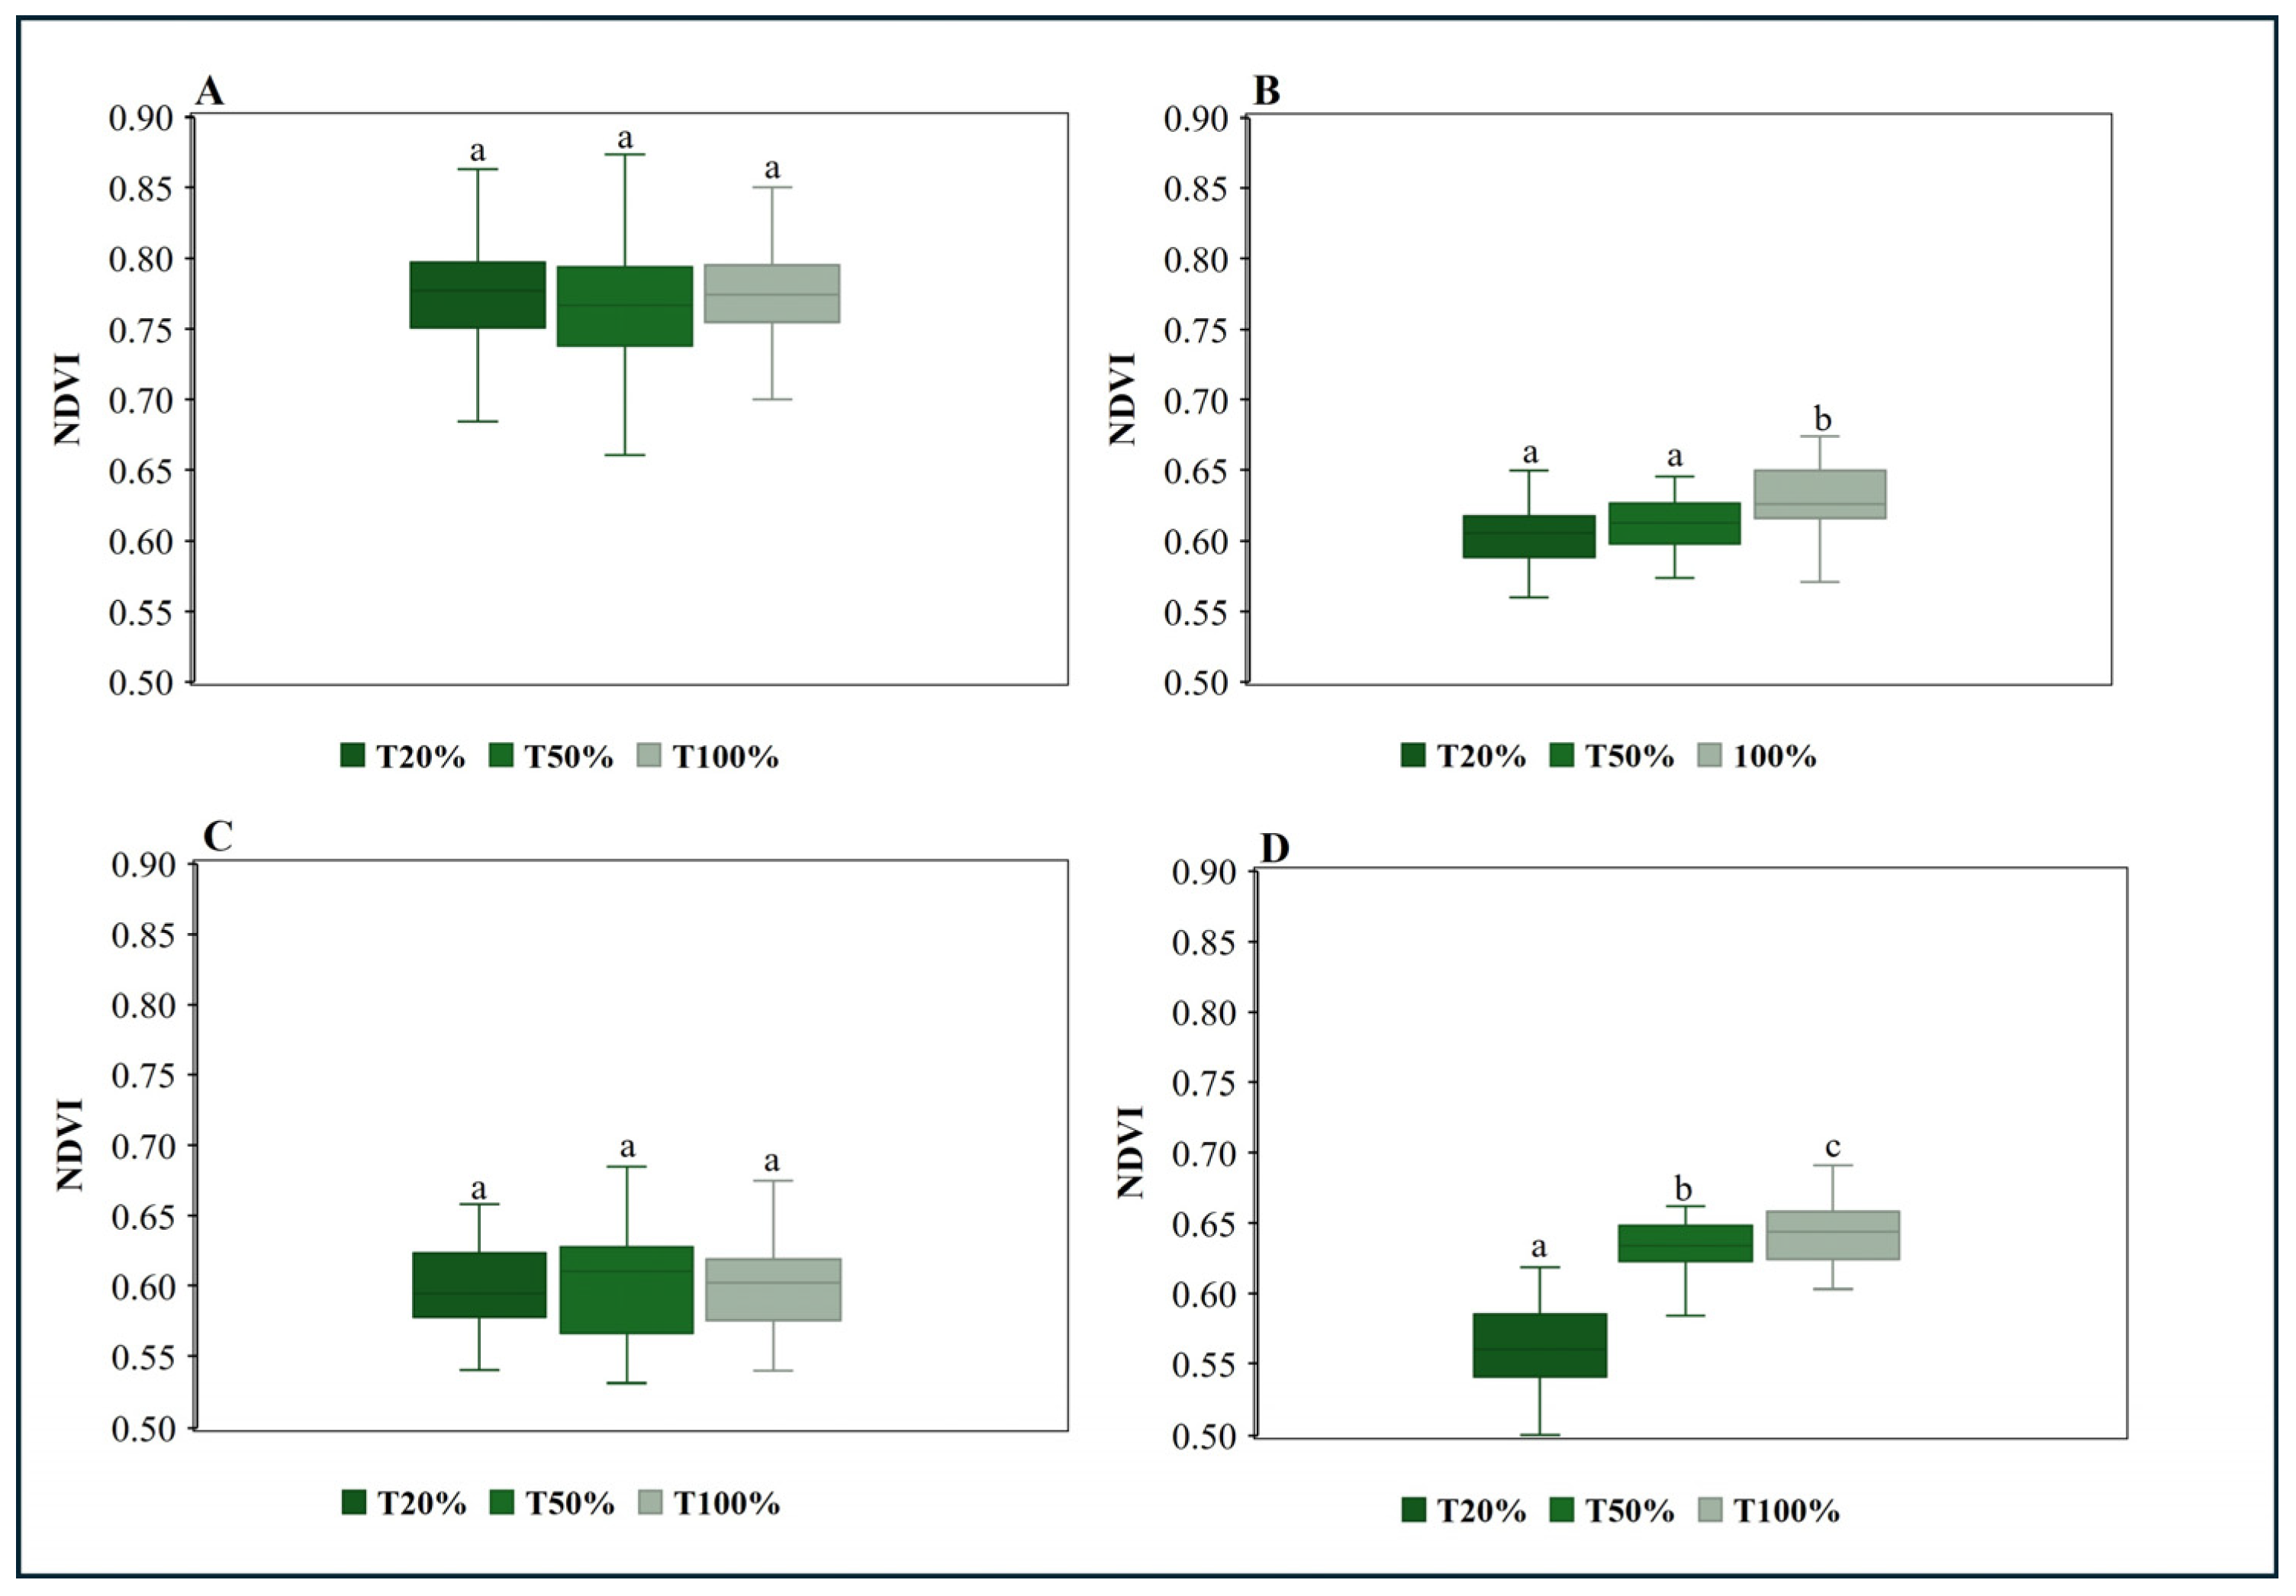
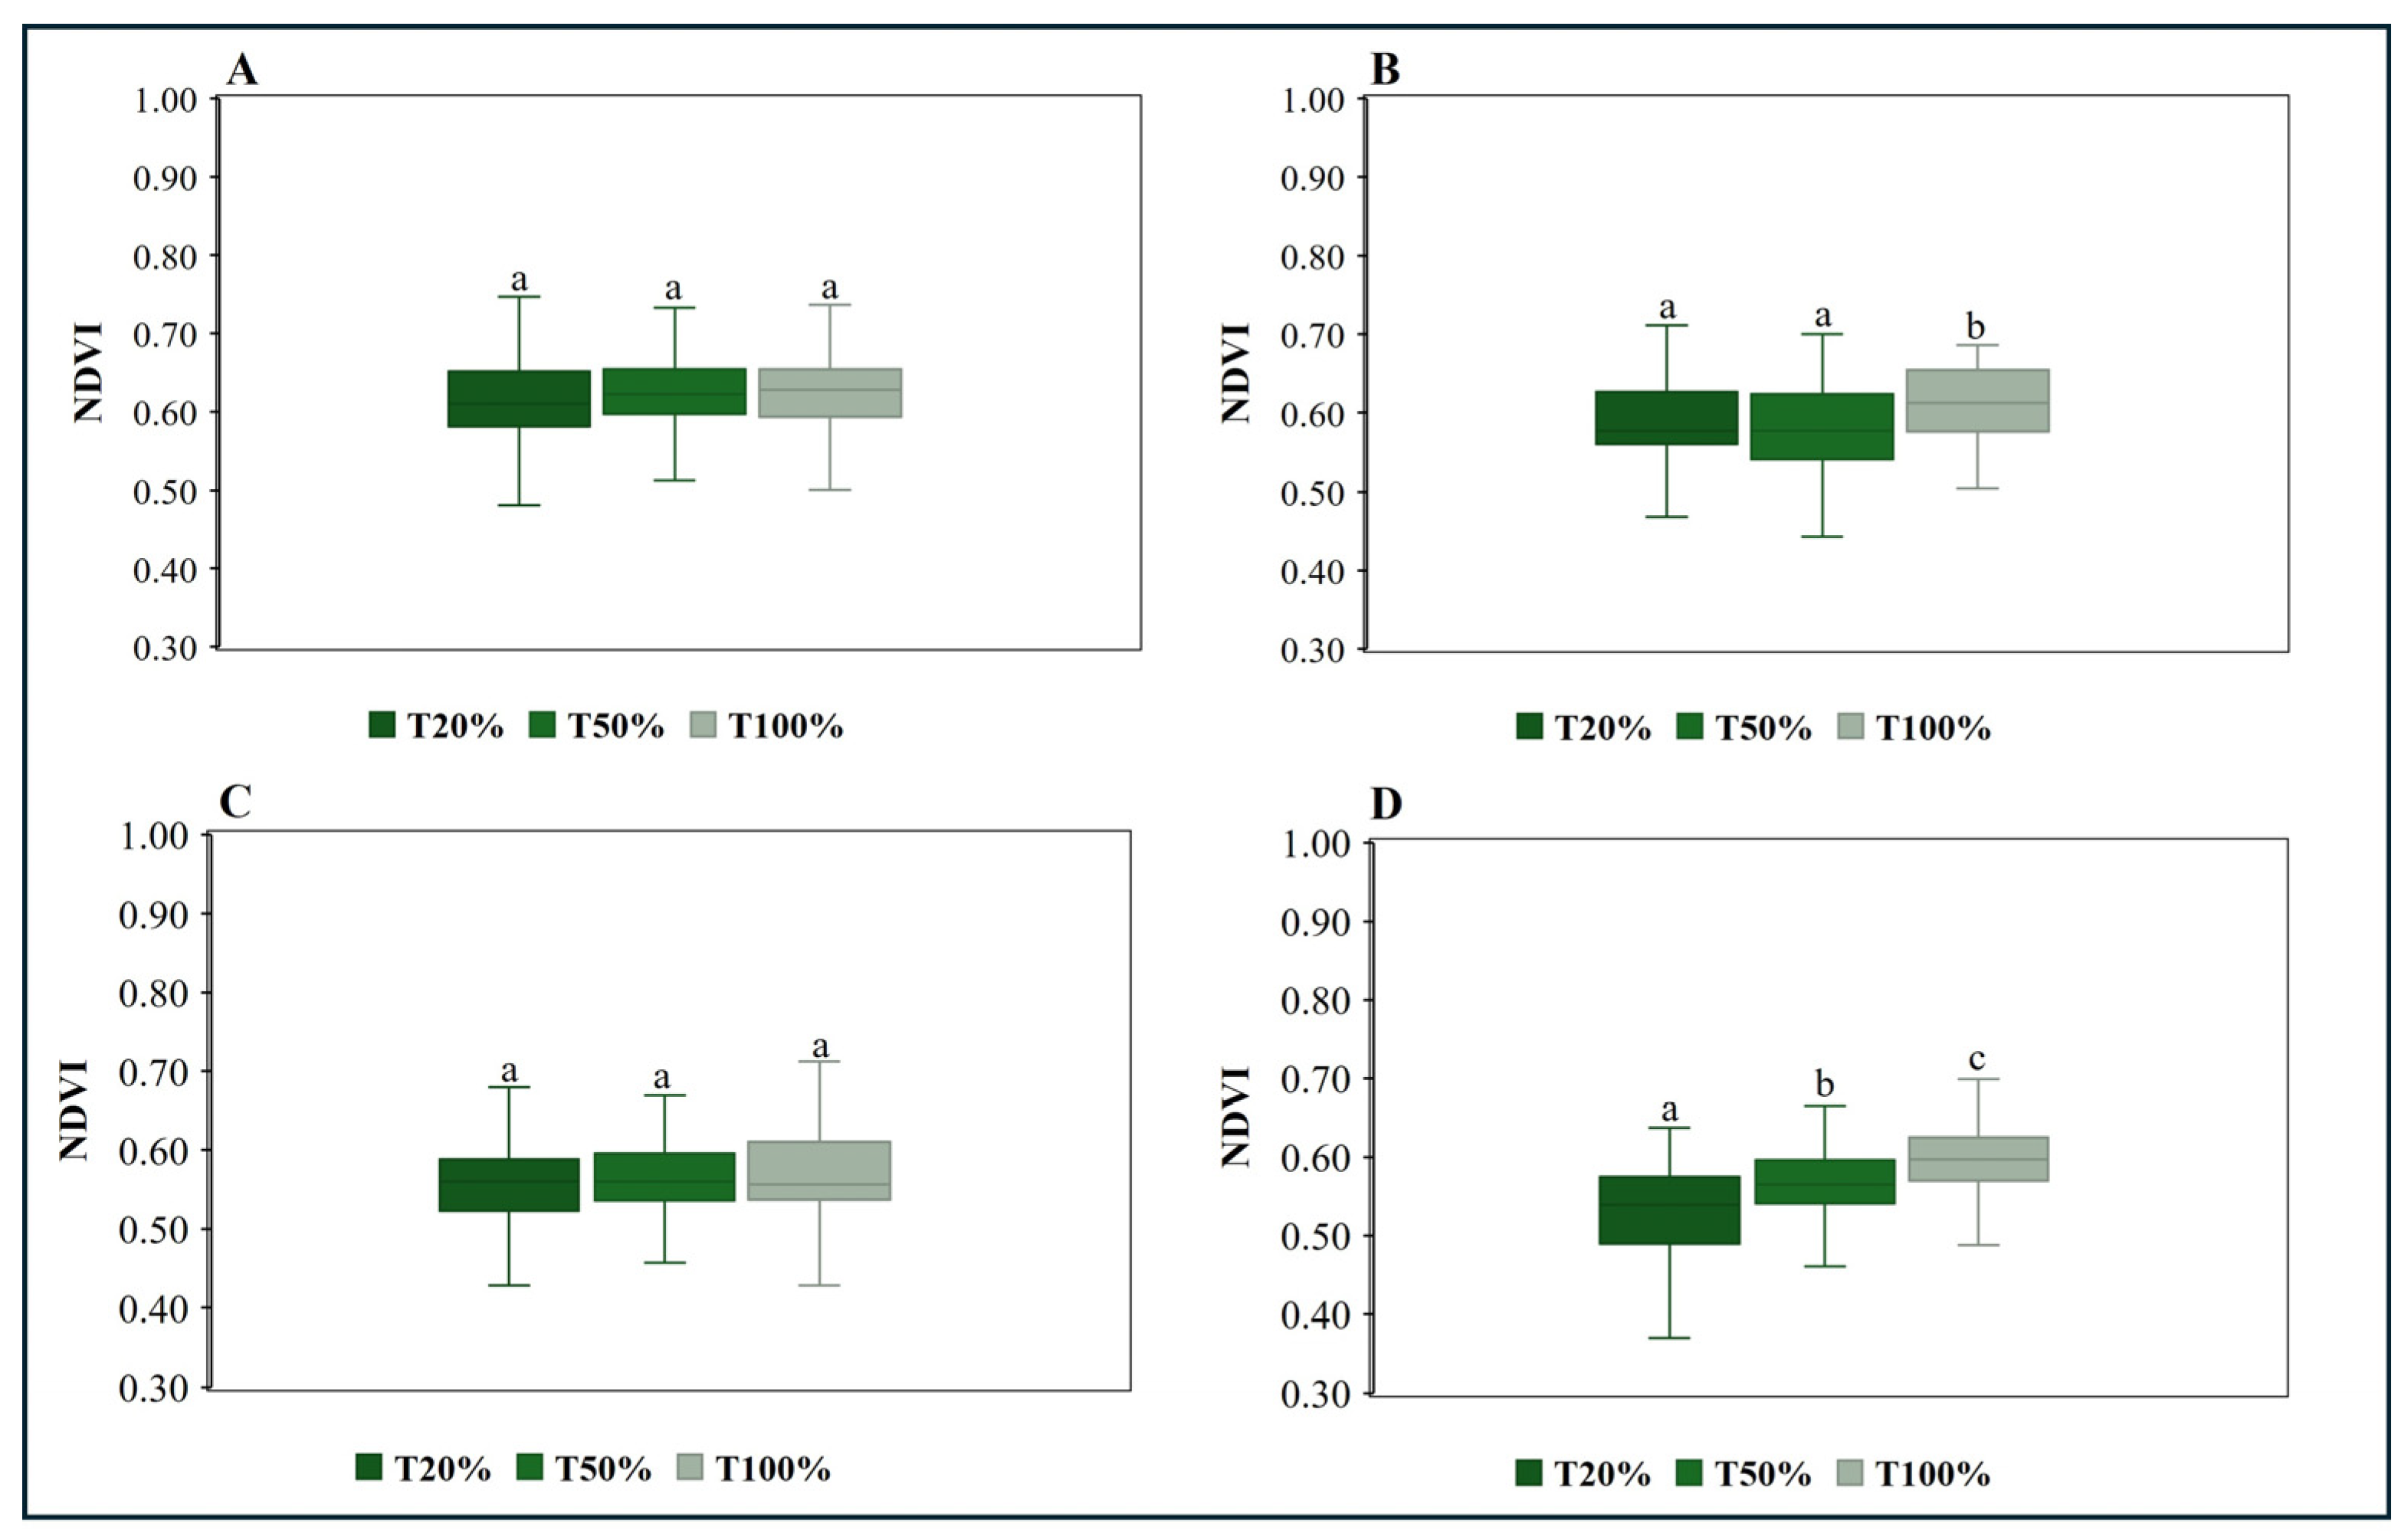
NDVI monitoring confirmed the impact of the WRs across both experimental repetitions. Throughout the experiment, NDVI values remained lower in T20% compared to T50% and T100%, reflecting a progressive decline associated with water deficit. During the pre-inoculation phase in April and May 2024 (Figure 4A,B), differences in NDVI values were significant only for T100%, resulting in mean values of 0.63 ± 0.02 compared to values of 0.61 ± 0.02 for T20% and T50%, respectively. Following pathogen inoculation in June 2024, similar NDVI values were observed at the explored WRs (Figure 4C). Pronounced separation was observed in July among all WRs, indicating NDVI values of 0.55 ± 0.03 for T20%, 0.63 ± 0.03 for T50%, and 0.68 ± 0.02 for T100%, respectively.
Two-way ANOVAs confirmed that NDVI was significantly affected by inoculation period (Time; F = 168.78, p-value < 0.001) and WR (F = 8.31, p-value < 0.001), while the WR × Time interaction was not significant (F = 2.83, p-value = 0.0601). Similar behavior was obtained during the second experimental repetition (see Appendix A, Figure A3).

3.2. Disease Severity Assessment

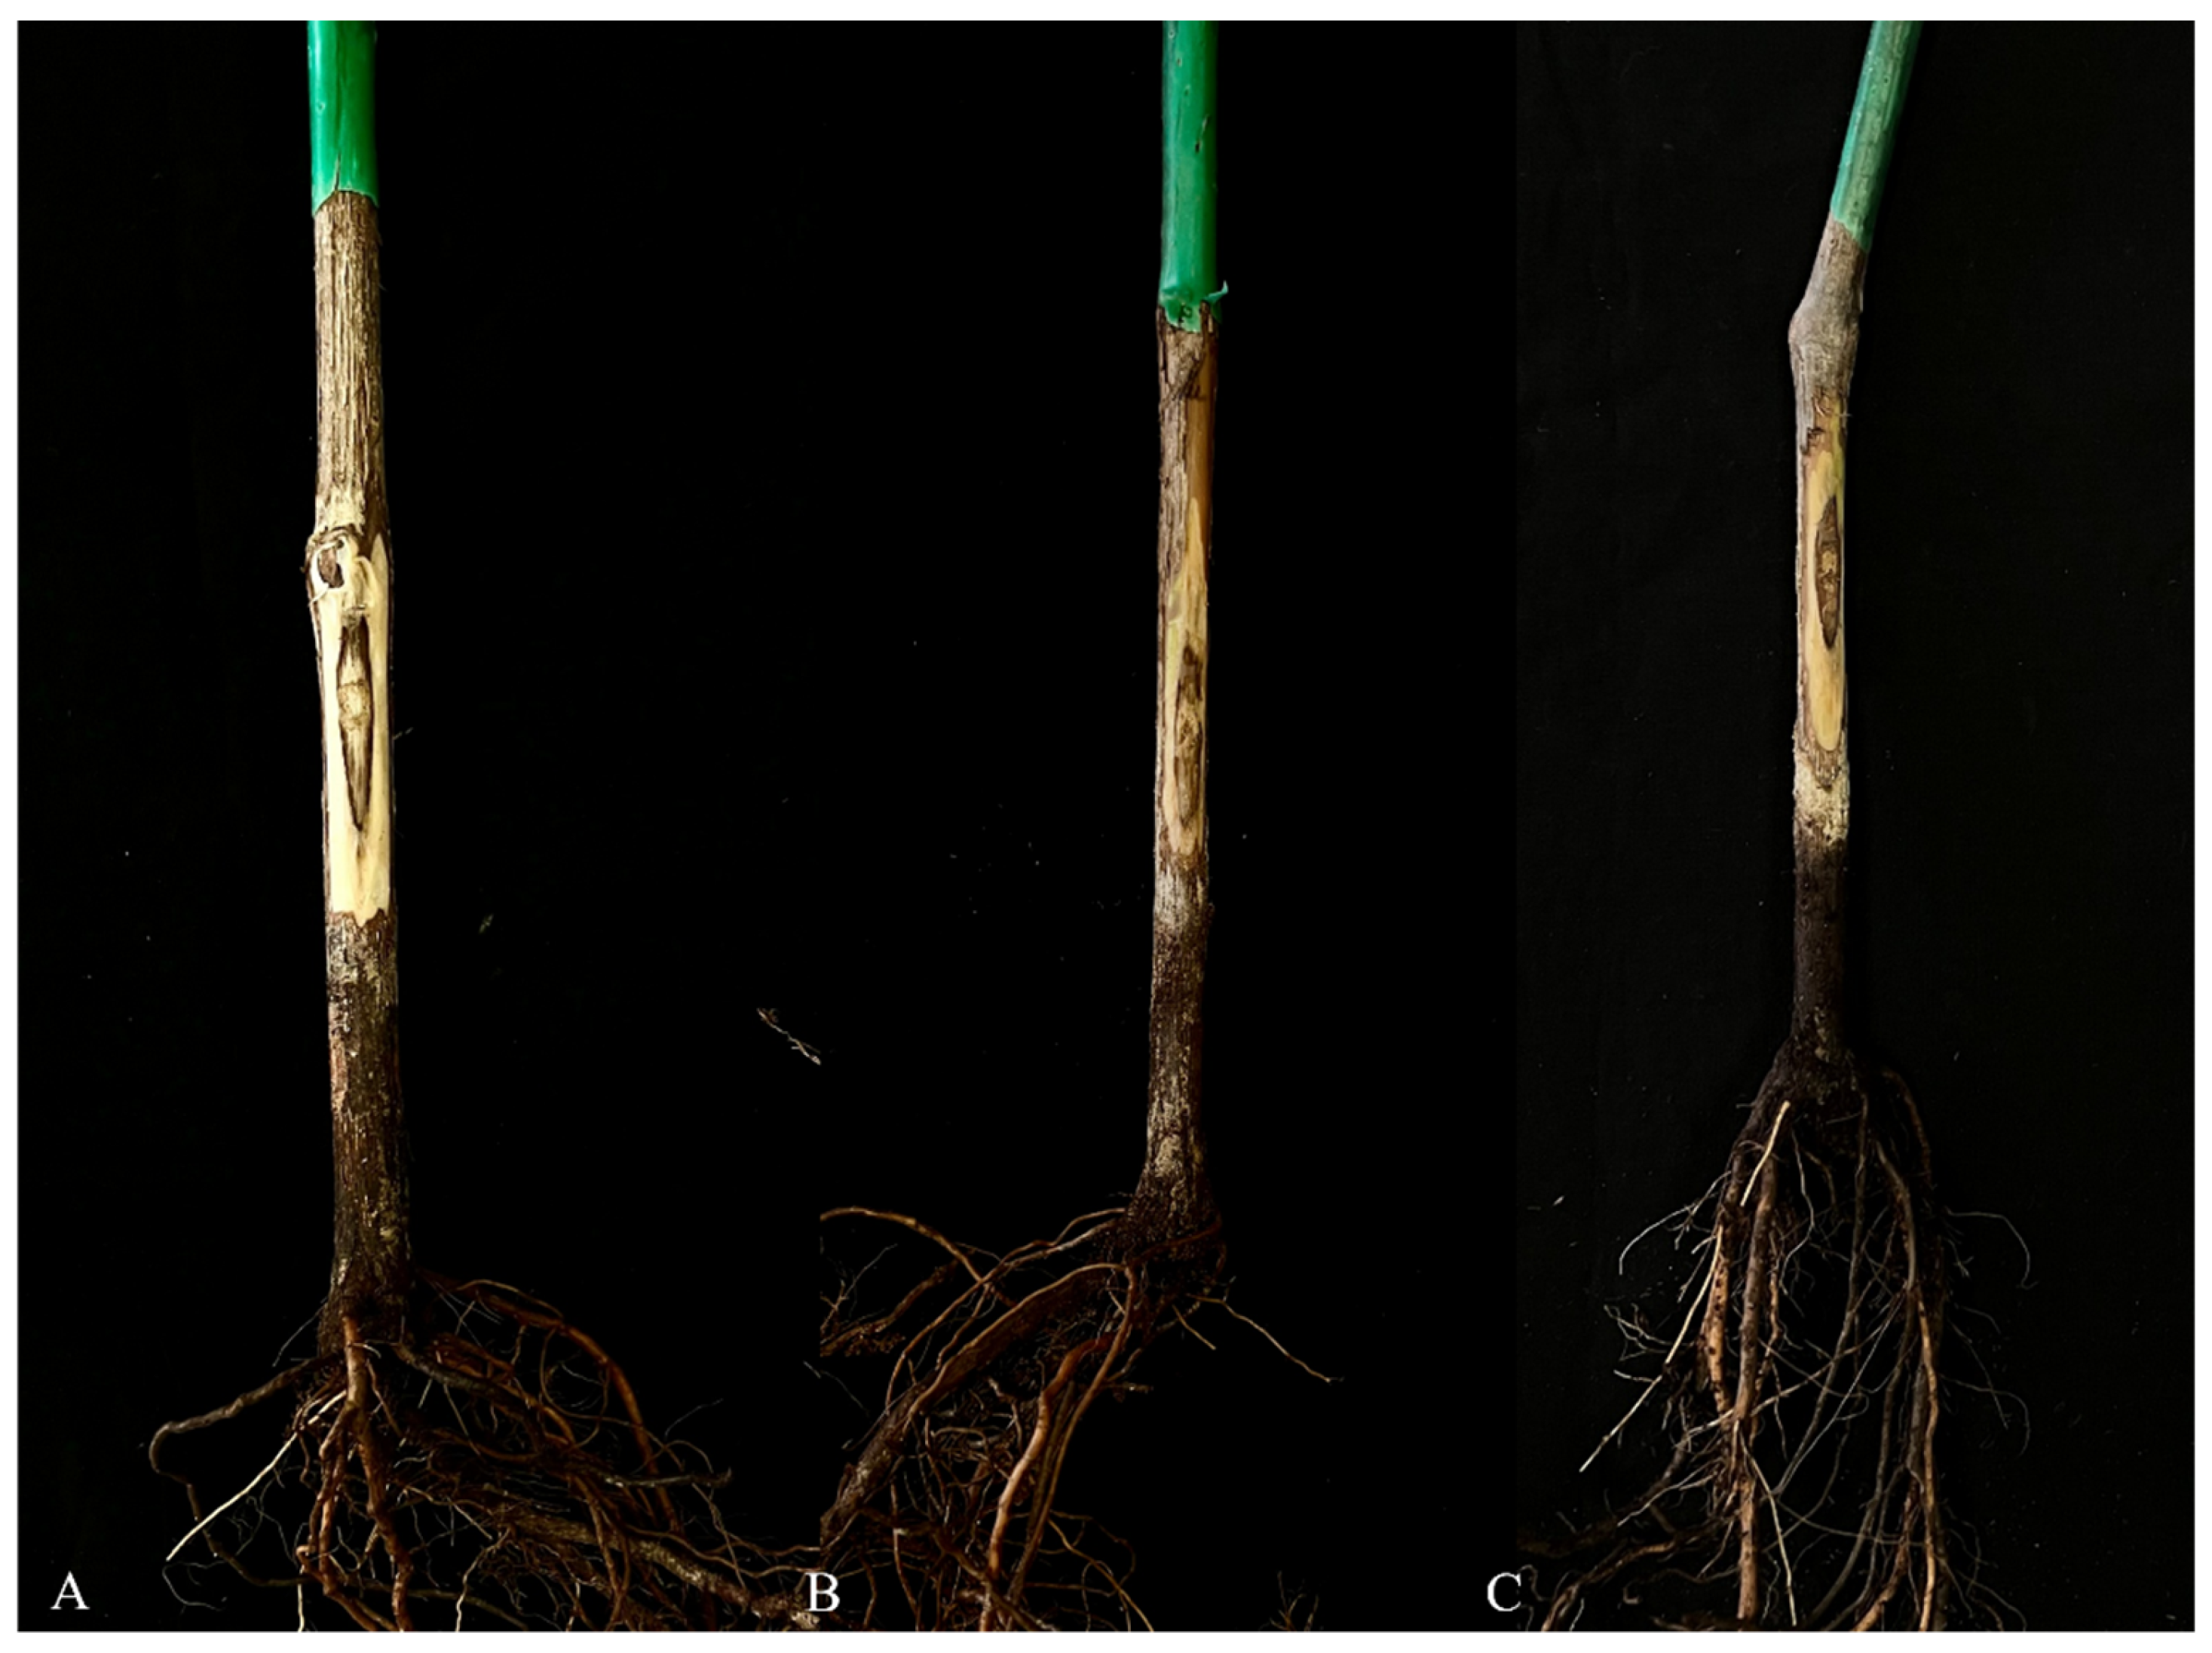
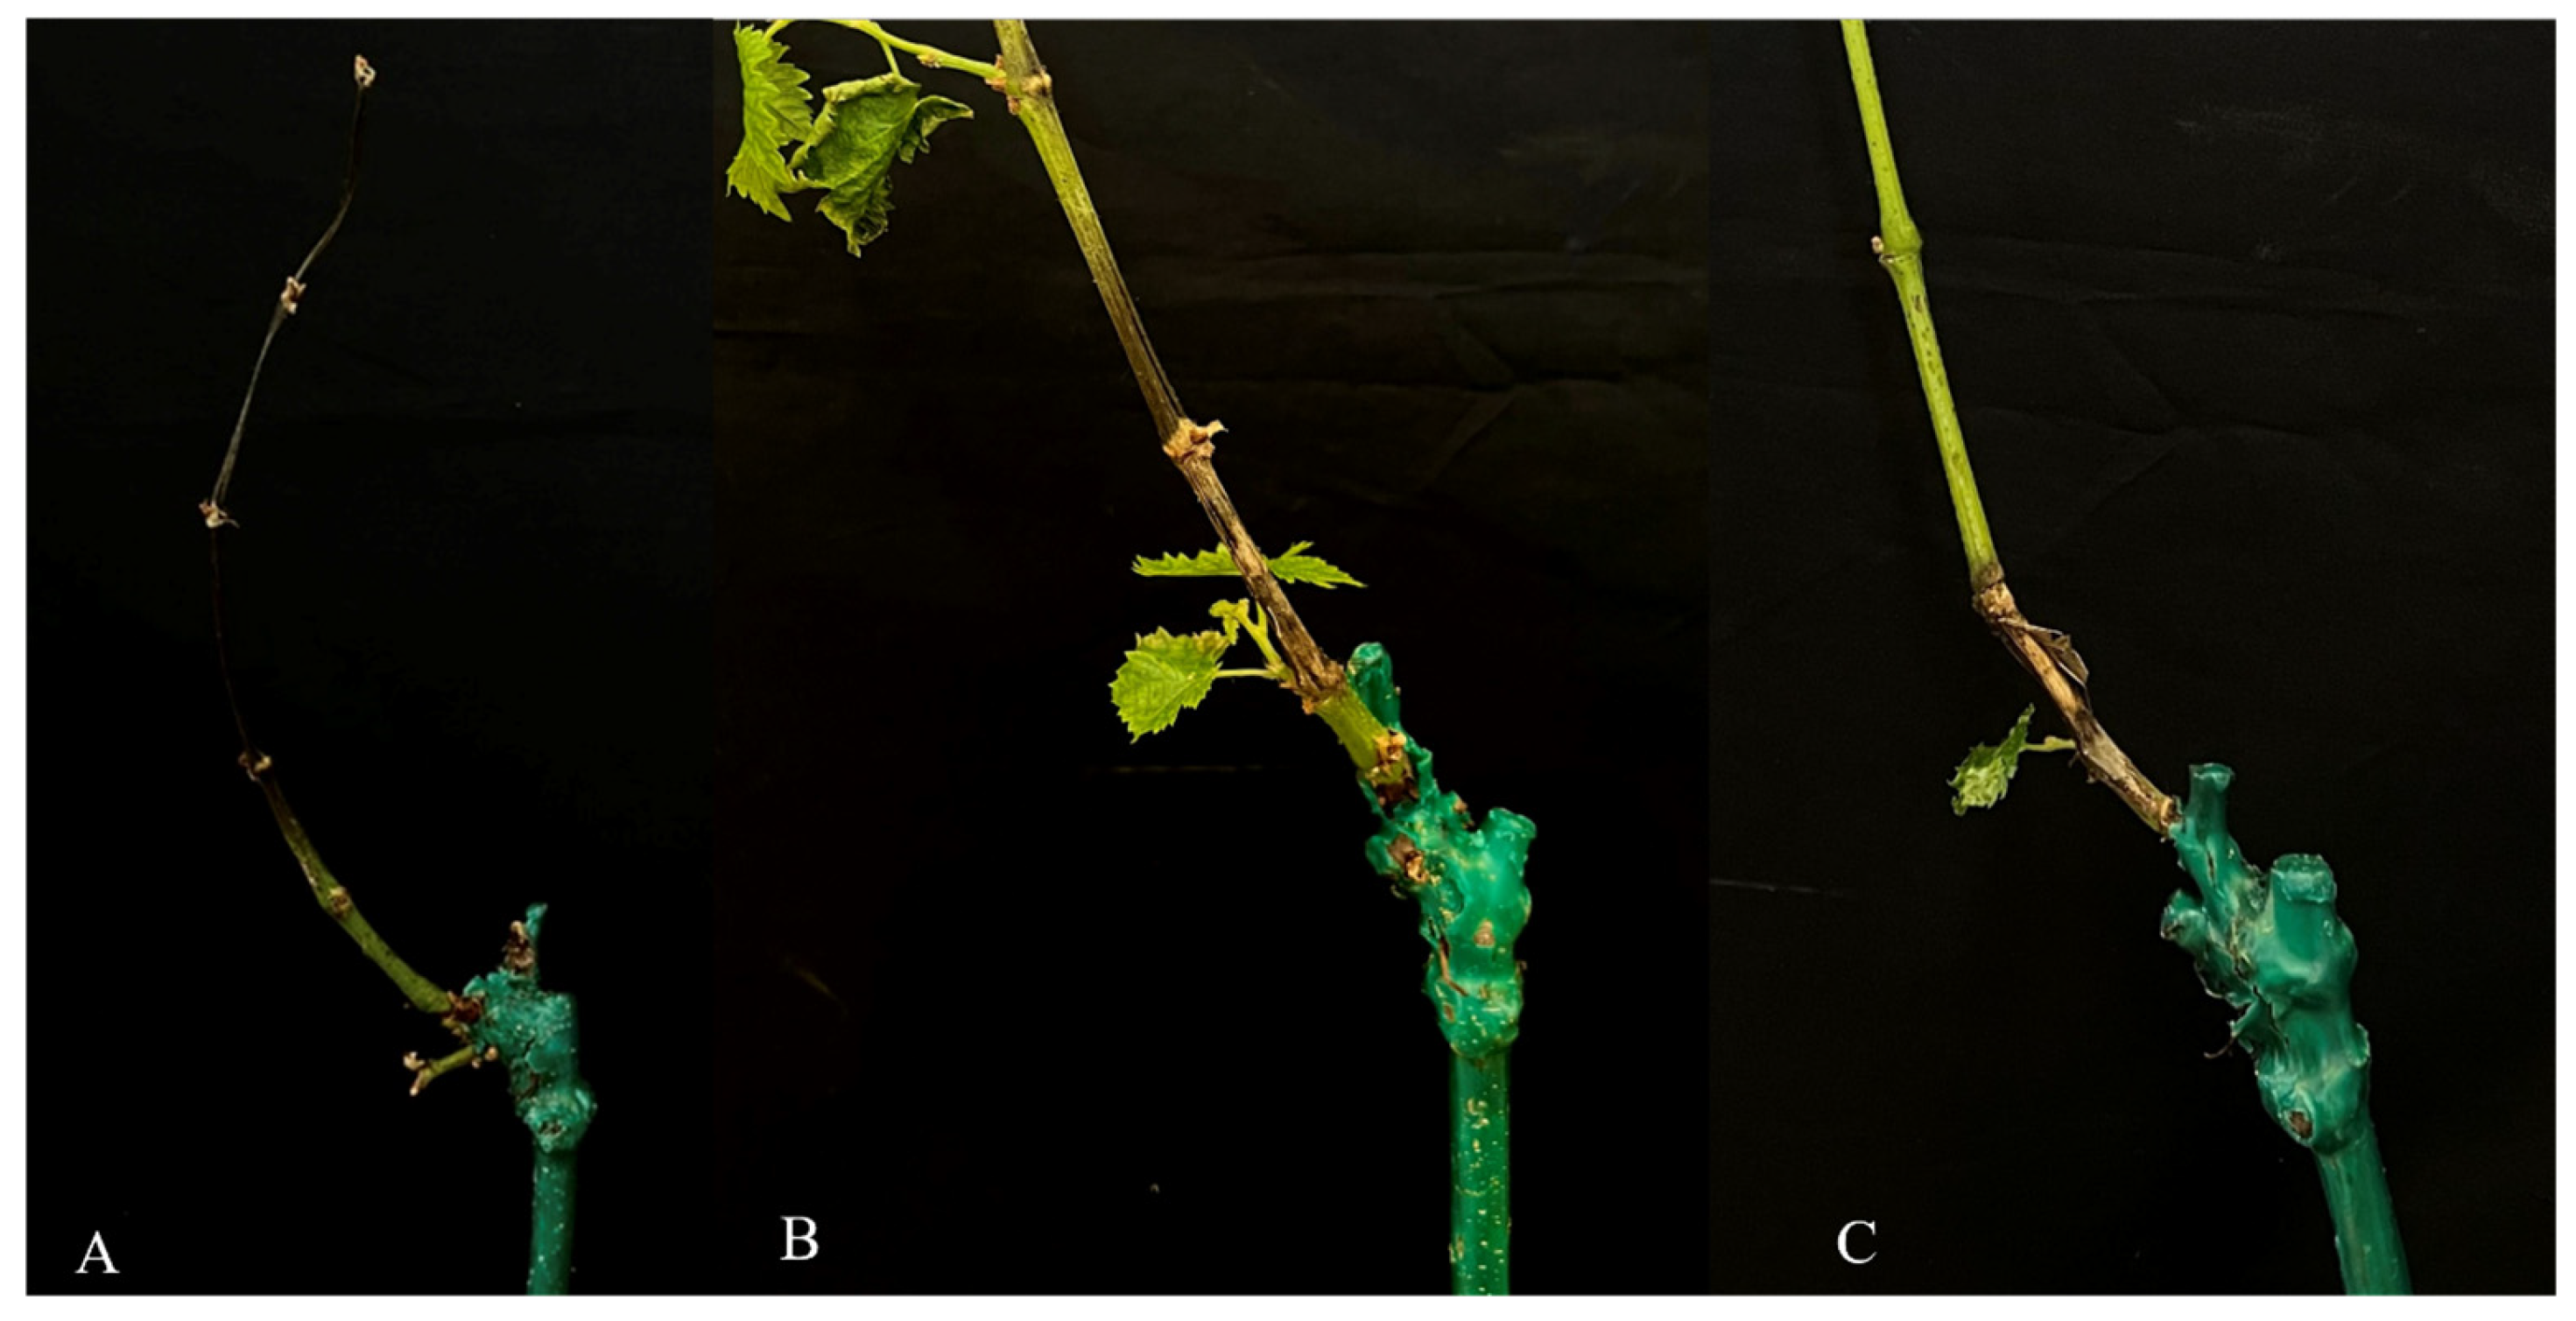
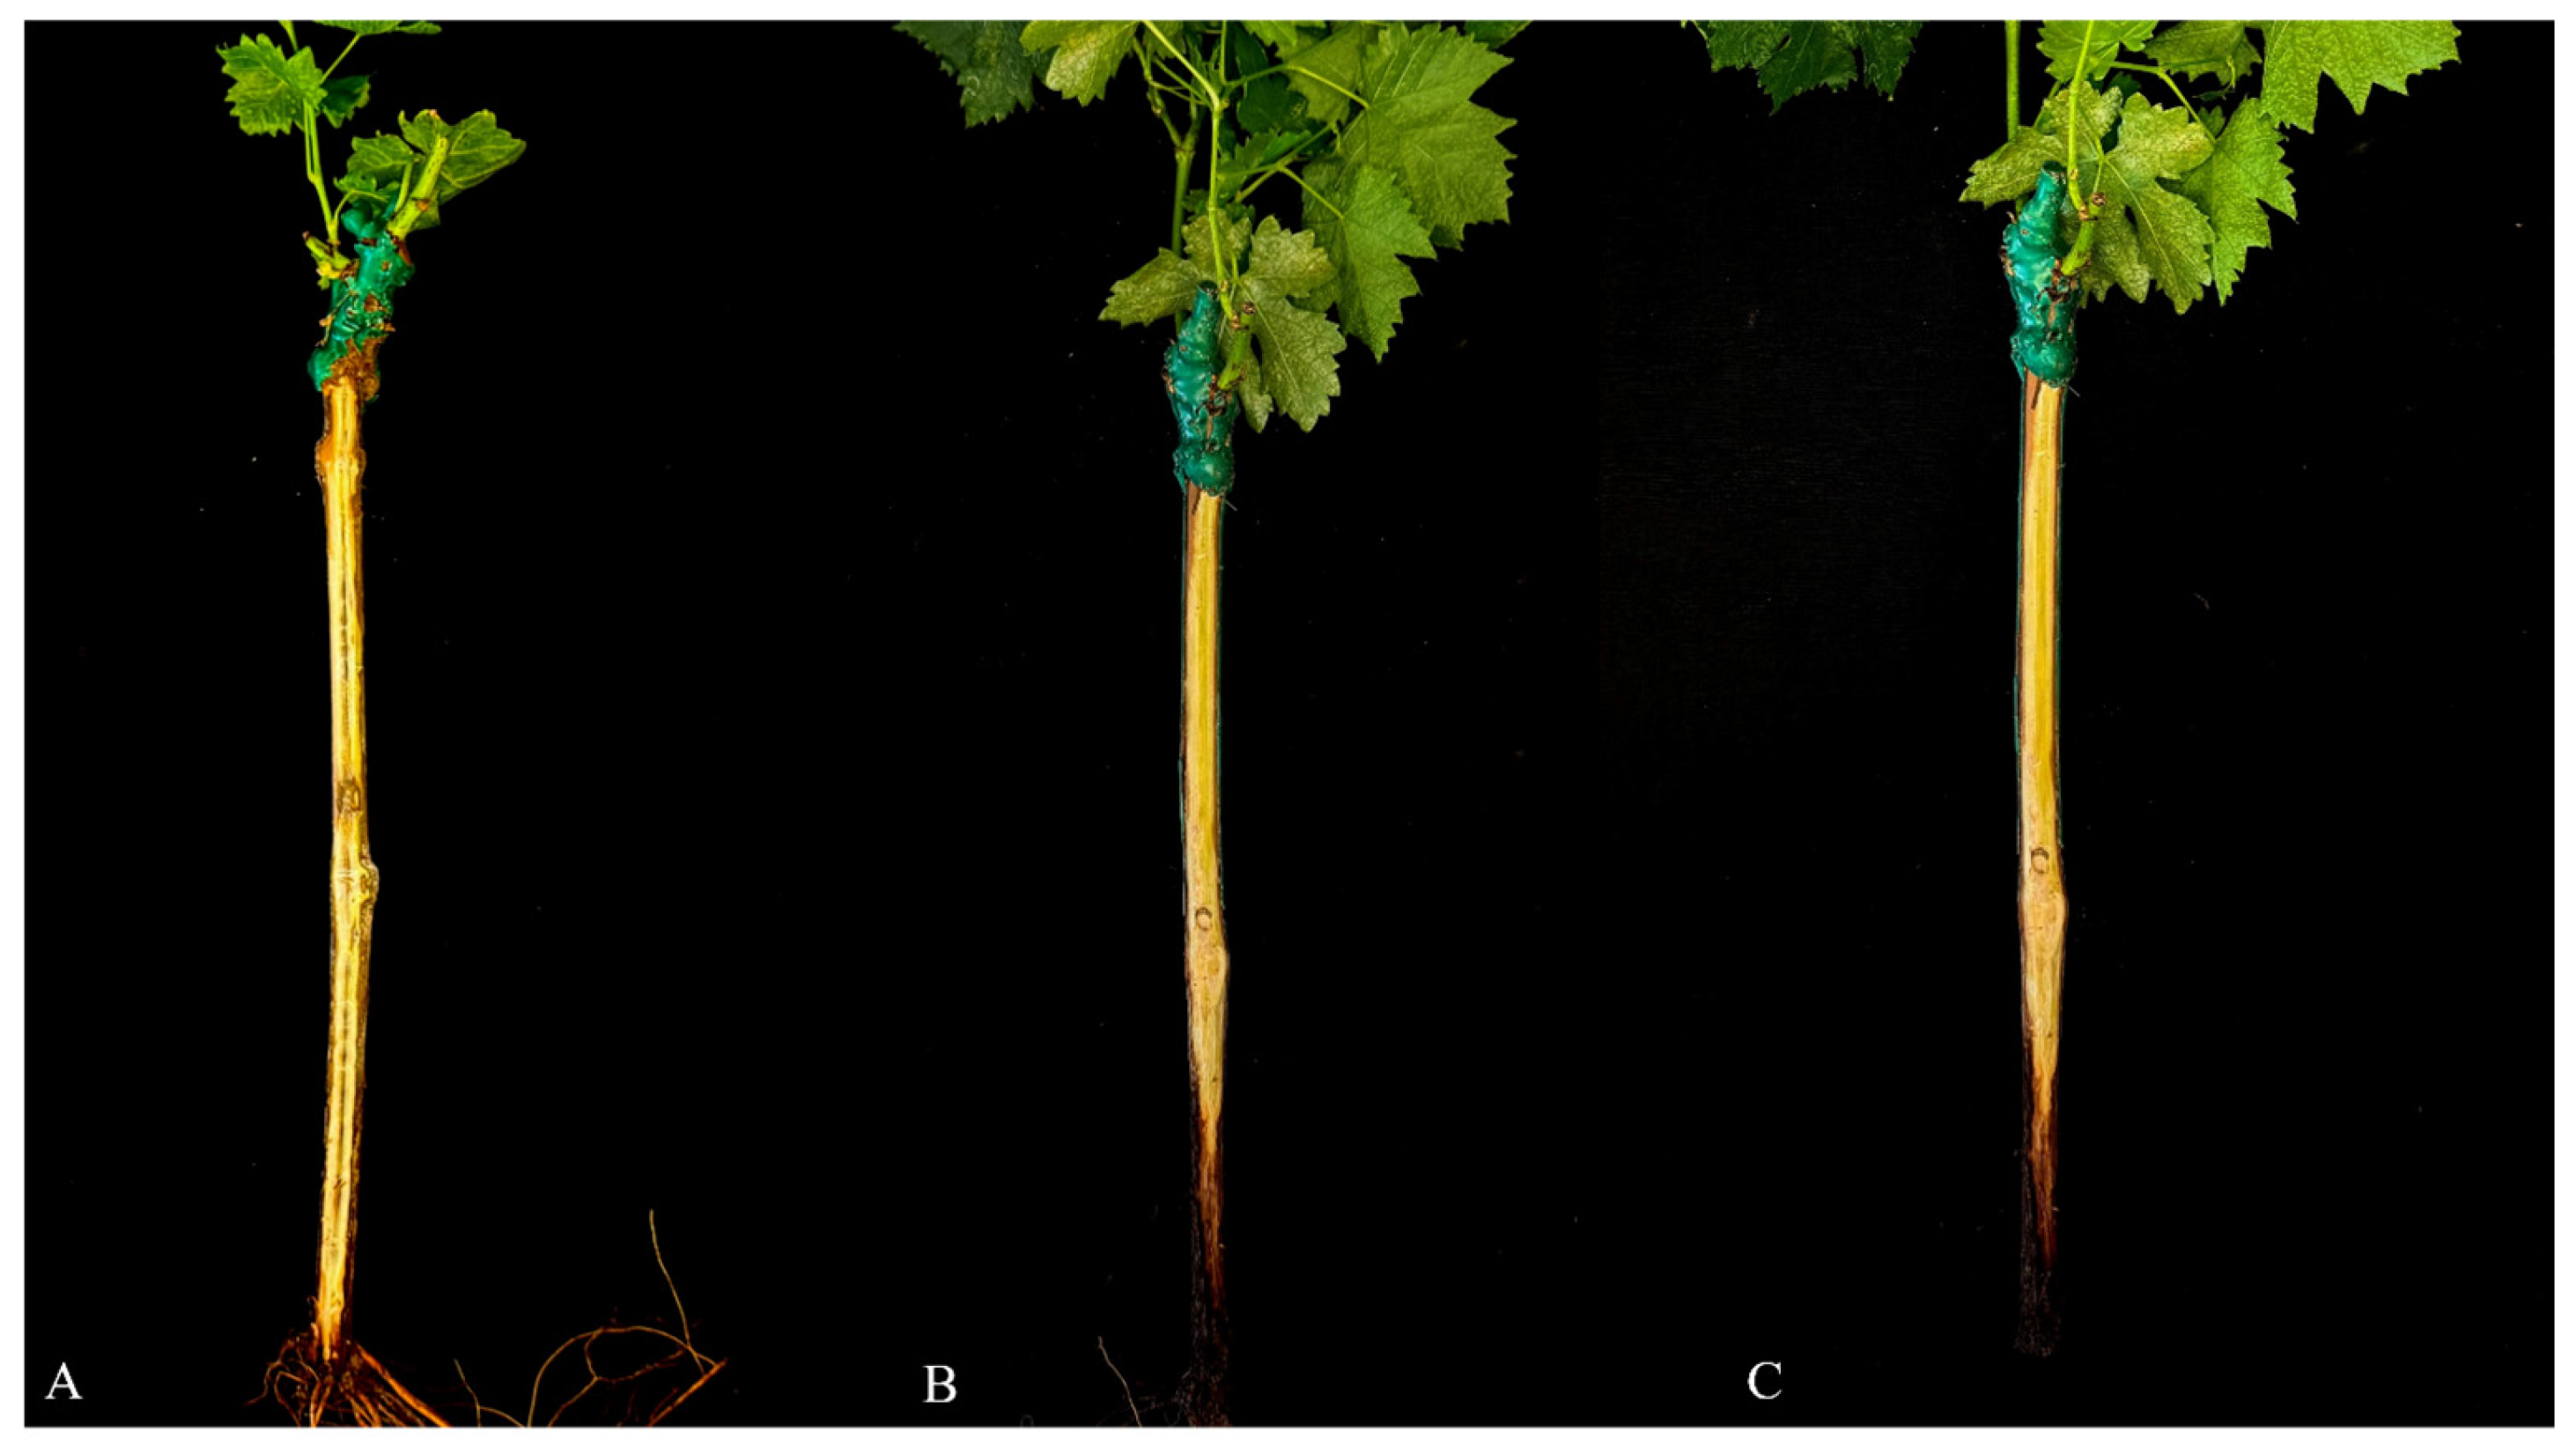
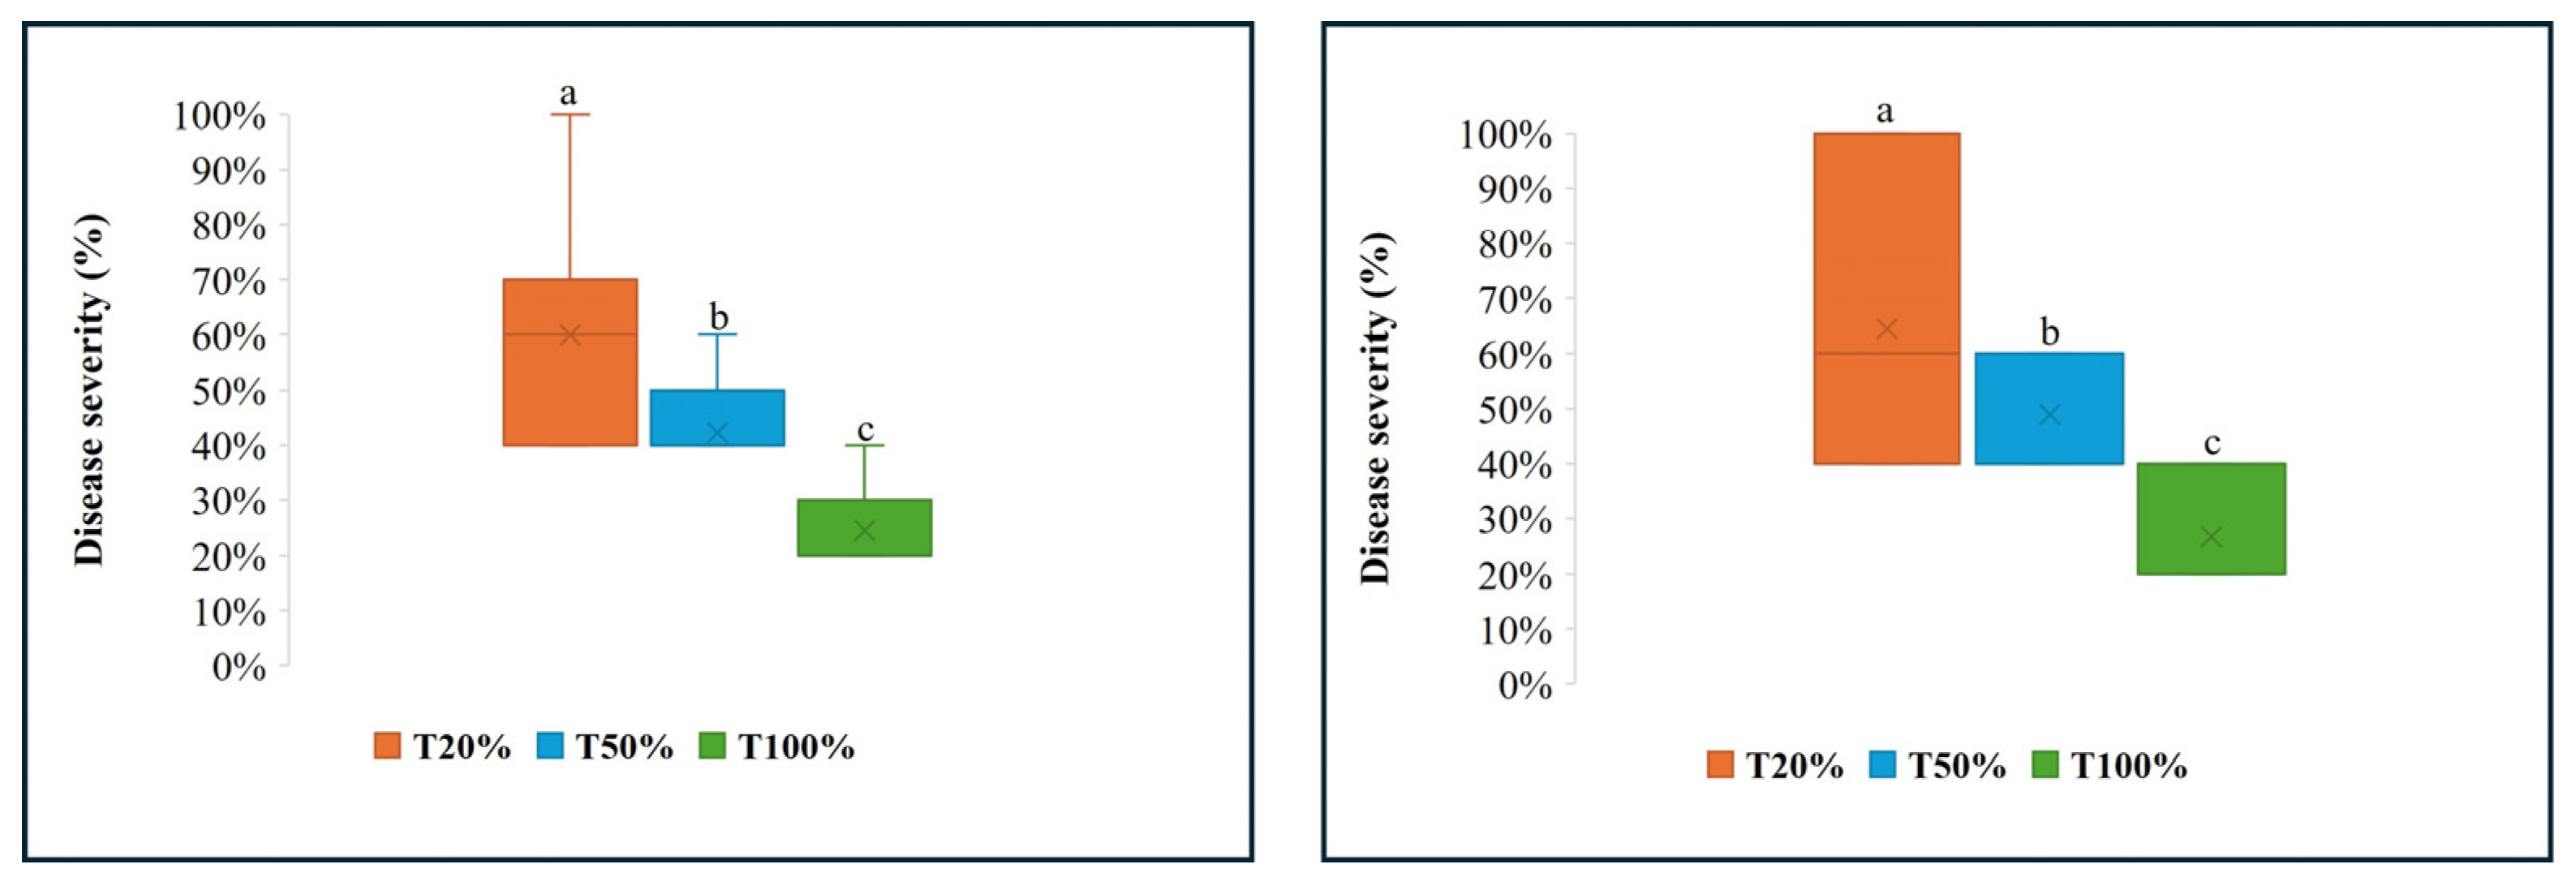
Disease severity was analyzed separately for shoots and rootstocks. Across both tissues, disease severity differed according to the irrigation regime applied. In Experiment 1, inoculated plants showed the highest values of internal necrosis and MKI were consistently observed under severe deficit irrigation (T20%), whereas progressively lower values were recorded under moderate deficit irrigation (T50%) and full irrigation (T100%; Figure 5 and Figure 6).
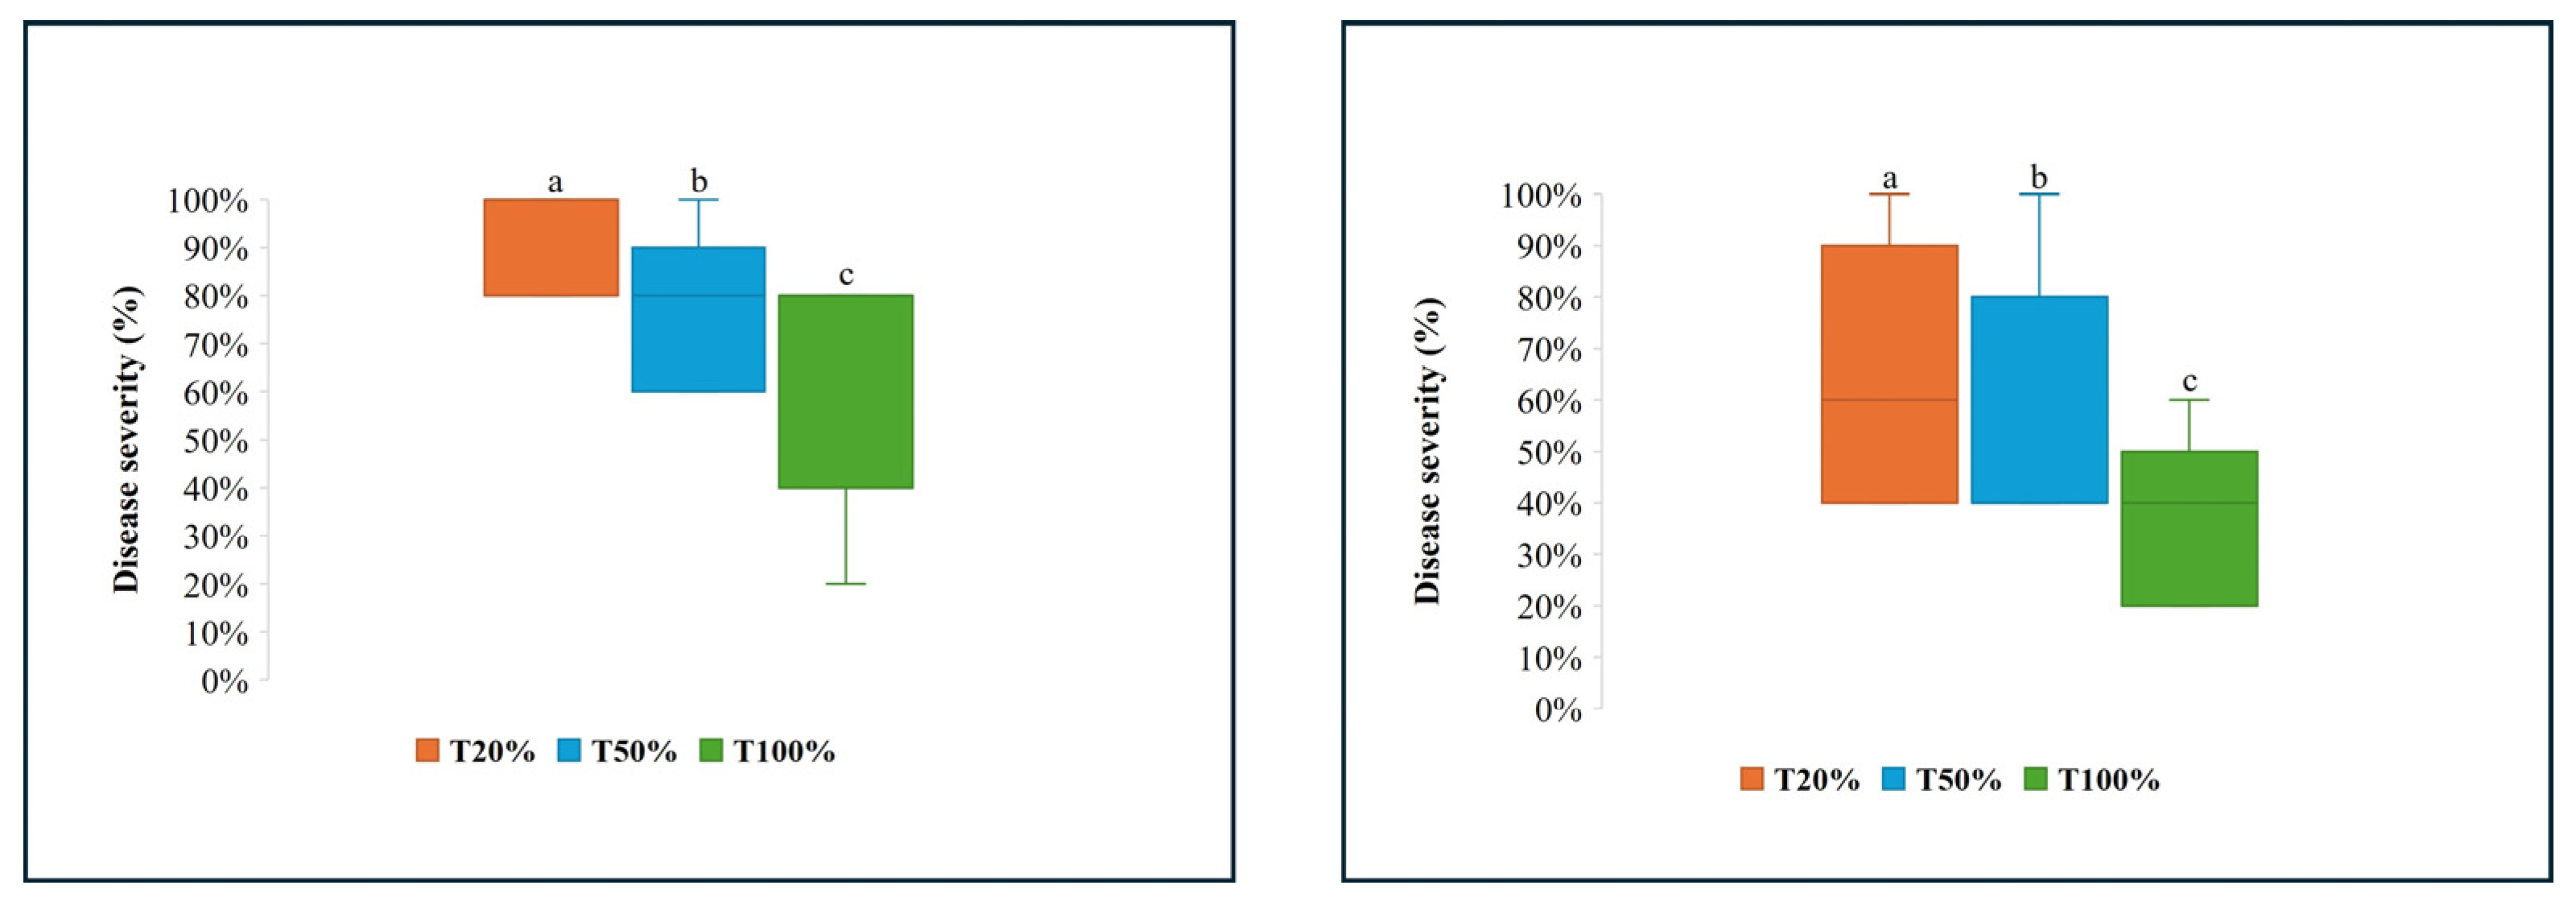
Box plot analysis of shoot tissues revealed apparent differences in disease severity among irrigation treatments (Figure 7). Plants subjected to T20% showed the highest MKI values (91.1% ± 10.5), with a narrow interquartile range, indicating limited variability within this treatment. Lower MKI values were observed under T50% (75.6% ± 16.7), while shoots maintained under full irrigation (T100%) exhibited the lowest disease severity (62.2% ± 25.4) and a wider dispersion of values. Statistical analysis confirmed significant differences among irrigation regimes (one-way ANOVA, p ≤ 0.05). The post hoc Tukey’s HSD test revealed that the MKI values under T20% were significantly higher than those under T50% and T100%. A similar pattern was observed in rootstock tissues (Figure 7).
Disease severity, as expressed by MKI, differed significantly between irrigation regimes (one-way ANOVA, p < 0.01). The highest MKI values were recorded under T20% (67% ± 24.4), followed by intermediate values under T50% (56% ± 26.0), with substantially lower values observed under full irrigation T100% (36% ± 16.7). Post hoc comparisons confirmed statistically significant differences among the three irrigation treatments.
In Experiment 1, no correlation was found between Tleaf and MKI (r = 0.59, p = 0.22) or between NDVI and MKI (r = −0.65, p = 0.16). In Experiment 2, a significant positive correlation was observed between Tleaf and lesion severity (r = 0.90, p = 0.016), whereas no significant relationship was found between NDVI and lesion severity (r = −0.68, p = 0.14).
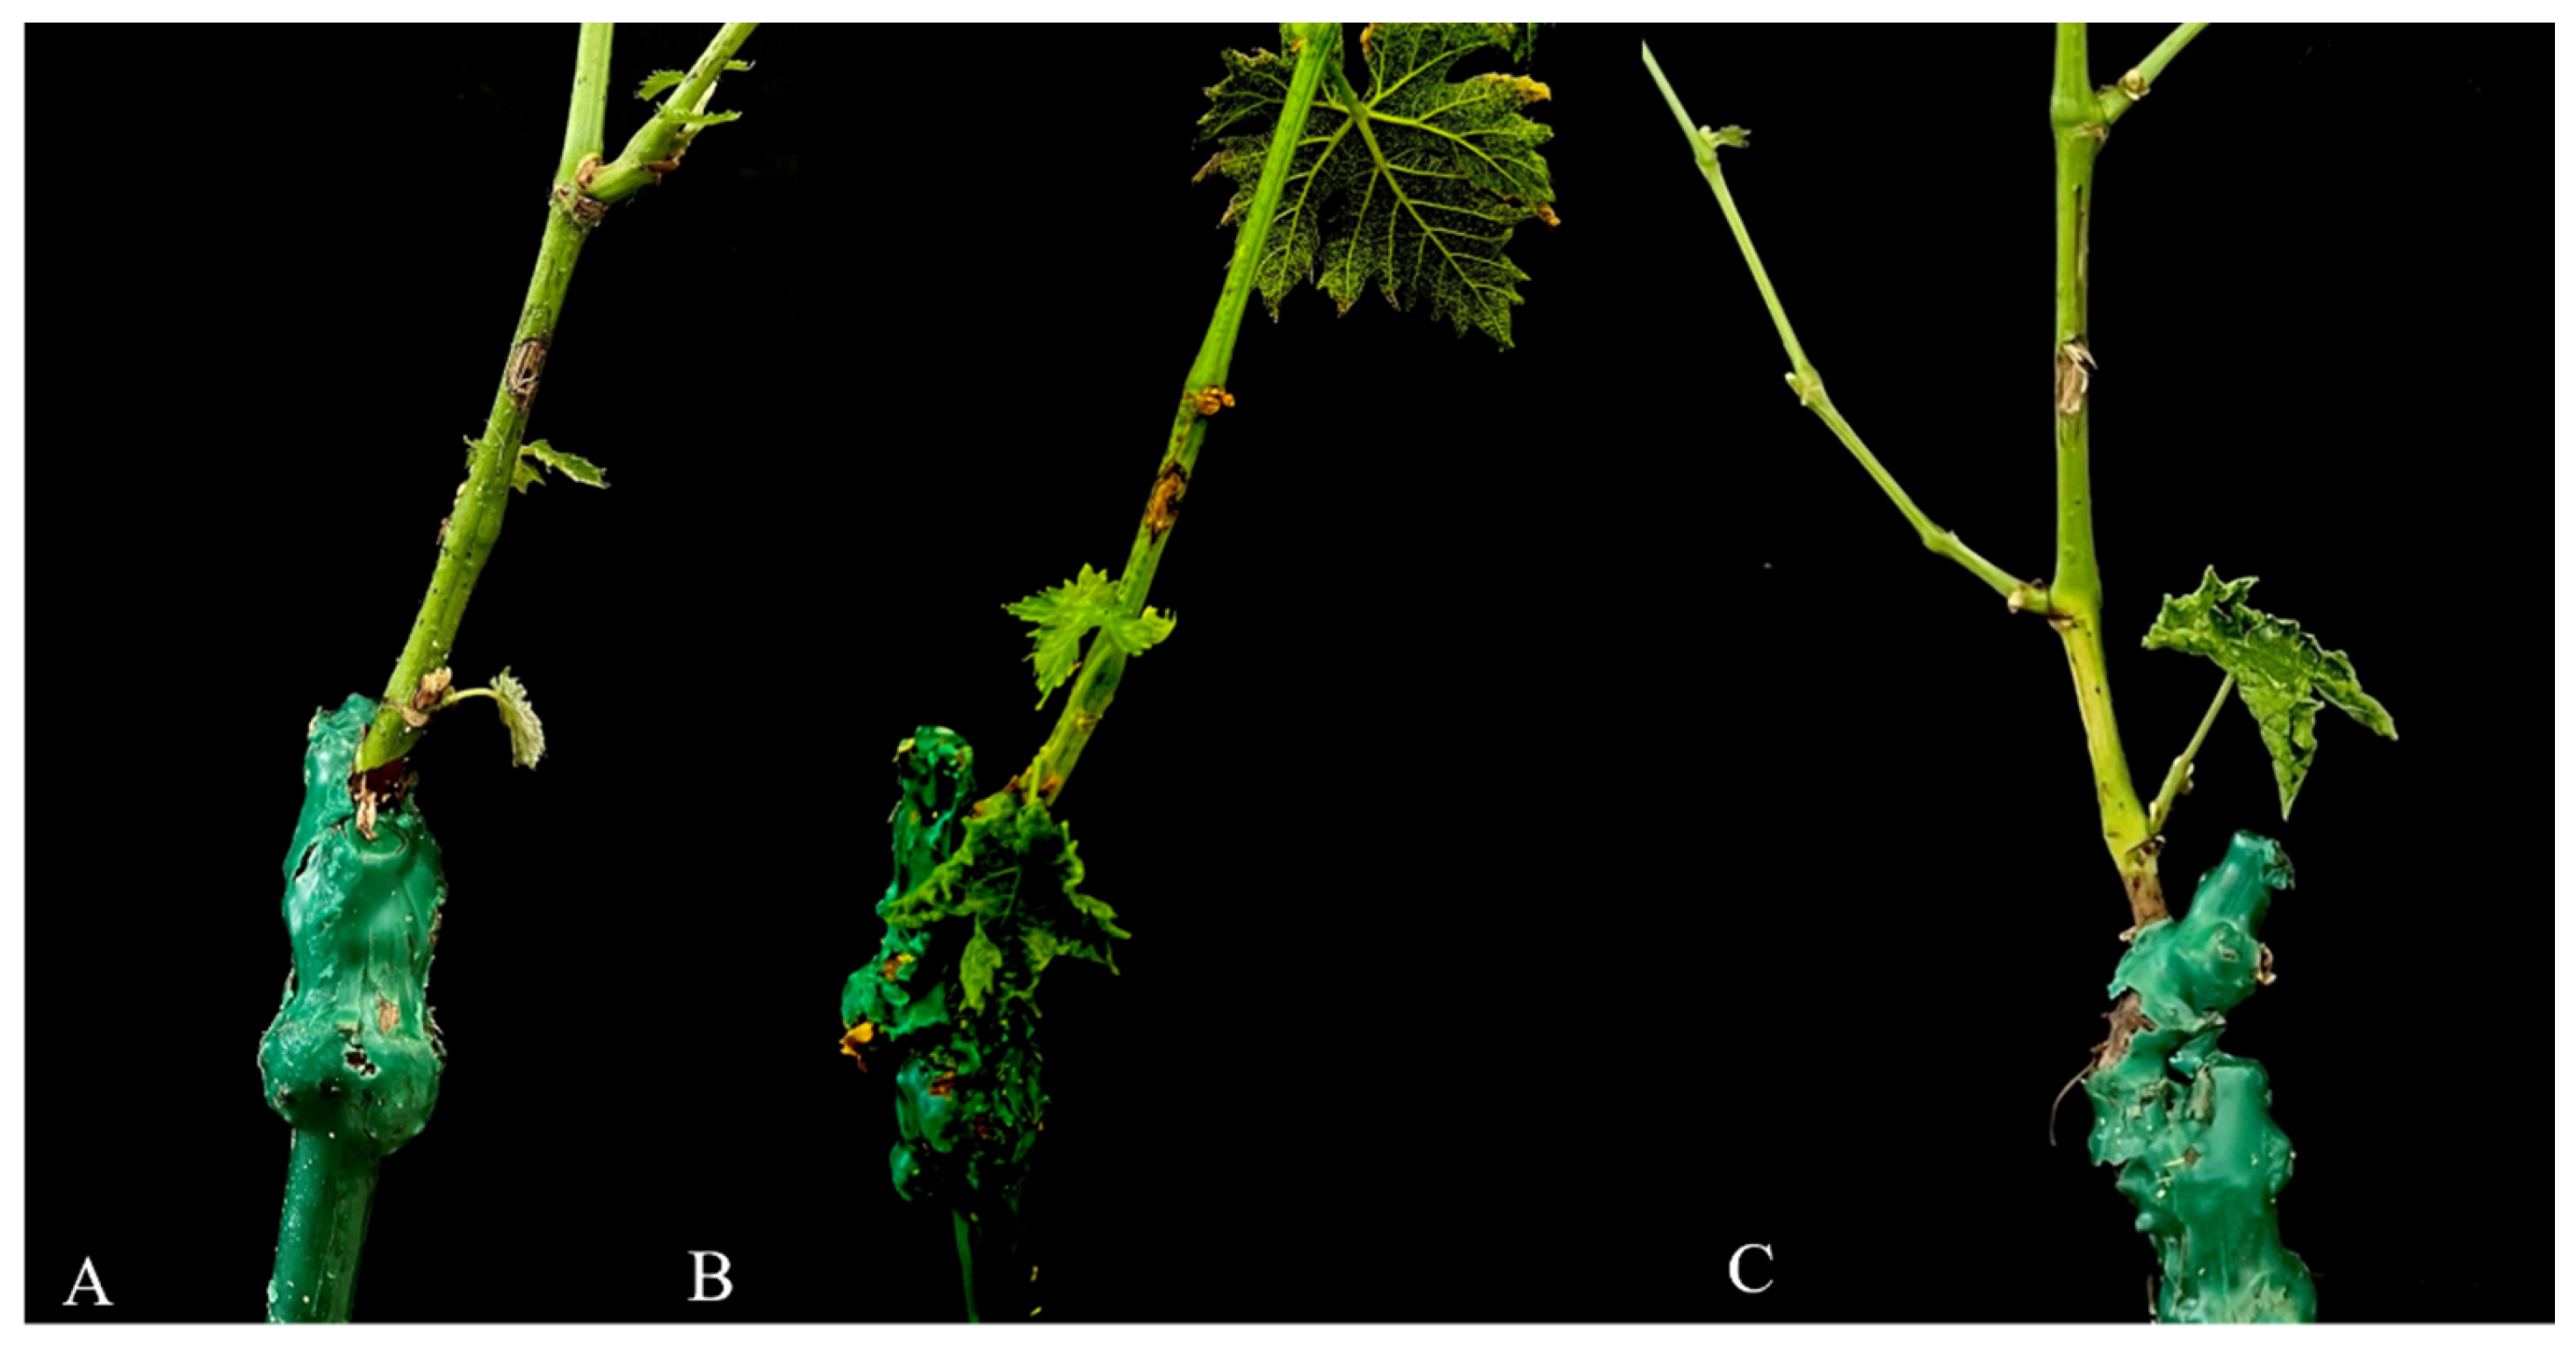
Non-inoculated control plants did not exhibit internal necrotic symptoms in either shoots or rootstocks under any irrigation regime (MKI = 0%) (see Figure 8 and Figure 9).
Comparable trends in disease severity across irrigation regimes were also observed in Experiment 2, confirming the consistency of the response pattern between runs (see Appendix A, Figure A1, Figure A2, Figure A3 and Figure A4).

4. Discussion

The integration of proximal sensing technologies into viticultural research offers a valuable approach for assessing plant responses to abiotic and biotic stresses in a non-destructive, scalable, and temporally resolved manner. Recent technological advances have expanded the availability of sensor-based tools that provide reliable indicators of crop water status, offering practical alternatives to conventional, labor-intensive plant-based measurements [24]. Consistent with previous studies, this work confirms that combining VNIR and TIR information provides valid proxies for characterizing grapevine physiological conditions [33,43,44].
In this study, two low-cost yet robust imaging sensors, i.e., a FLIR ONE Pro thermal camera and a MAPIR Survey3 multispectral device, were used to investigate grapevine responses to different WRs under controlled environmental conditions and to relate these responses to the severity of N. parvum infection. The choice of these specific sensors was guided by a growing body of literature that highlights their sensitivity and suitability for early stress detection in perennial crops [19]. While high-resolution thermal and multispectral devices have traditionally been limited to costly, research-grade systems, recent developments have demonstrated that low-cost alternatives can provide sufficiently precise data for research purposes. This methodological approach offers clear advantages in terms of accessibility and economic feasibility, as well as reduced installation and maintenance requirements [18]. Thermal monitoring revealed consistent differences in Tleaf among WRs, with significantly higher values in vines subjected to DI than in fully irrigated plants throughout the experiments. Note that, as Tair, Rs, wind, and relative humidity remained stable over time, in this study, Tleaf represents an indicator of the physiological response of the plants to the applied stressors (WR and pathogen). Thus, the computation of temperature differentials (ΔT = Tleaf − Tair), commonly adopted in field-based studies, was not required. Similarly, the CWSI was not calculated since the stable microclimatic conditions inside the chamber did not allow the determination of the reference wet and dry leaf temperatures required for its estimation. The progressive increase in Tleaf observed at T20%, after pathogen inoculation, suggests a reduction in evaporative cooling capacity associated with limited water availability [15,24,33,34].
Importantly, thermal monitoring successfully identified stress-related physiological changes across different irrigation regimes. Water-limited vines exhibited increased canopy temperature, particularly after inoculation. These findings are consistent with those of [24], who emphasized the usefulness of thermal imaging variables in detecting grapevine responses to different irrigation conditions.
Multispectral analysis provided additional insights into the plant status. NDVI values declined progressively with increasing water deficit, particularly during the later monitoring dates (Figure 4D). This indicates that the leaves were less vigorous under limited water availability. The lower NDVI values observed at T20% were consistent with the TIR data (Figure 2D), reflecting changes in photosynthetic activity associated with water stress (44). These findings are consistent with previous studies reporting the sensitivity of NDVI as an indicator of physiological alterations under stressful conditions. The reliability of the adopted approach is supported by independent studies that validate the use of FLIR and MAPIR sensors [18,19,25].
Notably, the controlled-environment setup used in this study allowed irrigation to be isolated as the primary stress factor, minimizing the fluctuations in Rs, wind, or soil heterogeneity. Standardizing data acquisition in terms of timing, illumination, and sensor positioning enhanced the interpretability of the sensor-derived indicators and strengthened their comparison with pathological outcomes. Differences detected by proximal sensing were closely aligned with the severity of disease observed following N. parvum inoculation. Vines subjected to lower irrigation levels exhibited higher levels of internal necrosis and higher values on the MKI than fully irrigated plants.
Trunk disease expression is known to depend not only on pathogen aggressiveness but also on different factors including host physiological conditions. In this context, irrigation regime and meteorological variability have been reported to affect symptom expression in grapevines [17]. In line with the findings of [12], our results indicate that water deficit could exacerbate the expression of Botryosphaeriaceae disease, potentially leading to more severe symptoms and internal necrosis in the event of severe drought.
The worsening of disease severity under deficit irrigation is consistent with previous evidence showing that the combination of heat and water stress can exacerbate Botryosphaeria dieback symptoms in grapevine [15]. This finding supports the hypothesis that climate-driven stress scenarios may intensify disease expression associated with Botryosphaeriaceae infections, particularly in Mediterranean environments. In addition to affecting symptom severity at the host level, abiotic stress may also influence pathogen behavior. Temperature and water deficit have been shown to modulate the virulence of Botryosphaeriaceae species and potentially alter their distribution patterns, highlighting the role of environmental conditions in shaping infection dynamics [16].
Although some mechanisms were not directly investigated in the present study, the response of grapevines to infection by N. parvum involves complex transcriptional reprogramming associated with stress signaling, oxidative responses, and cell wall remodeling processes during pathogen colonization [8]. These defense-related mechanisms may limit the spread of pathogens within woody tissues. In addition, pathogens associated with Botryosphaeria dieback, including N. parvum, possess enzymatic systems capable of degrading wood structural components and metabolizing grapevine phenolic phytoalexins, such as resveratrol and viniferins. This facilitates colonization of host tissue [45]. Furthermore, several fungi implicated in grapevine trunk diseases produce phytotoxic metabolites that promote host tissue necrosis and symptom development during disease progression [46].
Although pathogen biomass was not directly quantified in the present study, disease severity was assessed using lesion length and MKI, which are widely used indicators in grapevine trunk disease research. In addition, N. parvum was consistently re-isolated from inoculated symptomatic tissues. Future studies integrating symptom-based assessments with molecular approaches (e.g., qPCR) and anatomical analysis, as well dynamic monitoring of lesion expansion over time, could provide further insight into pathogen colonization dynamics and the mechanisms underlying disease progression under water stress conditions [47].
The patterns observed for NDVI, Tleaf, and symptom expression highlight the usefulness of integrating spectral and thermal indicators to describe grapevine responses to water limitation across irrigation regimes. Although we did not directly evaluate host defense mechanisms, our results are consistent with previous experimental evidence suggesting that water deficit conditions can exacerbate the expression of Botryosphaeria dieback symptoms and internal necrosis in grapevines infected with N. parvum [48]. The synergistic interaction between reduced water availability and wood-inhabiting microorganisms has been identified as a critical factor in the intensification of grapevine trunk diseases in stressful conditions [49]. Further evidence supporting the role of vine water status in the development of trunk diseases has also been reported in other GTDs pathosystems. In particular, it has been demonstrated that water stress increases the abundance of Phaeomoniella chlamydospora and promotes the development of Petri disease symptoms in young grapevines. This highlights how reduced water availability may exacerbate the severity of trunk diseases under stressful conditions [50]. However, no correlation was found between Tleaf or NDVI with MKI, due to the fact that effects on lesions are restricted to the trunk; conversely, Tleaf and NDVI describe the whole-plant responses. This may be attributed to the localized nature of lesion development on the trunk, whereas Tleaf and NDVI represent whole-plant physiological responses.
The dual-site inoculation approach allowed the evaluation of disease development in scion and rootstock tissues under different irrigation regimes. When analyzed separately, both tissues should have a clear response to water availability, supporting the role of plant hydraulic status in modulating pathogen infection.
A key novel aspect of this study is its focus on young table grapevine plants, a topic that has been largely overlooked in GTDs sensing research. Considering that Botryosphaeriaceae infections can already occur in planting material at early stage [51] and compromise vineyard establishment, our findings offer new and useful insights into stress-disease interactions in table grape production systems. They also support the development of practical, low-cost monitoring tools for protected Mediterranean environments.
Overall, the results of this study demonstrate that low-cost, proximal sensing sensors can provide meaningful information for monitoring grapevine responses to water availability and pathogen infection under controlled conditions. The detection of Tleaf and NDVI information prior to the final assessment of internal symptoms suggests their potential to identify stress-related physiological differences among WRs. Future research should validate these relationships under field conditions (e.g., different soil texture and microclimate conditions) and across a wider range of table grapes cultivars and rootstock combinations subjected to greater number of irrigation gradients, while integrating sensor-based indicators with additional physiological and biochemical measurements (e.g., chlorophyll fluorescence, stomatal conductance). This will support the practical development of more sustainable irrigation strategies and improved management of grapevine trunk diseases.

5. Conclusions

This study examined how water availability affects the severity of N. parvum infections under controlled conditions. The severe deficit irrigation (T20%) condition was consistently associated with higher disease severity, highlighting the critical role of water availability in modulating grapevine responses to pathogen infection. Although the underlying physiological and molecular mechanisms were not directly investigated, the observed patterns demonstrated that variations in water regime are closely aligned with differences in disease severity.
From a methodological perspective, this study demonstrated that low-cost proximal sensing tools, including thermal (Tleaf) and multispectral (NDVI) indicators derived from FLIR ONE Pro and MAPIR Survey3 sensors, were able to capture consistent differences in irrigation volume application prior to the final assessment of internal symptoms. The derived variables provided complementary information on plant responses to water limitation under controlled conditions.
Overall, the findings demonstrated the potential utility of low-cost proximal sensing approaches as rapid and non-destructive tools for the monitoring of grapevine stress associated with water deficit and pathogen infection. Future studies based on larger datasets should aim to establish robust detection thresholds, validate these relationships under field conditions, and integrate sensor-based indicators with additional physiological and pathological measurements to better support irrigation management strategies.

Author Contributions

Conceptualization: S.C., G.L.-M., D.A., C.D.P., S.M. and D.V.; data curation: C.D.P., G.L.-M. and D.V.; formal analysis: C.D.P.; funding acquisition: S.C., D.A. and D.V.; investigation: C.D.P.; methodology: S.C., G.L.-M., D.A., C.D.P., S.M. and D.V.; supervision: S.C. and D.A.; visualization: C.D.P., G.L.-M., S.C., D.A., S.M. and D.V.; writing—original draft: C.D.P.; writing—review and editing: S.C., G.L.-M., D.A., C.D.P. and D.V. All authors have read and agreed to the published version of the manuscript.

Funding

This work was funded by the research project Sicilian Micro and Nano Technology Research and Innovation Center—SAMOTHRACE—SPOKE 1 (ECS_00000022, CUP E63C22000900006), the research projects Diagnosi di malattie poco note o emergenti e sviluppo di strategie di difesa innovative ed ecosostenibili—DIME-SIECO and Innovazioni nelle tecniche di osservazione basate su sensori di PROssimità a supporto dell’Agricoltura di Precisione ed applicazioni ambientali—PRO-AP under the PIAno di inCEntivi per la RIcerca di Ateneo 2024/2026 of the University of Catania (Italy), and the research project Operational adaptation Nexus-based systems solutions in Mediterranean—DIONYSUS under the EU PRIMA program (grant agreement: 2341).

Data Availability Statement

The original contributions presented in this study are included in the article; further inquiries can be directed to the corresponding author.

Acknowledgments

The authors wish to thank the technical staff and researchers involved in the SAMOTHRACE project for their support in experimental activities and laboratory analyses.

Conflicts of Interest

The authors declare no conflicts of interest.

Appendix A

Figure A1. Box plot of the leaf temperature (Tleaf) values under the water regimes (T20%, T50%, T100%) before (A,B) and after (C,D) inoculation with N. parvum. Panels (A,B) correspond to the monitoring campaigns conducted in December 2024 and January 2025, while panels (C,D) refer to measurements taken in February and March 2025. Different letters indicate significant differences according to Tukey’s significant difference test (p-value < 0.05) during Experiment 2. Degrees of freedom (DF) values corresponded to 2 for the water regime factor for all analyses, with a total DF number of 119 for all analyses.
Agronomy 16 00696 g0a1
Figure A2. Interaction between water regime (WR) and inoculation period (time; pre- and post-inoculation) on grapevine canopy temperature (Tleaf) under controlled environmental conditions during Experiment 2. Degrees of freedom (DF) values corresponded to 2 and 1 for WR and Time, respectively, with a total DF number of 479. Different letters indicate significant differences according to Tukey’s HSD test (p-value < 0.05).
Agronomy 16 00696 g0a2
Figure A3. Box plot of the normalized difference vegetation index (NDVI) values under the water regimes (T20%, T50%, T100%) before (A,B) and after (C,D) inoculation with N. parvum. Panels (A,B) correspond to the monitoring campaigns conducted in December 2024 and January 2025, while panels (C,D) refer to measurements taken in February and March 2025. Different letters indicate significant differences according to Tukey’s significant difference test (p-value < 0.05, Experiment 2). Degrees of freedom (DF) values corresponded to 2 for the water regime factor for all analyses, with a total DF number of 119 for all analyses.
Agronomy 16 00696 g0a3
Figure A4. Disease severity in grapevine shoots (on the left) and rootstock (on the right) inoculated with N. parvum under different water regimes, expressed as McKinney disease severity index (%). Different letters indicate significant differences according Tukey’s HSD test (p-value < 0.05) during Experiment 2. Degrees of freedom (DF) values corresponded to 2 for the water regime factor for all analyses, with a total DF number of 26 for all analyses.
Agronomy 16 00696 g0a4

References

  1. Morante-Carballo, F.; Montalván-Burbano, N.; Quiñonez-Barzola, X.; Jaya-Montalvo, M.; Carrión-Mero, P. What Do We Know about Water Scarcity in Semi-Arid Zones? A Global Analysis and Research Trends. Water 2022, 14, 2685. [Google Scholar] [CrossRef]
  2. Food and Agriculture Organization of the United Nations. The State of Food and Agriculture 2020; FAO: Rome, Italy, 2020. [Google Scholar]
  3. Arnone, E.; Pumo, D.; Viola, F.; Noto, L.V.; La Loggia, G. Rainfall Statistics Changes in Sicily. Hydrol. Earth Syst. Sci. 2013, 17, 2449–2458. [Google Scholar] [CrossRef]
  4. Viola, F.; Liuzzo, L.; Noto, L.V.; Conti, F.; La Loggia, G. Spatial Distribution of Temperature Trends in Sicily. Int. J. Climatol. 2014, 34, 1–17. [Google Scholar]
  5. Ghiat, I.; Mackey, H.R.; Al-Ansari, T. A Review of Evapotranspiration Measurement Models, Techniques and Methods for Open and Closed Agricultural Field Applications. Water 2021, 13, 2523. [Google Scholar] [CrossRef]
  6. Allen, R.G.; Pereira, L.S.; Raes, D.; Smith, M. Crop Evapotranspiration—Guidelines for Computing Crop Water Requirements; FAO Irrigation and Drainage Paper No. 56; FAO: Rome, Italy, 1998. [Google Scholar]
  7. Gramaje, D.; Armengol, J. Fungal Trunk Pathogens in the Grapevine Propagation Process: Potential Inoculum Sources, Detection, Identification, and Management Strategies. Plant Dis. 2011, 95, 1040–1055. [Google Scholar] [CrossRef]
  8. Massonnet, M.; Figueroa-Balderas, R.; Galarneau, E.R.A.; Miki, S.; Lawrence, D.P.; Sun, Q.; Wallis, C.M.; Baumgartner, K.; Cantu, D. Neofusicoccum parvum Colonization of the Grapevine Woody Stem Triggers Asynchronous Host Responses at the Site of Infection and in the Leaves. Front. Plant Sci. 2017, 8, 1117. [Google Scholar] [CrossRef]
  9. Mondello, V.; Songy, A.; Battiston, E.; Pinto, C.; Coppin, C.; Trotel-Aziz, P.; Clément, C.; Mugnai, L.; Fontaine, F. Grapevine Trunk Diseases: A Review of Fifteen Years of Trials for Their Control with Chemicals and Biocontrol Agents. Plant Dis. 2018, 102, 1189–1217. [Google Scholar] [CrossRef]
  10. Úrbez-Torres, J.R. The Status of Botryosphaeriaceae Species Infecting Grapevines. Phytopathol. Mediterr. 2011, 50, S5–S45. [Google Scholar]
  11. Kaliterna, J.; Miličević, T.; Bencić, D.; Duralija, B. First Report of Neofusicoccum parvum Associated with Grapevine Trunk Diseases in Croatia. Plant Dis. 2013, 97, 1656. [Google Scholar] [CrossRef]
  12. Van Niekerk, J.M.; Strever, A.E.; du Toit, P.G.; Halleen, F.; Fourie, P.H. Influence of Water Stress on Botryosphaeriaceae Disease Expression in Grapevines. Phytopathol. Mediterr. 2011, 50, S151–S165. [Google Scholar]
  13. Sosnowski, M.R.; Luque, J.; Loschiavo, A.P.; Martos, S.; Garcia-Figueres, F.; Wicks, T.J.; Scott, E.S. Studies on the Effect of Water and Temperature Stress on Grapevines Inoculated with Eutypa lata. Phytopathol. Mediterr. 2011, 50, S127–S138. [Google Scholar]
  14. Sosnowski, M.R.; Ayres, M.R.; Scott, E.S. The Influence of Water Deficit Stress on the Grapevine Trunk Disease Pathogens Eutypa lata and Diplodia seriata. Plant Dis. 2021, 105, 2217–2221. [Google Scholar] [CrossRef]
  15. Fernandez, O.; Lemaître-Guillier, C.; Songy, A.; Robert-Siegwald, G.; Lebrun, M.-H.; Schmitt-Kopplin, P.; Larignon, P.; Adrian, M.; Fontaine, F. The Combination of Both Heat and Water Stresses May Worsen Botryosphaeria Dieback Symptoms in Grapevine. Plants 2023, 12, 753. [Google Scholar] [CrossRef]
  16. Qiu, Y.; Steel, C.C.; Ash, G.J.; Savocchia, S. Effects of Temperature and Water Stress on the Virulence of Botryosphaeriaceae spp. Causing Dieback of Grapevines and Their Predicted Distribution Using CLIMEX in Australia. Acta Hortic. 2016, 1115, 171–182. [Google Scholar]
  17. Calvo-Garrido, C.; Songy, A.; Marmol, A.; Roda, R.; Clément, C.; Fontaine, F. Description of the Relationship between Trunk Disease Expression and Meteorological Conditions, Irrigation and Physiological Response in Chardonnay Grapevines. OENO One 2021, 55, 97–113. [Google Scholar] [CrossRef]
  18. Pappalardo, S.; Consoli, S.; Longo-Minnolo, G.; Vanella, D.; Longo, D.; Guarrera, S.; D’Emilio, A.; Ramírez-Cuesta, J.M. Performance Evaluation of a Low-Cost Thermal Camera for Citrus Water Status Estimation. Agric. Water Manag. 2023, 278, 108489. [Google Scholar]
  19. Toscano, S.; Consoli, S.; Longo-Minnolo, G.; Guarrera, S.; Continella, A.; Modica, G.; Gentile, A.; Las Casas, G.; Barbagallo, S.; Vanella, D. Using Low-Cost Proximal Sensing Sensors for Detecting the Water Status of Deficit-Irrigated Orange Orchards in Mediterranean Climatic Conditions. Agronomy 2025, 15, 550. [Google Scholar]
  20. Fereres, E.; Soriano, M.A. Deficit Irrigation for Reducing Agricultural Water Use. J. Exp. Bot. 2007, 58, 147–159. [Google Scholar]
  21. Andreu-Coll, L.; Carbonell-Barrachina, Á.A.; Burló, F.; Galindo, A.; García-Brunton, J.; López-Lluch, D.B.; Martínez-Font, R.; Noguera-Artiaga, L.; Sendra, E.; Hernández-Ariola, P.; et al. Regulated Deficit Irrigation Perspectives for Water Efficiency in Apricot Cultivation: A Review. Agronomy 2024, 14, 1219. [Google Scholar] [CrossRef]
  22. Wang, X.; Yang, W.; Wheaton, A.; Cooley, N.; Moran, B. A First Step Towards Automated Plant Water Stress Monitoring. Comput. Electron. Agric. 2010, 73, 74–83. [Google Scholar] [CrossRef]
  23. Conti, L.; Gaeta, L.; Giannini, M.; D’Onghia, A.M.; Montesano, F.F.; Losciale, P. Scouting Ecophysiological Variables to Monitor Regulated Deficit Irrigation in Almond. Sci. Hortic. 2025, 352, 114442. [Google Scholar] [CrossRef]
  24. Grant, O.M.; Tronina, Ł.; Jones, H.G.; Chaves, M.M. Exploring Thermal Imaging Variables for the Detection of Stress Responses in Grapevine Under Different Irrigation Regimes. J. Exp. Bot. 2007, 58, 815–825. [Google Scholar] [CrossRef] [PubMed]
  25. Portela, F.; Sousa, J.J.; Araújo-Paredes, C.; Peres, E.; Morais, R.; Pádua, L. A Systematic Review on the Advancements in Remote Sensing and Proximity Tools for Grapevine Disease Detection. Sensors 2024, 24, 8172. [Google Scholar] [CrossRef] [PubMed]
  26. Gonzalez-Dugo, V.; Ruz, C.; Testi, L.; Orgaz, F.; Fereres, E. The Impact of Deficit Irrigation on Transpiration and Yield of Mandarin and Late Oranges. Irrig. Sci. 2018, 36, 227–239. [Google Scholar] [CrossRef]
  27. Ben-Gal, A.; Agam, N.; Alchanatis, V.; Cohen, Y.; Yermiyahu, U.; Zipori, I.; Presnov, E.; Sprintsin, M.; Dag, A. Evaluating Water Stress in Irrigated Olives: Correlation of Soil Water Status, Tree Water Status, and Thermal Imagery. Irrig. Sci. 2009, 27, 367–376. [Google Scholar] [CrossRef]
  28. Egea, G.; Padilla-Díaz, C.M.; Martínez, J.; Fernández, J.E.; Pérez-Ruiz, M. Use of Aerial Thermal Imaging to Assess Water Status Variability in Hedgerow Olive Orchards. Agric. Water Manag. 2016, 187, 210–219. [Google Scholar]
  29. Garcia-Tejero, I.F.; Ortega-Arevalo, C.J.; Iglesias-Contreras, M.; Moreno, J.M.; Souza, L.; Tavira, S.C.; Duran-Zuazo, V.H. Assessing the Crop-Water Status in Almond (Prunus dulcis Mill.) Trees Via Thermal Imaging Camera Connected to Smartphone. Sensors 2018, 18, 1050. [Google Scholar] [CrossRef]
  30. Blanco, V.; Willsea, N.; Campbell, T.; Howe, O.; Kalcsits, L. Combining Thermal Imaging and Soil Water Content Sensors to Assess Tree Water Status in Pear Trees. Front. Plant Sci. 2023, 14, 1197437. [Google Scholar] [CrossRef]
  31. Ballester, C.; Jimenez-Bello, M.A.; Castel, J.R.; Intrigliolo, D.S. Usefulness of Thermography for Plant Water Stress Detection in Citrus and Persimmon Trees. Agric. For. Meteorol. 2013, 168, 120–129. [Google Scholar] [CrossRef]
  32. Mangus, D.L.; Sharda, A.; Zhang, N. Development and Evaluation of Thermal Infrared Imaging System for High Spatial and Temporal Resolution Crop Water Stress Monitoring of Corn Within a Greenhouse. Comput. Electron. Agric. 2016, 121, 149–159. [Google Scholar] [CrossRef]
  33. Möller, M.; Alchanatis, V.; Cohen, Y.; Meron, M.; Tsipris, J.; Naor, A.; Ostrovsky, V.; Sprintsin, M.; Cohen, S. Use of Thermal and Visible Imagery for Estimating Crop Water Status of Irrigated Grapevine. J. Exp. Bot. 2007, 58, 827–838. [Google Scholar] [CrossRef]
  34. Idso, S.B.; Jackson, R.D.; Reginato, R.J. Normalizing the Stress-Degree-Day Parameter for Environmental Variability. Agric. Meteorol. 1981, 24, 45–55. [Google Scholar] [CrossRef]
  35. Gonzalez-Dugo, V.; Zarco-Tejada, P.J.; Fereres, E. Applicability and Limitations of Using the Crop Water Stress Index as an Indicator of Water Deficits in Citrus Orchards. Agric. For. Meteorol. 2014, 198, 94–104. [Google Scholar] [CrossRef]
  36. Jamshidi, S.; Zand-Parsa, S.; Niyogi, D. Assessing Crop Water Stress Index of Citrus Using In-Situ Measurements, Landsat, and Sentinel-2 data. Int. J. Remote Sens. 2021, 42, 1893–1916. [Google Scholar] [CrossRef]
  37. Rouse, J.W.; Haas, R.H.; Schell, J.A.; Deering, D.W. Monitoring Vegetation Systems in the Great Plains with ERTS. NASA Spec. Publ. 1974, 351, 309. [Google Scholar]
  38. El-Hendawy, S.E.; Al-Suhaibani, N.; Alotaibi, M.; Hassan, W.; Elsayed, S.; Tahir, M.U.; Mohamed, A.I.A.I.; Schmidhalter, U. Estimating Growth and Photosynthetic Properties of Wheat Grown in Simulated Saline Field Conditions Using Hyperspectral Reflectance Sensing and Multivariate Analysis. Sci. Rep. 2019, 9, 16473. [Google Scholar] [CrossRef]
  39. Rahimikhoob, H.; Sohrabi, T.; Delshad, M. Assessment of Reference Evapotranspiration Estimation Methods in Controlled Greenhouse Conditions. Irrig. Sci. 2020, 38, 389–400. [Google Scholar] [CrossRef]
  40. Irmak, S.; Irmak, A.; Allen, R.G.; Jones, J.W. Solar and Net Radiation-Based Equations to Estimate Reference Evapotranspiration in Humid Climates. J. Irrig. Drain. Eng. 2003, 129, 336–347. [Google Scholar] [CrossRef]
  41. Carlucci, A.; Cibelli, F.; Lops, F.; Raimondo, M.L. Characterization of Botryosphaeriaceae species as Causal Agents of Trunk Diseases on Grapevines. Plant Dis. 2015, 99, 1678–1688. [Google Scholar] [CrossRef]
  42. Dardani, G.; Mugnai, L.; Bussotti, S.; Gullino, M.L.; Guarnaccia, V. Grapevine Dieback Caused by Botryosphaeriaceae Species, Paraconiothyrium brasiliense, Seimatosporium Vitis Viniferae and Truncatella angustata in Piedmont: Characterization and Pathogenicity. Phytopathol. Mediterr. 2023, 62, 283–306. [Google Scholar] [CrossRef]
  43. Cogato, A.; Jewan, S.Y.Y.; Wu, L.; Marinello, F.; Meggio, F.; Sivilotti, P.; Sozzi, M.; Pagay, V. Water Stress Impacts on Grapevines (Vitis vinifera L.) in Hot Environments: Physiological and Spectral Responses. Agronomy 2022, 12, 1819. [Google Scholar] [CrossRef]
  44. Matese, A.; Baraldi, R.; Berton, A.; Cesaraccio, C.; Di Gennaro, S.F.; Duce, P.; Facini, O.; Mameli, M.G.; Piga, A.; Zaldei, A. Estimation of Water Stress in Grapevines Using Proximal and Remote Sensing Methods. Remote Sens. 2018, 10, 114. [Google Scholar]
  45. Stempien, E.; Goddard, M.-L.; Wilhelm, K.; Tarnus, C.; Bertsch, C.; Chong, J. Grapevine Botryosphaeria Dieback Fungi Have Specific Aggressiveness Factor Repertory Involved in Wood Decay and Stilbene Metabolization. PLoS ONE 2017, 12, e0188766. [Google Scholar] [CrossRef]
  46. Andolfi, A.; Mugnai, L.; Luque, J.; Surico, G.; Cimmino, A.; Evidente, A. Phytotoxins Produced by Fungi Associated with Grapevine Trunk Diseases. Toxins 2011, 3, 1569–1605. [Google Scholar] [CrossRef] [PubMed]
  47. Pouzoulet, J.; Scudiero, E.; Schiavon, M.; Rolshausen, P.E. Xylem Vessel Diameter Affects the Compartmentalization of the Vascular Pathogen Phaeomoniella chlamydospora in Grapevine. Front. Plant Sci. 2017, 8, 1442. [Google Scholar] [CrossRef] [PubMed]
  48. Galarneau, E.R.A.; Lawrence, D.P.; Wallis, C.M.; Baumgartner, K. Drought Exacerbates Botryosphaeria Dieback Symptoms in Grapevines Infected with Neofusicoccum parvum. Plant Dis. 2019, 103, 1738–1745. [Google Scholar]
  49. Haidar, R.; Yacoub, A.; Pinard, A.; Roudet, J.; Fermaud, M.; Rey, P. Synergistic Effects of Water Deficit and Wood-Inhabiting Bacteria on Pathogenicity of the Grapevine Trunk Pathogen Neofusicoccum parvum. Phytopathol. Mediterr. 2020, 59, 473–484. [Google Scholar]
  50. Hrycan, J.; Bowen, P.; Forge, T.; Hart, M.; Úrbez-Torres, J.R. Impact of Water Stress on Phaeomoniella chlamydospora Abundance and Petri Disease Symptom Development in Young Grapevines. OENO One 2025, 59, 1–16. [Google Scholar] [CrossRef]
  51. Mattia, D.; Mavica, S.; Di Pietro, C.; Efstathiou, S.; Makris, G.; Kanetis, L.I.; Aiello, D. Fungi Associated with Table Grape Propagation Material, with emphasis on Neoscytalidium dimidiatum and Quambalaria cyanescens in Italy. Phytopathol. Mediterr. 2025, 64, 537–558. [Google Scholar] [CrossRef]
Figure 1. Overview of the growth chamber used for the experiments, highlighting potted grapevine plants in early development.
Agronomy 16 00696 g001
Figure 2. Box plot of leaf temperature (Tleaf) values under the analyzed water regimes (T20%, T50%, T100%) before (A,B) and after (C,D) inoculation with N. parvum. Panels (A,B) correspond to the monitoring campaigns conducted in April and May 2024, while panels (C,D) refer to measurements taken in June and July 2024. Different letters indicate significant differences according to Tukey’s significant difference test (p-value < 0.05) during Experiment 1. Degrees of freedom (DF) values corresponded to 2 for the water regime factor for all analyses, with a total DF number of 479 for all analyses.
Agronomy 16 00696 g002
Figure 3. Interaction between water regime (WR) and inoculation period (time; pre- and post-inoculation) on grapevine canopy temperature (Tleaf) under controlled environmental conditions during Experiment 1. Degrees of freedom (DF) values corresponded to 2 and 1 for WR and Time, respectively, with a total DF number of 479. Different letters indicate significant differences according to Tukey’s HSD test (p-value < 0.05).
Agronomy 16 00696 g003
Figure 4. Box plot of the normalized difference vegetation index (NDVI) values under the analyzed water regimes (T20%, T50%, T100%) before (A,B) and after (C,D) inoculation with N. parvum. Panels (A,B) correspond to the monitoring campaigns conducted in April and May 2024, while panels (C,D) refer to measurements taken in June and July 2024. Different letters indicate significant differences according to Tukey’s significant difference test (p-value < 0.05, Experiment 1). Degrees of freedom (DF) values corresponded to 2 for the water regime factor for all analyses, with a total DF number of 119 for all analyses.
Agronomy 16 00696 g004
Figure 5. Necrotic lesion observed after artificial inoculation of grapevines shoots with N. parvum under three water regimes: (A) T20%, (B) T50%, (C) T100%.
Agronomy 16 00696 g005
Figure 6. Symptoms observed after artificial inoculation of grapevine rootstocks with N. parvum under three water regimes: (A) T20%, (B) T50%, (C) T100%.
Agronomy 16 00696 g006
Figure 7. Disease severity in grapevine shoots (on the left) and rootstock (on the right) inoculated with N. parvum under different water regimes Letters indicate significant differences according to Tukey’s HSD test (p-value < 0.05) during Experiment 2. Degrees of freedom (DF) values corresponded to 2 for the water regime factor for all analyses, with a total DF number of 26 for all analyses.
Agronomy 16 00696 g007
Figure 8. Shoot sections from non-inoculated control plants under the three water regimes: (A) T20%, (B) T50%, (C) T100%, showing absence of necrotic symptoms.
Agronomy 16 00696 g008
Figure 9. Rootstock sections from non-inoculated control plants under the three water regimes: (A) T20%, (B) T50%, (C) T100%, showing absence of necrotic symptoms.
Agronomy 16 00696 g009
Table 1. Summary of the main technical specifications of the multispectral (MAPIR Survey3 RGN, San Diego, CA, USA) and thermal (FLIR ONEPro, Teledyne FLIR LLC, Arlington, VA, USA) sensors used in the study adapted from [19].
ParameterMultispectral CameraThermal Camera
Optical resolution4000 × 300 pixels640 × 480
WavelengthRGN (Red + Green + NIR): 550 nm/660 nm/850 nm/
Object temperature range /−20 °C to 400 °C
Lens opticsf2.8 aperture/
Spectral range /8–14 µm
Accuracy /±3 °C
Field of view87° (19 mm)55° × 43°
Iso setting50, 100, 200, 400, 800, 1600, Auto/
Emissivity setting /0.60–0.95
Acquisition softwareMapir Camera Control (MCC v. 20230123 PC Windows)FLIR ONE (App for smarthphone, v. 5.3.14)
Price (currently)~400 USD~450 USD
Disclaimer/Publisher’s Note: The statements, opinions and data contained in all publications are solely those of the individual author(s) and contributor(s) and not of MDPI and/or the editor(s). MDPI and/or the editor(s) disclaim responsibility for any injury to people or property resulting from any ideas, methods, instructions or products referred to in the content.