Article

Mechanistic Shifts in Organic Carbon Stabilization in a Black Soil Driven by Nitrogen Fertilization
1
College of Resources and Environment, Jilin Agricultural University, Changchun 130118, China
2
Key Laboratory of Soil Resource Sustainable Utilization for Jilin Province Commodity Grain Bases, Changchun 130118, China
3
College of Horticulture, Jilin Agricultural University, Changchun 130118, China
4
Institute of Plant Nutrition, Resources and Environment, Beijing Academy of Agriculture and Forestry Sciences, Beijing 100097, China
*
Authors to whom correspondence should be addressed.
These authors contributed equally to this work.
Agronomy 2026, 16(2), 268; https://doi.org/10.3390/agronomy16020268
Submission received: 15 December 2025 / Revised: 9 January 2026 / Accepted: 19 January 2026 / Published: 22 January 2026
(This article belongs to the Section Soil and Plant Nutrition)

Abstract

The phaeozem in Northeast China is rich in soil organic carbon (SOC). However, the excessive and inefficient application of chemical fertilizers, particularly nitrogen fertilizers, has primarily led to a decrease in soil pH in this region. Currently, the relationship between soil pH and the stability of soil organic carbon (SOC) remains ambiguous. This study, conducted over 13 years of field experiments, focused on soils exhibiting varying degrees of pH resulting from different nitrogen application rates. The research employed aggregate classification, 13C nuclear magnetic resonance spectroscopy, and analysis of microbial community composition to investigate the alterations in the SOC stabilization mechanisms under varying nitrogen application levels. Our results demonstrated that the decline in soil pH led to reductions in macroaggregates (>2 mm) and the soil aggregate destruction rate (PAD) by 4.8–14.6%, and in soil aggregate unstable agglomerate index (ELT) by 9.7–13.4%. The mean weight diameter (MWD) and geometric mean diameter (GMD) exhibited significant declines (p < 0.05) with decreasing pH levels. According to the 13C NMR analysis, the SOC was predominantly composed of O-alkyl carbon and aromatic carbon. At a pH of 5.32, the Alip/Arom values decreased, while the molecular structure of SOC became more complex under different levels of pH. In addition, the increase in [Fe(Al)-OC] (31.4–71.9%) complex indicates a shift in the stability of organic carbon from physical protection to organic mineral binding. Declining soil pH significantly reduced the diversity of soil microbial communities and promoted a shift toward copiotrophic microbial groups. Overall, declining soil pH resulted in a decline in soil aggregate stability and an increase in SOC aromaticity. This drove the shift in the stabilization mechanism of SOC in the black soil ecosystem of meadows in Northeast China from physical protection to chemical stability.

1. Introduction

Soil organic carbon (SOC) is a vital indicator that reflects ecosystem stability, soil health, and fertility [1,2]. The black soil of Northeast China is characterized by its high levels of SOC content. However, continuous overuse of nitrogen (N) fertilizers to maintain high crop yields in black soils has contributed significantly to accelerating the decline in soil pH [3,4,5]. Wu et al. showed that long-term use of ammonium nitrogen fertilizer increased the speed of soil acidification. Hence, exploring the stability of organic carbon in acidified soils has emerged as a task of great significance [6].
The extent to which soil pH decline affects SOC depends largely on the stability of the soil organic carbon [7]. Almagro et al. demonstrated that the proportion of soil aggregates with a size of >0.25 mm significantly decreased as the soil’s pH declined [8]. This was mainly attributable to reduced stabilizing and cementing substances resulting from the decline in soil pH. The impact of soil acidification on the agglomeration process is primarily due to its effect on soil cementing substances, which in turn affect aggregate stability. A decline in soil’s pH diminishes its adsorption capacity for binding agents such as Al(OH)3 and Fe(OH)3, thus impeding the formation of macroaggregates and compromising aggregate integrity [9]. The biological function of soil microorganisms is also a key factor affecting the stability of SOC, whose turnover process of SOC fundamentally depends on the growth and activity of soil microorganisms. The presence of arbuscular mycorrhizal fungi in soil was found to be diminished due to acidification of the soil, thereby reducing the stability of soil aggregates [10]. One possible explanation is that soil acidification made mycorrhizal fungi more vulnerable to parasitism. This, in turn, reduced the number of arbuscular mycorrhizae and ultimately weakened the stability of soil aggregates [11].
Besides the physical safeguarding afforded by agglomerates, the chemical resilience of organic carbon substantially influences its overall stability. Comprising a spectrum of carbon-rich organic molecules, SOC exhibits varied levels of resistance to biodegradation, contingent upon intrinsic chemical attributes, including the elemental makeup, functional groupings, molecular chain lengths, and spatial configurations [12,13]. Nondegradability plays a key role in protecting SOC. For example, as demonstrated by Ding et al., augmented levels of mineral-associated inert organic carbon fractions enhance the retention of stabilized organic carbon within the soil matrix [14]. The molecular architecture of organic carbon is a crucial determinant of its chemical stability. As Huo et al. discerned, the integration of organic fertilizers and the reincorporation of straw into the field serve to diminish the proportion of oxyalkyl carbon in soil particulates, whilst concomitantly elevating aromatic and alkyl carbon levels [15,16]. This process thus endows soil organic carbon with aromatic and hydrophobic properties. The complexity of the chemical structure; therefore, plays an instrumental role in protecting the organic carbon stability in soil. Additionally, long-term use of chemical fertilizers increases the soil’s oxyalkyl carbon concentrations but reduces its aromatic carbon quantities. Conversely, consistent application of organic fertilizer increases in alkyl carbon contents, culminating in a higher alkyl-to-oxyalkyl carbon ratio [17]. The structure of the microbial community affects the stability of organic carbon significantly through metabolic functional diversity, interspecific interaction, and environmental adaptability [18,19]. Zhu et al. found that highly diverse communities can synergistically decompose complex organic matter and promote the formation of carbon pools [20]. According to research by Gao et al., soil microorganisms can enhance the chemical resistance of organic carbon through chemical modification (such as polymerization and aromatization) and thereby affect the chemical stability of soil organic carbon. In addition, soil microorganisms can affect the physical protection process of soil organic carbon through the interaction with soil minerals (such as clay adsorption) [21,22]. The stability of soil organic carbon (SOC) is influenced by the soil’s texture and agricultural practices. Current research on soil acidification primarily addresses concerns relating to soil health and the degradation of soil fertility. Nevertheless, the mechanisms underlying SOC stabilization and the processes that are affected by a decline in soil pH due to prolonged application of chemical nitrogen fertilizers remain poorly understood. Consequently, it is essential to investigate the effects of a decline in soil pH on SOC stabilization pathways within agricultural ecosystems in Northeast China.
In this study, we aimed to understand the impact of soil acidification on several key factors in the black soil of meadows in Northeast China: the stability of soil aggregates, the chemical stability of SOC, and the chemical composition of SOC. We hypothesized that long-term nitrogen addition, which leads to a decline in soil pH, may result in altered pathways for soil carbon sequestration and stabilization mechanisms. The specific objectives of this study were to (1) analyze changes in soil aggregates and their associated stability under declining soil pH; (2) elucidate the different effects of soil pH decline on soil organic carbon components; (3) explore changes in the chemical structure of organic carbon associated with soil pH decline; and (4) clarify the impact of soil pH decline on microbial community composition.

2. Materials and Methods

A 13-year-long-term maize cropping system experiment was conducted in this study, which was established in 2008 at the Jilin Lishu Experimental Station operated by China Agricultural University in Sankeshu Village within Sikeshu Township, Lishu County, which is part of Siping City in Jilin Province (124°34′ E, 43°31′ N). The average annual temperature and precipitation were 6.2 ± 0.49 °C and 573.5 ± 24.83 mm with a frost-free period spanning approximately 145 days. The soil texture in this area was classified as phaeozem (equivalent to Hapudoll according to the USDA Soil Classification). The soil’s chemical properties (0–20 cm) were as follows: pH—6.16; SOC—10.56 g·kg−1; total nitrogen—1.09 g·kg−1; available nitrogen—128.00 mg·kg−1; available phosphorus—43.90 mg·kg−1; and available potassium—196.33 mg·kg−1. The changes in soil pH from 2008 to 2021 are shown in Supplementary Table S1. In this study, corn was cultivated using a monoculture planting method from 2008 to 2021. The variety employed was Xianyu 335, with a planting density of 65,000 plants per hectare. Each year, corn was sown in May, followed by prompt weed removal after sowing, and harvest occurred in October.
A long-term positioning trial utilized 46% urea as the nitrogen fertilizer to induce five levels of acidification corresponding to five nitrogen (N) application rates: 0, 168, 240, 270, and 310 kg N ha−1. The resulting pH levels were 6.54 (P1), 6.03 (P2), 5.72 (P3), 5.44 (P4), and 5.32 (P5). The experiment was randomized with three replications. The amounts of phosphorus, potassium, and silicon fertilizers applied were the same across all treatments, consisting of 100 kg·ha−1 of phosphorus, 120 kg·ha−1 of potassium, and 120 kg·ha−1 of silicon. Phosphorus and potassium fertilizers were applied at one time point as base fertilizer, whereas N fertilizer was split between base and joining in a 1:2 ratio. Specifically, urea with a content of 46% was used for nitrogen, di-ammonium phosphate (18-46-0) for phosphorus, and potassium sulfate with a 60% content for potassium. Each experimental plot covered an area of 130 square meters, and none of the treatment groups involved straw being returned to the field.

2.1. Sampling Methods

Soil samples were collected at harvest in October 2021, with a five-point sampling method being employed from the tilled layer (0–20 cm depth). Soil samples were then carefully enclosed in preservation boxes and transported back to the laboratory. The samples were delicately disaggregated, adhering to their natural texture, with extraneous materials such as stones, roots, and remnants of flora and fauna being meticulously removed. One part of the fresh samples was used immediately for determination of soil microbial carbon (MBC); one part was used to determine the soil’s aggregate size distribution, as well as its other chemical properties, physicochemical characteristics, organic carbon fractions, easily oxidized organic carbon content (EOC), and water-soluble organic carbon (WOC); and the last part was stored in a −80 °C ultra-low-temperature freezer for analysis of the soil’s microbial properties.

2.2. Soil Analysis

2.2.1. Physical and Chemical Properties of Soil

The soil’s water stability agglomerates were analyzed using the Cambardella method [23]. They were divided into 4 levels: >2 mm, 2–0.25 mm, 0.25–0.053 mm, and <0.053 mm. The sample was placed evenly in a sieve, and the height of the water surface of the sieve was adjusted to ensure that the water did not pass through the bottom of the sieve or through the top of the sieve when it was vibrating. Thereafter, the soil agglomerate analyzer (TTF-100, Suzhou Tuoce Instrument Equipment Co., Ltd., Suzhou, China) was activated to vibrate the soil sample for 20 min at an upper and lower amplitude of 4 cm and a frequency of 30 vibrations per minute. The water-stable agglomerates of each particle size were cleaned with clean water, rinsed in a beaker, and then dried at 60 °C until constant weight (approx. 12 h). The mass fraction of soil aggregates was calculated for large aggregates (>2 mm), small aggregates (2–0.25 mm), and microaggregates (0.25–0.053 mm), as was the silt and clay fraction (<0.053 mm). The weight mean diameter (MWD), geometric diameter (GMD), mass fraction of aggregates >0.25 mm (R0.25), soil aggregate destruction rate (PAD), and soil aggregate unstable agglomerate index (ELT) were calculated based on Equations (1)–(5).
MWD = i = 1 n x i × w i ,
GMD = exp [ i = 1 n w i × l n x i i = 1 n w i ] ,
R 0.25 = M r > 0.25 M T ,
PAD = D R 0.25 W R 0.25 D R 0.25 × 100 ,
E LT = M T     M r > 0.25 M T × 100 ,
where wi is the mass percentage of agglomerates of particle size i; xi is the average diameter of agglomerates of particle size i; DR0.25 and WR0.25 are the mass percentages of mechanically and water-stable agglomerates of particle size ≥0.25 mm, respectively; Mr > 0.25 represents agglomerates of particle size ≥0.25 mm (g); and MT is the total weight of the agglomerates (g).

2.2.2. Determination Methods of Soil Organic Carbon and Its Component Contents

Soil organic carbon (SOC) was quantified using the potassium dichromate external heating oxidation–titration method. Easily oxidizable organic carbon (EOC; organic carbon in soil that is easily oxidized and decomposed has high biological activity and can sensitively reflect changes in the soil environment) was assessed through potassium permanganate oxidation spectrophotometry. Microbial biomass carbon (MBC; an indicator of microbial activity, soil fertility, and organic matter turnover) was determined via the chloroform fumigation potassium sulfate leaching method. Water-soluble organic carbon (WOC; organic carbon that can be dissolved in water, which is used to reflect the health status and ecological functions of soil) was measured using a water–soil ratio leaching filtration technique. All these methods adhere to the experimental procedures outlined by Bharali et al. [24]. The refractory fraction of organic carbon was hydrolyzed by sulfuric acid hydrolysis [25]. The amount of organic carbon that was fixed by active aluminite was determined by the method proposed by Kramer et al. [26]. The procedure was as follows: Leaching was conducted by using a mixture of sodium dithionite and sodium pyrophosphate (referred to as a DP solution), with a preset pH of 7.3. The water bath was maintained at 50 °C for 30 min and then shaken for 1 min every 5 min. The organic carbon (OCA) content of the extracted solution was determined using a carbon and nitrogen analyzer (Multi N/C 2100, Analytik Jena, Jena, Germany). The determination of water-soluble organic carbon (OCw) is a critical step in this experiment. The specific procedure involves weighing the sieved soil sample and adding CO2-free water at a water-to-soil ratio of 1:5. The mixture is then shaken and extracted at room temperature for 30 min, followed by centrifugation and filtration through a 0.45 μm filter membrane. The resulting filtrate is analyzed using a total organic carbon analyzer to quantify the water-soluble organic carbon content. At the same time, the organic carbon content (OCDP) of the DP solution was determined. Then, the amount of organic carbon that was fixed by active iron and aluminum minerals was calculated by applying the OCFe-Al = OCA − OCw − OCDP equation. The content of Fe and Al ions in the solution was determined using an atomic absorption spectrophotometer (LJ-AAS8S, Shandong Lanjing Technology Co., Ltd., Weifang, China). The determination of calcium–bound organic carbon (Ca-OC) and iron–aluminum bond–bound organic carbon [Fe(Al)-OC] followed the method of Tang et al. [27].

2.2.3. Determination of Chemical Structure of Organic Carbon

The functional organic carbon groups were determined by solid-state 13C NMR analysis, in accordance with the method of Schmidt et al. [28]. Meanwhile, small macroaggregate samples were pretreated with a 10% HCl-HF solution to improve the signal-to-noise ratio of the obtained NMR. The procedure was as follows: Firstly, 5 g of air-dried soil samples that had passed through a 2 mm sieve were weighed and then placed into a 100 mL plastic centrifuge tube. Next, 50 mL of 10% hydrofluoric acid solution was drawn up, and the tube was shaken for 1 h, after which it was centrifuged at 4500 rpm for 10 min. Subsequently, the supernatant was poured out, and the bottom residue was further washed with the hydrofluoric acid solution. The whole process was repeated eight times in total. The oscillation times were 1 h × 4 times, 12 h × 3 times, and 24 h × 1 time. The treated soil samples were washed with distilled water to remove the residual hydrofluoric acid, with this washing process being repeated three times. The solid-state 13C cross-polarization magic angle spin (CPMAS) NMR spectra of the samples were recorded by using a Bruker AVANCE III 400 WB spectrometer (Bruker AVANCE III 400 WB, Bruker Biospin, Karlsruhe, Germany) [29]. The specific parameters were as follows: resonance frequency—100.63 MHz; magic angle spin frequency—6 kHz; pulse delay time—0.5 s; and acquisition time—10 ms. The functional organic carbon groups were determined by following the method put forward by Ndung’U et al. [30]. The specific groups included alkyl-C (ranging from 0 to 50 ppm), alkoxy-C (ranging from 50 to 110 ppm), aromatic-C (ranging from 110 to 160 ppm), and carboxy-C (ranging from 160 to 220 ppm).
The ratios of alkyl C to oxygenated alkyl C (A/O-A), aliphatic C to aromatic C (Alip/Arom), and hydrophobic C to hydrophilic C (HB/HI) were used as indicators for evaluating the stability, aliphaticity, and hydrophobicity of the soil organic matter, respectively. The calculations were based on Equations (6)–(9) [31]:
A / O A = A l k y l C O a l k y l C ,
A l i p / A r o m = A l k y l C + O a l k y l C A r o m a t i c C ,
H B / H I = A l k y l C + A r o m a t i c C O a l k y l c + C a r b o n y l C ,
Aromaticity = ( A r o m a t i c C / A l k y l C + O A l k y l C + A r o m a t i c C ) × 100 ,

2.2.4. Determination of Enzyme Activity in Soil

Then, enzyme activity in the soil was assessed following the method outlined by Guan [32]. Specifically, the soil’s invertase activity was quantified using the sodium thiosulfate titration method, wherein sucrose served as the substrate. The soil samples were incubated at a constant temperature of 37 °C for 24 h in phosphate buffer with a pH of 5.5. The reducing sugars produced by the enzymatic reaction were measured using calorimetry, while urease activity was evaluated through the indoxyl colorimetric method (indophenol blue method). In this case, soil samples were incubated with a 10% urea solution in a citrate buffer with a pH of 6.7 at 37 °C for 24 h. The ammonium ions generated by hydrolysis reacted with sodium phenolate and sodium hypochlorite under alkaline conditions, resulting in the formation of blue indophenol, which was quantified by measuring absorbance at a wavelength of 578 nm. Catalase activity was assessed using the potassium permanganate titration method. Soil samples were treated with a 0.3% hydrogen peroxide solution for 20 min, after which the reaction was halted by the addition of 3 N sulfuric acid. The remaining hydrogen peroxide was then titrated with a 0.1 N potassium permanganate standard solution, allowing for the calculation of enzyme activity based on the amount consumed. Acid phosphatase activity was determined using a colorimetric method involving benzene disodium phosphate as the substrate. The substrate was incubated in a pH 5.0 acetate buffer at 37 °C for 2 h. Following this incubation, a colorimetric measurement was conducted at a wavelength of 510 nm, after the phenol that had been released through enzymatic hydrolysis reacted with a specific chromogen. All culture processes were carried out in a biochemical incubator that was shielded from light to maintain a constant temperature of 37 °C, thereby ensuring the stability of enzymatic reaction conditions and the comparability of the experimental results.

2.2.5. Determination of Composition of Soil Microbial Community

Total soil microbial DNA was extracted from 0.5 g of fresh soil using the FastDNA® SPIN kit (MP Biomedicals, Illkirch, France) in accordance with the manufacturer’s instructions. The quality of the DNA was assessed using 1.2% agarose gel electrophoresis. The V3-V4 region of the bacterial 16S rRNA gene was amplified with primer sets 338F (5′-ACTCCTACGGGAGGCAGCAG-3′) and 806R (5′-GGACTACHVGGGTWTCTAAT-3′). Fungal ITS genes were amplified using primer sets ITS1F (5′-CTTGGTCATTTAGAGGAAGTAA-3′) and ITS2R (5′-GCTGCGTTCTTCATCGATGC-3′). The thermal cycling conditions were as follows: initial denaturation at 95 °C for 3 min, followed by 30 cycles of denaturation at 95 °C for 30 s, annealing at 55 °C for 30 s, and extension at 72 °C for 45 s, concluding with a final extension at 72 °C for 10 min. PCR amplification products were recovered from 2% agarose gels, purified using the AxyPrep DNA Purification Kit (Axygen Biosciences, Union City, CA, USA), and quantified with QuantiFluor™-ST (Promega, Madison, WI, USA). The purified PCR products were sent to Shanghai Personalbio Biotechnology Co., Ltd. (Shanghai, China) for high-throughput sequencing on the Illumina MiSeq platform. The raw sequences were processed using QIIME (V1.17), followed by quality control and processing. OTU clustering at 97% was performed using Vsearch software (V2.29.4), and the bacterial 16S rRNA genes and fungal ITS genes were referenced against the Greengenes (Release 13.8, http://greengenes.lbl.gov/, accessed on 15 October 2025) and the UNITE (Release 8.0, https://unite.ut.ee/, accessed on 15 October 2025) database, respectively. Each OTU representative sequence was annotated using QIIME2 software (2025.7.0). Microbial diversity was assessed by calculating the Chao 1 and Shannon indexes for both bacterial and fungal communities, with results being flattened by the smallest sequence.

2.3. Statistical Analysis

One-way analysis of variance (ANOVA) was carried out using SPSS 21.0 to analyze the differences between the means under different treatments (p < 0.05). Additionally, the Mnova software (9.0.0) was used to process the data, and the Origin 2021 software was employed for graphing. The relationship between the soil’s pH value, aggregate stability, organic carbon chemical structure, active metal ion content, and mineral-bound organic carbon content was explored using the partial least squares method (PLS-PM). The path coefficient and determination coefficient (R2) in the PLS-PM path model were estimated using R (4.5.0) and verified by the PLS PM software package (0.6.0) (1000 boot bands).

3. Results

3.1. Changes in Aggregate Size Distribution and Aggregate Stability

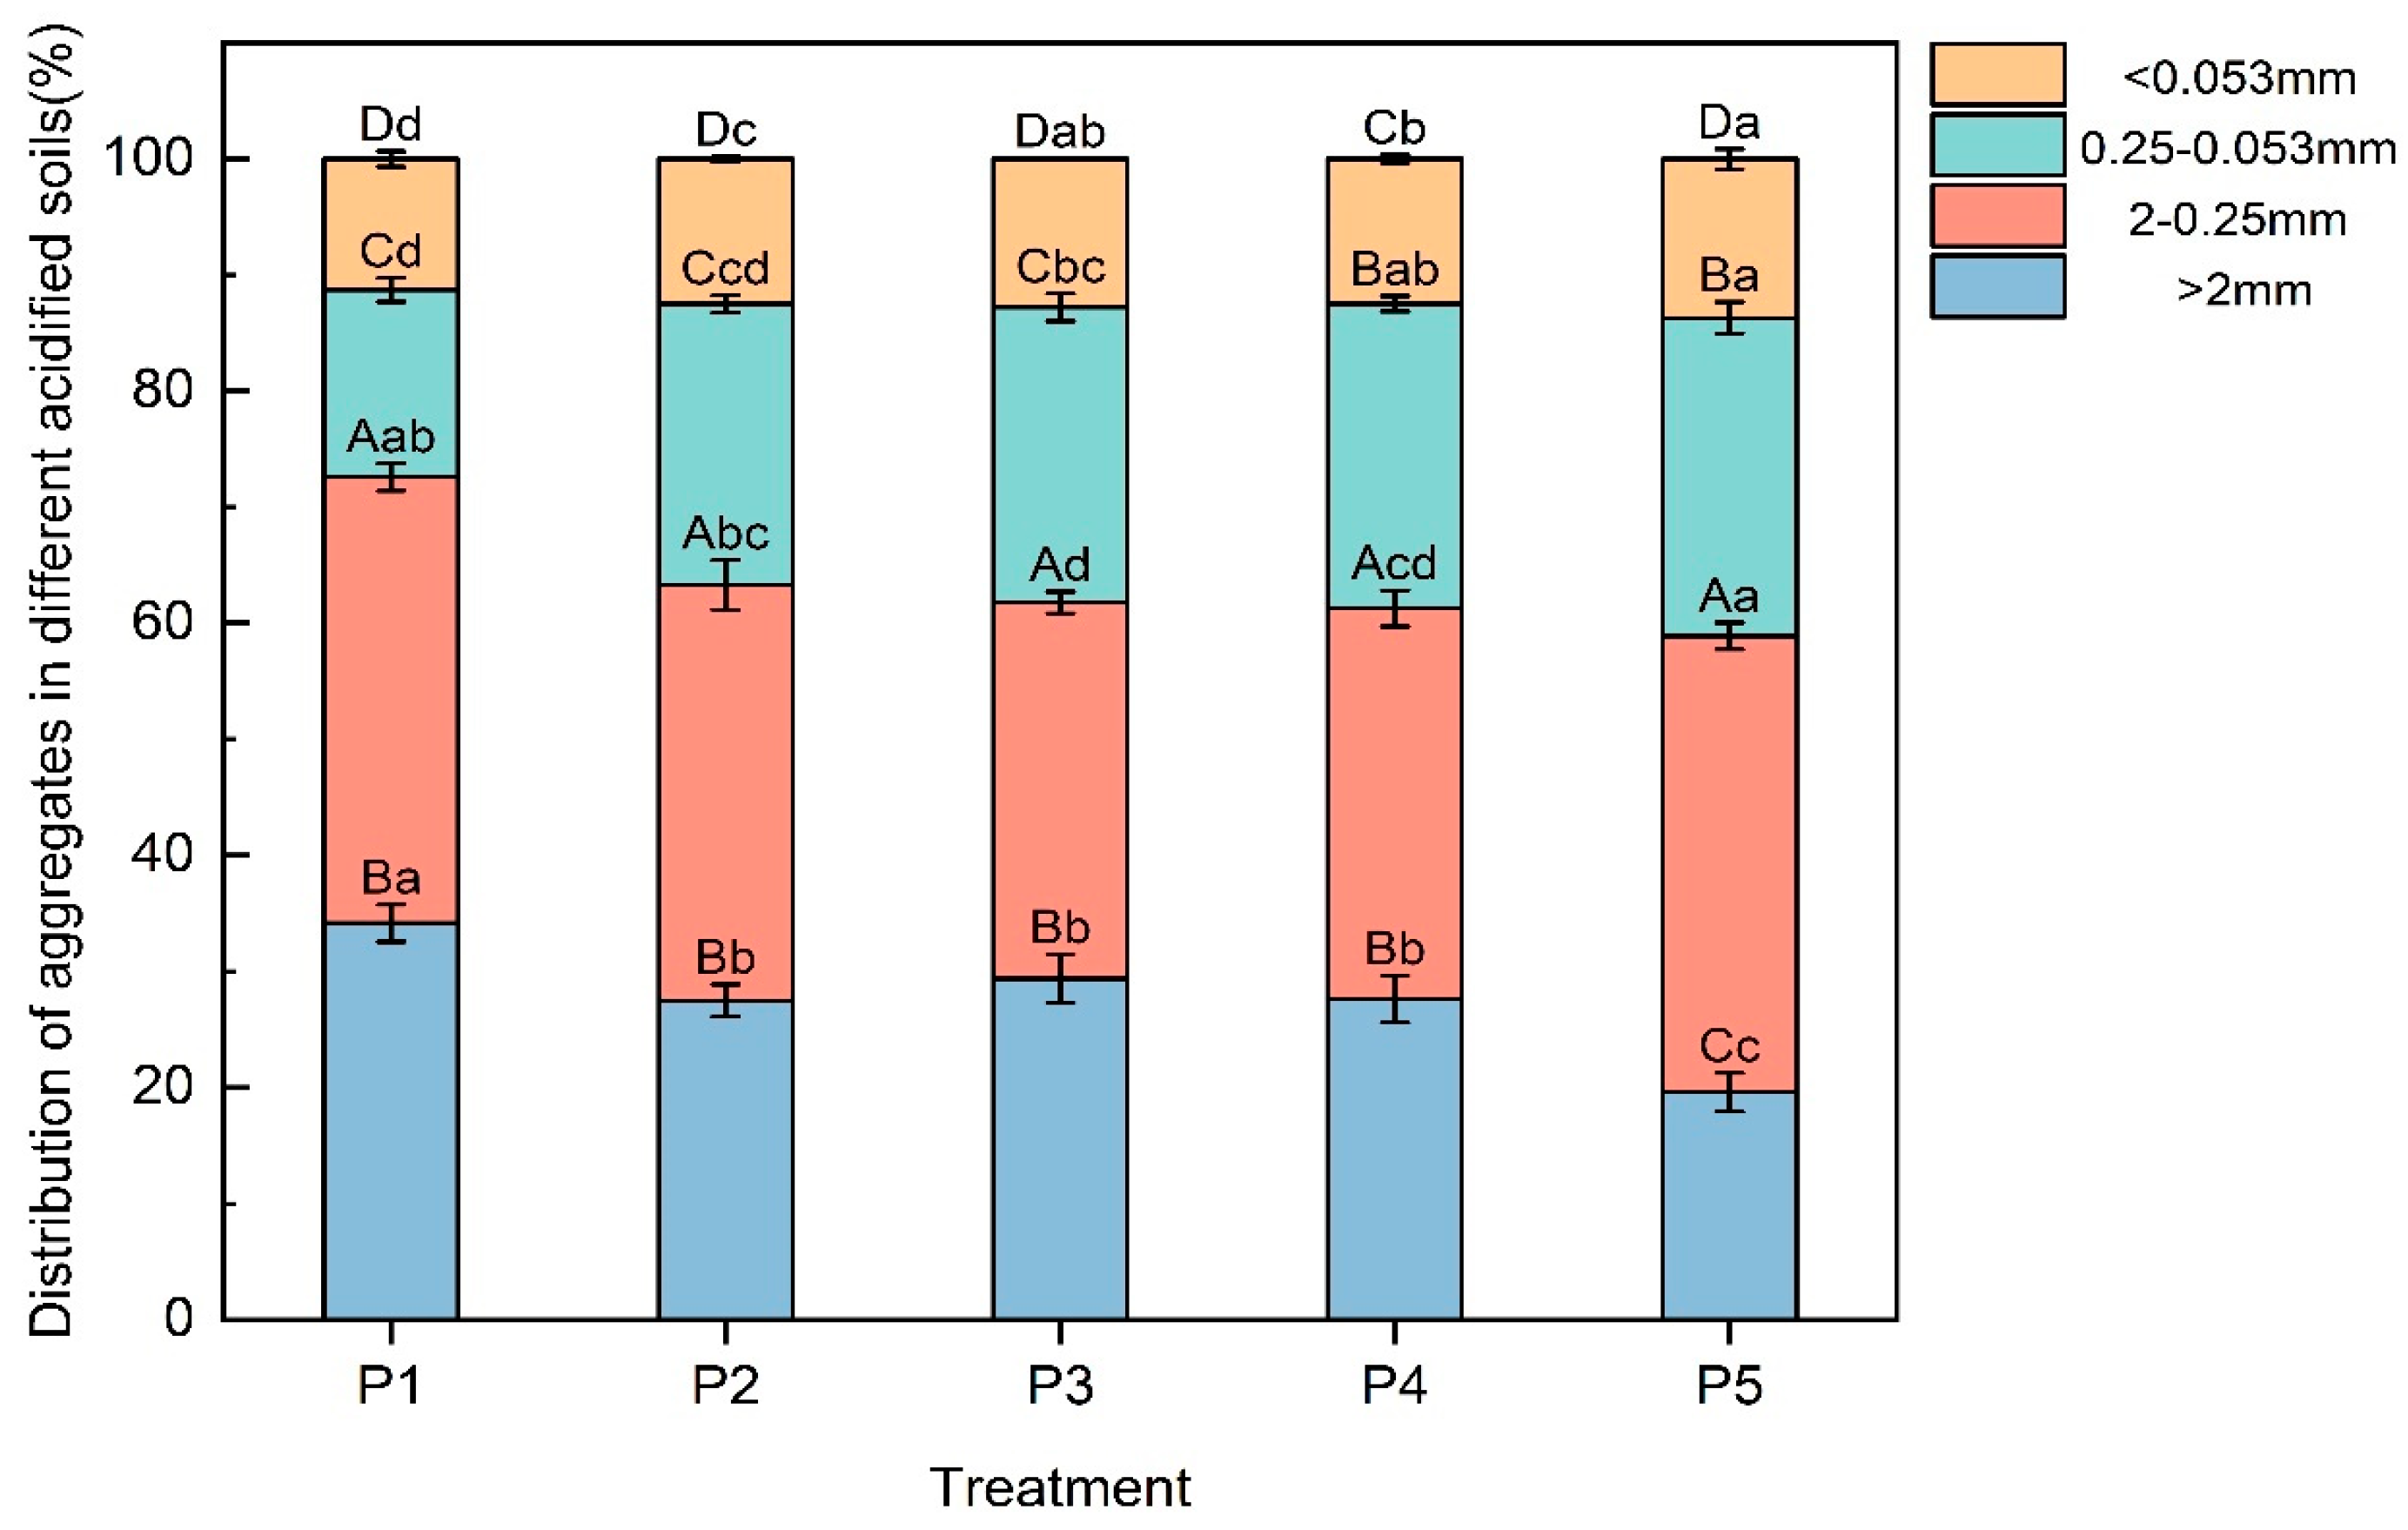
The decline in soil pH exerted a significant impact on the distribution of soil aggregates (Figure 1). Water-stabilized aggregates were primarily in the size range of 2 to 0.25 mm across all treatments. The mass of aggregates in the size range of >2 mm decreased by 14.6% as the pH declined from 6.54 to 5.32. The proportion of aggregates in the size range of >2 mm was lowest (19.6%) under the P5 treatment. The mass fraction of aggregates in the size ranges of 0.25–0.053 mm and <0.053 mm increased by 11.3% and 2.3%, respectively, under the P5 treatment compared with P1.
The trajectories of both the PAD and ELT exhibited fundamentally identical patterns (Table 1). As the pH decreased, PAD and ELT increased by 3.3% and 4.1%, respectively. The highest values of PAD and ELT were observed under the P5 treatment, showing increments of 13.0% and 13.4%, respectively, relative to P1. Relative to P1, the P2, P3, P4, and P5 treatments showed decrease in GMD by 25.6%, 25.6%, 28.0%, and 40.2% while R0.25 decreased by 12.8%, 14.9%, 15.6%, and 18.5%. Overall, the decline in soil pH contributes to the deterioration of soil aggregate structures, signified by the transformation from macroaggregate to microaggregate structures. These findings highlight the detrimental effects of soil pH decline on the stabilization processes of soil agglomerates and the physical retention of organic carbon within the soil matrix.

3.2. The Impact of Soil pH Decline on Organic Carbon and Its Components

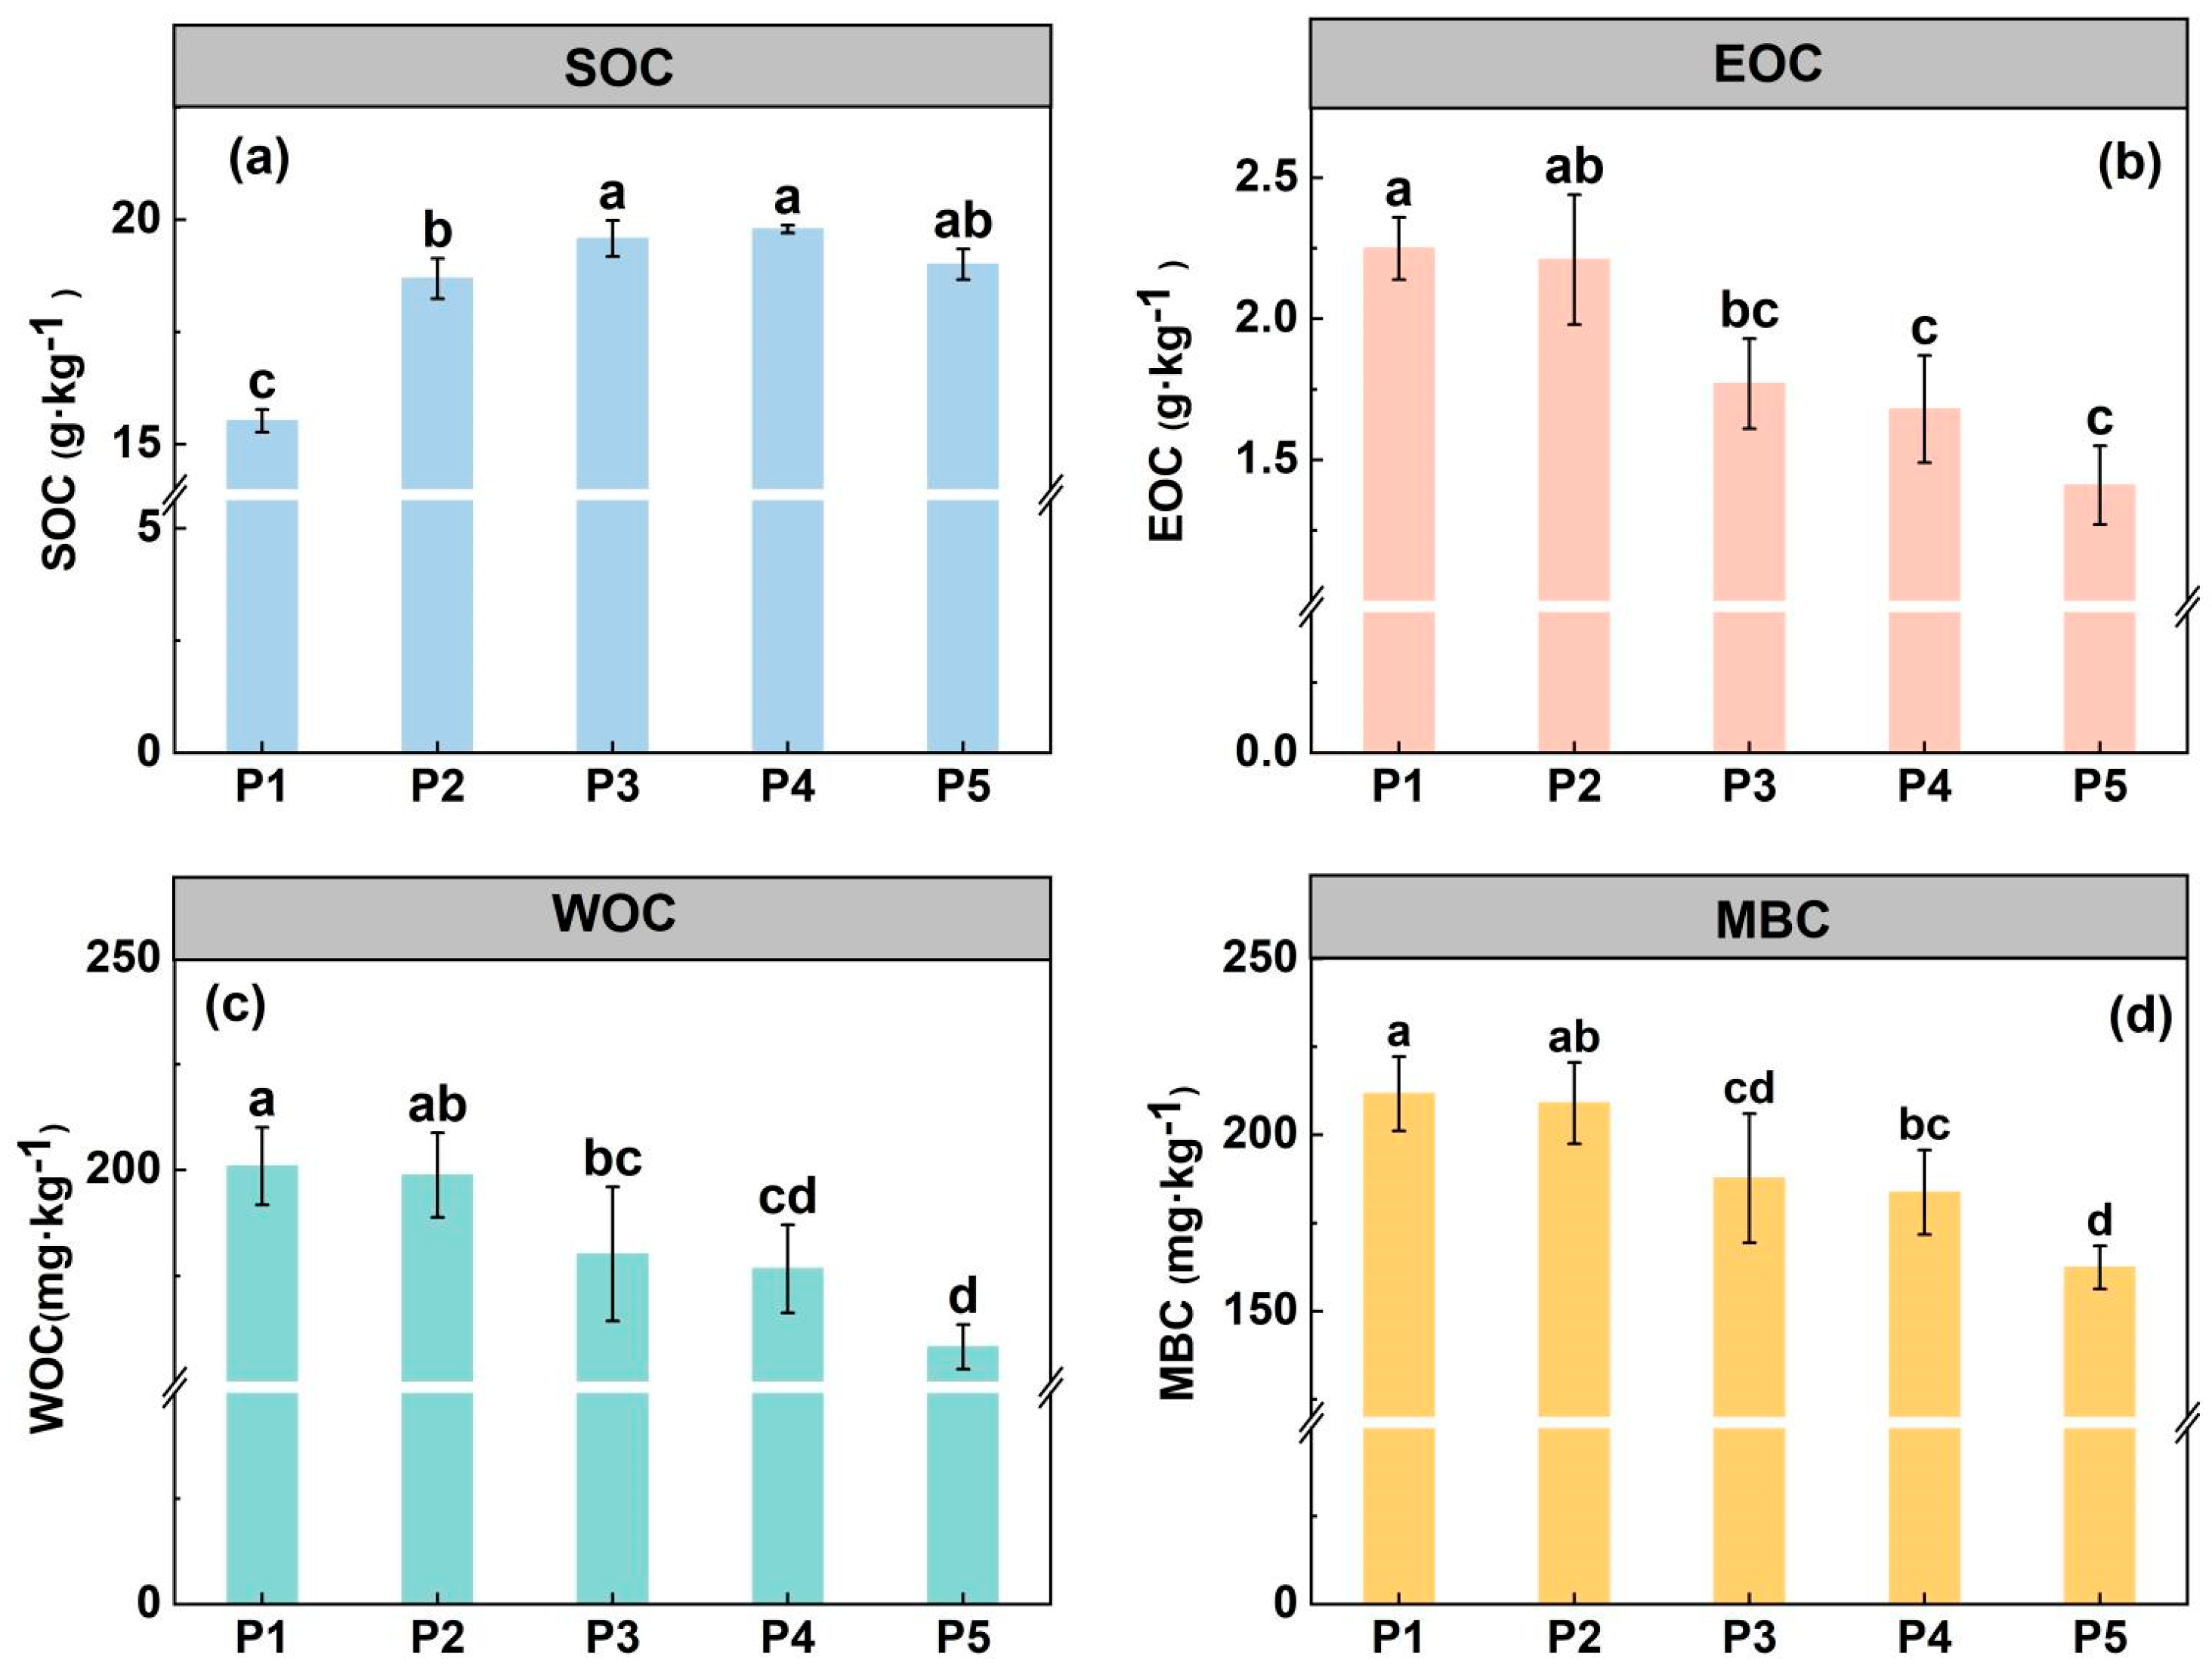
The SOC content increased and then decreased with the decrease in soil pH. Among all treatments, the highest SOC content (19.58 g·kg−1) was found under the P4 treatment (pH of 5.44) with an increase of 27.5% compared with the P1 treatment (Figure 2a). There were notable declines in EOC, WOC, and MBC under declining soil pH (Figure 2b–d). Compared with P1, the P5 treatment reduced DOC, WOC, and MBC content by 37.3%, 21.3%, and 23.3%, respectively.
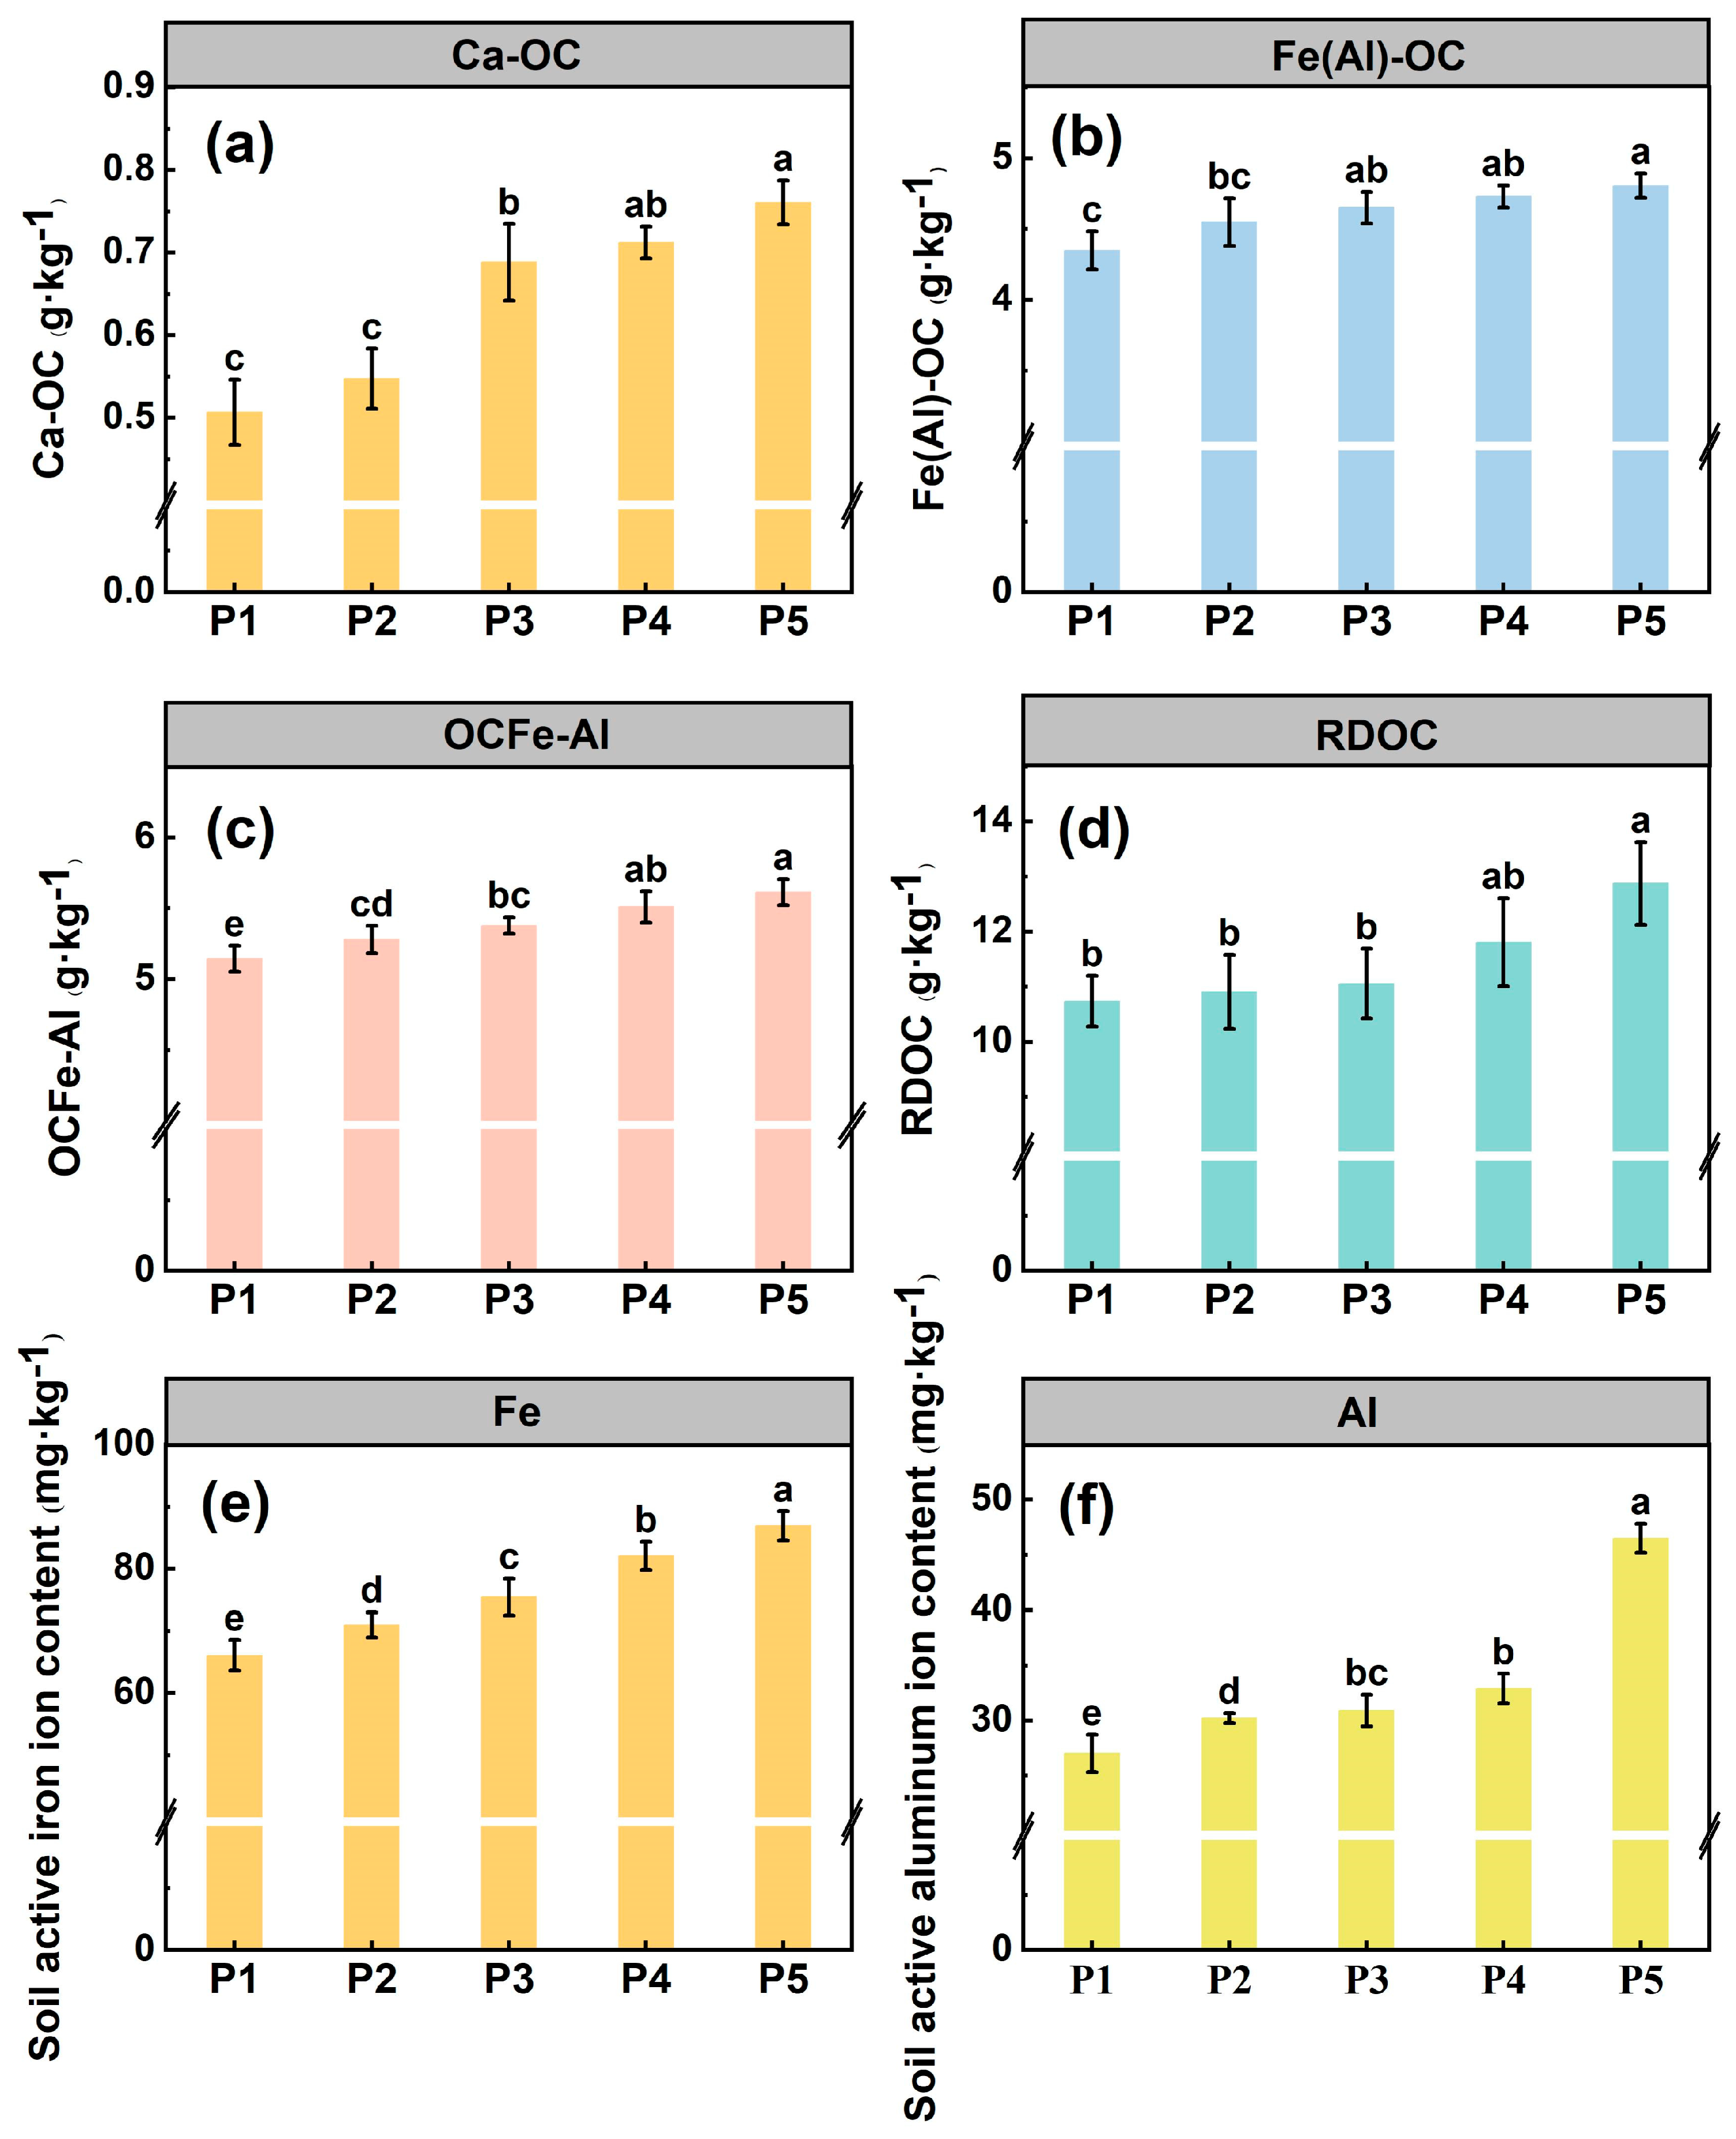
As the soil’s pH decreased, its stable carbon sequestration increased significantly (Figure 3a–c). Specifically, the concentrations of Ca-bound OC (Ca-OC), Fe/Al-bound OC (Fe(Al)-OC), and organo–mineral complexes (OC-Fe-Al) all peaked under the P5 treatment. Compared with P1 treatment, their sequestration rates increased by 49.0%, 10.6%, and 9.1%, respectively. Concurrently, the concentration of recalcitrant organic carbon reached its maximum value of 5.02 g·kg−1 under the P5 treatment, significantly higher than the levels observed in other treatments (Figure 3d). As demonstrated in Figure 3e,f, the soil’s pH exhibited a strong inverse correlation with the concentrations of reactive iron (Fe) and aluminum (Al) ions. Decreasing the soil pH triggered a significant increase in these ions. Specifically, relative to the P1 treatment, reactive Fe and Al ion concentrations under the P5 treatment increased substantially by 31.4% and 71.9%, respectively.
Among the five treatment conditions, soil organic carbon is mainly composed of O-alkyl carbon (accounting for 30.9–36.3%) and aromatic carbon (comprising 30.0–35.7%), with the percentages of carbonyl carbon being 14.0–16.7% and that of alkyl carbon being 14.0–22.3% (Table 2). As the soil’s pH value drops, the contents of alkyl carbon and carbonyl carbon exhibited decreases ranging from 10.4% to 34.8% and 4.8% to 12.7%, respectively, under the P2, P3, P4, and P5 treatments, in comparison with the P1. Meanwhile, the amounts of aromatic carbon and O-alkyl carbon correspondingly experienced increases of 7.4–24.0% and 2.9–8.7%, respectively. The alkyl carbon/O-alkyl carbon and aliphatic carbon/aromatic carbon ratios increased by 47.2% and 20.3%, respectively, under the P5 treatment relative to P1. The aliphatic carbon/aromatic carbon ratio decreased, and the molecular structure of organic carbon tended to be more complicated with the decrease in pH (Table 3). The variation in the ratio of hydrophobic carbon to hydrophilic carbon implied that the hydrophobicity of organic carbon decreased due to soil pH decline. It was observed that the aromaticity of organic carbon increased by 20.8% under the P5 treatment in comparison with P1. The reduction in alkyl C content and the increment in the content of aromatic C corroborated the fact that soil aggregates are less stable under low-pH conditions.

3.3. The Impact of Soil pH Decline on Enzyme Activity and Microbial Community Composition of Soil

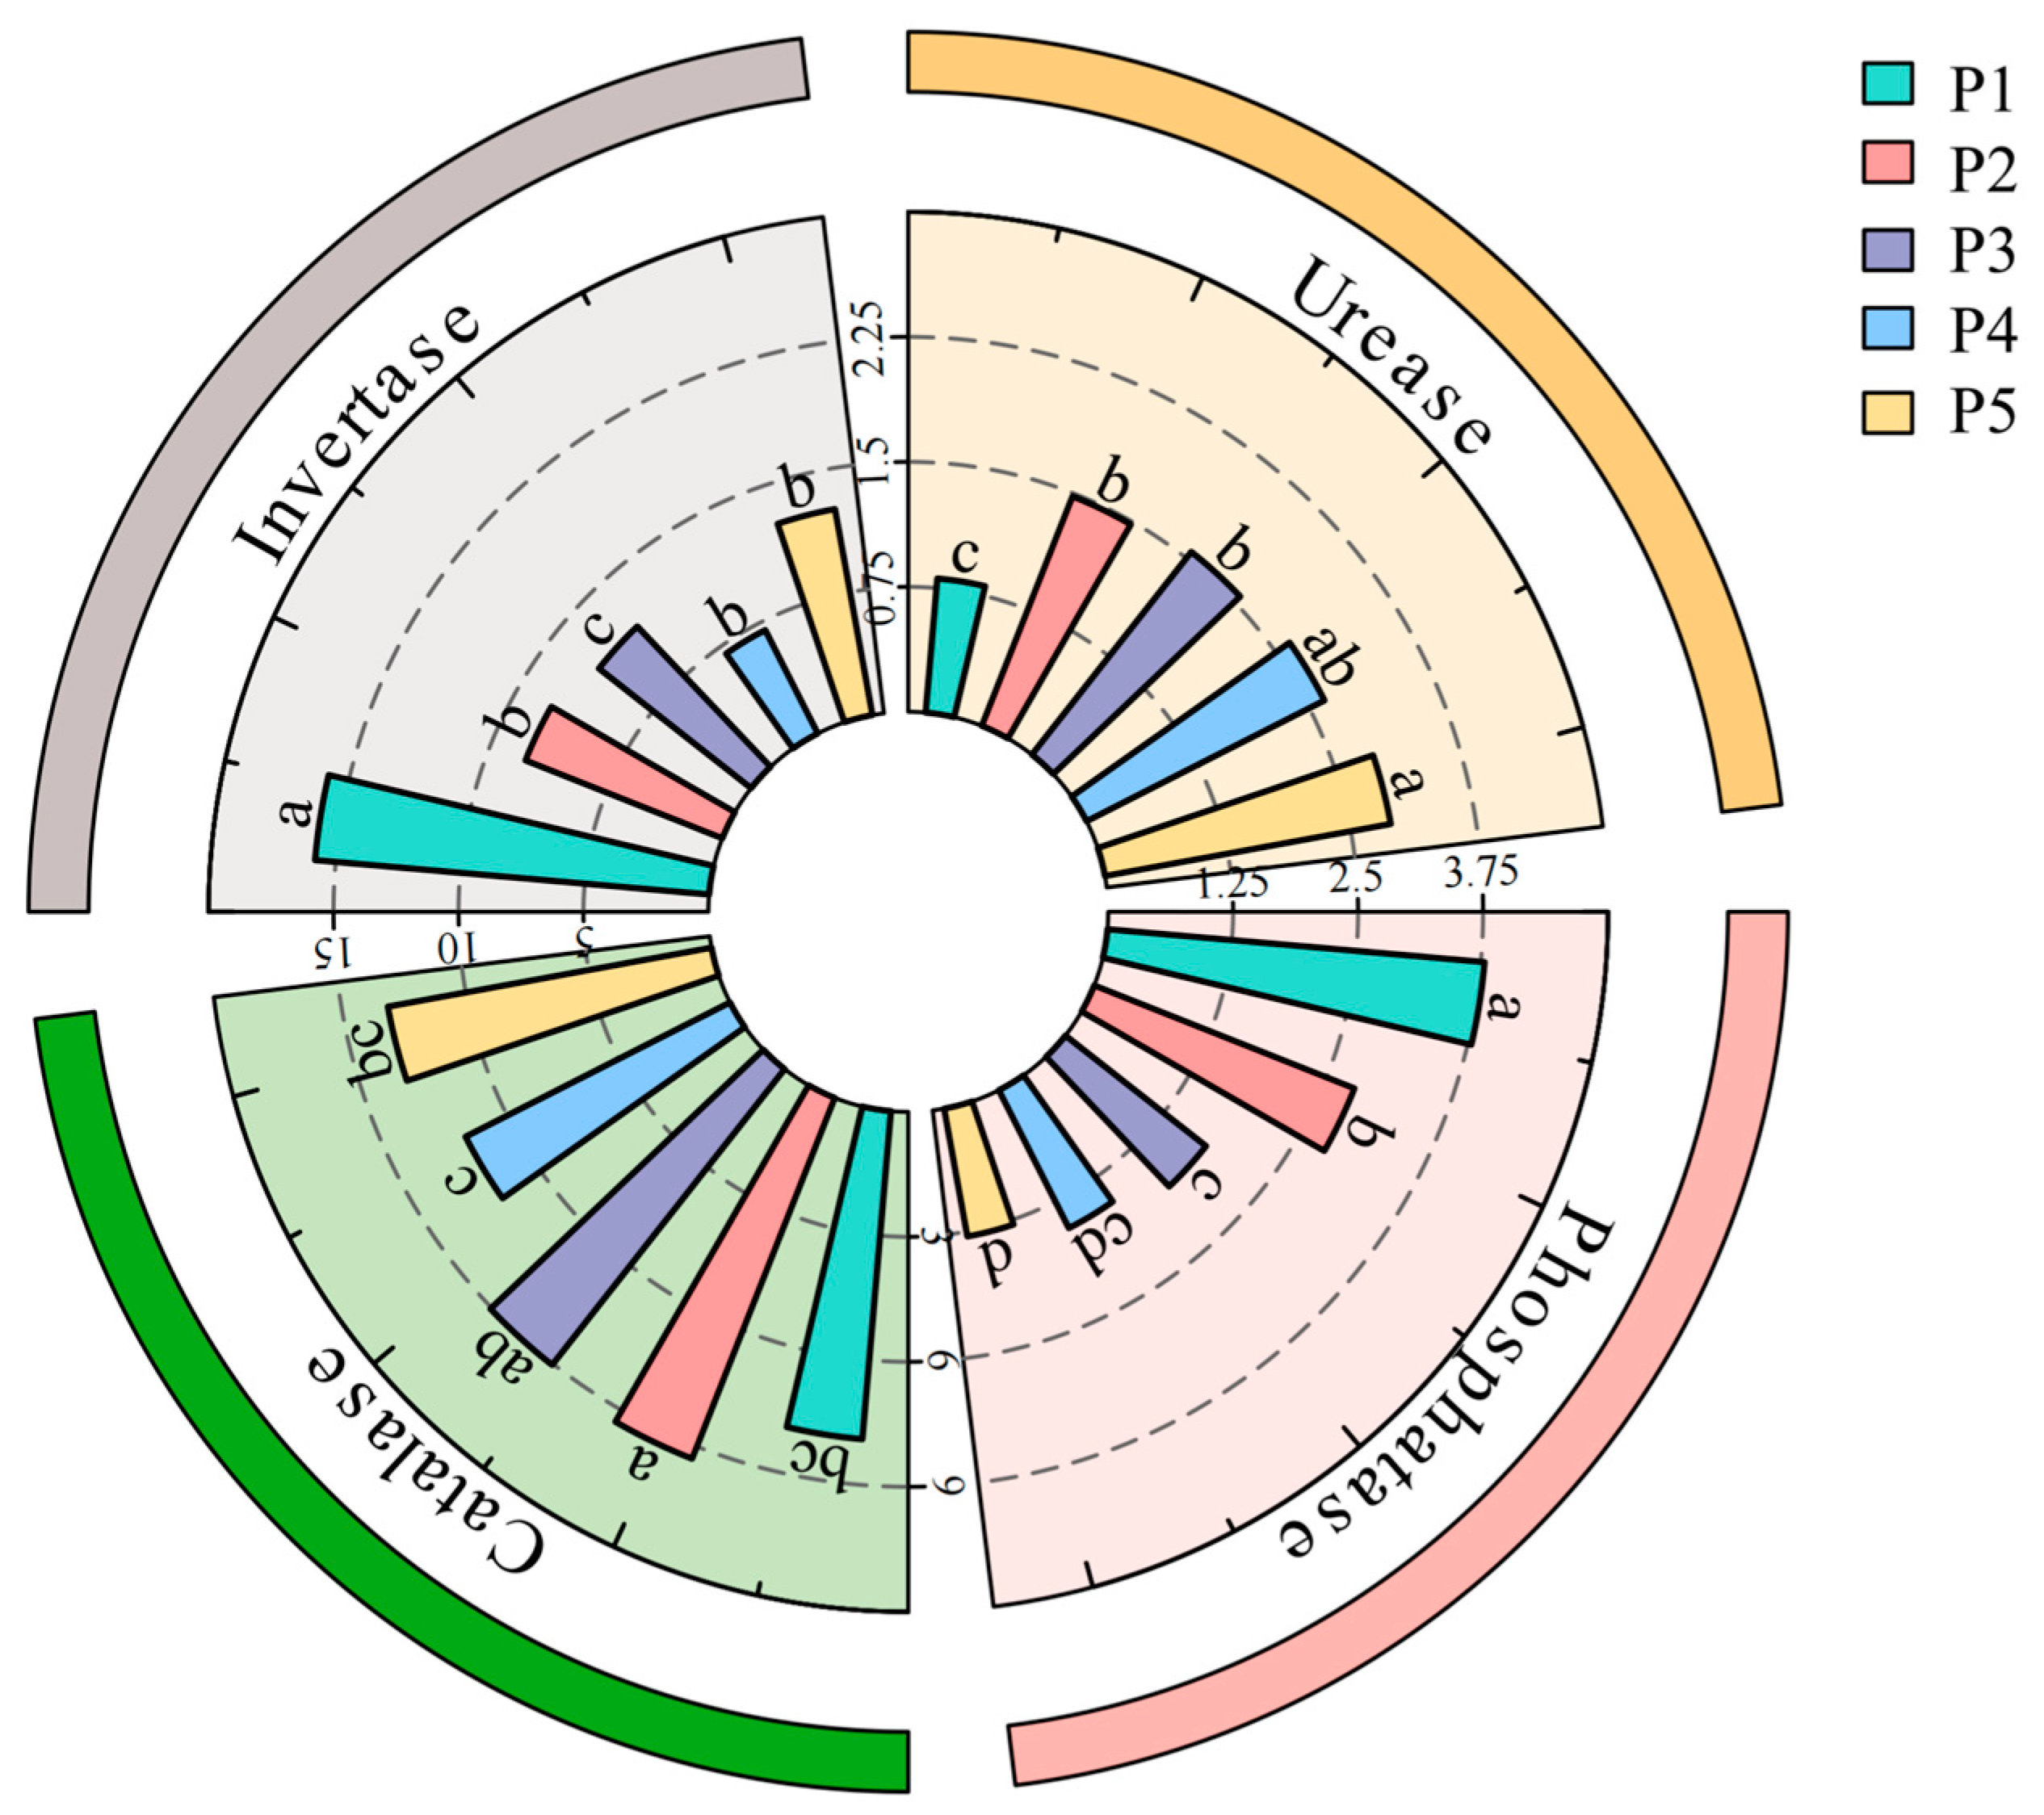
Figure 4 delineates changes in soil enzyme activities under decreasing soil pH. Urease activity exhibited a pronounced increase with decreasing soil pH levels, rising by 115% in the P5 treatment relative to P1. Conversely, acidification significantly suppressed acid phosphatase and invertase activities, which decreased by 65.7% and 47.0%, respectively, in P5 versus P1. Notably, catalase activity peaked significantly in the P2 treatment, exceeding the levels observed under other treatments.
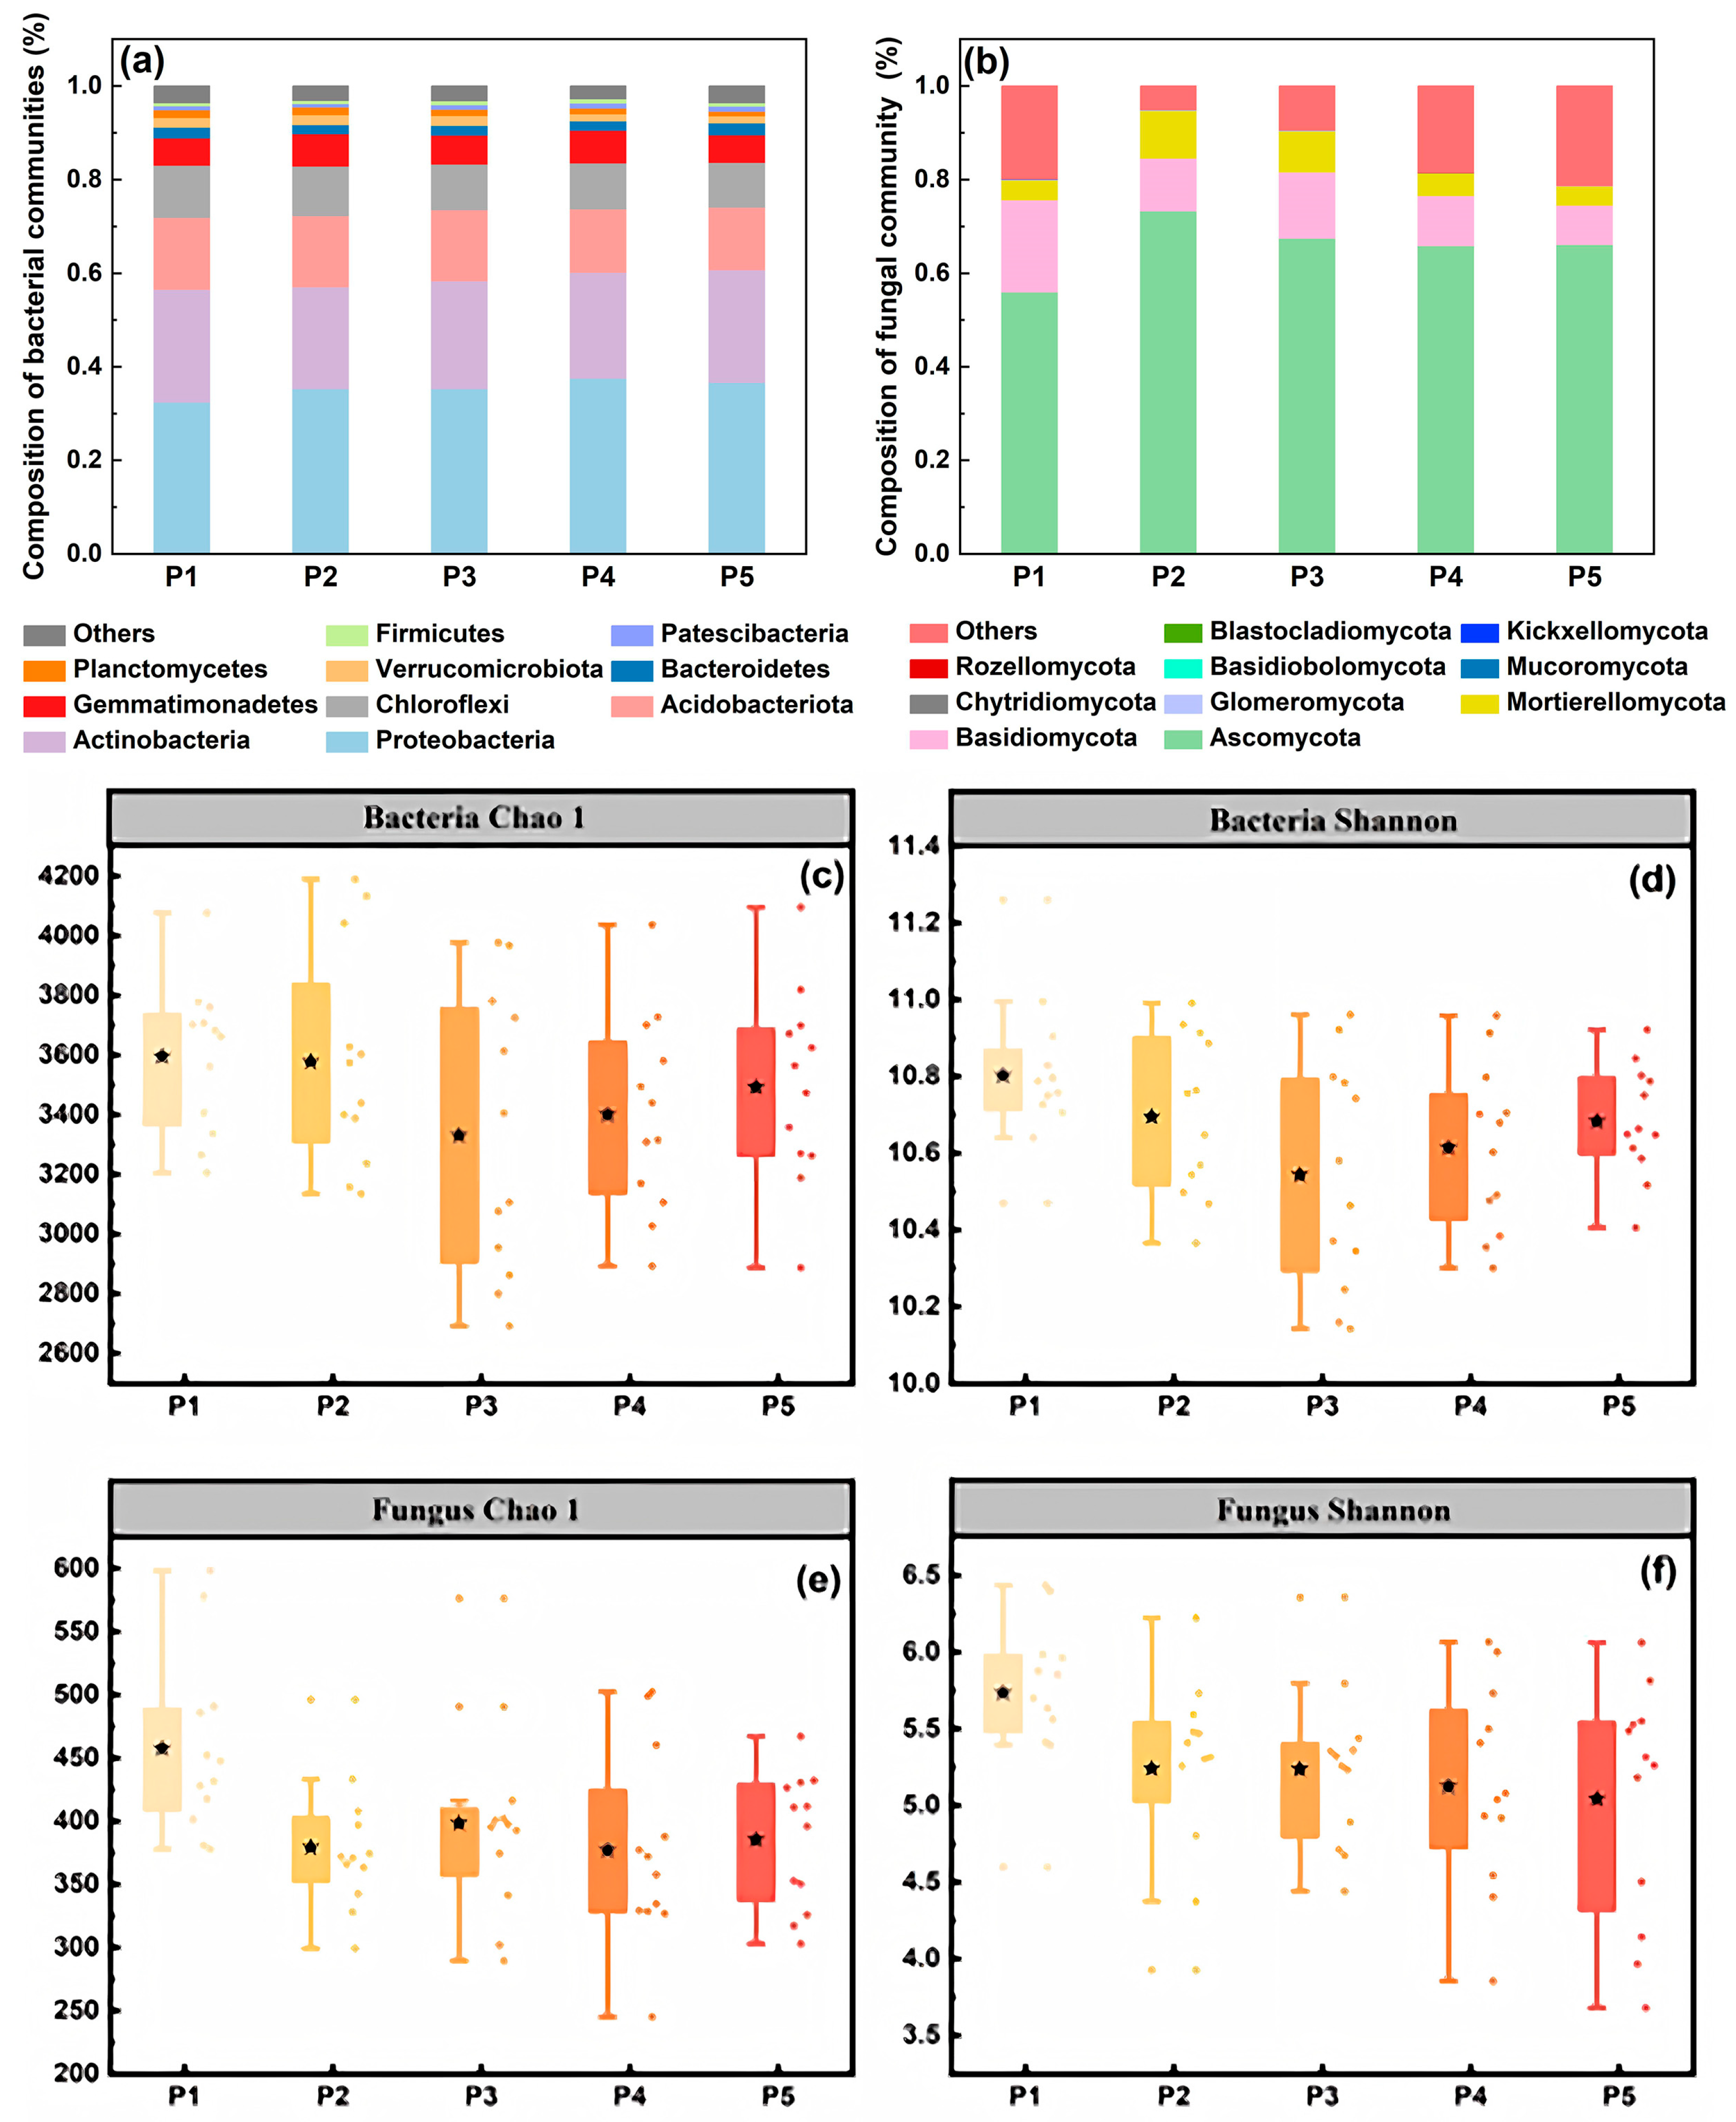
Changes in the soil’s bacterial and fungal community composition with declining soil pH are shown in Figure 5. Figure 5a shows the pH-driven recombination of bacterial communities in the soil under acidification stress. The bacterial community in acidified soils was dominated by Proteobacteria (32.5–37.6%), Actinobacteria (21.8–24.1%), Acidobacteriota (13.4–15.3%), Chloroflexi (9.6–11.2%), and Gemmatimonadetes (5.8–7.1%). Soil pH declines significantly altered the taxonomic distribution, with Proteobacteria’s relative abundance significantly increasing by 15.7% (P4 vs. P1), while those of Acidobacteria and Chloroflexi decreased by 22.4% and 18.9%, respectively. Alpha diversity analysis revealed declining species richness (Chao1 index: P3 < P1 by 14.7%), although the Shannon diversity remained statistically invariant across treatments. These shifts suggest that acidification favors copiotrophic taxa (Proteobacteria) over oligotrophic groups (Acidobacteriota), potentially through pH-mediated niche filtering and resource competition.
Figure 5b delineates the structural reorganization of fungal communities under soil pH decline, characterized by a predominance of Ascomycota (56.1–77.3%), Basidiomycota (8.3–19.6%), and Mortierellomycota (4.2–10.2%). Notably, the relative abundances of Ascomycota and Mortierellomycota reached their maxima under the P2 treatment, increasing substantially by 17.2% and 6.0% relative to P1, suggesting their adaptive tolerance to moderate acidification. Conversely, Basidiomycota displayed a pronounced pH-dependent decline, with its abundance decreasing progressively across acidification gradients and culminating in an 11.3% reduction under P5 versus P1, which is indicative of heightened sensitivity to severe acidification. Alpha diversity metrics further corroborated community simplification: the species richness (Chao1 index) and community diversity (Shannon index) decreased significantly by 17.5% and 23.5% in the P5 treatment compared with P1.

3.4. The Impact of Soil pH Decline on the Stability Mechanism of Soil Organic Carbon

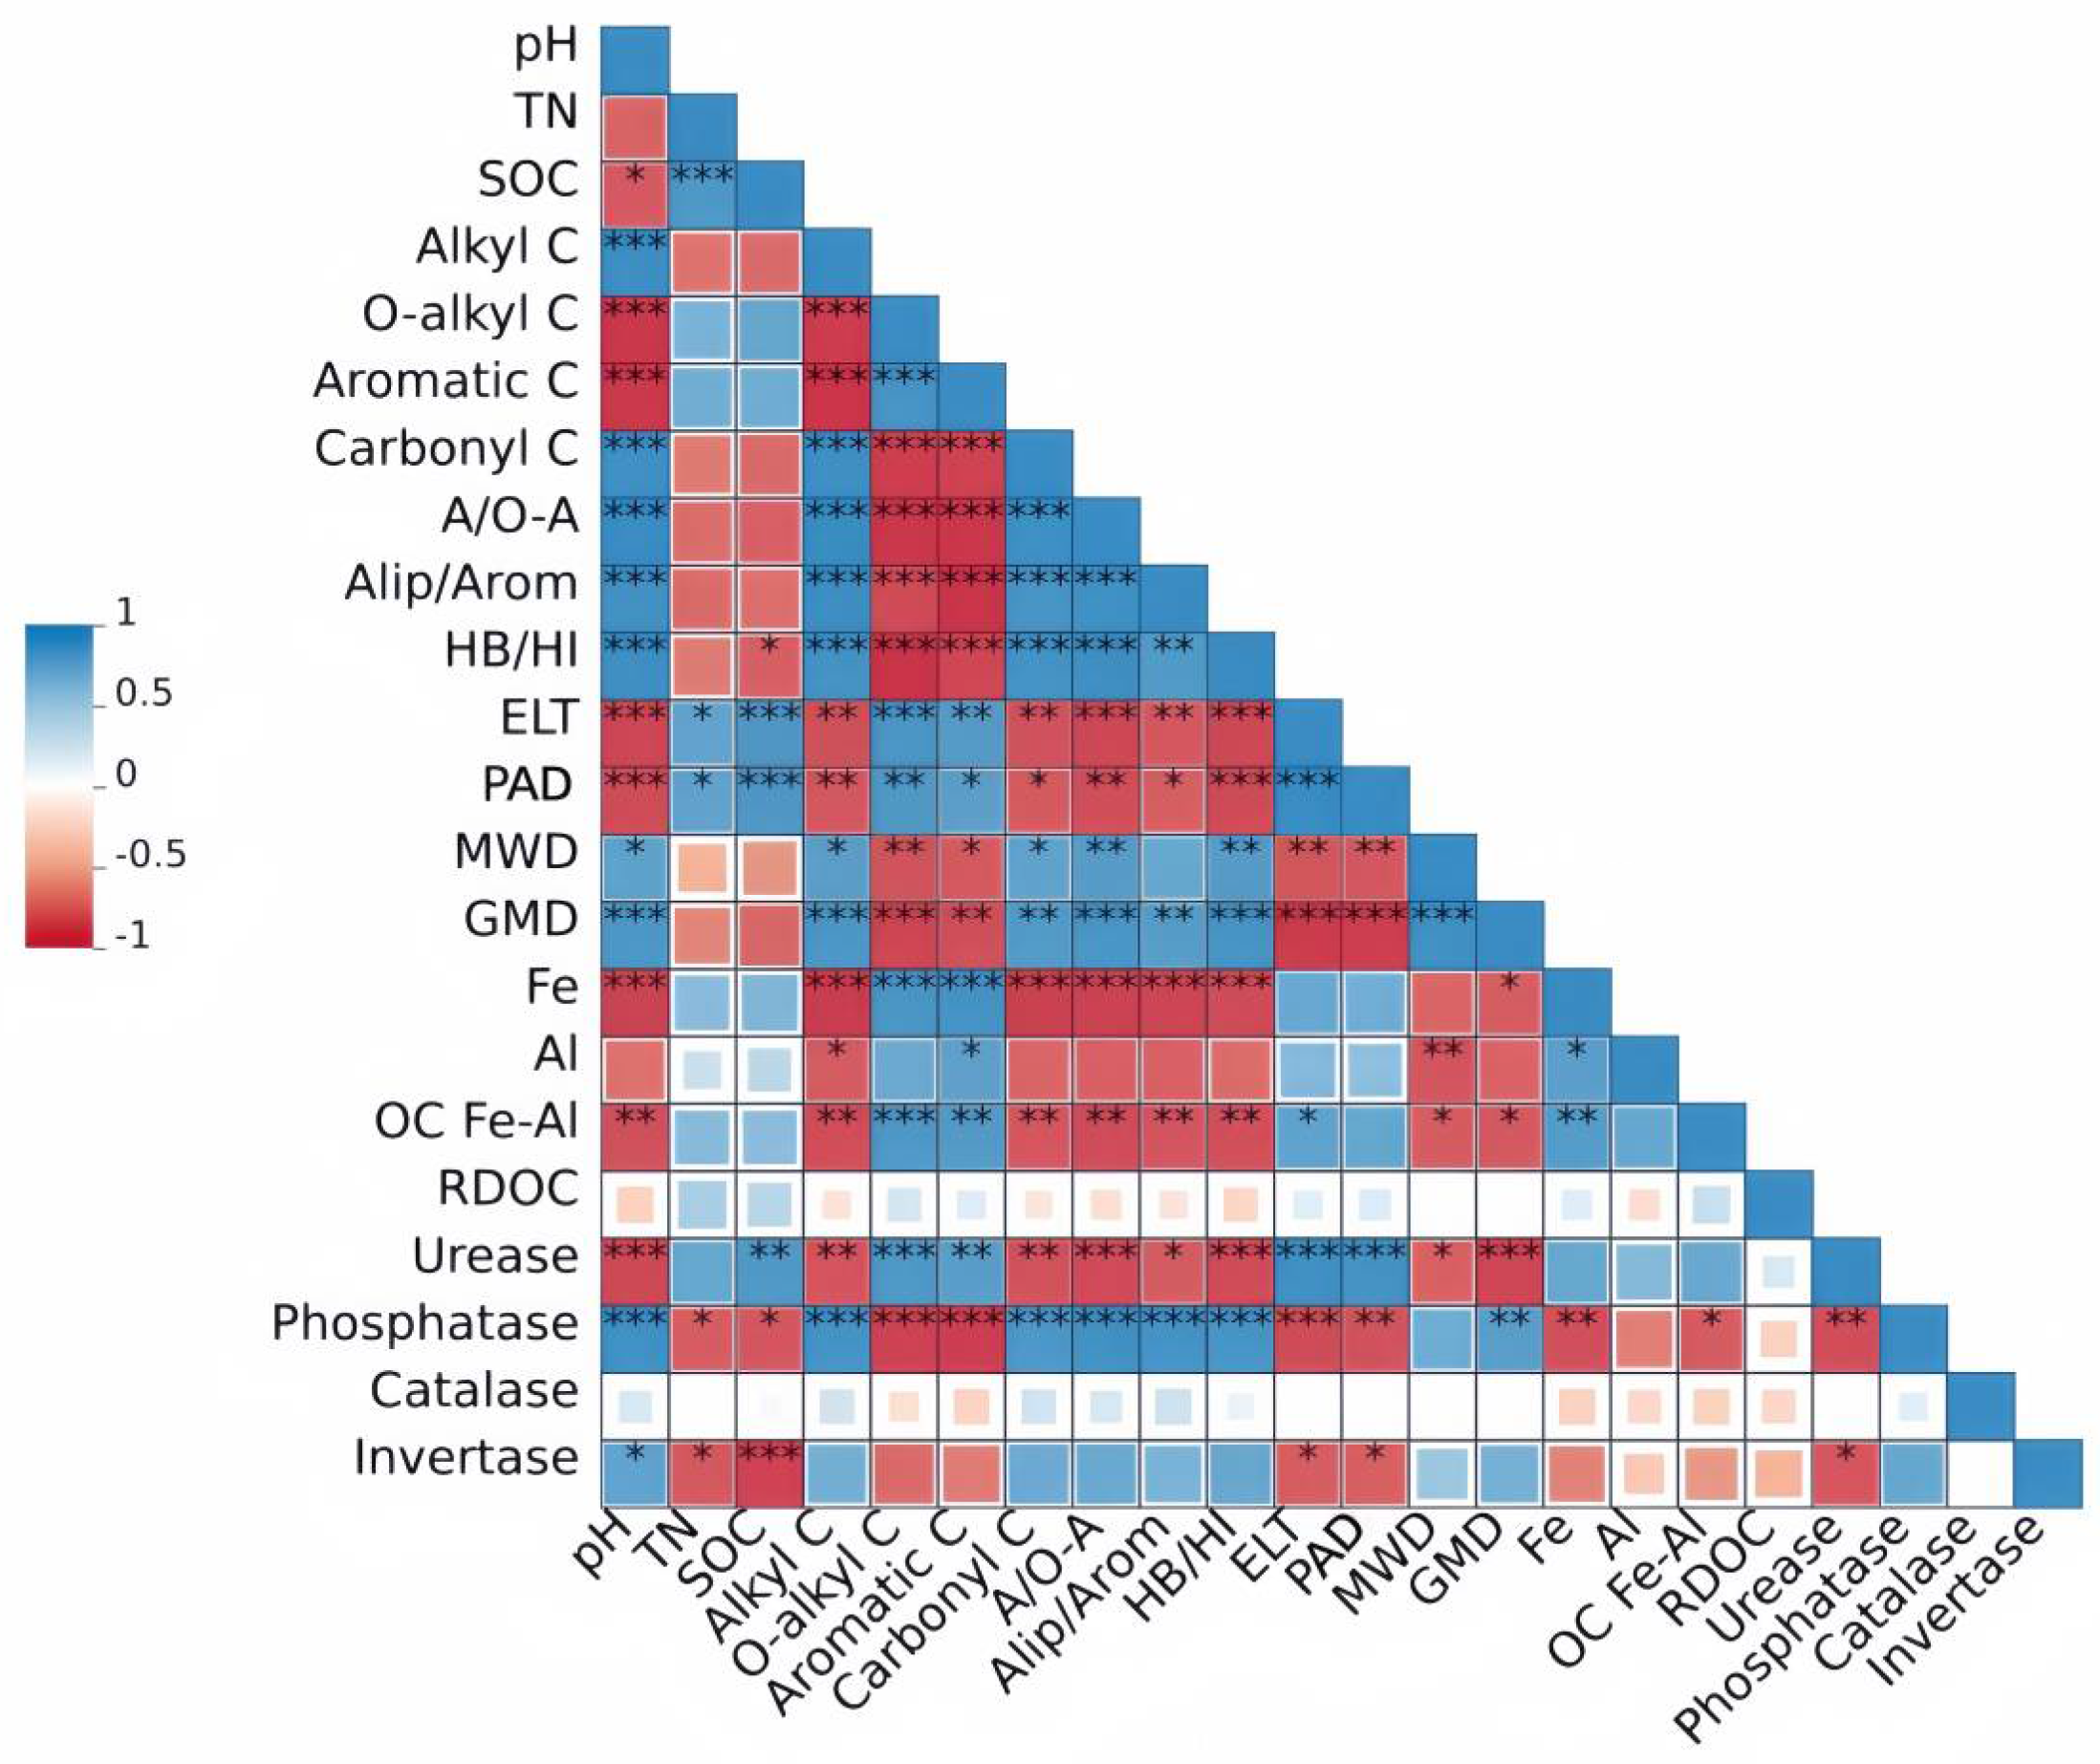
According to the correlation thermogram data presented in Figure 6, the soil’s pH value was significantly negatively correlated with aromatic C and significantly positively correlated with alkyl C and A/O-A with high activity. These results showed that with soil acidification, the aromatic components with more stable chemical structures that were difficult decompose in organic carbon increased relatively, while the proportion of relatively active components decreased, which directly enhanced the chemical stability of the organic carbon itself. In addition, the pH indirectly affects organic carbon by affecting the physical protection mechanism of aggregates. In the figure, pH is significantly negatively correlated with aggregate stability indicators such as MWD and GMD. This confirms that acidification will destroy soil aggregates, resulting in the exposure of organic carbon that has been encapsulated in the soil, which is more easily decomposed by microorganisms. More importantly, pH changes drive the carbon cycle from the biochemical level by regulating microbial activity and function. The thermogram showed that there was a significant positive correlation between pH and invertase activity. Acidification will seriously inhibit the activity of this key carbon cycle enzyme, slowing down the conversion of fresh organic carbon and the fixation to a stable carbon pool. At the same time, pH was significantly negatively correlated with iron and aluminum oxides (Fe, Al) and organic mineral-bound carbon (OCFe-Al).
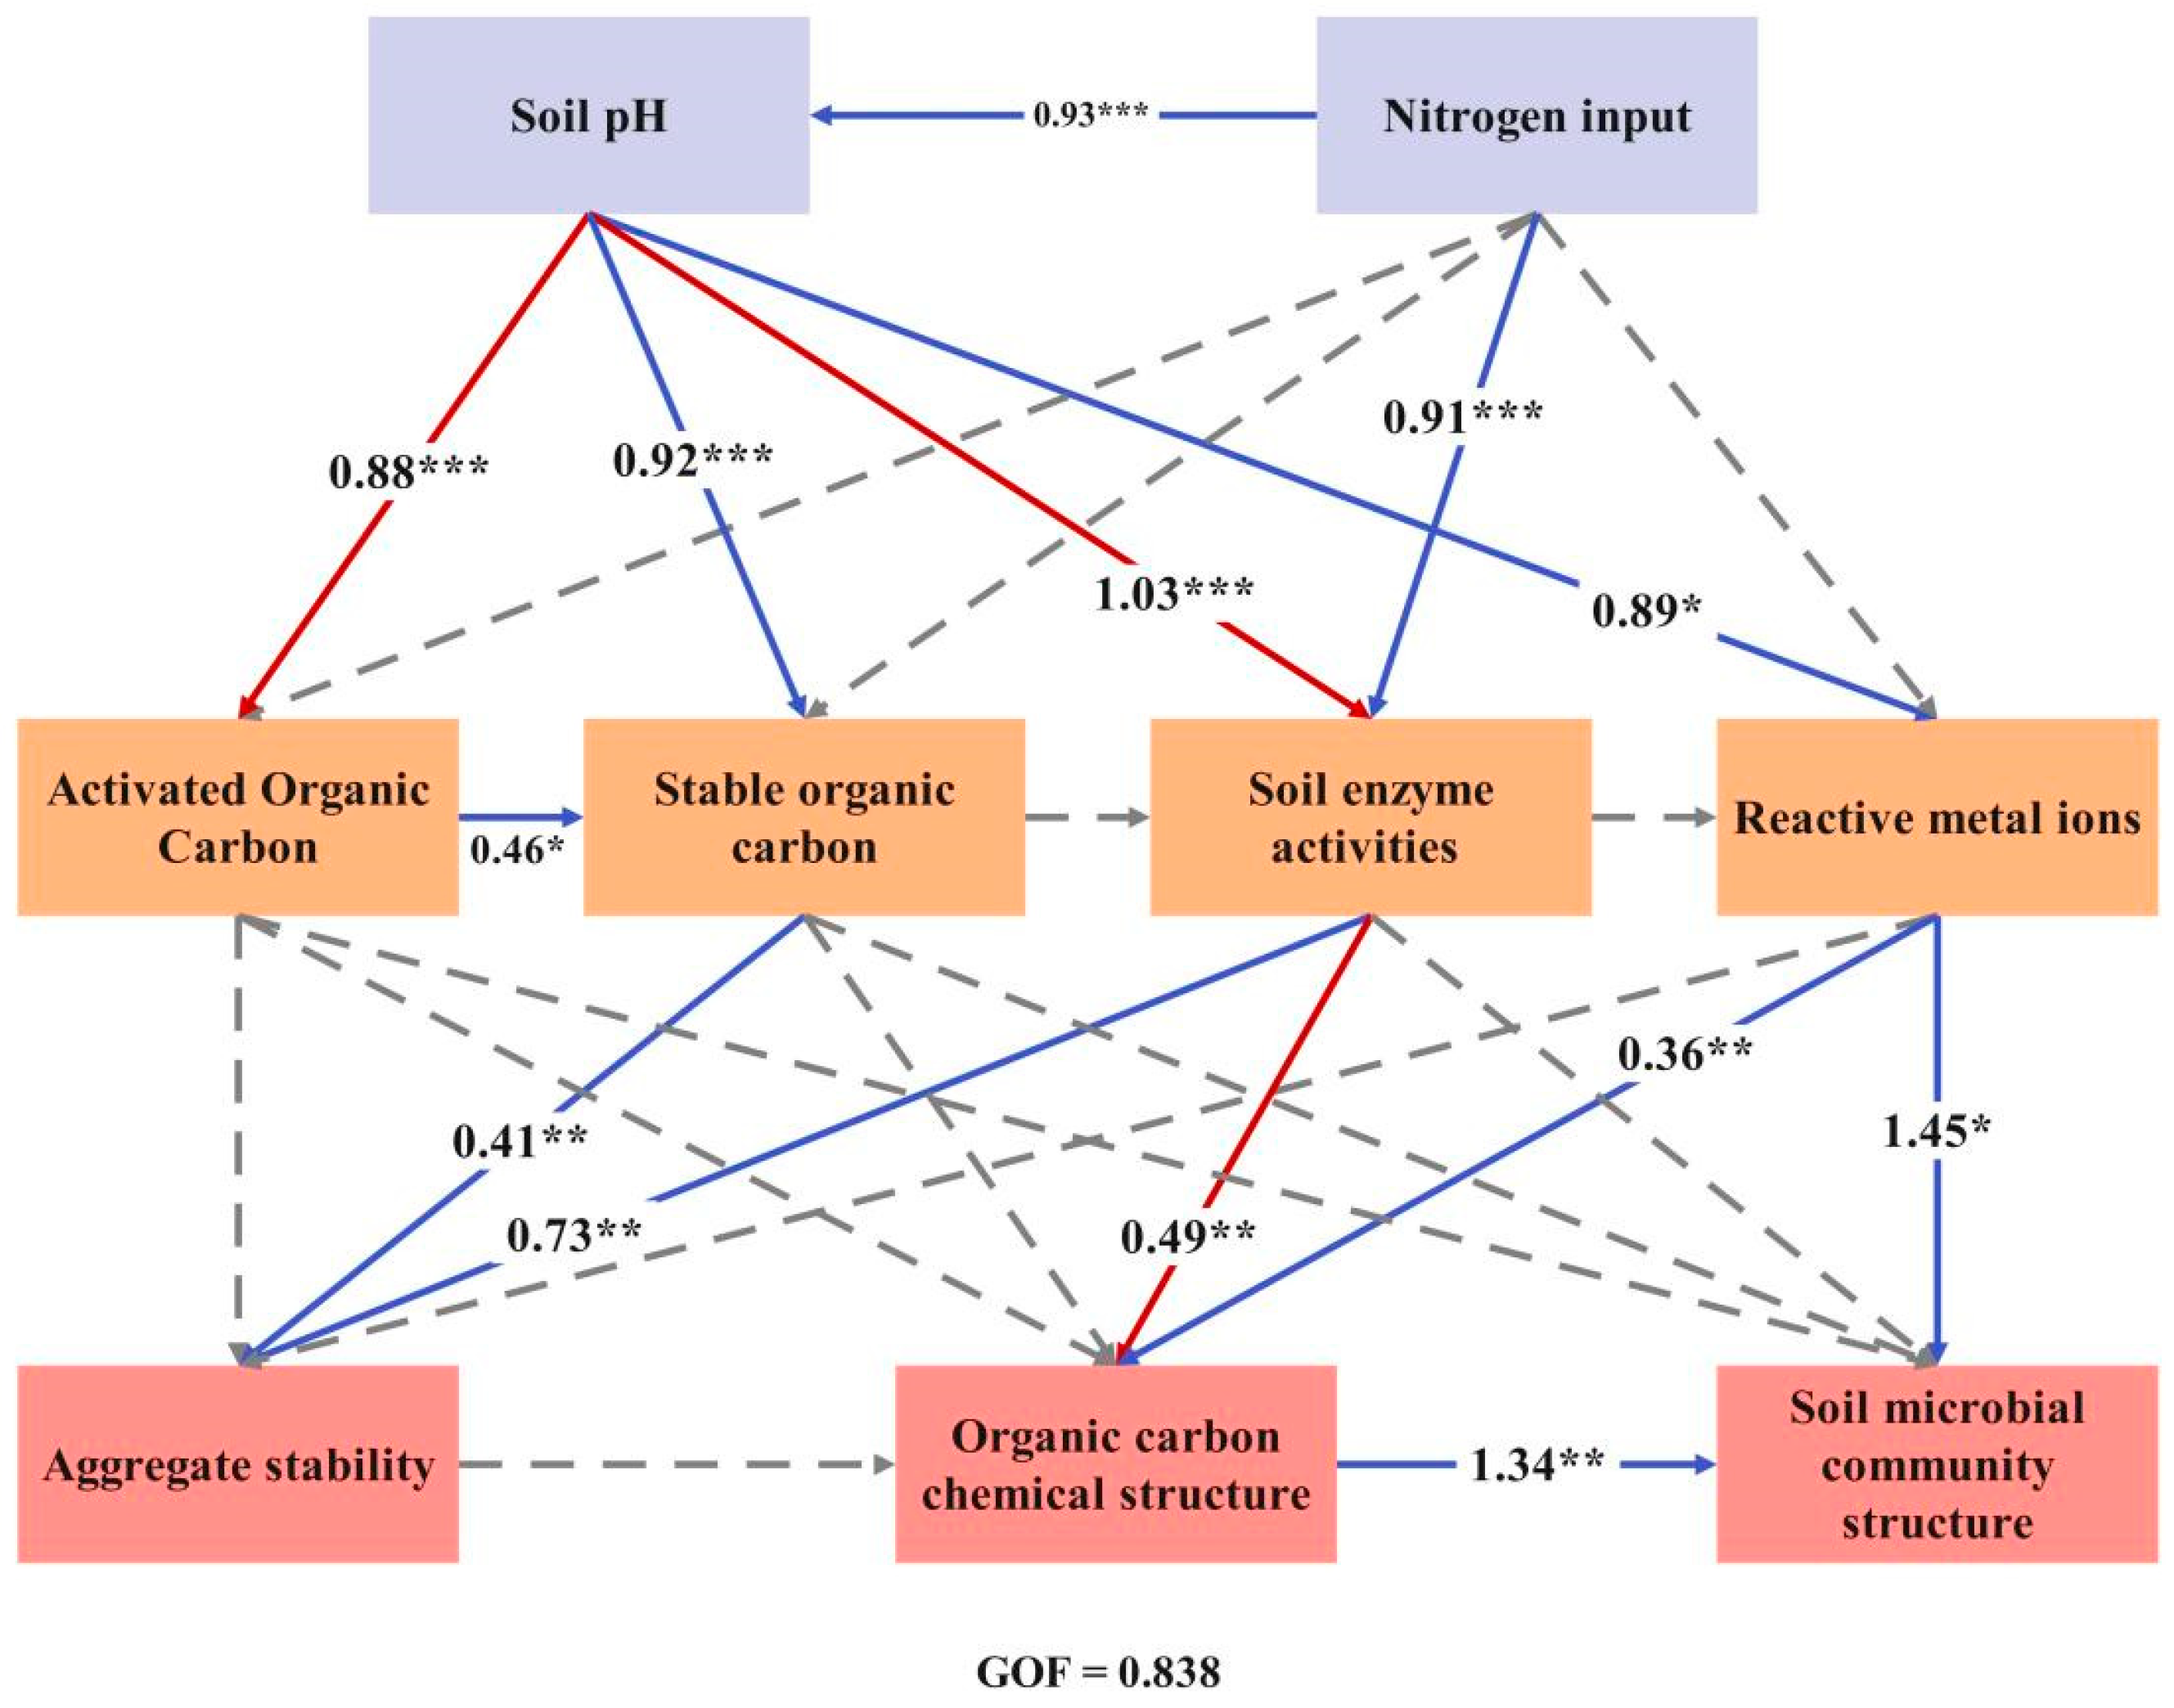
Partial least squares path simulation (PLS-PM) analysis indicated that nitrogen-induced soil pH decrease influenced the stabilization mechanism of black soil organic carbon (SOC). As the soil’s pH decreased from 6.54 to 5.32, the stability of the soil organic carbon was compromised, leading to a shift in the primary stabilization mechanism from physical protection and biological activity to chemical stability. This transformation mechanism may be influenced by three interrelated processes (Figure 7): (1) Destruction of physical protection: A decrease in pH diminishes the physical shielding of soil organic carbon (SOC) by altering enzyme activities in the soil (path coefficient = 1.03; p < 0.001) and reducing the content of particulate organic carbon (path coefficient = 0.92; p < 0.001). (2) Enhancement of chemical stability: Active metal ions (path coefficient = 0.36; p < 0.05) and variations in enzyme activity (path coefficient = 0.49; p < 0.05) work synergistically to promote organic–mineral complexation, thereby enhancing the chemical stability of SOC. (3) Inhibition of biological pathways: Reactive metal ions (path coefficient = 1.45; p < 0.01) and chemically stable SOC (path coefficient = 1.34; p < 0.05) collectively influence microbially driven SOC sequestration. These three interrelated processes form a cross-mechanism interaction that collectively influences the stabilization mechanisms of soil organic carbon under acidic conditions. However, the interaction mechanisms among these three processes under acidic conditions require further investigation.

4. Discussion

The stability of soil organic carbon reflects its resilience against decomposition and mineralization processes, with the soil’s pH serving as a critical factor influencing this stability [33,34,35]. This study demonstrates that soil pH decreases diminish both the physical and biological stability of organic carbon. This reduction occurs through a transition of aggregates from larger to smaller sizes, a decline in the diversity of the soil’s microbial communities, and a shift toward a eutrophic microbial community. Conversely, the acidification process increases in the proportion of refractory organic carbon and mineral-bound organic carbon while complicating the chemical structure of organic carbon, thereby enhancing its chemical stability. Fujii et al. reported that the addition of nitrogen and phosphorus leads to the structural transformation of soil aggregates from large to small, consequently reducing aggregate stability and the physical protection of organic carbon [36]. These findings align with the results of the present study.

4.1. Soil pH Decline Reduces the Physical Stability of Soil Organic Carbon

Shen et al. and Bai et al. demonstrated that soil acidification is a precursor to the structural degradation of soil [37,38]. This study indicated a negative correlation between the soil’s pH and both the proportion of large aggregates and their average weighted diameter. Acidified soil predominantly consists of aggregates within particle size ranges above 2 mm and between 2 and 0.25 mm. An increase in acidification levels is associated with a diminishing presence of large aggregates, potentially due to reduced concentrations of stable binding agents within the soil [39]. Increases in PAD and ELT and decreases in MWD and GMD may lead to the intensified leaching of soil base ions from acidified soils, which in turn reduces the ion content and increases in metal oxide reduction, thus promoting macroaggregate dissolution [40,41]. Soil pH decrease destroys pre-existing large aggregates, disrupts the overall soil aggregation, and prevents the formation of new large soil aggregates [42]. Chen et al. demonstrated that nitrogen-induced soil acidification reduced the buffering ability of the soil due to the depletion of organic matter and binders, which compromise the physical stability of soil aggregates [43]. These observations implied that soil pH decrease impairs not only the stability of soil aggregates but also the physical mechanisms that safeguard organic carbon within the soil matrix.

4.2. Soil pH Decline Increases Recalcitrant Organic Carbon Content

Chemical defense strategies play a pivotal role in solidifying soil organic carbon. There is a substantive link between the morphology and concentration of soil iron and aluminum minerals and the extent of carbon sequestration, with denser minerals being indicative of enhanced organic carbon retention [44,45]. Moreover, a decrease in soil pH tends to boost its active contents of iron and aluminum, simultaneously influencing the surface charges of minerals and modulating the acidic groups of organic carbon. This fosters an enhanced interaction between minerals and organic carbon [46]. This relationship echoes the findings of Moore et al., who indicated that soil acidification increased in the OCFe-Al intensities of soil to some extent, thereby augmenting the stability of soil organic carbon [47].
Persistent organic carbon plays a crucial part in soil carbon sequestration in soil on account of its high stability. Previous studies have established that soil pH decrease can serve as a catalyst for the accumulation of this type of carbon, thereby enhancing the soil’s overall carbon sequestration capacity [48]. A decline in soil pH hinders the decomposition of recalcitrant carbon pools [49], which might be attributed to the weakened protection of aggregates and the increased access of microorganisms to organic carbon [50]. Moreover, the increase in Al3+ ions resulting from soil pH decrease gives rise to the formation of organic–inorganic complexes that adhere to soil aggregates, thereby restraining the microbial degradation of recalcitrant organic carbon substrates [51,52]. In line with the results of this study, the phenomenon of soil pH decline increases in the levels of mineral-bound stable carbon and organic substances that are difficult to decompose, making them crucial components in carbon sequestration in soil.

4.3. Complexity of Chemical Structure of Soil Organic Carbon

Variations in the stability of soil aggregate clusters are significantly influenced by the molecular structure of SOC. Alkyl carbon and aromatic carbon are typical of recalcitrant carbon structures that can resist microbial consumption, which implies that they are the stable portions of organic carbon that are resistant to decomposition [53]. In contrast, O-alkyl carbon and carbonyl carbon represent the labile forms of organic carbon, being prone to rapid breakdown within microbial metabolic processes [54]. In this study, SOC was primarily composed of O-alkyl carbon and aromatic carbon. With escalating soil acidity, the proportions of O-alkyl carbon and carbonyl carbons decreased, along with an uptick in the persistent aromatic carbon fraction. This indicates that soil acidification results in the buildup of recalcitrant organic carbon. A previous study suggested that, unlike aromatic carbon fractions, soil’s oxyalkyl and dioxyalkyl carbon contents have a positive association with the aggregational stability over medium to long durations. Enhancements in aggregate fortification can result from reduced hydrophobic interactions or direct binding to soil clusters [55]. Furthermore, investigations conducted by Spaccini et al. have indicated that the degradation of soil’s physical integrity is associated with the gradual weakening of alkyl carbon binding [56]. Meanwhile, the decreases in the quantities of macroaggregates and alkyl carbon, coupled with a significant increase in the levels of aromatic carbon, confirm the decline in the aggregate stability of soil. Consequently, the reduction in the protection of aggregates under soil acidification can be partly attributed to alterations in the soil’s chemical structure. The deterioration of soil’s aggregate structure diminishes physical protection, heightening the vulnerability of sequestered organic carbon. In the present analysis, a decrease in soil pH led to an increase in mineral-associated carbon. Evidence from grassland ecosystems demonstrated that nitrogen supplementation mitigated the decomposition of recalcitrant carbon repositories, potentially due to impeded aggregate protection and heightened spatial exposure of organic carbon to soil microbes, paralleling the findings of this investigation [57,58].

4.4. The Impact of Soil Acidification on Soil Microbial Community Structure and Enzyme Activity

Changes in microbial community structure and function in soil are directly related to changes in the soil environment and extremely sensitive to the response of soil environmental factors, which may be caused by small changes in this environment. In this study, pH played an important role in the reconstruction of microbial communities. Under the decline in soil pH, the significant increase in Proteobacteria abundance and the decrease in acidobacteria abundance reflect the transformation from pH-mediated to copiotrophic advantage. This shift may be due to the intensification of resource competition and niche filtration. A lower pH value selectively enriched fast-growing and nutrient-demanding groups (Proteobacteria and actinomycetes), rather than the slow-growing Oligotrophic Bacteria (acidobacteria) [59]. While the Chao1 index decreased, the Shannon index showed no significant change. This pattern indicates that soil pH declines disproportionately reduced rare taxa, whereas dominant species remained largely unaffected. Cui et al. showed that this phenomenon may be related to the interruption of micronutrient availability (e.g., Al3+ toxicity) [60]. With a decline in soil pH, the change in fungal community showed a nonlinear trend. Ascomycota and Mortierellomycota reached their peaks at moderate acidification levels and then decreased under extreme acidification. This hump pattern means that fungal communities have adaptive tolerance thresholds. The advantage of Ascomycota may be due to the improved efficiency of lignocellulose-decomposing enzymes (such as laccase) at a pH of 4.5–5.5 [61]. However, Mortierellomycota’s saprophytic plasticity is conducive to survival under pH fluctuations [62]. Overall, the decline in soil pH significantly reduced the diversity of the soil’s microbial community and promoted its transformation to a copiotrophic type. This change trend accelerated the decomposition of active organic carbon and turned it into stable organic carbon, which was difficult to decompose; this was consistent with the results of this study.
The research findings by Zhang et al. indicate that prolonged use of chemical nitrogen fertilizers is the primary factor leading to soil structure degradation and reductions in the soil’s organic carbon levels [63]. The stability of soil organic carbon plays a crucial role in determining its sequestration. Hence, this investigation examined alterations in the stabilization mechanism of black soil organic carbon (SOC) due to nitrogen-induced soil acidification, employing a “physical–chemical–biological” multi-mechanism approach in conjunction with a partial least squares path model (PLS-PM). The study revealed that, with a decrease in pH level (from 6.54 to 5.32), the stabilization mechanism of SOC shifts from a physical–biological synergistic pathway to a chemical stabilization pathway. This finding corroborates and deepens recent observations across multiple global ecosystems. An integrated analysis of 304 global observation sites indicates that, while nitrogen addition can increase in the total amount of soil organic carbon, it primarily promotes the unstable particulate organic carbon pool. This may, in fact, lead to a decrease in the overall stability of the carbon pool, which is highly consistent with the phenomenon of weakened physical protection during the initial stages of acidification that is described in this paper [64]. Secondly, the chemical protection mechanism of active metal ions significantly influences carbon stability. This observation aligns with findings from long-term acid rain studies conducted in South China, which suggest that acidification activates the organic–mineral complexation of iron and aluminum oxides, thereby enhancing deep carbon sequestration [65]. Furthermore, the “enzyme activity trade-off effect” resulting from nitrogen addition—characterized by an increase in hydrolase activity alongside a suppression of oxidase activity—emerges in the pathway model of this study as a crucial intermediary effect of enzyme activity’s impact on the conversion of carbon components. This provides a mechanistic framework for understanding the transformation of microbial metabolic pathways under conditions of acidification.

5. Conclusions

Changes in soil aggregates, mineral-bound SOC, recalcitrant SOC, and functional groups of SOCs were systematically analyzed under soil pH decline, and the predominant stabilization processes of organic carbon under varying levels of acidification in black soil were explored. The empirical data revealed that soil pH decline prompts a shift from larger to smaller particle size aggregates, subsequently augmenting the pool of protected and less labile SOC. This transition means reduced physical protection of organic carbon. In addition, soil pH decline increased in the proportions of recalcitrant and mineral-bound SOC, which suggested an increase in the biochemical intricacy of the chemical structure of organic carbon and an enhancement of its chemical robustness. Soil pH decrease significantly reduces the diversity of microbial communities in soil and promotes a shift toward copiotrophic microbial groups. A low-pH environment favors the dominance of copiotrophic microorganisms (e.g., Proteobacteria), a trend that accelerates the decomposition of labile organic carbon and its transformation into recalcitrant, stabilized organic carbon. Meanwhile, certain acid-tolerant microorganisms enhance the chemical stability of persistent carbon through interactions with iron and aluminum oxides. Overall, soil pH decline has led to a decrease in soil aggregation structure and an increase in its aromaticity, driving the transfer of soil organic carbon stabilization mechanisms from physical protection to chemical stability in the black soil ecosystem of croplands in Northeast China.

Supplementary Materials

The following supporting information can be downloaded at: https://www.mdpi.com/article/10.3390/agronomy16020268/s1, Table S1: Changes in soil pH from 2008 to 2021.

Author Contributions

Y.C.: conceptualization, methodology, investigation, writing—original draft, visualization, data curation. Q.L.: writing—review and editing, software, validation, formal analysis, data curation. H.C.: investigation, validation, software, formal analysis, visualization, writing—review and editing, methodology. Y.L.: methodology, investigation. S.L.: writing—original draft, visualization, data curation, funding acquisition. C.W.: writing—review and editing, software, methodology, validation. R.J.: writing—review and editing. W.H.: writing—review and editing, data curation, funding acquisition. All authors have read and agreed to the published version of the manuscript.

Funding

This work supported by the National Key Research and Development Program of China (2023YFD2300403), the Jilin Provincial Natural Science Foundation of China (20210101100JC), the research program of Beijing Academy of Agriculture and Forestry Sciences (ZHS202302), and China Agriculture Research System of MOF and MARA.

Data Availability Statement

The data presented in this study are available on request from the corresponding author.

Conflicts of Interest

The authors declare no conflicts of interest.

References

  1. Ayari, M.; Charef, A.; Azouzi, R.; Trifi, M.; Khiari, N. Impact of Induced Natural Organic Carbons on Soil Organic Carbon (SOC), Permeability and Production of Sandy and Clay Soils in Mediterranean Semi-Arid Eco-System. Commun. Soil Sci. Plant Anal. 2023, 54, 1923–1938. [Google Scholar] [CrossRef]
  2. Anthony, M.A.; Crowther, T.W.; Maynard, D.S.; Hoogen, J.V.D.; Averill, C. Distinct Assembly Processes and Microbial Communities Constrain Soil Organic Carbon Formation. One Earth 2022, 2, 349–360. [Google Scholar]
  3. Xu, R.K.; Li, J.Y.; Zhou, S.W.; Xu, M.G.; Shen, R.F. Scientific issues and technical measures for the regulation of soil acidification in farmland in China. Proc. Chin. Acad. Sci. 2018, 33, 160–167. (In Chinese) [Google Scholar]
  4. Raza, S.; Miao, N.; Wang, P.; Ju, X.; Chen, Z.; Zhou, J.; Kuzyakov, Y. Dramatic loss of inorganic carbon by nitrogen-induced soil acidification in Chinese croplands. Glob. Change Biol. 2020, 26, 3738–3751. [Google Scholar] [CrossRef]
  5. Duan, Y.; Zhang, J.; Petropoulos, E. Soil Acidification Destabilizes Terrestrial Ecosystems via Decoupling Soil Microbiome. Glob. Change Biol. 2025, 31, 4. [Google Scholar] [CrossRef]
  6. Wu, Z.; Sun, X.; Sun, Y.J.; Yan, Y.; Zhao, J. Soil acidification and factors controlling topsoil pH shift of cropland in central China from 2008 to 2018. Geoderma 2022, 408, 115586. [Google Scholar] [CrossRef]
  7. Wei, H.; Li, H.; Wang, Q. Soil acidification alters C:N:P stoichiometry in the soil due to higher acid sensitivity of phosphorus. Environ. Sci. Process. Impacts 2025, 27, 7. [Google Scholar]
  8. Almagro, M.; Ruiz-Navarro, A.; Díaz-Pereira, E.; Albaladejo, J.; Martinez-Mena, M. Plant residue chemical quality modulates the soil microbial response related to decomposition and soil organic carbon and nitrogen stabilization in a rainfed Mediterranean agroecosystem. Soil Biol. Biochem. 2021, 156, 108198. [Google Scholar] [CrossRef]
  9. Huang, B.; Yan, G.; Liu, G.; Sun, X.; Wang, X.; Xing, Y.; Wang, Q. Effects of long-term nitrogen addition and precipitation reduction on glomalin-related soil protein and soil aggregate stability in a temperate forest. Catena 2022, 214, 106284. [Google Scholar] [CrossRef]
  10. Yu, M.; Wang, Y.P.; Deng, Q. Soil acidification enhanced soil carbon sequestration through increased mineral protection. Plant Soil 2024, 503, 2. [Google Scholar] [CrossRef]
  11. Raza, S.; Zamanian, K.; Ullah, S.; Kuzyakov, Y.; Virto, I.; Zhou, J.B. Inorganic carbon losses by soil acidification jeopardize global efforts on carbon sequestration and climate change mitigation. J. Clean. Prod. 2021, 315, 128036. [Google Scholar] [CrossRef]
  12. Zhang, N.; Xing, J.; Wei, L. The potential of biochar to mitigate soil acidification: A global meta-analysis. Biochar 2025, 7, 49. [Google Scholar] [CrossRef]
  13. Cui, H.; Ou, Y.; Wang, L.; Liang, A.; Yan, B.; Li, Y. Dynamic changes in microbial communities and nutrient stoichiometry associated with soil aggregate structure in restored wetlands. Catena 2021, 197, 104984. [Google Scholar] [CrossRef]
  14. Ding, W.T.; Fang, J.J.; Wu, X.P.; Zhang, J.Z.; Zhang, J.M.; Zhang, J.Z.; Liu, Y.D.; Song, X.J.; Li, J.Y.; Zheng, F.J. The effects of different ratios of organic fertilizer replacing chemical fertilizer on the microbiological properties of black soil and spring wheat yield and quality. Chin. Soil Fertil. 2021, 2, 9. (In Chinese) [Google Scholar]
  15. Huo, Y.; Hu, G.; Han, X.; Zhuge, Y. Straw-returning reduces the contribution of microbial anabolism to salt-affected soil organic carbon accumulation over a salinity gradient. Soil Ecol. Lett. 2023, 5, 220168. [Google Scholar] [CrossRef]
  16. Bai, T.; He, S.; Li, Y. Unexpected suppressive fungal diversity and stimulative soil carbon loss under soil acidification in an alkaline grassland. Funct. Ecol. 2025, 39, 114–127. [Google Scholar] [CrossRef]
  17. Angst, G.; Mueller, K.E.; Nierop, K.G.J.; Simpson, M.J. Plant- or microbial-derived? A review on the molecular composition of stabilized soil organic matter. Soil Biol. Biochem. 2021, 156, 108189. [Google Scholar] [CrossRef]
  18. Liu, B.; Xia, H.; Jiang, C.; Riaz, M.; Yang, L.; Chen, Y.; Fan, X.; Xia, X. 14-year applications of chemical fertilizers and crop straw effects on soil labile organic carbon fractions, enzyme activities and microbial community in rice-wheat rotation of middle China. Sci. Total Environ. 2022, 841, 156608. [Google Scholar] [CrossRef]
  19. Mackiewicz-Walec, E.; Krzebietke, S.J.; Sienkiewicz, S. The Influence of Crops on the Content of Polycyclic Aromatic Hydrocarbons in Soil Fertilized with Manure and Mineral Fertilizers. Int. J. Environ. Res. Public Health 2022, 19, 13627. [Google Scholar] [CrossRef]
  20. Zhu, X.; Mao, L.; Chen, B. Driving forces linking microbial community structure and functions to enhanced carbon stability in biochar-amended soil. Environ. Int. 2019, 133, 105211. [Google Scholar] [CrossRef]
  21. Gao, X.; Berhe, A.A.; Hu, Y.; Du, L.; Hou, F.; Guo, S.; Wang, R. Role of soil organic matter composition and microbial communities on SOC stability: Insights from particle-size aggregates. J. Soils Sediments 2023, 23, 2878–2891. [Google Scholar] [CrossRef]
  22. Cheng, J.; Yang, C.Z.; Zhang, L. The competitive effects of crop straw return and nitrogen fertilization on soil acidification. Agric. Ecosyst. Environ. 2025, 388, 109638. [Google Scholar] [CrossRef]
  23. Cambardella, C.A.; Elliott, E.T. Carbon and Nitrogen Distribution in Aggregates from Cultivated and Native Grassland Soils. Soil Sci. Soc. Am. J. 1993, 57, 1071–1076. [Google Scholar] [CrossRef]
  24. Bharali, A.; Baruah, K.K.; Bhattacharyya, P. Integrated nutrient management in wheat grown in a northeast India soil: Impacts on soil organic carbon fractions in relation to grain yield. Soil Tillage Res. 2017, 168, 81–91. [Google Scholar] [CrossRef]
  25. Rovira, P.; Vallejo, V.R. Labile and recalcitrant pools of carbon and nitrogen in organic matter decomposing at different depths in soil: An acid hydrolysis approach. Geoderma 2002, 107, 109–141. [Google Scholar] [CrossRef]
  26. Kramer, M.G.; Chadwick, O.A. Climate-driven thresholds in reactive mineral retention of soil carbon at the global scale. Nat. Clim. Change 2018, 8, 1104–1108. [Google Scholar] [CrossRef]
  27. Tang, L.; Zhang, W.; Hu, P. Temperature effects on soil mineral-protected organic carbon are regulated by lithology in humid subtropical forests. Catena 2025, 250, 108772. [Google Scholar] [CrossRef]
  28. Schmidt, M.W.I.; Knicker, H.; Hatcher, P.G.; Kogel-Knabner, I. Improvement of 13C and 15N CPMAS NMR spectra of bulk soils, particle size fractions and organic material by treatment with 10% hydrofluoric acid. Eur. J. Soil Sci. 1997, 48, 319–328. [Google Scholar] [CrossRef]
  29. Xiong, L.; Shao, C.H.; Zhang, W.X.; Drosos, M.; Zhou, X.H.; Liu, S.X.; Liu, Z.B.; Sun, G.; Wang, S.X. Effects of regenerated rice cultivation on soil fertility and chemical structure of organic carbon. J. Ecol. 2023, 42, 7. (In Chinese) [Google Scholar]
  30. Ndung’u, M.; Ngatia, L.W.; Onwonga, R.N.; Mucheru-Muna, M.W.; Moriasi, D.N. The influence of organic and inorganic nutrient inputs on soil organic carbon functional groups content and maize yields. Heliyon 2021, 7, 7881. [Google Scholar] [CrossRef]
  31. Zhang, J.; Wei, Y.; Liu, J.; Yuan, J.; Liang, Y.; Ren, J. Effects of maize straw and its biochar application on organic and humic carbon in water-stable aggregates of a Mollisol in Northeast China: A five-year field experiment. Soil Tillage Res. 2019, 190, 1–9. [Google Scholar] [CrossRef]
  32. Guan, S.Y. Study on factors affecting soil enzyme activity—Effects of organic fertilizers on enzyme activities and nitrogen and phosphorus transformation in soil. Acta Pedol. Sin. 1989, 26, 72–78. [Google Scholar]
  33. Li, Y.; Zhang, J.; Chang, S.X.; Jiang, P.; Zhou, G.; Shen, Z.; Wu, J.; Lin, L.; Wang, Z.; Shen, M. Converting native shrub forests to Chinese chestnut plantations and subsequent intensive management affected soil C and N pools. For. Ecol. Manag. 2014, 312, 161–169. [Google Scholar] [CrossRef]
  34. Chen, M.; Zhang, S.; Liu, L.; Liu, J.; Ding, X. Organic fertilization increased soil organic carbon stability and sequestration by improving aggregate stability and iron oxide transformation in saline-alkaline soil. Plant Soil 2022, 474, 233–249. [Google Scholar] [CrossRef]
  35. Xu, H.; Qu, Q.; Chen, Y.; Liu, G.; Xue, S. Responses of soil enzyme activity and soil organic carbon stability over time after cropland abandonment in different vegetation zones of the Loess Plateau of China. Catena 2021, 196, 104812. [Google Scholar] [CrossRef]
  36. Fujii, K.; Zheng, J.; Zhou, Z. Quantitative assessment of soil acidification in four Chinese forests affected by nitrogen deposition. Plant Soil 2024, 504, 219–233. [Google Scholar] [CrossRef]
  37. Shen, D.; Ye, C.; Hu, Z.; Chen, X.; Guo, H.; Li, J.; Du, G.; Adl, S.; Liu, M. Increased chemical stability but decreased physical protection of soil organic carbon in response to nutrient amendment in a Tibetan alpine meadow. Soil Biol. Biochem. 2018, 126, 11–21. [Google Scholar] [CrossRef]
  38. Bai, T.; Wang, P.; Ye, C.; Hu, S. Form of nitrogen input dominates N effects on root growth and soil aggregation: A meta-analysis. Soil Biol. Biochem. 2021, 157, 108251. [Google Scholar] [CrossRef]
  39. Shen, Y.; Tian, D.; Hou, J.; Wang, J.; Zhang, R.; Li, Z.; Chen, X.; Wei, X.; Zhang, X.; He, Y.; et al. Forest soil acidification consistently reduces litter decomposition irrespective of nutrient availability and litter type. Funct. Ecol. 2021, 35, 2753–2762. [Google Scholar] [CrossRef]
  40. Fan, R.Q.; Liang, A.Z.; Yang, X.M.; Zhang, X.P.; Shen, Y.; Shi, X.H. Influence of tillage on the content and characteristics of black soil agglomerates. Chin. Agric. Sci. 2010, 43, 3767–3775. (In Chinese) [Google Scholar]
  41. Ding, Y.; Yang, J.L.; Zhao, X.R.; Yang, S.H.; Mulder, J.; Dorsch, P.; Peng, X.H.; Zhang, G.L. Soil acidification and loss of base cations in a subtropical agricultural watershed. Sci. Total Environ. 2022, 827, 154338. [Google Scholar] [CrossRef]
  42. Han, S.; Delgado-Baquerizo, M.; Luo, X.; Liu, Y.; Nostrand, J.D.; Chen, W.; Zhou, J.; Huang, Q. Soil aggregate size-dependent relationships between microbial functional diversity and multifunctionality. Soil Biol. Biochem. 2021, 154, 108143. [Google Scholar] [CrossRef]
  43. Chen, Z.; Liu, F.; Cai, G.; Peng, X.; Wang, X. Responses of Soil Carbon Pools and Carbon Management Index to Nitrogen Substitution Treatments in a Sweet Maize Farmland in South China. Plants 2022, 11, 2194. [Google Scholar] [CrossRef]
  44. Chasse, A.W.; Ohno, T.; Higgins, S.R.; Amirbahman, A.; Yildirim, N.; Parr, T.B. Chemical force spectroscopy evidence supporting the layer-by-layer model of organic matter binding to iron (oxy) hydroxide mineral surfaces. Environ. Sci. Technol. 2015, 49, 9733–9741. [Google Scholar] [CrossRef] [PubMed]
  45. Lin, Z.; Huang, Z.; Liao, D.; Huang, W.; Huang, J.; Deng, Y. Effects of soil organic matter components and iron aluminum oxides on aggregate stability during vegetation succession in granite red soil eroded areas. J. Mt. Sci. 2022, 19, 2634–2650. [Google Scholar] [CrossRef]
  46. Saidy, A.R.; Smernik, R.J.; Baldock, J.A.; Kaiser, K.; Sanderman, J. The sorption of organic carbon onto differing clay minerals in the presence and absence of hydrous iron oxidel. Geoderma 2013, 209, 15–21. [Google Scholar] [CrossRef]
  47. Moore, T.R.; Turunen, J. Carbon accumulation and storage in mineral subsoil beneath peat. Soil Sci. Soc. Am. J. 2004, 68, 170–177. [Google Scholar] [CrossRef]
  48. Ndzelu, B.S.; Dou, S.; Zhang, X.; Zhang, Y.; Ma, R.; Liu, X. Tillage effects on humus composition and humic acid structural characteristics in soil aggregate-size fractions. Soil Tillage Res. 2021, 213, 105090. [Google Scholar] [CrossRef]
  49. Riggs, C.E.; Hobbie, S.E.; Bach, E.M.; Hofmockel, K.S.; Kazanski, C.E. Nitrogen addition changes grassland soil organic matter decomposition. Biogeochemistry 2015, 125, 203–219. [Google Scholar] [CrossRef]
  50. Jastrow, J.D. Soil aggregate formation and the accrual of particulate and mineral-associated organic matter. Soil Biol. Biochem. 1996, 28, 665–676. [Google Scholar] [CrossRef]
  51. Töysä, T. Associations of Humus Content and pH of Mineral Soils with Silicate Weathering Factors and Carbon Capture. Biomed. J. Sci. Tech. Res. 2021, 35, 27359–27371. [Google Scholar] [CrossRef]
  52. Cai, Z.; Wang, B.; Zhang, L.; Wen, S.; Xu, M.; Misselbrook, T.H.; Carswell, A.M.; Gao, S. Striking a balance between N sources: Mitigating soil acidification and accumulation of phosphorous and heavy metals from manure. Sci. Total Environ. 2021, 754, 142189. [Google Scholar] [CrossRef] [PubMed]
  53. Zheng, S.; Zhang, J.; Chi, F. Response of the chemical structure of soil organic carbon to modes of maize straw return. Sci. Rep. 2021, 11, 6574. [Google Scholar] [CrossRef]
  54. Kögel-Knabner, I. The macromolecular organic composition of plant and microbial residues as inputs to soil organic matter: Fourteen years on. Soil Biol. Biochem. 2017, 105, A3–A8. [Google Scholar] [CrossRef]
  55. Sarker, T.C.; Incerti, G.; Spaccini, R.; Piccolo, A.; Mazzoleni, S.; Bonanomi, G. Linking organic matter chemistry with soil aggregate stability: Insight from 13C NMR spectroscopy. Soil Biol. Biochem. 2018, 117, 175–184. [Google Scholar] [CrossRef]
  56. Spaccini, R.; Mbagwu, J.S.C.; Conte, P.; Piccolo, A. Changes of humic substances characteristics from forested to cultivated soils in Ethiopia. Geoderma 2006, 132, 9–19. [Google Scholar] [CrossRef]
  57. Bicharanloo, B.; Shirvan, M.B.; Cavagnaro, T.R.; Keitel, C.; Dijkstra, F.A. Nitrogen addition and defoliation alter belowground carbon allocation with consequences for plant nitrogen uptake and soil organic carbon decomposition. Sci. Total Environ. 2022, 846, 157430. [Google Scholar]
  58. Chen, Z.; Geng, S.; Zhou, X.; Gui, H.; Zhang, L.; Huang, Z.; Wang, M.; Zhang, J.; Han, S. Nitrogen addition decreases soil aggregation but enhances soil organic carbon stability in a temperate forest. Geoderma 2022, 426, 116112. [Google Scholar] [CrossRef]
  59. Wang, Z.; Zhang, B.; Dong, S.Q. Effects of Long-Term Nitrogen Fertilizer Application on the Rhizosphere Microbial Community Structure and Function in Black Soil and Sandy Soil. Sci. Agric. Sin. 2025, 58, 520–536. [Google Scholar]
  60. Cui, S.; Xu, S.; Cao, G. The long-term straw return resulted in significant differences in soil microbial community composition and community assembly processes between wheat and ric. Front. Microbiol. 2025, 16, 1533839. [Google Scholar]
  61. Oram, N.J.; Brennan, F.; Praeg, N. Plant community composition and traits modulate the impacts of drought intensity on soil microbial community composition and function. Soil Biol. Biochem. 2025, 200, 109644. [Google Scholar] [CrossRef]
  62. Li, B.; Zhao, N.; Ran, X. The effect of slow-release phosphate fertilizers from digestates on maize rhizosphere soil microbial community and nutrient cycling: Response and activation mechanism. Appl. Soil Ecol. 2024, 201, 7. [Google Scholar] [CrossRef]
  63. Zhang, X.; Jia, S.; You, C. Nitrogen-induced soil acidification mitigates the negative effects of nitrogen addition on SOC stability. Soil Tillage Res. 2025, 254, 106752. [Google Scholar] [CrossRef]
  64. Chen, X.; Cao, J.; Sinsabaugh, R.L. Soil extracellular enzymes as drivers of soil carbon storage under nitrogen addition. Biol. Rev. 2025, 100, 4. [Google Scholar] [CrossRef] [PubMed]
  65. Zhang, Y.; Wang, R.; Gu, B. Nitrogen Retention Along a Soil Acidification Gradient in a Meadow. Bull. Ecol. Soc. Am. 2025, 106, 2. [Google Scholar] [CrossRef]
Figure 1. Variation in soil aggregate mass fraction at different pH levels. Note: The mass fraction of soil aggregates of different particle sizes showing significant differences under the same treatment is indicated by capital letters, and the mass fraction of soil aggregates of the same particle size showing significant differences under different treatments is indicated by lowercase letters. (p < 0.05). P1: pH—6.54; P2: pH—6.03; P3: pH—5.72; P4: pH—5.44; P5: pH—5.32.
Agronomy 16 00268 g001
Figure 2. Changes of soil organic carbon and its components. (a) changes in soil organic carbon content, (b) easily oxidizable organic carbon content, (c) water-soluble organic carbon content, and (d) microbial biomass and carbon content under soil acidification conditions. Note: Differences in soil organic carbon and its components under different treatments are indicated by lowercase letters (p < 0.05). P1: pH—6.54; P2: pH—6.03; P3: pH—5.72; P4: pH—5.44; P5: pH—5.32.
Agronomy 16 00268 g002
Figure 3. Changes in stable organic carbon content under soil acidification conditions. (a) Changes in calcium-bound organic carbon content. (b) Changes in organic carbon content in an iron-aluminum binding state. (c) Changes in carbon sequestration of active iron-aluminum minerals. (d) Changes in recalcitrant organic carbon content. (e) Changes in active iron ion content. (f) Changes in active aluminum ion content. Note: The differences in the soil’s organic carbon components and active metal ion contents under different treatments are indicated by lowercase letters (p < 0.05). P1: pH—6.54; P2: pH—6.03; P3: pH—5.72; P4: pH—5.44; P5: pH—5.32.
Agronomy 16 00268 g003
Figure 4. Changes in soil enzyme activity under soil acidification conditions. Note: Lowercase letters indicate significant differences in soil enzyme activity under different treatments (p < 0.05). P1: pH—6.54; P2: pH—6.03; P3: pH—5.72; P4: pH—5.44; P5: pH—5.32.
Agronomy 16 00268 g004
Figure 5. (a) Changes in bacterial community composition in soil. (b) Changes fungal community composition in soil under soil acidification conditions. (c) Changes in the soil’s bacterial Chao 1 Index. (d) Changes in the soil’s bacterial Shannon Index. (e) Changes in the soil’s fungal Chao 1 Index. (f) Changes in the soil’s fungal Shannon Index. Note: ★ represents the average value of microbial diversity of each treatment. P1: pH—6.54; P2: pH—6.03; P3: pH—5.72; P4: pH—5.44; P5: pH—5.32.
Agronomy 16 00268 g005
Figure 6. Correlation analysis of soil pH and soil organic carbon stability index under soil acidification. Note: ***, **, and * represent significant correlations at the 0.001, 0.01, and 0.05 levels, respectively. pH, soil’s pH value; TN, total nitrogen in soil; SOC, soil organic carbon; Alkyc C, alkyl carbon; O-alkyl C, oxygen-containing alkyl carbon; Aromatic C, aromatic carbon; Carbonyl C, carboxyl carbon; A/O-A, Alkyc C/O-alkyl C; Alip/Arom, (Alkyc C + O-alkyl C)/Aromatic C; HB/HI, (Alkyc C + Aromatic C)/(O-alkyl C + Carbonyl C); ELT, soil aggregate unstable agglomerate index; PAD, soil aggregate destruction rate; MWD, weight mean diameter; GMD, geometric diameter; Fe, active iron ion; Al, active aluminum ion; OCFe-Al, carbon fixation capacity of active iron aluminum minerals; RDOC, difficult-to-decompose organic carbon; urease, soil urease; phosphatase, soil phosphatase; catalase, soil catalase; invertase, soil invertase.
Agronomy 16 00268 g006
Figure 7. Partial least squares path model (PLS-PM) analysis of organic carbon stability mechanism in soil. Note: The path coefficients (*, **, ***) of key driving factors include soil pH, organic carbon composition, organic carbon chemical structure, and microbial diversity. Model fitting: GOF = 0838. (* p < 0.05, ** p < 0.01, *** p < 0.001). The red arrow indicates a significant positive correlation (p < 0.05), the blue arrow indicates a significant negative correlation (p < 0.05), and the dashed arrow indicates no significant effect (p > 0.05).
Agronomy 16 00268 g007
Table 1. Changes in soil aggregate stability under soil acidification conditions.
TreatmentMWD (mm)GMD (mm)PAD
(%)
ELTR0.25 (%)
P11.83 ± 0.05 a0.82 ± 0.02 a25.99 ± 0.68 c27.42 ± 0.42 c72.58 ± 0.42 a
P21.54 ± 0.04 b0.61 ± 0.01 b35.65 ± 0.92 b36.71 ± 0.88 b63.29 ± 0.88 b
P31.58 ± 0.07 b0.61 ± 0.03 b36.82 ± 1.48 ab38.23 ± 1.12 b61.77 ± 1.12 bc
P41.53 ± 0.07 b0.59 ± 0.02 b37.40 ± 0.89 ab38.73 ± 0.74 b61.27 ± 0.74 c
P51.27 ± 0.06 c0.49 ± 0.02 c38.96 ± 1.67 a40.84 ± 1.71 a59.16 ± 1.71 d
Note: Lowercase letters indicate significant differences in soil aggregate stability index under different treatments (p < 0.05). P1: pH—6.54; P2: pH—6.03; P3: pH—5.72; P4: pH—5.44; P5: pH—5.32.
Table 2. 13C solid-phase NMR spectroscopy to determine the relative proportion of different carbon functional groups.
TreatmentAlkyl C (%)
(0–50 ppm)
O-Alkyl C (%)
(50–110 ppm)
Aromatic C (%)
(110–160 ppm)
Carbonyl C (%)
(160–220 ppm)
P122.30 ± 0.61 a 30.87 ± 0.40 e30.03 ± 0.32 e16.67 ± 0.21 a
P219.57 ± 0.35 b33.17 ± 0.40 d31.60 ± 0.20 d15.60 ± 0.26 b
P317.37 ± 0.38 c33.87 ± 0.47 c33.47 ± 0.25 c15.23 ± 0.15 b
P415.87 ± 0.35 d35.47 ± 0.31 b34.13 ± 0.35 b14.40 ± 0.26 c
P514.00 ± 0.26 e36.27 ± 0.21 a35.67 ± 0.38 a14.03 ± 0.32 c
Note: Lowercase letters indicate significant differences in the proportion of soil organic carbon functional groups under different treatments (p < 0.05). P1: pH—6.54; P2: pH—6.03; P3: pH—5.72; P4: pH—5.44; P5: pH—5.32.
Table 3. Changes in characterization indicators of organic carbon chemical structure under soil acidification conditions.
TreatmentA/O-AAlip/AromHB/HIAromaticity
P10.72 ± 0.01 a1.77 ± 0.05 a1.10 ± 0.01 a36.10 ± 0.66 d
P20.59 ± 0.00 b1.67 ± 0.03 b1.05 ± 0.01 b37.47 ± 0.42 c
P30.51 ± 0.01 c1.53 ± 0.04 c1.04 ± 0.01 b39.51 ± 0.56 b
P40.45 ± 0.01 d1.50 ± 0.01 c1.00 ± 0.02 c39.94 ± 0.22 b
P50.39 ± 0.01 e1.41 ± 0.02 d0.99 ± 0.00 c41.51 ± 0.43 a
Note: Lowercase letters denote significant differences in the indicators characterizing the chemical structure of organic carbon across various treatments (p < 0.05). P1: pH—6.54; P2: pH—6.03; P3: pH—5.72; P4: pH—5.44; P5: pH—5.32.
Disclaimer/Publisher’s Note: The statements, opinions and data contained in all publications are solely those of the individual author(s) and contributor(s) and not of MDPI and/or the editor(s). MDPI and/or the editor(s) disclaim responsibility for any injury to people or property resulting from any ideas, methods, instructions or products referred to in the content.