Article

Aboveground and Belowground Photosynthesized C Allocation and Its Microbial Utilization in Paddy Soil: Effects of Cellulose and Nitrogen Fertilization
1
State Key Laboratory for Quality and Safety of Agro-Products, International Science and Technology Cooperation Base for the Regulation of Soil Biological Functions and One Health of Zhejiang Province, Ningbo University, Ningbo 315211, China
2
College of Smart Agriculture, Xinjiang University, Urumqi 830046, China
3
Ningbo Research Institute of Ecological and Environmental Sciences, Ningbo 315000, China
4
State Key Laboratory for Development and Utilization of Forest Food Resources, College of Environmental and Resource Sciences, Zhejiang A&F University, Hangzhou 311300, China
5
College of Resources & Environment, Hunan Agricultural University, Changsha 410128, China
*
Author to whom correspondence should be addressed.
These authors contributed equally to this work.
Agronomy 2026, 16(18), 1755; https://doi.org/10.3390/agronomy16181755
Submission received: 19 July 2026 / Revised: 20 August 2026 / Accepted: 31 August 2026 / Published: 8 September 2026
(This article belongs to the Special Issue Soil Microbial Functions Affecting Soil Carbon Cycling)

Highlights

  • Cellulose addition (+C) promoted rhizodeposition.
  • Combined C and N fertilization (+CN) decreased the belowground allocation of rhizodeposited C.
  • +C or +N increased the percentages of 13C in the G+ and G− groups.
  • +N and +CN enhanced the incorporation of rhizodeposits into soil macro-aggregates.

Abstract

Cellulose-derived carbon inputs to paddy soils have increased with the widespread adoption of straw return as a sustainable rice cultivation practice. However, the effect of cellulose-derived carbon inputs on photosynthesized C allocation from aboveground to belowground and the utilization of the photosynthesized C by soil microbial groups remain poorly understood. In this study, using continuous 13CO2 labeling, 13C allocated to the above- and belowground C pools was measured to study the effects of cellulose and nitrogen fertilization on photosynthetic dynamics and microbial rhizodeposit utilization. Cellulose, nitrogen, and combined fertilization of cellulose and nitrogen promoted the allocation of photosynthates to the shoots. The combined fertilization of cellulose and nitrogen maximally decreased the allocation of photosynthesized C in the belowground C pools, including roots, soil organic matter, dissolved organic C, microbial biomass C, and phospholipid fatty acids (PLFAs), leading to a dominant microbial community that utilized the rhizodeposit shift by different fertilization practices. Cellulose or nitrogen fertilization increased the percentage of 13C in the Gram-positive (G+) (a15:0, i15:0, and i16:0) and Gram-negative (G−) (17:1ω8c) groups, while the combined fertilization of cellulose and nitrogen stimulated the G+ (a17:0), actinomycetes (10Me16:0 and 10Me18:0), fungi (18:1ω9c), and anaerobes (cy19:0) groups. Moreover, cellulose promoted the incorporation of rhizodeposits into soil macro-aggregates, thereby decreasing the utilization of rhizodeposits by microorganisms (13C-PLFA). The findings of this study suggest that under the prevalent practice of cellulose-derived C and N fertilization inputs, belowground photosynthetic C allocation and microbial utilization may decrease, potentially facilitating the retention of rhizodeposit-derived C in paddy soils.

1. Introduction

Cellulose is an essential component of rice straw, accounting for 29–46% of the dry straw biomass [1]. Rice (Oryza sativa L.) is a major cereal crop cultivated on more than 140 million ha worldwide, producing 741–1111 million tons of rice straw and 274–411 million tons of cellulose annually [2]. Burning rice straw following harvest may induce greenhouse gas (GHG) emissions and environmental damage [3,4,5]. To improve soil quality and achieve a cleaner production system, rice straw retention in paddy fields has become a prevalent practice instead of in situ burning or collecting for livestock sectors and bulking agents [6,7,8]. Thus, a large amount of cellulose is incorporated into paddy soils. The labile components of rice straw are decomposed immediately after being incorporated into the soil; however, the less-labile components, e.g., cellulose, will accumulate in the soil [9,10,11]. Since the rate of straw decomposition is low during the flooded season, about 5–10% of cellulose can be degraded in nature under anaerobic conditions [12]. Moreover, cellulose in paddy soils may activate microbial activity, which influences SOC cycling [13,14,15].
Allocating photosynthetic C in the soil through rhizodeposition is a major source of SOC in paddy ecosystems. Rhizodeposits account for approximately 0.3–0.4 Mg C ha−1 during one rice harvest season [16]. Furthermore, more photosynthesized C is allocated belowground during early growth [17]. In paddy systems, reduced soil oxygen content suppresses oxidizing enzyme activity, which slows the mineralization of native and new exogenous organic C [18,19,20]. Therefore, quantifying the input and allocation of photosynthesized C in rice-soil systems under cellulose amendment is of foremost importance for revealing the contribution of photosynthesized C to SOC in rice paddy systems. Li et al. [21] reported that cellulose addition may improve the N microbial transformation processes, accelerating the rhizodeposits incorporated into soil microbial biomass in ryegrass soil; however, the effect of cellulose on the dynamics and allocation of photosynthesized C in a rice-soil system remains unclear.
Several microbial species are involved in cellulose degradation [22,23,24,25]. For example, the bacterial classes of Xanthomonadales, Sphingobacteriales, Rhizobiales, Caulobacteriales, Burkholderiales, and Acidobacteria subdivision 1 and the fungal genera of Trichocladium, Chaetomium, Dactylaria, and Arthrobotrys are active in the decomposition of cellulose [26]. Some microbial taxa, such as fungi and G− bacteria, stimulated by cellulose, can produce non-targeted hydrolysis of SOM components via cellulolytic enzymes, which may also decompose other SOC components, such as chitin and hemicelluloses [13,27]. Rhizodeposits are more labile than cellulose, especially for rhizodeposition at the early growth stage of plants, as they contain a large proportion of low-molecular-weight amino acids, organic acids, fatty acids, carbohydrates, and phenolics from root border cells, secretions, mucilage, and exudates [28]. This indicates that microorganisms may prefer rhizodeposits to cellulose. However, whether the presence of cellulose affects the utilization of rhizodeposits by microorganisms in anaerobic paddy soils requires further investigation.
Rice straw return and nitrogen (N) fertilization are prevalent practices for sustainable rice cultivation. Soil C availability and N nutritional status can affect the photosynthesized C allocated to the soil [21,29], which implies that rice-photosynthesized C allocation from aboveground to belowground and its utilization by microorganisms may be affected by cellulose and N application. Therefore, the objectives of this study were to (i) quantify the dynamics, allocation, and recovery of photosynthesized C in rice-soil systems under cellulose and N fertilization, as well as (ii) reveal the effects of cellulose and N fertilization on the utilization of photosynthates by different soil microbial communities. We hypothesized that cellulose and N fertilization would individually reduce the allocation of photosynthesized C to belowground components and its microbial utilization in paddy soil and that cellulose and N would interactively regulate these processes.

2. Materials and Methods

2.1. Experimental Design and Sampling

Soil was collected from a paddy field (28°33′04″ N, 113°19′52″ E, 80 m above sea level) located in Changsha, Hunan Province, China. The paddy field (plowed anthrosol) originated from granitic red soil and has been continuously cropped for over 30 years. Plow-layer (0–20 cm) soil was collected and sieved (4 mm) under moist conditions to remove coarse stones and visible plant residues. The air-dried soil contained 2.06% SOC, 0.26% total N, and 0.05% total P and had a pH of 5.56 (1:2.5; soil: water ratio). The soil comprised 24.0% sand, 69.3% silt, and 6.7% clay.
The four fertilization treatments were as follows: (1) prepared soil only (Control); (2) carboxymethyl cellulose (419311, Sigma-Aldrich, with a degree of substitution of 0.7) addition with a dosage of 2000 mg C kg−1 soil (+C); (3) ammonium sulfate addition with a dosage of 100 mg N kg−1 soil (+N); and (4) combined carboxymethyl cellulose and ammonium sulfate addition with a dosage of 2000 mg C kg−1 soil and 100 mg N kg−1 soil, respectively (+CN). The application rates of C and N fertilization were selected based on the actual fertilization practices for the experimental soil. Soils (41% water content, 1.45 kg of dry soil) were mixed with cellulose and/or ammonium sulfate and placed in a PVC pot (17 × 40 cm). All the soils were mixed with 20 mg P kg−1 soil of NaH2PO4 and 80 mg K kg−1 soil of KCl. Four rice seedlings (Oryza sativa L., two-line hybrid rice Zhongzao 39) were planted in each pot. A 2–3 cm layer of deionized water was maintained above the soil for the duration of the experiment. For each treatment and sampling date, three independent pots were used for continuous 13CO2 labeling, and an additional three independent pots were established as unlabeled controls. Thus, a total of 120 experimental pots (4 treatments × 5 sampling dates × 3 replicates × 2 labeling conditions) were used. All labeled pots were transferred to a chamber for continuous labeling, according to the method described by Ge et al. [30]. Specifically, 13CO2 was generated by reacting NaH13CO3 (80 mL, 1 M, and 10 atom% 13C) and HCl (90 mL, 1 M). When the CO2 concentration was <380 µL L−1, CO2 was released into the chamber. At CO2 concentrations > 400 µL L−1, a switch diverted the gas flow to pass CO2 through a NaOH solution to trap the excess CO2. Temperature and humidity were monitored using SNT-96S sensors (Hangzhou Time Domain Electronic Technology Co., Ltd., Hangzhou, China), with one sensor placed inside the chamber and another positioned outside. The chamber temperature was regulated by an air-conditioning system and maintained within 1°C of the ambient temperature recorded in the rice field. Two fans were operated continuously to ensure adequate air circulation throughout the labeled chamber. To minimize potential effects of spatial microenvironmental variation, such as differences in light intensity and temperature gradients, all pots in the labeled chamber were randomly rearranged every 3 days throughout the experiment. Unlabeled controls were placed outside, 10–15 m away from the labeled chamber, with independent air systems and no direct air exchange with the labeled chambers, thereby preventing cross-contamination of 13CO2.
Three rice-growing stages were continuously 13CO2-labeled over 39 d, including the tillering, elongation, and panicle formation stages. During the labeling, soils and plants were sampled to analyze the assimilated 13C on days 1, 5, 10, 25, and 39. Rice stems were cut at the soil surface to separate the shoots and roots. The roots were separated from the soil and washed with deionized water. The shoot and root samples were oven-dried at 60 °C for about 72 h until they reached a constant weight. The plants were cut into 1 cm lengths and ball-milled. Soil samples were collected and mixed to analyze the 13C in soil organic matter (SOM), dissolved organic C (DOC), aggregate fractions, microbial biomass C (MBC), and phospholipid fatty acids (PLFAs). Details of the analytical methods are provided in the Supplementary Information.

2.2. Calculations and Statistical Analysis

2.2.1. 13C in Rice-Soil Systems

The 13C amounts in the MBC, PLFAs, DOC, soil, roots, and shoots were calculated using the following equations [31,32]:
13C = [(13Catomic%) L − (13Catomic%) UL]/100 × TC
where L and UL are the labeled and unlabeled samples, respectively, and TC and 13C are the total C and 13C contents in the different C pools, respectively. 13Catomic% was calculated using the following equation:
13Catomic% = (δ13C/1000 + 1) RVPDB/[(δ13C/1000 + 1) RVPDB + 1] × 100%
where RVPDB is the 13C/12C ratio of the international Vienna Pee Dee Belemnite standard (RVPDB = 0.0111797). Furthermore, δ13C was calculated as follows:
δ13C = (RsRVPDB)/RVPDB × 1000
where Rs is the 13C/12C ratio of the plant and soil samples.

2.2.2. PLFA Taxonomic Assignment

13C-PLFAs were classified as described previously [33,34]. Briefly, a17:0, i17:0, i16:0, a15:0, i15:0, and i14:0 are indicators for Gram-positive bacteria (G+); 10Me17:0, 10Me18:0, and 10Me16:0 are markers for actinomycetes; 16:1ω5c and 17:1ω8c are indicators for arbuscular mycorrhizal fungi (AMF) and Gram-negative bacteria (G−), respectively; 18:1ω9c and 18:2ω6,9c are classified as fungi; and cy17:0 and cy19:0 are classified as anaerobes. The data for all 20 PLFAs (including four other fatty acids at 18:0, 17:0, 16:0, 15:0, and 14:0) were subsequently used for redundancy analysis (RDA), hierarchical clustering analysis, and heat map production. In all cases, the relative percentages of 13C-PLFA biomarkers were used for analysis.

2.2.3. Statistical Analysis

The normal distribution and homogeneity of residuals were assessed using Shapiro–Wilk and Levene’s tests, respectively. Two-way analysis of variance (ANOVA) followed by Tukey’s test was used to determine significant differences (p < 0.05) between treatments on the same labeling day or microbial 13C-PLFAs groups on the same treatment (Tables S1 and S2). No data transformation was applied because the model residuals satisfied the assumptions of normality and homogeneity of variance. The statistical and correlation analyses were performed using SPSS version 19 (IBM Corp., Armonk, NY, USA). Using SigmaPlot version 11 (Systat Software Inc., SAN Jose, CA, USA), figures were created. The RDA map was plotted using Canoco version 5 software (Biometris, Wageningen, The Netherlands). The heat map and hierarchical clustering were generated using R 3.4.0 [35].

3. Results

3.1. Rice Plant Biomass

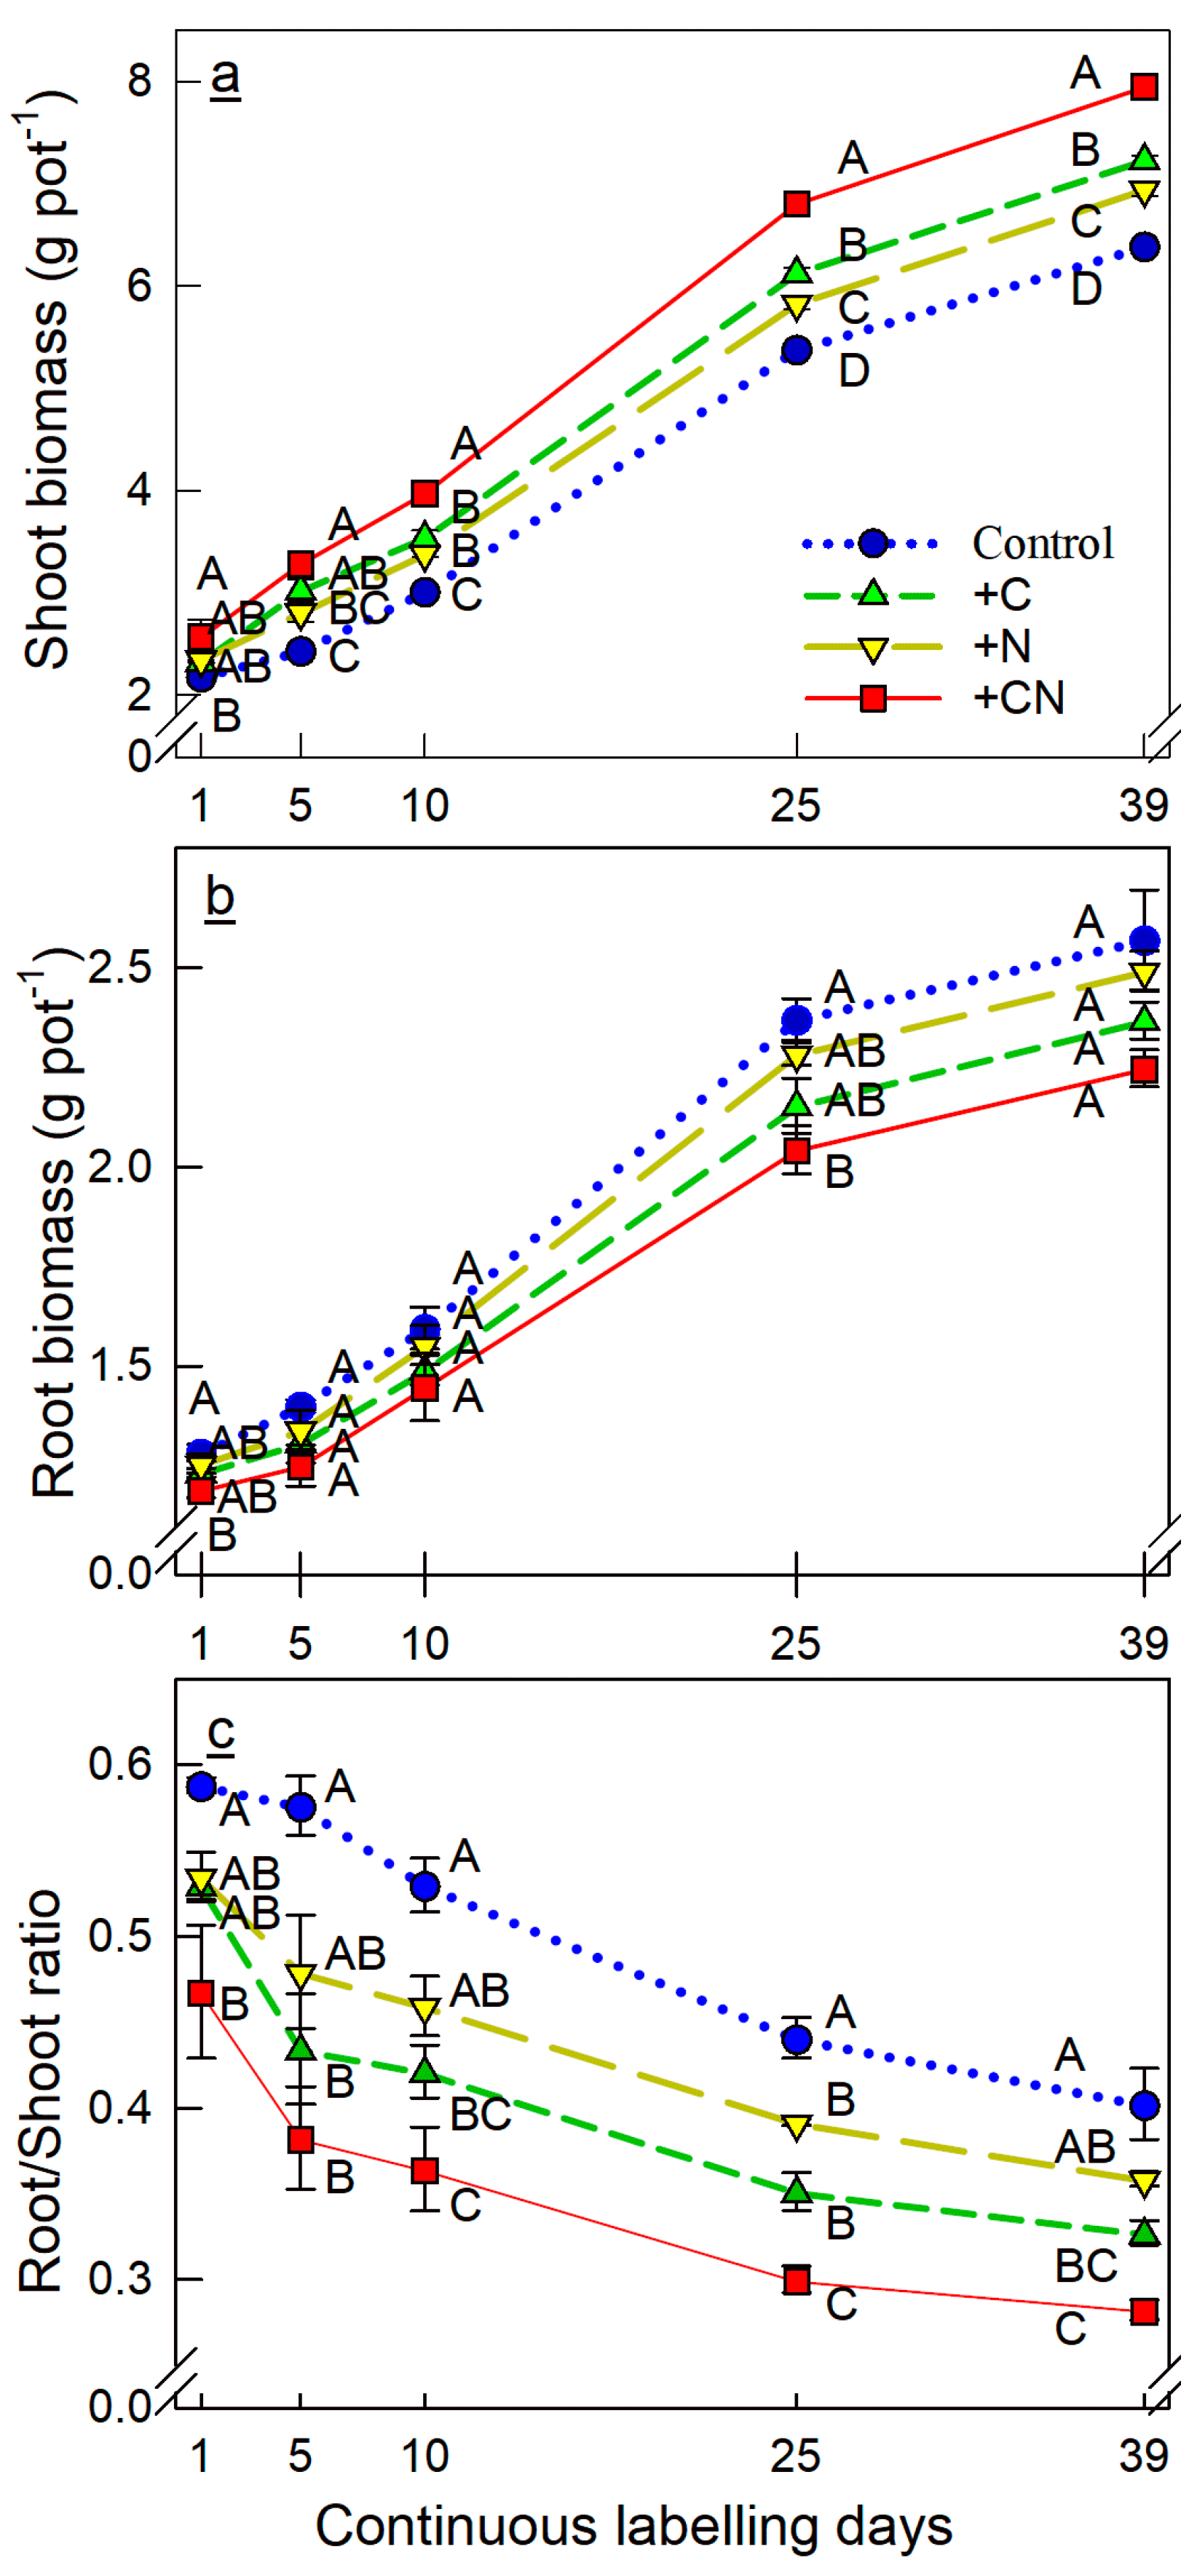
Compared with the unfertilized treatment, the rice shoot biomass significantly increased (2.93–3.11 times) in the fertilized treatments during the 39-day labeling period. This corresponded to a 40–32% reduction in the root-to-shoot ratio (Figure 1). The combined fertilization of cellulose and N led to a maximum increase in shoot biomass compared to a single fertilizer, which resulted in a decrease in the root-to-shoot ratio.

3.2. Dynamic of 13C in Plant–Soil Systems

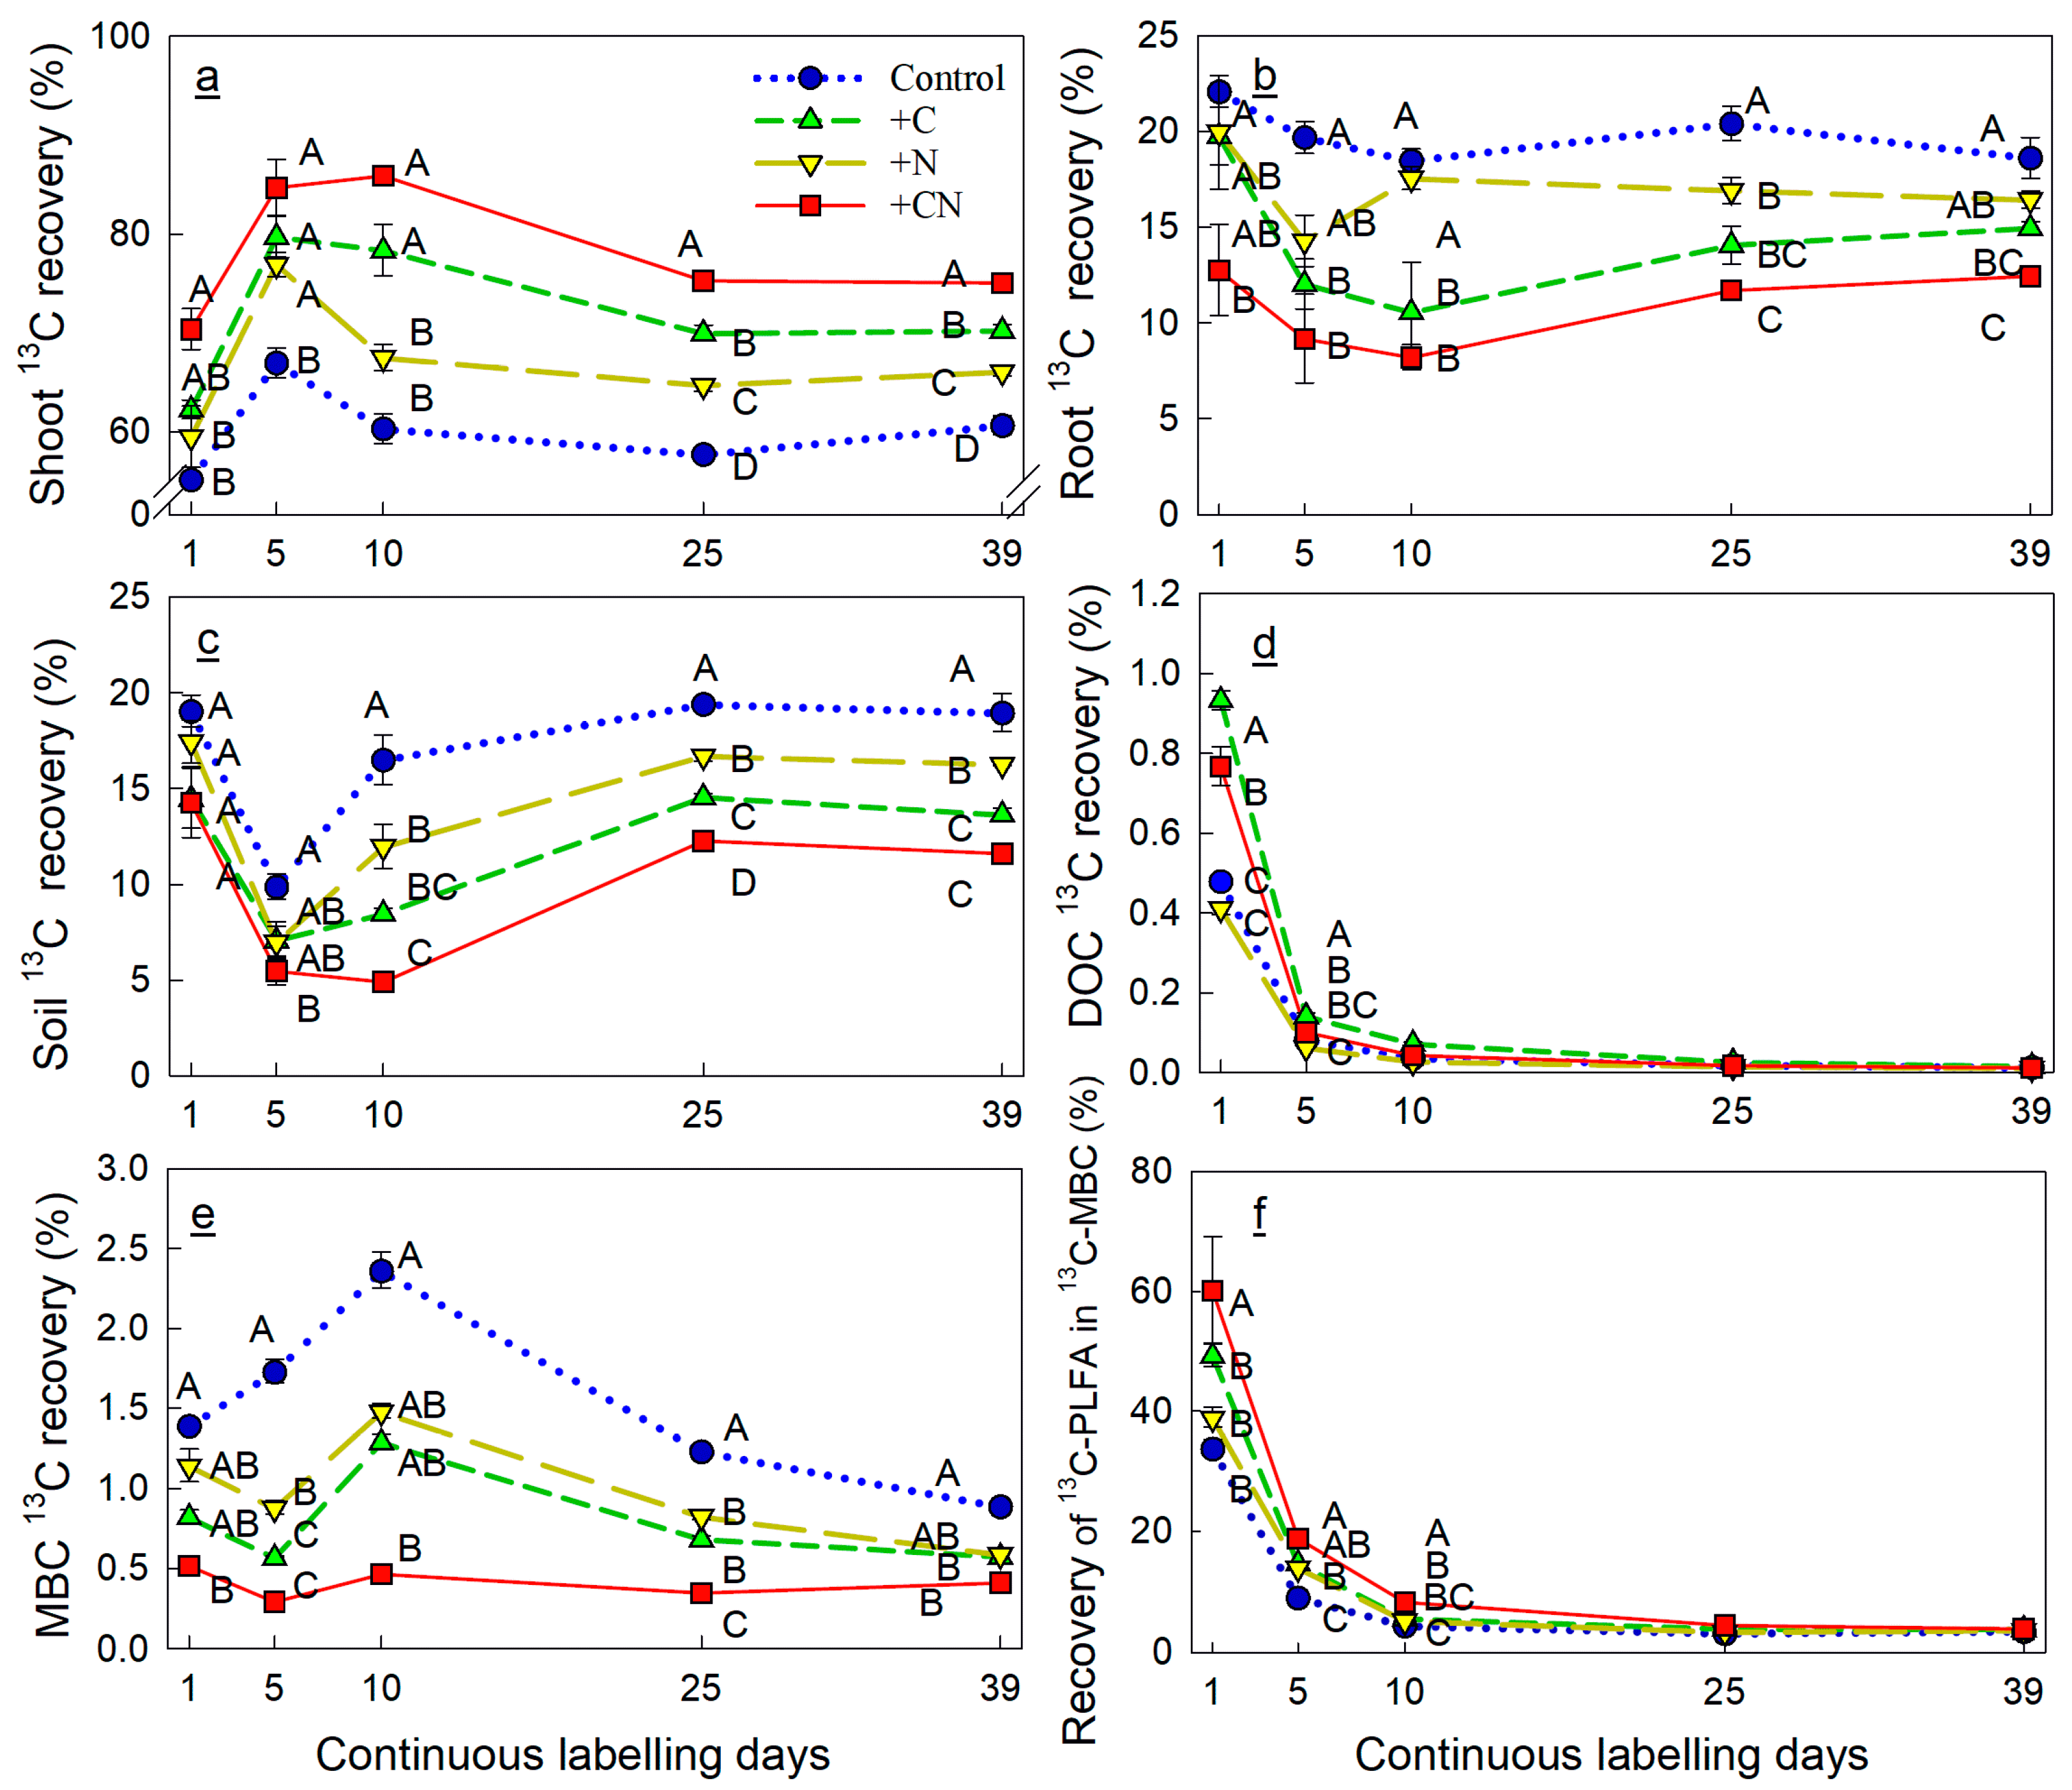
Across the entire labeling period, simultaneous cellulose and N fertilization led to maximum 13C (photo-assimilate) recovery in shoots, with the minimum amount of 13C allocated to the roots, soil, and MBC (Figure 2). The addition of cellulose (both alone and in combination with N) resulted in higher levels of photo-assimilates being incorporated into the DOC compared with the Control and single N fertilization on labeling day 1. During the tillering stage (labeling days 1–10), combined cellulose and N fertilization decreased the total 13C recovered belowground from 29 to 14% (the sum of roots, soil, MBC, and DOC). Maximum 13C MBC recovery was observed on labeling day 10 except for the combined fertilization treatment. Compared to combined fertilization, cellulose or N fertilization alone induced a relatively higher recovery rate of photo-assimilates (13C) in belowground C pools (roots, SOM, and MBC).
The recovery of 13C-PLFA from 13C-MBC decreased in all treatments from labeling days 1 to 10 (Figure 2f). Combined fertilization with cellulose and N led to maximum 13C recovery in the PLFAs compared with the single fertilizer. Both fertilized and unfertilized soils showed similar 13C recovery (4%) in the PLFAs after the 39-day labeling.

3.3. Percentages of C and 13C in Micro-, Meso-, and Macro-Aggregates

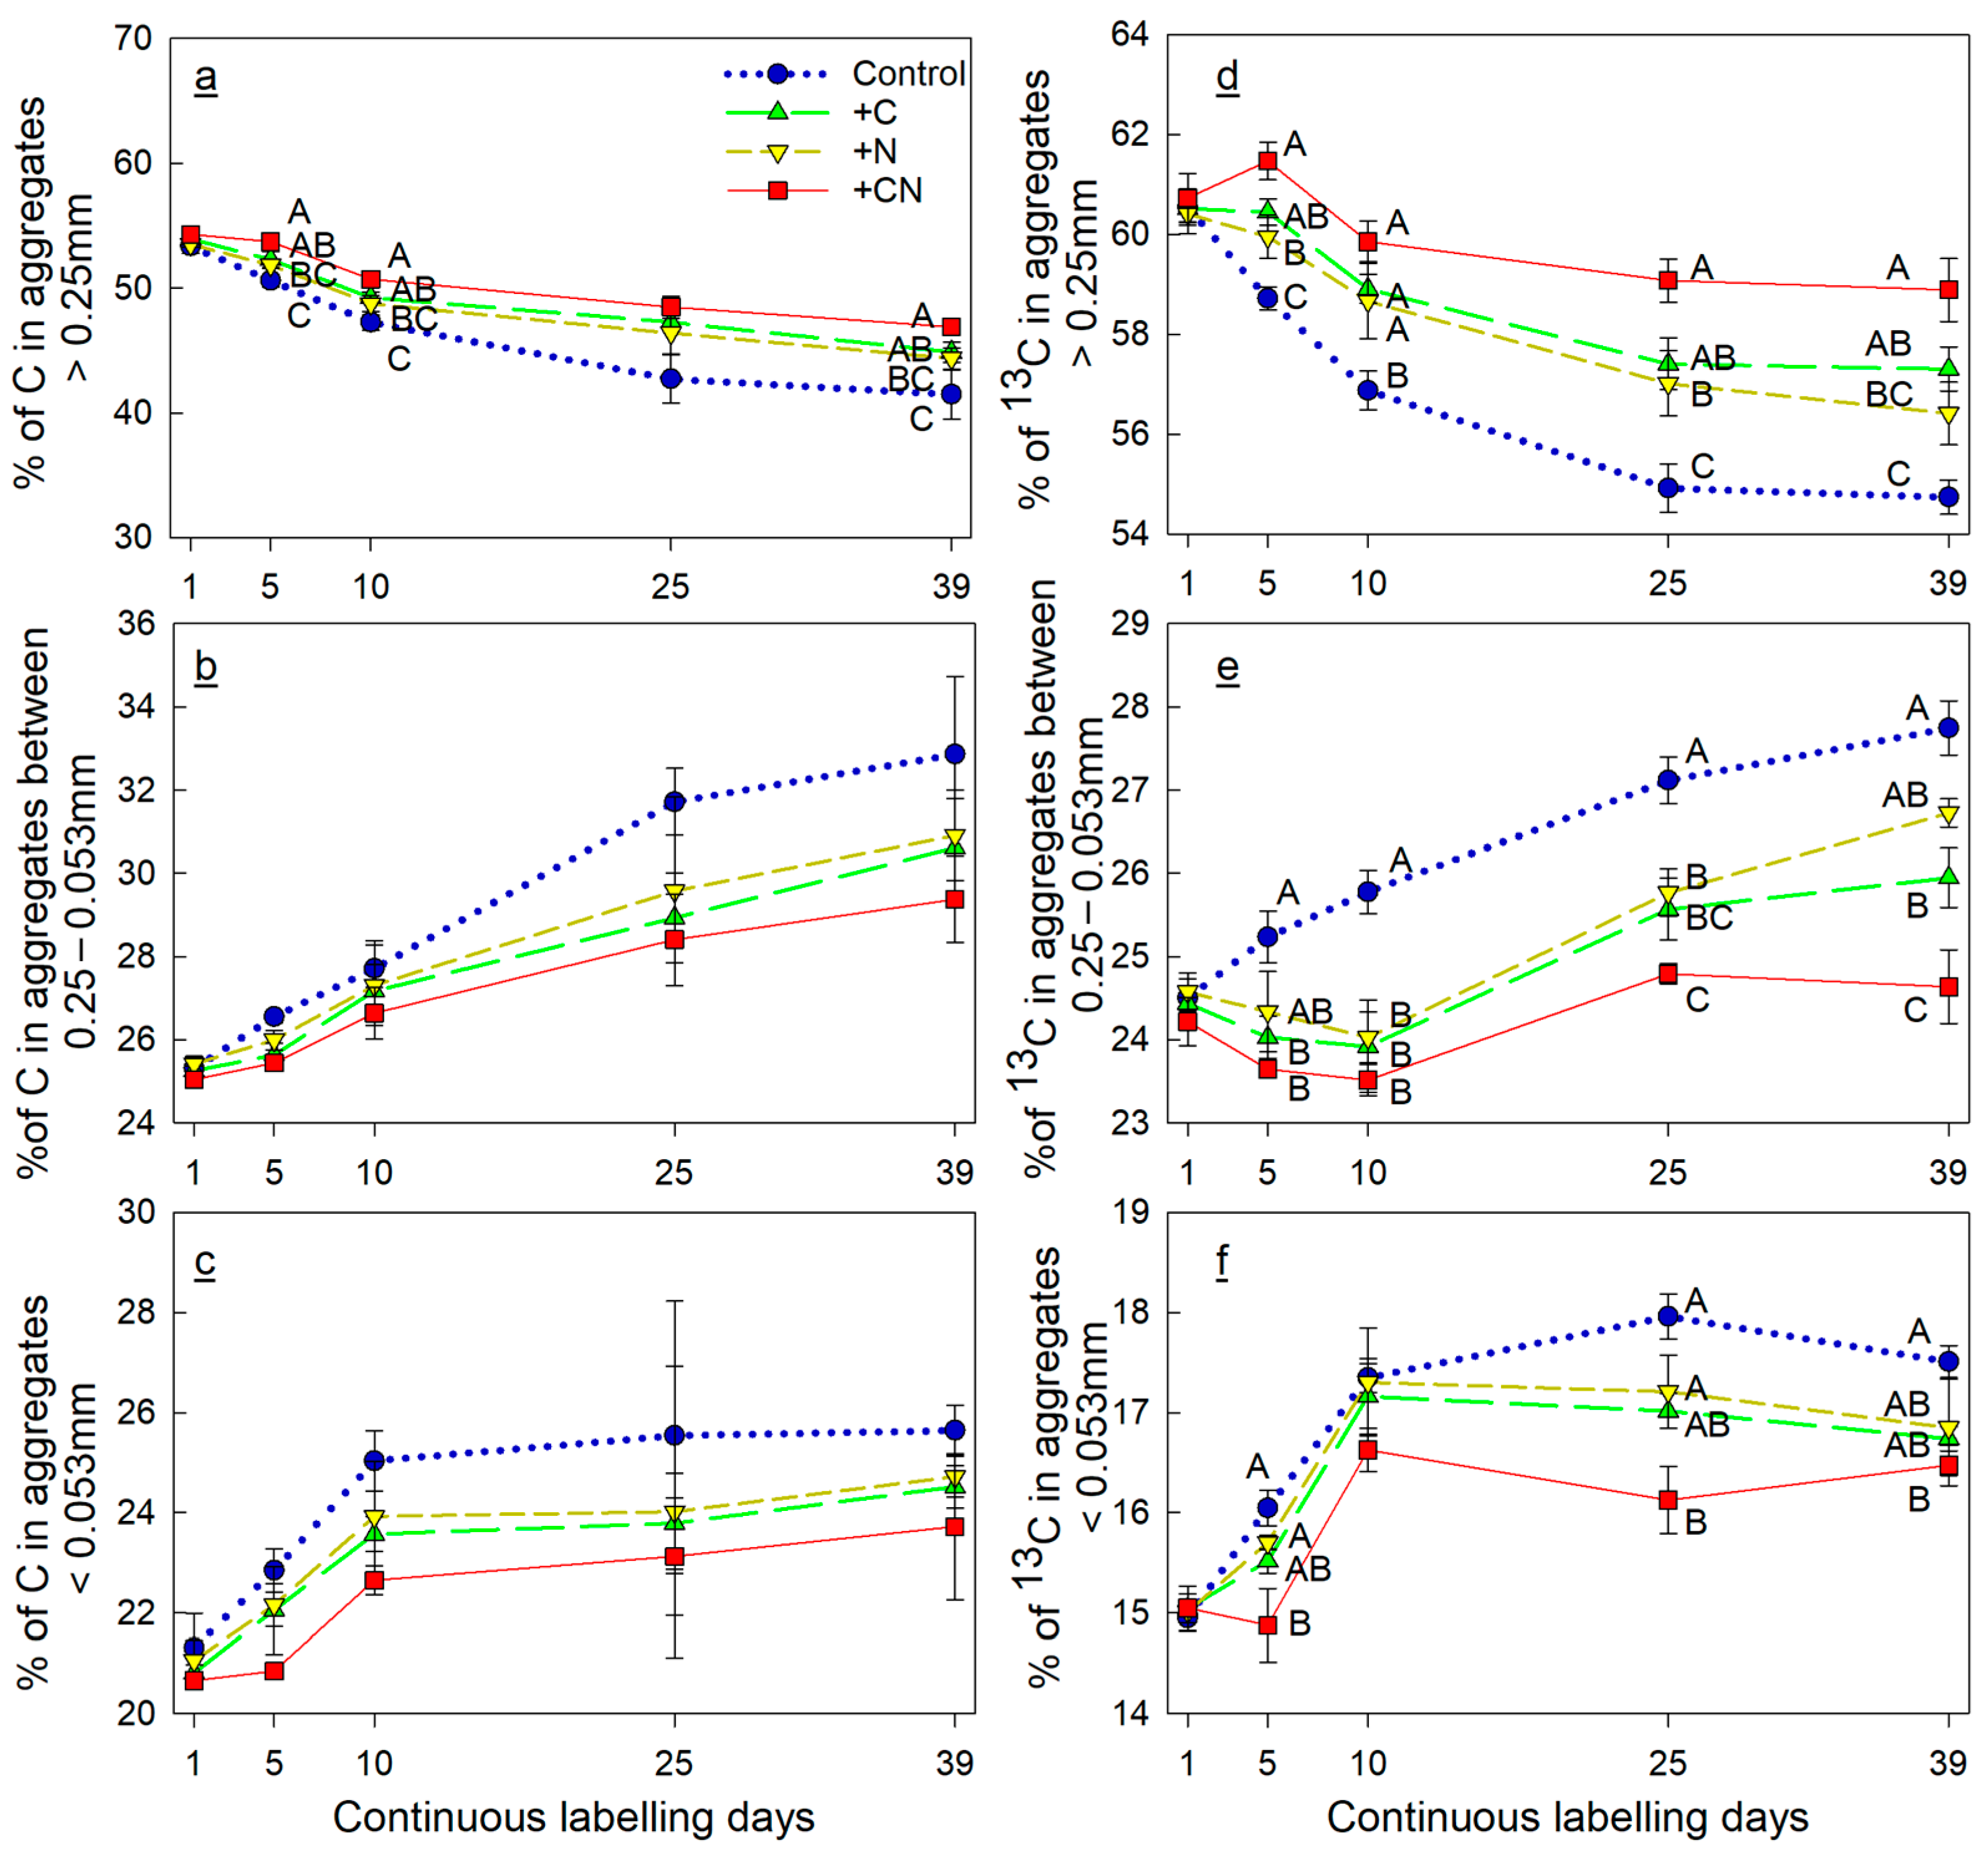
There was no significant difference in the percentages of C in the micro- and meso-aggregates (Figure 3b,c), whereas the percentage of 13C in each soil aggregate component showed significant differences between the treatments (Figure 3d–f). Compared to unfertilized soils, combined cellulose and N fertilization resulted in the highest proportion of 13C in the macro-aggregates, which resulted in the lowest 13C content in the meso- and micro-aggregates. Cellulose and N fertilization alone led to similar 13C percentages in the soil meso- and micro-aggregates.

3.4. Incorporation of Rhizodeposit-Derived C in Microbial Groups

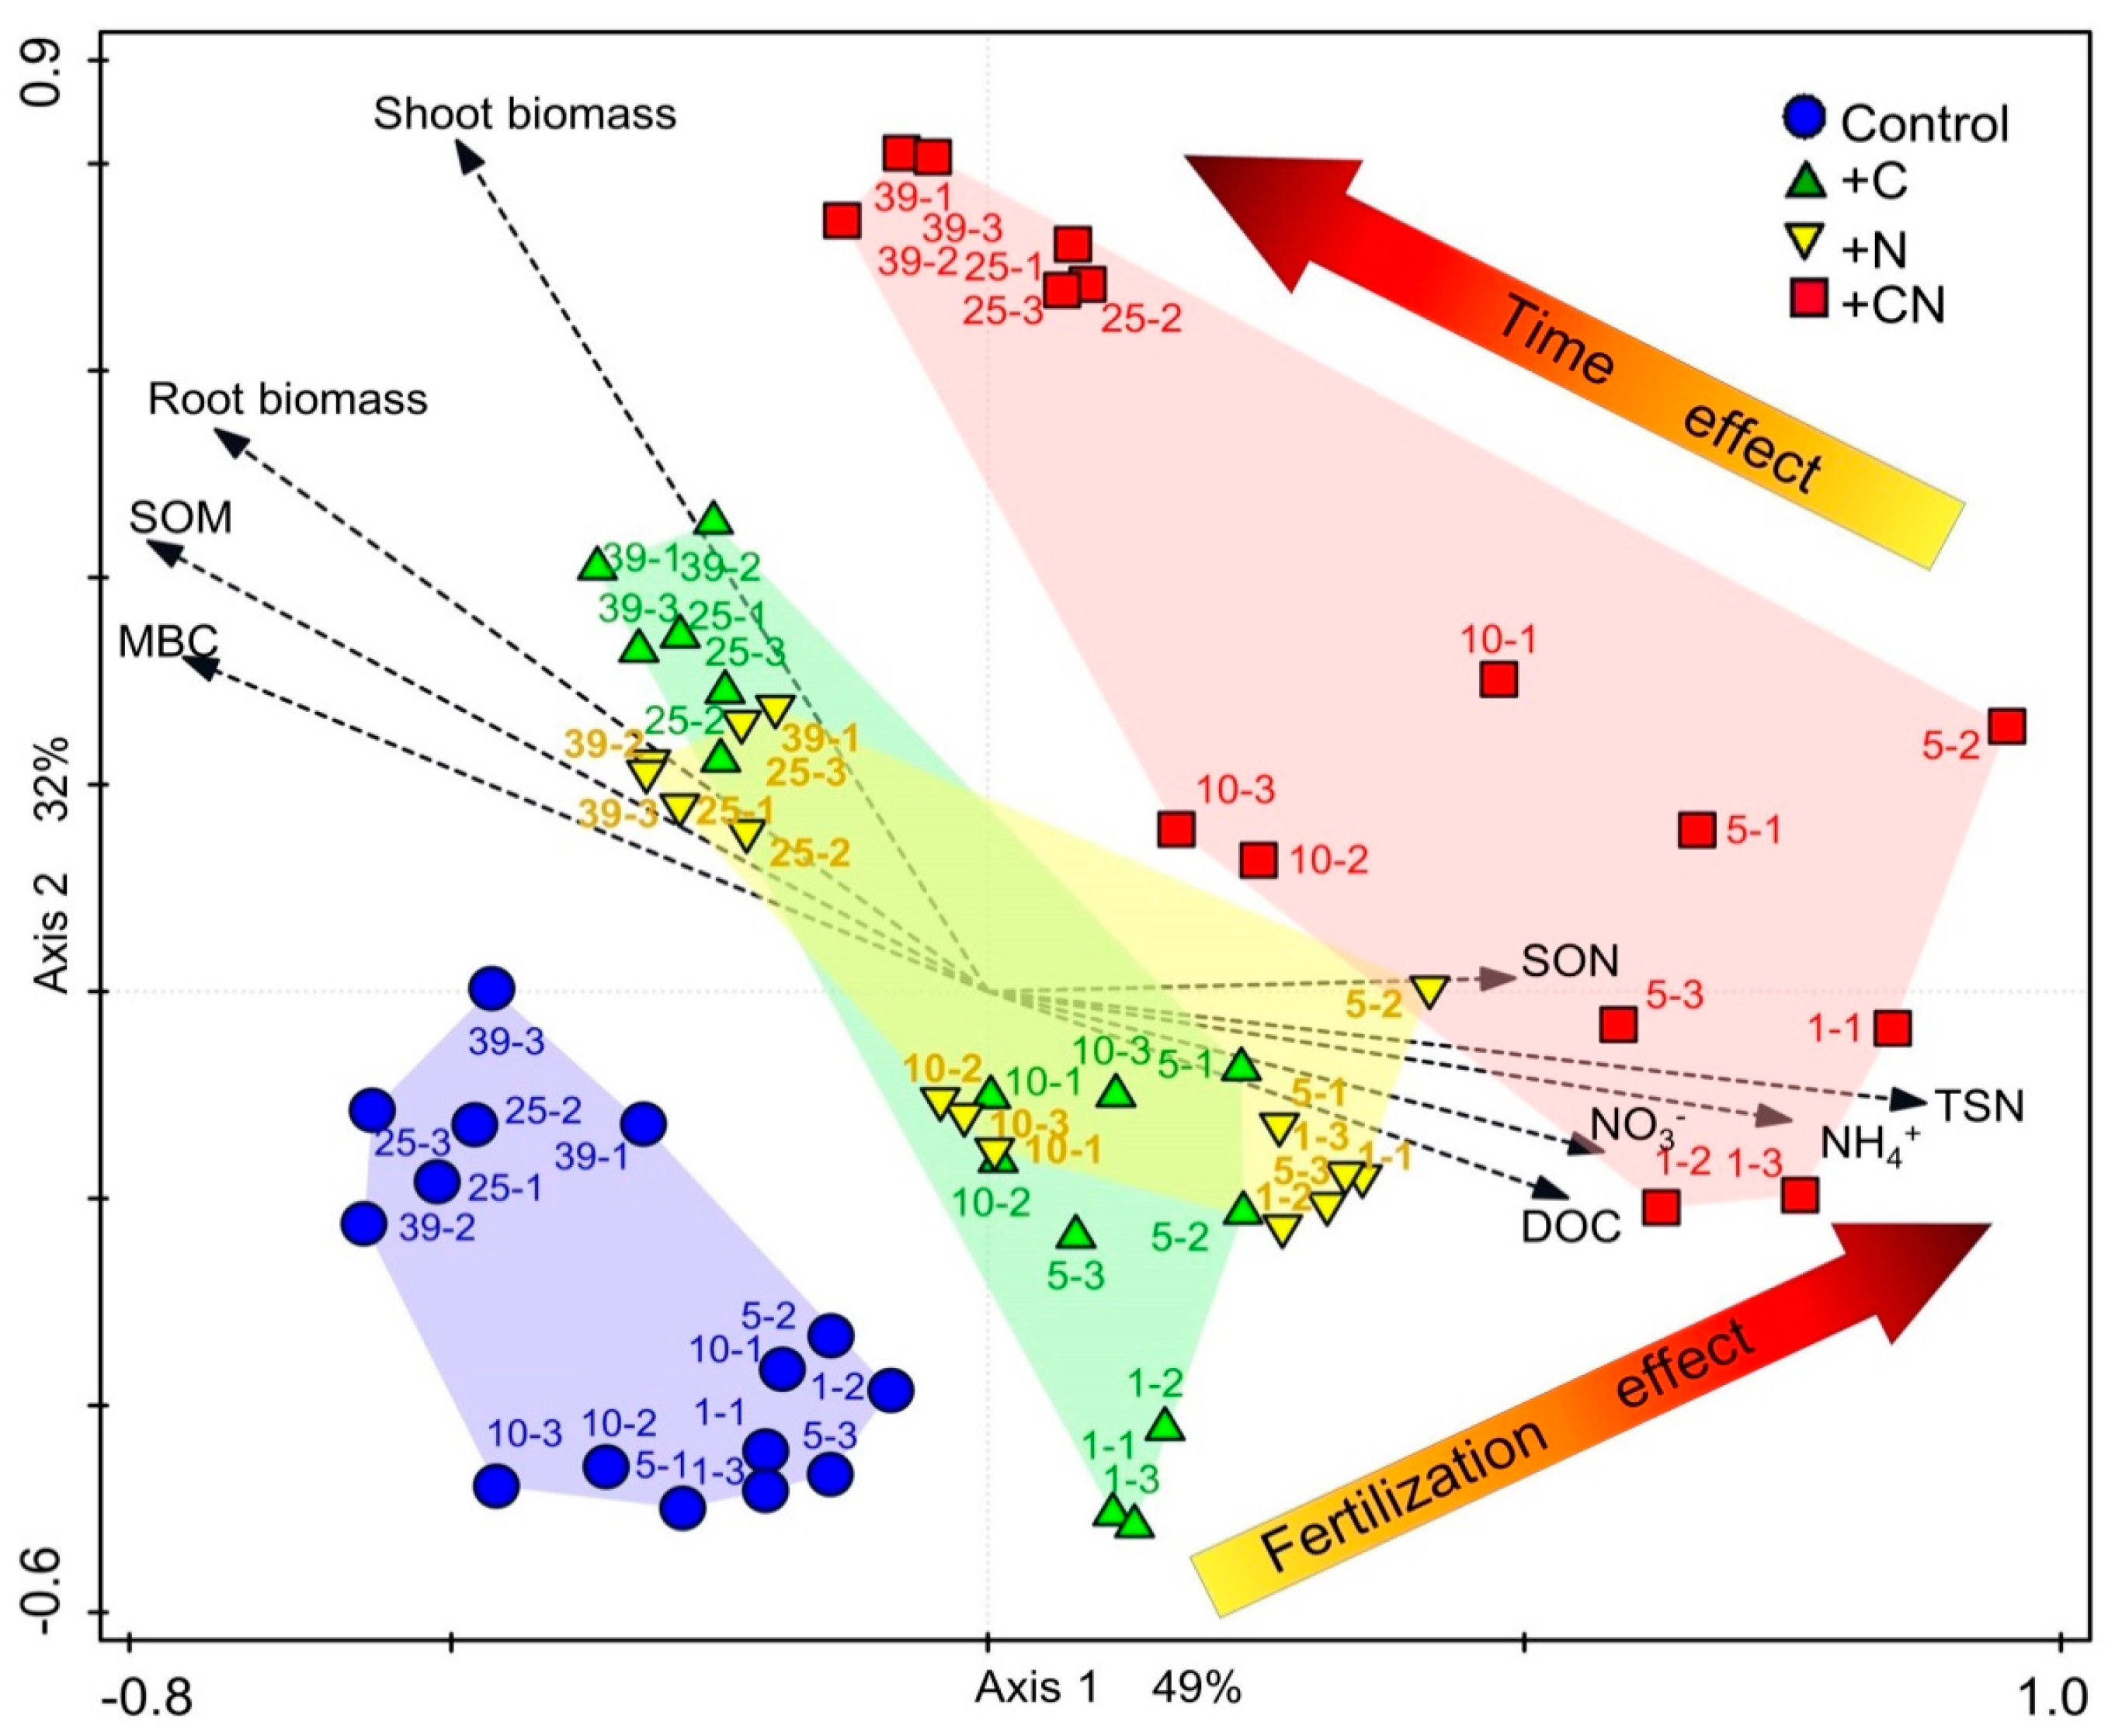
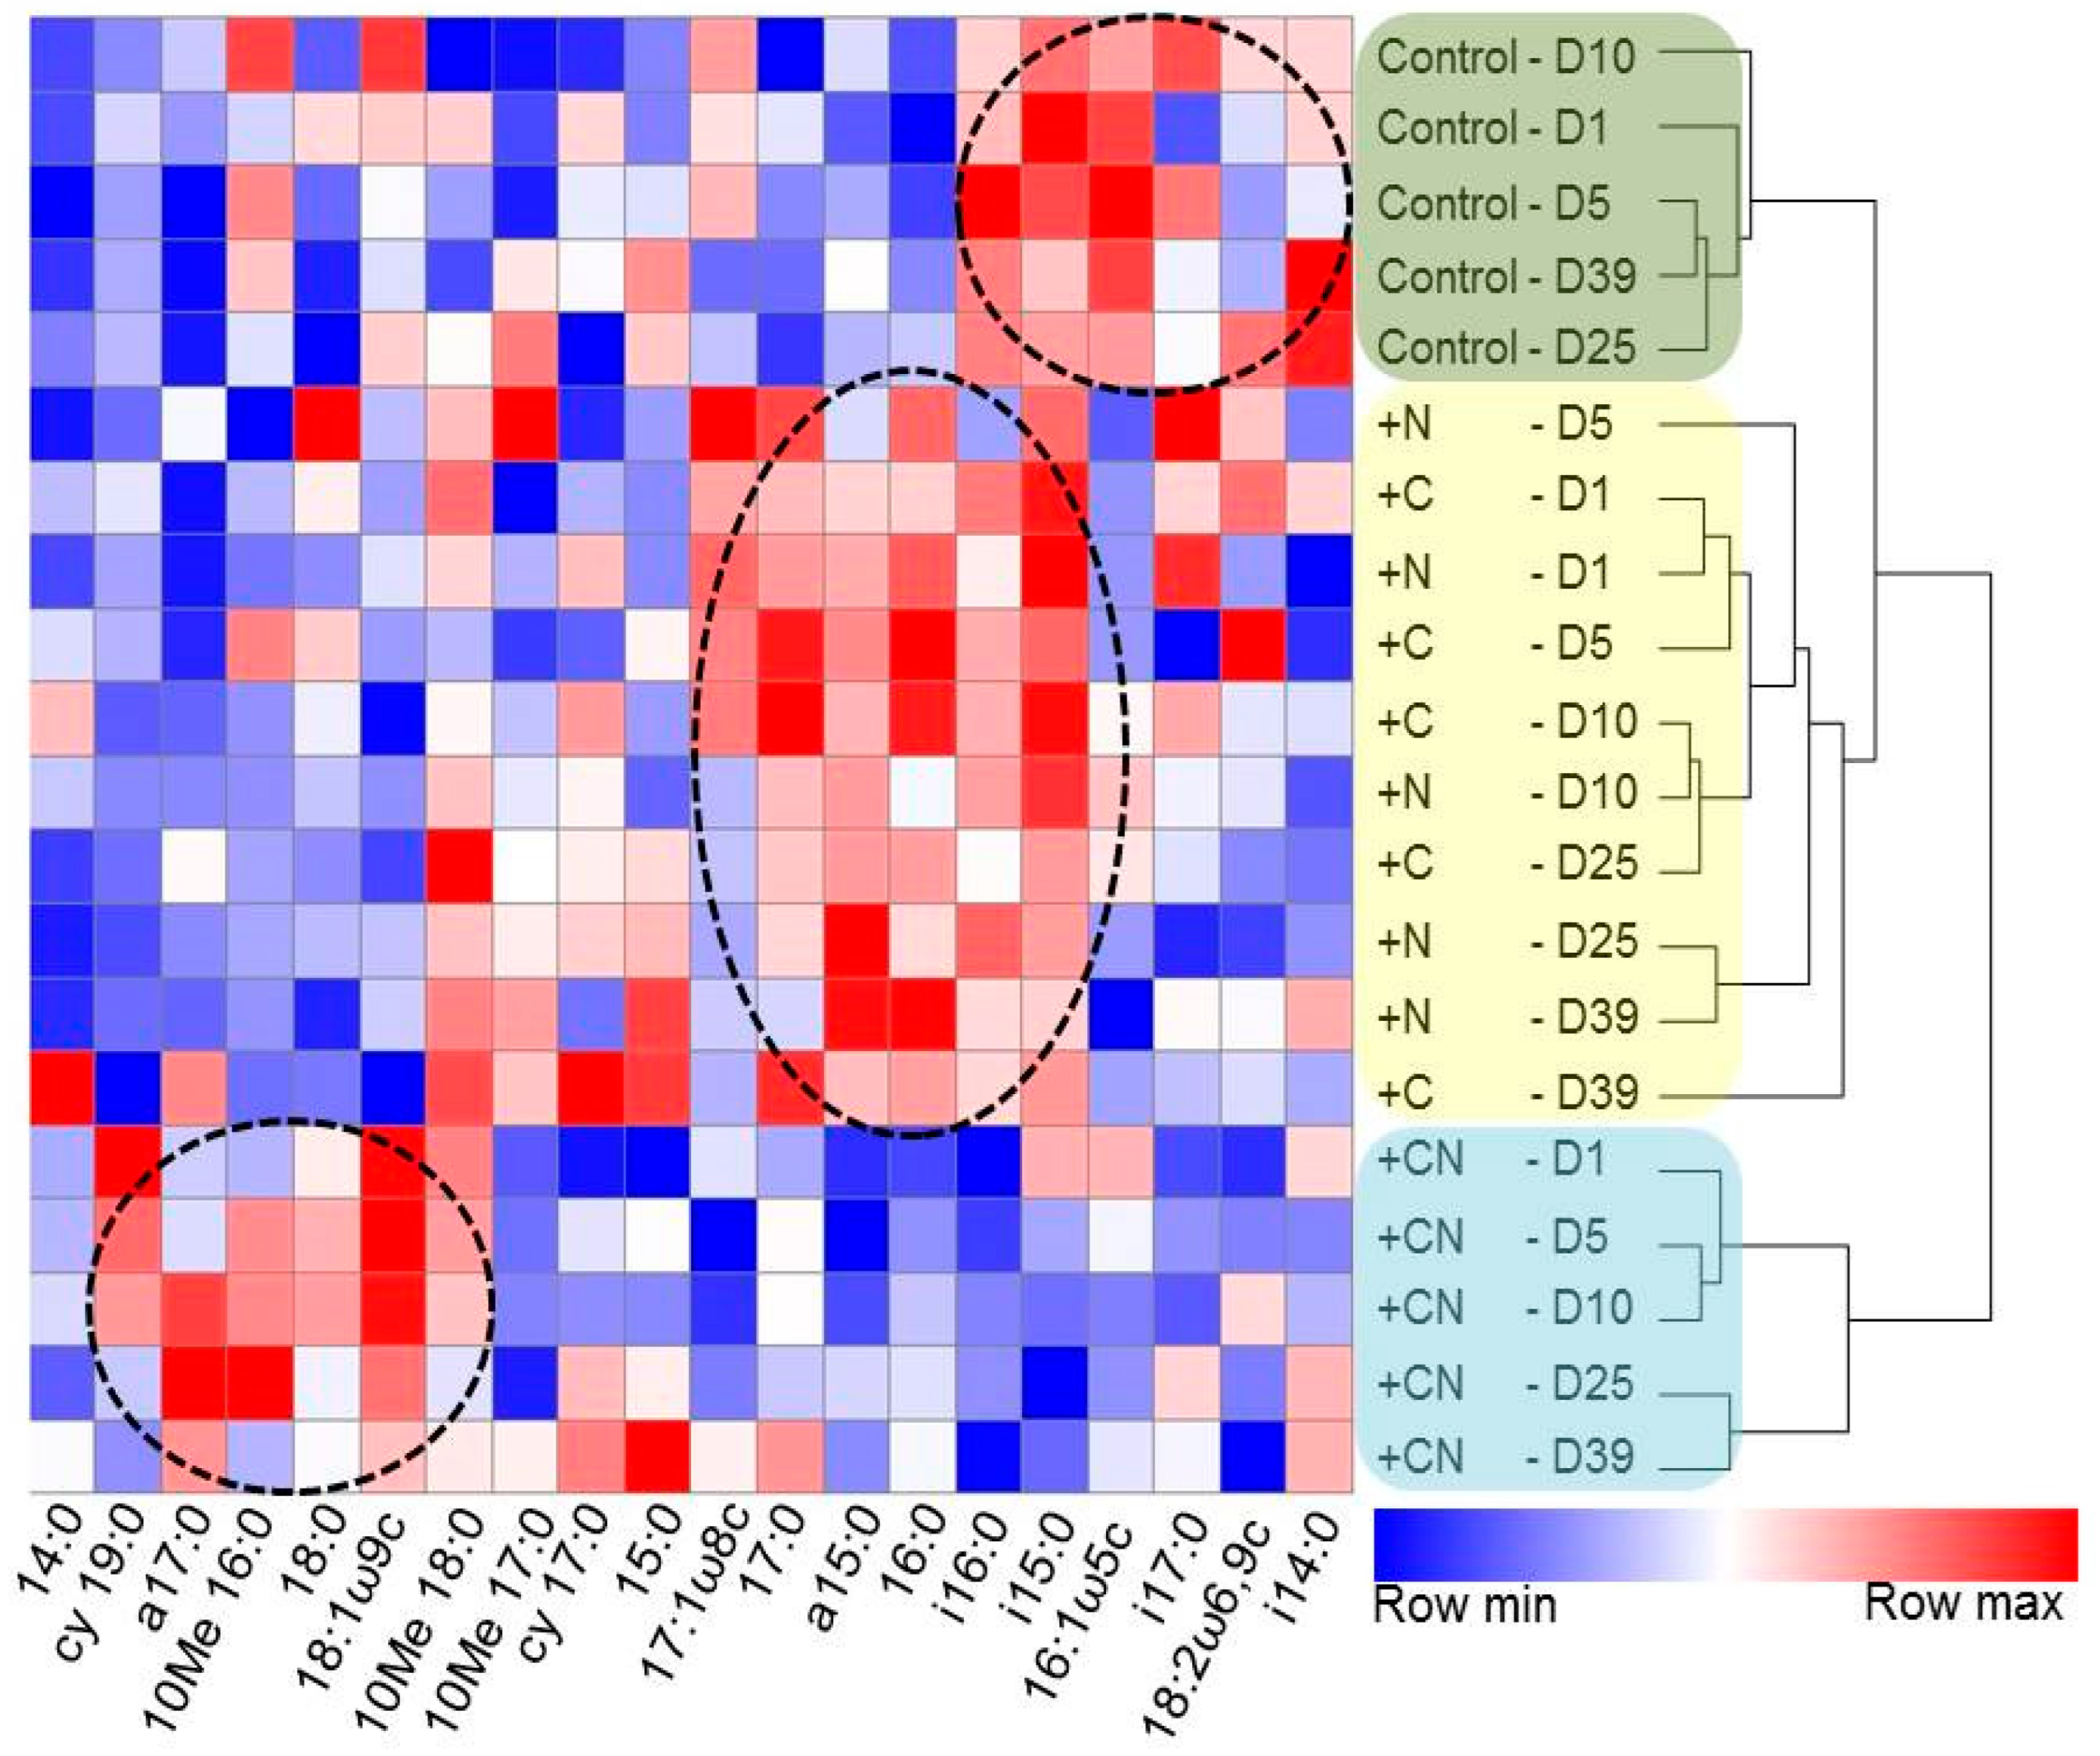
The RDA of 13C-PLFAs showed that the microbial communities involved in the utilization of the rhizodeposit-derived C were significantly affected by plant growth stage and fertilization (pseudo-F = 4.03, p = 0.001, 999 permutations), with the constrained axes explaining 81% of the total variation (Figure 4). Plant growth stage and fertilization resulted in significant separation within the microbial groups. The microbial groups in the utilization of 13C were similar in single cellulose or N-fertilized soil; however, they showed a large discrepancy with unfertilized soil and the combined cellulose and N fertilization soil (Figure 5).
The heat map showed that fertilization led to the specific stimulation of PLFA biomarkers; the individual addition of cellulose or N induced relatively higher amounts of G− (17:1ω8c) and G+ (i15:0, a15:0, and i16:0). In contrast, simultaneous cellulose and N application (combined fertilization) led to relatively higher amounts of fungi (18:1ω9c), G+ (a17:0), actinomycetes (10Me16:0 and 10Me18:0), and anaerobes (cy19:0).
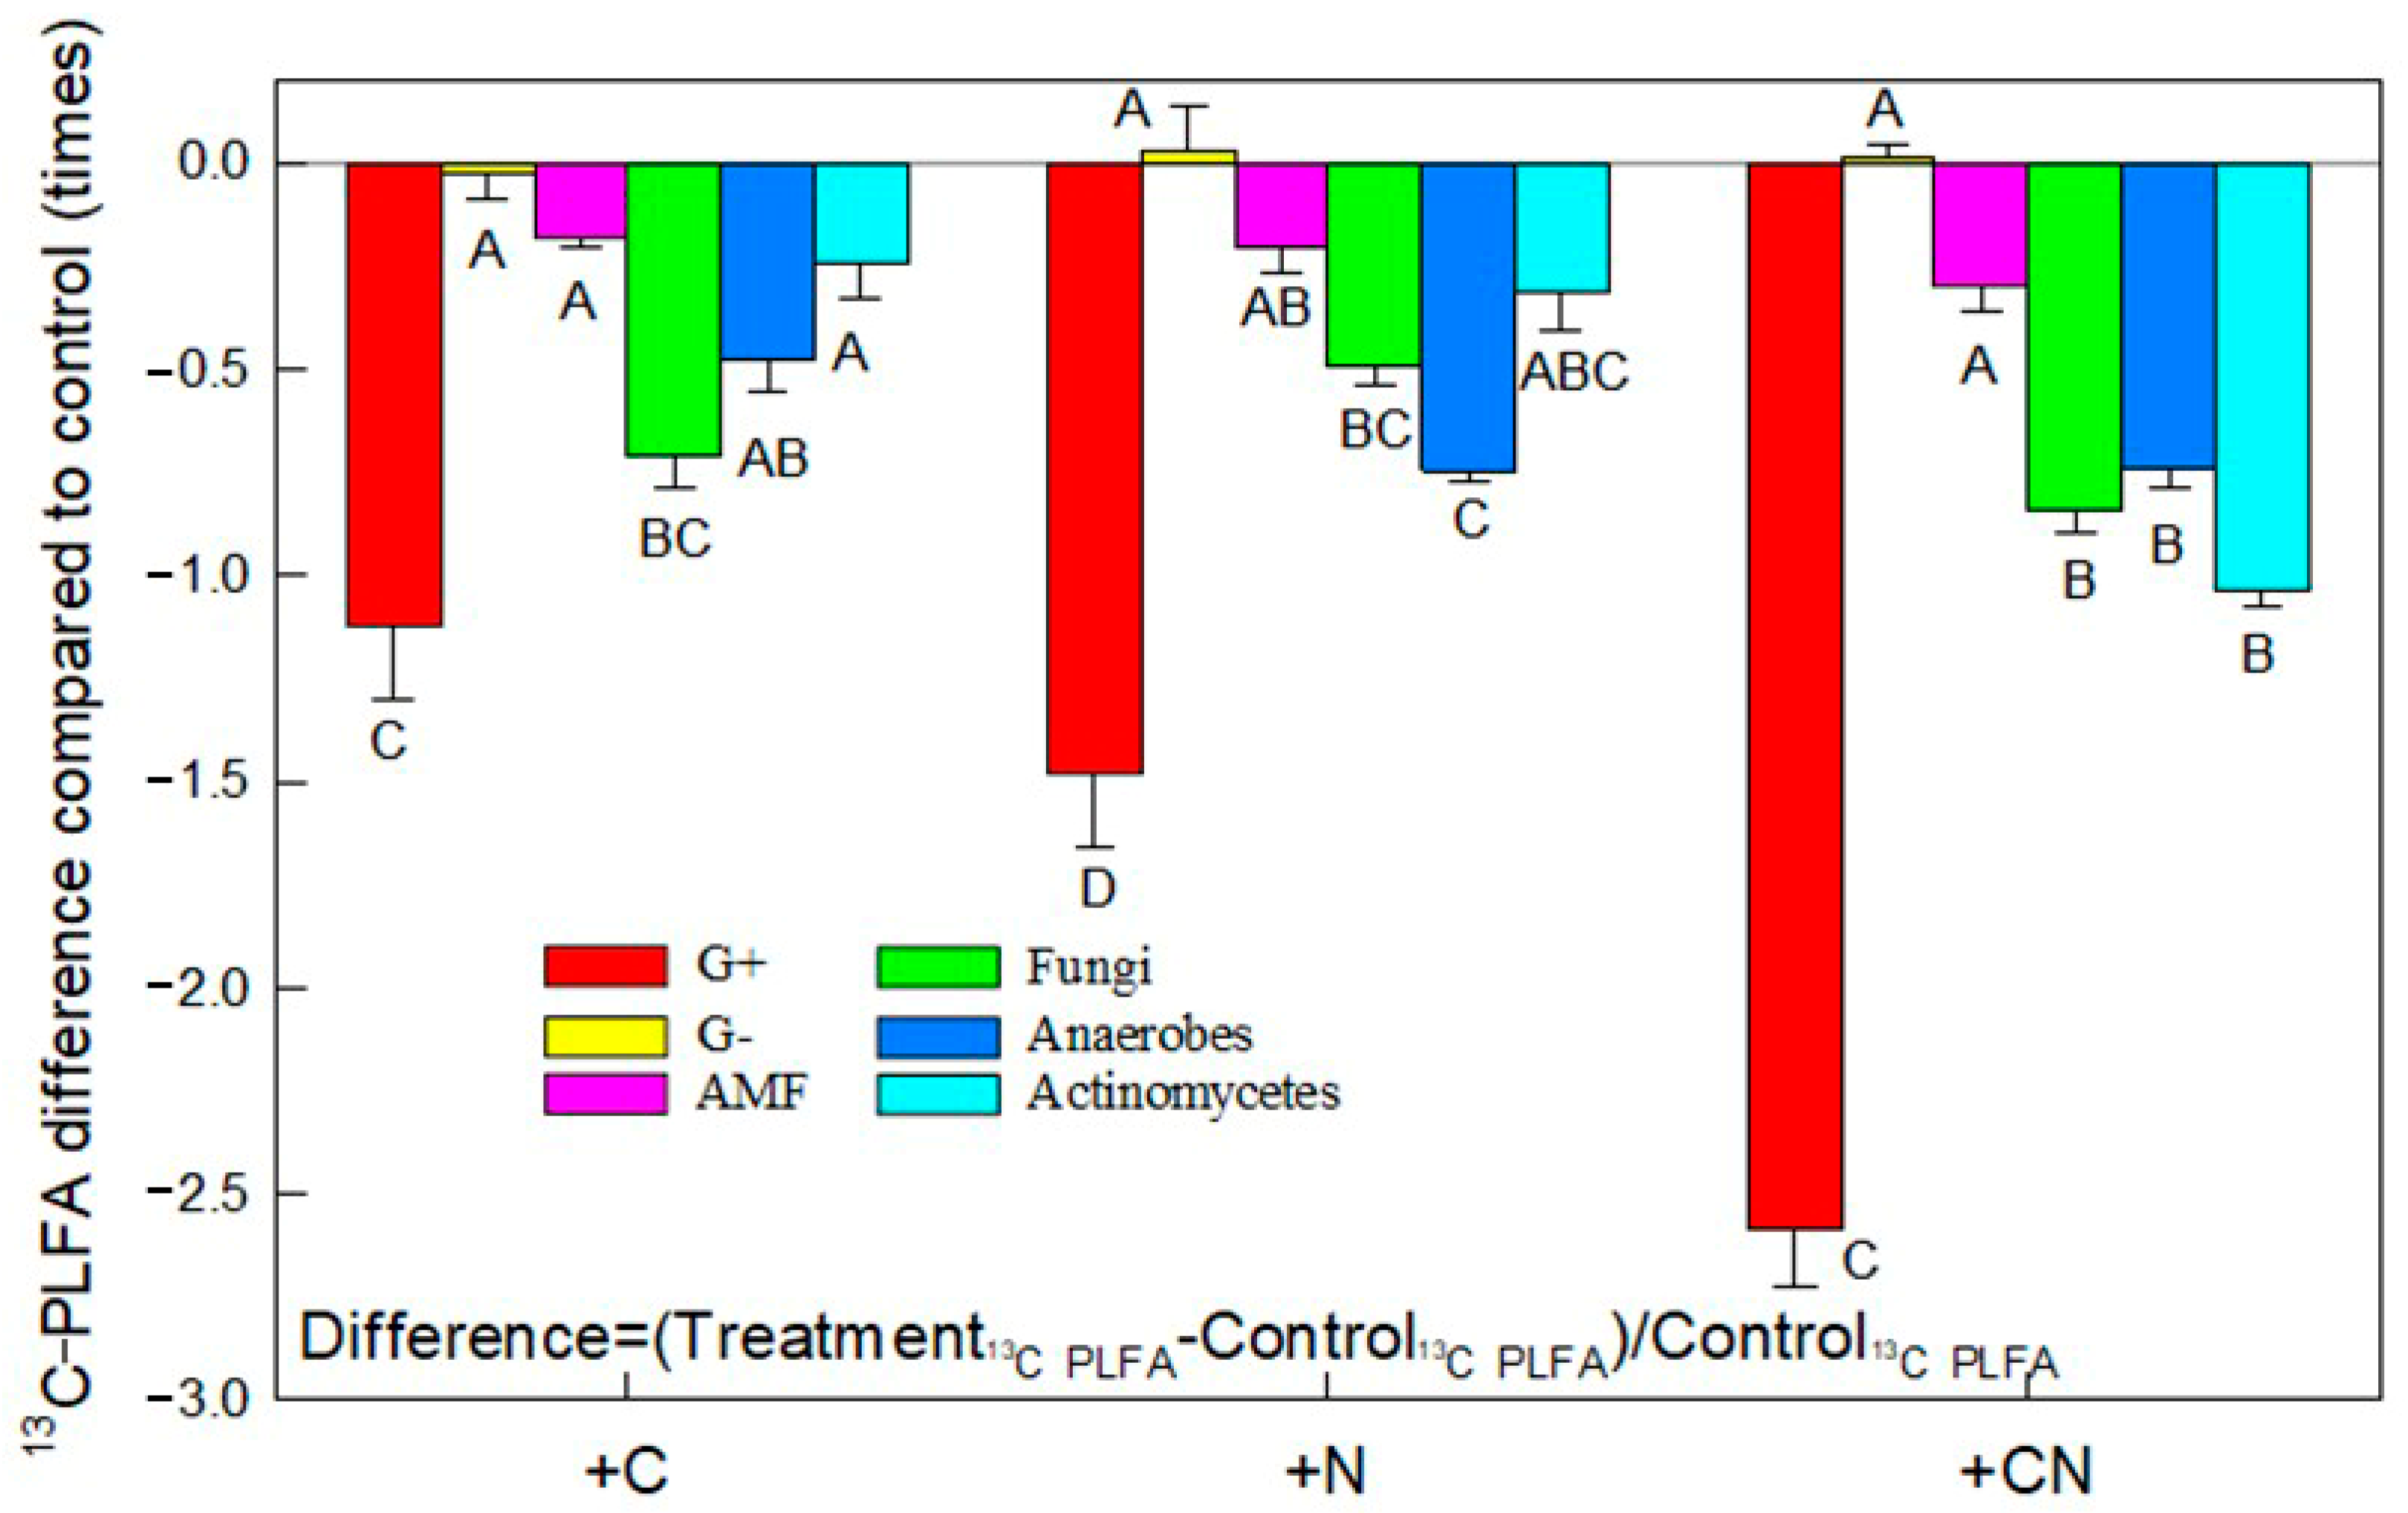
Both single and combined fertilization treatments decreased the 13C PLFA content of most microbial groups (Figure 6 and Table S3). Fertilization (single or combined) resulted in a higher incorporation of 13C into G+ bacterial PLFA. N fertilization decreased G+ 13C PLFAs, with the lowest amounts recorded under combined fertilization.

4. Discussion

4.1. Allocation of Photosynthate C in Rice-Soil Systems Affected by Cellulose and N Fertilization

Because the proportion of belowground allocation of plant photo-assimilated C can be restricted by high amounts of available C and N [29,30], fertilization (cellulose, N, or combined) reduced the net photo-assimilated C allocated to the soil in the present study. The amount of photo-assimilated C allocated to the soil positively correlates with root biomass [36]; hence, a smaller amount of root biomass leads to less 13C incorporation belowground in the combined fertilized treatment. Cellulose addition has been reported to induce a strong positive priming effect, which may release nutrients from SOM and potentially alter nutrient availability for plant growth [37,38]. Thus, cellulose fertilization may have contributed to reduced root development and consequently lower 13C allocation to roots and belowground C pools. Furthermore, the combined cellulose and N fertilization induced the largest increase in rice aboveground biomass compared to single fertilization (Figure 1a). These results are consistent with the outcomes of combined mineral N and organic C treatments, which enhance rice yield [39]. Cellulose addition may also modify the effects of N fertilization on the belowground allocation of photo-assimilated C by altering N immobilization, N remineralization, and denitrification processes [40,41]. However, these processes were not directly measured in the present study and therefore should be considered possible mechanisms. Thus, in contrast to the increased shoot yield, combined fertilization maximized the reduction in photo-assimilated C in the belowground C pools (roots, soil, DOC, and MBC; Figure 2).
Limited energy and labile C sources induce a dormant state of microorganisms in the soil [42,43,44]. In the present study, the photosynthates were 13C-labeled and released as labile organic substrates with high bioavailability, such as mucilage, exudates, and dead tissue [28]. The decreasing input of 13C into the soil from labeling days 1–5 indicated a high requirement for photosynthates for aboveground biomass growth (Figure 2a–c). The increase in soil 13C after labeling day 5 denoted a shift in the photo-assimilated C allocation pattern between above- and belowground, as well as the release of 13C from root exudation, mucilage, and dead tissues, supporting microbial proliferation (Figure 2e). Furthermore, combined cellulose and N fertilization induced higher 13C incorporation into PLFAs relative to MBC than that observed with single cellulose or N fertilization at the early stage of rice growth (Figure 2f), possibly because the combined fertilization met the requirement of microbial C:N stoichiometry that promotes microbial growth [45]. However, combined cellulose and N fertilization induced the maximum shoot biomass (Figure 1a) and the lowest 13C-MBC (Figure 2e), which may indicate that the activated microorganisms are dedicated to nutrient transformation rather than microbial biomass content. This process is a crucial driver of aboveground plant growth and the rate-limiting step in productivity [46]. Thus, cellulose and N application reduced belowground photo-assimilated C partitioning but may have promoted aboveground biomass growth by accelerating microbial nutrient transformation.

4.2. Cellulose and N Fertilization Regulated the Microbial Utilization of Photo-Assimilated C

The utilization of rhizodeposits by microbial communities is regulated by C substrate availability and nutritional status [47]. Microorganisms are active and competitive for rhizodeposits during rice cultivation because rhizodeposits are more readily available for microbial utilization [48]. Larger quantities of rhizodeposits from the higher photo-assimilated C rice roots support microbial proliferation, resulting in higher microbial biomass C during rice cultivation (Figure 2 and Figure S1). N fertilization decreases cellulose breakdown and phosphorus acquisition associated with enzyme activity, thereby limiting the microbial acquisition of phosphorus and labile C and reducing the microbial utilization of rhizodeposits [49,50]. However, N fertilization decreases the available C/N ratio, resulting in an increase in microbial C use efficiency (CUE) [51]. This change in C availability and CUE may have contributed to the higher proportion of 13C-PLFA in 13C-MBC between labeling days 1 and 10 (Figure 2f), especially in the combined cellulose- and N-fertilized soil that had sufficient available C and N for microbial growth. With nitrogen consumption (Figure S2), increasing the available C/N ratio may decrease CUE but increase the microbial respiration of rhizodeposited C to provide energy for microbial activity [52]. Cellulose may plausibly accelerate these effects by increasing the available soil C/N ratio, activating microbial activity, and promoting rhizodeposit consumption [13].
Nitrogen fertilization decreases the dependence of microorganisms on rhizodeposited C in the rhizosphere soil [21]; hence, less rhizodeposited C was allocated to the PLFA composition in the N-fertilized soils. Cellulose improves N transport, promoting N availability [21]. For example, the rhizodeposited C allocated to the PLFA compositions had a similar pattern in the C- and N-fertilized soils, with higher proportions of 13C in the G+ (i15:0, a15:0, i16:0) and G− (17:1ω8c) soils than in the other PLFA compositions (Figure 5). The effect of cellulose on the allocation of rhizodeposited C to the PLFA profile is influenced by N availability [21]. Thus, cellulose can stimulate Actinobacteria, whose abundance accounts for only 4.6% yet encodes 16% of the total carbohydrate-active enzymes that contribute to cellulose degradation [22]. Fungi can also metabolize cellulose by releasing extracellular enzymes [26]. In soils with low N availability, cellulose can serve as a C source for microbial growth and reduce rhizodeposit utilization [53]. Thus, the addition of cellulose and N might promote the incorporation of rhizodeposited C into the fungi and Actinobacteria, although the underlying microbial mechanisms were not directly examined in this study.

4.3. Effects of Cellulose and N Fertilization on the Incorporation of Photo-Assimilated C into Soil Aggregates

Nitrogen fertilization increased the proportion of macro-aggregates, thus increasing the C content in the macro-aggregate fraction by an average of 15% [54]. Organic binding agents such as polysaccharides (transient agents) from microbial turnover and root exudates bind to the silt and clay fractions and stabilize soil aggregation [55,56,57,58]. The higher proportion of rhizodeposit-derived C (13C in soil) in the macro-aggregates in fertilized soils suggests that photosynthates from roots may have contributed to macro-aggregate formation (Figure 3d), potentially favoring the retention of rhizodeposit-derived C within this aggregate fraction during the experimental period. This corresponded to the lower 13C values observed for MBC (Figure 2e). Cellulose is an exogenous polysaccharide that has been reported to facilitate macro-aggregate formation and stabilization [59], which may contribute to the physical protection of rhizodeposit-derived C within macro-aggregates.
The mean residence time (MRT) of rice rhizodeposit-derived C in soils is longer than that of other exogenous organic substrates in rice paddy systems, such as rice straw and roots, approximately 53 and 73% lower than the MRT of rhizodeposit-derived C, respectively [60]. This is because rhizodeposits are labile substrates that are easily utilized during microbial growth and released as microbial necromass during microbial succession [61]. Microbial necromass is a relatively stable form of SOM [62,63,64]. Sorption of microbial necromass onto mineral surfaces is considered a stable form of SOM, that is, mineral-associated organic matter (MAOM) [61]. The greater proportion of rhizodeposit-derived C in macro-aggregates may indicate that physical protection within aggregates reduced its immediate microbial utilization in fertilized soils (Figure 3d). Thus, less rhizodeposit-derived C may have been available for microbial decomposition and subsequent transformation into microbial necromass and bound to mineral surfaces.

5. Conclusions

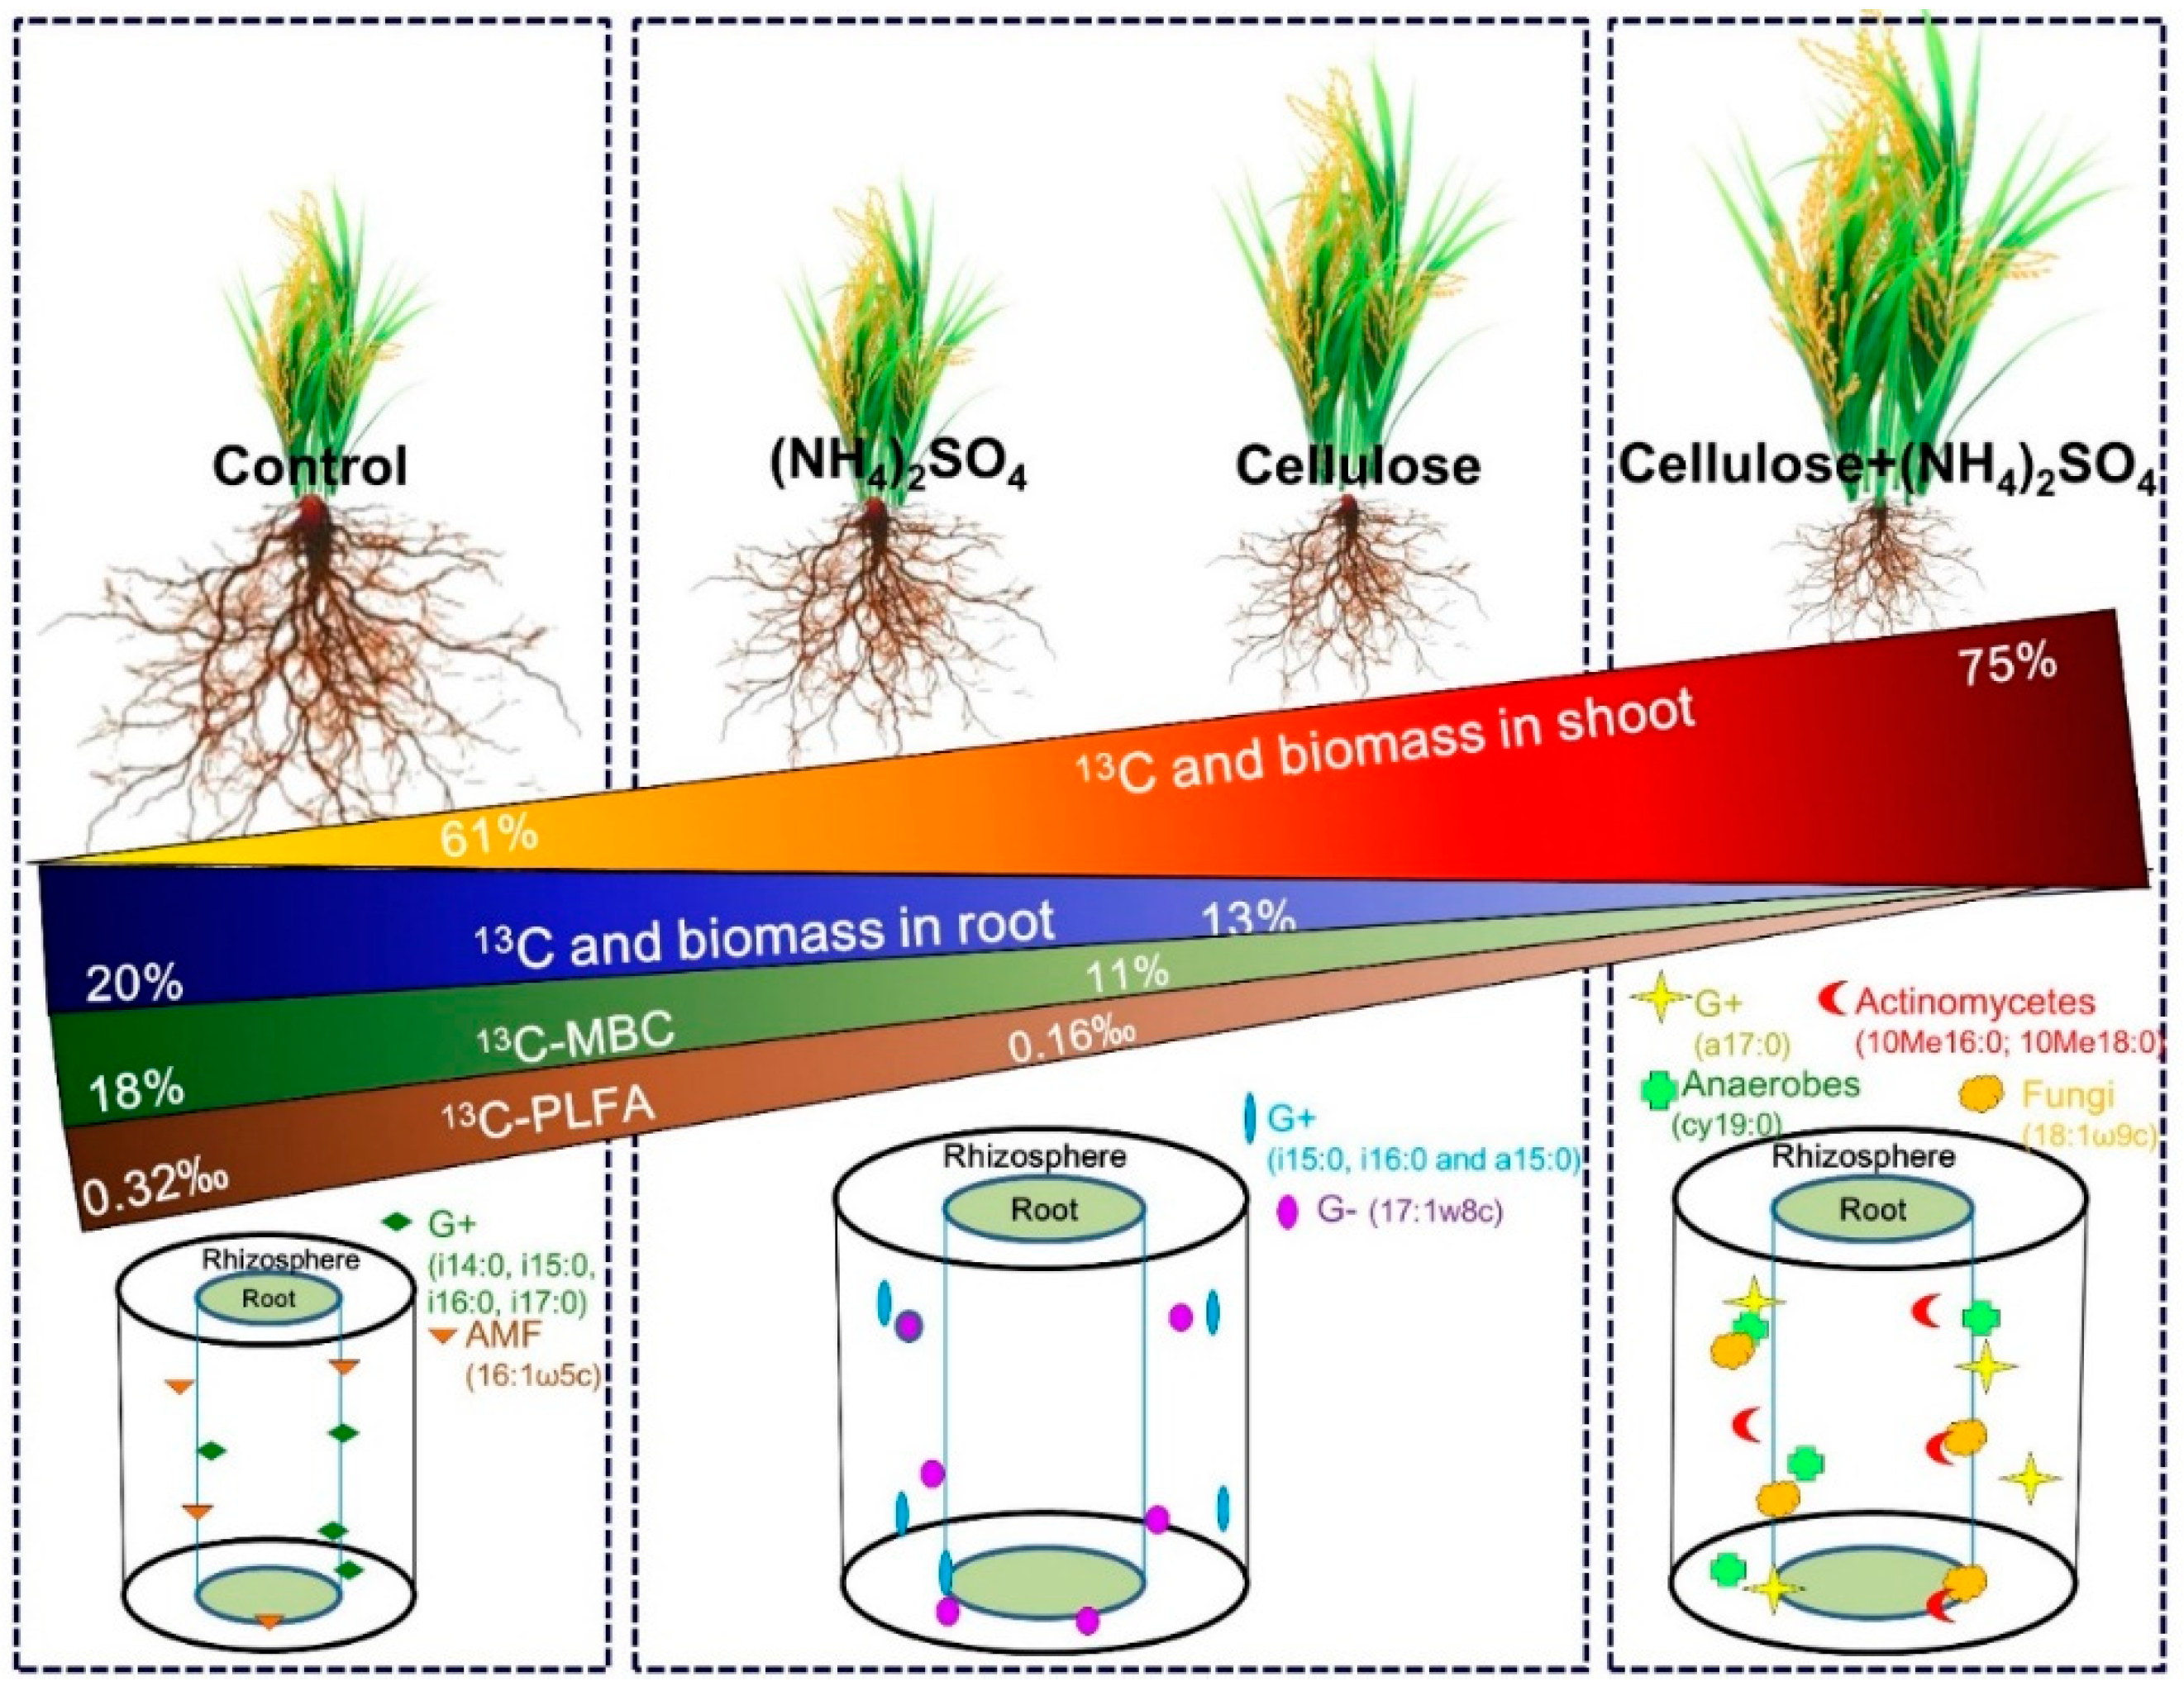
In this pot experiment, carboxymethyl cellulose, N, and their combined fertilization promoted shoot biomass and 13C incorporation, resulting in the lowest root-to-shoot ratio (Figure 7). Consequently, cellulose and N fertilization reduced the proportion of photosynthetic C allocated to the belowground C pools (root SOM, PLFA, MBC, and DOC). Cellulose and N fertilization shifted the dominant microbial groups and decreased the number of rhizodeposits incorporated into the microbial communities. Rhizodeposit-derived C allocated to PLFA compositions showed a similar pattern with single cellulose or N fertilization, which increased the relative percentages of the G− (17:1ω8c) and G+ (i16:0, i15:0, and a15:0) groups. In the case of combined cellulose and N fertilization, the relative percentages of G+ (a17:0), actinomycetes (10Me16:0 and 10Me18:0), fungi (18:1ω9c), and anaerobes (cy19:0) were increased. Overall, under the conditions of this pot experiment, cellulose and N fertilization shifted the dominant microbial groups associated with rhizodeposit utilization by regulating plant and soil properties and the allocation of photosynthates in rice-soil systems. N and combined fertilization enhanced the incorporation of rhizodeposits into soil macro-aggregates, which may protect them from microbial decomposition. These findings suggest that cellulose addition, particularly in combination with N fertilization, may have potential as a soil management strategy to promote rice shoot productivity while enhancing the retention of recently assimilated C in soil macro-aggregates and modifying microbial C utilization. Such effects may provide a potential pathway for improving soil C retention while maintaining crop productivity, although their contributions to long-term C sequestration and greenhouse gas mitigation remain to be determined. However, these findings are restricted to the indoor pot experiment using carboxymethyl cellulose as a model cellulose compound; further validation and in-depth investigations under field conditions with actual rice straw return and realistic fertilization management are required to evaluate their practical agricultural implications.

Supplementary Materials

The following supporting information can be downloaded at https://www.mdpi.com/article/10.3390/agronomy16181755/s1, Table S1: Statistical results of the two-way analysis of variance (ANOVA) analysis; Table S2: Statistical results of the two-way analysis of variance (ANOVA) analysis; Table S3: 13C PLFA content of microbial groups; Figure S1: Dynamics of C in plant-soil systems during the 39 days of 13CO2 continuous labeling. (a) Shoot biomass C; (b) Root biomass C; (c) Soil organic C (SOC); (d) Microbial biomass C (MBC); (e) Dissolved organic carbon (DOC). Lines and symbols represent the following treatments: Control, no addition; +C, cellulose addition; +N, ammonium sulfate addition; +CN, combined cellulose and ammonium sulfate addition. Data points represent means and error bars represent standard errors (n = 3). Capital letters adjacent to the points represent significant differences (p < 0.05) between treatments on the same labeling day; Figure S2: Dynamics of soil properties during the 39 days of 13CO2 continuous labeling. (a) Total soluble N; (b) Inorganic N; (c) Soluble organic N. Lines and symbols represent the following treatments: Control, no addition; +C, cellulose addition; +N, ammonium sulfate addition; +CN, combined cellulose and ammonium sulfate addition. Data points represent means and error bars represent standard errors (n = 3). Capital letters adjacent to the points represent significant differences (p < 0.05) between treatments on the same labeling day. References in the Supplementary Material are cited in [33,34,65,66,67,68].

Author Contributions

Conceptualization, S.W., J.X., Z.H., M.X., Z.Z. (Zhenhua Zhang) and Z.Z. (Ziwei Zhao); Methodology, S.W., J.X., Z.H., M.X., Z.Z. (Zhenhua Zhang) and Z.Z. (Ziwei Zhao); Data curation, T.Y., Z.H. and Z.Z. (Ziwei Zhao); Formal analysis, T.Y. and Z.Z. (Ziwei Zhao); Supervision, Z.H. and Z.Z. (Ziwei Zhao); Funding acquisition, M.X.; Project administration, M.X.; Writing—original draft, S.W., T.Y. and Z.Z. (Ziwei Zhao); Writing—review and editing, S.W., T.Y., J.X., M.X., Z.Z. (Zhenhua Zhang) and Z.Z. (Ziwei Zhao). All authors have read and agreed to the published version of the manuscript.

Funding

This research was funded by the National Natural Science Foundation of China, grant number 42577370, and the K. C. Wong Magna Fund at Ningbo University.

Data Availability Statement

The original contributions presented in this study are included in the article/Supplementary Material. Further inquiries can be directed to the corresponding author.

Conflicts of Interest

The authors declare that they have no known competing financial interests or personal relationships that could have appeared to influence the work reported in this paper.

References

  1. Huang, C.; Han, L.; Liu, X.; Ma, L. The rapid estimation of cellulose, hemicellulose, and lignin contents in rice straw by near infrared spectroscopy. Energy Sources Part A Recovery Util. Environ. Eff. 2010, 33, 114–120. [Google Scholar] [CrossRef] [Scilit]
  2. Abraham, A.; Mathew, A.K.; Sindhu, R.; Pandey, A.; Binod, P. Potential of rice straw for bio-refining: An overview. Bioresour. Technol. 2016, 215, 29–36. [Google Scholar] [CrossRef] [Scilit] [PubMed]
  3. Qu, C.; Li, B.; Wu, H.; Giesy, J.P. Controlling air pollution from straw burning in China calls for efficient recycling. Environ. Sci. Technol. 2012, 46, 7934–7936. [Google Scholar] [CrossRef] [Scilit] [PubMed]
  4. Dinh, V.-P.; Tran-Vu, H.-A.; Tran, T.; Duong, B.-N.; Dang-Thi, N.-M.; Phan-Van, H.-L.; Tran, T.-K.; Huynh, V.-H.; Nguyen, T.-P. Improving soil quality and crop yields using enhancing sustainable rice straw management through microbial enzyme treatments. Environ. Health Insights 2024, 18. [Google Scholar] [CrossRef] [Scilit] [PubMed]
  5. Belenguer-Manzanedo, M.; Alcaraz, C.; Camacho, A.; Ibáñez, C.; Català-Forner, M.; Martínez-Eixarch, M. Effect of post-harvest practices on greenhouse gas emissions in rice paddies: Flooding regime and straw management. Plant Soil 2022, 474, 77–98. [Google Scholar] [CrossRef] [Scilit]
  6. Fusi, A.; Bacenetti, J.; González-García, S.; Vercesi, A.; Bocchi, S.; Fiala, M. Environmental profile of paddy rice cultivation with different straw management. Sci. Total Environ. 2014, 494-495, 119–128. [Google Scholar] [CrossRef] [Scilit] [PubMed]
  7. Jia, S.; Li, Y.D.; Qu, H.; Li, B.; Juan, Y.; Xing, Y.; Liu, Y.; Bao, H.; Sun, W. Straw retention drives microbial community succession to improve soil C/N cycling: Insights from a multi-year rice-based system. Front. Microbiol. 2025, 16, 1590788. [Google Scholar] [CrossRef] [Scilit] [PubMed]
  8. Che, Y.; Zhang, B.; Liu, B.; Wang, J.; Zhang, H. Effects of straw return rate on soil physicochemical properties and yield in paddy fields. Agronomy 2024, 14, 1668. [Google Scholar] [CrossRef] [Scilit]
  9. Chen, X.; Hu, Y.; Feng, S.; Rui, Y.; Zhang, Z.; He, H.; He, X.; Ge, T.; Wu, J.; Su, Y. Lignin and cellulose dynamics with straw incorporation in two contrasting cropping soils. Sci. Rep. 2018, 8, 1633. [Google Scholar] [CrossRef] [Scilit] [PubMed]
  10. Dong, M.; Chen, X.; Feng, S.; Yin, C.; Su, Y. Characteristics of cellulose degradation after straw return and its influence factors in arable lands in red soil hilly region. Chin. J. Ecol. 2016, 35, 1834–1841. [Google Scholar] [CrossRef]
  11. Glissmann, K.; Conrad, R. Saccharolytic activity and its role as a limiting step in methane formation during the anaerobic degradation of rice straw in rice paddy soil. Biol. Fertil. Soils. 2002, 35, 62–67. [Google Scholar] [CrossRef] [Scilit]
  12. Pérez, J.; Muñoz-Dorado, J.; de la Rubia, T.; Martínez, J. Biodegradation and biological treatments of cellulose, hemicellulose and lignin: An overview. Int. Microbiol. 2002, 5, 53–63. [Google Scholar] [CrossRef] [Scilit] [PubMed]
  13. Blagodatskaya, E.; Khomyakov, N.; Myachina, O.; Bogomolova, I.; Blagodatsky, S.; Kuzyakov, Y. Microbial interactions affect sources of priming induced by cellulose. Soil Biol. Biochem. 2014, 74, 39–49. [Google Scholar] [CrossRef] [Scilit]
  14. Liang, Y.; Cao, D.; Ma, Z.; Wu, R.; Zhang, H.; Fang, Y.; Shahbaz, M.; Liu, X.J.A.; Kuzyakov, Y.; Chen, J.; et al. Stoichiometry regulates rice straw-induced priming effect: The microbial life strategies. Soil Biol. Biochem. 2024, 196, 109514. [Google Scholar] [CrossRef] [Scilit]
  15. Zhang, Y.; Lu, M.; Wang, Z.; Zhang, K.; Zhang, B.; Naimaiti, R.; Wei, S.; Ding, X. Nutrient supply enhances positive priming of soil organic C under straw amendment and accelerates the incorporation of straw-derived C into organic C pool in paddy soils. Eur. J. Soil Biol. 2024, 123, 103695. [Google Scholar] [CrossRef] [Scilit]
  16. Liu, Y.; Ge, T.; Zhu, Z.; Liu, S.; Luo, Y.; Li, Y.; Wang, P.; Gavrichkova, O.; Xu, X.; Wang, J.; et al. Carbon input and allocation by rice into paddy soils: A review. Soil Biol. Biochem. 2019, 133, 97–107. [Google Scholar] [CrossRef] [Scilit]
  17. Zang, H.; Xiao, M.; Wang, Y.; Ling, N.; Wu, J.; Ge, T.; Kuzyakov, Y. Allocation of assimilated carbon in paddies depending on rice age, chase period and N fertilization: Experiment with 13CO2 labelling and literature synthesis. Plant Soil 2019, 445, 113–123. [Google Scholar] [CrossRef] [Scilit]
  18. Freeman, C.; Ostle, N.; Kang, H. An enzymic ’latch’ on a global carbon store. Nature 2001, 409, 149. [Google Scholar] [CrossRef] [Scilit] [PubMed]
  19. Kemmitt, S.J.; Lanyon, C.V.; Waite, I.S.; Wen, Q.; Addiscott, T.M.; Bird, N.R.A.; O’Donnell, A.G.; Brookes, P.C. Mineralization of native soil organic matter is not regulated by the size, activity or composition of the soil microbial biomass—a new perspective. Soil Biol. Biochem. 2008, 40, 61–73. [Google Scholar] [CrossRef] [Scilit]
  20. Li, Y.; Shahbaz, M.; Zhu, Z.; Deng, Y.; Tong, Y.; Chen, L.; Wu, J.; Ge, T. Oxygen availability determines key regulators in soil organic carbon mineralisation in paddy soils. Soil Biol. Biochem. 2021, 153, 108106. [Google Scholar] [CrossRef] [Scilit]
  21. Li, Y.; Wang, J.; Pan, F.; Chapman, S.J.; Yao, H. Soil nitrogen availability alters rhizodeposition carbon flux into the soil microbial community. J. Soils Sediments 2016, 16, 1472–1480. [Google Scholar] [CrossRef] [Scilit]
  22. Bao, Y.; Dolfing, J.; Wang, B.; Chen, R.; Huang, M.; Li, Z.; Lin, X.; Feng, Y. Bacterial communities involved directly or indirectly in the anaerobic degradation of cellulose. Biol. Fertil. Soils. 2019, 55, 201–211. [Google Scholar] [CrossRef] [Scilit]
  23. Li, Y.; Zhang, S.; Fang, Y.; Hui, D.; Tang, C.; Van Zwieten, L.; Zhou, J.; Jiang, Z.; Cai, Y.; Yu, B.; et al. Nitrogen deposition-induced stimulation of soil heterotrophic respiration is counteracted by biochar in a subtropical forest. Agric. For. Meteorol. 2024, 349, 109940. [Google Scholar] [CrossRef] [Scilit]
  24. Bao, Y.; Dolfing, J.; Li, X.; Chen, R.; Cui, X.; Li, Z.; Lin, X.; Feng, Y. Bacterial interference competition and environmental filtering reduce the fungal taxonomic and functional contribution to plant residue decomposition in anoxic paddy soils. Soil Tillage Res. 2024, 236, 105938. [Google Scholar] [CrossRef] [Scilit]
  25. Datta, R. Enzymatic degradation of cellulose in soil: A review. Heliyon 2024, 10, e24022. [Google Scholar] [CrossRef] [Scilit] [PubMed]
  26. Eichorst, S.A.; Kuske, C.R. Identification of cellulose-responsive bacterial and fungal communities in geographically and edaphically different soils by using stable isotope probing. Appl. Environ. Microbiol. 2012, 78, 2316–2327. [Google Scholar] [CrossRef] [Scilit] [PubMed]
  27. Fontaine, S.; Bardoux, G.; Benest, D.; Verdier, B.; Mariotti, A.; Abbadie, L. Mechanisms of the priming effect in a savannah soil amended with cellulose. Soil Sci. Soc. Am. J. 2004, 68, 125–131. [Google Scholar] [CrossRef]
  28. Jones, D.L.; Nguyen, C.; Finlay, R.D. Carbon flow in the rhizosphere: Carbon trading at the soil–root interface. Plant Soil 2009, 321, 5–33. [Google Scholar] [CrossRef] [Scilit]
  29. Zhu, Z.; Ge, T.; Xiao, M.; Yuan, H.; Wang, T.; Liu, S.; Atere, C.T.; Wu, J.; Kuzyakov, Y. Belowground carbon allocation and dynamics under rice cultivation depends on soil organic matter content. Plant Soil 2017, 410, 247–258. [Google Scholar] [CrossRef] [Scilit]
  30. Ge, T.; Li, B.; Zhu, Z.; Hu, Y.; Yuan, H.; Dorodnikov, M.; Jones, D.L.; Wu, J.; Kuzyakov, Y. Rice rhizodeposition and its utilization by microbial groups depends on N fertilization. Biol. Fertil. Soils. 2016, 53, 37–48. [Google Scholar] [CrossRef] [Scilit]
  31. Wu, W.; Liu, W.; Lu, H.; Chen, Y.; Medha, D.; Janice, T. Use of 13C labeling to assess carbon partitioning in transgenic and nontransgenic (parental) rice and their rhizosphere soil microbial communities. FEMS Microbiol. Ecol. 2009, 67, 93–102. [Google Scholar] [CrossRef] [Scilit] [PubMed]
  32. Xiao, M.; Zang, H.; Liu, S.; Ye, R.; Zhu, Z.; Su, Y.; Wu, J.; Ge, T. Nitrogen fertilization alters the distribution and fates of photosynthesized carbon in rice–soil systems: A 13C-CO2 pulse labeling study. Plant Soil 2019, 445, 101–112. [Google Scholar] [CrossRef] [Scilit]
  33. Zhao, Z.; Ge, T.; Gunina, A.; Li, Y.; Zhu, Z.; Peng, P.; Wu, J.; Kuzyakov, Y. Carbon and nitrogen availability in paddy soil affects rice photosynthate allocation, microbial community composition, and priming: Combining continuous 13C labeling with PLFA analysis. Plant Soil 2019, 445, 137–152. [Google Scholar] [CrossRef] [Scilit]
  34. Joergensen, R.G. Phospholipid fatty acids in soil—drawbacks and future prospects. Biol. Fertil. Soils 2022, 58, 1–6. [Google Scholar] [CrossRef] [Scilit]
  35. Kim, N.; Park, H.; He, N.; Lee, H.Y.; Yoon, S.Q. Canvas: An advanced tool for data clustering and visualization of genomics data. Genom. Inform. 2012, 10, 263–265. [Google Scholar] [CrossRef] [Scilit] [PubMed]
  36. Ge, T.; Liu, C.; Yuan, H.; Zhao, Z.; Wu, X.; Zhu, Z.; Brookes, P.; Wu, J. Tracking the photosynthesized carbon input into soil organic carbon pools in a rice soil fertilized with nitrogen. Plant Soil 2015, 392, 17–25. [Google Scholar] [CrossRef] [Scilit]
  37. Guenet, B.; Juarez, S.; Bardoux, G.; Abbadie, L.; Chenu, C. Evidence that stable C is as vulnerable to priming effect as is more labile C in soil. Soil Biol. Biochem. 2012, 52, 43–48. [Google Scholar] [CrossRef] [Scilit]
  38. Kuzyakov, Y.; Xu, X. Competition between roots and microorganisms for nitrogen: Mechanisms and ecological relevance. New Phytol. 2013, 198, 656–669. [Google Scholar] [CrossRef] [Scilit] [PubMed]
  39. Pan, G.; Zhou, P.; Li, Z.; Smith, P.; Li, L.; Qiu, D.; Zhang, X.; Xu, X.; Shen, S.; Chen, X. Combined inorganic/organic fertilization enhances N efficiency and increases rice productivity through organic carbon accumulation in a rice paddy from the Tai Lake region, China. Agric. Ecosyst. Environ. 2009, 131, 274–280. [Google Scholar] [CrossRef] [Scilit]
  40. Gök, M.; Ottow, J.C.G. Effect of cellulose and straw incorporation in soil on total denitrification and nitrogen immobilization at initially aerobic and permanent anaerobic conditions. Biol. Fertil. Soils. 1988, 5, 317–322. [Google Scholar] [CrossRef] [Scilit]
  41. Vinten, A.J.; Whitmore, A.; Bloem, J.; Howard, R.; Wright, F. Factors affecting N immobilisation/mineralisation kinetics for cellulose-, glucose- and straw-amended sandy soils. Biol. Fertil. Soils. 2002, 36, 190–199. [Google Scholar] [CrossRef] [Scilit]
  42. Blagodatskaya, E.; Kuzyakov, Y. Active microorganisms in soil: Critical review of estimation criteria and approaches. Soil Biol. Biochem. 2013, 67, 192–211. [Google Scholar] [CrossRef] [Scilit]
  43. Endress, M.G.; Blagodatsky, S. Bioenergetics of microbial maintenance metabolism in soil. Soil Biol. Biochem. 2026, 216, 110124. [Google Scholar] [CrossRef] [Scilit]
  44. Rosinger, C.; Keiblinger, K.M.; Ousk, J.; Sandén, H. Shifts in microbial stoichiometry upon nutrient addition do not capture growth-limiting nutrients for soil microorganisms in two subtropical soils. Biogeochemistry 2022, 159, 33–43. [Google Scholar] [CrossRef] [Scilit]
  45. Zhu, Z.; Ge, T.; Luo, Y.; Liu, S.; Xu, X.; Tong, C.; Shibistova, O.; Guggenberger, G.; Wu, J. Microbial stoichiometric flexibility regulates rice straw mineralization and its priming effect in paddy soil. Soil Biol. Biochem. 2018, 121, 67–76. [Google Scholar] [CrossRef] [Scilit]
  46. Schimel, J.P.; Bennett, J. Nitrogen mineralization: Challenges of a changing paradigm. Ecology 2004, 85, 591–602. [Google Scholar] [CrossRef] [Scilit]
  47. Bao, Y.; Dolfing, J.; Guo, Z.; Chen, R.; Wu, M.; Li, Z.; Lin, X.; Feng, Y. Important ecophysiological roles of non-dominant Actinobacteria in plant residue decomposition, especially in less fertile soils. Microbiome 2021, 9, 84. [Google Scholar] [CrossRef] [Scilit] [PubMed]
  48. Kuzyakov, Y. Review: Factors affecting rhizosphere priming effects. J. Plant Nutr. Soil Sci. 2002, 165, 382–396. [Google Scholar] [CrossRef] [Scilit]
  49. Ramirez, K.S.; Craine, J.M.; Fierer, N. Consistent effects of nitrogen amendments on soil microbial communities and processes across biomes. Glob. Change Biol. 2012, 18, 1918–1927. [Google Scholar] [CrossRef] [Scilit]
  50. Treseder, K.K. Nitrogen additions and microbial biomass: A meta-analysis of ecosystem studies. Ecol. Lett. 2008, 11, 1111–1120. [Google Scholar] [CrossRef] [Scilit] [PubMed]
  51. Feng, X.; Qin, S.; Zhang, D.; Chen, P.; Hu, J.; Wang, G.; Liu, Y.; Wei, B.; Li, Q.; Yang, Y.; et al. Nitrogen input enhances microbial carbon use efficiency by altering plant–microbe–mineral interactions. Glob. Change Biol. 2022, 28, 4845–4860. [Google Scholar] [CrossRef] [Scilit] [PubMed]
  52. Manzoni, S.; Taylor, P.; Richter, A.; Porporato, A.; Ågren, G.I. Environmental and stoichiometric controls on microbial carbon–use efficiency in soils. New Phytol. 2012, 196, 79–91. [Google Scholar] [CrossRef] [Scilit] [PubMed]
  53. Maarastawi, S.A.; Frindte, K.; Bodelier, P.L.E.; Knief, C. Rice straw serves as additional carbon source for rhizosphere microorganisms and reduces root exudate consumption. Soil Biol. Biochem. 2019, 135, 235–238. [Google Scholar] [CrossRef] [Scilit]
  54. Lu, X.; Hou, E.; Guo, J.; Gilliam, F.S.; Li, J.; Tang, S.; Kuang, Y. Nitrogen addition stimulates soil aggregation and enhances carbon storage in terrestrial ecosystems of China: A meta-analysis. Glob. Change Biol. 2021, 27, 2780–2792. [Google Scholar] [CrossRef] [Scilit] [PubMed]
  55. Blanco-Canqui, H.; Lal, R. Mechanisms of carbon sequestration in soil aggregates. Crit. Rev. Plant Sci. 2004, 23, 481–504. [Google Scholar] [CrossRef] [Scilit]
  56. Tisdall, J.M.; Oades, J.M. Organic matter and water-stable aggregates in soils. Eur. J. Soil Sci. 1982, 33, 141–163. [Google Scholar] [CrossRef] [Scilit]
  57. Olagoke, F.K.; Bettermann, A.; Nguyen, P.T.B.; Redmile-Gordon, M.; Babin, D.; Smalla, K.; Nesme, J.; Sørensen, S.J.; Kalbitz, K.; Vogel, C. Importance of substrate quality and clay content on microbial extracellular polymeric substances production and aggregate stability in soils. Biol. Fertil. Soils 2022, 58, 435–457. [Google Scholar] [CrossRef] [Scilit]
  58. Islam, M.R.; Singh, B.; Dijkstra, F.A. Stabilisation of soil organic matter: Interactions between clay and microbes. Biogeochemistry 2022, 160, 145–158. [Google Scholar] [CrossRef] [Scilit]
  59. Mizuta, K.; Taguchi, S.; Sato, S. Soil aggregate formation and stability induced by starch and cellulose. Soil Biol. Biochem. 2015, 87, 90–96. [Google Scholar] [CrossRef] [Scilit]
  60. Zhu, Z.; Zeng, G.; Ge, T.; Hu, Y.; Tong, C.; Shibistova, O.; He, X.; Wang, J.; Guggenberger, G.; Wu, J. Fate of rice shoot and root residues, rhizodeposits, and microbe-assimilated carbon in paddy soil – Part 1: Decomposition and priming effect. Biogeosciences 2016, 13, 4481–4489. [Google Scholar] [CrossRef] [Scilit]
  61. Luo, Y.; Xiao, M.; Yuan, H.; Liang, C.; Zhu, Z.; Xu, J.; Kuzyakov, Y.; Wu, J.; Ge, T.; Tang, C. Rice rhizodeposition promotes the build-up of organic carbon in soil via fungal necromass. Soil Biol. Biochem. 2021, 160, 108345. [Google Scholar] [CrossRef] [Scilit]
  62. Liang, C.; Amelung, W.; Lehmann, J.; Kastner, M. Quantitative assessment of microbial necromass contribution to soil organic matter. Glob. Change Biol. 2019, 25, 3578–3590. [Google Scholar] [CrossRef] [Scilit] [PubMed]
  63. Hu, J.; Du, M.; Chen, J.; Tie, L.; Zhou, S.; Buckeridge, K.M.; Cornelissen, J.H.C.; Huang, C.; Kuzyakov, Y. Microbial necromass under global change and implications for soil organic matter. Glob. Change Biol. 2023, 29, 3503–3515. [Google Scholar] [CrossRef] [Scilit] [PubMed]
  64. Wu, H.; Wan, S.; Ruan, C.; Wan, W.; Han, M.; Chen, G.; Liu, Y.; Zhu, K.; Liang, C.; Wang, G. Soil microbial necromass: The state-of-the-art, knowledge gaps, and future perspectives. Eur. J. Soil Biol. 2023, 115, 103472. [Google Scholar] [CrossRef] [Scilit]
  65. Wu, J.; Joergensen, R.G.; Pommerening, B.; Chaussod, R.; Brookes, P.C. Measurement of soil microbial biomass C by fumigation extraction—An automated procedure. Soil Biol. Biochem. 1990, 22, 1167–1169. [Google Scholar] [CrossRef] [Scilit]
  66. Luo, Y.; Zhu, Z.; Liu, S.; Peng, P.; Xu, J.; Brookes, P.; Ge, T.; Wu, J. Nitrogen fertilization increases rice rhizodeposition and its stabilization in soil aggregates and the humus fraction. Plant Soil 2019, 445, 125–135. [Google Scholar] [CrossRef] [Scilit]
  67. Atere, C.T.; Gunina, A.; Zhu, Z.; Xiao, M.; Liu, S.; Kuzyakov, Y.; Chen, L.; Deng, Y.; Wu, J.; Ge, T. Organic matter stabilization in aggregates and density fractions in paddy soil depending on long-term fertilization: Tracing of pathways by 13C natural abundance. Soil Biol. Biochem. 2020, 149, 107931. [Google Scholar] [CrossRef] [Scilit]
  68. Yao, H.Y.; Chapman, S.J.; Thornton, B.; Paterson, E. 13C PLFAs: A key to open the soil microbial black box? Plant Soil 2015, 392, 3–15. [Google Scholar] [CrossRef] [Scilit]
Figure 1. Dynamics of plant properties during the 39 days of 13CO2 continuous labeling. (a) Shoot biomass; (b) Root biomass; (c) Root/shoot ratio. Lines and symbols represent the following treatments: Control (no addition); +C (cellulose addition); +N (ammonium sulfate addition); +CN (combined cellulose and ammonium sulfate addition). Data points represent means and error bars represent standard errors (n = 3). Capital letters adjacent to the points represent significant differences (p < 0.05) between treatments on the same labeling day.
Agronomy 16 01755 g001
Figure 2. Dynamics of the aboveground and belowground rice 13C budget and microbial utilization of rhizodeposits during the 39 days of 13CO2 continuous labeling. (a) Percentage of 13C recovery in shoots; (b) Percentage of 13C recovery in roots; (c) Percentage of 13C recovery in soil (total 13C in soil excluding 13C in MBC and DOC); (d) Percentage of 13C recovery in DOC; (e) Percentage of 13C recovery in MBC; (f) Percentage of 13C-PLFA in 13C-MBC. Lines and symbols represent the following treatments: Control (no addition); +C (cellulose addition); +N (ammonium sulfate addition); +CN (combined cellulose and ammonium sulfate addition). Data points represent means and error bars represent standard errors (n = 3). Capital letters adjacent to the points represent significant differences (p < 0.05) between treatments on the same labeling day.
Agronomy 16 01755 g002
Figure 3. Percentage of C and 13C in different soil aggregates. (a) Percentage of C in macro-aggregates (>0.25 mm); (b) Percentage of C in meso-aggregates (0.25–0.053 mm); (c) Percentage of C in micro-aggregates (<0.053 mm); (d) Percentage of 13C in macro-aggregates (>0.25 mm); (e) Percentage of 13C in meso-aggregates (0.25–0.053 mm); (f) Percentage of 13C in micro-aggregates (<0.053 mm). Data points represent means, and error bars indicate standard errors (n = 3). Capital letters adjacent to the points represent significant differences (p < 0.05) between treatments on the same labeling day.
Agronomy 16 01755 g003
Figure 4. Redundancy analysis of 13C-PLFA biomarkers across all five labeling days (1, 5, 10, 25, and 39). Symbols represent the following treatments: Control (no addition); +C (cellulose addition); +N (ammonium sulfate addition); +CN (combined cellulose and ammonium sulfate addition). Numbers before the dashes indicate labeling days (1, 5, 10, 25, and 39), while those after the dashes indicate replicates of each labeling day (1, 2, and 3); The black dashed arrows represent environmental variables. The red arrows indicate the directions of fertilization and time effects. The percentages indicate the explained fitted variation along axes 1 and 2, respectively (49% and 32%).
Agronomy 16 01755 g004
Figure 5. Hierarchical clustering of 13C PLFA biomarkers. The heat map shows the relative amount of 13C PLFA biomarkers in each treatment. Each colored square of the 13C-PLFA biomarkers indicates the relative percentage in each treatment: relative percentage = amount of each 13C-PLFA biomarker/total amount of 13C-PLFA biomarkers in each treatment × 100. Color bar: row min and row max represent the lowest and highest relative percentages of 13C-PLFA biomarkers in each treatment, respectively. The hierarchical clustering on the right side shows the treatment groups with similar compositions of 13C-PLFA biomarkers (Control, +C, +N, and +CN treatments). The black branching lines on the right form a hierarchical clustering dendrogram, grouping treatments with similar compositions of 13C-PLFA biomarkers (Control, +C, +N, and +CN treatments). Control: no addition; +C, cellulose addition; +N, ammonium sulfate addition; +CN, combined cellulose and ammonium sulfate addition. Black ovals show the dominant biomarkers in each clustering branch. Numbers after the letter D (day) indicate labeling days (1, 5, 10, 25, and 39).
Agronomy 16 01755 g005
Figure 6. Changes in 13C PLFA content (number of times) standardized to the Control (unfertilized soil) after 39 days of continuous 13CO2 labeling. Difference = (Treatment13C-PLFA-Control13C-PLFA) / Control13C-PLFA. Colors and letters represent the following microbial groups: G+ (Gram-positive); G− (Gram-negative); AMF (arbuscular mycorrhizal fungi); fungi; anaerobes; and actinomycetes. Letters on the x-axis represent the following fertilization treatments: +C, cellulose addition; +N, ammonium sulfate addition; +CN, combined cellulose and ammonium sulfate addition. Each column represents the means of differences relative to the Control (n = 3). Capital letters adjacent to the columns represent significant differences (p < 0.05) between different microbial 13C-PLFA groups within the same treatment.
Agronomy 16 01755 g006
Figure 7. Conceptual diagram of the incorporation of photosynthesized C in the plant–soil system during 39 days of 13CO2 continuous labeling. Numbers under each arrow represent 13C recovery in roots, soil, and microorganisms (%) in the four treatments.
Agronomy 16 01755 g007
Disclaimer/Publisher’s Note: The statements, opinions and data contained in all publications are solely those of the individual author(s) and contributor(s) and not of MDPI and/or the editor(s). MDPI and/or the editor(s) disclaim responsibility for any injury to people or property resulting from any ideas, methods, instructions or products referred to in the content.