Article

Regulation of Soil Water–Salt Dynamics and Cotton Growth in Saline Cotton Fields Through Optimization of Drip Emitter Parameters and Irrigation Quotas


1
Institute of Agricultural Resources and Environment, Xinjiang Academy of Agricultural Sciences, Urumqi 830091, China
2
Department of Hydraulic Engineering, Tsinghua University, Beijing 100084, China
3
College of Hydraulic and Civil Engineering, Xinjiang Agricultural University, Urumqi 830052, China
*
Author to whom correspondence should be addressed.
Agronomy 2026, 16(17), 1730; https://doi.org/10.3390/agronomy16171730 (registering DOI)
Submission received: 29 July 2026 / Revised: 1 September 2026 / Accepted: 2 September 2026 / Published: 5 September 2026
(This article belongs to the Section Water Use and Irrigation)

Abstract

Soil salinization constrains cotton production in arid regions, making the optimization of water and salt regulation in drip irrigation systems crucial for enhancing water use efficiency and yield in saline cotton fields. This study aimed to evaluate the synergistic effects of emitter parameters and irrigation quotas on water–salt regulation and cotton growth in a salinized field. Treatments included conventional and leaching irrigation quotas, combined with emitter flow rates of 1.4–3.0 L/h and emitter spacings of 20–30 cm. Soil water–salt dynamics, cotton growth, and yield responses were monitored. The results indicated that the irrigation quota was the dominant factor regulating root-zone water retention and salt leaching, with leaching quotas significantly enhancing soil moisture and desalination compared to conventional quotas. Emitter parameters significantly modulated water and salt distribution. A moderate flow rate of 2.4 L/h combined with a 30 cm spacing created more uniform soil moisture distribution and more efficient salt leaching within the root zone. Cotton growth and yield responded markedly to this water–salt regulation pattern. The combination of a 2.4 L/h flow rate, 30 cm spacing, and the leaching quota achieved the highest seed cotton yield of 6343.12 kg/hm2. However, increasing the total seasonal irrigation quota reduced irrigation water productivity from 1.26 kg/m3 to 0.97 kg/m3. Based on the experimental data, optimization models for yield and salt leaching index were constructed and used for prediction. The model-predicted parameter combination for theoretical reference was an emitter discharge rate of 2.1–2.4 L/h, a spacing of 30 cm, and a per-application irrigation quota of 60–66 mm, with a predicted yield of 6356.68 kg/hm2 and a salt leaching index of 6.48. This study provides a quantitative basis for optimizing drip irrigation system parameters and the management of water and salt in saline cotton fields in the arid region of Xinjiang.

1. Introduction

Soil salinization is one of the primary constraints to agricultural production in arid regions. Particularly in cotton cultivation areas, salt stress severely hampers crop water uptake and physiological metabolism, leading to reduced yield and decreased resource use efficiency [1,2]. Xinjiang, a crucial cotton production base in China, accounted for 83.5% of the national cotton sowing area and 91.0% of the total output in 2023. The region is characterized by widespread saline soils, with salinized arable land constituting approximately 37.72% of the total cultivated area. The scarcity of freshwater resources and extensive secondary salinization of arable land significantly constrain the sustainable development of agriculture in Xinjiang [3,4].
Xinjiang has become one of the world’s most successful regions for the application of field drip irrigation technology. Since its introduction in 1996, drip irrigation has been combined with plastic film mulching to form mulch-drip irrigation, which has demonstrated favorable application outcomes [5,6]. However, conventional water quotas under water-saving irrigation often insufficiently consider salt leaching in the root zone. Intensive evaporation in arid areas leads to the continuous accumulation of salts in the root zone during the cotton growing season, resulting in the issue of secondary soil salinization associated with water-saving irrigation [7,8]. Currently, traditional salt-leaching winter and spring irrigation has been largely abandoned in northern Xinjiang, and irrigation quotas for winter and spring are being progressively reduced in southern Xinjiang. This has further exacerbated soil salinization in mulch-drip irrigated cotton fields across Xinjiang [9,10]. Consequently, achieving coordinated regulation of water and salt through irrigation management during the cotton growing period has become a key issue for ensuring sustainable cotton production in this region [11,12]. During the cotton growing season, mulch-drip irrigation must not only meet crop water requirements but also facilitate salt leaching and desalination in the root zone, thereby creating a favorable hydro-saline environment for cotton growth [13,14].
Nevertheless, in salinized cotton fields, reliance solely on water-saving irrigation is often inadequate for effectively mitigating salt accumulation in the root zone. Insufficient irrigation may even lead to salt concentration in the root layer, exacerbating salt stress [15,16]. Therefore, the key to achieving high yield and high efficiency of cotton in saline–alkali lands lies in the coordinated regulation of water and salt dynamics under drip irrigation. This involves optimizing irrigation schedules and emitter parameters to simultaneously satisfy crop water demand and promote salt leaching in the root zone [17,18]. Currently, some studies have investigated the effects of parameters such as irrigation quota, emitter discharge rate, and emitter spacing on soil water–salt movement and crop growth [19]. However, most of these studies have focused on the leaching quota, cycle, or frequency of surface irrigation with large water volumes during winter and spring, or have analyzed the effects of single factors such as emitter parameters or irrigation quotas on soil water–salt dynamics during the cotton growing season. Systematic research on the synergistic regulation combining conventional water quotas or drip irrigation root-zone leaching quotas with drip irrigation technical parameters remains limited [20,21]. Therefore, it is necessary to rationally select irrigation quota, emitter discharge rate, and emitter spacing to simultaneously satisfy cotton growth requirements and control root-zone salinity during the growing season. The optimal combination patterns for cotton production in typical saline–alkali soil regions remain unclear, which restricts the full potential of drip irrigation technology in such areas [22].
Based on this, a two-year field experiment was conducted in a typical salinized cotton field in Karamay, Xinjiang. The specific objectives of this study were: (i) to quantify the effects of different combinations of drip irrigation parameters (emitter discharge rate, emitter spacing, and irrigation quota) on soil water–salt dynamics across cotton growth stages; (ii) to evaluate the responses of cotton growth, physiology, and yield formation to these parameter combinations; and (iii) to develop an optimization framework for drip irrigation parameters based on yield and salt leaching index, and to identify suitable parameter combinations for water–salt regulation in saline cotton fields. The findings are expected to provide a theoretical basis and technical pathway for the design optimization of drip irrigation systems and the coordinated management of water and salt in cotton production in arid saline–alkali regions. The results may also offer scientific reference for water-saving, salt control, productivity enhancement, and sustainable development of cotton production in arid regions similar to Xinjiang.

2. Materials and Methods

2.1. Experimental Site Description

The field experiment was conducted from 2022 to 2023 in the Agricultural Comprehensive Development Zone of Karamay City, Xinjiang, China (84°55′ E, 45°27′ N; altitude 270 m above sea level). The experimental site is situated in the western part of the Junggar Basin. The region experiences a temperate continental arid desert climate characterized by scant precipitation and high daily evaporation. The mean annual temperature is 8.50 °C, with a long-term average precipitation of 109.50 mm. The annual potential evaporation is 3345.20 mm. The site receives a total annual solar radiation of 5430–6670 MJ/cm2 and enjoys 2600–3400 h of sunshine per year, with a frost-free period of approximately 190 days. The soil at the site had an average bulk density of 1.54 g/cm3 and an average field capacity (volumetric) of 24.78%. The average groundwater table depth was 1.65 m. The soil salt content of the experimental site ranged from 4.8 to 12.5 g/kg, with the electrical conductivity (EC) ranging from 3400 to 10,400 μS/cm. According to the salinity classification criteria (slightly saline: salt content 3.0–6.0 g/kg, EC 2000–4500 μS/cm; moderately saline: 6.0–12.0 g/kg, EC 4500–9900 μS/cm; severely saline: 12.0–20.0 g/kg, EC 9900–16,000 μS/cm), the soil was classified as moderately saline, dominated by sulfates and chlorides. A gravity-fed drip irrigation system was used for watering. Irrigation water was sourced from the West Suburban Reservoir of Karamay City, with a salinity level between 1.0 and 2.5 g/L. Detailed soil physical properties of the experimental site are summarized in Table 1.

2.2. Experimental Design

Two factors were considered in this experiment: irrigation quota and drip irrigation parameters including emitter discharge rate and spacing. The latter was treated as a single categorical factor, termed “emitter configuration,” representing the combined setting of discharge rate and spacing. Two levels of per-application irrigation quota were established: a conventional water quota based on crop water requirement and a root zone leaching quota (WL). The leaching quota was calculated using Equation (1). In 2022, the conventional and leaching per-application quotas were W52.5: 525 m3/hm2, and W75: 750 m3/hm2, respectively. In 2023, they were W52.5: 525 m3/hm2, and W70: 700 m3/hm2.
Four emitter configurations, which are commonly used in local cotton production, were tested. In 2022, these were T1.4×30: 1.4 L/h × 30 cm, T2.4×30: 2.4 L/h × 30 cm, T3.0×30: 3.0 L/h × 30 cm, and T3.0×20: 3.0 L/h × 20 cm. Based on the 2022 results, the configurations were optimized in 2023 to T1.4×20: 1.4 L/h × 20 cm, T2.0×30: 2.0 L/h × 30 cm, T2.4×30: 2.4 L/h × 30 cm, and T2.7×30: 2.7 L/h × 30 cm. The full combination of the two irrigation quotas and the four emitter configurations resulted in eight treatments for each year. Each treatment was replicated three times, and the 24 experimental plots were arranged in a completely randomized design. Each plot measured 84.6 m2 (18 m long × 4.7 m wide). Since emitter configurations represent specific paired combinations of discharge rate and spacing rather than a full factorial design, the independent main effects of discharge rate or spacing, as well as their interaction, are not estimated in this study. The experimental design is summarized in Table 2.
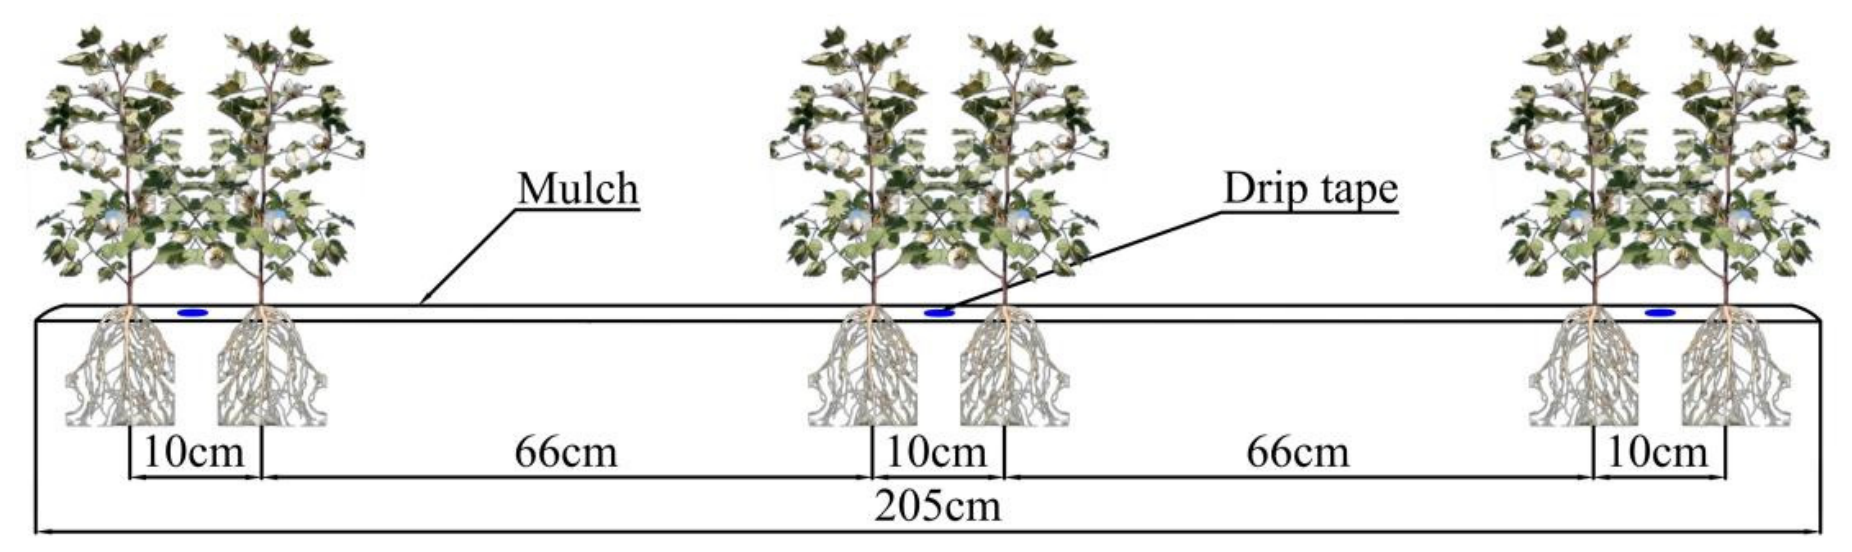
The cotton cultivar used was ‘Xinluzao 64’. Sowing was conducted in late April, with harvesting in early October. A machine-picked cotton planting pattern of one plastic film, three drip irrigation laterals, and six crop rows was employed. The pattern featured wide rows (66 cm), narrow rows (10 cm), and a bare soil width of 30 cm between films. Plant spacing was 10 cm, and lateral spacing was 76 cm. The drip irrigation laterals (16 mm diameter, with internal in-line emitters) were placed in the center of the narrow rows. The planting pattern is illustrated in Figure 1. A separate water meter and ball valve were installed for each treatment to control the irrigation quota precisely.
Irrigation commenced in early June after seedling emergence according to the assigned quotas and ceased in late August. The irrigation interval was approximately 10 days during the seedling and squaring stages and about 7 days during the flowering and boll-forming stage, resulting in 8–9 irrigation events per growing season. The total seasonal irrigation amounts in 2022 were 4125.0 m3/hm2 for W52.5 and 5925.0 m3/hm2 for W75. In 2023, the totals were 4125.0 m3/hm2 for W52.5 and 5631.8 m3/hm2 for W70. Fertilizer was applied at the local conventional rate (N-P2O5-K2O: 203-134-46 kg/hm2) and was split into eight applications delivered via fertigation. Pest control and other field management practices followed local standard protocols.
It should be noted that the 2022 and 2023 experiments were conducted as two consecutive but independent field trials. The emitter configurations were optimized in 2023 based on the 2022 findings, and the leaching quota was adjusted from W75: 750 m3/hm2 to W70: 700 m3/hm2 due to differences in initial soil salinity between the two years. Consequently, the treatment structures were not identical across the two years, and the data from 2022 and 2023 were analyzed separately rather than pooled as replicates of the same experiment.
The root zone salt leaching quota (WL) was calculated using the following formula:
W L = 10 γ H R D S 0 S 1 / K
where WL is the root zone salt leaching quota (mm), γ is the soil bulk density (g/cm3); HRD is the root zone depth (cm); S0 is the average soil salt content in the root zone before irrigation (g/kg); S1 is the salt tolerance threshold of cotton (g/kg); and K is the salt leaching coefficient, representing the amount of salt removed per unit volume of water (kg/m3).
In this study, the following parameter values were used for the leaching quota calculation: root zone depth HRD = 60 cm; average soil bulk density over the 0–60 cm root zone γ = 1.54 g/cm3; average initial soil salt content before irrigation S0 = 6.20 g/kg (2022) and 6.153 g/kg (2023); salt leaching coefficient K = 8.624 kg/m3; and cotton average salt tolerance threshold S1 = 5.50 g/kg.

2.3. Sample Collection and Measurement

2.3.1. Soil Volumetric Water Content and Electrical Conductivity

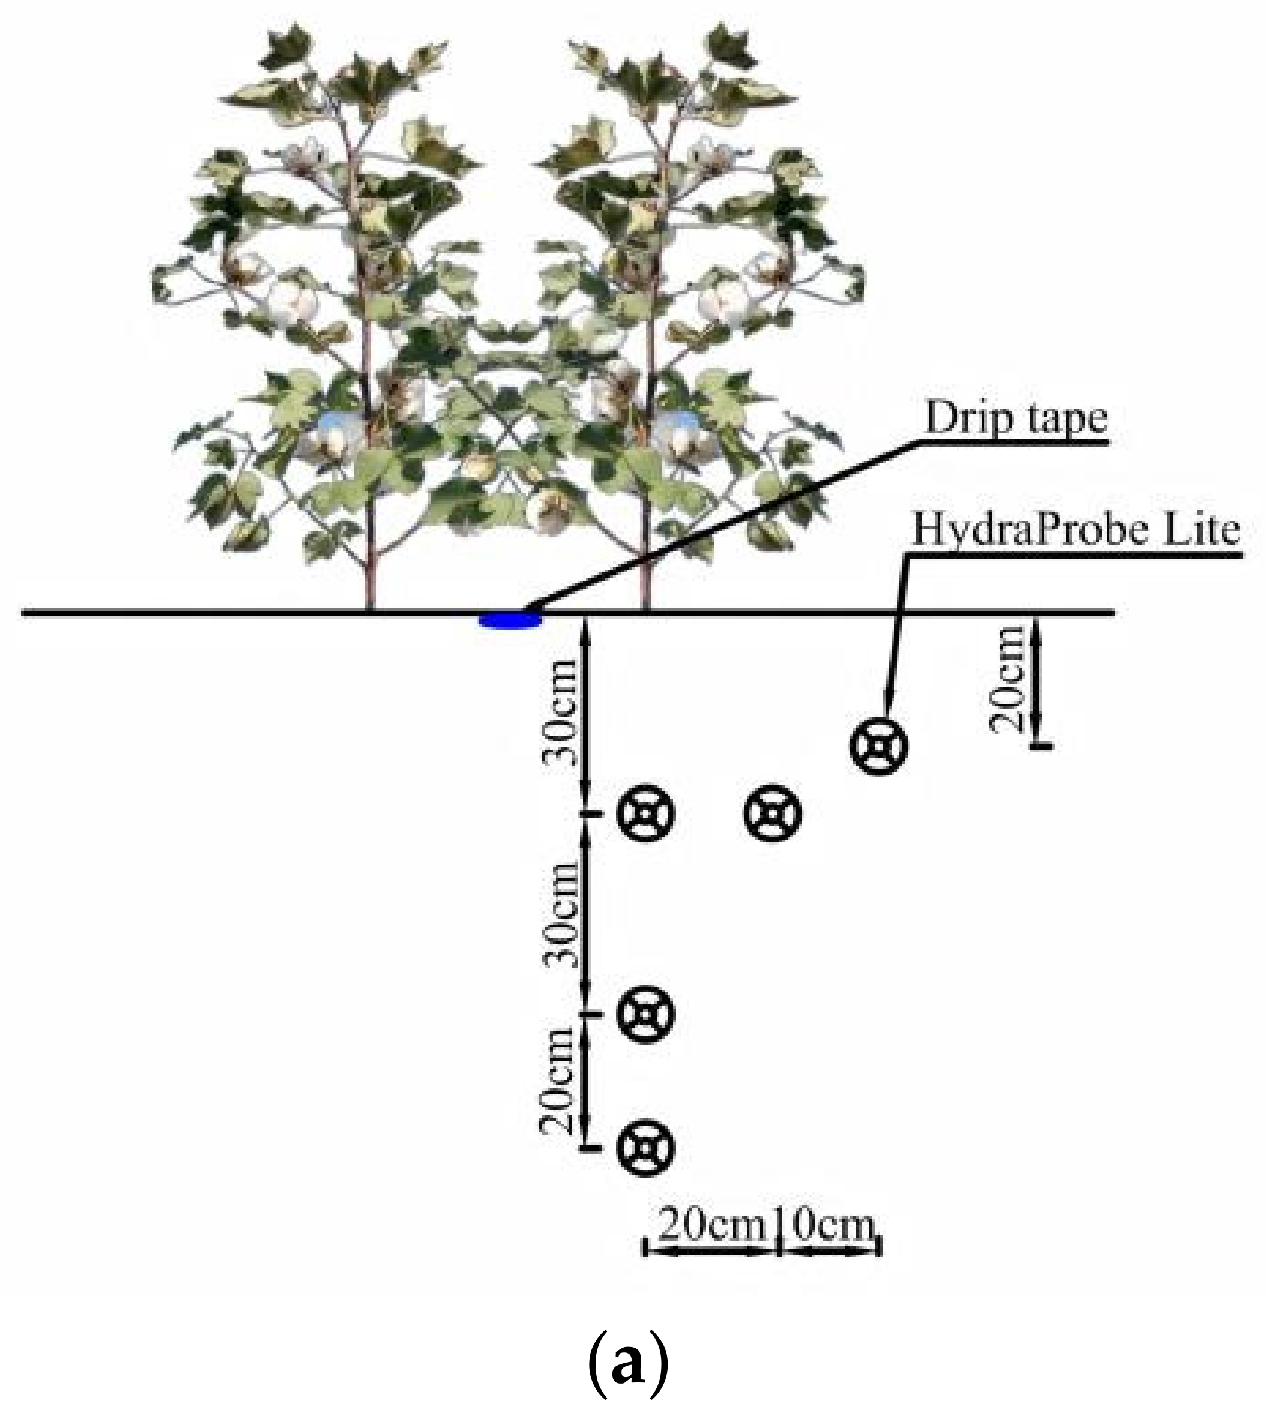
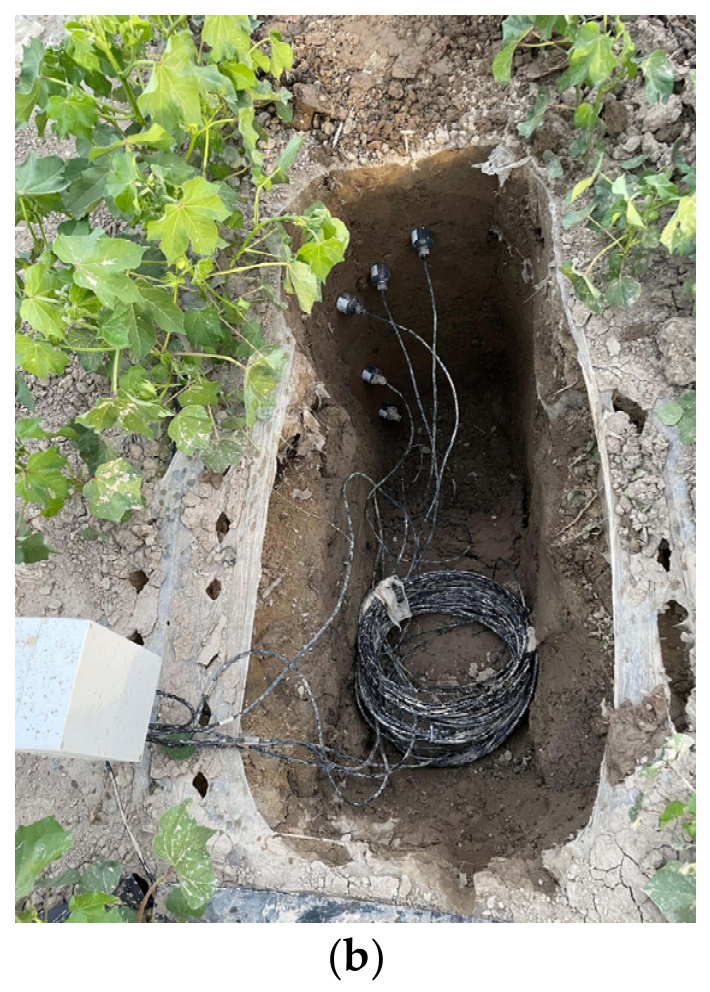
Soil volumetric water content (VWC) and electrical conductivity (EC) in the root zone were monitored using Hydra Probe Lite soil sensors (Stevens Water Monitoring Systems, Inc., Portland, OR, USA). Measurements were taken within the 0–80 cm soil depth and a horizontal distance of 0–30 cm from the emitter. Five sensors were installed in each of the three replicate plots per treatment, with the coordinate positions (horizontal, depth in cm) relative to the cotton plant base as follows: (0, 30), (0, 60), (0, 80), (30, 20), and (20, 30). For statistical analysis, readings from the five sensors within each plot were averaged to the plot level prior to further analysis, and the plot (n = 3 per treatment) was treated as the experimental unit for all statistical tests. The sensor installation is depicted in Figure 2.

2.3.2. Cotton Plant Height, Leaf Area Index, Dry Matter Weight and Yield

Cotton plant height, leaf area index (LAI), and aboveground dry matter weight were measured at the end of each major growth stage. Within each plot, three uniformly growing plants were randomly selected. Plant height was measured with a measuring tape. Leaf area was determined using the length-width coefficient method: for each sampled plant, the length (L) and maximum width (W) of all leaves were measured, and the area of an individual leaf was estimated as L × W × 0.7. The leaf area per plant was then calculated as the sum of all individual leaf areas. Leaf area index (LAI) was calculated as LAI = (leaf area per plant × plant number per unit land area)/unit land area. The aboveground parts of the sampled plants were then collected. These samples were placed in a forced-air oven at 105 °C for 30 min to deactivate enzymes, and subsequently dried at 75 °C until a constant weight was achieved to determine the dry matter weight.
At the boll-opening stage, three random quadrats, each measuring 6.67 m2 (2.84 m long × 2.35 m wide), were selected within each plot. The total number of effective bolls and the total number of plants within each quadrat were counted. The boll weight was measured, allowing for the calculation of the effective bolls per plant and the seed cotton yield per quadrat.

2.4. Soil Desalination Rate, Salt Leaching Index and Irrigation Water Productivity

The soil desalination rate (D, %) was calculated as follows:
D = E C 0 E C 1 / E C 0
where EC0 and EC1 are the soil electrical conductivity (μS/cm) before and after a specific time period, respectively.
Soil electrical conductivity was converted to total salt content (S, g/kg) using the following empirical relationship (R2 = 0.93):
S = 0.0011 E C + 1.0602
where EC is the soil electrical conductivity (μS/cm) at any given time.
The salt leaching index (E) was calculated using the formula:
E = Q / Δ M
where E is a dimensionless index representing the unit water consumption per unit salt leached. Q is the weight of irrigation water (kg), calculated as Q = q·ρ·A; q is the irrigation amount per unit area (m3/hm2); ρ is the density of irrigation water (kg/m3); A is the irrigated area (hm2). ΔM is the change in total salt mass within the target soil layer (kg), calculated as ΔM = M1M2; Mi represents the total salt mass in the target soil layer (kg), with M1 and M2 denoting the values before and after irrigation, respectively. M is calculated as M = γ·V·S; γ is the soil bulk density (g/cm3); V is the volume of the target soil layer (m3). In this study, the target layer dimensions were 30 cm in length, 30 cm in width, and 60 cm in depth, resulting in a volume (V) of 0.054 m3; S is the soil salt content (g/kg).
Irrigation water productivity (IWP, kg/m3) was determined as:
I W P = Y / I
where Y is the crop yield (kg/hm2) and I is the total seasonal irrigation amount (m3/hm2).

2.5. Data Analysis

Data analysis was performed using Microsoft Excel 2020 (Microsoft Corp., Redmond, WA, USA) and SPSS Statistics 26 (IBM Corp., Armonk, NY, USA). The statistical model used for each year’s analysis was a two-factor completely randomized design, with irrigation quota and emitter configuration as the two fixed factors. Because the experimental design was completely randomized, all effects were tested against a single residual error term; no separate whole-plot or sub-plot error terms were applicable. Data from 2022 and 2023 were analyzed separately, as the treatment structures differed between years, and therefore year was not included as a factor in the model. Analysis of variance (ANOVA) was conducted, and means were compared using the Least Significant Difference (LSD) test at significance levels of 0.05 and 0.01. Given the exploratory nature of this field study, LSD tests were used for pairwise comparisons to identify general treatment trends. Mean values presented in figures and tables represent the averages from three replicates. Figures were prepared using Origin 2024 (OriginLab Corp., Northampton, MA, USA) and AutoCAD 2016 (Autodesk, Inc., San Rafael, CA, USA) software.

3. Results

3.1. Soil Water and Salt Dynamic Response

3.1.1. Post-Irrigation Distribution of Soil Water and Salt

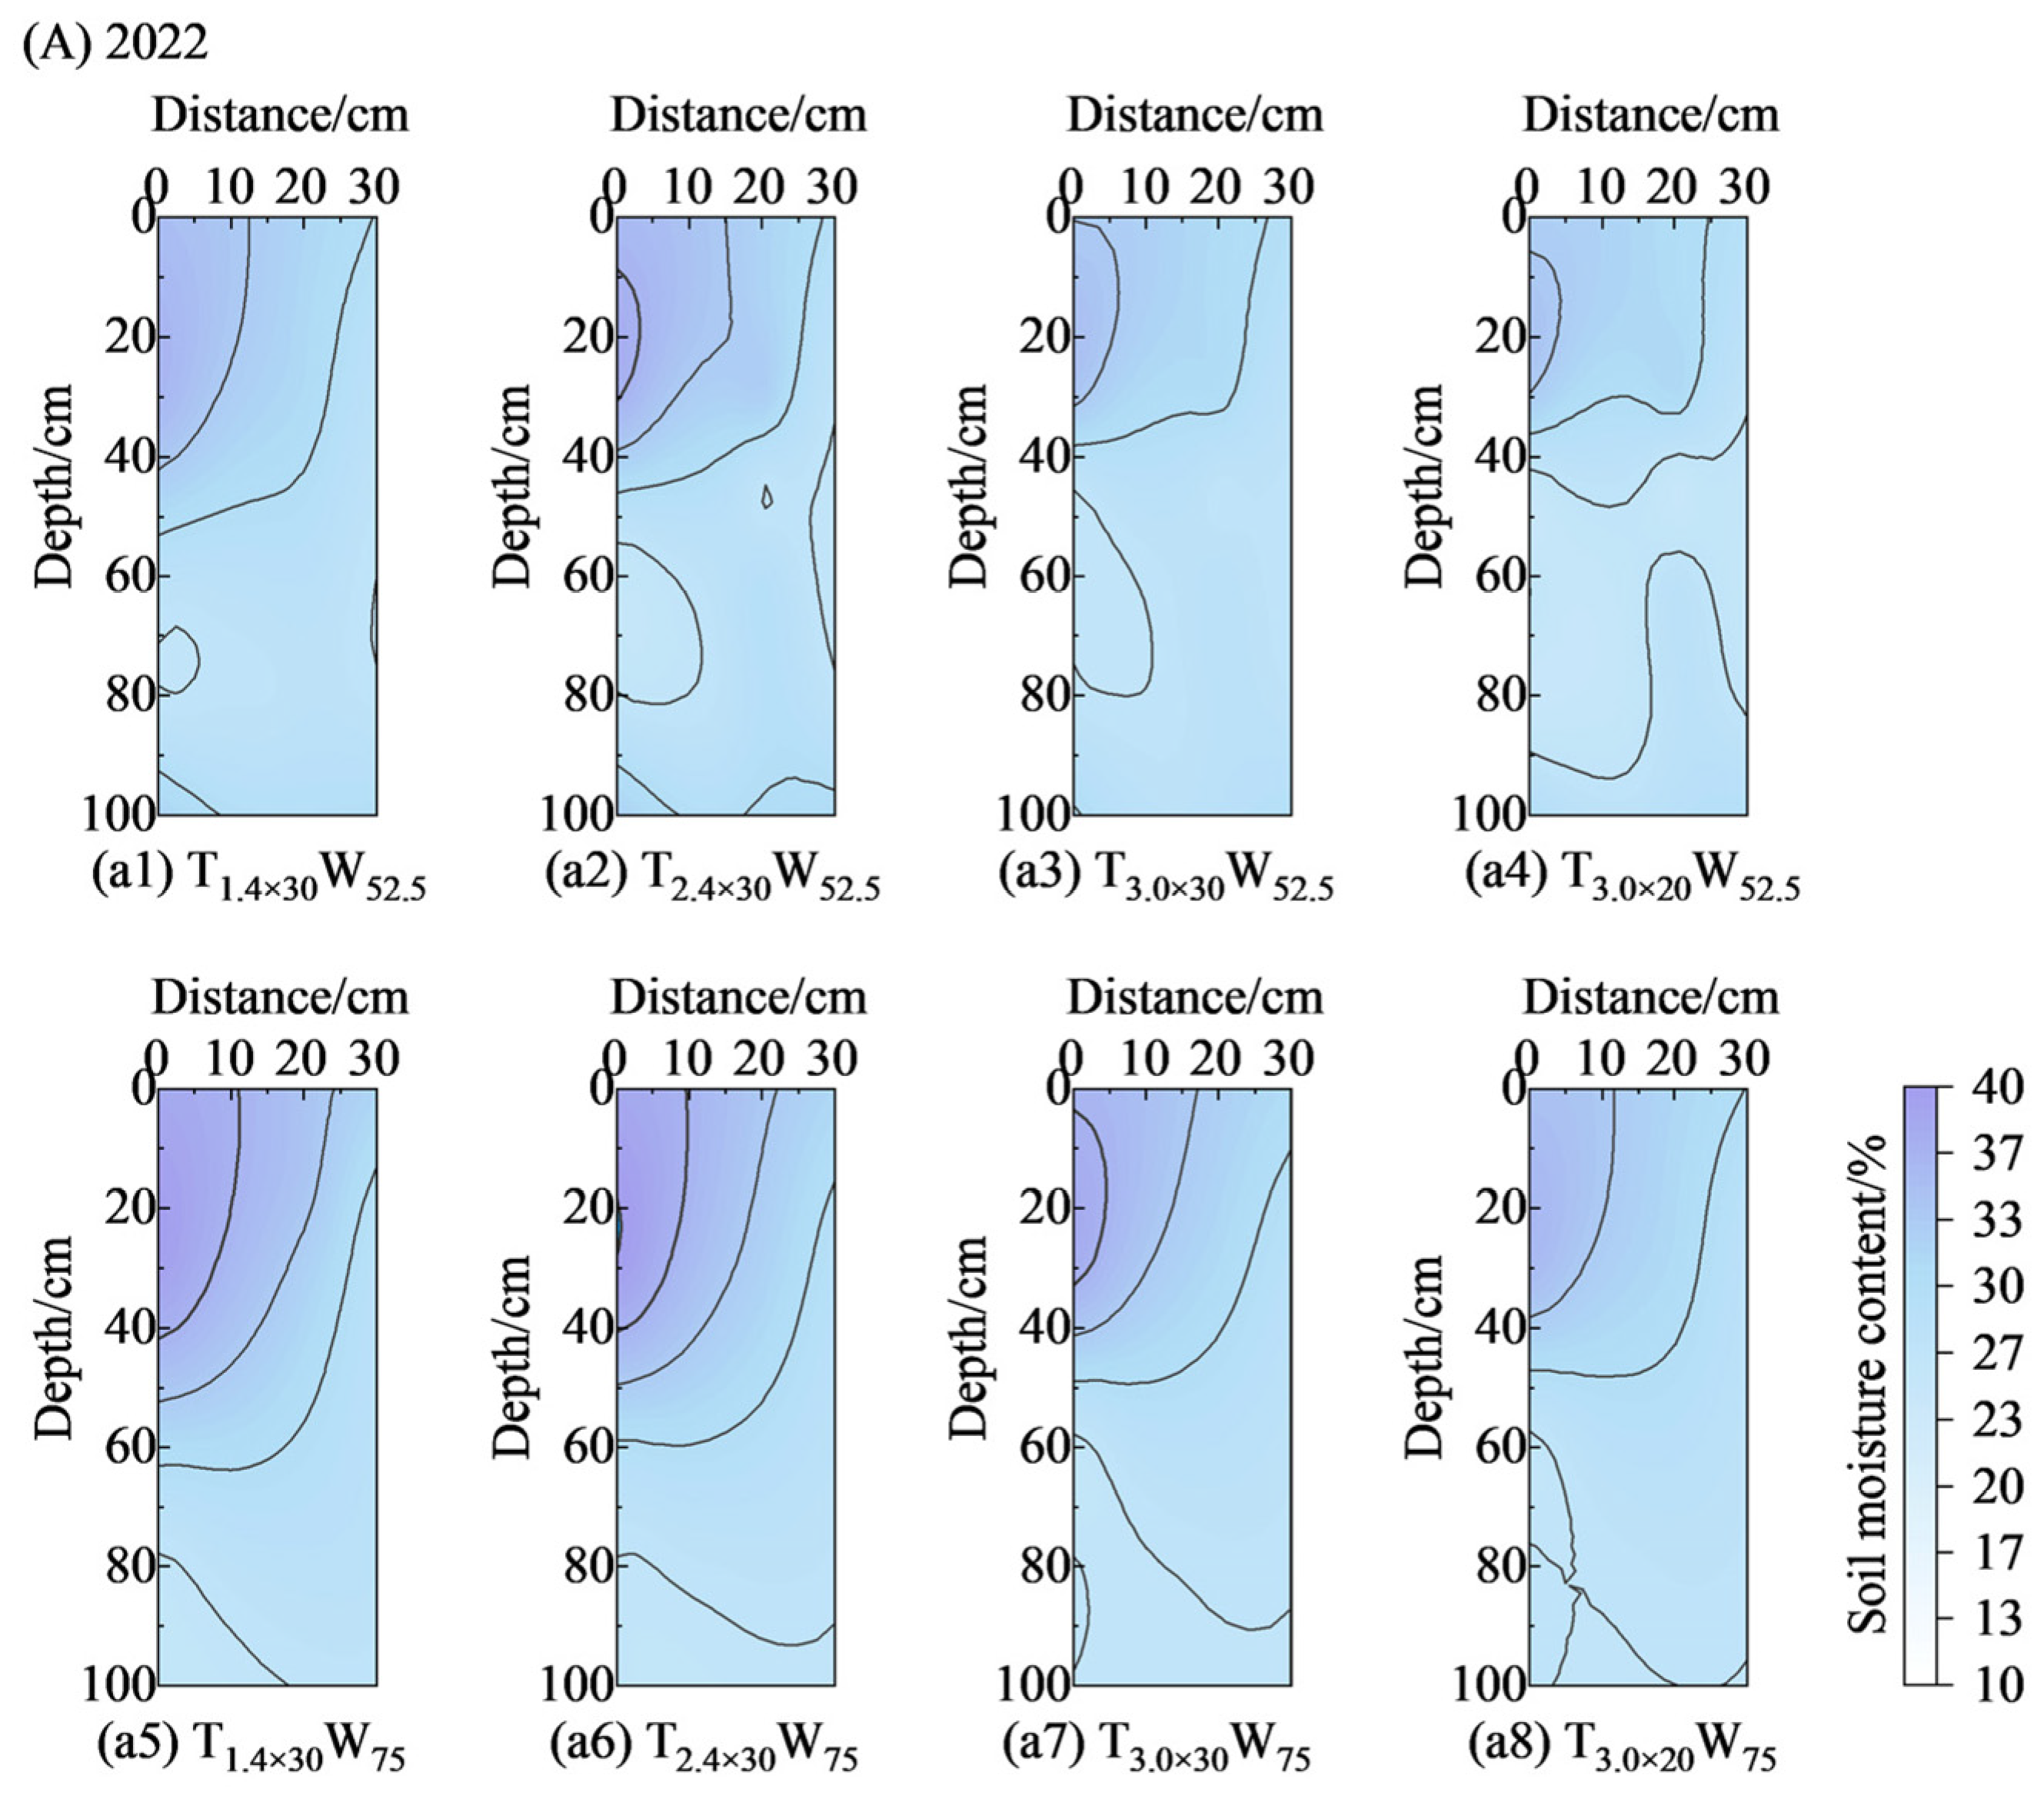
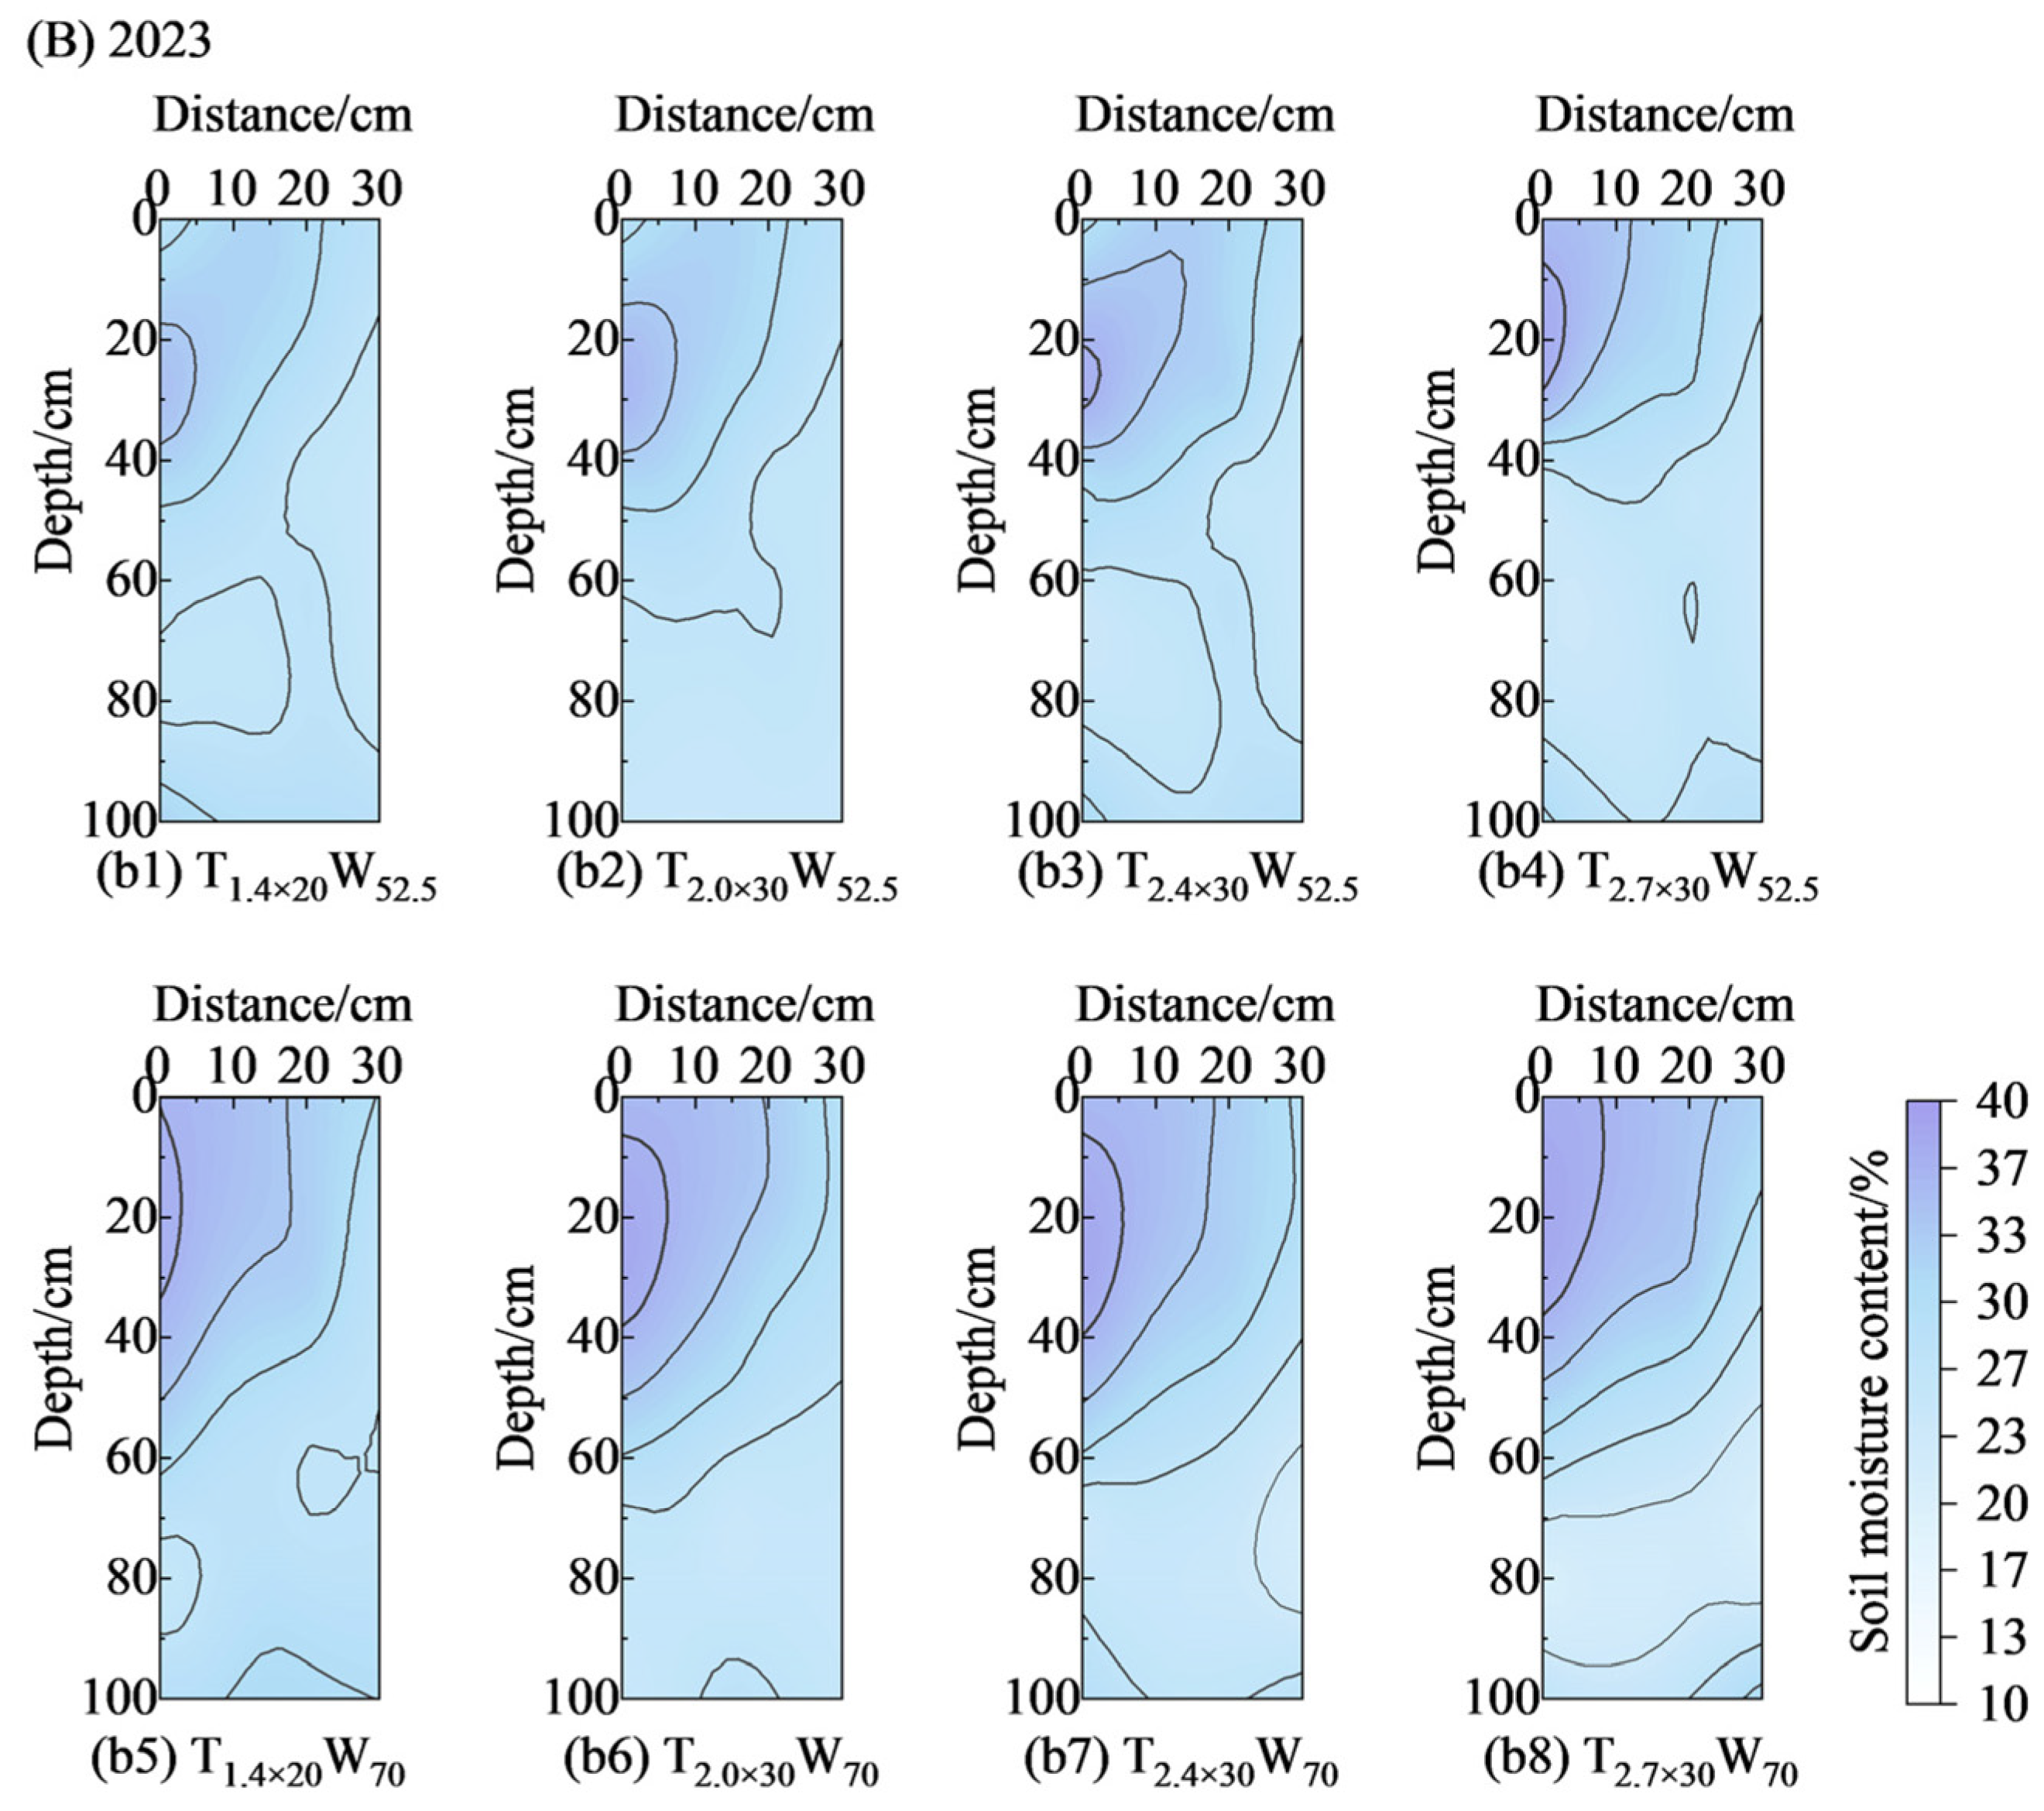
The distribution of soil volumetric water content (VWC) one day after irrigation during the flowering and boll-forming stage (Figure 3) indicated that the per-application irrigation quota was the primary factor influencing moisture distribution in the root zone. Under identical emitter parameter combinations, the average root zone VWC for the W75 treatment in 2022 was 3.60% to 6.55% higher than that of the W52.5 treatment (p < 0.05), with the vertical wetting depth increased by 6 to 15 cm. In 2023, the W70 treatment exhibited an 11.01% to 12.00% higher VWC and an 8 to 12 cm greater wetting depth compared to the W52.5 treatment. These results demonstrate that increasing the per-application irrigation quota significantly enhanced both soil water retention and the wetted volume within the root zone. It should be noted that the observed differences between irrigation quota treatments primarily reflect the overall effect of increased water input on soil moisture and salt leaching, since the irrigation quota was applied uniformly across all emitter configurations within each year.
Under a given per-application irrigation quota, emitter discharge rate exerted a significant regulatory effect on water distribution. Data from both years showed that root zone VWC initially increased and then decreased with increasing emitter discharge rate. The T2.4×30 treatment, with a moderate discharge rate, exhibited the most balanced moisture distribution and the highest water content. For instance, under the W52.5 quota in 2022, the VWC for T2.4×30 was 1.37% and 3.08% higher than that for T1.4×30 and T3.0×30 (p < 0.05), respectively. A similar trend was observed in 2023 under W52.5, where T2.4×30 showed a 1.59% and 1.87% higher VWC compared to T2.0×30 and T2.7×30, respectively. Comparing treatments with the same discharge rate but different spacing (T3.0×20 vs. T3.0×30), reducing the emitter spacing did not significantly affect the vertical wetting depth but slightly reduced the average root zone VWC by approximately 0.9–1.0%, indicating that overly dense emitter placement offered limited improvement in water distribution uniformity.
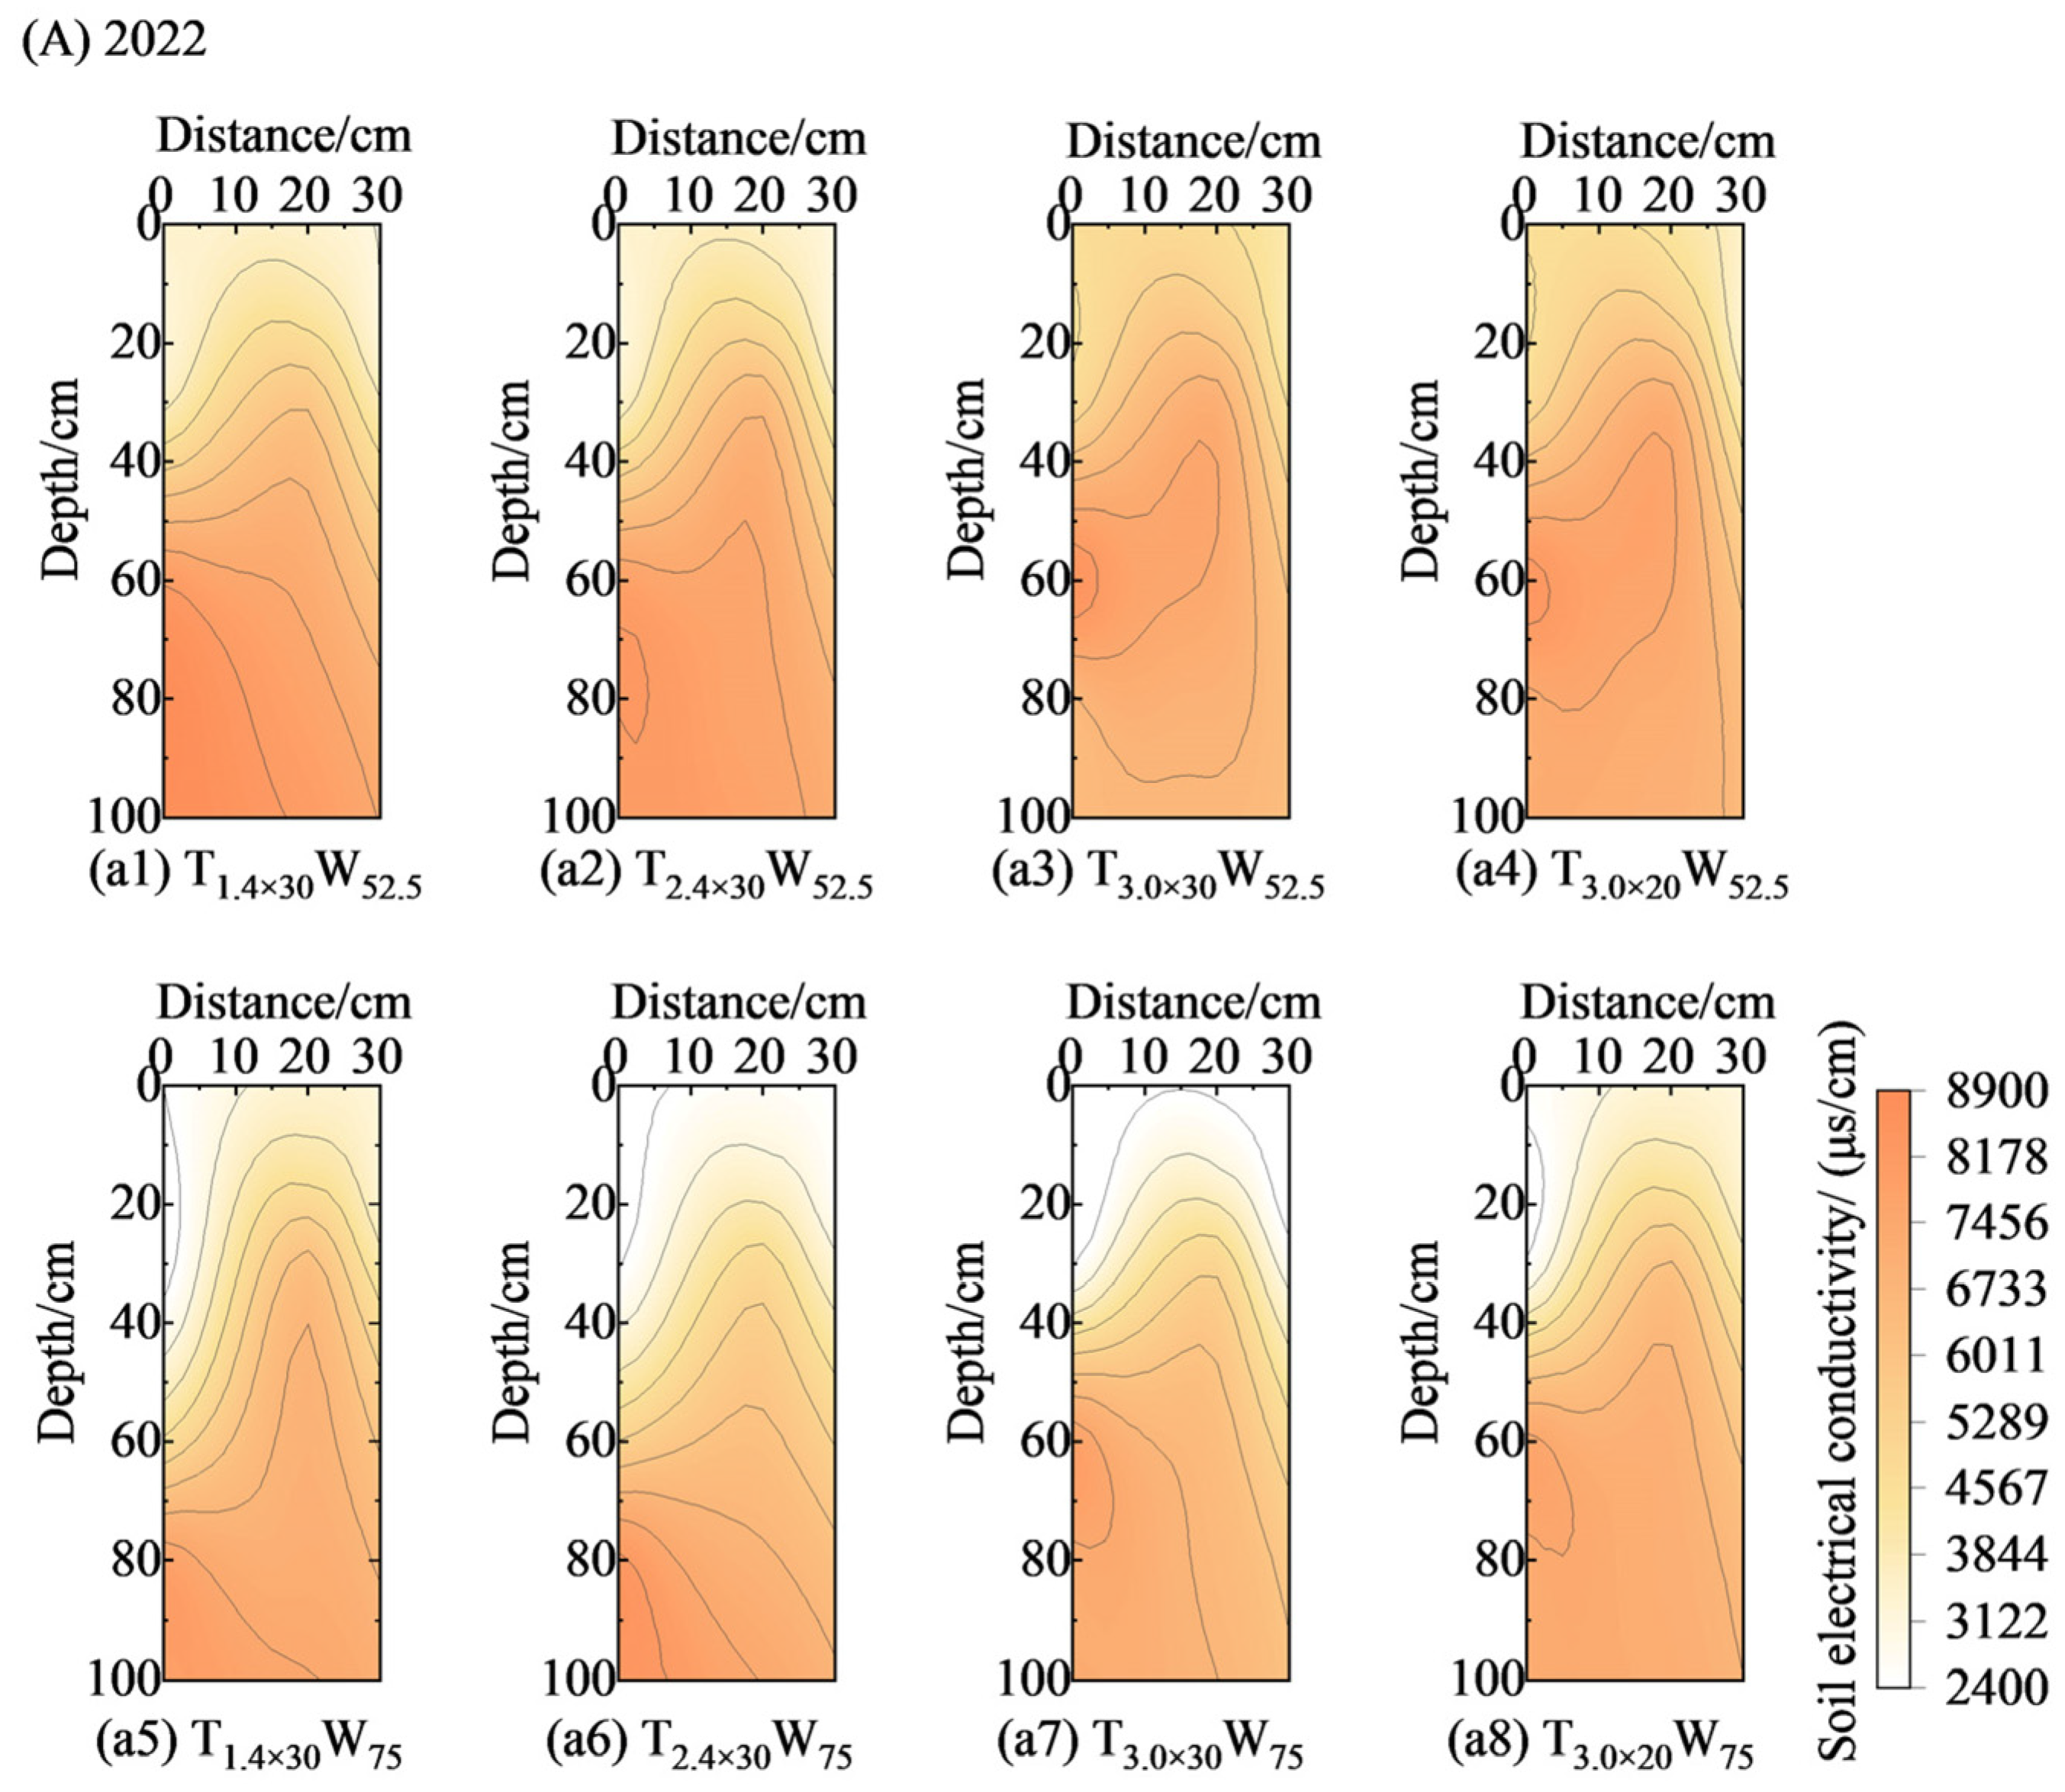
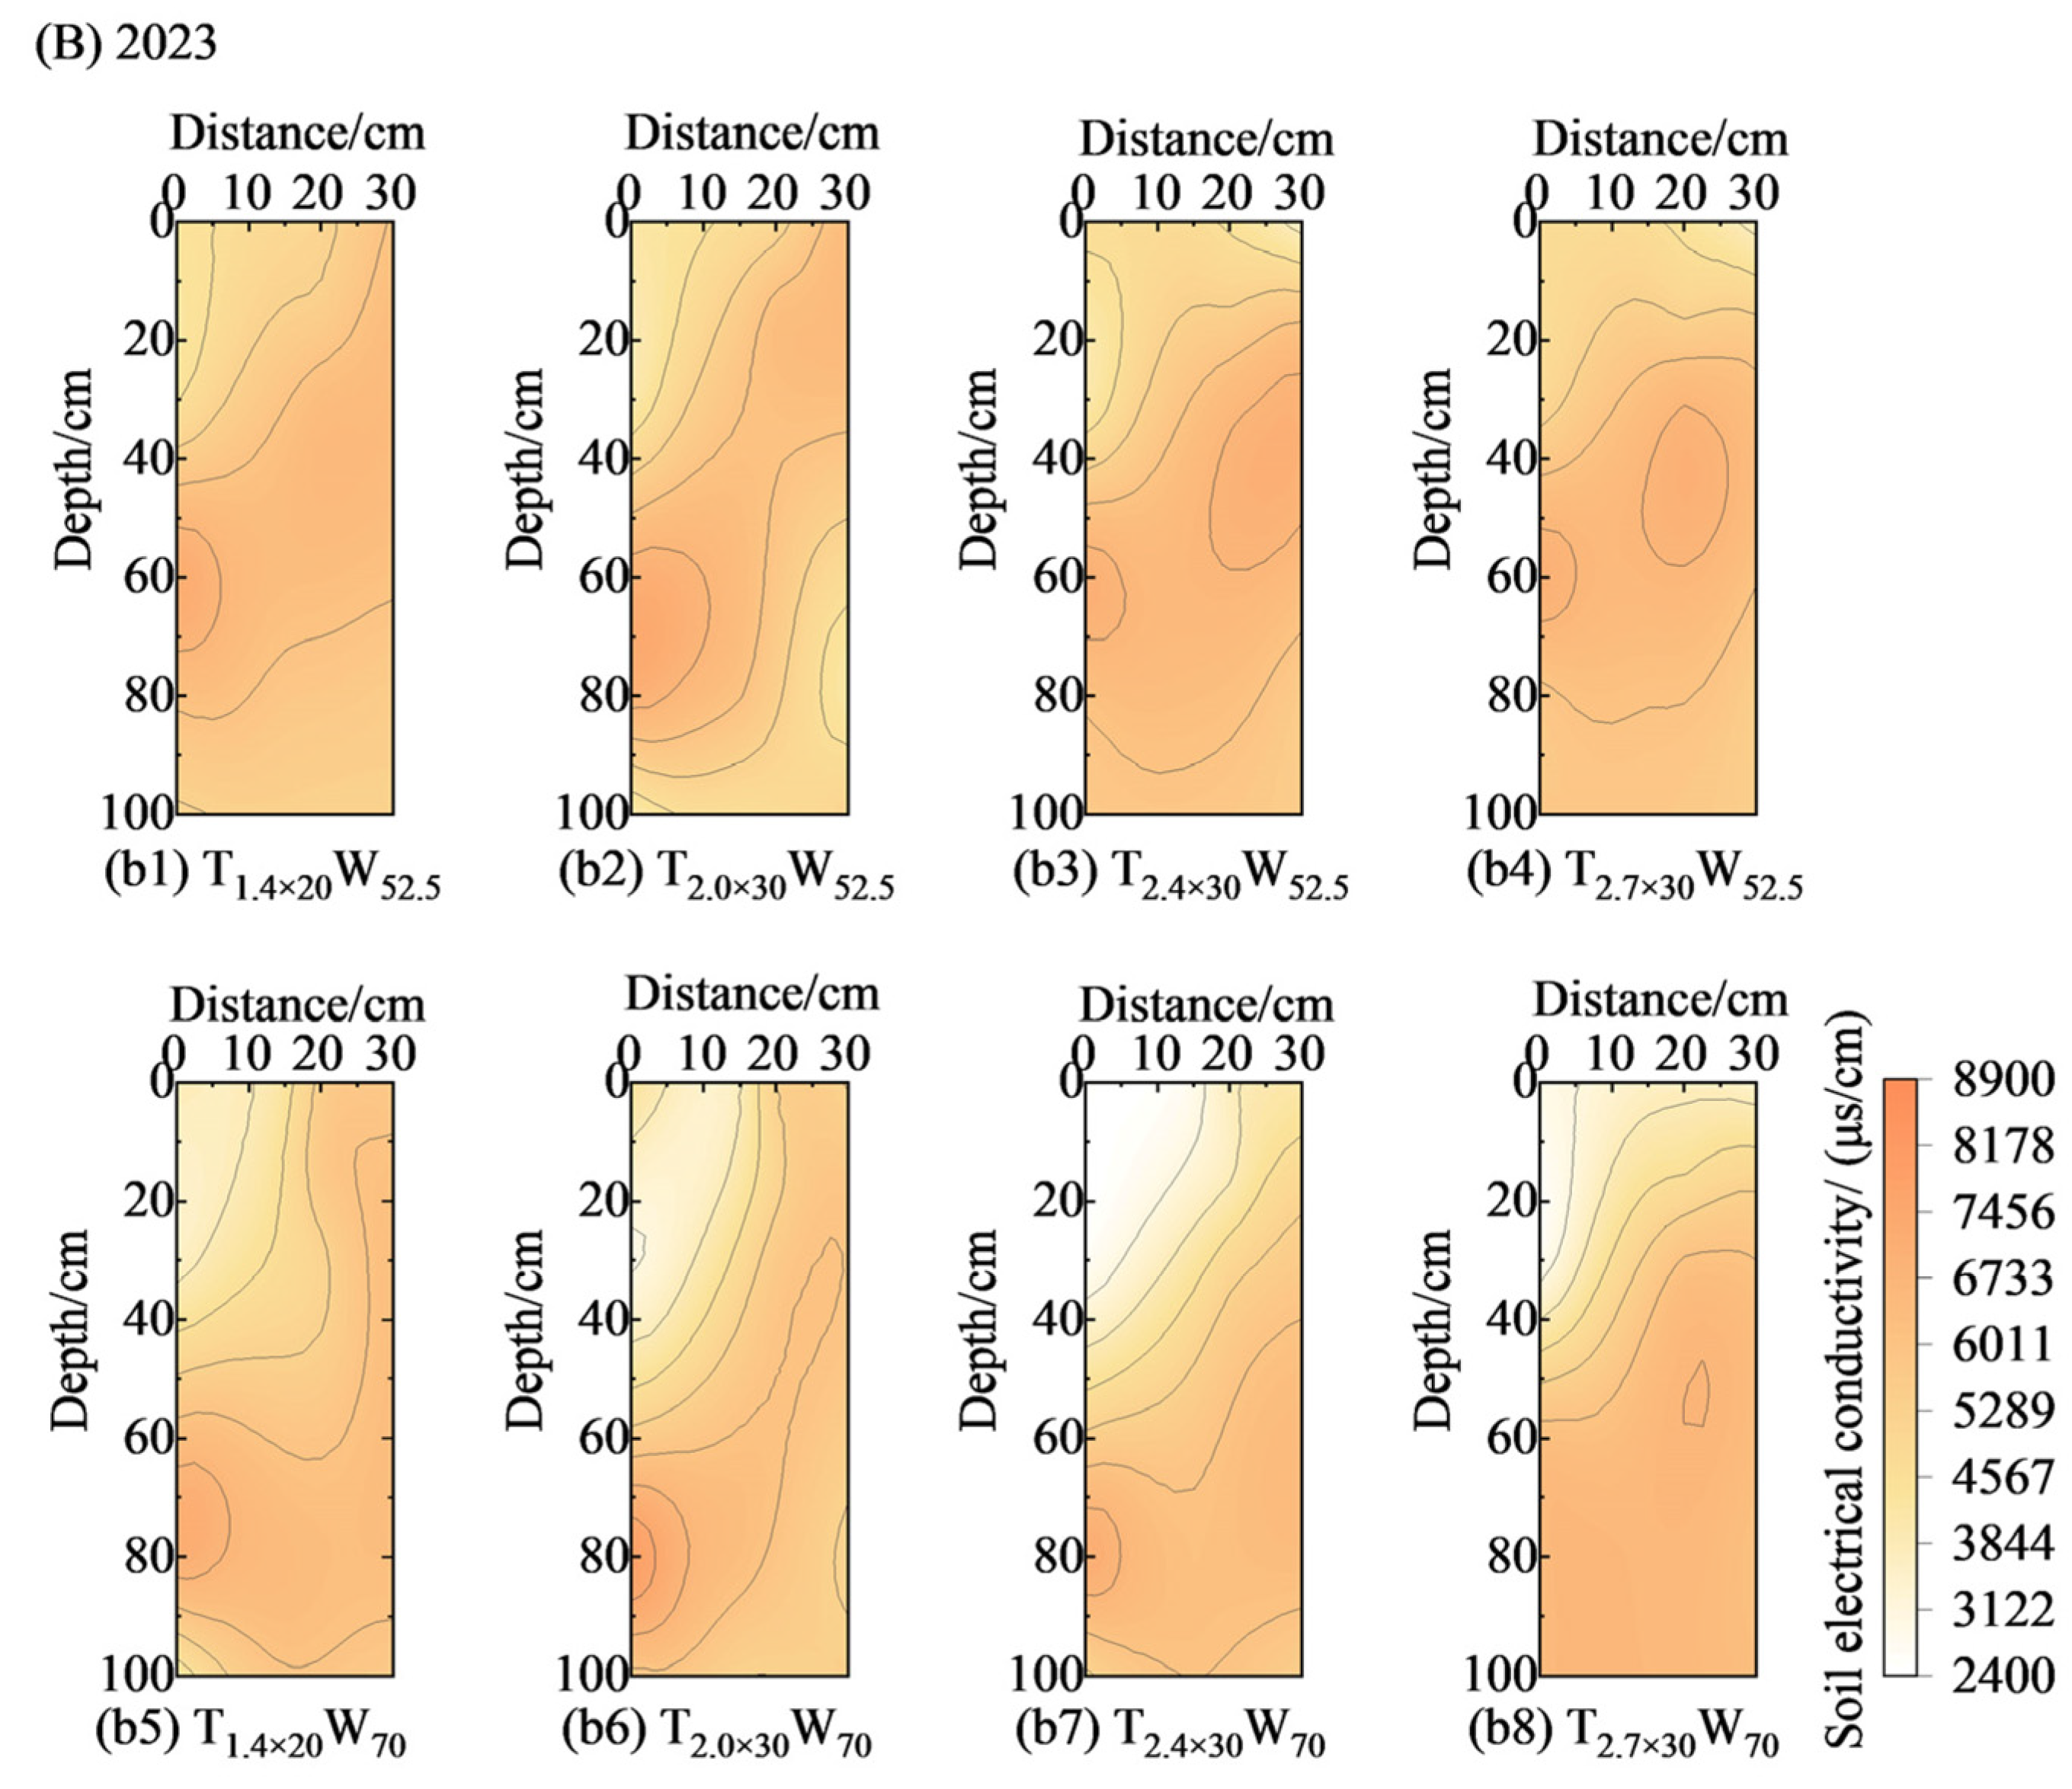
The soil electrical conductivity (EC) distribution one day after irrigation (Figure 4) revealed synergistic effects of per-application irrigation quota and emitter parameters on salt leaching efficacy. Under identical emitter settings, increasing the irrigation quota substantially improved the desalination rate and increased the leaching depth. In 2022, the desalination rate for the W75 treatment was 120.59% to 315.66% higher than that for W52.5 (p < 0.01), with the leaching depth increased by 6–9 cm. In 2023, the desalination rate for W70 was also 60.43% to 62.97% higher than that for W52.5 (p < 0.05), with an approximately 8 cm increase in leaching depth. This confirms that the conventional water quota (W52.5) was insufficient for adequate root zone leaching.
Under a fixed per-application irrigation quota, salt removal efficiency also varied considerably among the different emitter configurations tested. The moderate-discharge treatment T2.4×30 consistently demonstrated the optimal desalination performance in both experimental years, with a significantly higher desalination rate compared to low- and high-discharge treatments. For example, under the W75 quota in 2022, the desalination rate for T2.4×30 was 18.16% and 102.15% higher than that for T1.4×30 and T3.0×30 (p < 0.05), respectively. Under the W70 quota in 2023, it was 28.40% and 32.43% higher, respectively. The high-discharge treatment T3.0×30 resulted in a shallower leaching depth, with salt removal concentrated mainly in the surface layer. Reducing the emitter spacing from 30 cm to 20 cm at a 3.0 L/h discharge rate did not produce a significant effect on either the desalination rate or leaching depth. Overall, under the same irrigation quota, the combination of a moderate emitter discharge rate (2.4 L/h) with a 30 cm spacing was most conducive to creating a root zone environment with sufficient moisture and effective salt leaching post-irrigation.

3.1.2. Dynamics of Water and Salt in the Root Zone Across Growth Stages

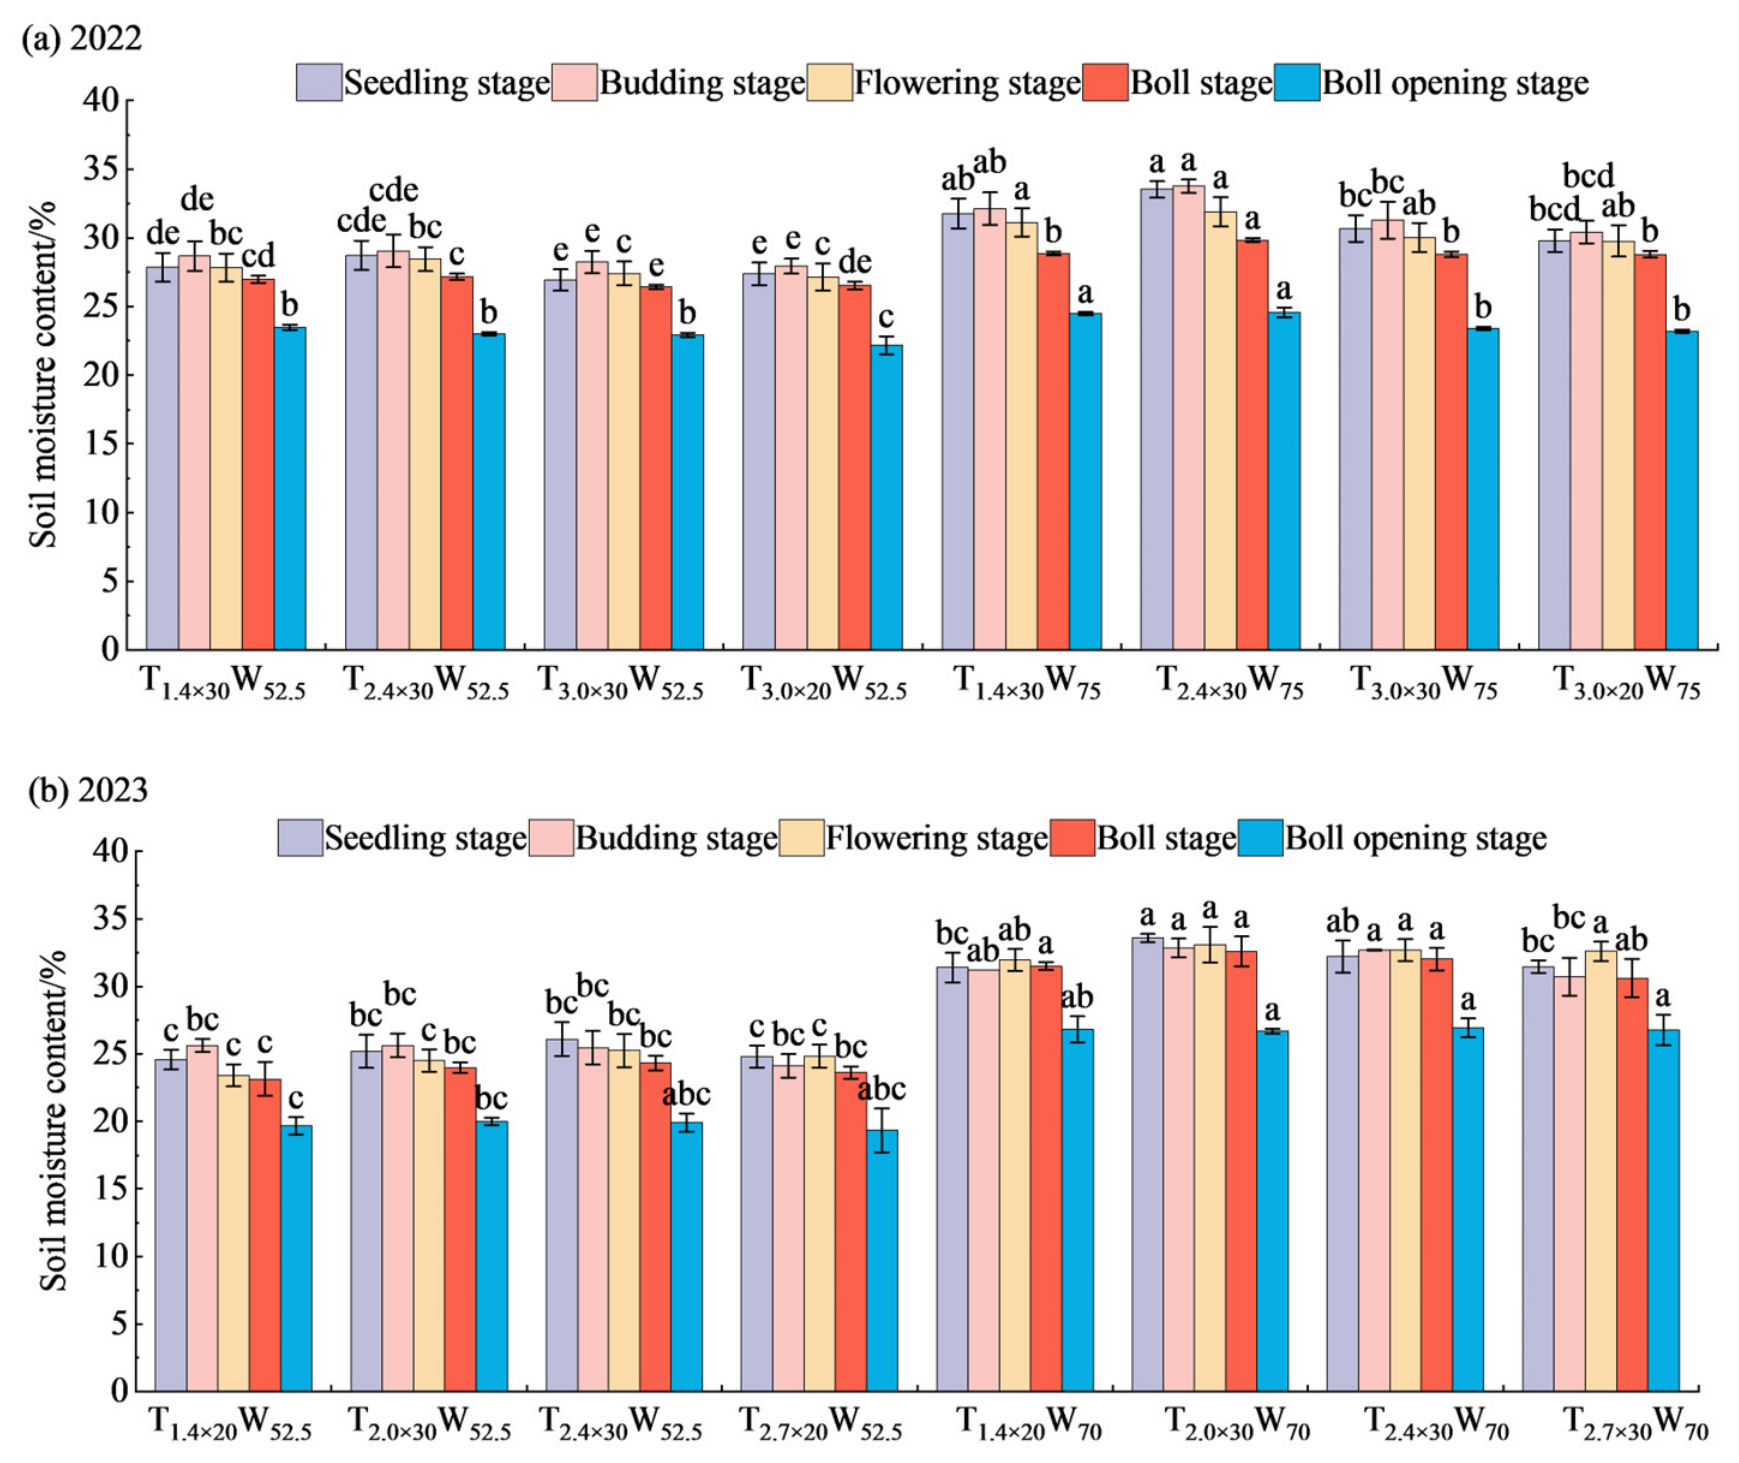
Because the emitter configurations and irrigation quota levels differed between 2022 and 2023, the results from the two years are presented separately. In each year, data were analyzed as a completely randomized design with two factors (irrigation quota and emitter configuration) using two-way ANOVA. The dynamics of average soil VWC in the 0–60 cm root zone across cotton growth stages are shown in Figure 5. Soil water content was co-regulated by stage-specific crop water demand and irrigation management. Overall, VWC accumulated slowly from the seedling to squaring stages due to weak evaporation, decreased during the flowering and boll-forming stage as crop water consumption intensified, and continued to decline after irrigation ceased at the boll-opening stage. Per-application irrigation quota was the key determinant of root zone water supply. In 2022, from the squaring to boll-forming stage, the average VWC for the W75 treatment was 7.09% to 16.22% higher than that for W52.5 across all emitter parameter sets (p < 0.05). In 2023, the VWC for the W70 treatment during the flowering and boll-forming stage was also significantly higher (22.77% to 26.79%) than that for W52.5, indicating that increased irrigation quota effectively maintained a favorable soil moisture status in the root zone during the mid-to-late growth stages. Under a given per-application irrigation quota, differences among emitter configurations remained significant. Data from both years consistently showed that the T2.4×30 treatment maintained the relatively highest and most stable root zone VWC throughout the growing season. For example, during the flowering and boll-forming stage in 2023, under both W52.5 and W70 quotas, the average VWC for T2.4×30 was 1.64% to 7.30% and 1.16% to 3.36% higher than that of other treatments (p < 0.05), respectively.
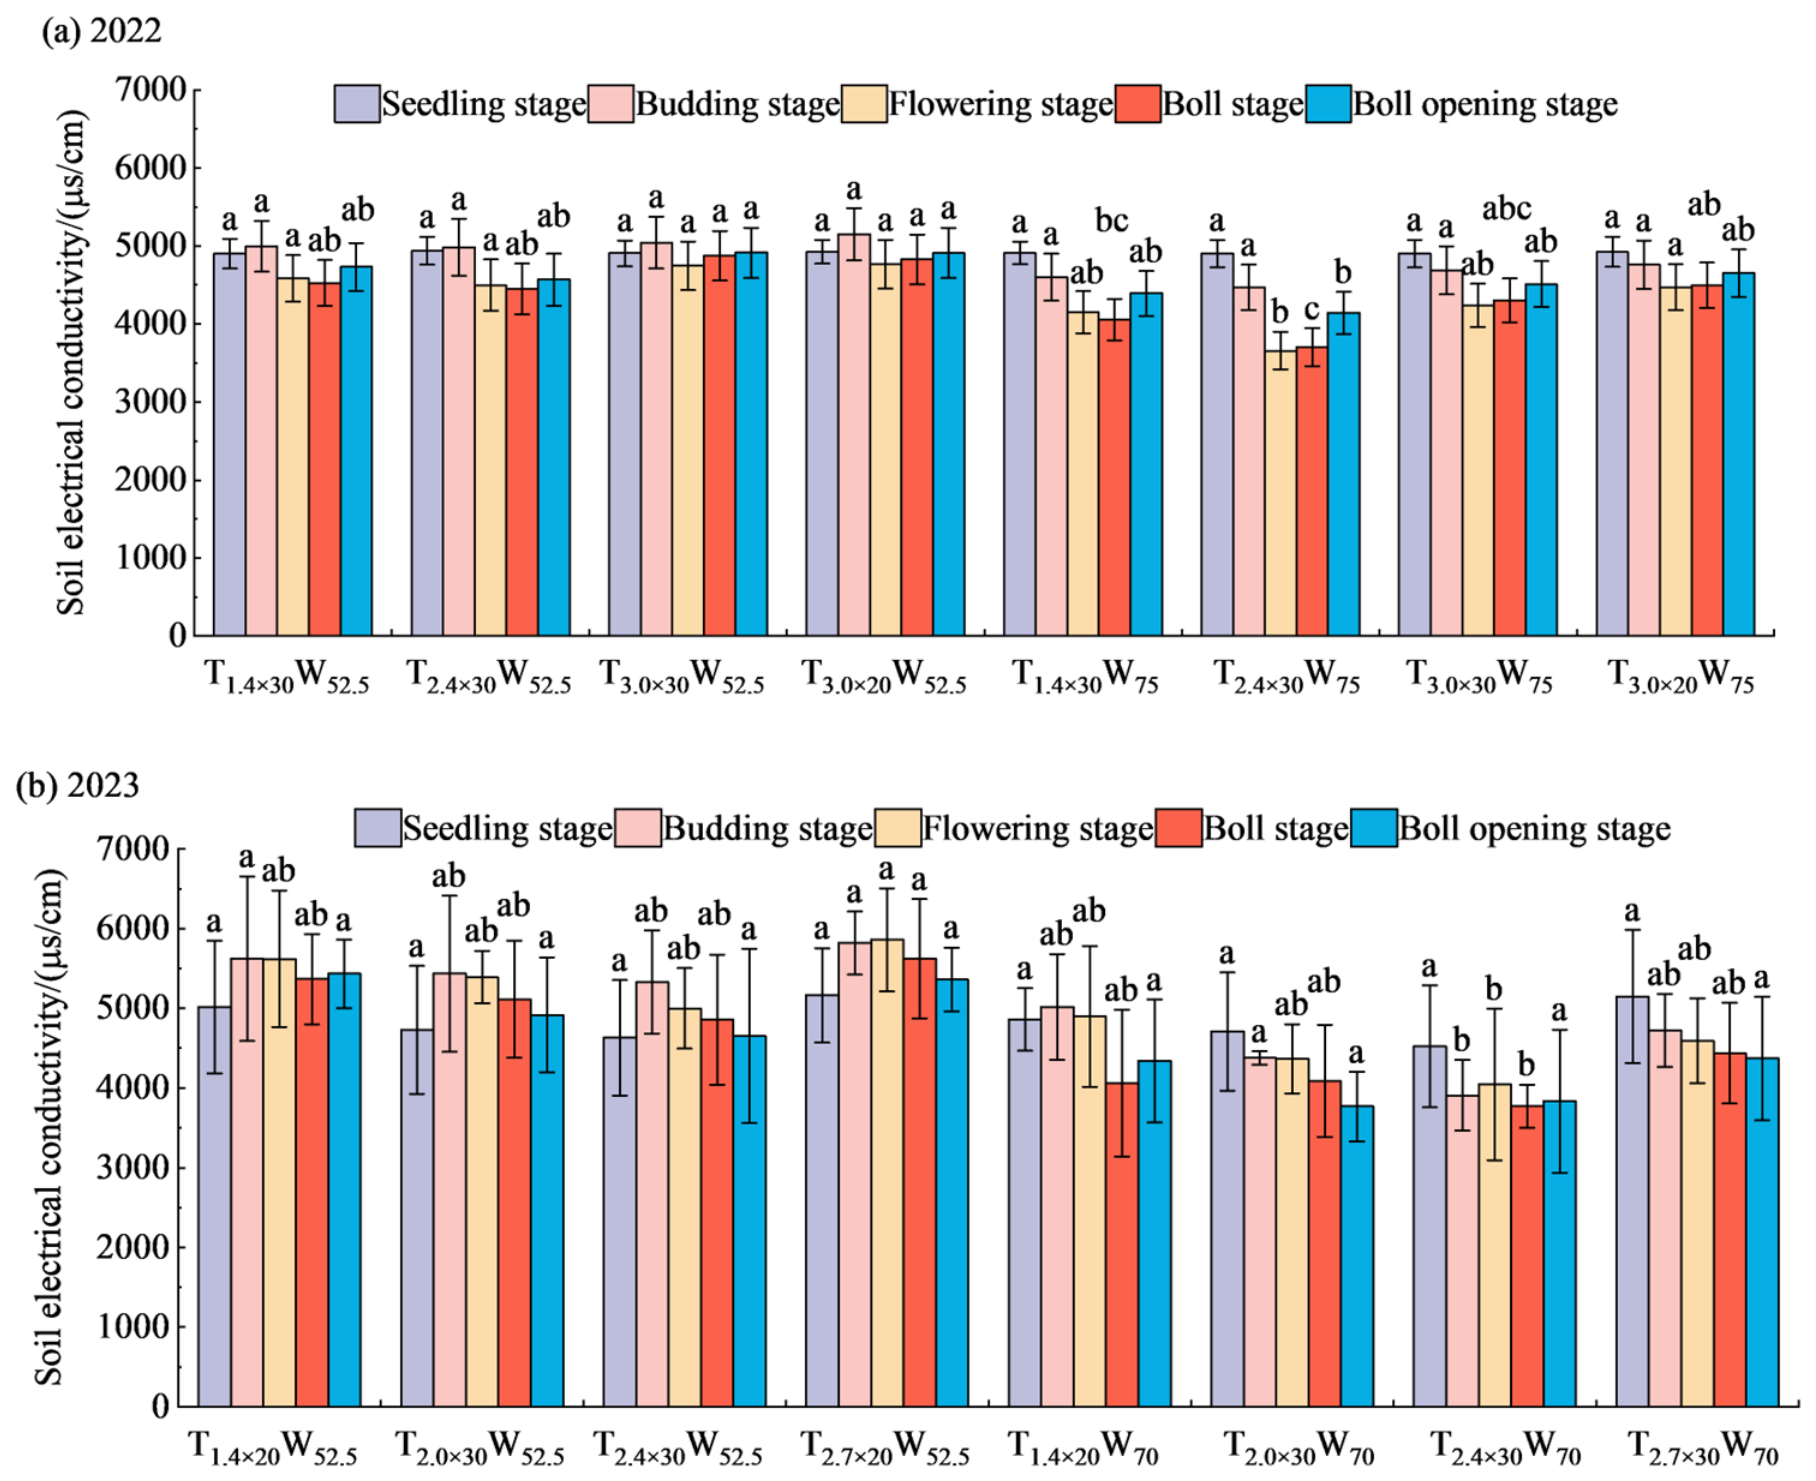
The dynamics of average root zone soil electrical conductivity (EC, Figure 6) exhibited a trend generally opposite to that of water content and showed inter-annual variation. In 2022, root zone EC was relatively high during the seedling and squaring stages due to salt accumulation from evaporation, decreased during the flowering and boll-forming stage due to frequent irrigation and leaching, and increased again after irrigation stopped at the boll-opening stage. Applying the root zone leaching quota (W75) significantly reduced soil salinity during the flowering and boll-forming stage. For instance, under the T2.4×30 treatment, the EC for W75 was 16.75% to 18.67% lower than that for W52.5. Under the same per-application irrigation quota, the moderate-discharge treatment T2.4×30 maintained the lowest root zone EC throughout the growing season, particularly during the flowering and boll-forming stage, with its EC being significantly lower than that of both low- and high-discharge treatments.
In 2023, soil salinity was relatively low early in the season but gradually accumulated with plant development, peaking during the flowering and boll-forming stage. Application of the leaching quota W70 effectively controlled salt accumulation across the entire root zone, with an average desalination rate of 5.89% to 7.13% during the flowering and boll-forming stage across treatments. In contrast, under the conventional water quota W52.5, significant salt accumulation occurred in the 30–60 cm soil layer, with peak values reaching 14.06–14.63 g/kg, indicating that this water volume was insufficient to leach salts from deeper layers. Under the W70 quota, the T2.4×30 treatment again demonstrated the best salt control performance, with its desalination rate during the flowering and boll-forming stage being 17.16% to 43.58% higher than that of other treatments (p < 0.05). In summary, the combination of a root zone leaching quota with a moderate emitter discharge rate of 2.4 L/h was more effective in synergistically regulating soil water and salt dynamics throughout the cotton growing season, maintaining suitable root zone moisture while periodically leaching salts and mitigating salt stress.

3.2. Cotton Growth and Physiological Responses

3.2.1. Plant Height and Leaf Area Index

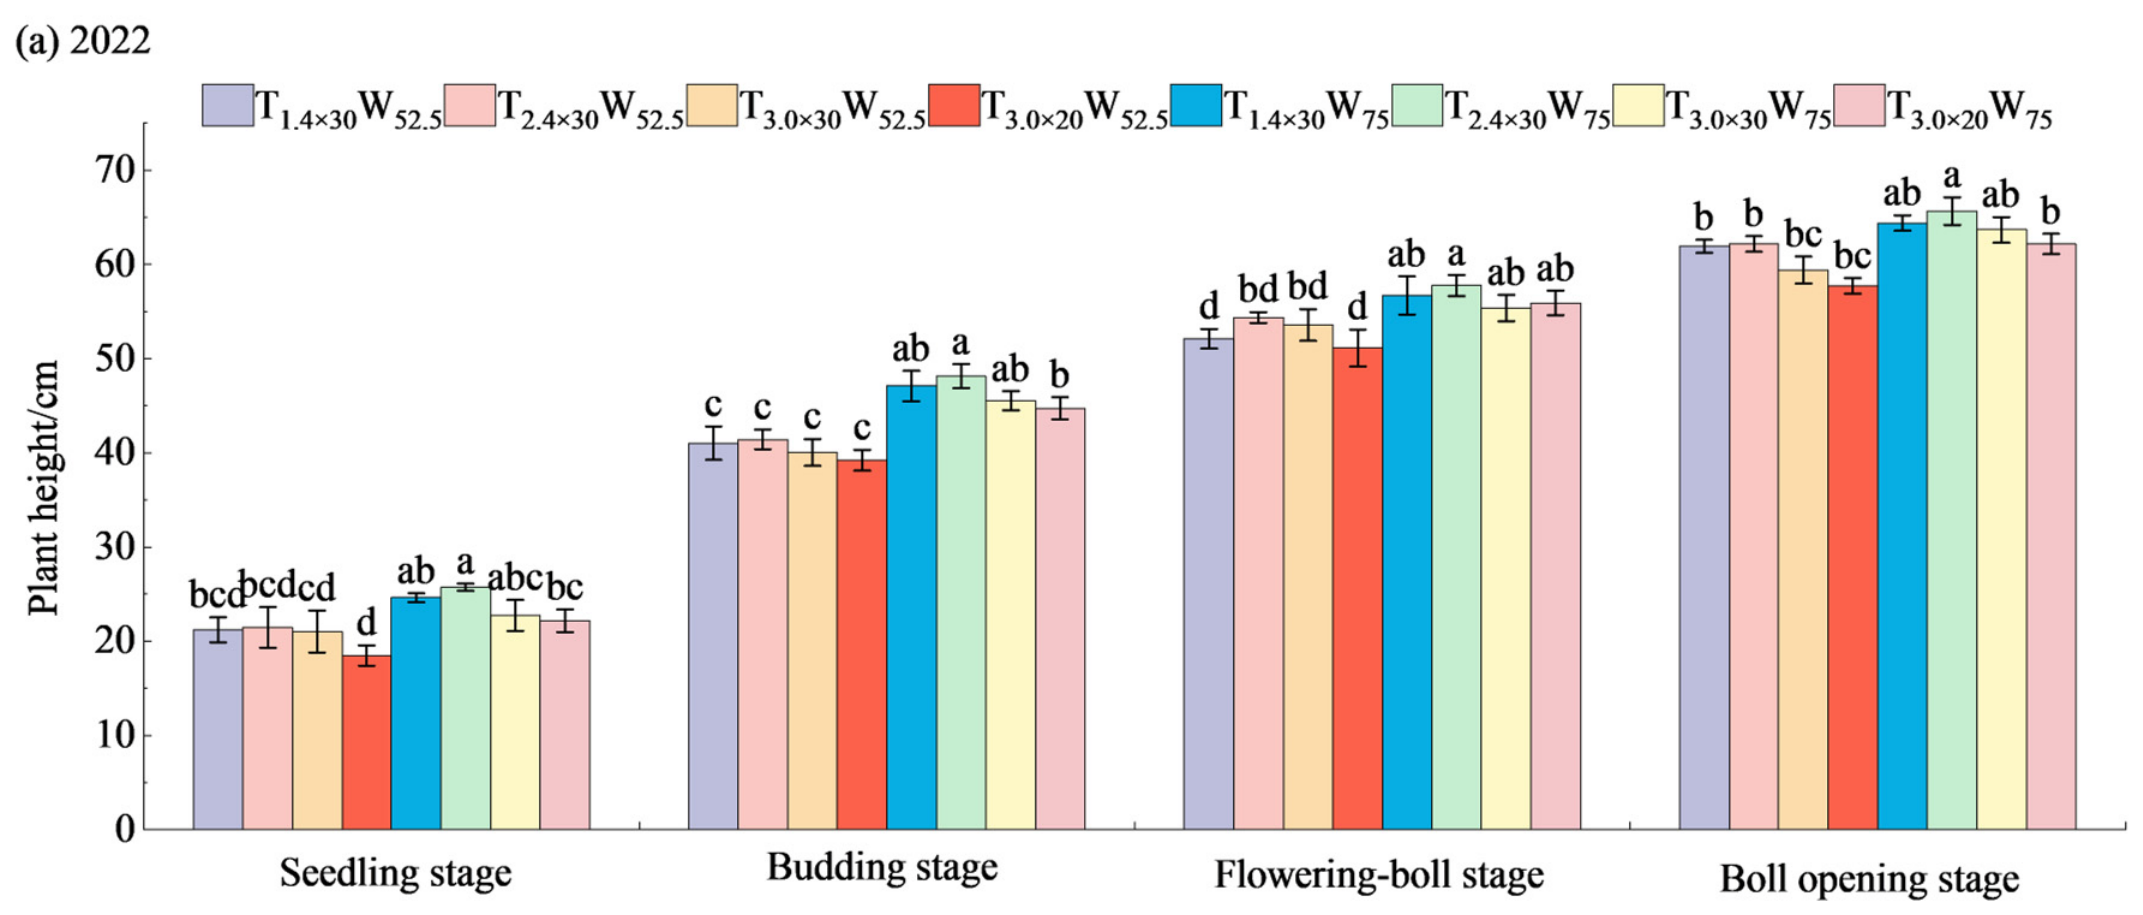
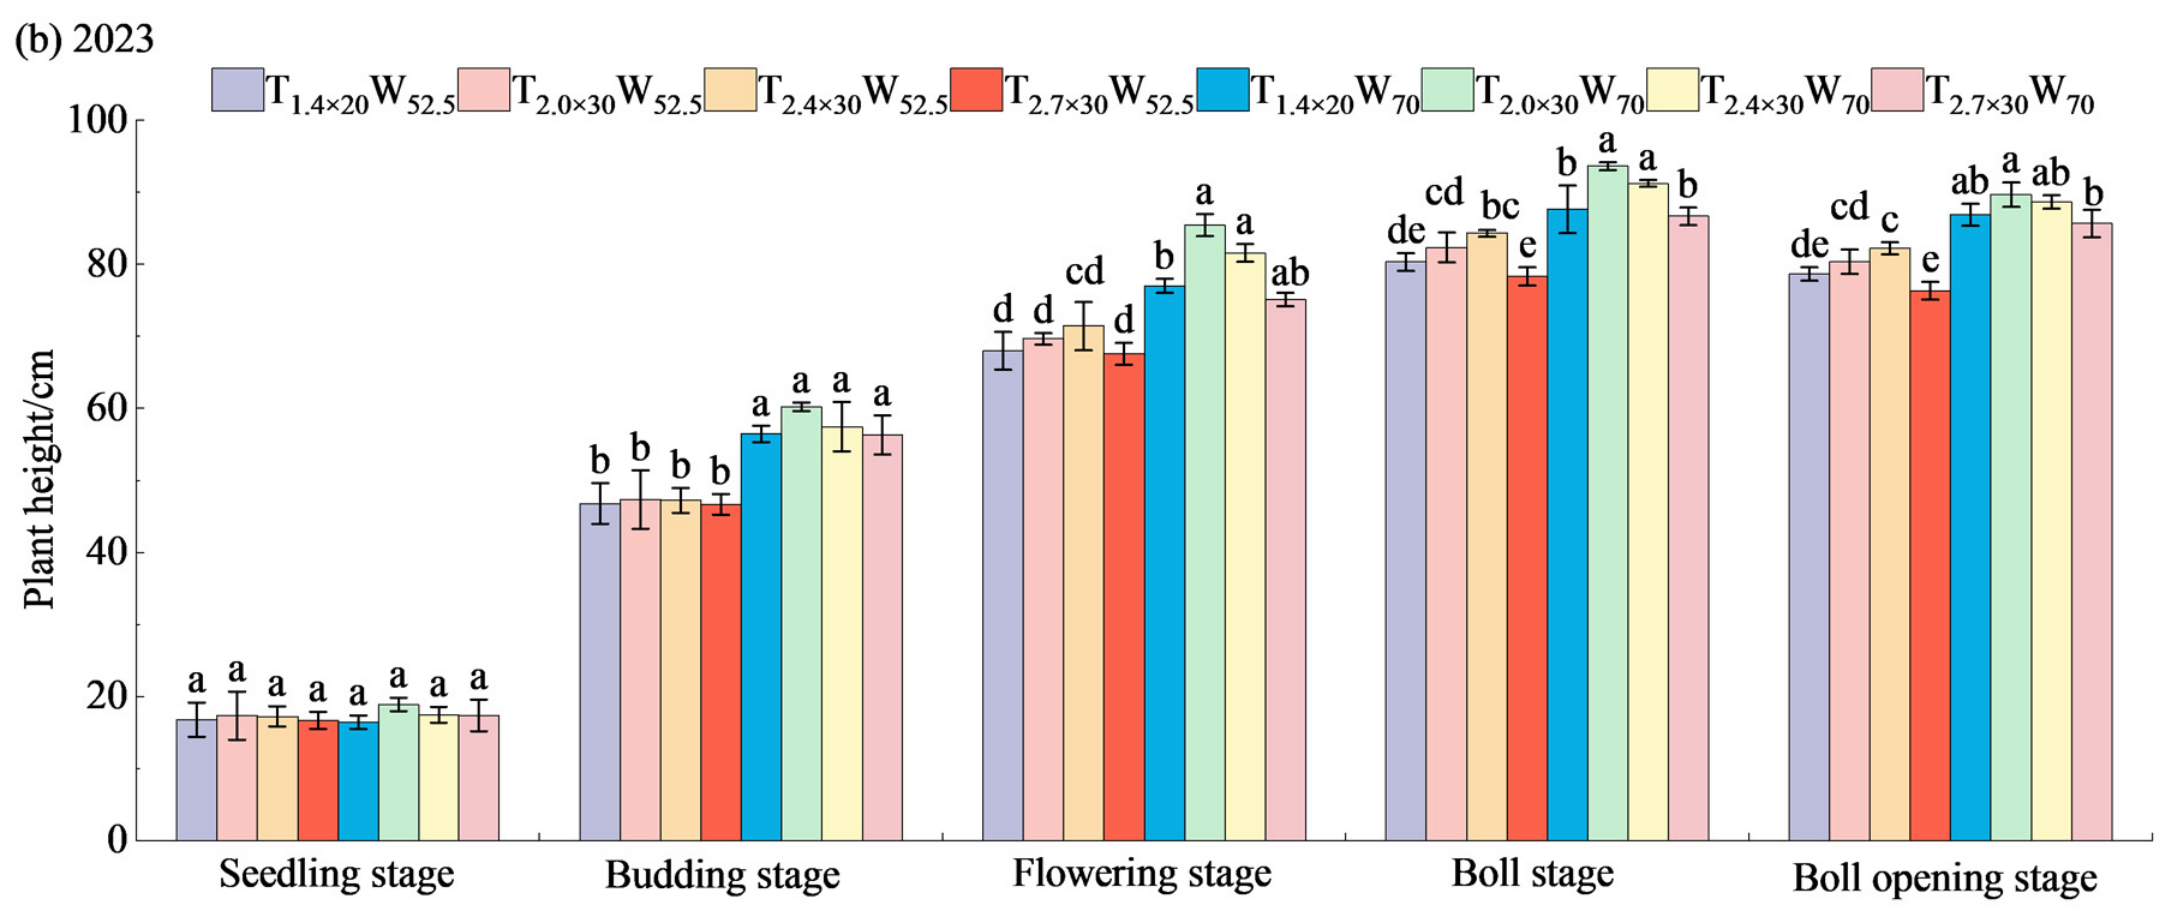
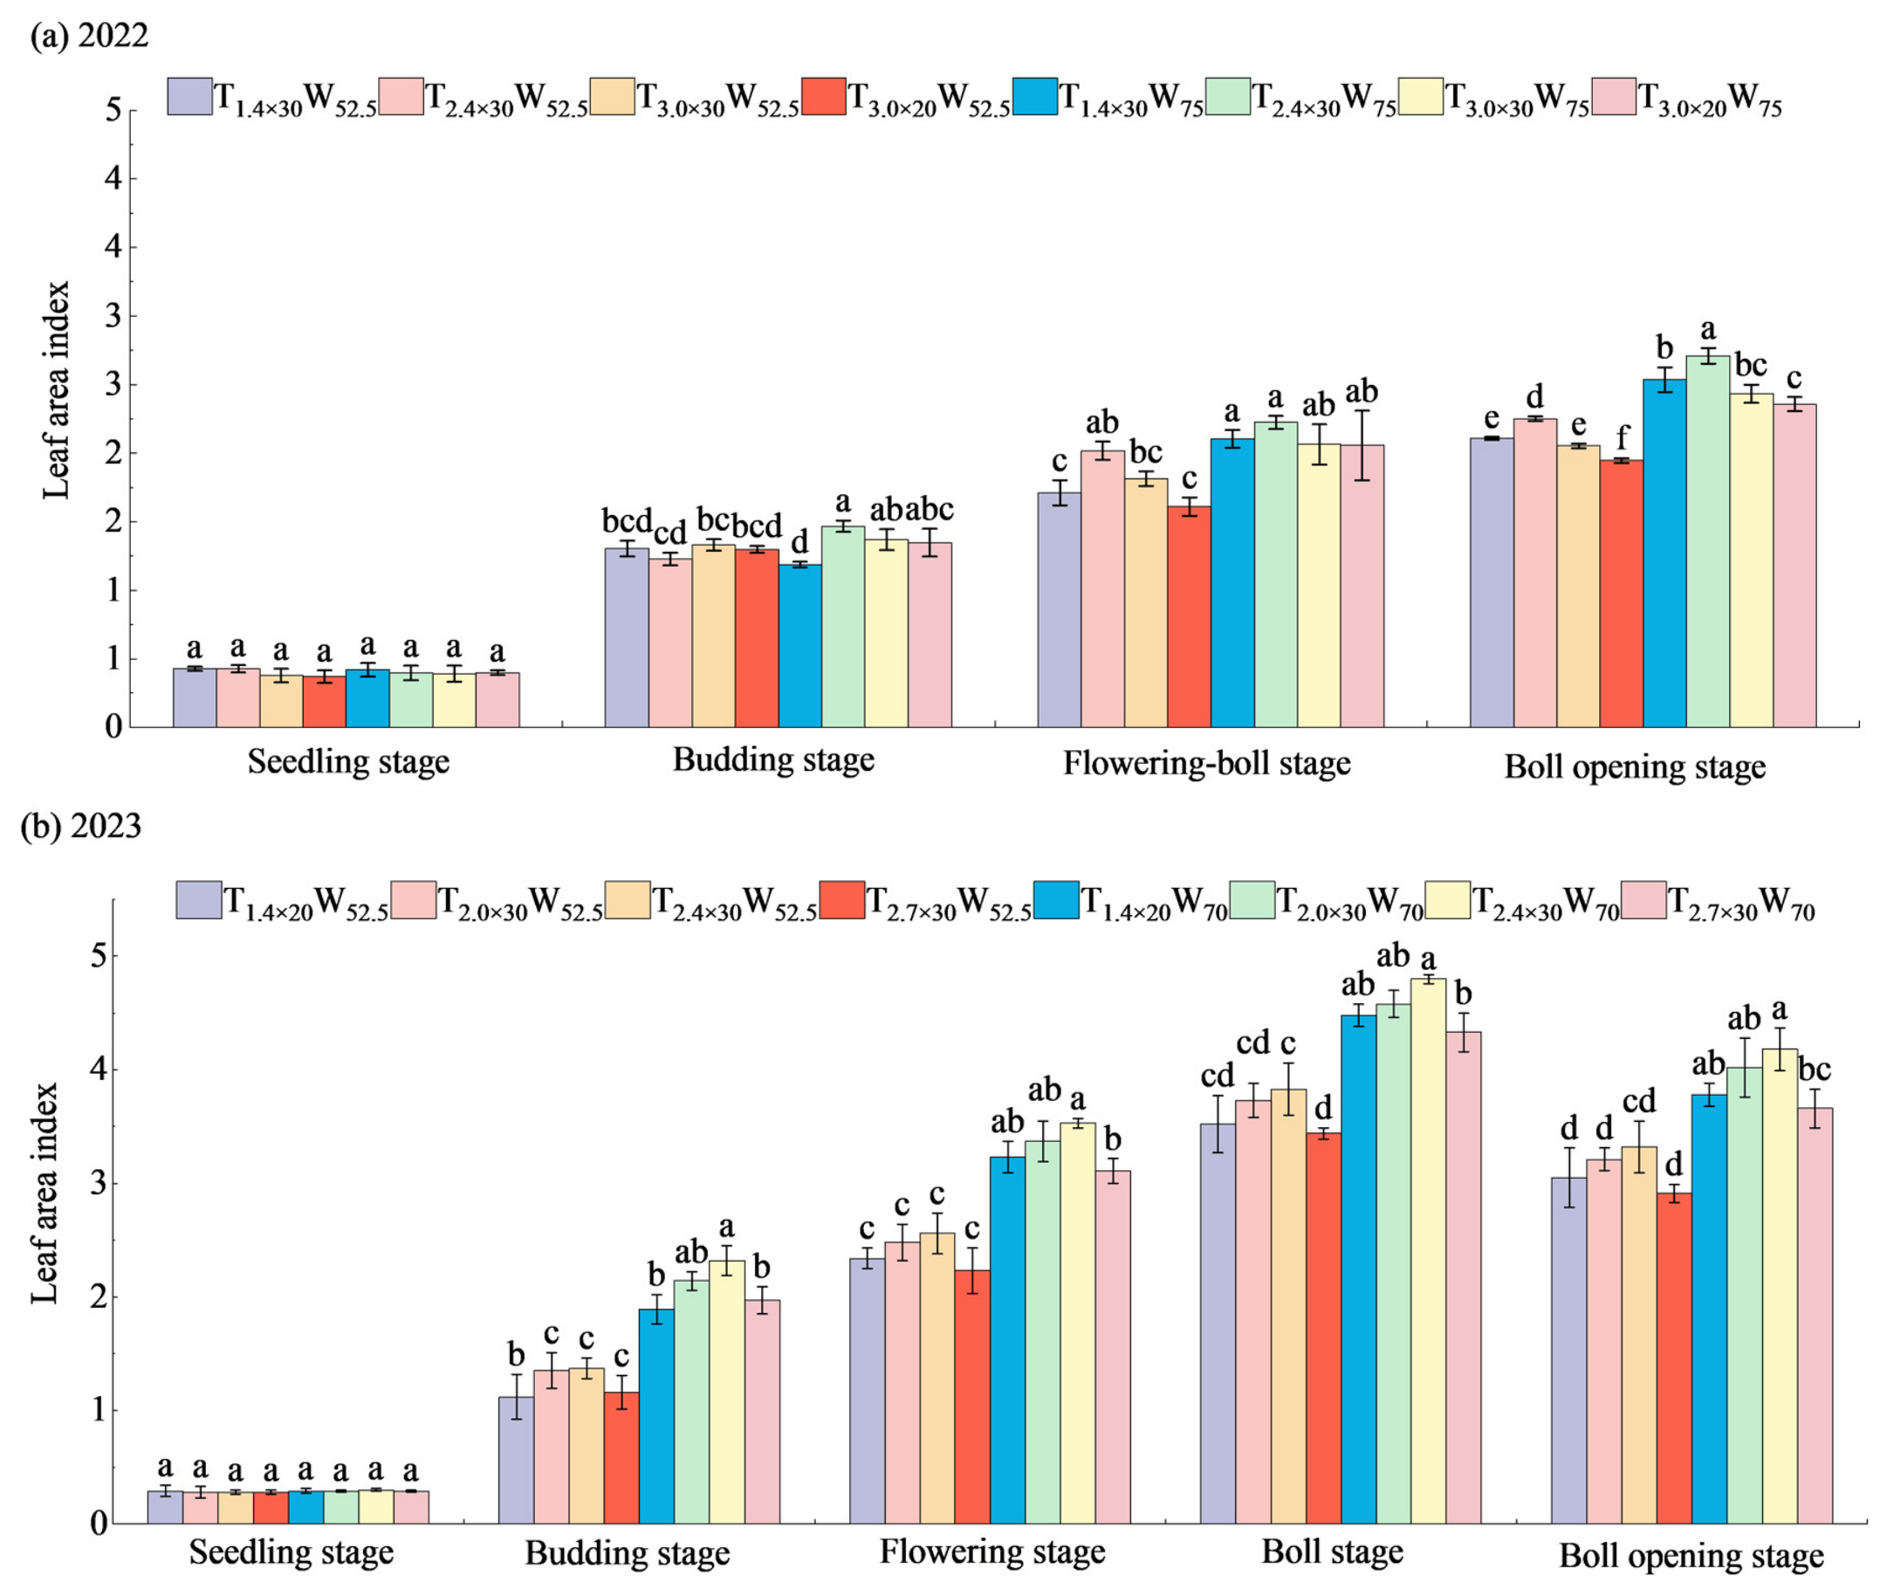
Cotton plant height (Figure 7) and leaf area index (LAI, Figure 8) exhibited significant variations under different combinations of irrigation quotas and emitter parameters. In 2022, plant height gradually increased with plant development, showing rapid growth from the seedling to squaring stages and stabilizing after the flowering and boll-forming stage. The per-application irrigation quota had the most pronounced effect on plant height. The W75 treatment significantly increased plant height at all growth stages compared to W52.5. At the boll-opening stage, the maximum plant height (65.66 cm) was observed in the T2.4×30W75 treatment, which was 5.61% higher than the minimum recorded in the T3.0×20W75 treatment. In 2023, plant height dynamics followed a similar trend, although growth slowed after flowering and slightly declined at the boll-opening stage. Under the W70 quota, the T2.4×30 and T2.0×30 treatments resulted in significantly taller plants during the flowering and boll-forming stage compared to other combinations. At the boll-opening stage, the T2.4×30W70 treatment maintained a significant advantage in plant height. Compared to W70, plant heights under the W52.5 quota decreased by an average of 4.02% to 12.27% across all emitter combinations, indicating a clear promoting effect of increased irrigation quota on plant height.
The LAI showed a pattern of initial increase followed by stabilization in both experimental years. The W75 per-application irrigation quota significantly enhanced LAI at all growth stages. The highest LAI (2.71) was recorded for the T2.4×30W75 treatment, which was 39.21% higher than the lowest value. In 2023, the LAI peaked at the boll-forming stage and decreased slightly at the boll-opening stage due to leaf senescence. Under the W70 quota, the LAI for the T2.4×30 treatment during the flowering and boll-forming stage was significantly higher (by 14.98%) than that for the T2.7×30 treatment. For the same emitter discharge rate, the LAI under W70 was 26.43% to 41.19% higher than that under W52.5 (p < 0.05), further confirming the critical role of irrigation quota in leaf area development. Overall, a higher per-application irrigation quota combined with an appropriate emitter discharge rate and spacing (2.4 L/h × 30 cm) was most conducive to the development of cotton plants and leaf canopy.

3.2.2. Dry Matter Accumulation

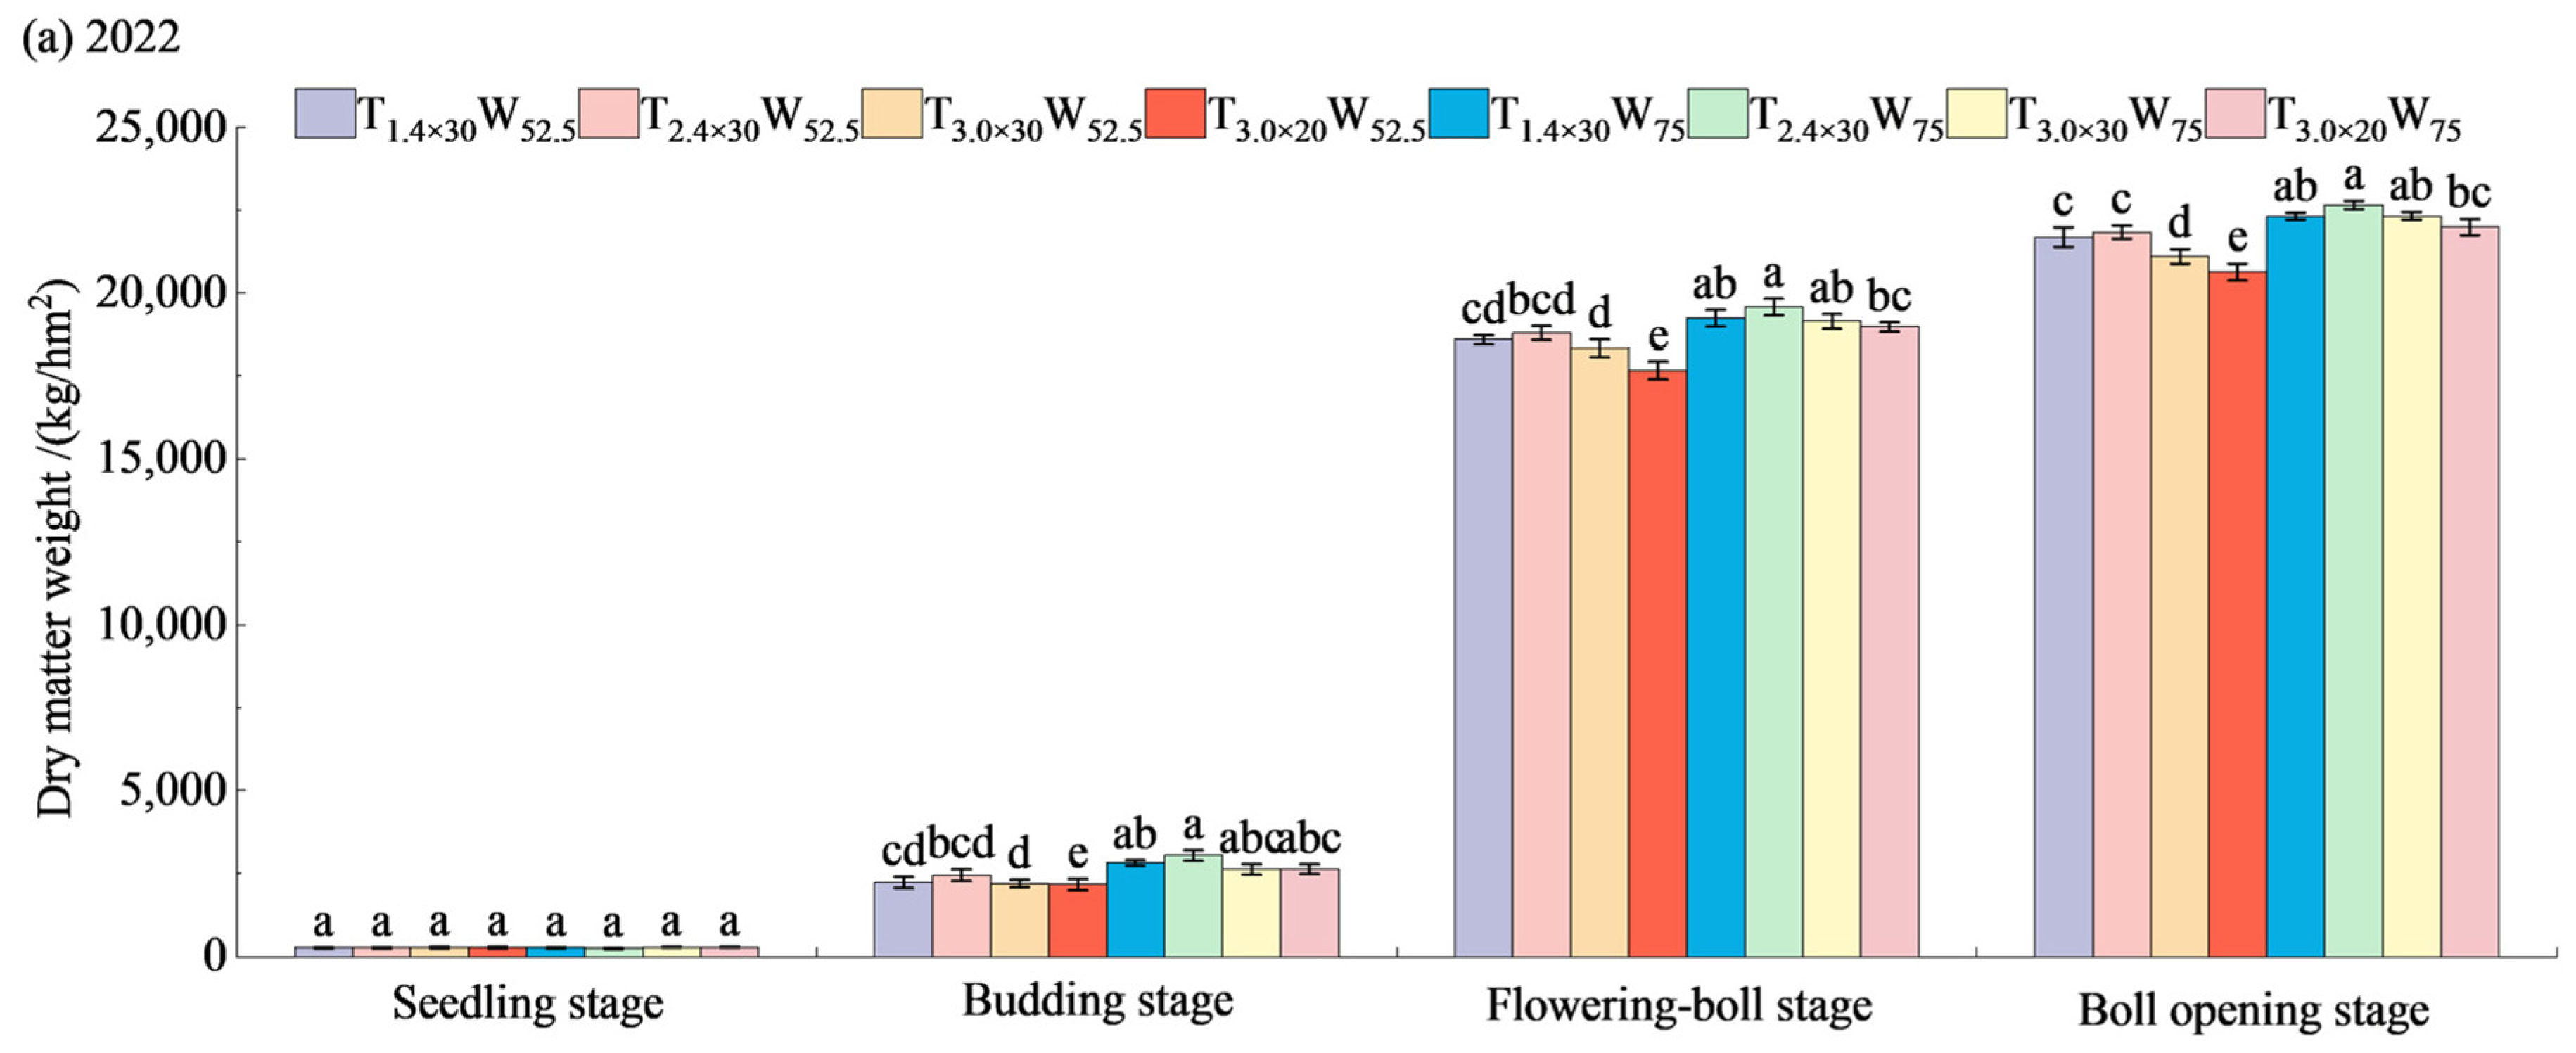
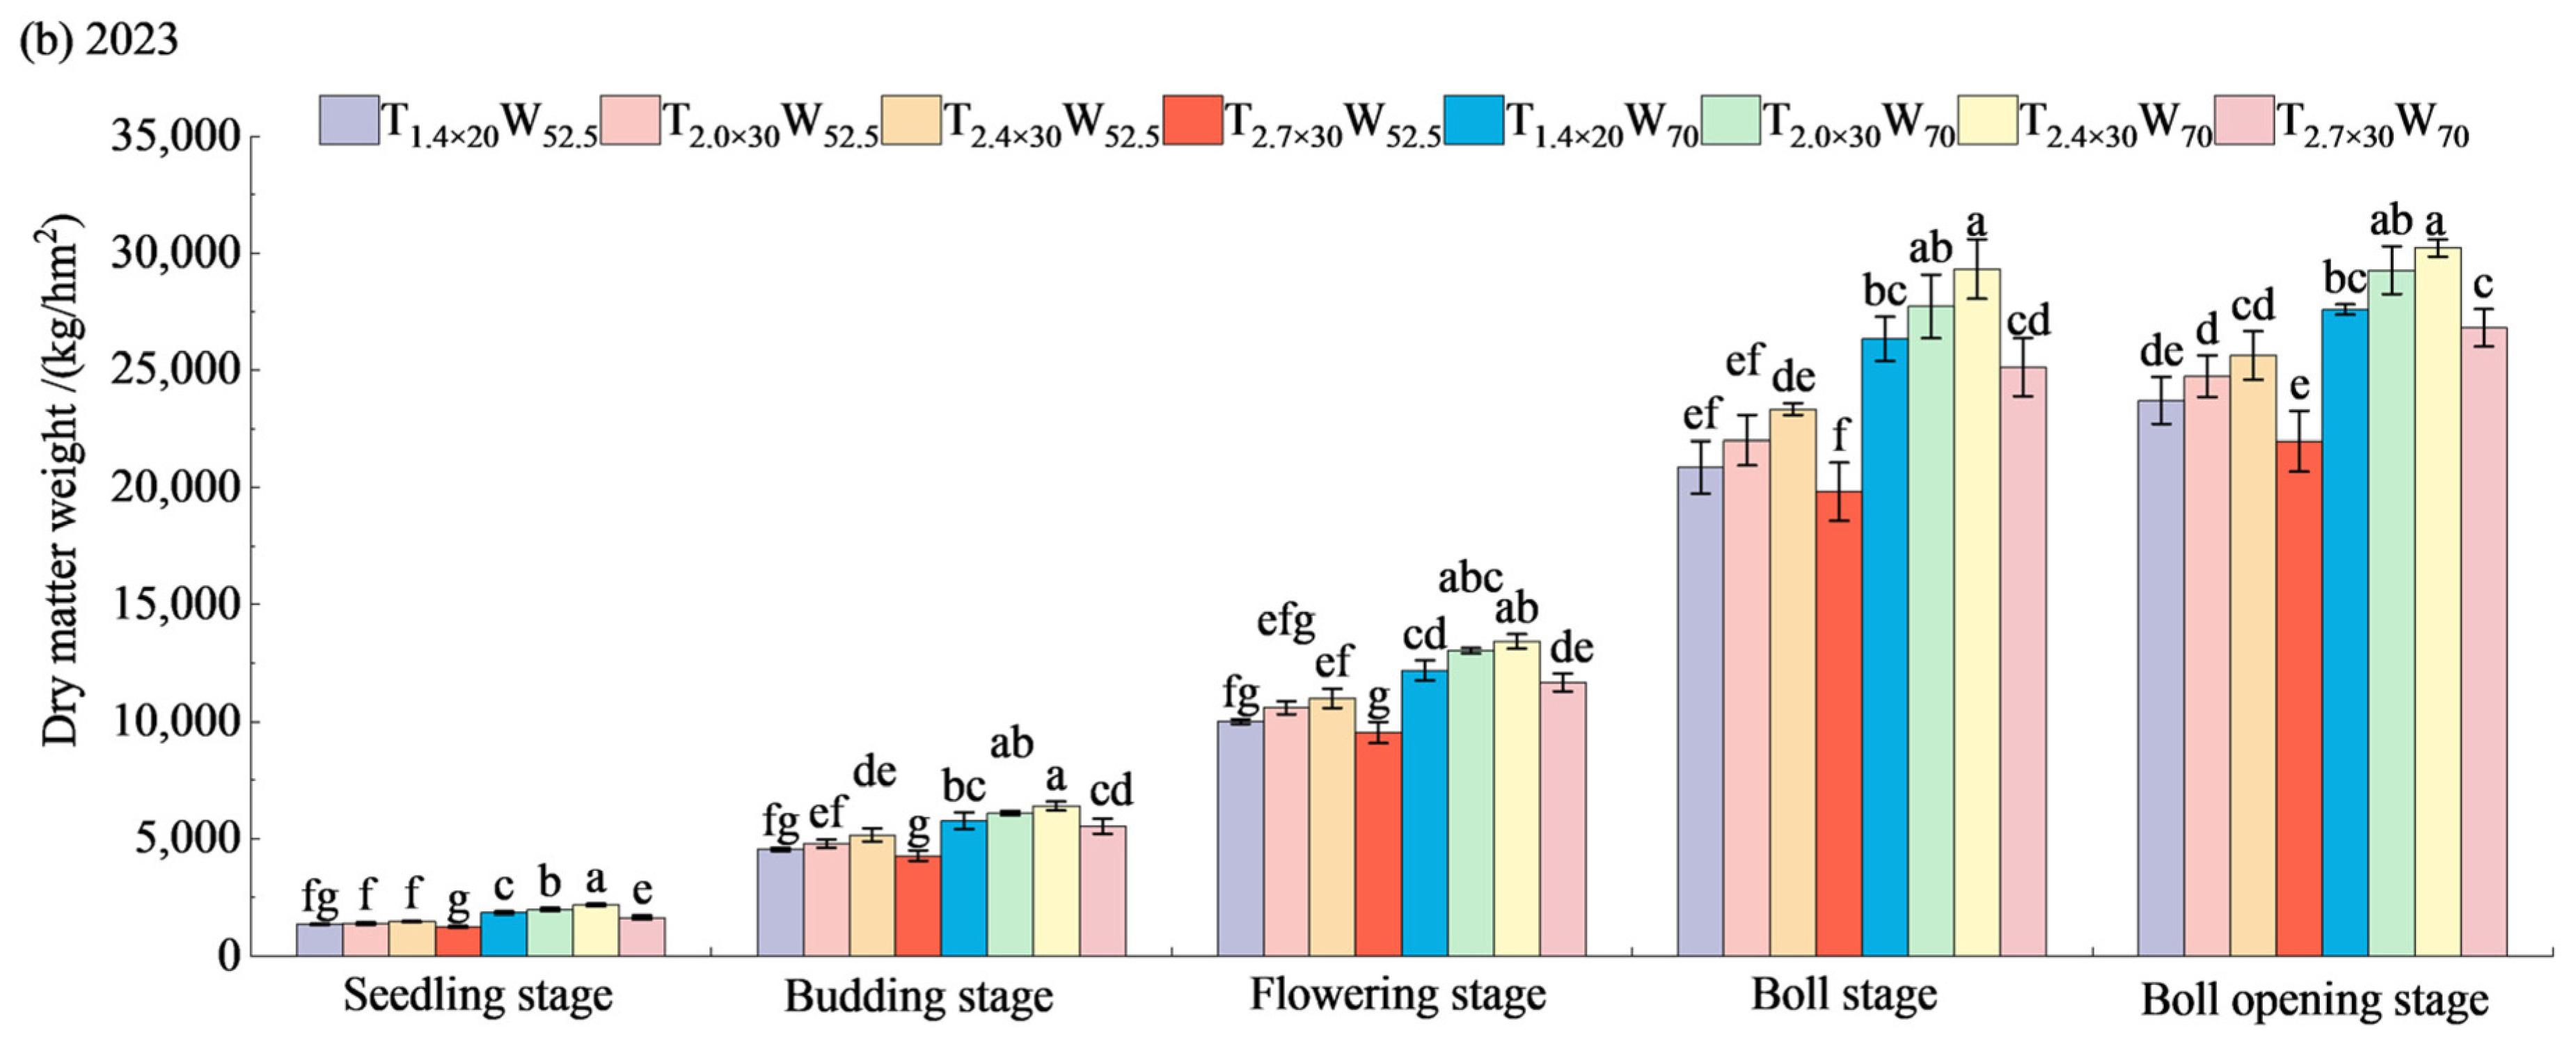
The above-ground dry matter weight of cotton was significantly regulated by both irrigation quota and emitter parameters. It increased progressively with plant development, with the period from squaring to flowering and boll-forming being the key stage for dry matter accumulation, showing an average increase of 7280 kg/hm2 over the two years (Figure 9). In 2022, the W75 treatment significantly promoted dry matter accumulation. At the boll-opening stage, the T2.4×30W75 treatment achieved the highest dry matter weight, which was 2.85%, 2.73%, and 5.57% higher than that of the T1.4×30W75, T3.0×30W75, and T3.0×20W75 treatments (p < 0.05), respectively. A similar trend in dry matter accumulation was observed in 2023, with the flowering and boll-forming stage being the critical period, accounting for 52.98% of the peak value. Under identical emitter parameters, the dry matter weight for the W70 treatment was consistently and significantly higher than that for the W52.5 treatment.
Differences among emitter configurations were also notable in their effects on dry matter accumulation. Under the W70 quota, the dry matter weight for the T2.4×30 treatment during the flowering and boll-forming stage was 10.16%, 5.42%, and 14.34% higher than that for the T1.4×20, T2.0×30, and T2.7×30 treatments (p < 0.05), respectively. Results from both years indicate that the root zone leaching quota significantly promoted cotton dry matter synthesis and accumulation by improving the root zone water and salt environment. The selection of appropriate emitter parameters was equally important. In both the 2022 and 2023 experiments, the 2.4 L/h × 30 cm combination generally demonstrated superior dry matter accumulation capacity, suggesting that this parameter set provided effective water supply and salt regulation in the local salinized cotton fields. In summary, a higher per-application irrigation quota combined with moderate emitter discharge rate and spacing created favorable conditions for cotton dry matter accumulation, thereby laying the foundation for yield formation.

3.3. Yield and Irrigation Water Productivity

The combination of different irrigation quotas and emitter parameters significantly influenced cotton yield components and irrigation water productivity (IWP). As shown in Table 3, in 2022, seed cotton yields under the root zone leaching quota W75 were generally and significantly higher than those under the conventional water quota W52.5. Among these, the T2.4×30W75 combination achieved the highest yield of 6343.12 kg/hm2, which was 7.72% and 14.93% higher than those for T1.4×30W75 and T3.0×30W75, respectively, under the same per-application irrigation quota. This treatment also recorded the highest number of effective bolls per plant (9.29). Two-way ANOVA indicated that both emitter configuration and irrigation quota had highly significant effects on yield (p < 0.01), and their combined effect was also significant. However, increasing the total seasonal irrigation quota to boost yield concurrently reduced IWP. The average IWP for the W75 treatments was 0.98 kg/m3, significantly lower than the 1.16 kg/m3 for the W52.5 treatments. Under the W52.5 quota, the T2.4×30W52.5 treatment achieved the highest IWP of 1.26 kg/m3.
In 2023, similar patterns were observed with the optimized per-application irrigation quota W70 and emitter combinations. The T2.4×30W70 treatment yielded the highest seed cotton production at 6175.59 kg/hm2, and its single boll weight was also significantly superior to most other treatments. ANOVA revealed that both emitter configuration and irrigation quota had significant effects on yield and IWP (p < 0.05). Considering the overall trends observed across both years, the combination of a root zone leaching quota with an emitter discharge rate of 2.4 L/h and a spacing of 30 cm consistently proved to be an effective strategy for enhancing yield in saline–alkali cotton fields. However, the concurrent decline in IWP indicates the need to seek a balance between yield improvement and efficient water use.
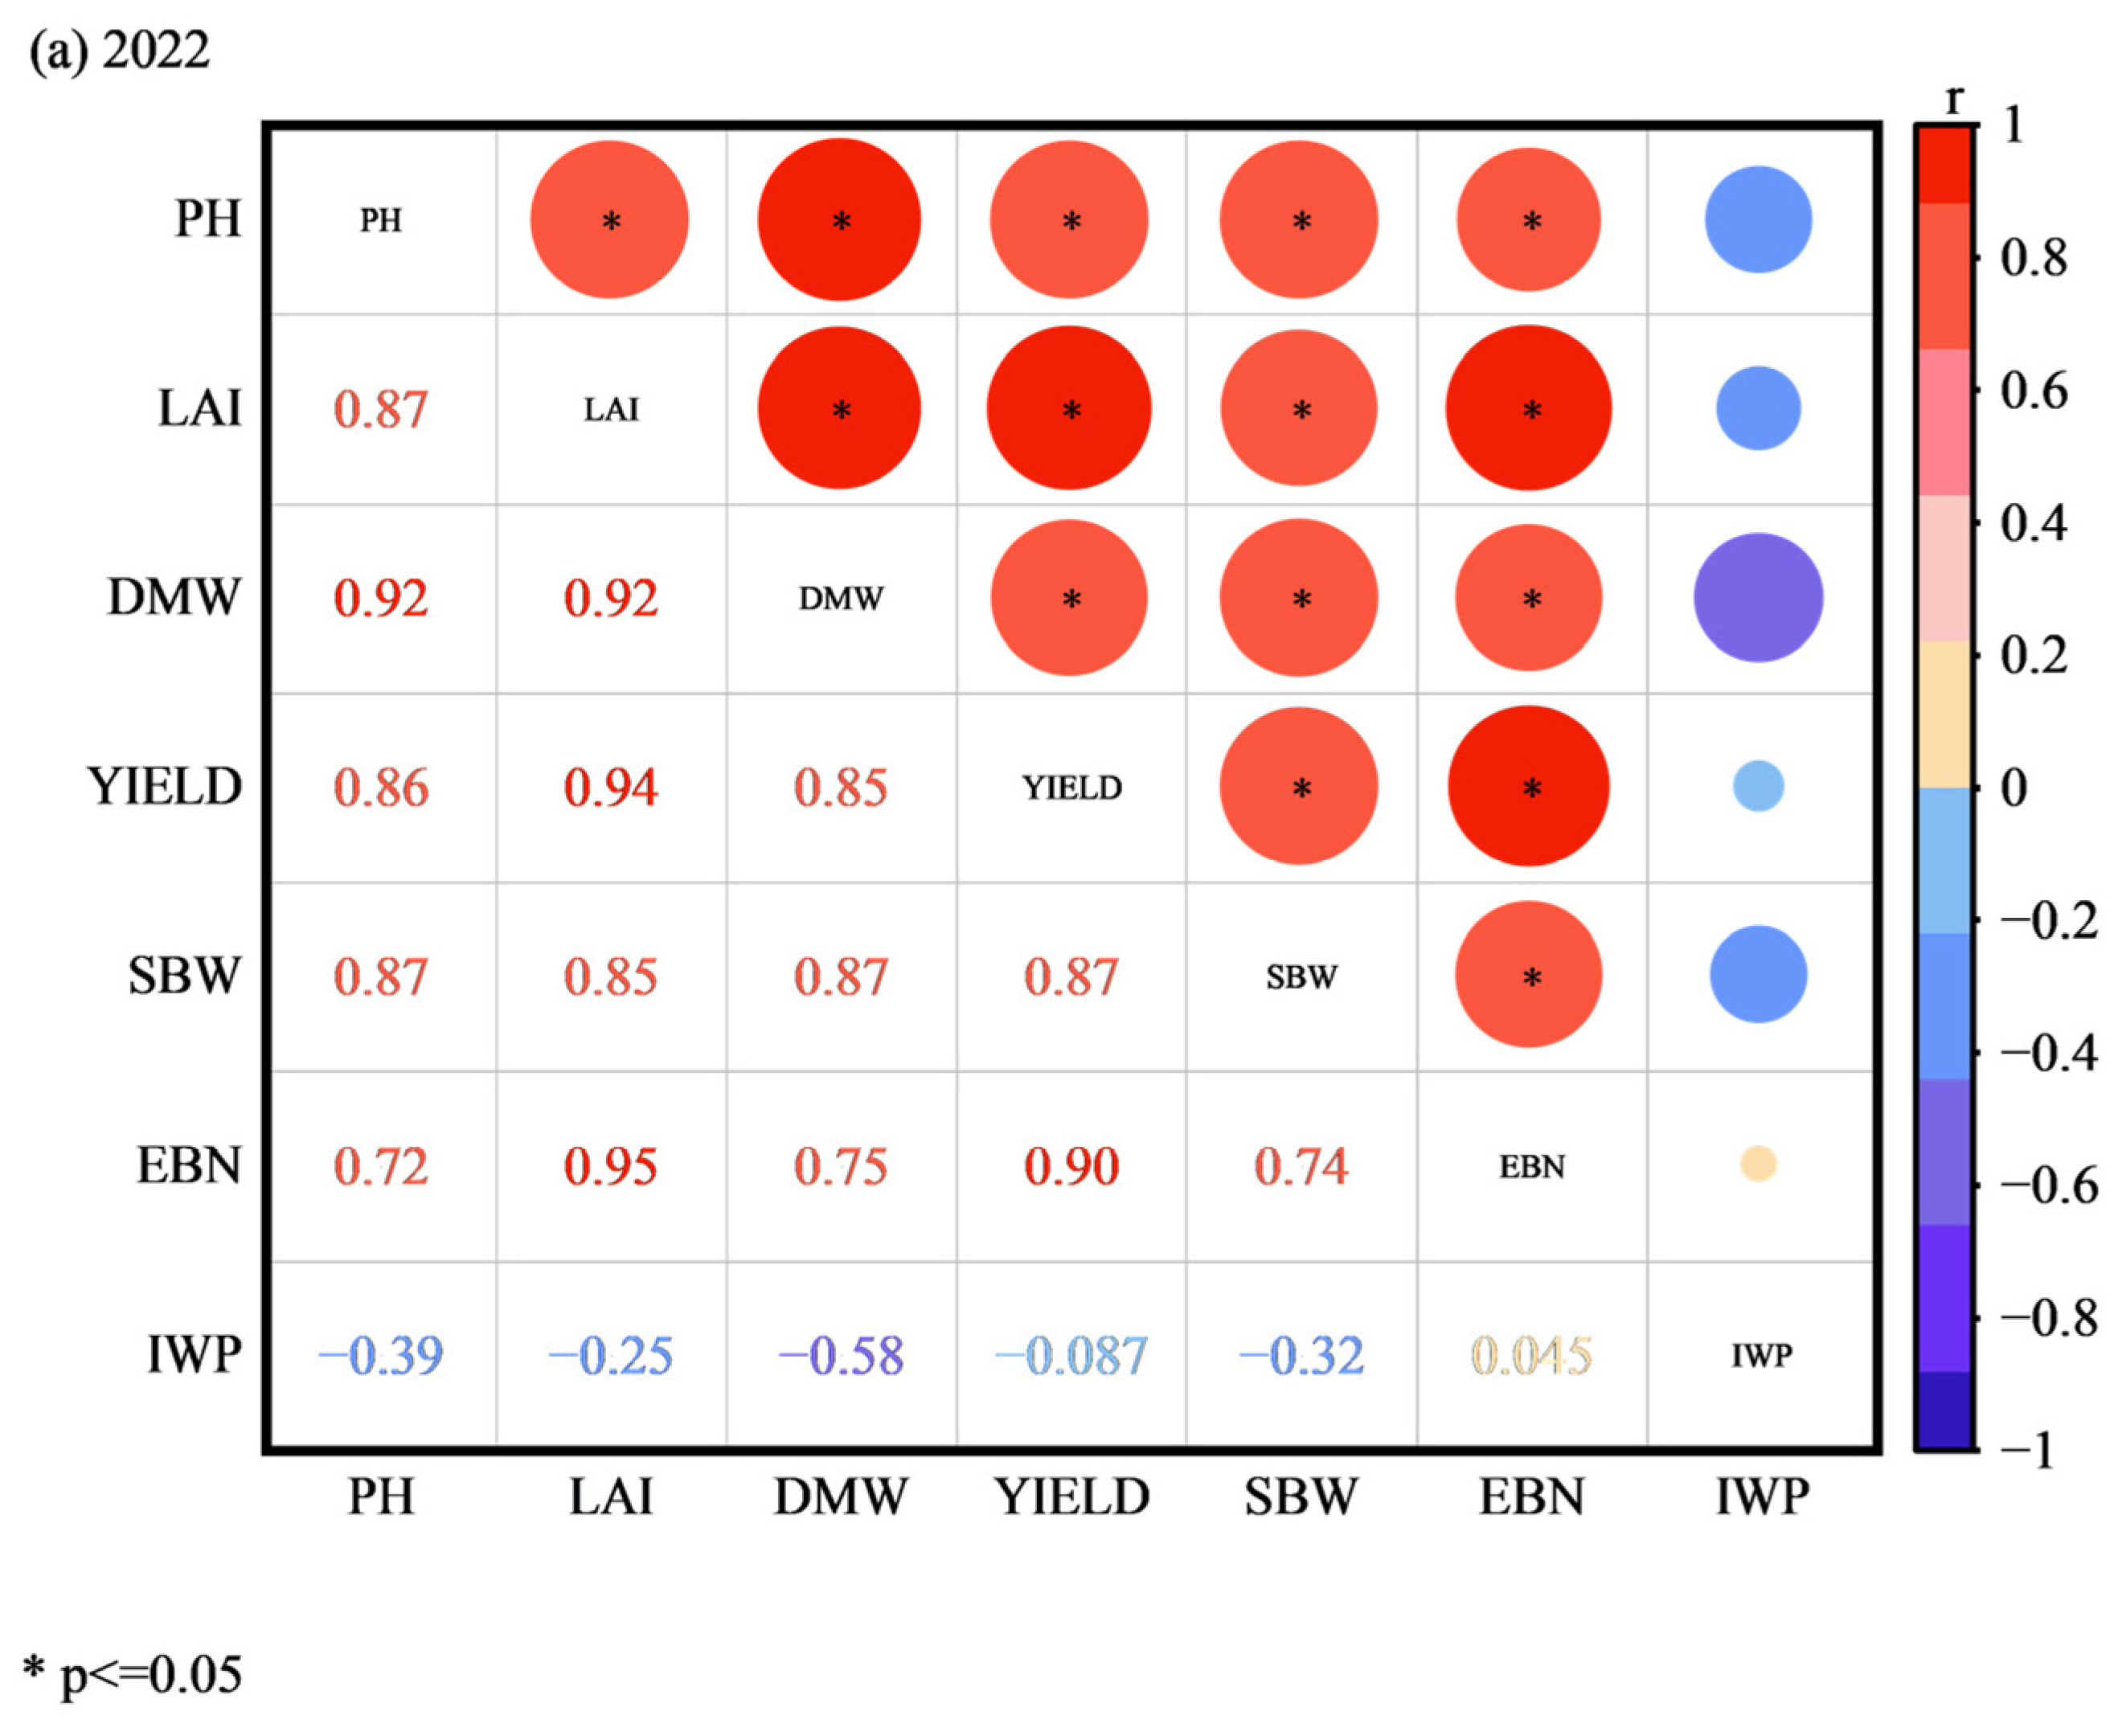
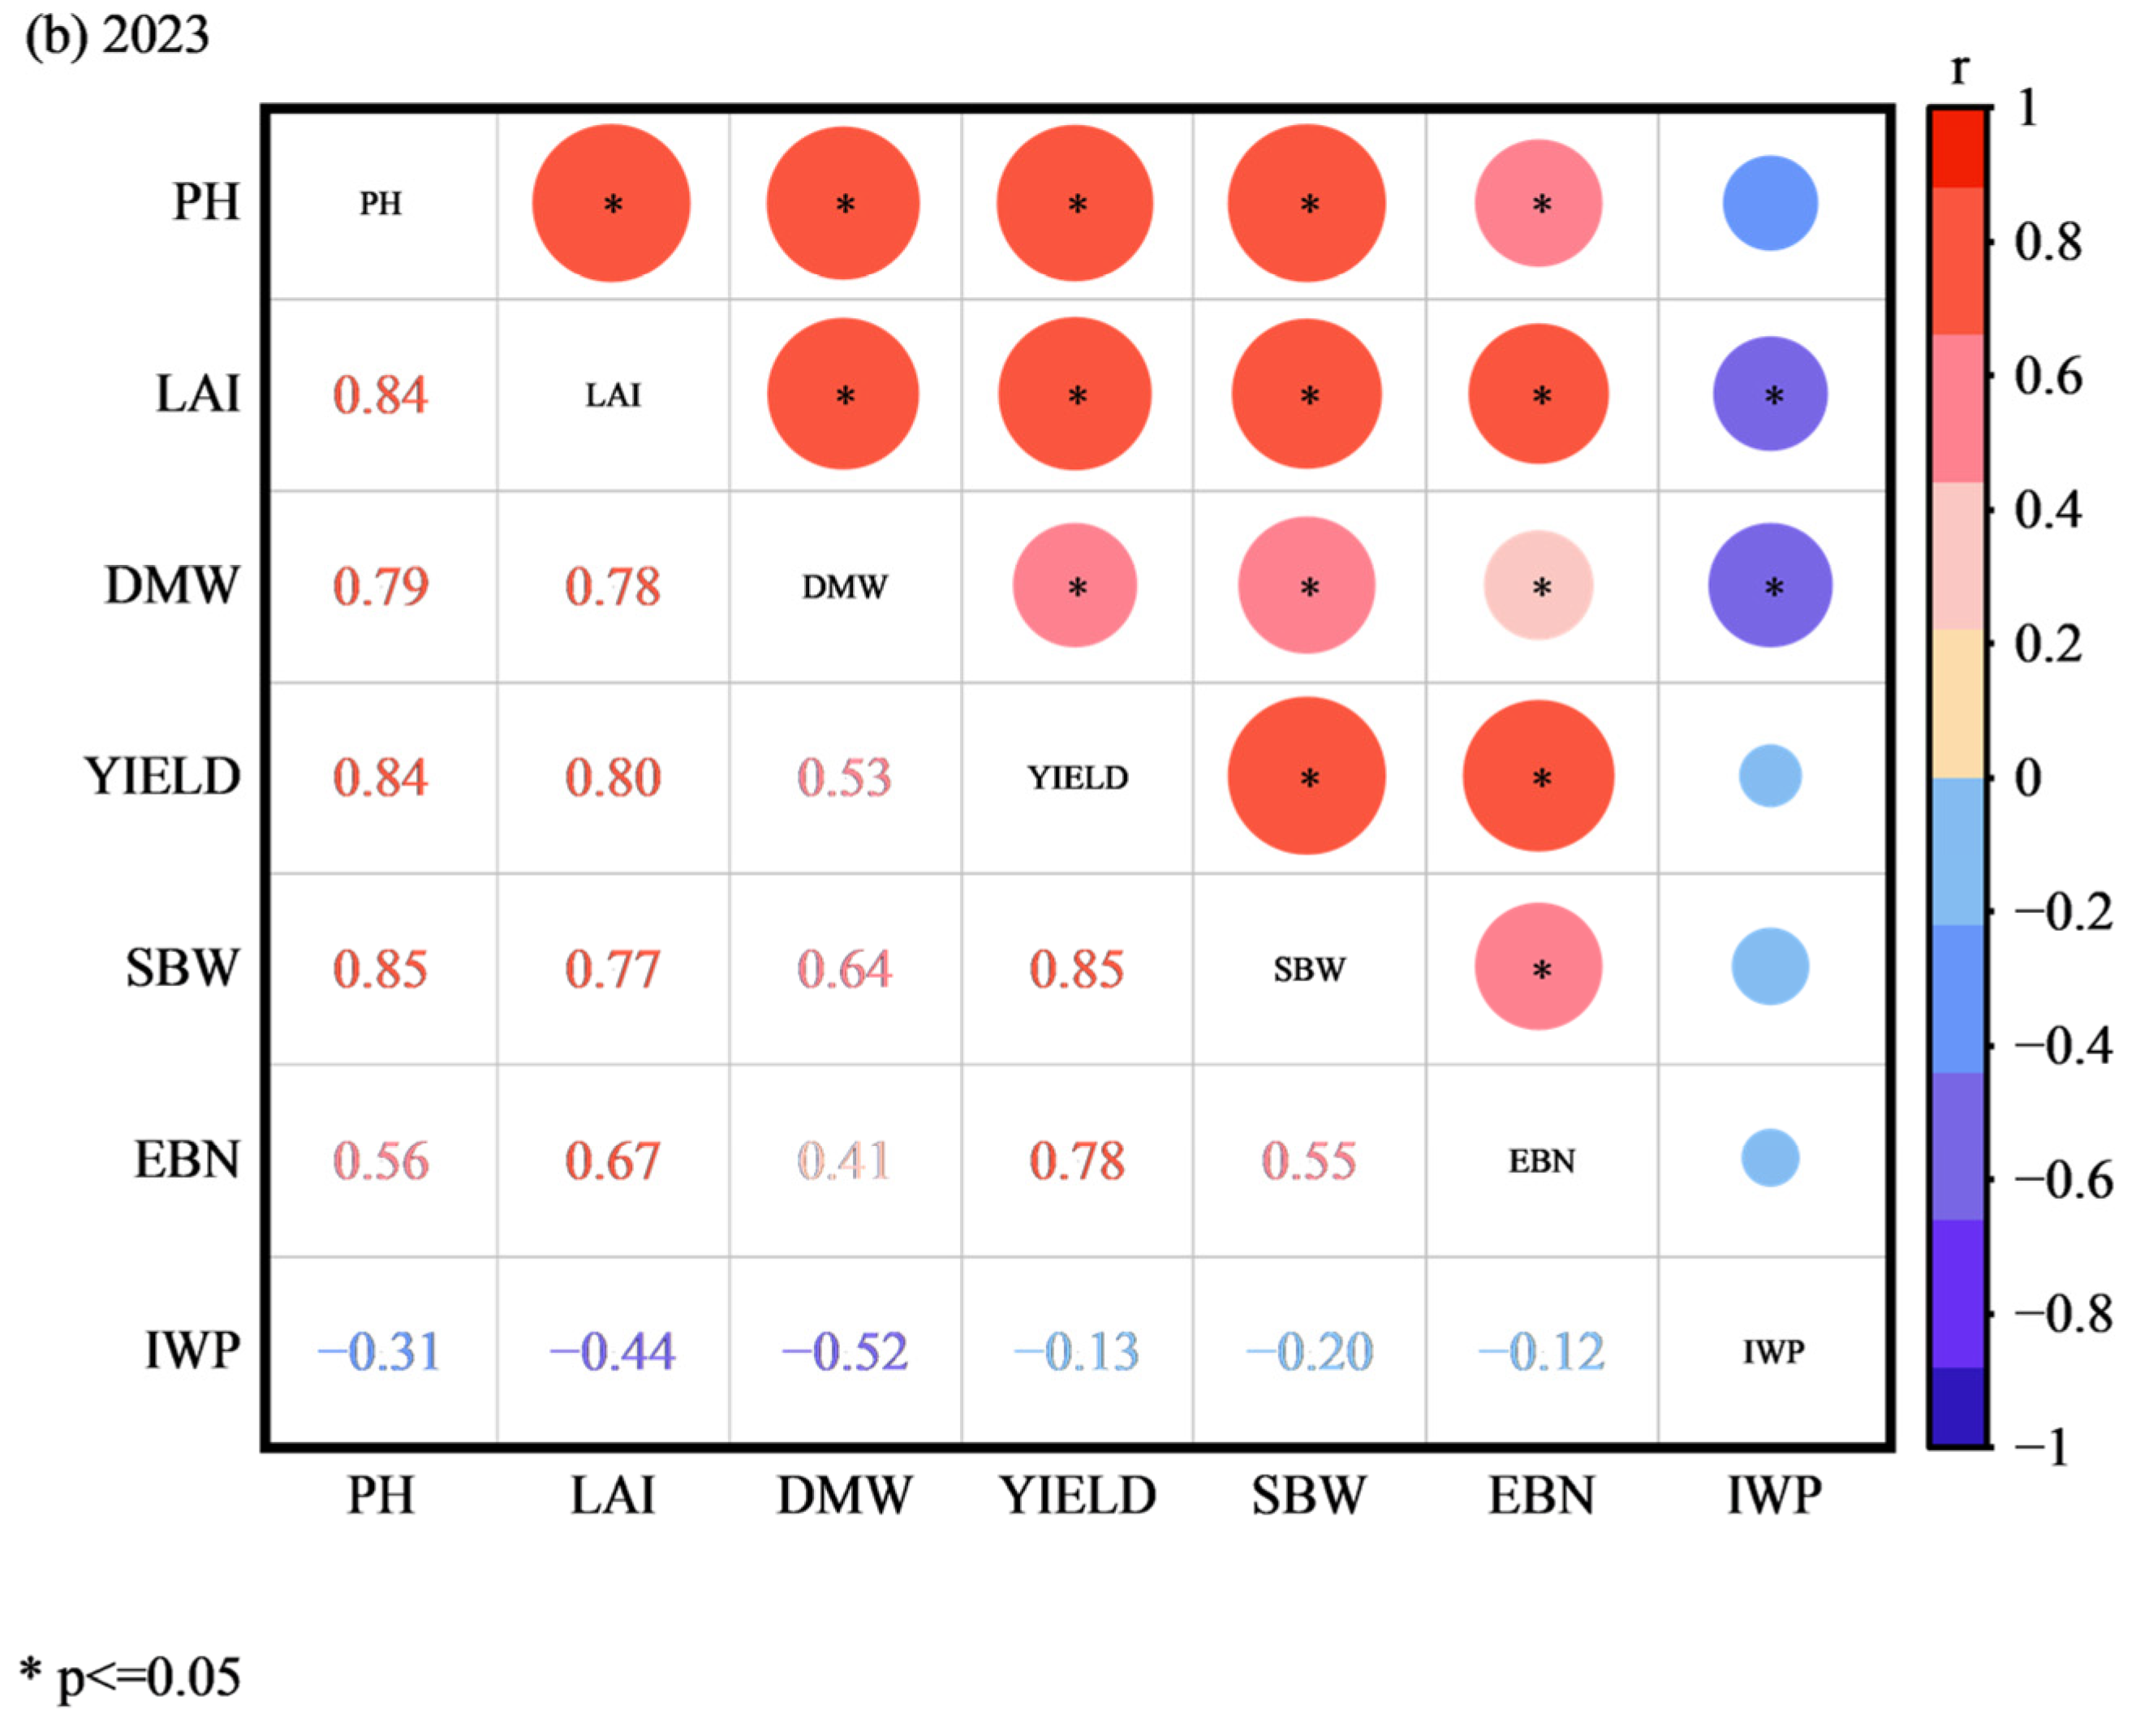
Close associations were observed among cotton growth indicators, yield components, and IWP. As shown in Figure 10, in both 2022 and 2023, plant height (PH), LAI, dry matter weight (DMW), yield, single boll weight (SBW), and effective boll number (EBN) were all significantly and positively correlated with each other. This confirms that robust vegetative growth forms the foundation for reproductive growth and high yield. However, the relationship between these growth/yield indicators and IWP was more complex. With the exception of the positive correlation between effective boll number and IWP in 2022, plant height, LAI, dry matter weight, yield, and single boll weight were all negatively correlated with IWP. This result clearly reveals that under the experimental conditions, promoting crop growth and ultimately increasing yield by raising the irrigation quota typically came at the cost of reduced output per unit of irrigation water. The correlation analysis statistically supports the field observations that optimizing drip irrigation parameters can, to some extent, reconcile the relationship between yield and IWP. For instance, the T2.4×30 treatment exhibited a relatively favorable combination of yield and IWP under both per-application irrigation quotas.

3.4. Optimization Model of Drip Irrigation Parameters

3.4.1. Yield-Based Optimization Model of Drip Irrigation Parameters

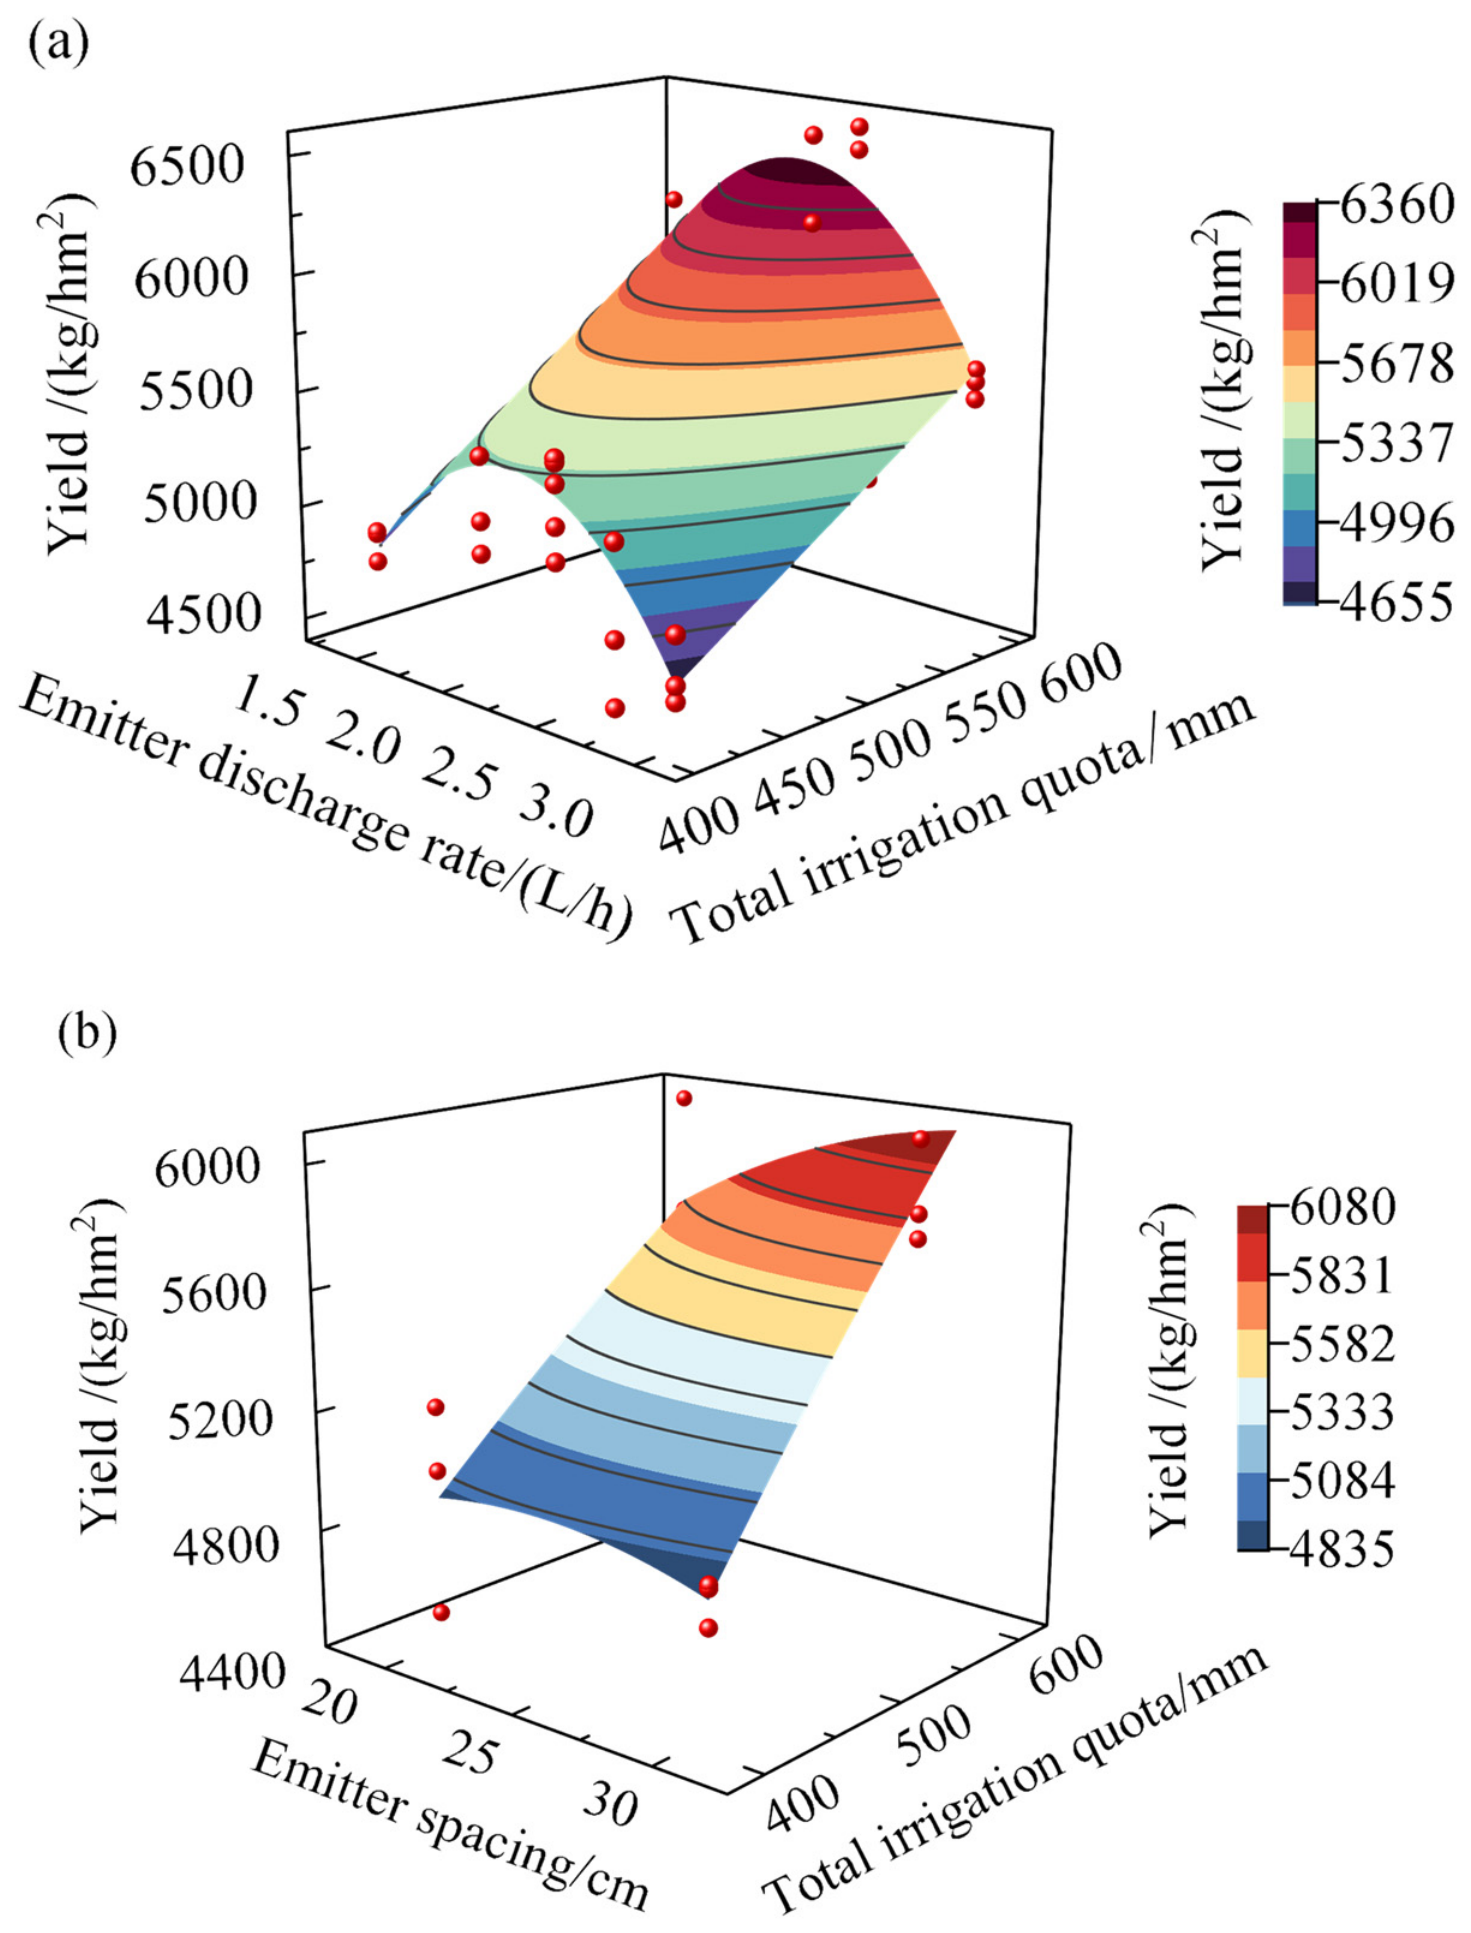
To quantify the relationships between irrigation parameters and cotton yield, two bivariate quadratic regression models (Z1 and Z2) were constructed using the pooled dataset from both years. Although the treatment structures differed between 2022 and 2023, the input variables (emitter discharge rate, emitter spacing, and total seasonal irrigation amount) are continuous agronomic parameters, and the models were fitted to the combined data to capture the general response surfaces across the tested parameter ranges. To ensure the reliability of the optimization models, the predicted trends were validated separately against the 2022 and 2023 datasets. In these models, yield served as the dependent variable, with the independent variables being emitter discharge rate and total irrigation amount for Z1, and emitter spacing and total irrigation amount for Z2. The coefficients of determination (R2) for models Z1 and Z2 were 0.91 and 0.81, respectively, indicating that the models reliably explained the relationships between yield and the parameters. As shown in Figure 11, the yield response surfaces exhibited a concave shape (opening downward), confirming the existence of a distinct yield maximum within the given parameter ranges.
The theoretical maximum yield and the corresponding optimal parameters for each combination were obtained by deriving and optimizing the models. For the emitter discharge rate model, the predicted maximum yield reached 6356.68 kg/hm2 when the emitter discharge rate was 2.09 L/h and the total seasonal irrigation amount was 5925 m3/hm2. For the emitter spacing model, the optimal spacing was 30 cm, yielding a predicted production of 6076.92 kg/hm2 under the same total irrigation amount. Comparing the two models revealed that optimizing the emitter discharge rate had greater potential for yield enhancement, while a fixed emitter spacing of 30 cm was already near-optimal. This result quantitatively confirms that employing an emitter discharge rate of approximately 2.1 L/h, combined with the irrigation amount required for root zone leaching, is an effective irrigation strategy for achieving high yield in saline–alkali cotton fields.
The forms of the yield-based regression models Z1 and Z2 are as follows:
Z 1 = 468.64 X 1 2 468.64 Y 2 0.67848 X 1 Y + 4307.44 X 1 7.11 Y 1926.37
Z 2 = 2.52 X 2 2 3.05 × 10 3 Y 2 + 0.25 X 2 Y + 17.70 X 2 + 2.58 Y + 2994.63
where Z1 and Z2 represent yield (kg/hm2), X1 is the emitter discharge rate (L/h), X2 is the emitter spacing (cm), and Y is the total seasonal irrigation amount (mm).
For model Z1 (Equation (6)), the 95% confidence intervals for the coefficients were [−142.3, −794.9], [−142.3, −794.9], [−1.89, 0.53], [3561.2, 5053.7], [−13.89, −0.33], and [−3124.1, −728.7], respectively, with n = 36. The overall model was significant (p < 0.01). Residual diagnostics confirmed approximate normality and homoscedasticity of residuals. For model Z2 (Equation (7)), the 95% confidence intervals for the coefficients were [−5.01, −0.03], [−0.0062, 0.0001], [0.13, 0.36], [7.21, 28.21], [1.42, 3.74], and [2763.1, 3226.2], respectively, with n = 12. The overall model was significant (p < 0.05). Residual diagnostics confirmed approximate normality and homoscedasticity of residuals.

3.4.2. Salt Leaching Index-Based Optimization Model of Drip Irrigation Parameters

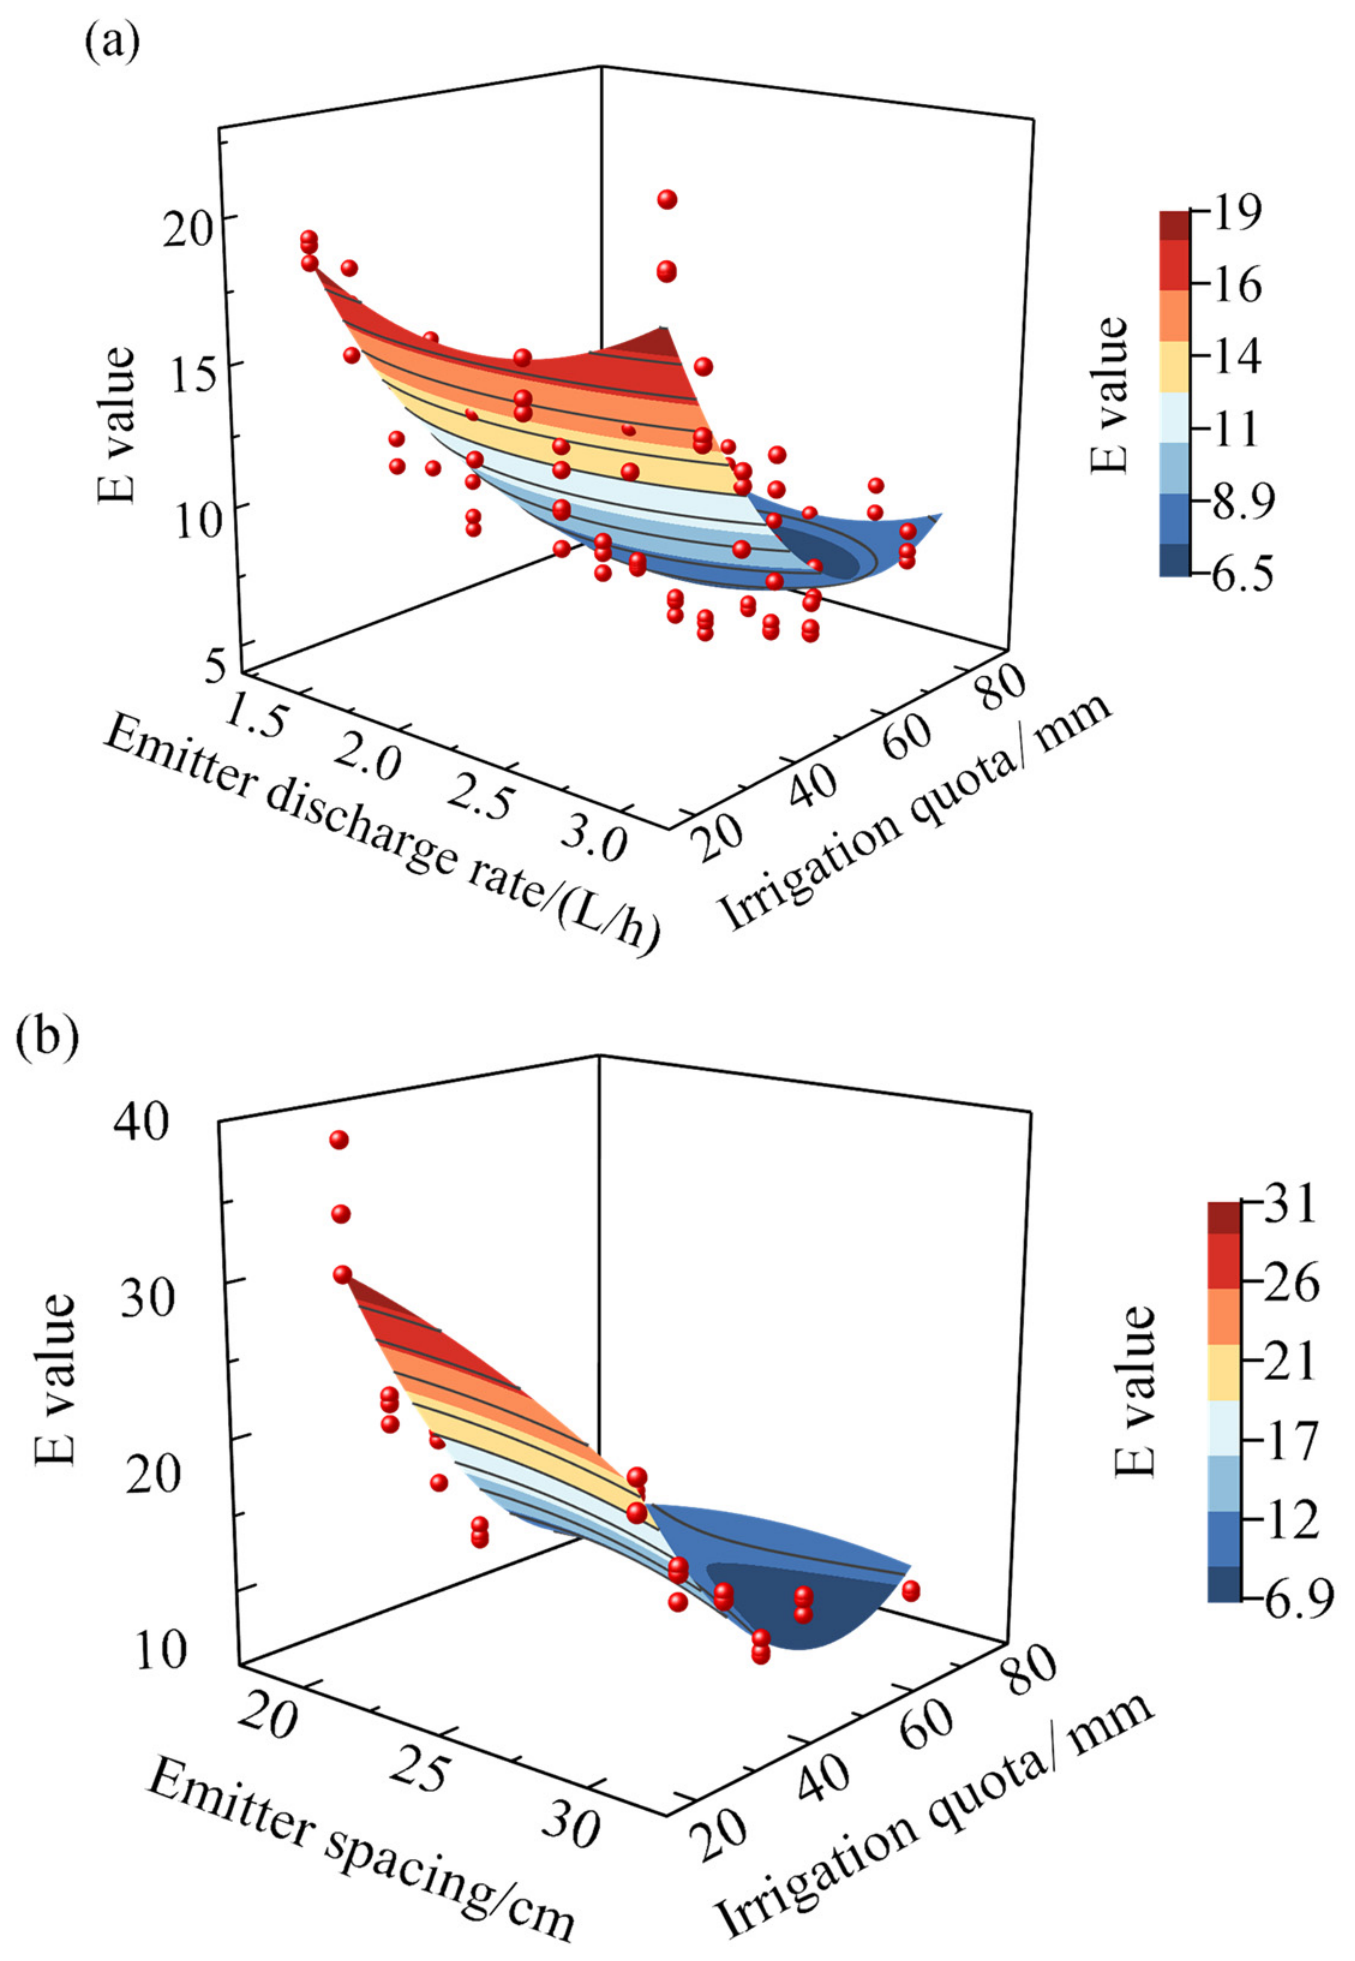
To evaluate the impact of drip irrigation parameters on root zone salt leaching performance, the salt leaching index (E) was used as the response variable. As defined in Equation (4), E represents the amount of irrigation water required per unit mass of salt leached. A smaller E value indicates that less water is required to leach a given amount of salt, and thus corresponds to higher salt leaching efficiency. Accordingly, the optimization objective was to minimize E. The coefficients of determination (R2) for the two established bivariate quadratic regression models were 0.84 and 0.89, respectively.
As shown in Figure 12, the response surfaces of E exhibited a convex shape (opening upward), with a distinct minimum point, indicating the existence of parameter combinations that minimize E. For the emitter discharge rate model, analysis showed that the irrigation quota and emitter discharge rate had similar effects on the E value, both causing it to decrease initially and then increase. Model solving indicated that the E value reached its minimum of 6.48 (representing the highest leaching efficiency) when the per-application irrigation quota was 66.3 mm and the emitter discharge rate was 2.37 L/h. For the emitter spacing model, the E value tended to increase with larger emitter spacing, while it first decreased and then increased with a higher per-application irrigation quota. The optimal solution for this model was a per-application irrigation quota of 59.08 mm and an emitter spacing of 30 cm, corresponding to a minimum E value of 6.92.
In summary, to achieve efficient root zone salt leaching, an emitter discharge rate of approximately 2.4 L/h is recommended, with the emitter spacing set at 30 cm. The per-application irrigation quota should be controlled within an appropriate range, approximately 60–66 mm. This optimization scheme provides specific parameter guidelines for effectively managing root zone salinity in saline–alkali cotton fields while ensuring cotton growth.
The forms of the salt leaching index-based regression models Z3 and Z4 are as follows:
Z 3 = 3.23 X 1 2 + 0.0053 Y 2 0.022 X 1 Y 13.50 X 1 0.65 Y + 44.09
Z 4 = 3.80 × 10 2 X 2 2 + 1.1 × 10 2 Y 2 1.86 × 10 2 X 2 Y + 0.59 X 2 1.90 Y + 63.48
where Z3 and Z4 represent the salt leaching index (E value), X1 is the emitter discharge rate (L/h), X2 is the emitter spacing (cm), and Y is the per-application irrigation quota (mm).
For model Z3 (Equation (8)), the 95% confidence intervals for the coefficients were [2.10, 4.36], [0.00436, 0.00616], [−0.0546, 0.0104], [−18.60, −8.40], [−0.777, −0.533], and [37.72, 50.46], respectively, with n = 108. All coefficients were significant at p < 0.01, indicating that this model provided the most reliable description of the response surface. Residual diagnostics confirmed approximate normality and homoscedasticity of residuals. For model Z4 (Equation (9)), the 95% confidence intervals for the coefficients were [−0.0865, 0.0095], [0.00826, 0.0145], [0.00823, 0.0291], [−0.467, 1.66], [−2.31, −1.50], and [58.68, 68.29], respectively, with n = 36. The overall model was significant (p < 0.01). Residual diagnostics confirmed approximate normality and homoscedasticity of residuals.
The response-surface optimizations separately identified the following theoretical parameter values: for yield, Z1 predicted a maximum of 6356.68 kg/hm2 at X1 = 2.09 L/h, and Z2 identified 30 cm as the optimal spacing; for salt leaching, Z3 predicted a minimum E value of 6.48 at X1 = 2.37 L/h, and Z4 also identified 30 cm as the optimal spacing. Among these models, Z3 exhibited the strongest statistical reliability. The integrated parameter interval of 2.1–2.4 L/h, 30 cm spacing, and 60–66 mm per-application irrigation quota is therefore a synthesized range derived from merging the separately optimized models, and should be regarded as a theoretical reference for future investigation rather than a confirmed agronomic recommendation. Importantly, it should be emphasized that these model-generated parameter values were not directly tested as a single combined treatment in our field experiments. The projected yield of 6356.68 kg/hm2 and the minimum E value of 6.48 were obtained from separate model optimizations (Z1 and Z3, respectively) and are not simultaneously achieved at a single parameter combination. By contrast, the field experimental data clearly showed that among all directly tested treatments, the combination of 2.4 L/h × 30 cm under the leaching irrigation quota consistently performed best in terms of both yield and salt leaching. Therefore, this experimentally supported finding serves as the primary practical recommendation, while the model predictions serve as a theoretical reference requiring independent validation under similar conditions.

4. Discussion

4.1. Effects of Drip Irrigation Parameters on Soil Water–Salt Regulation

The regulation mechanisms of drip irrigation technical parameters on the soil water–salt environment are primarily manifested in two aspects: the shaping of the wetted volume and the driving of salt transport. The per-application irrigation quota, as the key parameter determining the total water supply, significantly expanded the wetted front radius and depth when increased. The adjustment of the emitter discharge rate, on the other hand, influenced water distribution patterns by altering the hydraulic gradient [14]. While studies have focused on the impact of drip lateral layout patterns on root zone water–salt distribution, this research further refines the analysis to the emitter scale, demonstrating that optimizing the emitter discharge rate parameter can significantly improve the root zone salt environment even under the same lateral layout pattern. Significant differences in water–salt regulation efficacy exist among different drip irrigation layouts. For instance, the one-film-three-laterals-six-rows pattern has been shown to create a more optimal water–salt environment in the 0–60 cm soil layer compared to the traditional one-film-two-laterals-four-rows pattern [7]. By increasing drip lateral density, this pattern ensures continuous water supply and efficient salt leaching in the root zone, improving the soil desalination rate by 28.6% while maintaining a relatively high soil water content. This layout is particularly suitable for cotton production in saline–alkali lands, effectively mitigating the inhibitory effect of salt stress on root development.
Despite the differences in emitter configurations and irrigation quota levels between 2022 and 2023, the two years consistently demonstrated similar trends in the relative performance of treatments, particularly regarding the superior performance of the 2.4 L/h × 30 cm configuration under the leaching quota. In this study, it was observed that compared to the “narrow and deep” wetted volume typically formed by a lower discharge rate of 1.4 L/h and the “wide and shallow” wetted volume formed under a high discharge rate of 3.0 L/h, a moderate emitter discharge rate of 2.4 L/h resulted in a more uniform and moderate wetted pattern under the same per-application irrigation quota. This wetted morphology facilitated horizontal water diffusion within the primary root distribution layer (0–60 cm), enhancing the spatial uniformity of soil moisture in the root zone, thereby providing a more favorable pathway for the lateral transport and leaching of salts with water. Research indicates that soil water content distribution is more uniform at an emitter discharge rate of 2.4 L/h, supporting this study’s conclusion regarding the influence of emitter discharge rate on water distribution uniformity [15]. The findings of this study—that the most balanced water distribution and highest desalination rate occurred at 2.4 L/h—are consistent with conclusions from other studies suggesting that differences in drip wetted volume morphology affect leaching efficiency, where a suitable wetted volume shape forms the basis for effective water–salt co-regulation [17].
The regulatory effect of the per-application irrigation quota on root zone salt distribution was significantly greater than that of emitter configuration. The conventional water quota only met the basic water consumption of cotton, with limited capacity to leach salts from deeper soil layers. This led to salt accumulation in the 20–40 cm soil layer during the mid-to-late growth stages, posing a risk of salt stress. In contrast, the root zone leaching quota provided additional water beyond the immediate crop water consumption, creating a sustained downward water potential gradient that drove salts to migrate below the root zone. This mechanism aligns with the pattern revealed by model simulations in other studies, where the “leaching fraction increased significantly with increasing irrigation water volume” [9]. Higher irrigation amounts not only increased soil water storage but, more importantly, increased deep percolation, thereby removing more salts from the root zone. In this study, the leaching quota treatments resulted in an 8–15 cm increase in leaching depth during the flowering and boll-forming stage. This fully validates that implementing quantified leaching irrigation during the critical cotton growth period, in the context of “dry sowing and wet emergence” without winter/spring irrigation, is an effective strategy for actively regulating root zone salt balance and avoiding salt accumulation stress. Overall, drip irrigation parameters achieve precise control over soil salt distribution by regulating water transport processes. A reasonable parameter configuration can construct a root zone water–salt environment suitable for crop growth, providing technical assurance for high-quality and high-yield cotton production in saline–alkali lands.

4.2. Regulatory Effects of Drip Irrigation Parameters on Crop Growth and Yield

The regulatory effect of drip irrigation parameters on crop growth and development is achieved by improving the root zone water–salt environment and optimizing the water supply pattern. The irrigation quota, as a key parameter directly affecting crop water acquisition, significantly promoted cotton vegetative growth and reproductive development when moderately increased [18]. This study found that a higher root zone leaching quota significantly promoted cotton plant height, leaf area index, and dry matter accumulation. This is primarily attributed to sufficient water supply alleviating crop water stress and effective leaching of root zone salts reducing salt stress, thereby creating favorable conditions for photosynthesis and assimilate accumulation. This corroborates findings from other studies, which concluded that a 240 mm leaching amount combined with drip irrigation significantly improved cotton growth indicators and seed cotton yield [22]. The optimization of emitter parameters further amplified this positive effect. Under the leaching quota, the moderate discharge rate treatment of 2.4 L/h consistently exhibited the best growth indicators and the highest seed cotton yield. This is likely attributable to the favorable root zone water–salt environment created by this configuration. We speculate that the more uniform water distribution may have reduced root water uptake resistance, while the effective salt leaching likely alleviated ionic toxicity and osmotic inhibition [20]. In contrast, low discharge rate treatments might have induced water stress in some roots due to limited water supply coverage. One possible explanation for the relatively poor performance of high discharge rate treatments is that the shallower wetting zones might have encouraged shallower root distribution, which could in turn reduce the crop’s ability to utilize deep soil water and nutrients. However, as root distribution and root hydraulic resistance were not directly measured in this study, these proposed mechanisms warrant further investigation. Additionally, surface salt accumulation risk may increase under high temperatures due to enhanced evaporation from the wetted surface layer [4]. In summary, drip irrigation parameters regulate crop growth and development through multiple pathways. A reasonable parameter configuration can achieve the dual goals of water conservation and high yield, but it is necessary to consider the combined effects among parameters and soil environmental conditions to establish an adaptive drip irrigation technology system.

5. Conclusions

Based on two consecutive but independent years of field experiments, this study systematically investigated the regulatory effects of drip irrigation parameters on soil water–salt dynamics, cotton growth, and yield in a saline–alkali cotton field. The results demonstrated that the irrigation quota was the key factor influencing root zone water retention and salt leaching. Applying a root zone leaching quota, compared to a conventional water quota, significantly increased soil water content, expanded the wetted volume, and promoted salt leaching to deeper layers, thereby alleviating salt stress. Emitter configuration played an important role in regulating water–salt distribution. Among the tested combinations, the moderate discharge rate of 2.4 L/h paired with a 30 cm spacing resulted in more uniform water distribution and efficient salt leaching, outperforming configurations with lower or higher discharge rates. Cotton growth indicators and yield responded markedly to this water–salt regulation pattern. Suitable drip irrigation parameter combinations, while maintaining relatively high soil water content, effectively controlled root zone salinity, thereby significantly promoting cotton growth and development as well as enhancing seed cotton yield. However, increasing the irrigation amount, while boosting yield, often reduced irrigation water productivity, indicating the need to balance yield targets and water use efficiency in practical applications. Based on the experimental data, optimization models for yield and salt leaching index were constructed. Model prediction gave a parameter combination of emitter discharge rate of 2.1–2.4 L/h, spacing of 30 cm, and per-application irrigation quota of 60–66 mm for theoretical reference under the specific soil, climate (including temperature), cultivar, planting configuration, and drip irrigation system tested in Karamay. However, as these model-predicted parameters were not directly tested in this study, further field validation is needed to confirm their applicability under similar conditions. These results provide a quantitative basis for the design and management of drip irrigation systems for cotton in saline–alkali lands. Future research could validate the applicability of this model under different climatic (including temperature regimes) and soil conditions and explore water-saving and salt-controlling irrigation strategies integrated with intelligent regulation.

Author Contributions

Conceptualization, M.M. and X.X.; methodology, M.M. and X.X.; software, M.M. and Y.L.; validation, M.M., X.X. and W.X.; formal analysis, M.M. and F.D.; investigation, M.M., Y.L. and R.S.; resources, M.M., X.X. and W.X.; data curation, M.M., Y.L. and R.S.; writing—original draft preparation, M.M. and Y.L.; writing—review and editing, M.M. and Y.L.; visualization, M.M. and F.D.; supervision, M.M., X.X. and W.X.; project administration, M.M., X.X. and W.X.; funding acquisition, M.M. and X.X. All authors have read and agreed to the published version of the manuscript.

Funding

This research was funded by Youth Fund Project of Xinjiang Academy of Agricultural Sciences, grant number xjnkq-2023011; National Key Research and Development Program of China, grant number 2021YFD1900803; 2022 Tianchi Talent Introduction Program—Young Doctoral Project of Xinjiang Uygur Autonomous Region (no grant number assigned); Agricultural Science and Technology Innovation Stabilization Support Project of Xinjiang Academy of Agricultural Sciences, grant number xjnkywdzc-2024001-05-0102; Key Research and Development Program Project of Xinjiang Uygur Autonomous Region, grant number 2022B02020-3. The APC was funded by Milixiati Minaduola.

Data Availability Statement

The datasets used and analyzed in the current study are available from the corresponding author upon reasonable request.

Conflicts of Interest

The authors declare no conflicts of interest.

References

  1. Li, X.B.; Kang, Y.H. Agricultural utilization and vegetation establishment on saline-sodic soils using a water-salt regulation method for scheduled drip irrigation. Agric. Water Manag. 2020, 231, 105995. [Google Scholar] [CrossRef] [Scilit]
  2. Zhang, Z.; Hu, H.; Tian, F.; Hu, H.; Yao, X.; Zhong, R. Soil salt distribution under mulched drip irrigation in an arid area of northwestern China. J. Arid Environ. 2014, 104, 23–33. [Google Scholar] [CrossRef] [Scilit]
  3. Wang, Z.; Fan, B.; Guo, L. Soil salinization after long-term mulched drip irrigation poses a potential risk to agricultural sustainability. Eur. J. Soil Sci. 2019, 70, 20–24. [Google Scholar] [CrossRef] [Scilit]
  4. Du, Y.Q.; Liu, X.F.; Zhang, L.; Zhou, W. Drip irrigation in agricultural saline-alkali land controls soil salinity and improves crop yield: Evidence from a global meta-analysis. Sci. Total Environ. 2023, 880, 163226. [Google Scholar] [CrossRef] [Scilit] [PubMed]
  5. Liu, M.-X.; Yang, J.-S.; Li, X.-M.; Yu, M.; Wang, J. Effects of Irrigation Water Quality and Drip Tape Arrangement on Soil Salinity, Soil Moisture Distribution, and Cotton Yield (Gossypium hirsutum L.) Under Mulched Drip Irrigation in Xinjiang, China. J. Integr. Agric. 2012, 11, 502–511. [Google Scholar] [CrossRef] [Scilit]
  6. Wang, R.; Wan, S.; Sun, J.; Xiao, H. Soil salinity, sodicity and cotton yield parameters under different drip irrigation regimes during saline wasteland reclamation. Agric. Water Manag. 2018, 209, 20–31. [Google Scholar] [CrossRef] [Scilit]
  7. Wang, D.; Wang, Z.; Zhang, J.; Lyu, T.; Zhou, B.; Li, W. Effects of drip tape modes on machine-harvest cotton growth and soil water, heat and salt distribution in Northern Xinjiang of China. Trans. Chin. Soc. Agric. Eng. 2022, 38, 76–86. [Google Scholar] [CrossRef]
  8. Ma, Z.; Zhang, J.; Li, W.; Ye, H.; Yin, F.; Wen, Y.; Wang, Z. The dual-threat: How saline water irrigation compromises soil health and seed cotton yield under mulched drip irrigation in Xinjiang, China. Agric. Water Manag. 2025, 320, 109847. [Google Scholar] [CrossRef] [Scilit]
  9. Ning, S.; Zhou, B.; Shi, J.; Wang, Q. Soil water/salt balance and water productivity of typical irrigation schedules for cotton under film mulched drip irrigation in northern Xinjiang. Agric. Water Manag. 2021, 245, 106651. [Google Scholar] [CrossRef] [Scilit]
  10. Ren, F.; Yang, G.; Li, W.; He, X.; Gao, Y.; Tian, L.; Li, F.; Wang, Z.; Liu, S. Yield-compatible salinity level for growing cotton (Gossypium hirsutum L.) under mulched drip irrigation using saline water. Agric. Water Manag. 2021, 250, 106859. [Google Scholar] [CrossRef] [Scilit]
  11. Li, Z.P.; Wan, S.M.; Chen, G.D.; Han, Y.C.; Lei, Y.P.; Ma, Y.Z.; Xiong, S.W.; Mao, T.Y.; Feng, L.; Wang, G.P.; et al. Effects of irrigation regime on soil hydrothermal microenvironment, cotton biomass, and yield under non-film drip irrigation system in cotton fields in southern Xinjiang, China. Ind. Crops Prod. 2023, 198, 116738. [Google Scholar] [CrossRef] [Scilit]
  12. Wang, L.; Liu, X.; Wang, S.; He, S. Leaching amount and period regulated saline-alkaline soil water-salinity dynamics and improved cotton yield in southern Xinjiang, China. J. Arid Land 2025, 17, 823–845. [Google Scholar] [CrossRef] [Scilit]
  13. Che, Z.; Wang, J.; Li, J. Effects of water quality, irrigation amount and nitrogen applied on soil salinity and cotton production under mulched drip irrigation in arid Northwest China. Agric. Water Manag. 2021, 247, 106738. [Google Scholar] [CrossRef] [Scilit]
  14. Xiao, C.; Zhang, F.; Li, Y.; Fan, J.; Xu, X.; Liu, X. Optimal drip irrigation leaching amount and times enhance seed cotton yield and its stability by improving soil chemical environment and source-sink relationship. Field Crops Res. 2024, 317, 109531. [Google Scholar] [CrossRef] [Scilit]
  15. Zhang, T.B.; Zhan, X.Y.; He, J.Q.; Feng, H.; Kang, Y.H. Salt characteristics and soluble cations redistribution in an impermeable calcareous saline-sodic soil reclaimed with an improved drip irrigation. Agric. Water Manag. 2018, 197, 91–99. [Google Scholar] [CrossRef] [Scilit]
  16. Liu, S.H.; Wang, N.; Li, D.Z.; Tian, C.Y.; Zhang, K.; Hu, M.F.; Niu, H.S.; Zhao, Z.Y. Effects of halophyte Suaeda salsa continuous cropping on physical and chemical properties of saline soil under drip irrigation in arid regions. Agric. Ecosyst. Environ. 2024, 371, 109076. [Google Scholar] [CrossRef] [Scilit]
  17. Hou, X.; Xiang, Y.; Fan, J.; Zhang, F.; Hu, W.; Yan, F.; Xiao, C.; Li, Y.; Cheng, H.; Li, Z. Spatial distribution and variability of soil salinity in film-mulched cotton fields under various drip irrigation regimes in southern Xinjiang of China. Soil Tillage Res. 2022, 223, 105470. [Google Scholar] [CrossRef] [Scilit]
  18. Li, W.; Zhang, C.; Zou, M.; Lai, H.; Javed, T.; Wang, Z. Optimizing irrigation salinity for cotton production through cotton yield and fiber quality and water use efficiency in arid regions. Ind. Crops Prod. 2025, 233, 121375. [Google Scholar] [CrossRef] [Scilit]
  19. Ma, Z.L.; Liu, J.; Zhang, J.Z.; Yin, F.H.; Guo, L.; Wen, Y.; Song, L.B.; Zhu, Y.; Liang, Y.H.; Wang, Z.H. Ultra-wide film mulching with moderate irrigation water salinity enhances cotton growth under drip irrigation in Xinjiang, China. Field Crops Res. 2024, 315, 109485. [Google Scholar] [CrossRef] [Scilit]
  20. Li, N.; Shi, X.; Zhang, H.; Shi, F.; Zhang, H.; Liang, Q.; Hao, X.; Luo, H.; Wang, J. Optimizing irrigation strategies to improve the soil microenvironment and enhance cotton water productivity under deep drip irrigation. Agric. Water Manag. 2024, 305, 109095. [Google Scholar] [CrossRef] [Scilit]
  21. Lin, X.; Wang, Z.; Li, J. Identifying the factors dominating the spatial distribution of water and salt in soil and cotton yield under arid environments of drip irrigation with different lateral lengths. Agric. Water Manag. 2021, 250, 106834. [Google Scholar] [CrossRef] [Scilit]
  22. Hu, Q.; Cao, H.; He, Z.; Shi, H.; Ren, Z.; Qi, C. Effects of leaching amounts and drip irrigation types on water-salt distribution and seed cotton yield in northern Xinjiang, China. Field Crops Res. 2025, 328, 109947. [Google Scholar] [CrossRef] [Scilit]
Figure 1. Cotton planting pattern with one plastic film, three drip irrigation laterals, and six rows (66 + 10 cm wide-narrow row arrangement).
Agronomy 16 01730 g001
Figure 2. Installation of soil sensors within a plot: (a) schematic diagram of sensor positions; (b) photograph of field installation.
Agronomy 16 01730 g002aAgronomy 16 01730 g002b
Figure 3. Soil water content distribution one day after irrigation under different emitter parameter and irrigation quota treatments.
Agronomy 16 01730 g003aAgronomy 16 01730 g003b
Figure 4. Soil electrical conductivity distribution one day after irrigation under different emitter parameters and irrigation quota treatments.
Agronomy 16 01730 g004aAgronomy 16 01730 g004b
Figure 5. Average soil water content in the root zone across growth stages under different emitter parameter and irrigation quota treatments. Different lowercase letters above the error bars indicate significant differences (p < 0.05) among the treatments within the same growth stage.
Agronomy 16 01730 g005
Figure 6. Average soil electrical conductivity in the root zone across growth stages under different emitter parameter and irrigation quota treatments. Different lowercase letters above the error bars indicate significant differences (p < 0.05) among the treatments within the same growth stage.
Agronomy 16 01730 g006
Figure 7. Cotton plant height dynamics across growth stages. Different lowercase letters above the error bars indicate significant differences (p < 0.05) among the treatments within the same growth stage.
Agronomy 16 01730 g007aAgronomy 16 01730 g007b
Figure 8. Cotton leaf area index dynamics across growth stages. Different lowercase letters above the error bars indicate significant differences (p < 0.05) among the treatments within the same growth stage.
Agronomy 16 01730 g008
Figure 9. Cotton aboveground dry matter weight dynamics across growth stages. Different lowercase letters above the error bars indicate significant differences (p < 0.05) among the treatments within the same growth stage.
Agronomy 16 01730 g009aAgronomy 16 01730 g009b
Figure 10. Correlations among cotton growth indicators, yield, and irrigation water productivity.
Agronomy 16 01730 g010aAgronomy 16 01730 g010b
Figure 11. Yield-based optimization model for drip irrigation parameters: (a) response surface for emitter discharge rate and total seasonal irrigation amount; (b) response surface for emitter spacing and total seasonal irrigation amount.
Agronomy 16 01730 g011
Figure 12. Salt leaching index-based optimization model for drip irrigation parameters: (a) response surface for emitter discharge rate and per-application irrigation quota; (b) response surface for emitter spacing and per-application irrigation quota.
Agronomy 16 01730 g012
Table 1. Soil physical properties of the experimental site.
Soil Depth, cmClay, %
(<0.002 mm)
Silt, %
(0.05–0.002 mm)
Sand, %
(2–0.05 mm)
Soil TextureBulk Density, g·cm−3Field Capacity, %
0–2024.0832.0043.92Clay loam1.5121.11
20–4028.0846.0025.92Silty clay1.5524.46
40–6028.0858.0013.92Silty clay1.5527.57
60–8042.0848.009.92Silty clay1.4827.24
80–10052.0836.0011.92Clay1.5923.50
Table 2. Experimental treatments of drip irrigation parameters and irrigation quotas.
YearTreatmentsEmitter Discharge Rate/(L/h)
×Emitter Spacing/cm
Irrigation Quota Per Application/(m3/hm2)
2022T1.4×30W52.51.4 × 30525
T2.4×30W52.52.4 × 30525
T3.0×30W52.53.0 × 30525
T3.0×20W52.53.0 × 20525
T1.4×30W751.4 × 30750
T2.4×30W752.4 × 30750
T3.0×30W753.0 × 30750
T3.0×20W753.0 × 20750
2023T1.4×20W52.51.4 × 20525
T2.0×30W52.52.0 × 30525
T2.4×30W52.52.4 × 30525
T2.7×30W52.52.7 × 30525
T1.4×20W701.4 × 20700
T2.0×30W702.0 × 30700
T2.4×30W702.4 × 30700
T2.7×30W702.7 × 30700
Table 3. Cotton yield, boll weight, effective boll number and irrigation water productivity.
YearTreatmentsSingle Boll Weight, gEffective Boll Number, Bolls/PlantYield, kg/hm2IWP, kg/m3
2022T1.4×30W52.55.11 ± 0.08 a8.17 ± 0.05 de4839.67 ± 60.99 e1.13 ± 0.15 b
T2.4×30W52.55.17 ± 0.13 a8.42 ± 0.04 cd5194.94 ± 177.88 d1.26 ± 0.09 a
T3.0×30W52.55.11 ± 0.13 a8.13 ± 0.05 de4705.30 ± 116.37 e1.23 ± 0.14 b
T3.0×20W52.55.07 ± 0.15 a7.84 ± 0.10 e4328.88 ± 43.48 f1.01 ± 0.05 c
T1.4×30W755.30 ± 0.13 a9.00 ± 0.31 ab5888.84 ± 134.9 b0.98 ± 0.07 d
T2.4×30W755.37 ± 0.18 a9.29 ± 0.23 a6343.12 ± 203.51 a0.97 ± 0.06 c
T3.0×30W755.26 ± 0.17 a8.72 ± 0.13 bc5518.87 ± 52.53 c1.05 ± 0.08 e
T3.0×20W755.20 ± 0.16 a8.52 ± 0.08 c5210.63 ± 56.45 d0.92 ± 0.10 e
T********
W**NS****
2023T1.4×20W52.55.18 ± 0.08 de6.23 ± 0.09 ab4910.43 ± 292.63 de1.13 ± 0.12 abc
T2.0×30W52.55.21 ± 0.12 cde6.45 ± 0.16 ab5121.62 ± 172.57 cde1.26 ± 0.06 a
T2.4×30W52.55.36 ± 0.08 bcd6.53 ± 0.08 ab5355.43 ± 41.84 bcd1.23 ± 0.12 ab
T2.7×30W52.55.15 ± 0.06 e6.17 ± 0.40 b4800.36 ± 281.04 e1.01 ± 0.04 cd
T1.4×20W705.47 ± 0.10 ab6.74 ± 0.39 ab5706.24 ± 280.43 ab0.98 ± 0.06 cd
T2.0×30W705.54 ± 0.06 ab6.83 ± 0.51 ab5876.62 ± 100.10 ab0.97 ± 0.04 cd
T2.4×30W705.65 ± 0.09 a6.92 ± 0.26 a6175.59 ± 283.00 a1.05 ± 0.06 bcd
T2.7×30W705.40 ± 0.06 bc6.61 ± 0.11 ab5500.55 ± 290.54 bc0.92 ± 0.10 d
T*NS**
W******
Note: Different lowercase letters within a column indicate significant differences at p < 0.05. * and ** denote significant differences at p < 0.05 and p < 0.01, respectively. NS indicates no significant difference. T represents the combined emitter configuration (discharge rate × spacing) as a categorical factor; W represents the per-application irrigation quota. Because emitter configurations were tested as specific paired combinations rather than a full factorial design, independent main effects of discharge rate or spacing, and their interaction, are not estimated; therefore, the T × W term is not included in the analysis. The 2022 and 2023 experiments had different emitter configurations and irrigation quota levels; therefore, data from the two years were analyzed separately and are presented side-by-side for comparison of overall trends, not as statistical replicates.
Disclaimer/Publisher’s Note: The statements, opinions and data contained in all publications are solely those of the individual author(s) and contributor(s) and not of MDPI and/or the editor(s). MDPI and/or the editor(s) disclaim responsibility for any injury to people or property resulting from any ideas, methods, instructions or products referred to in the content.