1. Introduction
Lignans represent a class of low-molecular-weight polyphenolic secondary metabolites originating from the phenylpropanoid pathway and are broadly present in plants. They are generally formed through the oxidative coupling of two C6–C3 phenylpropanoid units and play important roles in plant defense, antioxidant responses, and seed quality formation [
1,
2,
3]. Lignan biosynthesis begins with the stereoselective coupling of monolignol precursors. In this pathway, coniferyl alcohol can be converted into pinoresinol through the action of oxidases and dirigent proteins [
4,
5]. Subsequently, pinoresinol-lariciresinol reductase (PLR) uses NADPH or NADH as a reducing cofactor to catalyze the reduction of pinoresinol to lariciresinol and is further involved in the formation of downstream lignan precursors such as secoisolariciresinol [
6,
7,
8]. Therefore, PLR is regarded as a key enzyme in the early reductive steps of lignan biosynthesis, and changes in its activity or expression may influence the accumulation and distribution of lignan components in different plant tissues [
9].
PLR genes and their homologs have been cloned from diverse plant species, and their biological functions have been experimentally characterized. Early studies isolated PLR proteins from
Forsythia intermedia and demonstrated their ability to catalyze pinoresinol- and lariciresinol-related reduction reactions in the lignan biosynthetic pathway. Subsequently, PLR or PLR-like genes associated with lignan biosynthesis were characterized in
Thuja plicata,
Arabidopsis thaliana,
Schisandra chinensis, and species of the genus
Linum, indicating that this class of reductases is broadly conserved among plant species [
1,
10]. Notably, PLR members from different species, or even within the same species, may exhibit distinct substrate preferences and stereoselectivities, thereby affecting lignan composition and enantiomeric profiles [
11,
12]. In flax, PLR proteins with opposite stereoselectivities have been shown to influence the enantiomeric composition of lignans, providing important evidence for understanding lignan metabolism in this species. However, previous studies have mainly focused on the cloning, enzymatic properties, or specific metabolic functions of a limited number of PLR genes. A genome-wide characterization of the flax PLR gene family based on a high-quality reference genome, together with an integrated analysis of its evolutionary features, expression patterns, and relationship with lignan accumulation during seed development, remains limited [
13,
14]. Additionally, genome-wide analyses of PLR families in
Arabidopsis thaliana, cotton and soybean have provided valuable references for evolutionary comparison in this study.
Flax (
Linum usitatissimum L.) is an important economic crop with fiber, oilseed, and nutritional value [
15]. Its seeds are rich in α-linolenic acid, dietary fiber, proteins, and various phenolic bioactive compounds, making them valuable for nutritional and functional applications [
16]. Among the functional components of flaxseed, lignans represent an important group of phenylpropanoid-derived secondary metabolites [
17]. In particular, secoisolariciresinol diglucoside (SDG) is considered one of the most representative lignan compounds in flaxseed and contributes substantially to its nutritional quality and functional value [
9,
18]. A high-quality telomere-to-telomere (T2T) genome provides an important foundation for accurate gene family identification, structural characterization, and evolutionary analysis in flax [
19]. In the present study,
LuPLR genes were systematically identified from the T2T genome assembly of the flax cultivar ‘Gaosi’. Their physicochemical characteristics, phylogenetic relationships, chromosomal locations, exon–intron organization, conserved motif composition, duplication patterns, promoter cis-acting elements, and expression profiles were subsequently investigated. In addition, lignan contents in flax seeds at different days after flowering were determined, and quantitative real-time PCR (qRT-PCR) combined with Pearson correlation analysis was used to screen candidate
LuPLR genes associated with lignan accumulation [
13]. Subcellular localization analysis was further conducted for the priority candidate gene [
20]. Together, these findings broaden our understanding of the flax PLR gene family and provide candidate gene resources for flaxseed quality improvement and the functional analysis of lignan-related genes [
21].
2. Materials and Methods
2.1. Plant Growth and Seed Collection
The flax (
Linum usitatissimum L.) cultivar ‘Gaosi’ was used as the experimental material in this study. Plants were grown in the experimental field of Jilin Agricultural University under natural light conditions and managed according to standard field practices. To ensure sample consistency among different developmental stages, plants with similar growth vigor, normal development, and no obvious disease or pest symptoms were selected and tagged at the full-bloom stage. The day of flower opening was defined as 0 days after flowering (DAF). Flax capsule samples were collected at 5, 10, 20, 30, and 40 DAF [
22]. At each developmental stage, three independent biological replicates were generated by pooling capsules from at least 10 plants at the same stage, thereby reducing the influence of individual variation on downstream analyses.
After collection, the samples were immediately placed in an ice box and transported to the laboratory, where the seeds were rapidly separated from the capsules. After separation, seeds were used for lignan determination and expression profiling. For RNA-related analyses, seed samples were immediately frozen in liquid nitrogen and maintained at −80 °C until RNA isolation and qRT-PCR [
23]. Seed samples used for lignan content determination were freeze-dried, ground into powder, and stored under dry and low-temperature conditions until further use. All samples were collected within the same time period to minimize the effects of circadian rhythm and environmental fluctuations on gene expression and metabolite accumulation. This sampling design was used to compare dynamic changes in lignan content during flax seed development and to further analyze the relationship between
LuPLR gene expression patterns and lignan accumulation [
24].
2.2. Identification of LuPLR Genes
For genome-wide identification of flax PLR genes, two previously characterized pinoresinol reductase protein sequences from
Arabidopsis thaliana (AT1G32100.1 and AT4G13660.1) were used as queries to search the flax whole-genome protein database using BLASTP v2.12.0, with an E-value threshold of 1 × 10
−5. In parallel, the PLR-related HMM profile PF01370 was obtained from Pfam and used to query the flax protein dataset with hmmsearch in HMMER 3.0, applying the same E-value threshold. The resulting candidate sequences from both methods were pooled, followed by removal of redundant entries according to gene ID and protein sequence identity [
25].
The candidate proteins were then submitted to SMART (Available online:
https://smart.embl.de/; accessed on 10 March 2026) and NCBI CDD (Available online:
https://www.ncbi.nlm.nih.gov/cdd/; accessed on 10 March 2026) for conserved domain validation. Only proteins containing a complete PLR-related domain were retained as LuPLR family members. Sequences lacking the conserved domain or representing redundant isoforms were excluded. Finally, a total of 18 flax PLR genes were identified and named
LuPLR1 to
LuPLR18 according to their physical positions on chromosomes.
The amino acid length and other physicochemical features of
LuPLR proteins, including MW, theoretical pI, instability index, aliphatic index, and GRAVY value, were obtained using ExPASy ProtParam (Available online:
https://web.expasy.org/protparam/; accessed on 10 March 2026). BUSCA (Available online:
https://busca.biocomp.unibo.it/; accessed on 10 March 2026) was used to infer the potential intracellular localization of each LuPLR protein.
2.3. Phylogenetic, Structural, and Chromosomal Analyses of LuPLR Genes
Three representative dicot species were selected for phylogenetic analysis:
Arabidopsis thaliana as a well-characterized model reference, and upland cotton and soybean as important dicot crops with high-quality genomes and active seed phenylpropanoid metabolism. Multiple alignment of PLR proteins from
Arabidopsis thaliana, flax,
Gossypium hirsutum, and
Glycine max was carried out using ClustalW in MEGA v11 (gap opening penalty = 10, gap extension penalty = 0.2, Gonnet matrix, delay divergent sequences = 30%). After model testing, the best-fit substitution model was applied to generate an ML phylogenetic tree with 1000 bootstrap replicates. The partial deletion option was selected to handle gaps and missing residues, and the resulting tree was further edited in iTOL v6 (Available online:
https://itol.embl.de/; accessed on 12 March 2026).
The GFF3 annotation file of the ‘Gaosi’ flax (
Linum usitatissimum L.) T2T reference genome was obtained from the published genome study [
14], and the supporting data is available at
https://doi.org/10.1093/hr/uhaf127 (accessed on 10 March 2026), followed by visualization in TBtools v2.069. Protein conserved domains were checked with NCBI CDD CD-Search, and motif prediction was performed using MEME Suite v5.5.4 (Available online:
https://meme-suite.org/meme/; accessed on 10 March 2026). The GFF3 file was also used to obtain exon–intron structures. Finally, TBtools v2.069 was employed to present the chromosomal distribution, gene organization, conserved domains, and motif composition of LuPLR members.
2.4. Gene Duplication and Synteny Analysis of LuPLR Genes
These three species were selected for cross-species synteny analysis to explore the evolutionary conservation and divergence of PLR genes between model plants and dicot crops. The genome sequences and GFF3 annotation files of
Arabidopsis thaliana (At), upland cotton (
Gossypium hirsutum, Gh), and soybean (
Glycine max, Gm) were downloaded from Phytozome v13 (Available online:
https://phytozome-next.jgi.doe.gov/; accessed on 8 March 2026) [
26]. Based on gene position information and protein homology relationships between flax and the above species, intraspecific and interspecific synteny analyses were performed using the MCScanX (Available online:
https://github.com/wyp1125/MCScanX accessed on 15 March 2026) toolkit to identify conserved syntenic blocks associated with
LuPLR genes [
27].
The duplication types of LuPLR genes within the flax genome were determined according to the MCScanX results. Homologous LuPLR genes located in adjacent regions on the same chromosome and separated by a short physical distance were defined as tandemly duplicated genes. Homologous gene pairs located within syntenic blocks were considered to have potentially originated from segmental duplication or whole-genome duplication events [
28]. Finally, TBtools v2.069 was used to visualize the intraspecific duplication relationships among LuPLR genes and the interspecific syntenic relationships between LuPLR genes and their homologous genes in At, Gh, and Gm.
2.5. Promoter Cis-Element Analysis and miRNA Target Prediction
Flax miRNA sequences were obtained from previously published data [
29]. The psRNATarget online server (
https://www.zhaolab.org/psRNATarget/analysis?function=3; accessed on 15 March 2026) was used to predict targeting relationships between known flax miRNAs and the coding sequences (CDSs) and available untranslated region (UTR) sequences of LuPLR genes, with default parameters.
Promoter sequences were defined as the 2000 bp regions upstream of the ATG start codon of LuPLR genes and were extracted using TBtools v2.069 [
30]. Potential
cis-acting elements were identified by submitting these sequences to PlantCARE (Available online:
http://bioinformatics.psb.ugent.be/webtools/plantcare/html/; accessed on 15 March 2026). Common core promoter elements, such as TATA-box and CAAT-box, were removed before the remaining elements were assigned to development-, hormone-, light-, and stress-related categories. The final results were visualized with TBtools v2.069.
2.6. Expression Pattern Analysis of the LuPLR Gene Family
Five publicly available flax transcriptome datasets were integrated to characterize
LuPLR expression patterns in different tissues, developmental stages, and stress conditions. The datasets included PRJNA1002756 for ovary, stamen, fruit, and shoot apical meristem; PRJNA833557 for floral organs at 5–30 days after flowering; PRJNA663265 for embryo, anther, seed, and other tissues; PRJNA977728 for salt-stressed roots and leaves; and PRJNA874329 for heat-stressed stems [
31].
Raw sequencing data were filtered using fastp v0.23.2 and then aligned to the telomere-to-telomere (T2T) reference genome of the flax cultivar ‘Gaosi’ [
32]. The FPKM values of each
LuPLR gene were obtained. Subsequently, the expression matrix was processed and normalized using R software v4.2.1 [
33]. Expression heatmaps based on log
2(FPKM) values were generated using TBtools v2.069 to display expression differences among LuPLR family members under different biological conditions [
30].
2.7. Determination of Lignan Content During Flax Seed Development
Seed lignan content was measured by high-performance liquid chromatography (HPLC) following previously published methods with minor modifications [
34]. Flax seed samples collected at 5, 10, 20, 30, and 40 DAF were freeze-dried and ground into powder, with three biological replicates prepared for each developmental stage. For each sample, 0.1 g of seed powder was weighed and soaked in anhydrous ether for 12 h, followed by heating extraction for 30 min. The samples were then placed under ventilated conditions at room temperature for 5 h and dried at 105 ± 5 °C for 2 h.
After drying, 1.5 mL of 60% (v/v) ethanol aqueous solution was added, and the samples were ultrasonically extracted at 50 °C for 15 min. The extracts were then centrifuged at 12,000 rpm for 10 min, and the supernatant was collected. The residue was extracted once again with 1.5 mL of 60% (v/v) ethanol aqueous solution, and the two supernatants were combined. Then, 1 mL of 1.8 mol/L sodium hydroxide solution was added to the combined extract, followed by alkaline hydrolysis at 40 °C for 40 min. The pH was subsequently adjusted to 4–6 with hydrochloric acid, and the mixture was centrifuged at 12,000 rpm for 10 min. The supernatant was collected, dried under a nitrogen stream, reconstituted in 2 mL of 60% methanol aqueous solution, and filtered through a syringe filter before HPLC analysis.
Lignan analysis was conducted using a Shimadzu LC-20A HPLC system (Shimadzu Corporation, Kyoto, Japan) fitted with an AQ-C18 column (250 mm × 4.6 mm, 5 μm). Detection was monitored at 290 nm with a PDA detector. The chromatographic conditions were as follows: flow rate, 0.8 mL/min; column temperature, 30 °C; injection volume, 20 μL; and mobile phase, methanol/water = 60:40. Quantification was performed using an SDG-based standard curve, and lignan levels were calculated from the corresponding chromatographic peak areas [
35].
2.8. RNA Preparation and qRT-PCR Assay
Total RNA was isolated from flax seeds collected at 5, 10, 20, 30, and 40 DAF with TRIzol® reagent. For each developmental stage, three biological replicates were prepared, and each replicate was generated by pooling seeds from at least 10 plants. RNA integrity and concentration were evaluated using agarose gel electrophoresis and spectrophotometric measurement. First-strand cDNA synthesis was carried out with an M-MLV reverse transcriptase kit (Takara Bio, Kyoto, Japan) following the manufacturer’s protocol.
qRT-PCR was performed using TB Green
® Premix Ex Taq™ II (Takara Bio, Kyoto, Japan) on a real-time PCR detection system. Three biological replicates were analyzed for each developmental stage, with three technical replicates performed for each biological replicate. The amplification program consisted of an initial denaturation at 95 °C for 30 s, followed by 40 cycles of 95 °C for 5 s and 60 °C for 30 s. Primer specificity was verified by melting-curve analysis. GAPDH was used as the internal reference gene, and relative transcript abundance was calculated using the 2
−ΔΔCT method [
36]. Statistical analyses were performed using ΔCT values. Differences in gene expression among developmental stages were evaluated by one-way analysis of variance followed by Dunnett’s multiple-comparison test, with the 5 DAF sample used as the control. Differences were considered statistically significant at
p < 0.05.
2.9. Correlation Analysis of LuPLR Expression and Seed Lignan Accumulation
To analyze the relationship between LuPLR gene expression changes and lignan accumulation in flax seeds, correlation analysis was performed using lignan contents and qRT-PCR relative expression levels at different developmental stages. The mean lignan contents of seed samples collected at 5, 10, 20, 30, and 40 DAF, together with the corresponding mean qRT-PCR relative expression levels of the 18 LuPLR genes, were used for analysis. Pearson correlation coefficients were calculated between the expression level of each LuPLR gene and lignan content, and two-tailed significance tests were performed. Correlation analysis and visualization were conducted using GraphPad Prism v8.4.3 software, with the significance threshold set at p < 0.05. Candidate LuPLR genes potentially associated with lignan accumulation in flax seeds were screened based on Pearson correlation coefficients, significance levels, and the consistency between gene expression trends and lignan accumulation patterns.
2.10. Subcellular Localization Validation of the Candidate LuPLR Protein
Primers specific to
LuPLR10 were designed using Oligo 7 for PCR amplification of its full-length CDS, with primer information listed in
Table S6. The amplified fragment was purified, cloned into the pGM-T vector, and introduced into
Escherichia coli DH5α cells for sequencing confirmation. The verified recombinant plasmid was then digested with XhoI and SalI, and the
LuPLR10 fragment was inserted into the similarly digested pCAMBIA1301-GFP vector to construct the
LuPLR10-GFP fusion expression plasmid.
The empty pCAMBIA1301-GFP vector and the LuPLR10-GFP fusion plasmid were individually transformed into Agrobacterium tumefaciens GV3101. Selected positive colonies were cultured and adjusted with infiltration buffer composed of 10 mM MES, 10 mM MgCl2, and 150 μM acetosyringone at pH 5.6. The bacterial suspension was induced at 28 °C for 3 h and subsequently infiltrated into Nicotiana benthamiana leaves. After dark treatment for 3 d, GFP fluorescence was detected using a Leica TCS SP8 confocal microscope, and the localization pattern of LuPLR10 was evaluated according to the fluorescence signal.
3. Results
3.1. Identification and Characterization of Flax PLR Genes
A total of 18 PLR family members were retrieved from the ‘Gaosi’ flax genome using the HMM profile of the PLR domain (PF01370). Based on their chromosomal positions, these genes were sequentially designated
LuPLR1 to
LuPLR18 (
Table 1). Prediction of physicochemical properties showed that the LuPLR proteins ranged from 271 to 407 amino acids (aa) in length. Among them,
LuPLR14 encoded the longest protein, containing 407 aa, whereas
LuPLR8 encoded the shortest protein, with 271 aa. The predicted molecular weights of the LuPLR proteins varied from 29.70 to 45.21 kDa, while their theoretical isoelectric points ranged between 4.76 and 9.48, with a mean value of 6.22. These differences suggest that LuPLR family members possess diverse physicochemical characteristics. The instability index ranged from 28.94 to 42.30, and the aliphatic index ranged from 84.87 to 100.36, suggesting potential differences in protein stability and thermostability among LuPLR members. The GRAVY values of LuPLR proteins were all below zero, varying from −0.20 to −0.01, which indicates their overall hydrophilic nature. Subcellular localization prediction further suggested that all 18 LuPLR proteins may be targeted to chloroplasts.
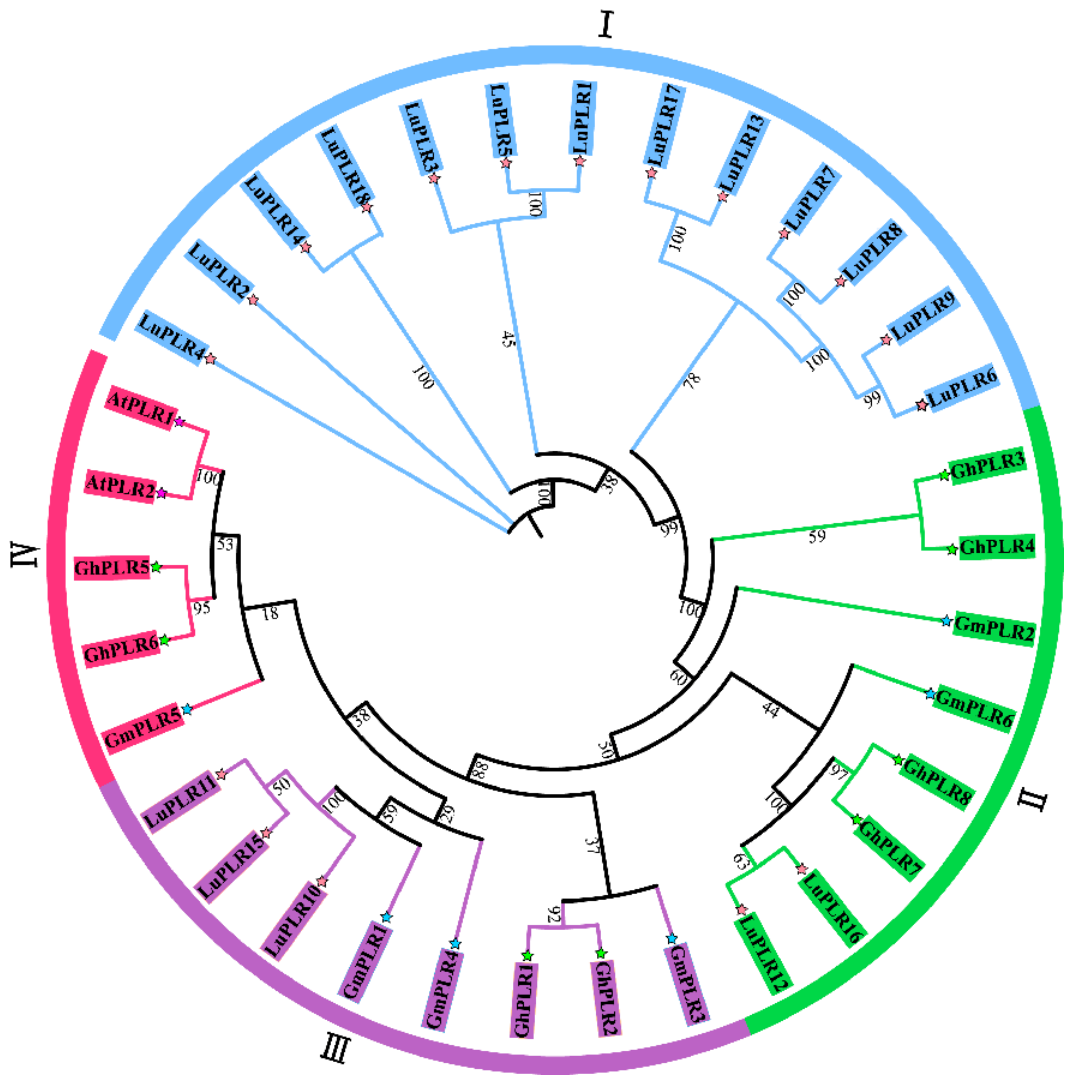
The evolutionary relationships of LuPLR proteins were assessed by constructing a maximum likelihood (ML) phylogenetic tree with PLR sequences from
Arabidopsis thaliana,
Gossypium hirsutum,
Glycine max, and flax (
Figure 1 and
Table S1). Bootstrap values were used to evaluate branch reliability. The phylogenetic analysis divided PLR proteins into four evolutionary groups. This classification was defined in the present study based on phylogenetic topology, and Group I represented a flax-specific expanded clade. The 18 LuPLR members were distributed in Groups I, II, and III, whereas no LuPLR member was assigned to Group IV. Among the four groups, Group I was the most abundant, comprising 13 LuPLR genes, whereas Groups III and II included three and two members, respectively. This distribution indicates that LuPLR members are unevenly represented among different evolutionary groups. Some LuPLR proteins clustered closely with PLR proteins from
A. thaliana,
G. hirsutum, or
G. max, suggesting that these members may be evolutionarily conserved and may have similar potential roles in phenylpropanoid metabolism, lignan biosynthesis, or seed development.
3.2. Structural Features and Conserved Motif Analysis of LuPLR Genes
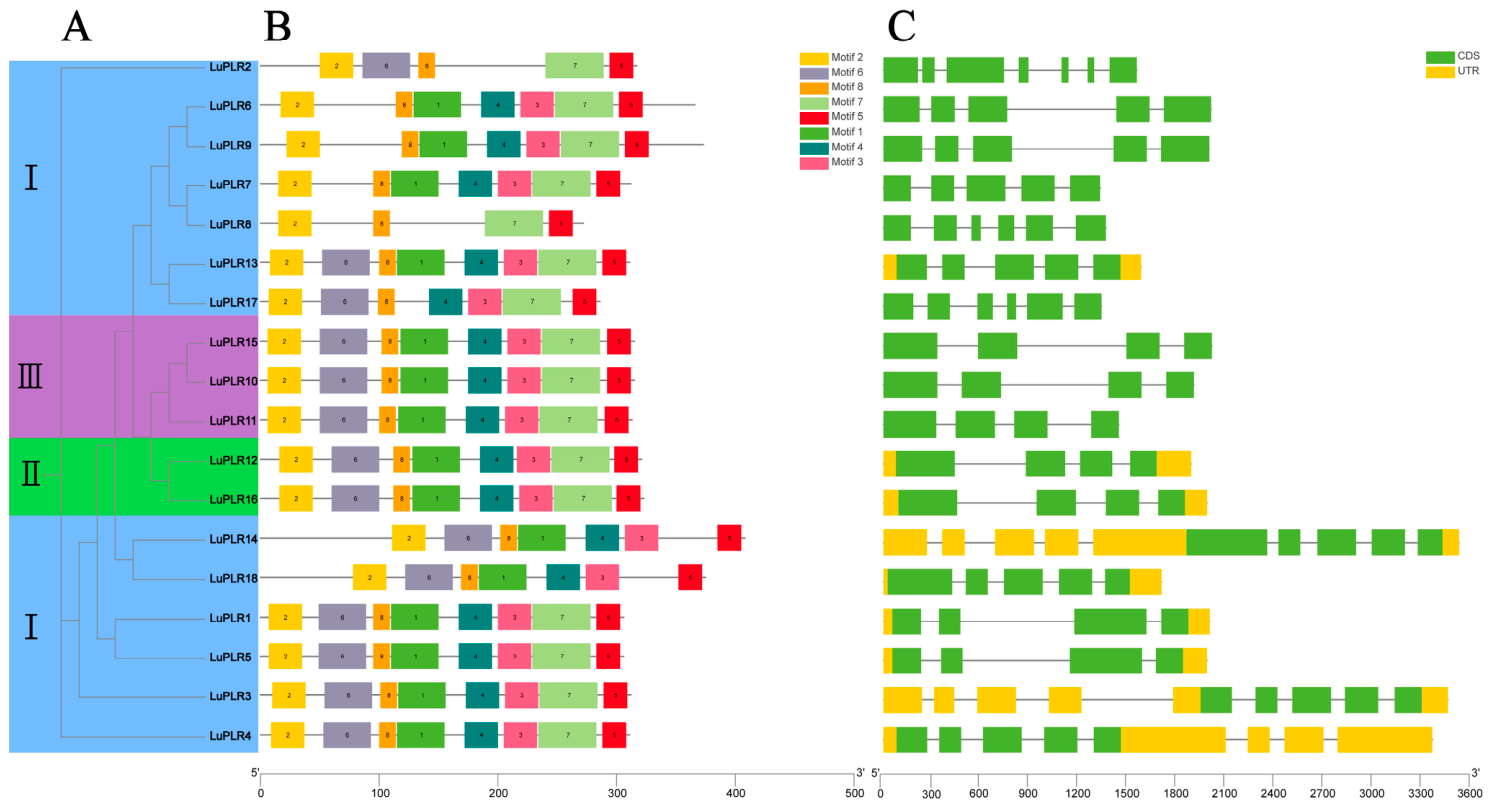
To describe the structural characteristics of the LuPLR family, conserved motifs of the encoded proteins and exon–intron organization of the corresponding genes were examined. A phylogenetic tree generated from multiple sequence alignment was then used to compare motif distribution among LuPLR proteins (
Figure 2A). MEME analysis identified eight conserved motifs, designated Motif 1 to Motif 8 (
Figure 2B). These motifs ranged from 15 to 50 amino acids in length. Among them, Motif 2, Motif 5, and Motif 8 were present in all LuPLR proteins, whereas the remaining motifs showed variable distributions among different members. Overall, LuPLR proteins grouped in the same phylogenetic clade showed comparable motif profiles and organization, suggesting conserved structural features among closely related members. In contrast, differences in motif number and distribution among different branches may reflect functional divergence of LuPLR family members during evolution.
Analysis of exon–intron structures showed that LuPLR genes differed in gene architecture, with exon numbers ranging from 4 to 11 and intron numbers ranging from 3 to 10 (
Figure 2C).
LuPLR3 and
LuPLR14 contained the largest number of exons, each with 11 exons and 10 introns, whereas some LuPLR members contained only four exons. Overall, LuPLR genes belonging to the same phylogenetic clade showed comparable exon–intron organizations, indicating that their gene structures were relatively conserved.
However, notable differences in exon and intron numbers were also observed among some members. For example, the number of exons in Group I varied widely, ranging from 5 to 11, indicating that gene structure may have undergone divergence within this group. By contrast, members of Groups II and III showed relatively consistent exon numbers, mainly containing six and four exons, respectively, further supporting the structural conservation of LuPLR genes within the same phylogenetic branch.
3.3. Chromosomal Distribution and Syntenic Relationships of LuPLR Genes
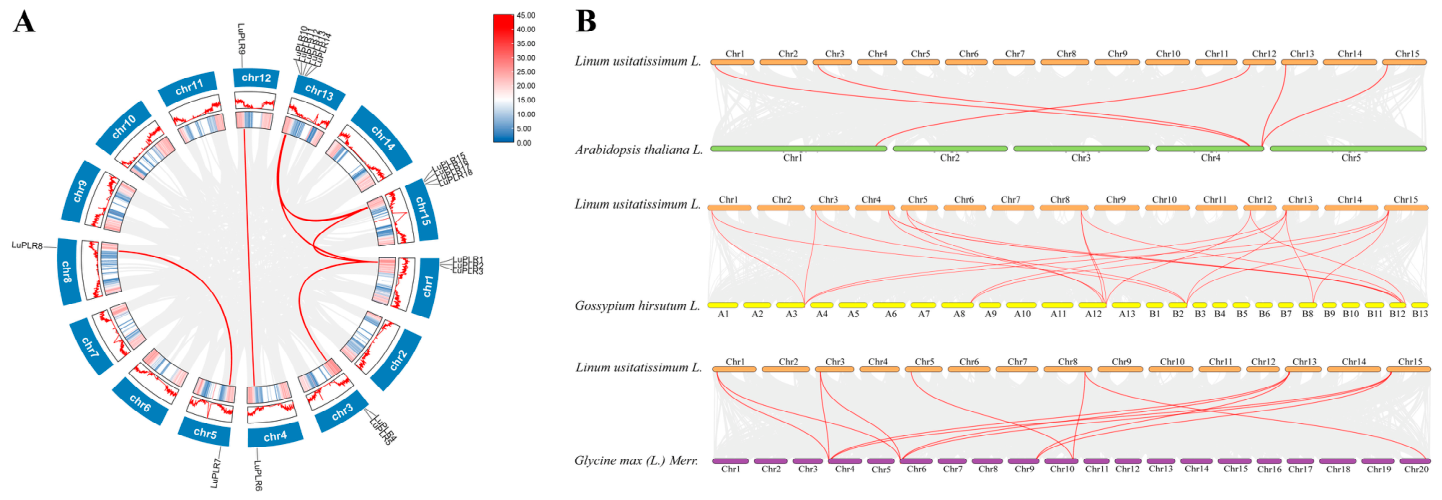
According to their genomic positions, the 18 LuPLR genes were mapped unevenly to 8 of the 15 flax chromosomes (
Figure S1). The greatest accumulation of LuPLR genes was observed on chromosome 13, where five members were located and accounted for 27.78% of the family, whereas chromosome 15 contained four members, representing 22.22%. In contrast, chromosomes 4, 5, 8, and 12 each contained only one LuPLR gene, accounting for 5.56% each.
Tandem duplication analysis of the LuPLR gene family using BLAST and MCScanX identified six tandemly duplicated gene clusters, including
LuPLR1–
LuPLR3,
LuPLR4–
LuPLR5,
LuPLR10–
LuPLR12,
LuPLR13–
LuPLR14,
LuPLR15–
LuPLR16, and
LuPLR17–
LuPLR18, which were located on chromosomes 1, 3, 13, and 15 (
Figure S1). Gene duplication is widely regarded as a major mechanism underlying the expansion and functional divergence of plant gene families. To further investigate duplication events in the LuPLR gene family, an intra-genomic synteny Circos plot was generated for LuPLR genes in the flax genome (
Figure 3A). Six syntenic LuPLR gene pairs were detected in total, implying that duplication events may have played a role in the expansion of the LuPLR family.
To examine the evolutionary conservation of PLR genes across species, synteny analysis was performed between flax and three representative plants, namely
Arabidopsis thaliana, upland cotton (
Gossypium hirsutum), and soybean (
Glycine max) (
Figure 3B). The results showed that flax shared 5, 21, and 13 syntenic PLR gene pairs with
A. thaliana,
G. hirsutum, and
G. max, respectively. LuPLR genes showing syntenic relationships with PLR genes from
A. thaliana were distributed on flax chromosomes 1, 3, 12, 13, and 15. Those showing syntenic relationships with PLR genes from G. hirsutum were distributed on chromosomes 1, 3, 4, 5, 8, 12, 13, and 15, whereas those showing syntenic relationships with PLR genes from G. max were located on chromosomes 1, 3, 5, 8, 13, and 15. Overall, some PLR homologs between flax and the three reference species showed conserved syntenic relationships, whereas the number and distribution patterns of syntenic gene pairs differed among species. These results reflect both conservation and divergence of the LuPLR gene family during evolution. Given the possible role of duplication events in LuPLR family expansion, promoter regions were further examined to identify
cis-acting elements that may participate in the transcriptional regulation of LuPLR genes.
3.4. Promoter Cis-Acting Elements and miRNA-Mediated Regulation of LuPLR Genes
For promoter analysis, sequences located 2000 bp upstream of the LuPLR start codons (ATG) were selected, and the potential cis-acting elements within these regions were identified and visualized (
Figure S2A and Table S2). After removing common core promoter components, including TATA-box and CAAT-box, 530 cis-acting elements were retained and grouped into four functional classes: hormone-responsive, light-responsive, environmental stress-related, and development-related elements (
Figure S2B,C). These elements were widely distributed in LuPLR promoter regions, indicating that the expression of this gene family may be controlled by multiple regulatory cues.
Among the four classes, hormone-responsive elements were predominant, comprising 200 elements and representing 37.74% of the total. These mainly included elements responsive to methyl jasmonate (MeJA), abscisic acid (ABA), auxin, gibberellin, and salicylic acid. The MeJA-related TGACG-motif and CGTCA-motif were particularly abundant, followed by the ABA-responsive ABRE element, implying that jasmonate and ABA signaling may participate in the regulation of LuPLR gene expression. Light-responsive elements formed the second largest group, with 188 elements accounting for 35.47% of all predicted elements, including G-box, Box 4, GT1-motif, TCT-motif, I-box, and GATA-motif. The abundance of light-responsive elements implies that light signaling may be involved in regulating LuPLR transcription. Stress-related elements were also common, with 112 elements representing 21.13% of the total. These included ARE, LTR, MBS, and TC-rich repeats, corresponding to anaerobic, cold, drought, and defense/stress response regulation, respectively. Specifically, LuPLR3, LuPLR4, LuPLR11 and LuPLR12 contained the highest number of stress-related elements across the family. Development-related elements were less frequent, with 30 elements accounting for 5.66%, mainly including CAT-box, O2-site, circadian, GCN4_motif, and MSA-like elements. Notably, the cis-element profiles of LuPLR promoters were correlated with their phylogenetic grouping: members within the same clade shared similar element patterns, and the flax-specific Group I was enriched in MeJA- and light-responsive elements. Collectively, these promoter features suggest that LuPLR genes may be coordinately regulated by hormonal, light, and environmental signals and may participate in seed development and secondary metabolism in flax.
In addition, microRNA (miRNA) target prediction identified three miRNA–LuPLR targeting relationships involving two genes,
LuPLR9 and
LuPLR17 (
Table S3). Among them,
LuPLR17 was predicted to be targeted by lus-miR394a and lus-miR394b, whereas
LuPLR9 was predicted to be targeted by lus-miR171d. All predicted targeting modes were cleavage. These results suggest that some LuPLR genes may be subject to miRNA-mediated post-transcriptional regulation.
3.5. Expression Profiles of LuPLR Family Members
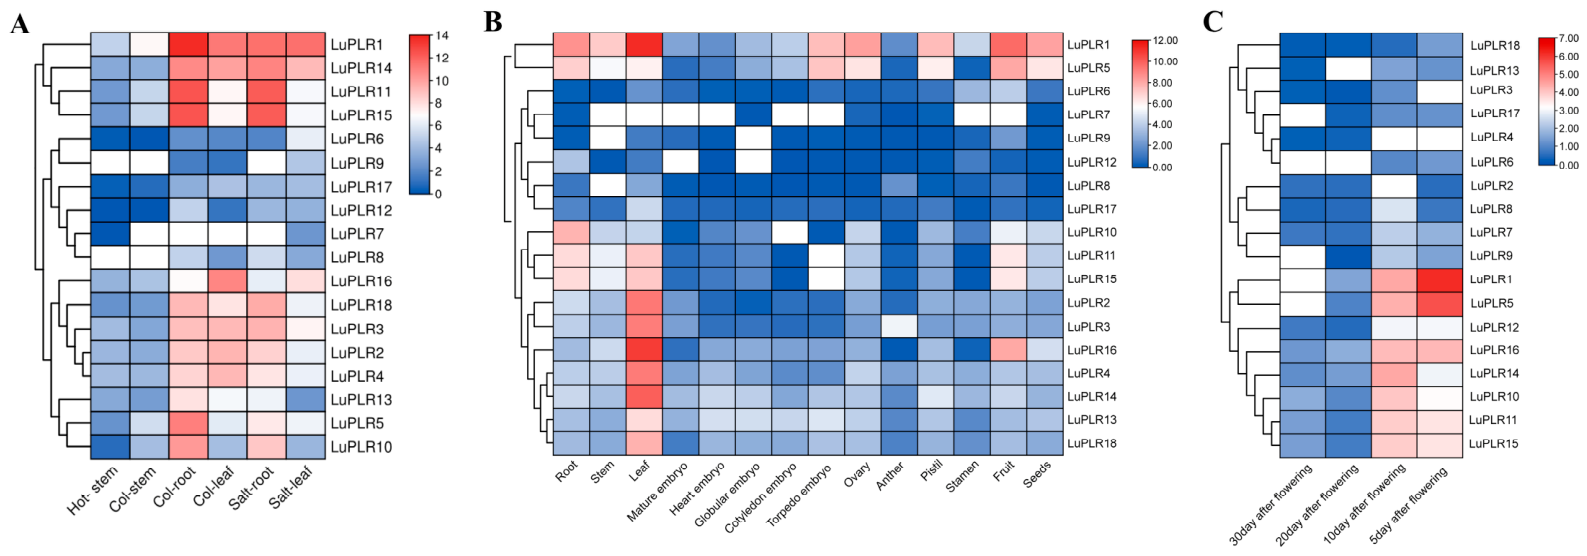
Public transcriptomic resources were used to characterize the transcriptional profiles of the 18 LuPLR genes under various tissue, developmental, and stress-related conditions (
Figure 4). In abiotic stress-related samples, LuPLR genes showed tissue- and treatment-specific expression patterns (
Figure 4A). Overall,
LuPLR1,
LuPLR11,
LuPLR14, and
LuPLR15 exhibited relatively high expression levels in root tissues, particularly in both control roots and salt-treated roots, suggesting that these genes may be associated with root development or salt stress responses. In contrast,
LuPLR6,
LuPLR9,
LuPLR12, and
LuPLR17 showed low expression levels in most stress-related samples. Several genes, including
LuPLR2,
LuPLR3,
LuPLR4,
LuPLR5,
LuPLR10, and
LuPLR18, were also expressed in root or leaf tissues, indicating that LuPLR family members may exhibit differential expression patterns across tissues and treatment conditions.
Expression analysis across different tissues and developmental organs revealed clear tissue-specific differences among LuPLR family members (
Figure 4B). Most LuPLR genes showed relatively high expression levels in leaves, particularly
LuPLR1,
LuPLR2,
LuPLR3,
LuPLR4,
LuPLR13,
LuPLR14,
LuPLR16, and
LuPLR18.
LuPLR1 and
LuPLR5 were relatively highly expressed in multiple tissues, including roots, stems, leaves, fruits, and seeds, suggesting that they may function in multiple organs. By contrast,
LuPLR6,
LuPLR7,
LuPLR8,
LuPLR9, and
LuPLR12 exhibited low expression levels in most tissues. In embryo-related developmental tissues, most LuPLR genes showed weak expression, whereas only a few members were expressed at detectable levels in mature embryos, heart-stage embryos, globular embryos, or cotyledon-stage embryos. These results suggest that LuPLR genes may have undergone functional differentiation across different tissues and developmental stages.
Further analysis of expression patterns at different post-flowering developmental stages showed that LuPLR genes exhibited stage-specific expression characteristics at 5, 10, 20, and 30 DAF (
Figure 4C).
LuPLR1 and
LuPLR5 showed relatively high expression levels at 5 and 10 DAF, with the highest expression observed at 5 DAF.
LuPLR10,
LuPLR11,
LuPLR14,
LuPLR15, and
LuPLR16 also showed detectable expression during early post-flowering stages. In contrast,
LuPLR3,
LuPLR4,
LuPLR6,
LuPLR7,
LuPLR8,
LuPLR9,
LuPLR13,
LuPLR17, and
LuPLR18 were expressed at low levels across most developmental stages. Overall, several LuPLR genes showed relatively high expression during post-flowering development, suggesting that they may be involved in flax reproductive organ development or seed-related developmental processes, and providing a reference for further screening of candidate LuPLR genes associated with lignan accumulation.
3.6. Dynamic Changes in Lignan Accumulation During Flax Seed Development
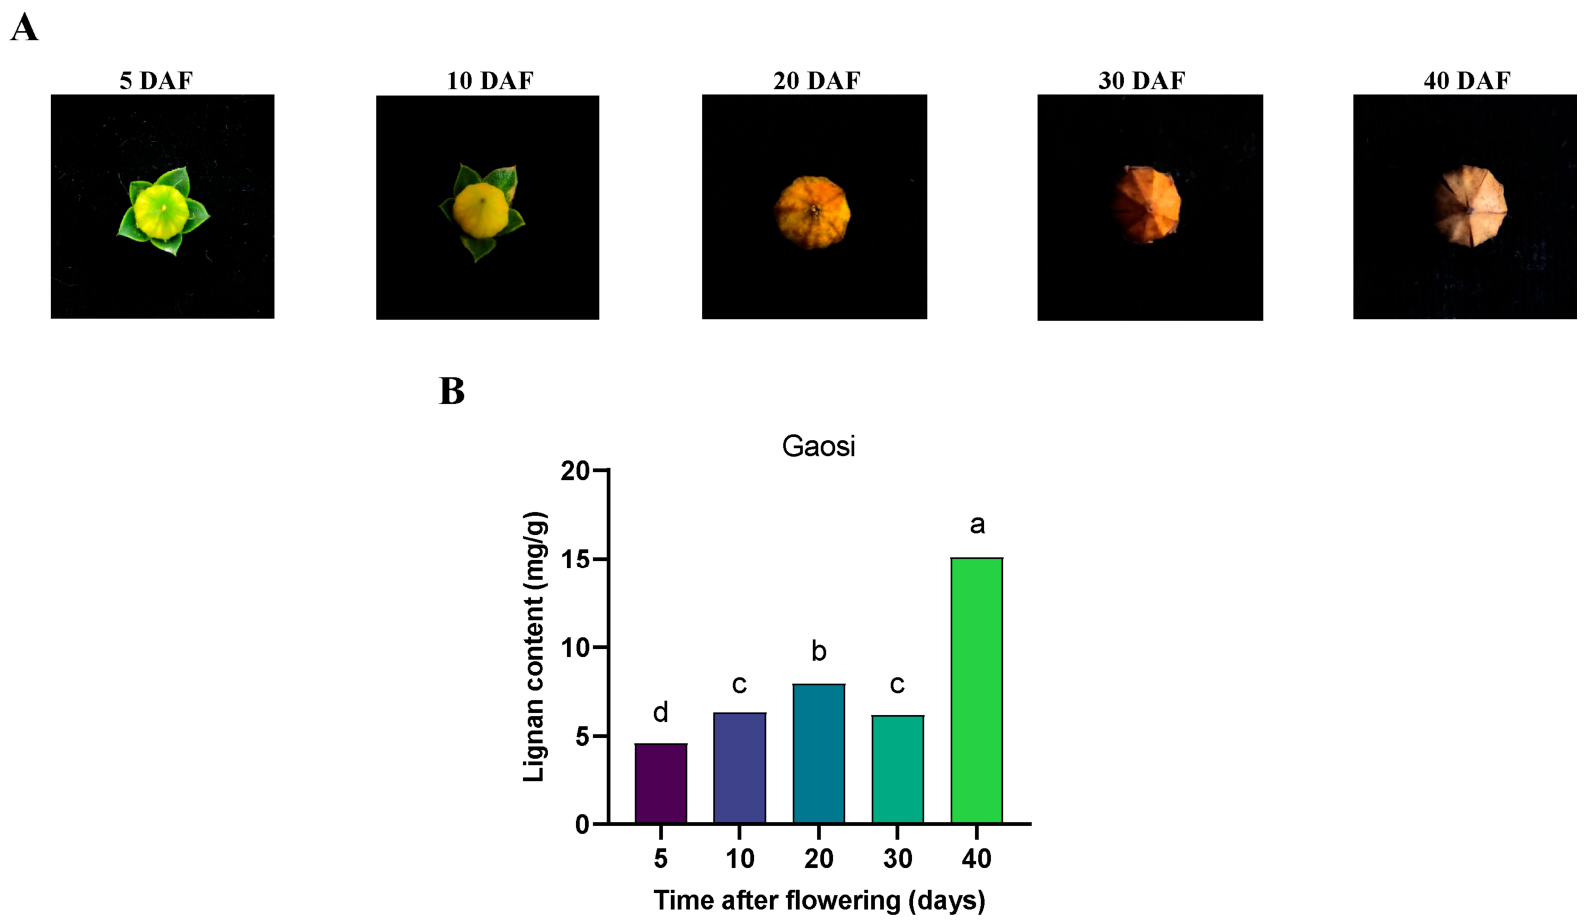
To characterize the dynamic accumulation pattern of lignans during flax seed development, flax capsules were collected at 5, 10, 20, 30, and 40 DAF, and their morphological characteristics and seed lignan contents were analyzed (
Figure 5 and
Table S4). Morphologically, flax capsules gradually matured with increasing DAF, and their color changed from green to yellowish brown or light brown, indicating that the sampled stages represented a continuous seed developmental process (
Figure 5A).
High-performance liquid chromatography (HPLC) analysis revealed marked variation in seed lignan content across the examined developmental stages of flax (
Figure 5B). The lignan content was lowest at 5 DAF, with a value of 4.62 mg g
−1, and then gradually increased to 6.36 mg g
−1 at 10 DAF and 7.96 mg g
−1 at 20 DAF. At 30 DAF, the lignan content decreased to 6.20 mg g
−1, which was not significantly different from that at 10 DAF but was significantly lower than that at 20 DAF. The lignan content reached its highest level at 40 DAF, with a value of 15.12 mg g
−1, which was significantly higher than that at the other developmental stages. Overall, lignan content in flax seeds changed dynamically during development and accumulated markedly at 40 DAF, suggesting that the late maturation stage may be a key period for lignan accumulation in flax seeds.
3.7. Developmental Expression Profiles of LuPLR Genes in Flax Seeds
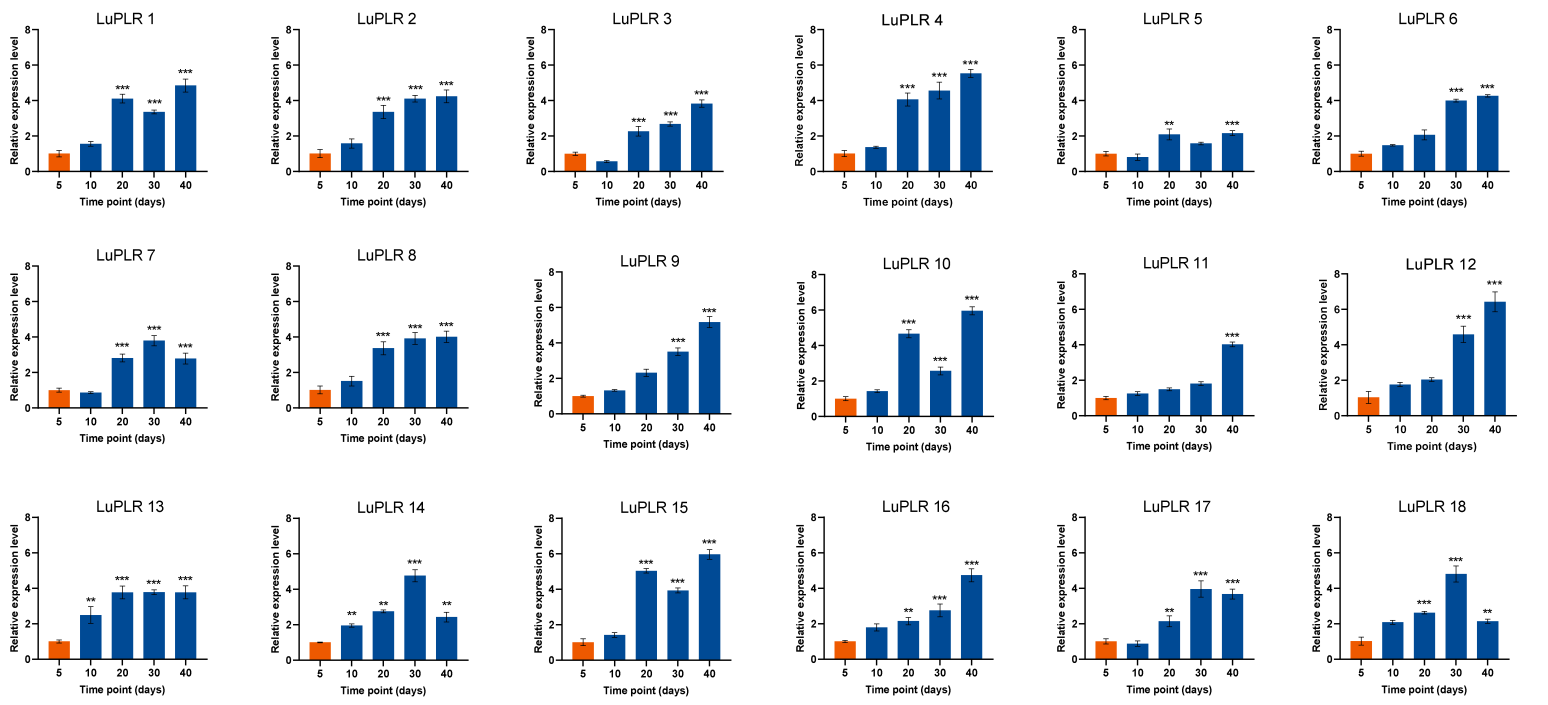
The relative expression levels of the 18 LuPLR genes were further examined by qRT-PCR in flax seeds at 5, 10, 20, 30, and 40 DAF, with 5 DAF set as the reference stage (
Figure 6). The results revealed pronounced stage-specific expression patterns among LuPLR genes during seed development. Most LuPLR members showed increased expression levels after 20 DAF, suggesting that these genes may be involved in the middle and late stages of flax seed development.
Based on their expression trends, LuPLR genes could be broadly classified into three groups. The first group included LuPLR2, LuPLR3, LuPLR4, LuPLR6, LuPLR8, LuPLR9, LuPLR11, LuPLR12, and LuPLR16, whose expression levels generally increased during seed development and reached relatively high or peak levels at 40 DAF. The second group included LuPLR7, LuPLR14, LuPLR17, and LuPLR18, whose expression levels peaked at 30 DAF and then decreased at 40 DAF, showing a strong stage-specific expression pattern. The third group included LuPLR1, LuPLR5, LuPLR10, and LuPLR15, whose expression levels increased markedly at 20 DAF, decreased at 30 DAF, and increased again or reached peak levels at 40 DAF.
When compared with the dynamic changes in lignan content during flax seed development, the expression patterns of LuPLR1, LuPLR5, LuPLR10, and LuPLR15 were relatively consistent with lignan accumulation, showing expression changes corresponding to the increase in lignan content at 20 DAF, the decrease at 30 DAF, and the highest accumulation at 40 DAF. Among them, LuPLR10 and LuPLR15 showed relatively high expression levels at 40 DAF, consistent with the marked accumulation of lignans at the late maturation stage. These results suggest that LuPLR10 may be an important candidate gene associated with lignan accumulation in developing flax seeds. LuPLR15, together with LuPLR1 and LuPLR5, showed partially consistent expression trends and may be considered as additional candidates for further analysis.
3.8. Correlation Analysis Between LuPLR Gene Expression and Lignan Accumulation
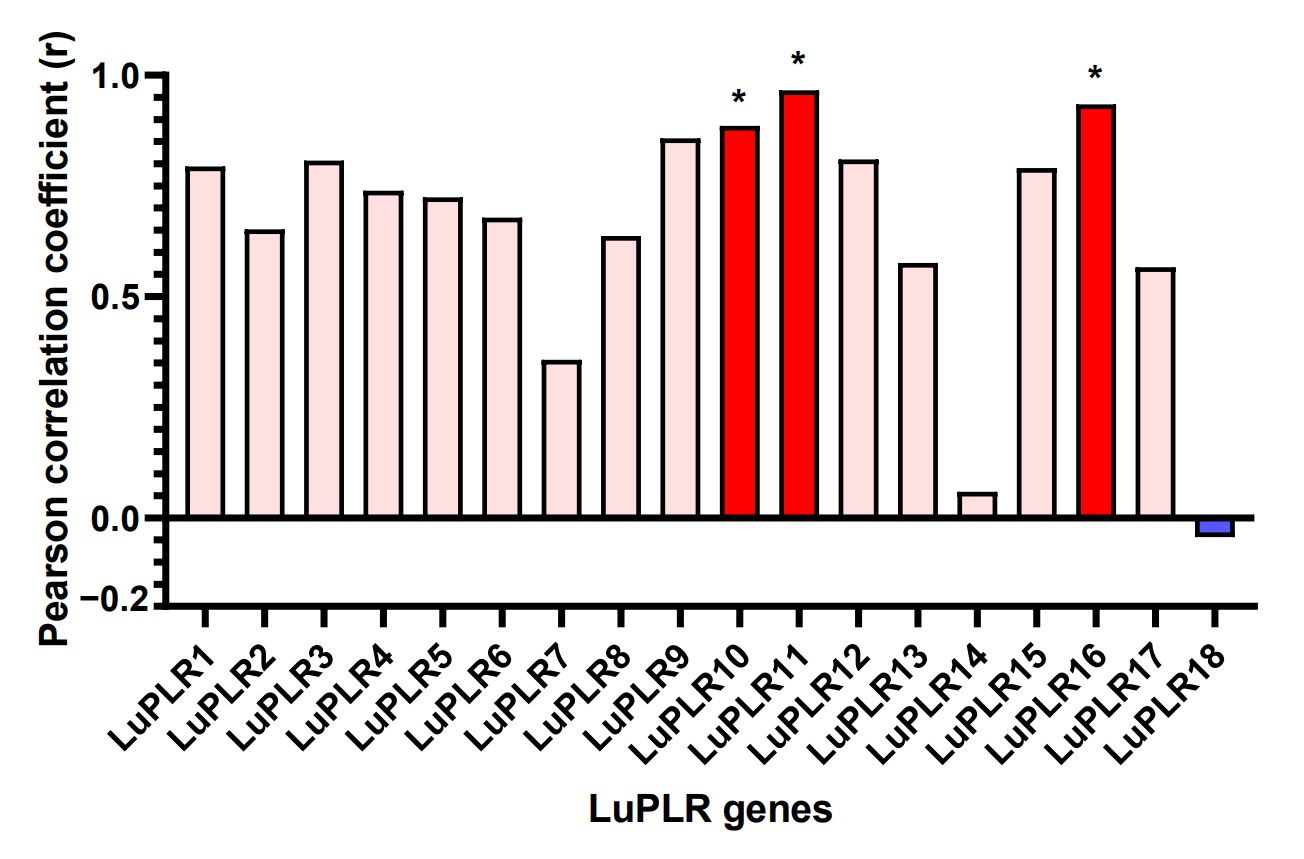
To further screen candidate LuPLR genes associated with lignan accumulation in flax seeds, Pearson correlation analysis was performed using the mean lignan contents and the mean qRT-PCR relative expression levels of 18 LuPLR genes at 5, 10, 20, 30, and 40 DAF (
Figure 7 and
Table S5). The results showed clear differences in the strength of correlation between LuPLR gene expression and lignan content. Most LuPLR genes showed positive correlations with lignan content, among which
LuPLR10,
LuPLR11, and
LuPLR16 reached significant positive correlation levels, with Pearson correlation coefficients of 0.8854, 0.9664, and 0.9346, respectively. In contrast,
LuPLR14 showed only a weak correlation with lignan content, whereas
LuPLR18 showed a slight negative correlation, indicating that their expression patterns were not consistent with lignan accumulation.
Further comparison with the qRT-PCR expression patterns showed that LuPLR10 expression increased markedly at 20 DAF, decreased at 30 DAF, and reached its highest level at 40 DAF, which was relatively consistent with the dynamic changes in lignan content at the corresponding developmental stages. Therefore, LuPLR10 can be considered a priority candidate gene potentially associated with lignan accumulation in developing flax seeds, although its functional role requires further experimental validation. LuPLR11 and LuPLR16, which also showed significant positive correlations with lignan content, may be regarded as additional candidate genes for further validation. In addition, although LuPLR15 did not reach a significant correlation level, its expression trend was partially consistent with lignan accumulation, suggesting that it may also warrant further attention in subsequent studies. Because this correlation analysis was based on five developmental stages, these candidate genes should be interpreted as preliminary targets for further functional validation rather than as functionally confirmed regulators of lignan accumulation.
3.9. Subcellular Localization of LuPLR10
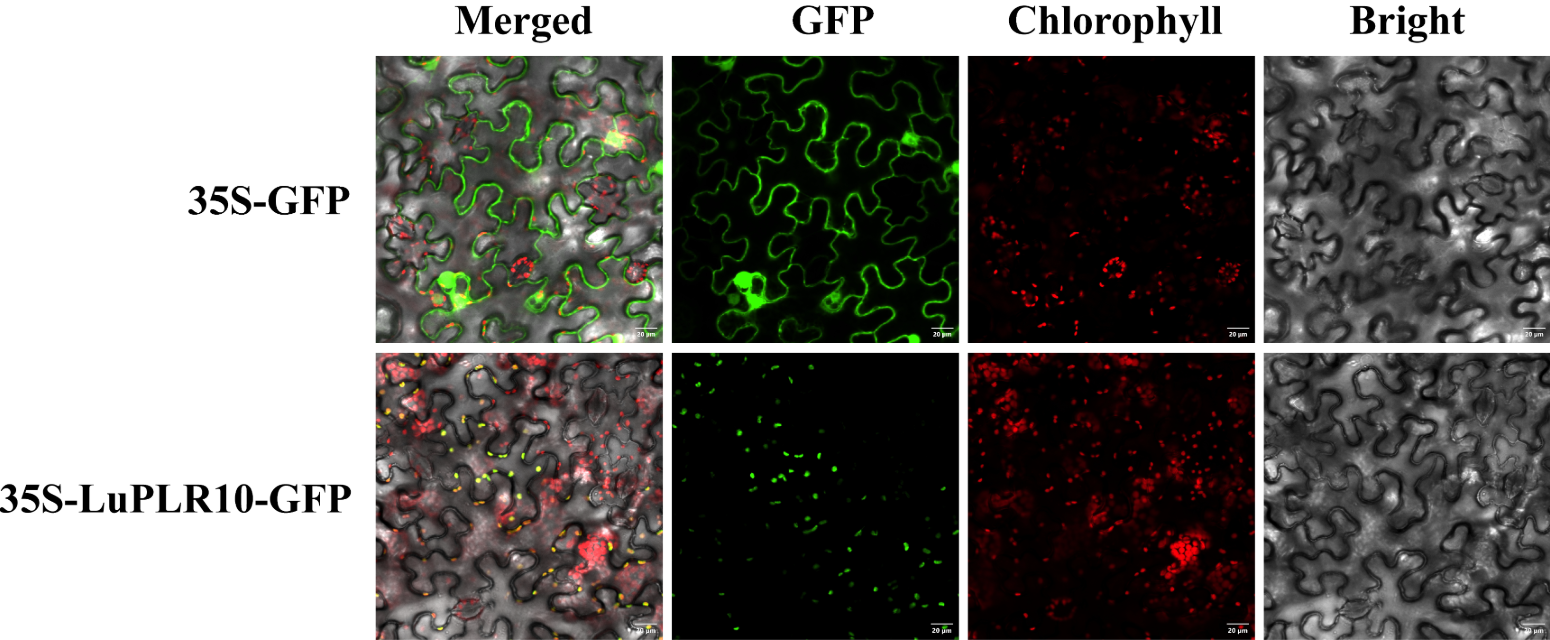
To assess the subcellular distribution of
LuPLR10, the
LuPLR10 coding sequence was fused with GFP and transiently expressed in
Nicotiana benthamiana leaves using
Agrobacterium tumefaciens GV3101. GFP fluorescence from the empty pCAMBIA1301-GFP vector was dispersed throughout the cell, whereas the
LuPLR10-GFP signal was mainly detected in chloroplast-associated regions (
Figure 8). This result was consistent with the predicted localization, suggesting that
LuPLR10 is predominantly chloroplast-localized.
4. Discussion
PLR catalyzes key reductive steps in lignan biosynthesis and contributes to the conversion of pinoresinol and lariciresinol into downstream lignan precursors [
6,
37]. Although flaxseed is a rich source of lignans, particularly secoisolariciresinol diglucoside (SDG) [
9,
38]. genome-wide characterization of the flax PLR gene family and its relationship with lignan accumulation during seed development remains limited [
13]. In this study, 18 LuPLR genes were identified from the T2T genome assembly of the flax cultivar ‘Gaosi’, and their evolutionary characteristics, regulatory features, expression patterns, and associations with lignan accumulation were systematically evaluated.
Members within the same phylogenetic clades generally exhibited similar motif compositions and exon–intron organizations, supporting their shared evolutionary origin. In contrast, structural variation among clades may reflect subsequent functional divergence within the LuPLR family. Gene duplication is a major evolutionary mechanism contributing to the expansion and diversification of plant gene families [
39,
40]. Accordingly, the detected intraspecific duplication events and cross-species syntenic relationships suggest that duplication and subsequent divergence contributed to the evolutionary history of the flax PLR family.
Promoter
cis-acting elements provide important sequence-level information for predicting potential transcriptional regulatory mechanisms [
41]. The abundance of hormone-, light-, stress-, and development-responsive elements in LuPLR promoters suggests that the transcription of these genes may be influenced by multiple endogenous and environmental signals [
42,
43] [
44,
45]. In addition, only three miRNA–LuPLR targeting relationships involving
LuPLR9 and
LuPLR17 were predicted, indicating that miRNA-mediated post-transcriptional regulation may be restricted to specific family members [
46]. Because these regulatory relationships were computationally predicted, their biological significance requires experimental validation.
Public transcriptome datasets revealed tissue- and stage-dependent expression differences among LuPLR genes, indicating potential functional differentiation within the family. qRT-PCR analysis, with relative expression calculated using the 2
−ΔΔCT method [
47], further confirmed distinct developmental expression patterns in flax seeds. Several genes, including
LuPLR1,
LuPLR5,
LuPLR10, and
LuPLR15, exhibited expression trends broadly consistent with lignan accumulation, providing a basis for subsequent candidate-gene screening.
Seed lignan content varied dynamically during development and reached its highest level at 40 DAF, indicating that late seed maturation may represent an important period of lignan accumulation in the flax cultivar ‘Gaosi’. Previous studies have established flaxseed as an important dietary source of lignans, particularly secoisolariciresinol diglucoside (SDG) [
2,
18,
48,
49], while PLR-mediated reduction in pinoresinol and lariciresinol constitutes a key step in the formation of downstream lignan products [
1,
50]. Comparison of developmental LuPLR expression profiles with lignan content therefore provided a rational basis for candidate-gene screening. Pearson correlation analysis revealed positive associations between lignan content and the expression of
LuPLR10,
LuPLR11, and
LuPLR16. Although
LuPLR11 and
LuPLR16 exhibited higher correlation coefficients,
LuPLR10 was prioritized because its developmental expression pattern, characterized by an increase at 20 DAF, a decrease at 30 DAF, and a peak at 40 DAF, most closely paralleled the overall pattern of lignan accumulation.
LuPLR15 also showed a partially consistent expression trend and may warrant further investigation. Nevertheless, because the correlation analysis was based on only five developmental stages, these associations should be interpreted as preliminary evidence rather than confirmation of gene function.
Transient expression in
Nicotiana benthamiana is widely used to investigate the subcellular distribution of plant proteins [
51,
52]. In the present study, the LuPLR10–GFP fluorescence signal was predominantly associated with chloroplasts, consistent with the predicted subcellular localization. However, subcellular localization alone does not establish the biochemical role of
LuPLR10 in lignan biosynthesis. Taken together, the developmental expression pattern, correlation with lignan content, and subcellular localization support the prioritization of
LuPLR10 as a candidate gene for further investigation. The current evidence remains primarily correlative and does not directly demonstrate its biological function. Further studies involving gene overexpression, gene silencing or editing, and in vitro enzyme activity assays will therefore be required to determine the specific contribution of
LuPLR10 to lignan biosynthesis in flax [
53,
54,
55].





 ,
,