1. Introduction
Phosphorus remains one of the essential nutrients for the functioning of agricultural systems, being directly involved in energy transfer, root system development, and biomass formation. Its agronomic importance is, however, accompanied by a major constraint: mineral phosphate resources are finite, and a substantial proportion of the phosphorus applied through fertilization does not remain in forms readily accessible to plants [
1,
2].
In many cultivated soils, repeated fertilizer applications have led to the accumulation of a significant pool of residual phosphorus, without this reserve being proportionally available to crops. This apparent phosphorus paradox reflects the fragile balance between P inputs, its retention on the solid phase, chemical transformations in soil, and the capacity of the root system to access it [
3,
4,
5].
At the same time, the use of residual P is increasingly regarded as a component of sustainable management, because it can reduce dependence on external fertilizer inputs when the forms accumulated in soil are mobilized in a controlled manner and remain accessible to crops [
6]. Sustainable phosphorus management therefore cannot be reduced to increasing the applied rates. It must also include the way in which extractable components, such as phosphorus determined by the ammonium lactate method (P-AL), are formed, redistributed, and maintained available within the root-explored zone [
7].
In alkaline and calcareous soils, this issue has a particular significance. The alkaline reaction can limit phosphorus availability even when the total reserve or the initial extractable level is high. Phosphates react with calcium ions and carbonate surfaces, and part of the P can be transferred into less soluble forms through strong sorption, limited desorption, and precipitation as calcium phosphates [
8,
9,
10].
Thus, a soil rich in residual P does not necessarily provide a constant P supply to plants. In calcareous soils, P accessibility depends on labile P forms, mineral reactivity, moisture, and root activity [
11,
12]. Recent studies on wheat confirm that P availability is controlled by the interaction between P source, soil reaction, and the physicochemical properties of the root environment, not only by the amount applied [
13,
14].
In alkaline calcareous soils, extractable P therefore represents a dynamic component sensitive to water, mineral reactivity, and fertilizer application method, rather than only an indicator of average soil fertility.
Water is involved in this dynamic through processes that act mainly over short distances. Phosphorus generally has low mobility in soil, and its movement towards roots occurs predominantly by diffusion, not by rapid transport through the profile. Soil water content, however, modifies the thickness of liquid films around soil particles, pore connectivity, and the rate of fertilizer dissolution. In this way, different conditions are created for sorption, desorption, and local redistribution of extractable P [
15,
16].
In alkaline calcareous soils, contrasting moisture episodes can modify P-AL distribution in the surface layer without necessarily implying leaching losses. These changes primarily reflect a reorganization of extractable P within the zone relevant to young wheat roots. Drying and rewetting have been shown to modify available P, with the magnitude of the response depending on rewetting intensity, soil properties, and biological context [
17,
18,
19].
To this water-induced variability is added the effect of fertilizer form. After application, phosphorus fertilizers do not behave only as P sources, but create local reaction zones in which phosphate concentration, product solubility, microzone pH, and contact with the soil solid phase can rapidly modify extractable P. Granular forms tend to generate concentrated dissolution points around the particles, whereas liquid fertilizers can provide a more continuous initial distribution in the application zone, with a different contact between P and the soil matrix [
20,
21,
22].
In alkaline or calcareous soils, these differences can influence the short-term retention, precipitation, and redistribution of phosphorus, but their effect remains dependent on moisture and soil properties [
23]. For this reason, the comparison between liquid and solid fertilizers should be viewed primarily as an analysis of the spatial behavior of extractable P, not as a direct assessment of agronomic efficiency. Fertilizer form can modify local availability and the vertical contrast of P-AL, especially in the surface layer where application takes place and where the root system begins to explore the soil [
24]. In addition, differences between phosphate formulations may affect not only P distribution in soil but also root traits and the microbial communities associated with wheat, which reinforces the need for an integrated interpretation of the soil–plant response [
25].
With plant emergence, the interpretative framework becomes more complex. Wheat roots create an active rhizosphere in which uptake, root exudation, local pH changes, and microbial activity can shift the balance between soluble, labile, and retained P forms [
26,
27,
28,
29,
30]. Consequently, extractable P may decrease through both root uptake and transformations that alter its extractability.
Comparing plant-free soil with cultivated soil therefore provides a useful way to separate, at least partially, the abiotic redistribution of P from the changes associated with the root system. For wheat, this distinction is important especially in the early growth stages, when root development and access to P from the surface layer can strongly influence the local organization of phosphorus [
11]. Recent studies show that microbial processes in the rhizosphere can contribute to P turnover and to increased bioavailability in wheat-based systems, while organic and inorganic P inputs can simultaneously modify productivity, bioaccessible forms, and soil enzymatic activity [
31,
32]. However, the reduction of P-AL in the presence of the plant should be interpreted as apparent depletion of the extractable component, not as a direct measure of total phosphorus uptake.
Although these processes are well documented separately, the way in which they act together in an alkaline soil rich in residual P remains less clear. Less frequently analyzed, within the same experimental framework, are the interactions between water regime, fertilization treatment, and wheat presence on P-AL distribution in a surface profile relevant for young roots. This gap is important because, in soils with large accumulations of residual P, the practical question is not only how much phosphorus exists in the soil, but where P-AL is located, how it is reorganized after fertilizer application, and how much it is modified by plant activity.
In temperate continental regions with pronounced climatic variability, such as north-eastern Romania, autumn conditions can be too dry in some years to support an effective basal phosphorus fertilization strategy for winter wheat [
33]. Under these circumstances, farmers may postpone or reduce autumn P application and rely on spring P correction fertilization during the resumption of vegetation. However, spring moisture conditions are also highly variable, ranging from dry periods to adequate or excessive precipitation events. This creates a practical uncertainty regarding how different fertilization options and application pathways can better support the short-term redistribution and maintenance of extractable P in the early root-explored layer under contrasting water regimes. Under such conditions, farmers may use either liquid NP fertilizers applied at commercial rates or conventional solid complex fertilizers broadcast on the soil surface.
Based on this gap, the study aimed to evaluate how water regime, fertilization treatment, and wheat presence modify P-AL distribution in the surface layer of an alkaline calcareous soil. The analysis focused on P-AL redistribution within the 2–8 cm interval and on the difference between plant-free and wheat-planted soil, used as an indicator of the apparent depletion associated with wheat presence. The fertilization treatments were not designed to provide equivalent P inputs, but to represent practical spring fertilization options differing in fertilizer formulation, rate, and application method. In this framework, the vertical distribution indices were used descriptively to capture changes in the position and contrast of extractable P within the profile. The working hypothesis was that water regime is a major factor shaping P-AL reorganization, while fertilization treatment and wheat presence modulate the magnitude and location of this redistribution in the surface zone explored by roots.
2. Materials and Methods
2.1. General Conditions and Experimental Site
The experiment was conducted within the Laboratory of Plant Nutrition and Soil Fertility of the “Ion Ionescu de la Brad” University of Life Sciences, Iași, Romania. The study was designed to evaluate the dynamics of extractable phosphorus in the surface soil layer, in relation to the form and rate of the applied fertilizer, under different water regimes.
To evaluate the redistribution of water and extractable phosphorus in the surface soil layer, experimental pots were used as independent experimental units. This system allowed the control of the experimental factors and the analysis of changes in P-AL within the 2–8 cm profile, under contrasting moisture conditions. The experiment was carried out in the laboratory greenhouse, where natural vegetation conditions were maintained in terms of temperature and light, without artificial interventions; the only controlled factor was the soil water regime.
Under these conditions, plant development and changes in P-AL were analyzed in relation to the interaction between soil, water, and fertilizers. The use of experimental pots allowed for the evaluation of P-AL distribution in the surface soil layer according to fertilizer form, water regime, and wheat presence.
2.2. Experimental Design
The soil used was an alkaline calcareous Chernozem with a sandy loam texture (AL-SL, alkaline sandy loam), and the tested crop was winter wheat (Triticum aestivum L.). The experiment was organized according to a three-factor design, with fertilization, water regime, and vegetation condition as factors.
- (1)
The fertilization factor included four levels: F0 (unfertilized control), FS (solid NPK 15–15–15 fertilizer), FL1 and FL2 (liquid NP 4–18 fertilizer applied at two rates).
- (2)
The water regime factor included four levels: H0 (0 L m−2), H50 (50 L m−2), H100 (100 L m−2), and H150 (150 L m−2).
- (3)
The vegetation condition factor included two levels: plant-free soil (S0) and wheat-planted soil (SP).
The plant-free treatment was used to help distinguish plant-associated changes from the physicochemical redistribution of phosphorus in soil, as affected by fertilizer form and water regime. The treatments were randomly assigned in a completely randomized design, with three replications for each factorial combination, resulting in a total of 96 experimental units (4 fertilization treatments × 4 water regimes × 2 vegetation conditions × 3 replications). The pots were not periodically rotated during the experiment; however, treatment combinations were randomly assigned to pot positions at the beginning of the experiment to avoid systematic association between treatments and greenhouse position.
2.3. Soil Characterization
The soil used in the experiment was collected from the Didactic Station of Iași, belonging to USV Iași. The source soil was classified as a cambic Chernozem (Cernoziom cambic) according to the Romanian soil classification system. For international comparability, based on the representative pedological characterization of the experimental farm and the properties of the soil used, the soil is reported as a Cambic Chernozem (Loamic, Aric) according to WRB 2022 [
34]. The soil developed on loess-derived parent material and had a sandy loam texture, an alkaline calcareous reaction, and a history of intensive fertilization associated with substantial accumulation of residual phosphorus.
The high initial P-AL status was an intentional selection criterion. The experiment was not designed to determine whether this soil required additional P fertilization, but to examine how an already large extractable P pool responds to additional fertilizer inputs under contrasting water regimes and in the presence or absence of wheat. Such conditions are relevant to intensively managed agricultural soils in which repeated P inputs have generated substantial residual P pools [
3,
4,
5,
6]. Importantly, a high soil-test P level does not necessarily imply a constant or spatially uniform P supply within the root-explored soil zone. In alkaline calcareous soils, the extractable P pool remains dynamic, and its accessibility is influenced by Ca-related reactions, soil buffering, moisture conditions, and rhizosphere processes [
7,
8,
9,
10,
11,
12]. Therefore, this soil provided an appropriate system for evaluating short-term P-AL redistribution in a high-residual-P environment rather than crop response to P deficiency.
Soil samples were collected from the 0–20 cm depth and prepared in the laboratory according to the methodological standards used in vegetation pot experiments.
2.3.1. Chemical Properties of the Soil
The analyses were performed on samples collected from the source soil before filling the experimental pots (
Table 1).
Table 1.
Chemical properties of the AL-SL soil used in the experiment.
Table 1.
Chemical properties of the AL-SL soil used in the experiment.
| Soil | pH (H2O) | CaCO3 (%) | SOC (%) | TSS
(mg L−1) | Total P
(mg kg−1) | P-AL
(mg kg−1) | K-AL
(mg kg−1) |
|---|
| AL-SL | 8.0 | 1.8 | 1.8 | 0.048 | 2150 | 178.1 | 580 |
The soil used in the experiment (AL-SL) had an alkaline reaction (pH 8.0) and contained 1.8% CaCO3. Soil organic carbon was 1.8%, while the low total soluble salt content indicated that the soil was non-saline.
The soil contained 2150 mg kg−1 total P and 178.1 mg kg−1 ammonium lactate-extractable phosphorus (P-AL), indicating a substantial phosphorus reserve and a high level of extractable P. The initial P-AL value of 178.1 mg kg−1 was determined in the homogenized source soil collected from the 0–20 cm layer before pot establishment and should not be interpreted as the expected post-treatment P-AL concentration at individual sampling depths.
Thus, the AL-SL soil represented a high-P alkaline calcareous system rather than a P-deficient soil. Under these conditions, the study focused on the short-term redistribution of the extractable P fraction in response to water regime, fertilization treatment, and wheat presence.
2.3.2. Physical Properties Determined in Experimental Pots
The physical properties were determined after filling the experimental pots with soil and reflect the conditions of the experiment (
Table 2). The AL-SL soil had a sandy loam texture, with 15.0% clay. Bulk density determined in the experimental pots was 1.40 g cm
−3. The estimated field capacity and wilting point were 19.3 and 6.9% vol., respectively, while estimated available water was 12.4% vol. Estimated total porosity was 47.2% vol., and air-filled porosity was 27.9% vol.
2.4. Soil Preparation and Establishment of Experimental Pots
The soil used in the experiment, collected from the 0–20 cm layer, was air-dried, cleaned of plant residues, and sieved through a 2 mm mesh to obtain a homogeneous material.
The experimental pots, made of metal, with an internal diameter of 20 cm and a height of 25 cm, were provided with drainage holes at the base and placed individually on containers for collecting any excess drained water.
The pots were filled manually, by gradually adding soil and uniformly packing it, in order to ensure a constant bulk density. Each pot was filled with 10 kg of soil, resulting in a soil column with a height of 24 cm. The procedure for preparing and filling the pots was identical for all experimental variants.
2.5. Wheat Growing Conditions in Experimental Pots
The experimental pots were sown with winter wheat (Triticum aestivum L., cultivar Glosa) at T0 + 4 days, after pot preparation and stabilization of the initial soil moisture. For sowing, 30 seeds pot−1 were used. Fertilization was applied at the 3–4 leaf stage (BBCH 13–14). To distinguish plant-associated changes from soil processes, the same treatments were also applied in plant-free pots, used as controls for evaluating phosphorus redistribution under the influence of water and fertilizer form. At 24 h after fertilizer application, watering was performed according to the experimental protocol.
Plant and soil sampling was carried out at BBCH 21–22, approximately 20 days after fertilization and 14 days after the completion of watering, to allow for water redistribution and stabilization of phosphorus mobility processes. During the experiment, the pots were maintained under natural conditions, without temperature or light control, with mean daytime temperatures of 10–12 °C and night-time temperatures of 0–5 °C, favorable to slow vegetative development.
2.6. Fertilizer Application
Two types of fertilizers were used in the experiment: a liquid NP 4–18 + 0.12% Zn + 0.12% B fertilizer (SynerTech 418 Pro, Timac Agro, Bucharest, Romania), applied at two rates (FL1 and FL2), and a solid granular NPK 15–15–15 fertilizer (FS), used as the conventional reference variant. The F0 variant was maintained without fertilization.
The amount of phosphorus applied in each pot was established by converting agronomic rates to the surface area of the experimental unit. For the liquid fertilizers, the calculation also included the density of the commercial product (1.12 g cm
−3). The conversion of P
2O
5 into elemental phosphorus (P) was performed using the standard stoichiometric factor. The values obtained in this way express the effective phosphorus input per pot and allow for comparison of its redistribution in the soil profile among treatments (
Table 3).
The liquid NP 4–18 fertilizer was applied as a solution, by dripping, at different dilutions but with the same total application volume (200 L ha−1): a 1:3 ratio for FL1 (50 L fertilizer + 150 L water ha−1) and a 1:1 ratio for FL2 (100 L fertilizer + 100 L water ha−1). Application was localized along the row, to simulate liquid fertilization used in practice and to ensure a controlled distribution of phosphorus in the upper soil layer.
The solid NPK 15–15–15 fertilizer was applied by uniform distribution on the soil surface, imitating the classical broadcasting method used in wheat crops. The treatments were designed as alternatives for spring phosphate fertilization, intended to support the resumption of vegetation in autumn-sown wheat.
The fertilizer rates and application methods were selected to reproduce practical spring P correction options for winter wheat when basal autumn phosphorus fertilization has not been applied or has been considered unsuitable because of dry autumn conditions. Thus, the liquid treatments represented low- and high-rate commercial NP applications, whereas the solid NPK treatment represented a conventional broadcast fertilization option. The treatments were not designed to supply equivalent amounts of P or other nutrients, but to compare realistic fertilization options differing in formulation, rate, nutrient composition, and application method. In addition to differing in P input, the treatments also differed in nutrient composition: FS supplied N, P, and K, whereas FL1 and FL2 supplied N and P but no K. Consequently, treatment effects cannot be attributed solely to fertilizer physical form. Accordingly, the effects of fertilizer physical form and P input cannot be fully separated within the present experimental design.
Accordingly, the results reflect phosphorus redistribution processes associated with realistic fertilization strategies and should not be interpreted as direct measures of fertilizer efficiency.
2.7. Water Regime and Rainfall Simulation
The watering regime was designed to reproduce the hydroclimatic conditions characteristic of the Moldavian Plateau, north-eastern Romania, based on meteorological data recorded during 2010–2024 by the National Meteorological Administration [
33]. These data indicate a marked variability of spring precipitation, with alternations between dry periods and short wet episodes, characterized by accumulations of 60–80 L m
−2 over a few days, especially in March–April.
Based on this climatic context, four watering regimes were established: H0—0 L m−2, control without additional water input; H50—50 L m−2; H100—100 L m−2; and H150—150 L m−2. The water volumes were applied fractionally, at a constant rate of 25 L m−2 day−1, over 2, 4, and 6 consecutive days, respectively, to represent contrasting cumulative spring water input scenarios. H150 therefore represented a high cumulative water input scenario rather than a leaching treatment.
Considering the 24 cm soil column and the estimated field capacity of 19.3% vol., the amount of water stored in the soil at field capacity was approximately 46.3 L m−2. Accordingly, the cumulative additional water inputs represented approximately 108%, 216%, and 324% of this field capacity water storage for H50, H100, and H150, respectively. Because all pots were adjusted to field capacity before treatment application, all watering treatments added water to soil that was initially at field capacity, with H100 and especially H150 representing particularly large cumulative inputs relative to the initial field capacity water storage. Therefore, downward percolation and drainage through the soil column were possible, particularly under H150. However, because water was applied fractionally over several days and drainage volume and P concentration in the drained water were not quantified, P losses by leaching cannot be assessed from this experiment.
The watering rates were converted into equivalent volumes for the surface area of each experimental pot, with a diameter of 20 cm. Distilled water was used to avoid the influence of salinity or other dissolved compounds on phosphorus behavior in soil.
Watering was performed manually, by slow dripping onto the soil surface, to ensure uniform water infiltration and to avoid surface runoff. Before applying the watering regimes, the soil in all pots was gravimetrically adjusted to the estimated field capacity to ensure uniform initial moisture conditions across all variants and replications. Watering started 24 h after fertilizer application.
2.8. Soil and Plant Sampling
Soil and plant sampling was carried out 20 days after fertilizer application, on the same day for all experimental variants, to allow for phosphorus redistribution and its interaction with the soil matrix under experimental conditions.
Soil samples were collected from three depth intervals: 2–4 cm, 4–6 cm, and 6–8 cm. The 0–2 cm layer was not included in the analytical profile in order to avoid direct interference from fertilizer residues or the immediate application zone and to focus on the subsurface layer explored by young wheat roots after initial fertilizer dissolution and water redistribution. This sampling strategy reduced the influence of the immediate fertilizer reaction zone on the profile analysis; however, it also limited the assessment of initial fertilizer dissolution and short-range reactions occurring within the 0–2 cm layer. The soil columns were sectioned into vertical segments of identical size, to ensure uniform sampling among variants. This interval corresponds to the surface zone intensively explored by young wheat roots during early growth stages, when phosphorus availability is important for root initiation and development.
Plants were harvested completely, and the roots were carefully washed to remove adhering soil particles. The plant material was then oven-dried to constant mass. The determinations targeted shoot dry mass and root dry mass, analyzed separately.
2.9. Soil Analysis Methods
Soil analyses were performed for the agrochemical and physical characterization of the soil used in the experiment, with emphasis on the indicators relevant to phosphorus mobility and availability. The determinations were carried out according to the standardized pedological and agrochemical methods of the National Research and Development Institute for Soil Science, Agrochemistry and Environmental Protection (ICPA), supplemented with internationally recognized methods.
Soil reaction was determined potentiometrically in a soil–distilled water suspension, at a ratio of 1:2.5, after 30 min of equilibration. Soil organic carbon (SOC) was determined by the Walkley–Black method, and humus content was estimated using the conversion factor 1.724. Calcium carbonate content (CaCO3) was determined by the Dronineanu method, and total soluble salts (TSS) were evaluated gravimetrically in a 1:5 soil–water extract.
Total phosphorus was determined by H
2SO
4–HClO
4 acid digestion, followed by colorimetric determination of orthophosphate. Extractable phosphorus (P-AL) and potassium (K-AL) were determined according to the Egner–Riehm–Domingo ammonium acetate–lactate (AL) method, as standardized in the Romanian national standard STAS 7184/19-82. Air-dried soil was extracted with a solution containing 0.1 M ammonium lactate and 0.4 M acetic acid, adjusted to pH 3.75, at a soil-to-solution ratio of 1:20, with shaking for 4 h [
35]. Phosphorus in the extract was determined spectrophotometrically using a UV 1700 spectrophotometer (Shimadzu, Kyoto, Japan), whereas potassium was determined by flame photometry (Flame Photometer 410, Sherwood Scientific Ltd., Cambridge UK).
Particle size distribution was determined by the Kacinski pipette method according to the ICPA soil analysis methodology; clay content (<2 μm) was obtained from the particle size analysis. Bulk density (BD) was established gravimetrically by drying a known volume of soil at 105 °C. Field capacity (FC), wilting point (WP), available water (AW), total porosity (TP), and air-filled porosity (AP) were estimated based on texture, clay content, and bulk density, according to the methodology proposed by Canarache [
36,
37,
38].
2.10. Derived Indicators and Calculations
The mean content of extractable phosphorus in the 2–8 cm layer (P-AL2–8) was calculated as the arithmetic mean of the P-AL values determined at the 2–4, 4–6, and 6–8 cm depths, for each combination of fertilization, water regime, and vegetation condition.
The apparent depletion of extractable phosphorus (ΔP-AL) was calculated as the difference between P-AL determined in plant-free soil (S0) and that determined in wheat-planted soil (SP), for each treatment and analyzed depth:
This indicator expresses the apparent reduction of the P-AL fraction in the presence of plants and integrates the effects of root uptake and phosphorus transformations in soil, without representing a direct balance of phosphorus taken up by plants.
The root-to-shoot ratio (R/S) was calculated based on the dry mass of roots and shoots, determined at harvest:
The R/S ratio was used as an indicator of biomass allocation between roots and shoots, without directly implying the physiological efficiency of nutrient uptake.
To describe the vertical redistribution of P-AL within the 2–8 cm layer, two descriptive indices were calculated: the vertical distribution index (VDI) and the vertical contrast index (VCI) [
39,
40,
41].
VDI was calculated as the ratio between P-AL in the lower layer and the mean of the analyzed profile:
Values close to 1 indicate a relatively uniform distribution along the profile, subunitary values indicate a more pronounced accumulation in the upper part, while supraunitary values suggest a relatively more pronounced redistribution towards the lower layer [
33].
To describe the vertical contrast of P-AL between the upper and lower parts of the analyzed layer, the vertical contrast index (VCI) was calculated:
Values close to 1 indicate a relatively balanced distribution between the upper and lower layers. Values greater than 1 reflect a relatively more pronounced concentration of P-AL in the 2–4 cm layer, whereas subunitary values indicate a relatively more pronounced redistribution towards the 6–8 cm layer. VCI was used exclusively as a descriptive indicator of the vertical contrast of P-AL and does not represent an indicator of agronomic efficiency, phosphorus uptake by plants, or fertilizer performance [
33].
2.11. Determination of Phosphorus Concentration and Accumulation in Roots
For the determination of phosphorus in roots, root samples were separated from the shoots, cleaned of adhering soil particles, dried to constant mass, and weighed to determine root dry mass. Subsequently, the dried plant material was finely ground and subjected to mineralization. The phosphorus concentration in the extract obtained after mineralization was determined spectrophotometrically using a UV 1700 spectrophotometer (Shimadzu, Japan). The results were expressed as mg P g
−1 root dry matter (mg g
−1 DW) [
42].
Root P accumulation was calculated for each experimental replication by multiplying root P concentration by the corresponding root dry mass:
Therefore, root P accumulation expresses the amount of phosphorus retained in root biomass per experimental pot and does not represent total phosphorus uptake at whole-plant level.
2.12. Statistical Analysis
Statistical analysis was performed in SPSS v.22 (IBM Corp., Armonk, NY, USA). Each experimental pot was considered an independent experimental unit, and the results were expressed as means ± standard deviation. Soil depth represented a within-pot sampling layer rather than an independent experimental unit. To avoid assuming independence among depth measurements originating from the same pot, inferential analyses of P-AL were performed separately for each analyzed soil depth.
For each soil depth (2–4, 4–6, and 6–8 cm), P-AL content was analyzed using a three-way factorial ANOVA with vegetation condition (V), water regime (H), and fertilization treatment (F) as fixed factors. The main effects and the V × H, V × F, H × F, and V × H × F interactions were evaluated.
The biometric parameters of wheat—shoot dry mass, root dry mass, and the R/S ratio—as well as root P concentration and root P accumulation, were analyzed only for the SP variants, using two-way ANOVA, with fertilization treatment and water regime as main factors.
Differences between means were tested using Tukey’s HSD at p < 0.05. Bonferroni correction was used for the interpretation of significant interaction effects. Before applying ANOVA, residual normality and homogeneity of variances were checked.
3. Results
The results are presented starting from P-AL distribution in plant-free soil and continuing with the changes observed in wheat-planted soil. The analysis follows the vertical variation of P-AL, the mean content in the 2–8 cm layer, the apparent depletion expressed as ΔP-AL, the biometric response of wheat, and phosphorus accumulation in roots.
3.1. Effect of Experimental Factors on P-AL Distribution in the Surface Soil Profile
P-AL content was significantly affected by vegetation condition, water regime, and fertilization treatment at all three analyzed soil depths (
Table 4). Vegetation condition had a highly significant effect at 2–4, 4–6, and 6–8 cm (F = 947.17, 1199.13, and 2726.16, respectively;
p < 0.001).
Water regime and fertilization treatment were also significant at each depth, indicating that P-AL variation was consistently associated with both factors across the three analyzed soil layers.
All interactions involving vegetation condition were significant (p < 0.001). The V × H interaction indicated that the difference between plant-free and wheat-planted soil depended on water regime, while the V × F interaction showed that this difference also varied among fertilization treatments. The significant V × H × F interaction at all three depths further indicated that the effect of vegetation condition on P-AL depended on the specific combination of water regime and fertilization treatment. The H × F interaction was likewise significant at each depth.
3.2. Vertical Distribution of P-AL Under Contrasting Water Regimes
3.2.1. Depth Distribution of P-AL Under H0 Water Regime
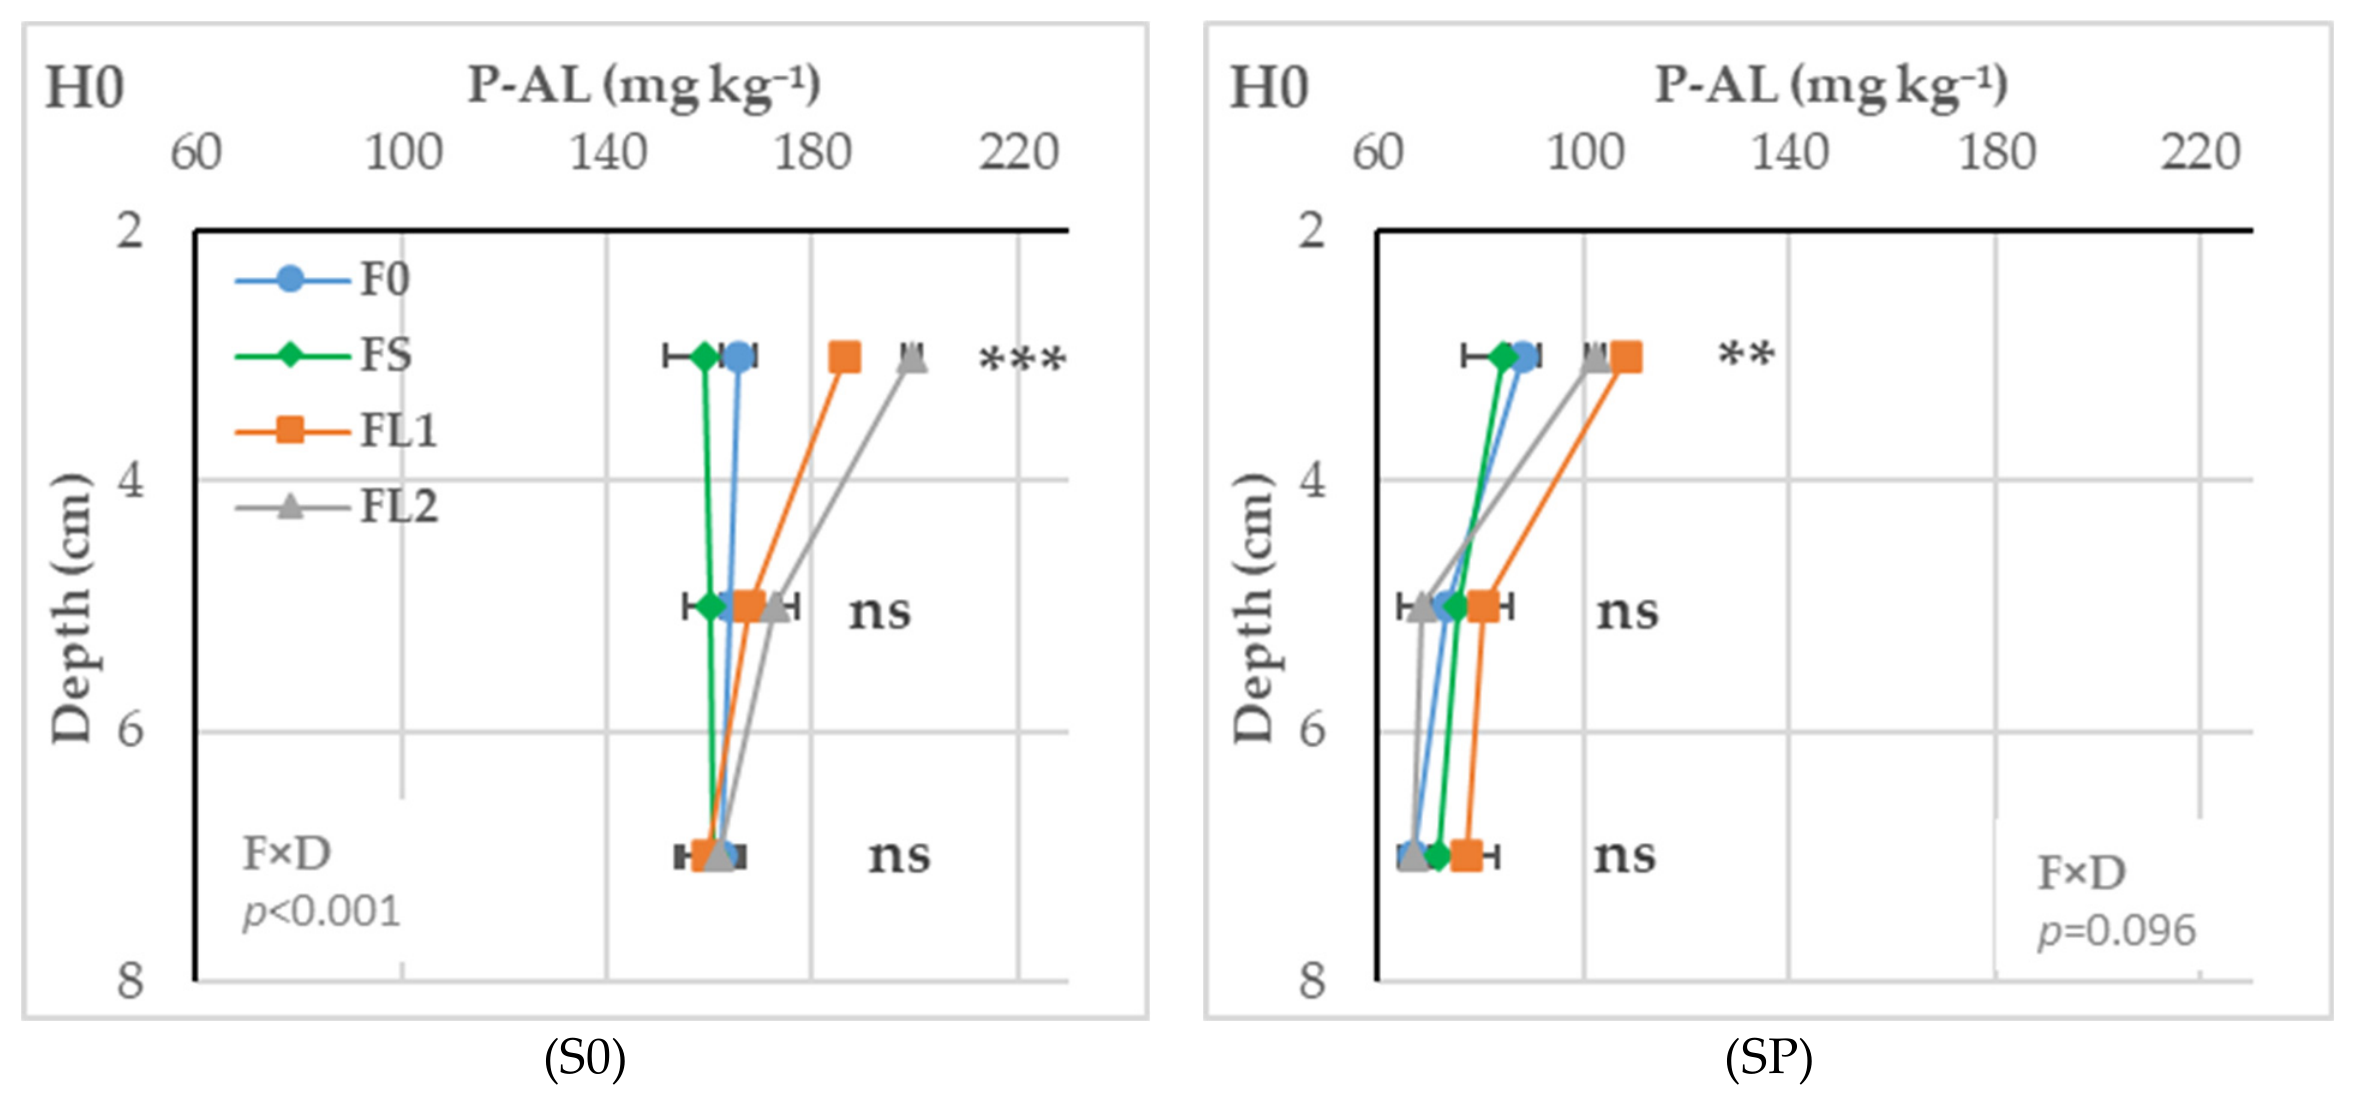
Under H0, P-AL remained predominantly concentrated in the upper soil layer. In S0, differences among fertilizers were significant only at 2–4 cm, where FL2 had the highest value (199 mg kg
−1), followed by FL1 (186 mg kg
−1). F0 and FS were lower, with 166 and 159 mg kg
−1, and belonged to the same statistical group (
Table 5). Below 4 cm, P-AL values were close among treatments, without significant differences.
In SP, the pattern remained similar, but at lower values. Treatment separation was maintained only in the 2–4 cm layer, where FL1 and FL2 had the highest values, 108 and 102 mg kg
−1, compared with 88 mg kg
−1 for F0 and 84 mg kg
−1 for FS. In the lower layers, differences among fertilizers were not significant. Thus, wheat presence reduced P-AL across the entire profile, without changing the main zone of differentiation among treatments; the notable difference was the shift of the maximum from FL2 in S0 to FL1 in SP (
Figure 1).
3.2.2. Depth Distribution of P-AL Under H50 Water Regime
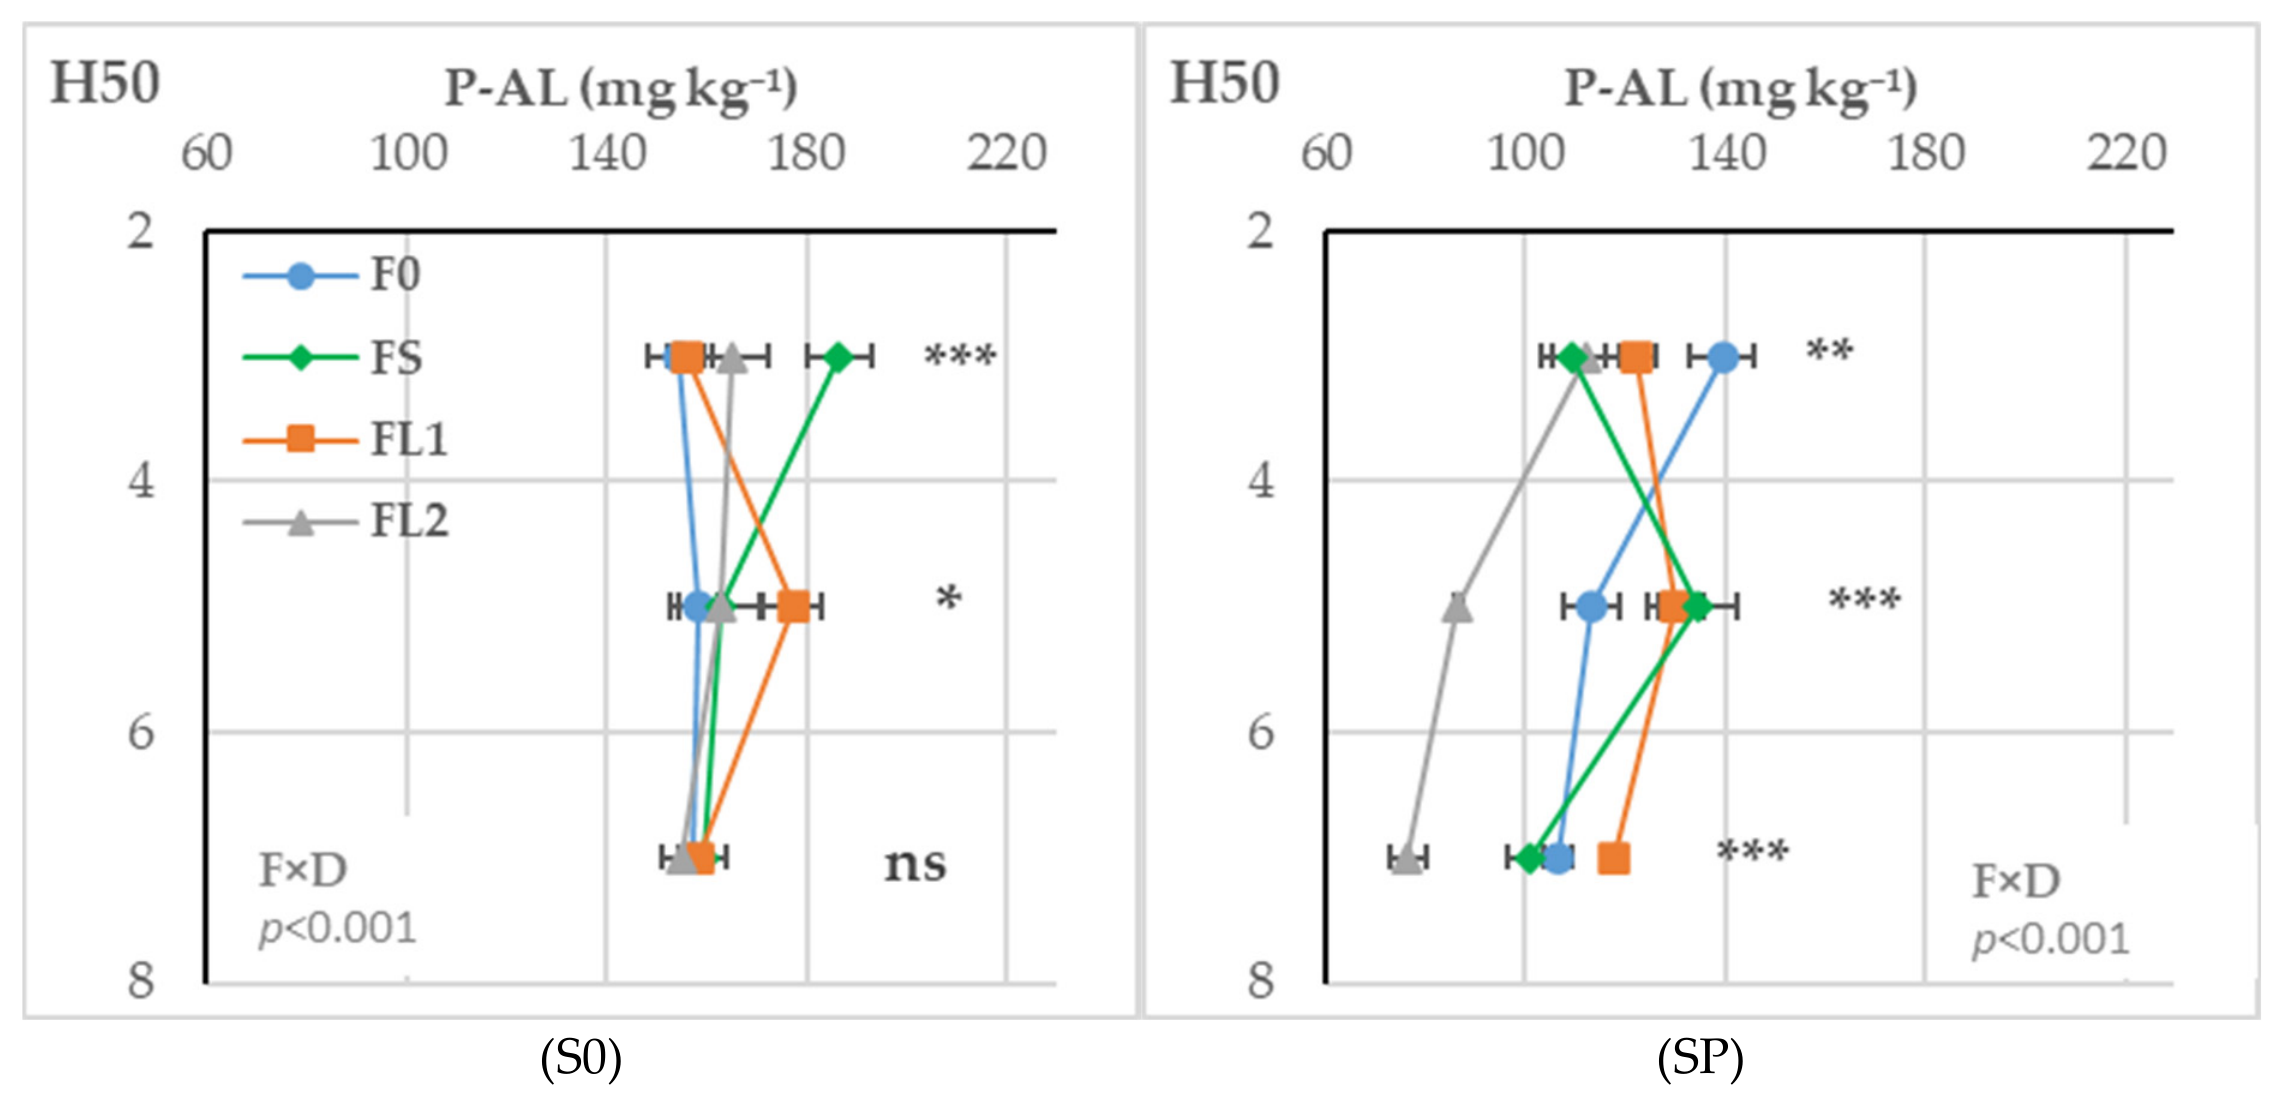
The H50 regime modified P-AL distribution mainly in the first two layers of the profile. In S0, differences among fertilizers were significant at 2–4 and 4–6 cm (
Table 6). At the surface, FS had the highest value (187 mg kg
−1), while F0, FL1, and FL2 remained close, between 155 and 164 mg kg
−1. In the 4–6 cm layer, the maximum value was recorded for FL1 (177 mg kg
−1). At 6–8 cm, the treatments did not differ significantly.
Comparison of the two systems shows that H50 produced not only a numerical reduction of P-AL in SP, but also a change in fertilizer behavior. In S0, the maximum values were associated with FS at 2–4 cm and with FL1 at 4–6 cm. In SP, FL2 stood out through the lowest values in the lower layers, indicating a clear modification of P-AL distribution in the presence of wheat (
Figure 2).
3.2.3. Depth Distribution of P-AL Under H100 Water Regime
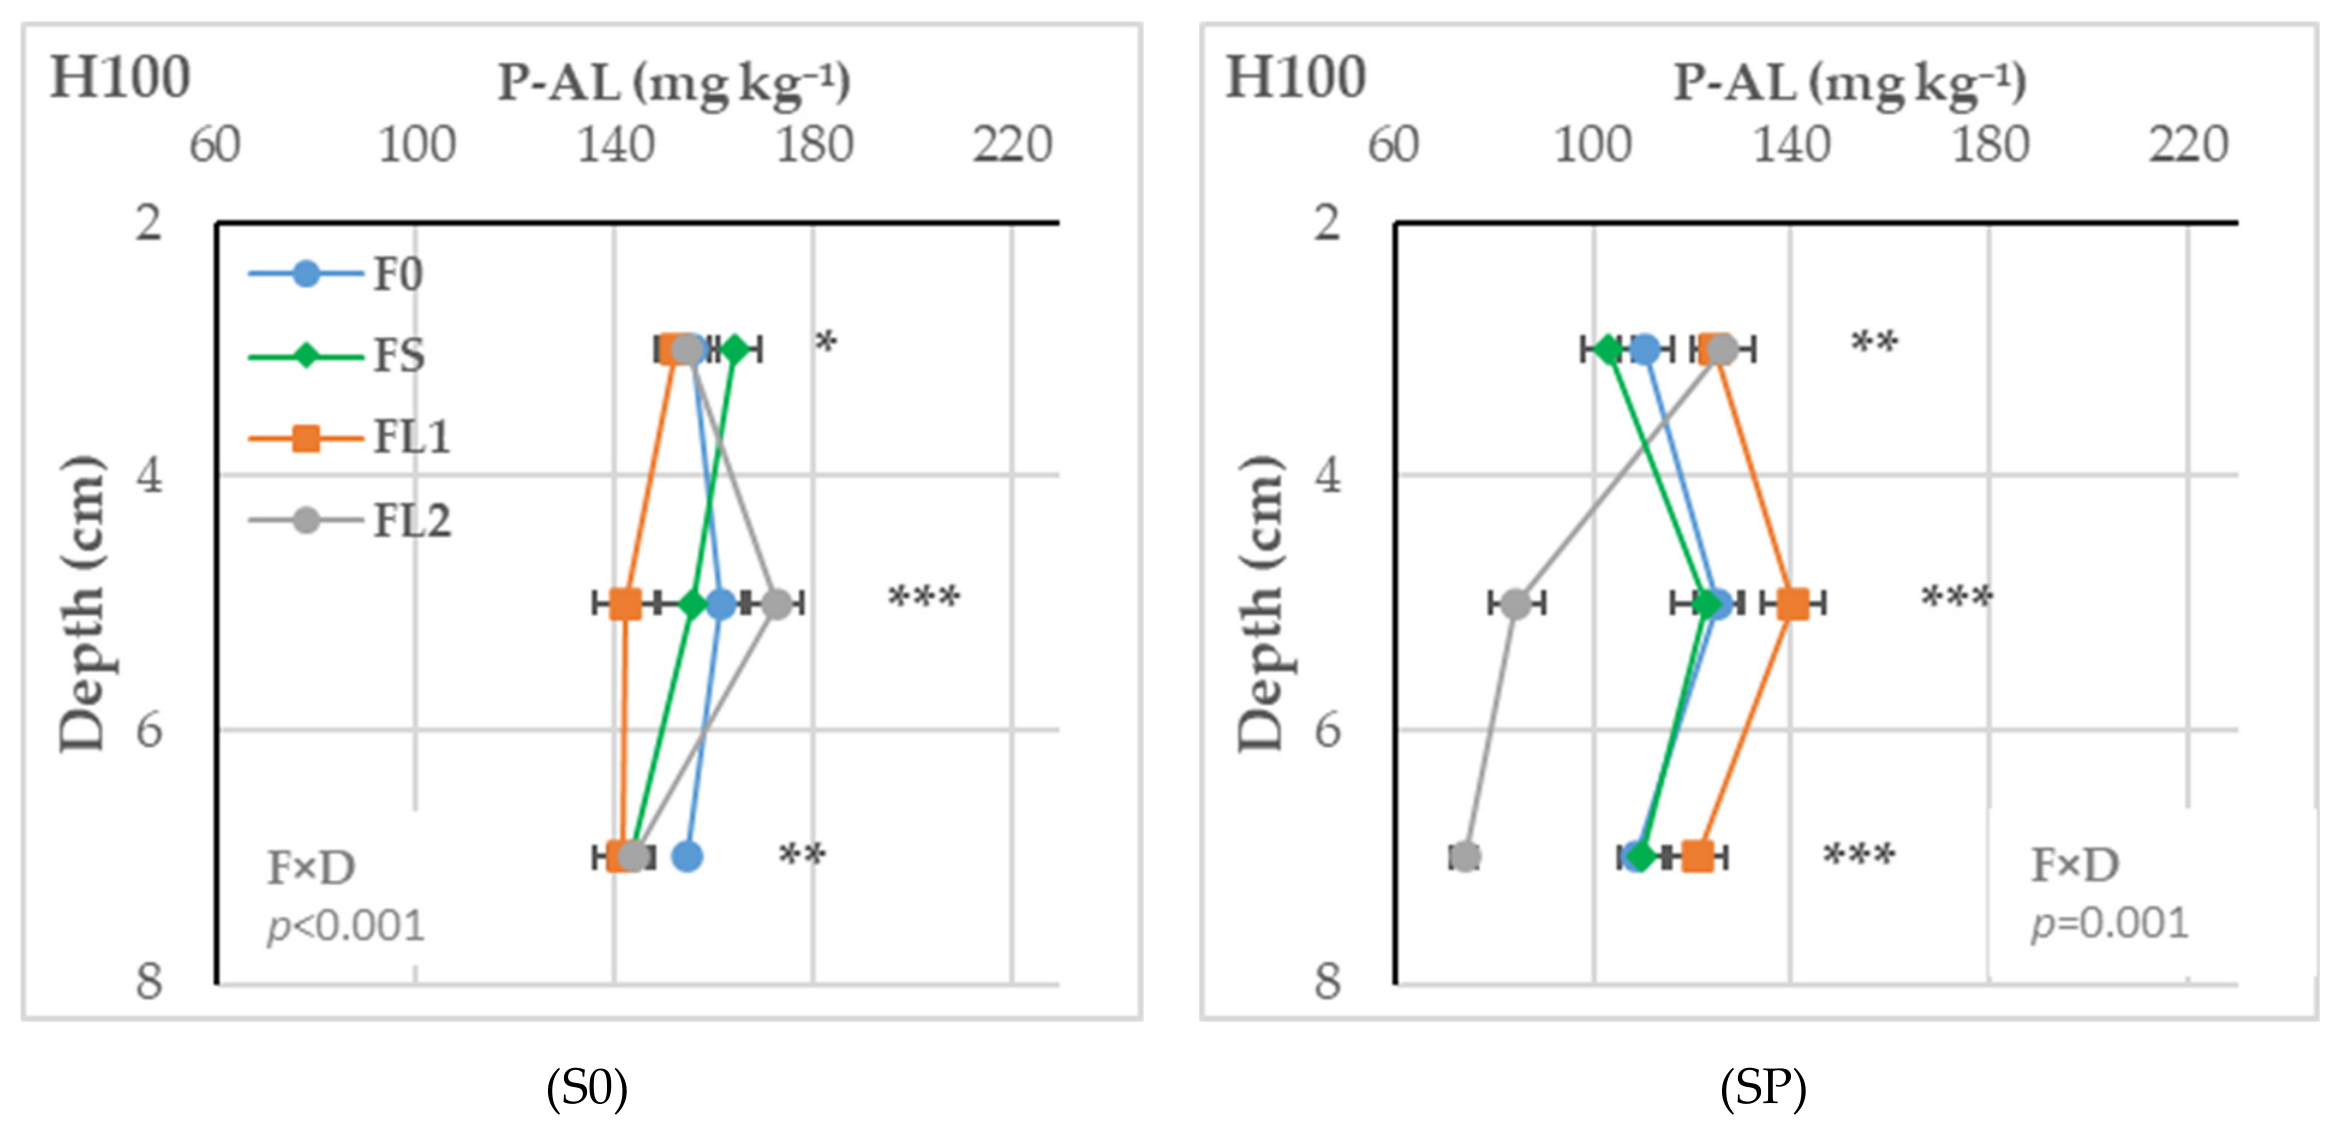
At H100, differences among fertilizers became significant at all analyzed depths (
Table 7). In S0, the 2–4 cm layer had relatively close values, with a maximum for FS (164 mg kg
−1) and a minimum for FL1 (153 mg kg
−1). The clearest contrast appeared at 4–6 cm, where FL2 recorded the highest P-AL value (173 mg kg
−1), while FL1 had the lowest value (142 mg kg
−1). At 6–8 cm, F0 remained at the highest level (155 mg kg
−1), whereas FS and FL1 were significantly lower.
In SP, P-AL distribution followed a different pattern. At 2–4 cm, FL1 and FL2 had the highest values, 124 and 126 mg kg
−1, both significantly above FS. Below this layer, FL2 decreased strongly, to 84 mg kg
−1 at 4–6 cm and 74 mg kg
−1 at 6–8 cm, values significantly lower than those of the other treatments. Compared with S0, the main difference was the change in the FL2 profile: in plant-free soil, the maximum occurred at 4–6 cm, whereas in the presence of wheat FL2 remained high only in the upper layer and had the lowest values in depth (
Figure 3).
3.2.4. Depth Distribution of P-AL Under H150 Water Regime
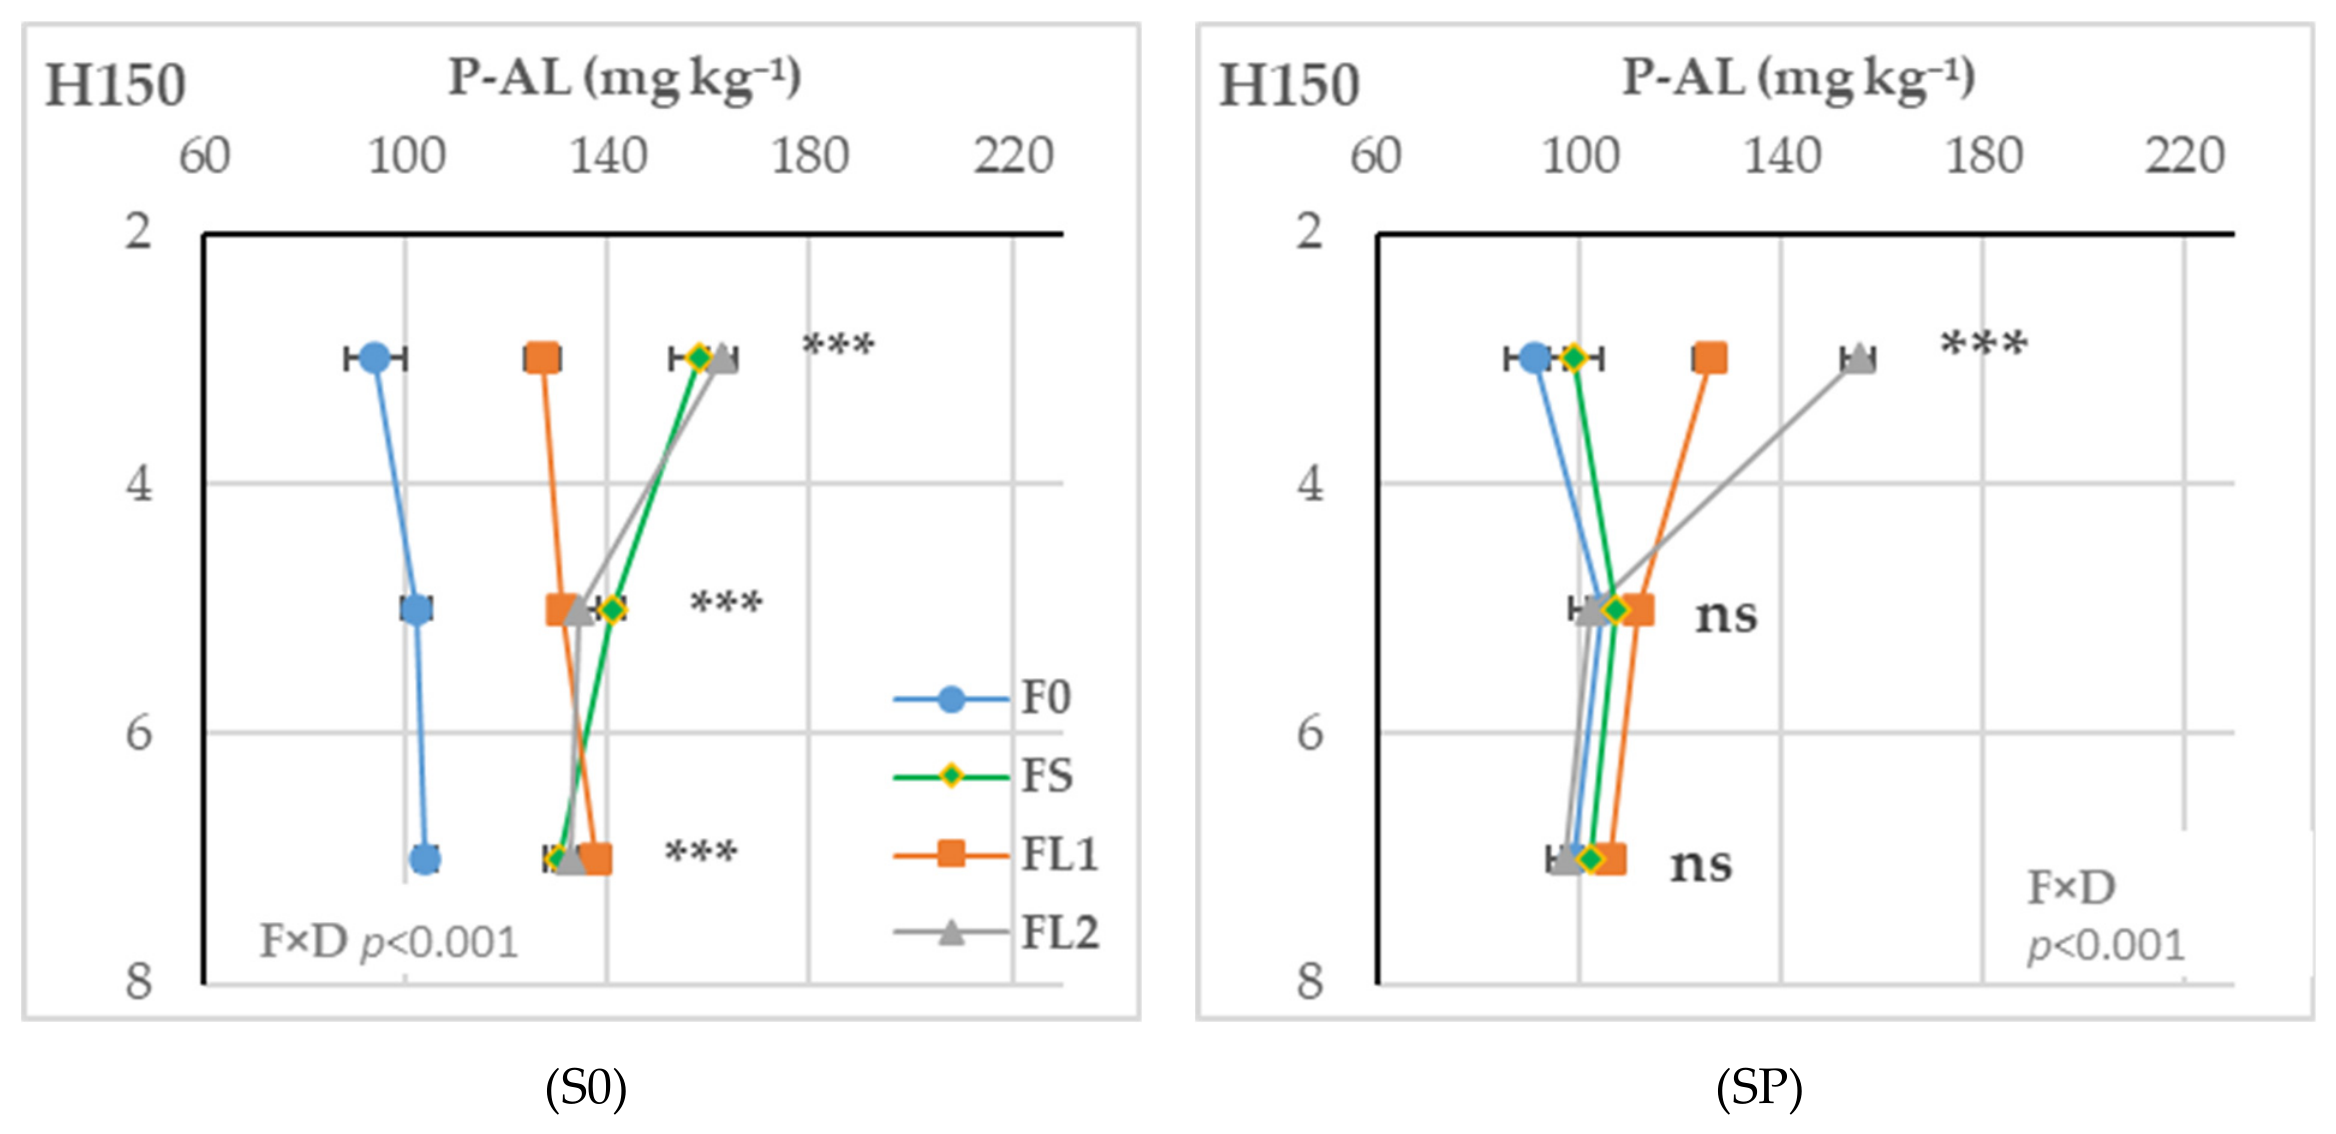
At H150, P-AL was strongly differentiated among treatments in plant-free soil (
Table 8). In the 2–4 cm layer, FL2 had the highest value (163 mg kg
−1), statistically close to FS (158 mg kg
−1), while F0 decreased to 94 mg kg
−1. Differences remained significant below 4 cm. In the 4–6 and 6–8 cm layers, fertilized treatments exceeded F0, while FL1, FL2, and FS did not differ significantly from one another.
In wheat-planted soil, treatment separation remained evident only in the surface layer. At 2–4 cm, FL2 had the maximum value (155 mg kg
−1), followed by FL1 (126 mg kg
−1), both significantly above F0 and FS. Below 4 cm, differences among fertilizers were no longer significant, and P-AL values remained within a narrow range of approximately 97–112 mg kg
−1. Compared with S0, wheat presence mainly reduced the differentiation among treatments in the 4–6 and 6–8 cm layers. In plant-free soil, the fertilization effect was visible across the entire analyzed profile; in SP, it was maintained almost exclusively at 2–4 cm, where FL2 clearly stood apart (
Figure 4).
Considered together, the four water regimes indicate different vertical distribution patterns for solid and liquid fertilization. FS showed a more stable behavior, especially in S0, whereas FL1 and FL2 generated more localized responses that were more dependent on water regime and wheat presence. FL2 stood out through high values in the surface layer under H0 and H150, but also through low values in SP under H50–H100, especially in the lower layers. This pattern supports the greater sensitivity of the high-rate liquid fertilization treatment to the conditions of the soil–plant system.
3.3. Mean P-AL in the 2–8 cm Layer and Apparent Depletion of Extractable Phosphorus
The mean P-AL content in the 2–8 cm layer highlighted clear differences between water regimes and between the two soil systems (
Table 9). In S0, the highest values were observed under H0, where FL2 and FL1 reached 178 and 171 mg kg
−1. At H50, the maximum shifted towards FS (170 mg kg
−1), while at H100 differences among treatments decreased, except for FL1, which declined to 146 mg kg
−1. Under H150, the contrast between fertilization and the control became more evident: FS and FL2 had the highest values, both 143 mg kg
−1, compared with 100 mg kg
−1 for F0.
In SP, P-AL values were lower and followed a different hierarchy. At H0, fertilization did not produce significant differences, with values ranging between 76 and 89 mg kg−1. Treatment separation became clearer at H50 and H100, where FL2 had the lowest values, 92 and 95 mg kg−1. In contrast, FL1 maintained the highest values at H100 and H150, with 129 and 115 mg kg−1. At H150, FL1 and FL2 belonged to the same statistical group and exceeded F0 and FS.
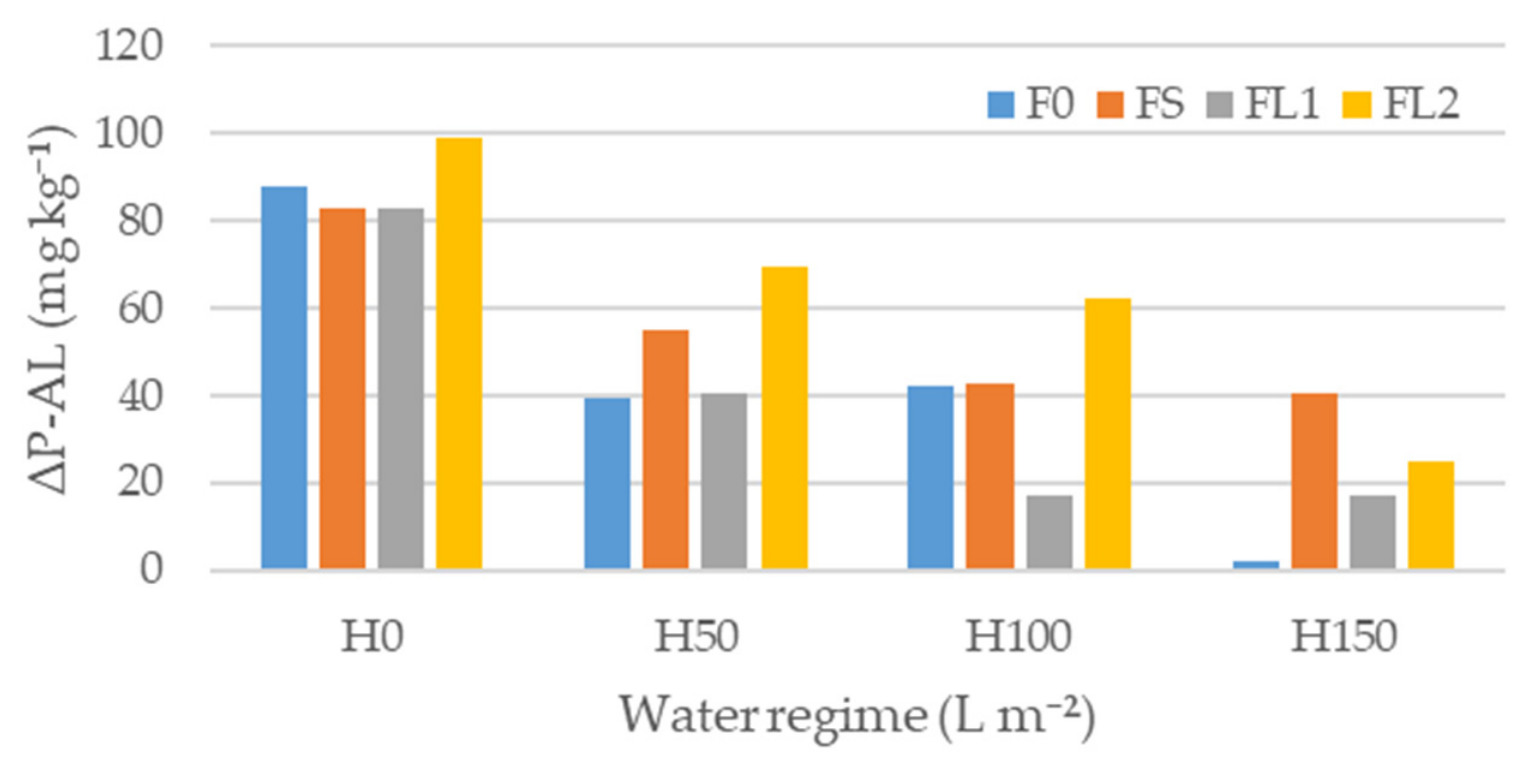
ΔP-AL generally decreased with increasing water input (
Figure 5). The largest differences between S0 and SP were observed under H0, where values ranged between 83 and 99 mg kg
−1, with the maximum for FL2. The same treatment maintained the highest values of apparent depletion also under H50 and H100, with 69 and 62 mg kg
−1. At H150, the differences between the two systems decreased considerably; F0 had an almost negligible ΔP-AL value (2 mg kg
−1), while FS recorded the largest difference between S0 and SP (40 mg kg
−1).
Overall, wheat presence reduced mean P-AL in the 2–8 cm layer, but the magnitude of this reduction depended on water regime and fertilizer. FL2 generated the largest contrasts between S0 and SP under H0–H100, whereas under H150 the maximum difference was associated with FS. This pattern shows that ΔP-AL does not reflect a simple fertilization effect, but rather the combined response of the soil–plant system to water and fertilization treatment.
3.4. Indices of Vertical P-AL Distribution in Plant-Free and Wheat-Planted Soil
The vertical distribution indices complemented the depth-based pattern, highlighting moderate differences among treatments (
Table 10). In S0, VDI remained close to 1.0 in most variants, while VCI had values of approximately 1.0–1.2. This profile indicates a relatively balanced distribution of P-AL within the 2–8 cm layer and a low to moderate vertical contrast between the upper and lower parts of the analyzed profile.
In SP, variations were clearer, especially for FL2. This treatment consistently had VDI values of 0.8, regardless of water regime, indicating a lower contribution of the 6–8 cm layer to the mean P-AL of the profile. At the same time, VCI increased to 1.4–1.5, reflecting a more pronounced vertical contrast and a relatively greater concentration of P-AL in the upper part.
Compared with S0, wheat presence accentuated mainly the vertical contrast for FL2, in agreement with the lower P-AL values observed in the lower layers of SP, especially under H50 and H100. Thus, the vertical indices support the interpretation of a more sensitive FL2 dynamic in the soil–plant system.
3.5. Wheat Biomass and Biomass Allocation
The two-way ANOVA highlighted a biometric response dependent on water regime, fertilization, and the interaction between these factors (
Table 11). Shoot dry mass was significantly influenced by water regime (F = 5.11,
p = 0.005), fertilization (F = 17.48,
p < 0.001), and the H × F interaction (F = 3.91,
p < 0.001). Root dry mass was also significantly influenced by water regime (F = 3.71,
p = 0.021), fertilization (F = 6.01,
p = 0.020), and the H × F interaction, the latter having the highest F value (F = 16.61,
p < 0.001). The R/S ratio also responded to both factors and to their interaction.
Differences among treatments varied according to water regime (
Table 12). Under H0, shoot biomass was close among fertilizers, between 11.6 and 12.4 g, without significant differences. The root response was clearer, with FL1 and FL2 having the highest values, 6.42 and 6.52 g; FL2 also had the highest R/S ratio (0.57).
At H50, FS had the highest numerical shoot biomass (14.3 g), without significant differentiation from F0 and FL2, whereas FL1 recorded the lowest values for both shoot and root biomass. At H100, differences in shoot biomass remained non-significant, but FS stood out through the highest root biomass (6.73 g). At H150, FS was associated with the highest shoot biomass (16.7 g) and root biomass (6.92 g).
Overall, FL2 was associated with a relatively greater allocation to roots under H0 and H50, whereas FS supported the largest biomass accumulations under high water input, especially at H150. The relationship with P-AL dynamics was not linear, indicating a biometric response dependent on the combination of water and fertilization treatment.
3.6. Root Phosphorus Concentration and Accumulation in Wheat
The two-way ANOVA highlighted significant effects of water regime and fertilization on P concentration in wheat roots (
Table 13). The H × F interaction was not significant, indicating that variations in root P concentration mainly reflected the general effects of the two factors, without major changes in treatment hierarchy among water regimes.
For root P accumulation, the response was more clearly differentiated. Water regime, fertilization, and the H × F interaction had significant effects, and the high value of the interaction (F = 8.58, p < 0.001) shows that the effect of fertilizers on P accumulation depended on water regime. Therefore, root P accumulation should be analyzed within each water regime, in relation to root biomass.
P concentration in wheat roots varied within a relatively narrow range, from 3.12 to 3.83 mg g
−1 DW (
Table 14). At H0 and H50, differences among fertilizers were not significant. Treatment separation became clearer under the regimes with higher water input. At H100, FL2 had the highest root P concentration (3.83 mg g
−1 DW), significantly above F0. At H150, the highest values were recorded for FL1 and FL2, with 3.65 and 3.74 mg g
−1 DW, while F0 remained at the lowest level.
Root P accumulation differentiated the treatments more clearly than P concentration. Under H0, the highest values were observed for FL1 and FL2, with 20.9 and 21.4 mg pot−1, respectively, while FS had the lowest accumulation (16.6 mg pot−1). At H50, differences were not significant, although FL2 had the highest numerical value. In contrast, at H100 and H150, FS stood out through the highest root P accumulation, with 25.2 mg pot−1 under both regimes.
Overall, liquid fertilizers were associated with higher values of root P accumulation under H0, whereas FS supported the highest accumulations under H100 and H150. This pattern shows that root P accumulation depended on the combination of water regime, fertilization treatment, and root response.
4. Discussion
4.1. Water Regime as a Major Factor Shaping P-AL Redistribution
Water regime was a major factor shaping P-AL distribution in the alkaline AL-SL soil. Its effect was significant at all three analyzed soil depths (
p < 0.001) and depended on vegetation condition and fertilization treatment, as indicated by the significant V × H and H × F interactions (
Table 4). This result can be explained by the specific behavior of phosphorus in soil. Phosphorus has low mobility, and its movement through the profile cannot be compared with that of highly mobile ions such as nitrate. In the case of phosphates, distribution changes occur mainly through dissolution, short-distance diffusion, and successive sorption–desorption reactions at the interface between the solid phase and the soil solution [
28,
43]. Therefore, water should not be interpreted as a direct transport vector for P, but as a factor that regulates the processes through which the extractable fraction can be redistributed within the analyzed layer [
33].
Under low-moisture conditions, the continuity of water films around soil particles is limited. Contact between the fertilizer, the soil solution, and reactive surfaces becomes weaker, and phosphate diffusion is restricted. As water input increases, the soil provides a more favorable medium for fertilizer dissolution and for P transfer towards the zones immediately adjacent to the application site. This water-driven activation explains why the H50, H100, and H150 regimes modified not only the mean level of P-AL, but also its vertical distribution within the 2–8 cm layer. The relationship, however, remained controlled. The effect of water depended on fertilization treatment and position within the profile, showing that P-AL redistribution was not a uniform process. Studies on phosphorus diffusion have shown that water can accelerate the local movement of P, but the extent of this movement depends on soil properties and on the soil’s capacity to retain phosphate in extractable or less extractable forms [
15,
16].
The particular nature of the AL-SL soil is essential for interpreting these results. Although the sandy loam texture and porosity may favor water infiltration, the alkaline reaction and the presence of CaCO
3 indicate a strongly buffered system. Under such conditions, P availability is controlled by rapid chemical equilibria, including reactions with Ca forms and the possible transfer of phosphate into less soluble fractions [
8,
9]. For this reason, increasing water input did not produce a simple or uniform redistribution through the profile. Rather, it generated a reorganization of P-AL within the analyzed layer, dependent on the fertilizer and on wheat presence.
Under H150, the cumulative additional water input was equivalent to approximately 324% of the water stored at field capacity in the 24 cm soil column (
Section 2.7), creating a high potential for downward percolation and drainage through the soil column. This enhanced water movement may have contributed to the distinct P-AL distribution observed under H150, in addition to dissolution, diffusion, and sorption–desorption processes. However, because drainage volume and P concentration in the drained water were not measured, this mechanism should be regarded as a plausible hydrological contribution rather than evidence of P leaching.
4.2. Wheat Presence and Apparent Depletion of Extractable Phosphorus
The comparison between the plant-free system and the wheat-planted system showed that plant presence modified P-AL distribution in the analyzed layer. In S0, P-AL variations mainly reflect the physicochemical processes occurring after water and fertilizer application: dissolution, short-distance diffusion, and phosphate retention reactions in soil. In SP, these processes were superimposed on root activity and on rhizosphere-specific changes. This difference is important because the root does not act only as an uptake organ, but locally changes pH, the composition of the soil solution, microbial activity, and the balance between more and less extractable P forms [
26,
27,
28].
The lower P-AL values in the planted system should not be interpreted simply as total phosphorus uptake by the plant. The ΔP-AL indicator expresses the difference between P-AL measured in S0 and that measured in SP and more accurately describes an apparent depletion of the extractable fraction. This depletion may include P taken up by roots, but also P transformed into less extractable forms, temporarily immobilized in microbial biomass, or redistributed in the immediate vicinity of roots. For this reason, ΔP-AL is useful for highlighting the effect of wheat presence on the extractable pool, but it cannot be equated with total P uptake. Such caution is necessary especially in soils with high P reserves, where soil tests estimate only part of the phosphorus potentially accessible to plants [
43,
44,
45,
46].
The depletion pattern was influenced by the water regime. Under H0, differences between S0 and SP were large for all treatments, with ΔP-AL values ranging from 83 to 99 mg kg−1, showing that the mere presence of wheat strongly reduced the extractable P-AL fraction under conditions of limited water-driven redistribution. As water input increased, ΔP-AL generally decreased, but not uniformly. FL2 maintained high contrasts under H50 and H100, with 69 and 62 mg kg−1, respectively, whereas under H150 the differences became narrower and the pattern changed: F0 had an almost negligible depletion, of 2 mg kg−1, while FS showed the highest value, of 40 mg kg−1. This behavior shows that the plant effect on P-AL was not constant but depended on the combination between water and fertilization treatment.
The VDI and VCI indices support the same interpretation. In the plant-free system, the vertical distribution of P-AL was relatively more balanced, with VDI values close to 1.0 and VCI values generally around the 1.0–1.2 interval. In SP, the contrast between the upper and lower layers became more evident. This was especially visible for FL2, where VDI remained below 1, around 0.8, while VCI increased to approximately 1.4–1.5, indicating a lower contribution of the 6–8 cm layer and a relatively greater concentration of P-AL in the upper part of the profile. In an alkaline calcareous soil, such changes may be related to the interaction between root position, water availability, and the rapid reactions of phosphate with the soil solid phases [
11,
33]. Therefore, wheat presence did not only reduce the mean P-AL level but also changed the way in which extractable phosphorus was vertically organized within the 2–8 cm layer.
4.3. Fertilization Treatment and Rate: Contrasting and Context-Dependent P-AL Responses
Fertilization treatment influenced the way in which P-AL was redistributed in the analyzed layer, but its effect cannot be separated from water regime and wheat presence. Liquid and solid fertilizers did not act only as different P sources. They created different contact conditions between applied phosphorus, the soil solution, and reactive surfaces. In general, liquid formulations can enter the soil liquid phase more rapidly, whereas granular forms release phosphorus from more localized points, with a dynamic influenced by granule dissolution and by the reactions occurring around it. Similar differences have been described in studies on fluid and granular phosphate fertilizers, especially in calcareous soils or soils with a high capacity for P retention [
20,
21,
23].
In the present experiment, liquid fertilizers showed a more variable behavior than the solid fertilizer (FS). Under H0, in S0, the mean P-AL content in the 2–8 cm layer was higher for FL2 and FL1 than for FS, reaching 178 and 171 mg kg
−1, compared with 160 mg kg
−1. This point supports the idea of a more reactive extractable pool in the case of liquid formulations when water-driven redistribution is limited. In the wheat-planted system, however, FL2 was associated under H50–H100 with low mean P-AL values, of approximately 92–95 mg kg
−1. Its behavior therefore does not indicate direct superiority, but rather a greater sensitivity to the interaction between water, roots, and position within the profile. Studies on wheat have also shown that the response to liquid or granular P forms depends strongly on soil, moisture conditions, and fertilizer placement [
47,
48].
The solid fertilizer (FS) showed a more stable behavior in relation to P-AL distribution, especially in the plant-free system. This stability may be related to the more gradual release of phosphorus from granules and to the local interaction with the soil solid phases. At higher water inputs, the effect of FS became more evident; under H150, in S0, FS and FL2 had the same mean P-AL level, 143 mg kg
−1, compared with 100 mg kg
−1 for F0. In SP, FS did not produce the strong vertical contrast observed for FL2, but it remained associated with a higher apparent P-AL depletion under H150. This pattern suggests that phosphorus from the solid source remained involved in the extractable pool and available for rhizosphere processes. The reactions of phosphate fertilizers in soil are strongly dependent on source, solubility, placement, and soil properties, which explains why the same fertilizer can have different responses depending on the water regime [
3,
49,
50,
51,
52,
53,
54].
The fertilization treatments were designed to reproduce practical spring P correction options for winter wheat under conditions in which basal autumn P fertilization is absent or insufficient. In temperate continental regions with variable autumn and spring moisture conditions, basal autumn P fertilization may be absent, reduced, or considered agronomically unsuitable under dry soil conditions. In such situations, spring P correction becomes a practical option, and farmers may choose between liquid NP fertilizers applied at commercial rates and conventional solid complex fertilizers broadcast on the soil surface.
For this reason, the P rates applied through FL1, FL2, and FS were not equivalent, and the application methods differed among treatments. The treatments were therefore selected to represent realistic spring fertilization strategies rather than equivalent-P fertilizer comparisons. Consequently, the results should not be interpreted as a comparison of fertilizer efficiency per unit of applied phosphorus or as evidence of the agronomic superiority of one fertilizer form. Rather, they describe different P-AL redistribution patterns associated with commercial fertilizer forms, rates, and application pathways under contrasting water regimes.
From this perspective, the liquid fertilizer treatments expressed more reactive and context-dependent P-AL patterns, whereas FS showed a comparatively more stable pattern within the 2–8 cm layer. However, this response should be attributed to the FS treatment as a whole—including its higher P input, K supply, nutrient composition, and broadcast application method—and not to the solid fertilizer form alone.
4.4. Wheat Biomass and Root P Accumulation: A Non-Linear Response to Soil P-AL Dynamics
The biometric response of wheat did not follow the variations in soil P-AL in a linear manner. Although water regime and fertilization treatment significantly modified the distribution of extractable phosphorus, higher P-AL values did not automatically translate into a proportional increase in biomass. This aspect is important because the AL-SL soil already had high P reserves, and under such conditions the relationship between extractable P, root P accumulation, and biomass production may become less direct. Phosphorus available to the plant depends not only on the extractable amount determined by soil analysis, but also on its position relative to roots, moisture, growth rate, and the plant’s capacity to explore the fertilized zone [
28,
43].
The biomass data show that the fertilization treatments were associated with different responses depending on water regime. Under conditions without additional water input, FL1 and FL2 were associated with higher root biomass values, and in FL2 the root-to-shoot ratio reached 0.57. This pattern indicates greater allocation towards the root system under conditions of limited water-driven phosphorus redistribution. The response should not be interpreted as a direct agronomic advantage, but as a change in the plant growth strategy in an environment where resources are more localized. Under H100 and H150, FS was associated with the highest root biomass values, and under H150 it reached 16.7 g shoot biomass and 6.92 g root biomass, the highest values in the experiment. Because FS also supplied substantially greater amounts of P and N and was the only treatment supplying K, this biomass response cannot be attributed solely to fertilizer physical form and may partly reflect differences in overall nutrient input.
Therefore, the response observed for FS under higher water inputs should be interpreted as the combined effect of the fertilization treatment and water regime, rather than as evidence of an intrinsic advantage of the solid fertilizer form. Interactions between soil moisture and P nutrition in wheat have also been highlighted in other studies, where the effect of phosphate fertilization varied according to water conditions and root system development [
16,
44].
Root P accumulation completed this picture. Root P concentration varied within a relatively narrow range, whereas root P accumulation was more sensitive to root mass. Thus, differences among treatments reflect not only changes in P concentration, but also the capacity of plants to produce root biomass in each water–fertilizer combination. FL1 and FL2 were associated with higher root P accumulation under H0, with values of 20.9 and 21.4 mg pot
−1, while FS was associated with the highest accumulations under H100 and H150, of approximately 25.2 mg pot
−1. This pattern supports the non-linear character of the relationship between P-AL, root growth, and P accumulated in root tissues. In alkaline soils, the rhizosphere can locally modify phosphorus availability through pH changes, exudation, and microbial activity, and these processes may be enhanced or limited by the water regime [
11,
26]. Accordingly, root P accumulation should be interpreted primarily as the amount of P retained in root biomass rather than as an independent indicator of plant P nutritional efficiency. Although root P concentration was significantly affected by water regime and fertilization, its variation was comparatively limited, and differences in root P accumulation were strongly influenced by differences in root biomass. Assessment of total plant P uptake would require P determination in the aboveground biomass in addition to roots.
Therefore, the results on biomass and root P should be interpreted together with P-AL dynamics, but not as a direct measure of whole-plant phosphorus uptake or phosphorus use efficiency.
4.5. Implications for Sustainable Phosphorus Management Under Variable Spring Moisture Conditions
The results obtained show that phosphorus management in alkaline soils with high P reserves cannot be reduced to the choice of a fertilizer form or to increasing the applied rate. The water regime modified both P-AL distribution and the wheat response, suggesting that the performance of phosphate fertilization depends on the moisture context in which it is applied. Under low-moisture conditions, phosphorus tends to remain more localized, and differences among fertilization treatments are expressed mainly near the application zone. At higher water inputs, redistribution becomes more evident, but not necessarily more uniformly favorable for the plant. In alkaline soils, rapid reactions between phosphate, carbonate phases, and Ca forms may limit the transformation of applied phosphorus into a pool that is constantly accessible to the crop [
8,
23].
From an agronomic perspective, liquid fertilizers treatments expressed a more reactive behavior, whereas the solid fertilizer (FS) had a more stable profile, especially under regimes with high water input. This difference should not be interpreted as the general superiority of one fertilizer form. More accurately, it indicates that fertilizer form should be selected according to the anticipated moisture conditions, the application method, and the intended objective: rapid stimulation of a more dynamic P-AL fraction or maintenance of a more stable input in the layer explored by roots. Such an approach is compatible with the principles of efficient phosphorus use, which aim not only to increase immediate availability, but also to avoid unnecessary P accumulation in soils that are already well supplied [
2,
3]. Accordingly, the fertilization treatments used in this experiment should not be interpreted as a recommendation for routine additional P fertilization in soils with very high P-AL, but as a means of examining the behavior of additional fertilizer inputs in a high-residual-P soil system.
The study was conducted in pots, on a single alkaline soil, over a short time interval, and P was determined in roots, not in shoots or in the whole plant. Because the experiment was conducted during a single experimental cycle, the consistency of these short-term P-AL responses across seasons and under field conditions remains to be validated. In addition, the 0–2 cm layer was not analyzed; therefore, the experiment does not fully characterize initial fertilizer dissolution and reactions within the immediate application zone. These analytical choices were consistent with the objective of the experiment, which targeted early root-zone P-AL redistribution and root response at BBCH 21–22. At this stage, shoot P concentration would mainly provide a transient indication of early plant P status and would not allow reliable conclusions on whole-plant P uptake or phosphorus use efficiency.
For this reason, the results should be viewed as evidence of P-AL redistribution mechanisms within the 2–8 cm layer and as a basis for future research including total plant P determination, soil phosphorus fractionation, and evaluation of rhizosphere processes over longer periods [
7,
45,
52].
5. Conclusions
The study showed that water regime was a major factor shaping extractable phosphorus redistribution in the high-P alkaline soil, both in plant-free and wheat-planted systems. Water input modified P-AL organization within the 2–8 cm layer, with redistribution varying among soil depths and fertilization treatments.
Wheat presence was associated with lower P-AL levels and modified their vertical distribution, with the magnitude of the S0–SP difference depending on water regime and fertilization treatment. This difference, expressed as ΔP-AL, should be interpreted as apparent depletion of the extractable fraction rather than as total plant P uptake. The vertical distribution indices supported this interpretation by showing a stronger contrast between upper and lower layers in the planted system.
Fertilization treatment influenced P-AL dynamics, but its effect depended on water regime. Because FS, FL1, and FL2 were not equivalent in P and overall nutrient input and also differed in application rate and method, the observed responses cannot be attributed to fertilizer physical form alone. This remains a key limitation when interpreting treatment differences as fertilizer-form effects.
The liquid fertilizer treatments showed more reactive and variable P-AL patterns, whereas the higher-input solid NPK treatment (FS), which supplied the largest P input and was the only treatment supplying K, showed a comparatively more stable pattern and, under higher water inputs, was associated with the highest biomass and root P accumulation. These responses cannot be interpreted as an inherent advantage of the solid fertilizer form. Wheat response therefore did not follow soil P-AL levels linearly but reflected the combined influence of water regime and fertilization treatment.
From a practical perspective, these results are relevant to spring P correction strategies in winter wheat grown on high-P alkaline soils when basal autumn P fertilization has not been applied. These results should not be interpreted as a recommendation for routine additional P fertilization in soils already very high in extractable P; under such conditions, fertilizer management should consider anticipated spring moisture, nutrient input, and application method. The study does not support conclusions on phosphorus use efficiency, whole-plant P uptake, or leaching losses because these processes were not directly measured. Further research should include seasonal and field validation, shoot P determination, soil P fractionation, and longer-term assessment of rhizosphere processes. Overall, the study provides a framework for interpreting short-term P-AL redistribution in high-P alkaline soils and highlights the need to integrate spring moisture conditions, nutrient input, and application method when designing phosphorus management strategies.