Article

Optimization and Validation of a Multitrait Physiological Drought Mitigation Index (PDMI) for Screening PGPR-Induced Drought Tolerance in Strawberry

1
Institute of Marine and Environmental Sciences, University of Szczecin, 70-383 Szczecin, Poland
2
Faculty of Data Science and Information, INTI International University, Nilai 71800, Malaysia
3
Department of Horticulture, Faculty of Environmental Management and Agriculture, West Pomeranian University of Technology in Szczecin, Słowackiego 17, 71-434 Szczecin, Poland
4
Department of Bioengineering, Faculty of Environmental Management and Agriculture, West Pomeranian University of Technology in Szczecin, Słowackiego 17, 71-434 Szczecin, Poland
*
Author to whom correspondence should be addressed.
Agronomy 2026, 16(17), 1623; https://doi.org/10.3390/agronomy16171623
Submission received: 25 June 2026 / Revised: 18 July 2026 / Accepted: 23 August 2026 / Published: 24 August 2026

Abstract

Drought mitigation by plant growth-promoting rhizobacteria (PGPR) is commonly assessed using individual physiological traits, although plant responses to water deficit are intrinsically multivariate. We developed a Multitrait Physiological Drought Mitigation Index (PDMI) to summarize PGPR-specific physiological responses in strawberry (Fragaria × ananassa) while separating drought-specific effects from general performance under optimal moisture. The balanced two-season experiment comprised 240 plant-level observations and 10 complete matched replication sets per season. The primary PGPR analysis excluded the non-bacterial magnesium-sulfate comparator (CMg) and included four PGPR strains, the uninoculated control, 200 plant-level observations, and 80 replication-level difference-in-differences (DiD) profiles. Nine nonredundant physiological traits were direction-aligned and standardized using the 2021 development season and aggregated with equal weights; all parameters were then applied unchanged to the 2022 holdout season. Block-adjusted MANOVA confirmed a joint inoculation variant × moisture interaction (Pillai’s trace = 0.533, F(36,664) = 2.835, p < 0.001). Block-restricted PERMANOVA detected a small multivariate strain effect (pseudo-F = 0.995, R2 = 0.0378, p = 0.0289), whereas PERMDISP was nonsignificant (p = 0.273). In 2021, DLGB 2 obtained the highest PDMI (0.160) and had a 66.3% bootstrap probability of rank 1 and an 88.3% probability of inclusion in the top two. In the 2022 holdout, AJ 1.2 ranked first; cross-season rank agreement was positive but uncertain (Spearman’s ρ = 0.60, p = 0.40). The best individual trait, water-use efficiency, showed greater within-season rank stability than PDMI (P(rank 1) = 0.998), demonstrating that the composite did not universally outperform single measurements. PDMI was not significantly associated with holdout yield mitigation (R2 = 0.0458; block-clustered p = 0.127; within-block permutation p = 0.341). PDMI should, therefore, be interpreted as a transparent integrative descriptor of coordinated physiological response rather than a definitive classifier, a universally superior screening metric, or a standalone yield predictor.

1. Introduction

Drought stress is among the most consequential abiotic constraints on agricultural productivity, and its frequency, duration, and intensity are expected to increase under projected climate change [1,2]. Water deficiency disrupts photosynthetic carbon assimilation, stomatal regulation, nutrient transport, cellular redox balance, and biomass allocation [3,4]. Strawberry (Fragaria × ananassa) is particularly sensitive because of its relatively shallow root system and high transpiration demand; even moderate reductions in substrate moisture may impair growth, fruit development, and yield [5,6]. Reliable strategies for increasing drought resilience therefore require not only effective biological interventions but also quantitative tools capable of measuring coordinated plant responses [7,8].
Plant responses to drought involve simultaneous physiological adjustments. Abscisic acid-mediated stomatal closure reduces transpiration but also restricts CO2 diffusion and photosynthetic carbon fixation [3,9]. Prolonged imbalance between light absorption and carbon fixation may impair photosystem II (PSII), which is reflected in chlorophyll-fluorescence variables such as maximum quantum efficiency (Fv/Fm) and the performance index (PI) [10,11,12]. Drought-induced reactive oxygen species may destabilize membranes and increase electrolyte leakage, whereas maintenance of tissue hydration and relative water content reflects the capacity to preserve water status [4,13,14,15]. No single measurement captures all of these partially coupled processes.
Plant growth-promoting rhizobacteria (PGPR) can mitigate abiotic stress through several mechanisms, including modification of root architecture, regulation of phytohormonal signalling, ACC-deaminase activity, osmolyte accumulation, nutrient mobilization, siderophore production, and stimulation of antioxidant systems [16,17,18,19,20,21]. Beneficial effects have been reported in cereals and horticultural crops, including strawberry [22,23]. However, quantitative comparisons among strains remain methodologically fragmented. Many studies evaluate isolated traits or compare raw drought-condition values without explicitly separating general growth promotion under optimal moisture from a treatment-specific response to drought. Consequently, a strain may appear favourable because it performs well in both moisture regimes, even if it does not specifically reduce the physiological impact of water deficit [24,25,26,27,28,29,30,31,32,33,34].
Composite indices offer a potential remedy to this single-trait fragmentation. Classical drought-tolerance indices such as tolerance (TOL), mean productivity (MP), geometric mean productivity (GMP), stress susceptibility index (SSI), stress tolerance index (STI), and yield stability index (YSI) summarize performance under stress and non-stress conditions, primarily using agronomic yield [29,32,33,34]. Multitrait approaches, including Smith–Hazel-type selection indices, MGIDI, MTSI, and FAI-BLUP, integrate several variables or quantify proximity to an ideotype [26,27,28,35,36,37]. These approaches are valuable, but they were not designed specifically to isolate PGPR × drought responses at the replication level before cross-trait aggregation. Moreover, composite scores may become difficult to interpret when trait direction, scaling, weighting, and rank uncertainty are not reported transparently.
The present study addresses this gap through a replication-level difference-in-differences (DiD) framework. For each PGPR strain and physiological trait, the drought-induced change is compared with the corresponding drought-induced change in the uninoculated control within the same replication set. Trait effects are then aligned, standardized, and aggregated, while bootstrap resampling quantifies ranking uncertainty. Importantly, composite integration is not assumed a priori to outperform every single physiological trait; this proposition is tested directly.
We therefore developed and cross-seasonally evaluated a Multitrait Physiological Drought Mitigation Index (PDMI) for strawberry. The specific objectives were to (i) test the joint inoculation variant × moisture response across nine nonredundant physiological traits; (ii) derive a transparent equal-weight PDMI using 2021 as the development season; (iii) compare PDMI ranking stability directly with each individual physiological trait; (iv) evaluate multivariate strain structure using block-restricted permutation tests; (v) assess ranking reproducibility and yield association in an independent 2022 holdout; and (vi) test sensitivity to biologically predefined trait directions and an alternative PCA ideal-point composite. We expected the multivariate profile to contain coordinated treatment information but did not assume that PDMI would be a direct predictor of yield or a universally superior classifier.

2. Materials and Methods

2.1. Study Overview

The present study introduces and validates the Plant Drought Mitigation Index (PDMI), a composite physiological index designed to quantify strain-specific drought mitigation capacity of plant growth-promoting rhizobacteria (PGPR) in strawberry (Fragaria × ananassa Duch., cv. ‘Polka’) [30,31]. The PDMI integrates multiple physiological drought-response traits within a unified statistical framework based on replication-level estimation of drought-specific effects, cross-trait standardization, weighted aggregation, and bootstrap-based stability analysis.
The index was constructed using data derived from controlled greenhouse experiments conducted during two consecutive growing seasons (2021–2022). The experimental structure followed a balanced two-factor design including moisture regime and inoculation variant. In total, the dataset comprised 240 observations distributed across 2 years, 6 inoculation variants (5 PGPR strains and a non-inoculated control), and 2 substrate moisture conditions.

2.2. Experimental Design, Replication, and Analysis Population

The full experiment was balanced across 2 years, 6 experimental variants, 2 moisture regimes, and 10 replication identifiers per year, yielding 120 plant-level observations per season and 240 observations overall. Each replication identifier occurred once in every variant × moisture combination. For the present reanalysis, these identifiers were treated as complete matched replication sets, permitting within-replication DiD contrasts. The full design, therefore, comprised 20 matched sets, each containing 12 observations. The primary PGPR analysis included C0 and the 4 bacterial strains, corresponding to 100 observations per year, 200 observations overall, 40 PGPR DiD profiles per year, and 80 profiles overall.
Plants were grown individually in black round PVC pots (approximately 19 cm diameter; 3.0 dm3) containing a peat-based substrate mixed with perlite at 15:1 (v/v), with substrate pH approximately 6.2 [30]. The substrate was enriched with the fertilizer mixtures described in the original experimental report [30]. Plants were maintained under greenhouse conditions with natural daylight and reported temperatures of approximately 17–20 °C.

2.3. Moisture Regimes and Operational Definition of Drought

Substrate water potential was monitored with contact soil tensiometers. Optimal moisture conditions (OMCs) were maintained between −15 and −10 kPa, whereas drought moisture conditions (DMCs) were maintained between −45 and −40 kPa [30,31]. Irrigation was applied individually to restore the corresponding target range. The water-deficit treatment was introduced after plant establishment and maintained according to the original experimental protocol.

2.4. PGPR Strains, Comparator Treatment, and Inoculation

The evaluated PGPR strains represented rhizobacterial taxa previously characterized for plant growth-promoting potential, including representatives of the genera Bacillus, Pantoea, Azotobacter, and Pseudomonas. Inoculation was performed directly into the substrate near the root system at a target density of approximately 10−7 CFU g−1 substrate.
Microbial abundance was quantified by serial dilution plating and expressed as colony-forming units per gram of substrate. When included in modelling procedures, abundance values were log-transformed as
M = log 10 ( C F U )
to stabilize variance and ensure linear-scale interpretability.
Detailed information on the taxonomic designation, strain identifier, source institution, isolation origin, and experimentally validated plant growth-promoting phenotypes of each bacterial strain used in the PDMI analysis is provided in Appendix A, Table A1.

2.5. Physiological and Agronomic Measurements

The primary PDMI comprised nine nonredundant physiological traits: total chlorophyll content, carotenoid content, net photosynthetic rate (A), stomatal conductance (gs), water-use efficiency (A/E), maximum quantum efficiency of PSII (Fv/Fm), performance index (PI), electrolyte leakage (EL), and relative water content (RWC). Water saturation deficit (WSD) was retained as a descriptive variable but excluded from the composite because WSD = 100 − RWC in the dataset and would duplicate the water-status dimension. Fruit yield (g plant−1) was analysed separately as an external agronomic outcome.
Chlorophyll fluorescence: Fluorescence was measured with a Handy PEA fluorometer (Hansatech Instruments, King’s Lynn, Pentney, UK) using three 650 nm LEDs, a saturating actinic-light intensity up to approximately 3500 μmol photons m−2 s−1, and a 1 s measurement pulse, following 20 min dark adaptation with 4 mm leaf clips [30]. Minimum fluorescence (F0), maximum fluorescence (Fm), variable fluorescence (Fᵥ = Fm − F0), Fᵥ/Fm, and PI were recorded. Measurements were reported 18 weeks after inoculation in the original experiment [30].
Photosynthetic pigments: Total chlorophyll and carotenoids were quantified from leaf material and expressed in the units recorded in the source dataset.
Gas exchange: Net photosynthetic rate (A), transpiration rate (E), stomatal conductance (gs), and intercellular CO2 concentration (Ci) were measured on fully expanded leaves. Water-use efficiency was calculated as A/E; the dataset-level audit confirmed agreement between the recorded A/E values and this ratio within rounding error:
WUE = A/E.
Electrolyte leakage: EL was expressed as the percentage of total electrolyte release from leaf tissue, with lower values biologically interpreted as greater membrane stability:
EL (%) = (C1/C2) × 100.
Leaf water status: RWC and WSD were recorded as percentages. The source data obeyed RWC + WSD = 100 exactly. The standard definitions are
RWC (%) = [(FW − DW)/(TW − DW)] × 100,
WSD (%) = 100 – RWC.
Yield: Fruit yield was calculated as the cumulative mass of harvested fruit per plant (g plant−1) within each growing season and was reserved for external validation rather than included in PDMI construction.

2.6. Replication-Level Estimation of Drought Mitigation Effects

For each trait T, PGPR strain s, replication r, and year y, a drought-specific strain effect was calculated as a difference-in-differences contrast:
Δ(s,r,y,T) = [DMC(s,r,y,T) − OMC(s,r,y,T)] − [DMC(C0,r,y,T) − OMC(C0,r,y,T)].
The first bracket represents the within-strain response to drought, whereas the second represents the corresponding within-replication response of the uninoculated control. The contrast therefore isolates the additional strain-associated response under drought and removes matched-replication baseline shifts. With 4 PGPR strains, 10 replication sets, and 2 seasons, this procedure yielded 80 profiles per trait and 720 trait-specific DiD effects across the 9 primary traits.

2.7. Training-Year Harmonization of Trait Directionality

All orientation and scaling parameters were estimated exclusively from the 2021 development season. For each trait, the orientation coefficient was defined as the sign of the Pearson correlation between its replication-level physiological DiD effect and the corresponding yield DiD effect in 2021. Multiplication by this coefficient aligned larger values with the direction associated with more favourable training-year yield response. The coefficients were then locked and applied unchanged to both 2021 and 2022. Aligned DiD effects were standardized using the 2021 mean and standard deviation for each trait:
z(s,r,y,T) = [o(T)Δ(s,r,y,T) − μ(T,2021)]/σ(T,2021).
Because several training-year correlations were weak, and two inferred directions (Fv/Fm and RWC) differed from conventional biological expectations, a fully a priori biological-direction specification was evaluated as a sensitivity analysis. Under that specification, chlorophyll, carotenoids, A, gs, A/E, Fv/Fm, PI, and RWC were oriented positively, whereas EL was oriented negatively.

2.8. Definition of the Primary PDMI

For each replication profile, PDMI was calculated as the equal-weight arithmetic mean of the nine aligned standardized trait effects:
PDMI(s,r,y) = (1/9) Σ z(s,r,y,T).
Equal weighting was selected a priori for transparency and to avoid allowing unstable trait-specific p-values or sample-dependent loadings to dominate the primary score. Strain-level PDMI values were obtained by averaging replication-level scores within a season. The 2021 ranking was treated as the development ranking; the 2022 ranking was a leakage-free holdout evaluation using unchanged orientation and scaling parameters.

2.9. Block-Adjusted Multivariate Inference

A MANOVA was fitted to the nine raw physiological traits using inoculation variant, substrate moisture regime, their interaction, and a year-by-replication block identifier as a fixed nuisance effect. The primary analysis included C0 and the four PGPR strains (n = 200 plant-level observations). Pillai’s trace was selected as the principal omnibus statistic because of its relative robustness to covariance heterogeneity; Wilks’ lambda, Hotelling–Lawley trace, and Roy’s greatest root were retained as complementary statistics.

2.10. Block-Restricted PERMANOVA and PERMDISP

Strain structure was evaluated in replication-level aligned standardized DiD space using Euclidean distances. PERMANOVA used 9999 permutations of strain labels restricted within each year × replication set, preserving the matched design. PERMDISP, also with 9999 restricted permutations, assessed whether an apparent group effect could be attributed to unequal within-strain multivariate dispersion. The pseudo-F statistic, R2, and permutation p-value were reported.

2.11. Bootstrap Ranking Stability and Direct Comparison with Single Traits

Ranking uncertainty was quantified with 5000 block-bootstrap iterations. Replication identifiers were sampled with replacement within 2021, and repeated draws were preserved. In each iteration, orientation, scaling, strain means, PDMI values, and ranks were recalculated. For every strain, we report the bootstrap mean, percentile 95% interval, median rank, rank interquartile range (IQR), P(rank 1), and P(top 2). The same bootstrap and ranking procedures were applied separately to each of the nine individual physiological traits. This direct comparison tested whether PDMI provided more stable strain identification than the best single trait; the best single trait was selected exploratorily as the trait with the largest P(rank 1).

2.12. Cross-Season Reproducibility and Holdout Yield Validation

The 2022 strain ranking was computed with the 2021 orientation and scaling parameters fixed. Rank reproducibility was summarized using Spearman’s ρ and whether the top-ranked strain was identical in both seasons. For agronomic validation, replication-level 2022 yield DiD effects were regressed on 2022 PDMI values. Inference included heteroskedasticity-consistent HC3 standard errors, standard errors clustered by replication set, and a within-block permutation test with 9999 permutations. R2, slope, p-values, Spearman correlation, and RMSE were reported.

2.13. Sensitivity Analyses

Two sensitivity analyses were performed. First, the primary yield-derived orientation was compared with the a priori biological-direction specification. Second, a PCA ideal-point composite was calculated from the 2021 aligned standardized DiD profiles. Components were retained until cumulative explained variance exceeded 80%, and strains were ranked by explained-variance-weighted Euclidean distance from a favourable ideal point in retained component space. Agreement with equal-weight PDMI was assessed using Spearman’s ρ, Kendall’s τ, top-rank consistency, and mean absolute rank change.

2.14. Statistical Software, Data Audit, and Reproducibility

All analyses were implemented in Python 3.13 with deterministic random seeds. The pipeline performed a strict design audit before analysis: all 240 full-dataset cells were unique; all 20 replication sets were complete; no required values were missing; and derived-variable checks confirmed RWC + WSD = 100, Fv = Fm − F0, Fv/Fm = (Fm − F0)/Fm, total chlorophyll = chlorophyll a + chlorophyll b, and A/E within rounding tolerance. The code exported analysis-ready data, complete MANOVA output, permutation results, bootstrap distributions, sensitivity tables, and figures in PNG, PDF, and SVG formats.

3. Results

3.1. Data Integrity and Analysis Population

The audit confirmed a complete balanced dataset with 240 plant-level observations, 20 complete matched replication sets, 10 sets per year, and 12 observations per set. No duplicate design cells or missing required values were detected. CMg was identified as a non-bacterial KMgSO4 treatment rather than a PGPR strain. After excluding CMg from the primary PGPR ranking, the inferential population comprised 200 observations and produced 80 replication-level DiD profiles: 40 in 2021 and 40 in 2022.

3.2. Joint Multivariate Response to Inoculation and Moisture

Block-adjusted MANOVA showed a significant inoculation variant × moisture interaction across the joint nine-trait physiological profile. Pillai’s trace was 0.5329, corresponding to F(36,664) = 2.8349 and p = 1.50 × 10⁻⁷. All complementary multivariate statistics supported the same conclusion (Table 1). Thus, the multivariate physiological response depended on the combination of inoculation variant and moisture regime after accounting for matched replication sets.

3.3. Multivariate Strain Structure in DiD Space

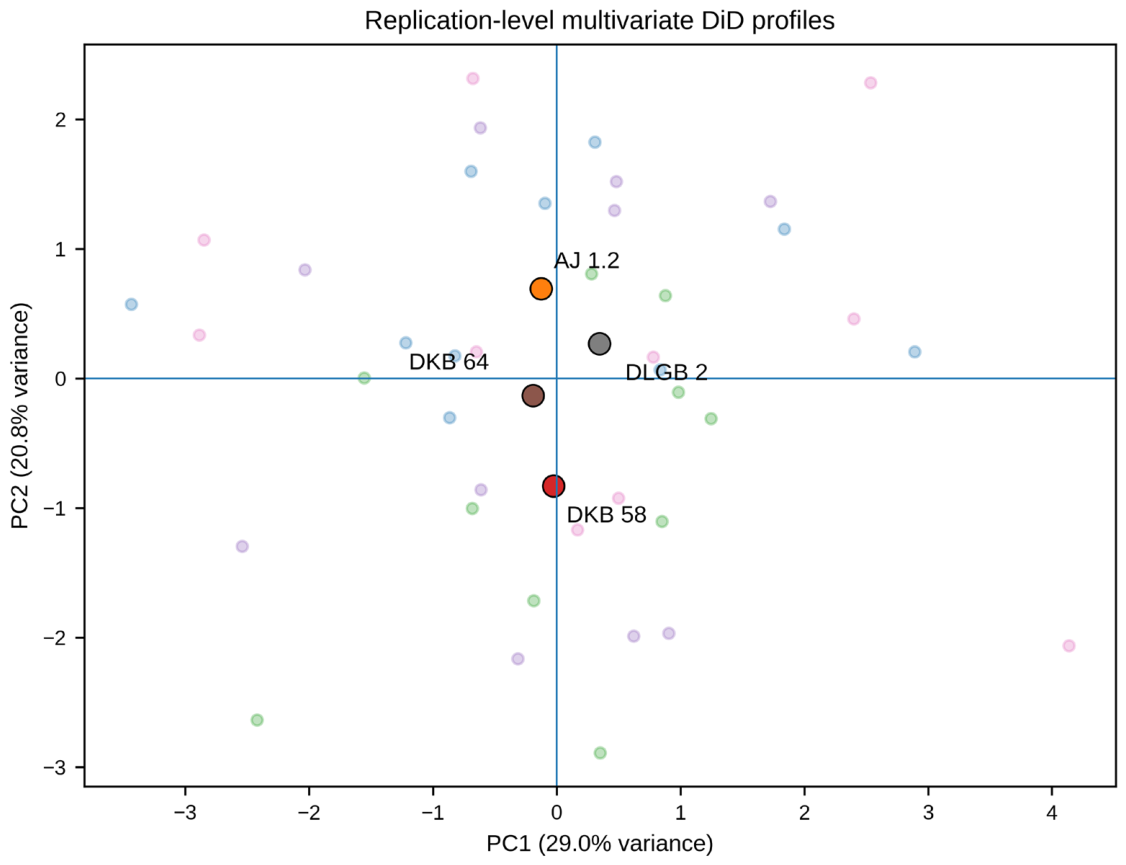
Block-restricted PERMANOVA detected a statistically significant but small strain effect in replication-level DiD space (pseudo-F = 0.9954, R2 = 0.0378, p = 0.0289; Table 2,Figure 1). PERMDISP was nonsignificant (F = 0.9363, p = 0.2731), indicating that the result was not attributable to detectable differences in within-strain dispersion. The effect size shows that strain identity explained only 3.8% of multivariate variation; the finding therefore supports weak group structure rather than clear classification boundaries.
Figure 1. Descriptive PCA ordination of the 80 replication-level aligned standardized DiD profiles for the four PGPR strains. The first two axes visualize overlap and heterogeneity; confirmatory inference is provided by the block-restricted PERMANOVA and PERMDISP tests.
Agronomy 16 01623 g001

3.4. Development-Year PDMI Ranking

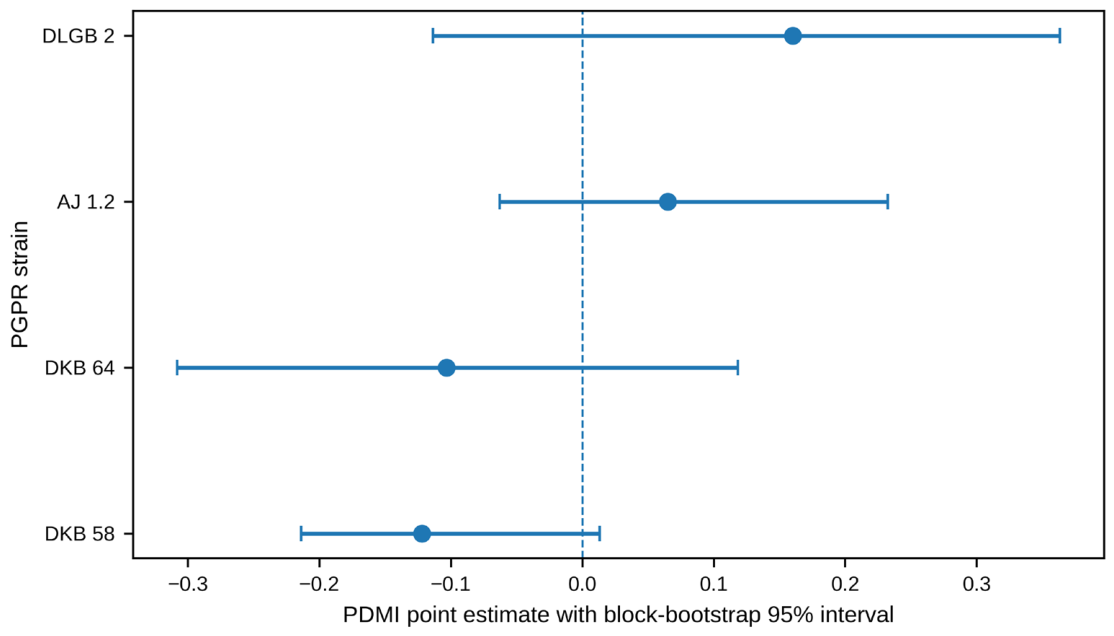
In the 2021 development season, DLGB 2 had the highest equal-weight PDMI (0.160), followed by AJ 1.2 (0.065), DKB 64 (−0.103), and DKB 58 (−0.122; Table 3). These standardized values are relative to the analysed four-strain panel and should not be interpreted as absolute biological thresholds.

3.5. Bootstrap Stability of the PDMI Ranking

Across 5000 block-bootstrap iterations, DLGB 2 remained the most frequently top-ranked strain. Its bootstrap mean was 0.141, the 95% percentile interval ranged from −0.114 to 0.363, P(rank 1) was 0.6628, and P(top 2) was 0.8832. AJ 1.2 had P(rank 1) = 0.2570 and P(top 2) = 0.9102. The intervals for all four strains included zero, except under the separate biological-direction sensitivity specification. Thus, the primary bootstrap supports prioritization of DLGB 2 but not definitive superiority (Table 4, Figure 2 and Figure 3).
Table 4. Block-bootstrap summary for the 2021 PDMI ranking (5000 iterations).
RankStrainPoint PDMI95% CI Low95% CI HighP(rank 1)P(top 2)Median RankRank IQR
1DLGB 20.160−0.1140.3630.6630.8831.01.0
2AJ 1.20.065−0.0630.2320.2570.9102.01.0
3DKB 64−0.103−0.3080.1180.0750.1613.01.0
4DKB 58−0.122−0.2140.0130.0050.0463.01.0
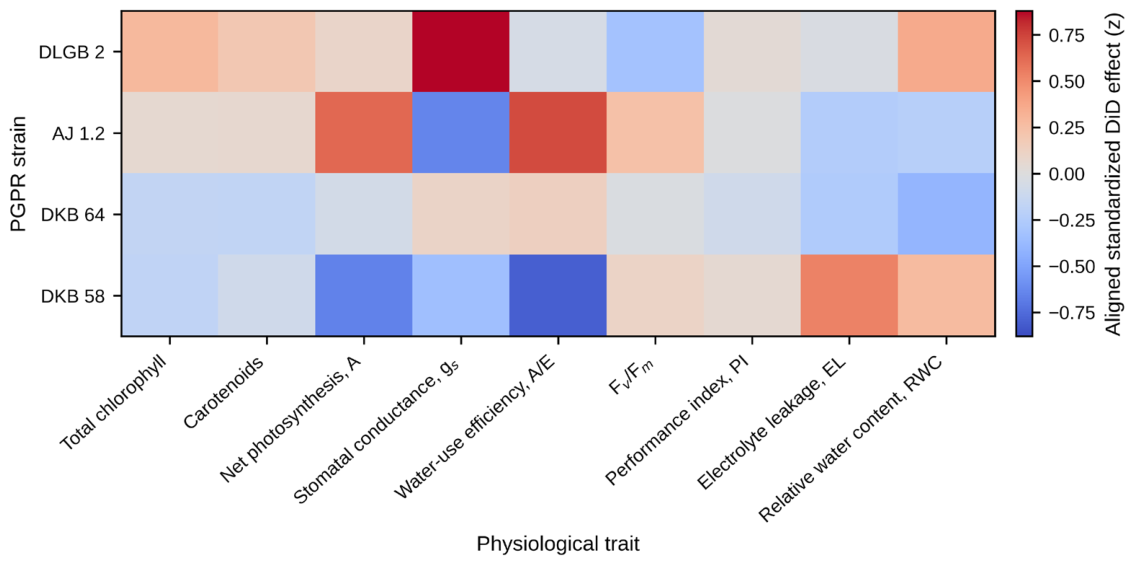
Figure 2. Heatmap of strain-level direction-aligned standardized DiD effects in the 2021 development season. Positive values indicate more favourable responses according to the locked training-year direction. WSD was excluded because it is deterministically related to RWC.
Agronomy 16 01623 g002
Figure 3. Year 2021 PDMI point estimates with block-bootstrap 95% percentile intervals. The vertical zero line emphasizes the uncertainty of strain-level standardized scores.
Agronomy 16 01623 g003

3.6. PDMI Versus Individual Physiological Traits

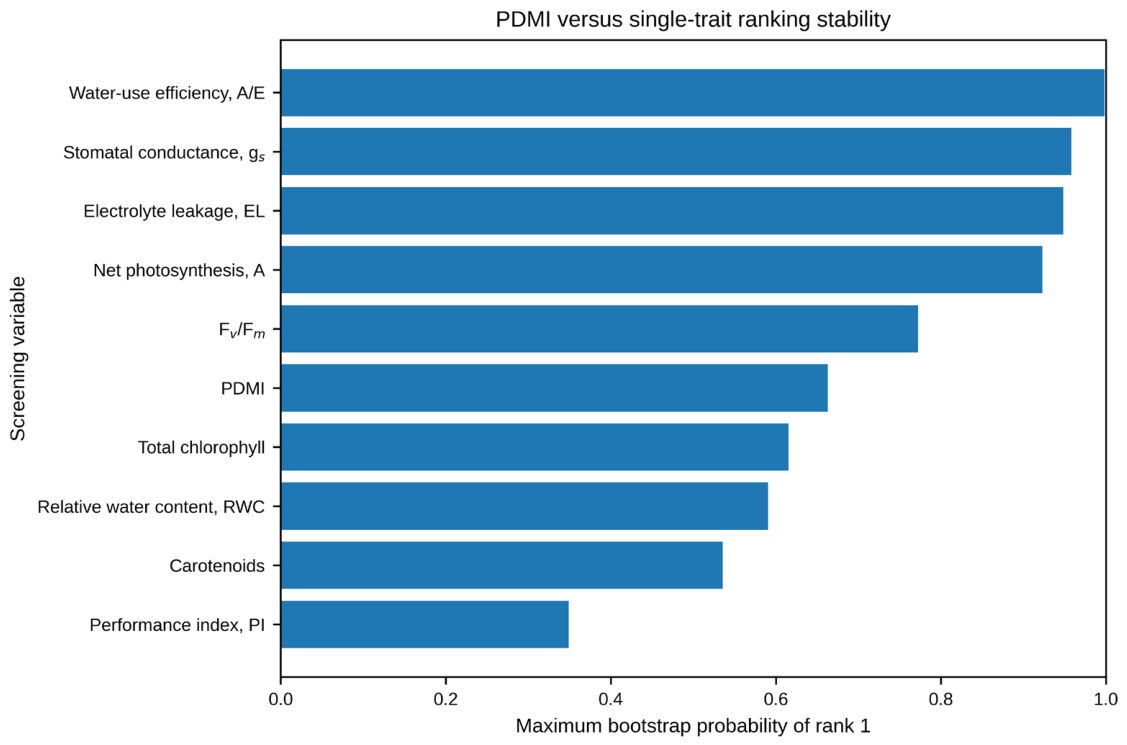
The direct bootstrap comparison showed that PDMI did not outperform the most stable individual measurements. Water-use efficiency identified AJ 1.2 with P(rank 1) = 0.9984 and P(top 2) = 1.000. Stomatal conductance identified DLGB 2 with P(rank 1) = 0.9584, electrolyte leakage identified DKB 58 with P(rank 1) = 0.9484, and net photosynthesis identified AJ 1.2 with P(rank 1) = 0.9230. PDMI ranked below these traits in within-season top-rank stability, with P(rank 1) = 0.6628 (Table 5, Figure 4). This result refutes a universal superiority claim for the composite, and instead, defines its value as cross-domain integration.
Figure 4. Probability of rank 1 for PDMI and the nine individual physiological traits under the same 2021 block-bootstrap procedure.
Agronomy 16 01623 g004

3.7. Independent 2022 Ranking and Cross-Season Reproducibility

When the 2021 orientation and scaling parameters were applied unchanged to 2022, AJ 1.2 ranked first (−0.004), followed by DLGB 2 (−0.051), DKB 58 (−0.096), and DKB 64 (−0.181; Table 6). The cross-season Spearman correlation was ρ = 0.60 (p = 0.40), and the top-ranked strain changed from DLGB 2 to AJ 1.2. The direction of association was moderately positive, but the four-strain sample did not support a claim of statistically established rank reproducibility.

3.8. Holdout Validation Against Yield Mitigation

In the 2022 holdout, PDMI explained 4.58% of replication-level variation in yield mitigation (R2 = 0.0458). The slope was 67.24 g plant−1 per PDMI unit. It was nonsignificant with HC3 inference (p = 0.284), replication-block-clustered inference (p = 0.127), and within-block permutation inference (p = 0.341). Spearman’s ρ was 0.208 (p = 0.198), and RMSE was 123.02 g plant−1. These results do not support use of PDMI as a standalone yield predictor (Table 7).
Table 7. Leakage-free 2022 validation of replication-level PDMI against yield DiD effects.
ProfilesBlocksR2SlopeHC3 pClustered pPermutation pSpearman rhoRMSE
40100.045867.240.2840.1270.3410.208123.02

3.9. Trait-Direction and PCA Sensitivity

Training-year correlations used to infer orientation were weak for most traits. Total chlorophyll, carotenoids, stomatal conductance, and water-use efficiency had absolute correlations below 0.09. The inferred directions for Fv/Fm and RWC were negative, contrary to the a priori biological specification; the negative RWC association was statistically detectable in 2021 (r = −0.485, p = 0.0015). Nevertheless, replacing all training-derived signs with a priori biological directions produced exactly the same strain order (Spearman’s ρ = 1.00; Kendall’s τ = 1.00), with DLGB 2 ranked first. Under the biological-direction bootstrap, DLGB 2 had P(rank 1) = 0.677 and P(top 2) = 0.937, and its 95% interval was 0.004 to 0.277. Thus, the ranking was insensitive to the orientation rule even though interpretation of individual trait contributions changed (Table 8).
Table 8. Training-year orientation diagnostics and bootstrap sign stability.
Traitr with Yield DiDpYield SignBiological SignP (Observed Sign)Bootstrap r LowBootstrap r High
Total chlorophyll0.0460.7762++0.602−0.2550.386
Carotenoids0.0140.9307++0.545−0.2250.377
Net photosynthesis, A0.1740.2836++0.822−0.1910.484
Stomatal conductance, gs0.0400.8052++0.574−0.3530.420
Water-use efficiency, A/E0.0850.6037++0.679−0.2670.333
Fv/Fm−0.0870.5947-+0.665−0.3280.309
Performance index, PI0.1700.2944++0.904−0.0950.396
Electrolyte leakage, EL−0.0740.6482--0.646−0.3980.285
Relative water content, RWC−0.4850.0015-+0.998−0.712−0.175
The PCA ideal-point sensitivity retained five components explaining 86.39% of 2021 variance. Its ranking was identical to equal-weight PDMI for all four strains: DLGB 2, AJ 1.2, DKB 64, and DKB 58. Spearman’s ρ and Kendall’s τ were both 1.00, top-rank consistency was complete, and mean absolute rank change was 0.

3.10. Descriptive Comparison with Yield-Based Drought Indices

Classical yield-based indices were recalculated using only the four PGPR strains in the 2021 development season. PDMI was negatively associated with STI, GMP, MP, and TOL (ρ = −0.80 for each; p = 0.20), while correlations with SSI and YSI were small (ρ = 0.20 and −0.20, respectively; p = 0.80) (Table 9.) With only four strain-level observations, these p-values are coarse, and the comparison is descriptive. The opposing rankings reinforce that PDMI and yield-based indices represent different response dimensions.
Table 9. Spearman correlations between 2021 PDMI and classical yield-based drought indices (n = 4 PGPR strains).
Yield-Based IndexSpearman ρp-Value
STI−0.800.20
GMP−0.800.20
MP−0.800.20
SSI0.200.80
TOL−0.800.20
YSI−0.200.80

4. Discussion

4.1. A Detectable Joint Response Does Not Imply Strong Strain Classification

The primary multivariate result is that the physiological response to moisture depended on inoculation variant. Block-adjusted MANOVA identified a clear omnibus interaction, and the block-restricted PERMANOVA detected strain structure in replication-level DiD profiles. These findings support the premise that several modest, partially coordinated changes across photosynthetic pigments, gas exchange, PSII function, membrane integrity, and water status can collectively contain treatment information. However, the PERMANOVA effect size was only 3.8%, and the PCA visualization showed substantial overlap. The appropriate interpretation is, therefore, that multivariate structure was detectable, not that the four strains formed sharply separated physiological classes.
The DiD formulation is the principal methodological distinction of PDMI. Classical yield indices summarize stress and non-stress performance, while ideotype and multivariate selection methods combine several variables [26,27,28,29,32,33,34,35,36,37]. PDMI first subtracts the drought response of the matched uninoculated control from the drought response of each inoculated plant. This reduces the risk that general growth promotion under optimal moisture is mislabelled as drought-specific mitigation. The subsequent equal-weight aggregation is intentionally simple and auditable.

4.2. The Composite Did Not Outperform the Best Single Trait

Several single traits produced more stable 2021 top-strain identification than PDMI. In particular, water-use efficiency, stomatal conductance, electrolyte leakage, and net photosynthesis each had P(rank 1) above 0.92, compared with 0.663 for PDMI. Therefore, the data do not support presenting PDMI as a universally superior screening classifier.
This negative comparison does not make the composite redundant. A single trait can provide highly stable discrimination in a specific season while representing only one physiological domain and potentially selecting a different strain. Water-use efficiency favoured AJ 1.2, stomatal conductance favoured DLGB 2, and electrolyte leakage favoured DKB 58. PDMI makes these competing dimensions explicit and returns a transparent compromise ranking. Its value is integrative description and candidate prioritization across complementary processes, not guaranteed maximization of rank stability.

4.3. Ranking Uncertainty and Cross-Season Transferability

DLGB 2 was the leading 2021 candidate under equal-weight PDMI, the a priori biological-direction sensitivity, and the PCA ideal-point composite. Nevertheless, the primary bootstrap interval crossed zero and P(rank 1) was 66.3%, indicating appreciable uncertainty. In 2022, AJ 1.2 ranked first, and DLGB 2 ranked second. The cross-season correlation of 0.60 suggests some preservation of ordering, but with only four strains, it was not statistically informative. Consequently, the present data support prioritizing DLGB 2 and AJ 1.2 for further work rather than declaring a stable universal winner.
The change in leading strain is biologically plausible, because physiological mitigation can depend on season-specific environmental conditions, plant developmental timing, microbial establishment, and the relative expression of different stress-response pathways. It also illustrates why single-season bootstrap stability and cross-season reproducibility answer different questions: the former quantifies sampling uncertainty within one season, whereas the latter evaluates transfer of the learned orientation and scale to a new season.

4.4. Physiological Description Versus Agronomic Prediction

Leakage-free holdout analysis did not show a significant relationship between PDMI and yield mitigation under any of the three inferential approaches. Physiological stress buffering and final fruit yield are related but non-equivalent outcomes. Yield integrates flower and fruit development, source-sink allocation, phenology, cumulative stress exposure, and additional environmental conditions not represented by the nine physiological measurements [3,4,38]. The lack of yield prediction therefore limits the domain of PDMI but does not invalidate its use as a descriptive physiological summary.
The descriptive comparison with STI, GMP, MP, SSI, TOL, and YSI reached the same conclusion. PDMI rankings differed from yield-based rankings because the index was designed to summarize drought-specific physiological responses relative to control, not absolute productivity. A practical screening programme should, therefore, report PDMI alongside yield and, where relevant, a small set of highly discriminative single traits rather than replace agronomic outcomes with the composite.

4.5. Trait Orientation and Interpretability

The original data-driven orientation rule was retained to preserve the planned development/holdout structure, but its limitations are now explicit. Most 2021 trait-yield correlations were weak, and the inferred negative direction for RWC conflicts with the conventional interpretation that higher tissue hydration is favourable under drought. This result may reflect season-specific covariance, timing differences between physiological measurement and cumulative yield, or sampling variability rather than an inverted biological role of RWC. Importantly, the strain ranking was identical under fully a priori biological directions, which supports robustness of candidate ordering but not of trait-level mechanistic interpretation.
Future versions of PDMI should preregister trait directions from physiology rather than estimate them from yield, or they should use a hybrid rule in which biologically established directions are fixed and only ambiguous traits are evaluated through sensitivity analysis. This would improve interpretability and reduce the risk that a training-year association defines a counterintuitive “favourable” direction.

4.6. Strengths and Limitations

The study has four principal strengths. First, replication-level DiD contrasts explicitly isolate drought-specific responses relative to an uninoculated control. Second, all orientation and scaling parameters were learned in 2021 and applied unchanged to 2022. Third, block-preserving bootstrap and permutation procedures respect the matched design. Fourth, the analysis directly tests rather than assumes superiority over individual traits and reports negative yield validation transparently.
Several limitations constrain generalization. Only four PGPR strains were eligible for the corrected primary ranking after the non-bacterial CMg comparator was removed. The experiment covered two greenhouse seasons at one site and one strawberry cultivar. Strain-level correlation tests therefore had extremely low resolution. The multivariate effect was statistically detectable but small, and the leading strain changed between years. Finally, the primary orientation rule relied on training-year yield correlations, several of which were weak or biologically counterintuitive. Broader multi-environment studies with prespecified directions, external laboratories, and agronomic endpoints are required before transferable decision thresholds can be proposed.


5. Conclusions

The corrected PDMI framework provides a transparent method for summarizing drought-specific multivariate physiological responses to four PGPR strains in strawberry. After exclusion of the non-bacterial CMg comparator, block-adjusted MANOVA and block-restricted PERMANOVA showed a significant but small multivariate strain signal. DLGB 2 ranked first in the 2021 development season and remained first under biological-direction and PCA ideal-point sensitivity analyses, but bootstrap uncertainty was substantial, and AJ 1.2 ranked first in the independent 2022 season. The comparison demonstrated that several individual traits, particularly water-use efficiency, produced more stable within-season top-strain identification than PDMI. Moreover, PDMI did not predict holdout yield mitigation. The index should, therefore, be used as an integrative physiological descriptor that complements—rather than replaces—informative single traits and agronomic outcomes. Further multi-year, multi-environment validation is required before PDMI can support general decision thresholds or claims of superior screening performance.

Author Contributions

Conceptualization, T.M., A.K., G.M. and M.M.; methodology, T.M., A.K., G.M. and M.M.; software, T.M.; validation, T.M.; formal analysis, T.M. and A.K.; investigation, T.M. and A.K.; resources, T.M., A.K., G.M., M.M. and D.P.; data curation, T.M.; writing—original draft preparation, T.M., A.K., G.M.,M.M. and D.P.; writing—review and editing, T.M. and A.K.; visualization, T.M.; project administration, T.M.; funding acquisition, T.M., A.K., G.M. and M.M. All authors have read and agreed to the published version of the manuscript.

Funding

This research was co-financed by the Minister of Science (Poland) under the “Regional Excellence Initiative” Program for 2024–2027 (RID/SP/0045/2024/01) for University of Szczecin, Institute of Marine and Environmental Sciences.

Data Availability Statement

The data presented in this study are openly available in a public repository: https://github.com/TyMill/PDMI-article (accessed on 24 June 2026).

Conflicts of Interest

The authors declare no conflicts of interest.

Appendix A

Table A1. Taxonomic designation, source institution, and isolation origin of the bacterial strains included in the strain collection.
AbbreviationFull Taxonomic Designation and Strain IdentifierSource InstitutionIsolation OriginReference
DLGB 2Bacillus sp. strain DLGB 2Department of Microbiology and Rhizosphere, National Institute of Horticultural Research, Skierniewice, PolandSoil-derived bacterial isolate[30,31]
DLGB 3Bacillus sp. strain DLGB 3Department of Microbiology and Rhizosphere, National Institute of Horticultural Research, Skierniewice, PolandSoil-derived bacterial isolate[30,31]
DKB 26Bacillus sp. strain DKB 26Department of Microbiology and Rhizosphere, National Institute of Horticultural Research, Skierniewice, PolandSoil-derived bacterial isolate[30,31]
DKB 58Bacillus sp. strain DKB 58Department of Microbiology and Rhizosphere, National Institute of Horticultural Research, Skierniewice, PolandSoil-derived bacterial isolate[30,31]
DKB 84Bacillus sp. strain DKB 84Department of Microbiology and Rhizosphere, National Institute of Horticultural Research, Skierniewice, PolandSoil-derived bacterial isolate[30,31]
DKB 63Pantoea sp. strain DKB 63Department of Microbiology and Rhizosphere, National Institute of Horticultural Research, Skierniewice, PolandSoil-derived bacterial isolate[30,31]
DKB 64Pantoea sp. strain DKB 64Department of Microbiology and Rhizosphere, National Institute of Horticultural Research, Skierniewice, PolandSoil-derived bacterial isolate[30,31]
DKB 65Pantoea sp. strain DKB 65Department of Microbiology and Rhizosphere, National Institute of Horticultural Research, Skierniewice, PolandSoil-derived bacterial isolate[30,31]
DKB 68Pantoea sp. strain DKB 68Department of Microbiology and Rhizosphere, National Institute of Horticultural Research, Skierniewice, PolandSoil-derived bacterial isolate[30,31]
DKB 70Pantoea sp. strain DKB 70Department of Microbiology and Rhizosphere, National Institute of Horticultural Research, Skierniewice, PolandSoil-derived bacterial isolate[30,31]
AJ 1.1Azotobacter sp. strain AJ 1.1Institute of Marine and Environmental Sciences, University of Szczecin, PolandSoil-derived bacterial isolate[30,31]
PJ 1.2Pseudomonas sp. strain PJ 1.2Institute of Marine and Environmental Sciences, University of Szczecin, PolandSoil-derived bacterial isolate[30,31]
Notes: All strains were isolated from soil. Strains marked as originating from the National Institute of Horticultural Research were obtained from the Department of Microbiology and Rhizosphere in Skierniewice, Poland. Strains AJ 1.1 and PJ 1.2 were obtained from the Institute of Marine and Environmental Sciences, University of Szczecin, Poland.

References

  1. Lamaoui, M.; Jemo, M.; Datla, R.; Bekkaoui, F. Heat and drought stresses in crops and approaches for their mitigation. Front. Chem. 2018, 6, 26. [Google Scholar] [CrossRef] [Scilit] [PubMed]
  2. Zandalinas, S.I.; Mittler, R.; Balfagón, D.; Arbona, V.; Gómez-Cadenas, A. Plant adaptations to drought and high temperatures. Physiol. Plant. 2018, 162, 2–12. [Google Scholar] [CrossRef] [Scilit] [PubMed]
  3. Chaves, M.M.; Flexas, J.; Pinheiro, C. Photosynthesis under drought and salt stress: Regulation mechanisms from whole plant to cell. Ann. Bot. 2009, 103, 551–560. [Google Scholar] [CrossRef] [Scilit] [PubMed]
  4. Farooq, M.; Wahid, A.; Kobayashi, N.; Fujita, D.; Basra, S.M.A. Plant drought stress: Effects, mechanisms and management. Agron. Sustain. Dev. 2009, 29, 185–212. [Google Scholar] [CrossRef] [Scilit]
  5. Klamkowski, K.; Treder, W. Response to drought stress of three strawberry cultivars grown under greenhouse conditions. J. Fruit Ornam. Plant Res. 2008, 16, 179–188. [Google Scholar]
  6. Grant, O.M.; Johnson, A.W.; Davies, M.J.; James, C.M.; Simpson, D.W. Physiological and morphological diversity of cultivated strawberry (Fragaria × ananassa) in response to water deficit. Environ. Exp. Bot. 2010, 68, 264–272. [Google Scholar] [CrossRef] [Scilit]
  7. Chaves, M.M.; Maroco, J.P.; Pereira, J.S. Understanding plant responses to drought—From genes to the whole plant. Funct. Plant Biol. 2003, 30, 239–264. [Google Scholar] [CrossRef] [Scilit] [PubMed]
  8. Morade, A.S.; Sharma, R.M.; Dubey, A.K.; Sathee, L.; Kumar, S.; Kadam, D.M.; Awasthi, O.P.; Kumar, A.; Yadav, D. Phenotyping drought stress tolerance in citrus rootstocks using high-throughput imaging and physio-biochemical techniques. BMC Plant Biol. 2025, 25, 753. [Google Scholar] [CrossRef] [Scilit] [PubMed]
  9. Wilkinson, S.; Davies, W.J. Drought, ozone, ABA and ethylene: New insights from cell to plant to community. Plant Cell Environ. 2010, 33, 510–525. [Google Scholar] [CrossRef] [Scilit] [PubMed]
  10. Baker, N.R. Chlorophyll fluorescence: A probe of photosynthesis in vivo. Annu. Rev. Plant Biol. 2008, 59, 89–113. [Google Scholar] [CrossRef] [Scilit] [PubMed]
  11. Maxwell, K.; Johnson, G.N. Chlorophyll fluorescence—A practical guide. J. Exp. Bot. 2000, 51, 659–668. [Google Scholar] [CrossRef] [Scilit] [PubMed]
  12. Kalaji, H.M.; Jajoo, A.; Oukarroum, A.; Brestić, M.; Živčák, M.; Samborska, I.A.; Cetner, M.D.; Łukasik, I.; Goltsev, V.; Ladle, R.J. Chlorophyll a fluorescence as a tool to monitor physiological status of plants under abiotic stress conditions. Acta Physiol. Plant. 2016, 38, 102. [Google Scholar] [CrossRef] [Scilit]
  13. Mittler, R. Oxidative stress, antioxidants and stress tolerance. Trends Plant Sci. 2002, 7, 405–410. [Google Scholar] [CrossRef] [Scilit] [PubMed]
  14. Gill, S.S.; Tuteja, N. Reactive oxygen species and antioxidant machinery in abiotic stress tolerance in crop plants. Plant Physiol. Biochem. 2010, 48, 909–930. [Google Scholar] [CrossRef] [Scilit] [PubMed]
  15. Bajji, M.; Kinet, J.-M.; Lutts, S. The use of the electrolyte leakage method for assessing cell membrane stability as a water stress tolerance test in durum wheat. Plant Growth Regul. 2002, 36, 61–70. [Google Scholar] [CrossRef] [Scilit]
  16. Vessey, J.K. Plant growth promoting rhizobacteria as biofertilizers. Plant Soil 2003, 255, 571–586. [Google Scholar] [CrossRef] [Scilit]
  17. Glick, B.R. Plant growth-promoting bacteria: Mechanisms and applications. Scientifica 2012, 2012, 963401. [Google Scholar] [CrossRef] [Scilit] [PubMed]
  18. Backer, R.; Rokem, J.S.; Ilangumaran, G.; Lamont, J.; Praslickova, D.; Ricci, E.; Subramanian, S.; Smith, D.L. Plant growth-promoting rhizobacteria: Context, mechanisms of action, and roadmap to commercialization of biostimulants for sustainable agriculture. Front. Plant Sci. 2018, 9, 1473. [Google Scholar] [CrossRef] [Scilit] [PubMed]
  19. Glick, B.R. Bacteria with ACC deaminase can promote plant growth and help to feed the world. Microbiol. Res. 2014, 169, 30–39. [Google Scholar] [CrossRef] [Scilit] [PubMed]
  20. Vurukonda, S.S.K.P.; Vardharajula, S.; Shrivastava, M.; SkZ, A. Enhancement of drought stress tolerance in crops by PGPR. Microbiol. Res. 2016, 184, 13–24. [Google Scholar] [CrossRef] [Scilit] [PubMed]
  21. Nadeem, S.M.; Ahmad, M.; Zahir, Z.A.; Javaid, A.; Ashraf, M. The role of mycorrhizae and plant growth promoting rhizobacteria in improving crop productivity under stress. Biotechnol. Adv. 2014, 32, 429–448. [Google Scholar] [CrossRef] [Scilit] [PubMed]
  22. Karlidag, H.; Yildirim, E.; Turan, M.; Pehluvan, M.; Donmez, F. Plant growth-promoting rhizobacteria mitigate deleterious effects of salt stress on strawberry plants (Fragaria × ananassa). HortScience 2013, 48, 563–567. [Google Scholar] [CrossRef] [Scilit]
  23. Raturi, P.; Rai, R.; Sharma, A.K.; Singh, A.K. Effects of PGPR and AMF on morpho-physiological parameters of strawberry under moisture levels. Int. J. Environ. Clim. Change 2023, 13, 2707–2713. [Google Scholar] [CrossRef] [Scilit]
  24. Li, J.; Abbas, K.; Wang, L.; Gong, B.; Hou, S.; Wang, W.; Dai, B.; Xia, H.; Wu, X.; Lü, G.; et al. Drought resistance index screening and evaluation of lettuce under water deficit conditions. Front. Plant Sci. 2023, 14, 1228084. [Google Scholar] [CrossRef] [Scilit] [PubMed]
  25. Munns, R.; Tester, M. Mechanisms of salinity tolerance. Annu. Rev. Plant Biol. 2008, 59, 651–681. [Google Scholar] [CrossRef] [Scilit] [PubMed]
  26. Inostroza, L.; Acuña, H.; Méndez, J. Multi-physiological-trait selection indices to identify Lotus tenuis genotypes with high dry matter production under drought conditions. Crop Pasture Sci. 2015, 66, 90–99. [Google Scholar] [CrossRef] [Scilit]
  27. Al-Ashkar, I. Multivariate analysis techniques and tolerance indices for detecting bread wheat genotypes of drought tolerance. Diversity 2024, 16, 489. [Google Scholar] [CrossRef] [Scilit]
  28. Mohi-Ud-Din, M.; Hossain, M.A.; Rohman, M.; Uddin, M.N.; Haque, M.S.; Tahery, M.H.; Hasanuzzaman, M. Multi-trait index-based selection of drought tolerant wheat. Plants 2025, 14, 35. [Google Scholar] [CrossRef] [Scilit] [PubMed]
  29. Kushwah, A.; Singh, I.; Singh, G.; Bindra, S.; Vij, S.; Johal, N.; Kaur, K.; Bhatia, D.; Singh, S. Evaluation of yield-based selection indices for drought tolerance involving recombinant inbred line population derived from chickpea. Plant Genet. Resour. 2024, 22, 117–124. [Google Scholar] [CrossRef] [Scilit]
  30. Paliwoda, D.; Mikiciuk, G.; Mikiciuk, M.; Kisiel, A.; Sas-Paszt, L.; Miller, T. Effects of Rhizosphere Bacteria on Strawberry Plants (Fragaria × ananassa Duch.) under Water Deficit. Int. J. Mol. Sci. 2022, 23, 10449. [Google Scholar] [CrossRef] [Scilit] [PubMed]
  31. Paliwoda, D.; Mikiciuk, G.; Chudecka, J.; Tomaszewicz, T.; Miller, T.; Mikiciuk, M.; Kisiel, A.; Sas-Paszt, L. Effects of Inoculation with Plant Growth-Promoting Rhizobacteria on Chemical Composition of the Substrate and Nutrient Content in Strawberry Plants Growing in Different Water Conditions. Agriculture 2024, 14, 46. [Google Scholar] [CrossRef] [Scilit]
  32. Fernandez, G.C.J. Effective selection criteria for assessing plant stress tolerance. In Proceedings of the International Symposium on Adaptation of Vegetables and Other Food Crops in Temperature and Water Stress; Asian Vegetable Research and Development Center: Taipei, Taiwan, 1992. [Google Scholar]
  33. Fischer, R.A.; Maurer, R. Drought resistance in spring wheat cultivars. I. Grain yield responses. Aust. J. Agric. Res. 1978, 29, 897–912. [Google Scholar] [CrossRef] [Scilit]
  34. Rosielle, A.A.; Hamblin, J. Theoretical aspects of selection for yield in stress and non-stress environments. Crop Sci. 1981, 21, 943–946. [Google Scholar] [CrossRef] [Scilit]
  35. Olivoto, T.; Lúcio, A.D.C.; da Silva, J.A.G.; Marchioro, V.S.; de Souza, V.Q.; Jost, E. Mean performance and stability in multi-environment trials I. Agron. J. 2019, 111, 2949–2960. [Google Scholar] [CrossRef] [Scilit]
  36. Pour-Aboughadareh, A.; Sanjani, S.; Nikkhah-Chamanabad, H.; Mehrvar, M.R.; Asadi, A.; Amini, A. Identification of salt-tolerant barley genotypes using multiple-traits index. Bull. Natl. Res. Cent. 2021, 45, 117. [Google Scholar] [CrossRef] [Scilit]
  37. Rocha, J.R.A.S.; Machado, J.C.; Carneiro, P.C.S. Multitrait index based on factor analysis and ideotype-design. GCB Bioenergy 2018, 10, 52–60. [Google Scholar] [CrossRef] [Scilit]
  38. Passioura, J.B. Phenotyping for drought tolerance in grain crops. Funct. Plant Biol. 2012, 39, 851–859. [Google Scholar] [CrossRef] [Scilit] [PubMed]
Table 1. Block-adjusted multivariate test of the inoculation variant × moisture interaction across nine physiological traits.
StatisticValueNumerator dfDenominator dfFp-Value
Wilks’ lambda0.546036612.62.9818<0.001
Pillai’s trace0.532936664.02.8349<0.001
Hotelling–Lawley trace0.695236431.13.1235<0.001
Roy’s greatest root0.44659166.08.2346<0.001
Table 2. Block-restricted permutation tests of strain structure in replication-level DiD space.
Test Statistic R2p-Value Permutations Restriction n
PERMANOVA0.99540.03780.02899999within year × replication block80
PERMDISP0.9363-0.27319999within year × replication block80
Table 3. Equal-weight PDMI ranking in the 2021 development season.
RankPGPR StrainPDMI
1DLGB 20.160
2AJ 1.20.065
3DKB 64−0.103
4DKB 58−0.122
Table 5. Bootstrap top-strain identification for PDMI and each individual physiological trait.
MetricTop StrainP(rank 1)P(top 2)Median RankRank IQR
Water-use efficiency, A/EAJ 1.20.9981.0001.00.0
Stomatal conductance, gsDLGB 20.9580.9991.00.0
Electrolyte leakage, ELDKB 580.9481.0001.00.0
Net photosynthesis, AAJ 1.20.9230.9971.00.0
Fv/FmAJ 1.20.7720.9741.00.0
PDMIDLGB 20.6630.8831.01.0
Total chlorophyllDLGB 20.6150.7421.02.0
Relative water content, RWCDLGB 20.5900.9641.01.0
CarotenoidsDLGB 20.5360.7301.02.0
Performance index, PIDKB 580.3490.5932.02.0
Note: The “best single trait” was selected exploratorily by the largest P(rank 1); this comparison describes ranking stability, not biological comprehensiveness.
Table 6. PDMI ranking in the independent 2022 holdout season using 2021-locked parameters.
RankPGPR StrainPDMI
1AJ 1.2−0.004
2DLGB 2−0.051
3DKB 58−0.096
4DKB 64−0.181
Disclaimer/Publisher’s Note: The statements, opinions and data contained in all publications are solely those of the individual author(s) and contributor(s) and not of MDPI and/or the editor(s). MDPI and/or the editor(s) disclaim responsibility for any injury to people or property resulting from any ideas, methods, instructions or products referred to in the content.