Article

Investigation of Antioxidative Enzymes and Transcriptomic Analysis in Response to Foliar Application of Zinc Oxide Nanoparticles and Salinity Stress in Solanum lycopersicum

1
Festetics Doctoral School, Institute of Agronomy, Georgikon Campus, Hungarian University of Agriculture and Life Sciences, 8360 Keszthely, Hungary
2
Department of Agricultural Biochemistry, Faculty of Agriculture, Cairo University, Giza 12613, Egypt
3
Institute of Agronomy, Georgikon Campus, Hungarian University of Agriculture and Life Sciences, 8360 Keszthely, Hungary
4
Heavy Metals Department, Central Laboratory for the Analysis of Pesticides and Heavy Metals in Food (QCAP), Dokki, Cairo 12311, Egypt
*
Authors to whom correspondence should be addressed.
Agronomy 2025, 15(7), 1715; https://doi.org/10.3390/agronomy15071715
Submission received: 7 June 2025 / Revised: 9 July 2025 / Accepted: 14 July 2025 / Published: 16 July 2025

Abstract

Farmers commonly throw away tomato leaves when they harvest tomatoes, although they are a good source of vital biomolecules. ZnO nanoparticles (ZnO NPs) enhance plant growth by regulating abiotic stress and scavenging reactive oxygen species. In the current article, the activities of five antioxidant enzymes—glutathione reductase (GR), peroxidase (POX), glutathione-S-transferase (GST), superoxide dismutase (SOD), and catalase (CAT)—were determined spectrophotometrically to study the interaction between foliar fertilization of ZnO NPs and salt stress in tomato plants. We employed the next-generation sequencing (NGS) technique to investigate the gene expression. It was also used to generate a de novo supertranscript and then determine the sequences modulated by treatments. Differential expression analysis was used to identify increased and reduced gene clusters, and gene enrichment analysis was used to identify over- and under-expressed genes under the treatment. Gene Ontology (GO) was used to identify the functions and regulatory pathways of the differentially expressed genes (DEGs). It was found that ZnO nanoparticles had the capability to overcome the reduction in antioxidant enzyme production levels in the case of the salinity-stressed treatments and enhance the secretion of those enzymes in the non-stressed but sprayed treatments. The ZnO NPs also enhanced the reduction in stress-responsive genes associated with salt stress resistance. The results revealed the impact of ZnO nanoparticles on alleviating the salinity stress reductive effects in antioxidative enzymes and regulating the mechanism by which metabolically relevant genes adaptively respond to salt stress in tomato plants. So, spraying tomato plants (stressed or not) with ZnO NPs is a promising agricultural technique in improving different metabolic pathways that are responsible for plants’ resistance.

1. Introduction

Shifting from fossil-derived chemicals to bio-alternatives has prompted the exploration of economical and renewable biomass sources [1]. Biomass, generated annually from photosynthesis, undergoes natural biodegradation and is utilized for food production [2]. Agricultural and food production waste, including leaves and wastewater, constitutes a valuable source of carbon-based materials that can be recovered and refined using eco-friendly methods [3]. Carbohydrates, comprising 75% of dry biomass, are regarded as the primary feedstock for green chemistry. They are utilized as biopesticides to substitute hazardous insecticides [4]. The nitrogen-containing component of biomass, especially water-soluble protein, is a significant source of amino acids in food, drinks, animal feed, medicines, cosmetics, and agricultural chemicals [5].
For the processing of tomatoes, the leaves are typically considered trash; nonetheless, they represent a valuable source of significant chemicals, including biophenols and sugars [6]. Tomato leaf biomass is a massive amount of raw material that can be used to make natural compounds. Also, farmed solanaceous crops, like tomatoes, have been proven to have a lot of important metabolites [7,8], which aid in protecting against abiotic and biotic challenges. Nevertheless, while making green manufacturing processes, it is important to think about how to separate biomass or rubbish in a way that is safe for the environment.
Nanoparticles (NPs) have been an appealing topic of research because of their unique properties, such as improved versatility, texture, and shaping capabilities, which enhance the toughness of metals and boost the radiative performance of semiconductor components [9]. Leaves can take in nanoparticles and spread them to all plant parts through aerial organs and cellular structures [10]. ZnO NPs improved plant development by controlling photosynthesis and the harmful reactive oxygen species (ROS), such as hydroxide anions [11,12,13]. Another study found that ZnO nanoparticles increased the levels of antioxidative enzyme activity, proteins, chlorophyll, and carotenoids in cotton plants [14]. As a result, it was discovered that ZnO nanoparticles play critical roles in improving the plant growth and providing resistance to various plants that suffer from the negative effects of abiotic stressors, such as salinity stress [15,16].
A revolution in biology has been brought about by next-generation sequencing, sometimes known as NGS. The production of libraries is necessary for next-generation sequencing (NGS), which involves fusing DNA or RNA molecules as fragments with adapters [17]. A technology known as high-throughput complementary DNA sequencing (RNA-Seq) is an efficient method for analyzing the entire transcriptome [18]. This approach indicates the level of transcript expression and the quality of synthesis, demonstrating how the functionality of differentially expressed genes is crucial for elucidating complex biological processes. Pathway analysis is a valuable approach for understanding the interactions between genes in biological pathways. But the scarcity of annotation data, primarily derived from model organisms or frequently studied species, complicates the situation [18,19].
The transcriptome study of tomato leaves that were stressed by salt and treated with ZnO NPs showed that these nanoparticles help the plants tolerate salt better by changing the way genes that control stress responses and nutrient use are expressed. ZnO NPs were shown to increase the activity of genes that are involved in nutrient transport, carbon (C) and nitrogen (N) assimilation, and secondary metabolism. This caused the leaves to have more antioxidants, sugar, and amino acids [19,20,21].
The current study is considered a complementary work to previous studies on tomatoes that were previously planted in greenhouse conditions [11]. The current experiment corroborated the hypothesis that plants possess an immune system that can be activated by external compounds, such as zinc oxide nanoparticles, enabling them to exhibit defensive responses to abiotic stressors like salinity stress and mitigate the detrimental effects of such environmental challenges. The objectives of the present study are to deepen the analysis of how ZnO nanoparticles can mitigate the detrimental effects of salinity stress on antioxidative enzymes and alter the response of metabolism-related genes to salt stress in tomato plants.

2. Materials and Methods

2.1. Experimental Setting

On 29 May 2023, the seeds of the tomato Kecskeméti 549 variety were planted in a plastic seedling tray. On 27 June 2023, after 30 days of sowing (DAS), when the seedlings had 3 to 4 true leaves, they were transferred to pots that were 28 cm wide and 28 cm deep. Salt stress was created by applying a 0.15 M sodium chloride solution to the soil on the 10th day post-transplantation, 40 days after sowing tomato seeds. The application of ZnO nanoparticles as foliar spray was conducted at different dosages, specifically 0.075 or 0.15 g/L, delivered three times at 10-day intervals after salt stress. Leaf tissue samples weighing approximately 40–50 mg were collected from each plant in the six experimental treatments: T1: control (untreated) (distilled water ‘dw’); T2: (dw + ZnO NPs at 0.075 g/L); T3: (dw + ZnO NPs at 0.15 g/L); T4: sodium chloride (0.15 M); T5: (0.15 M NaCl + 0.075 g/L ZnO NPs); T6: (0.15 M NaCl + 0.15 g/L ZnO NPs). The fresh, healthy, and intact leaves were collected for enzymatic determinations on 28 July 2023 and kept at −80 °C until further use. For transcriptomic analysis, four biological replicates of about 100 mg each were collected, immediately immersed in 1 mL RNA later solution, and stored at −20 °C until further processing was performed. All samples were derived from healthy, mature young leaves preserved in 1 mL of RNALater at −22 °C from the time of collection until sequencing. The tomato plants were harvested on 26 September 2023.

2.2. Chemical Synthesis and Characterization of ZnO NPs

Chemical synthesis and characterization of ZnO NPs were performed as described in our previous study [11]. ZnO NPs were synthesized by precipitation from the aqueous solution of sodium hydroxide and zinc nitrate hexahydrate. The white crystals were dissolved in distilled water using ultrasonic vibrations to make varied ZnO NPs concentrations for foliar application.

2.3. Estimation of Enzyme Activities

2.3.1. Extraction of the Enzymes

A total of 0.5 g of leaf tissue (500 mg) was blended in a 50 mM phosphate buffer of monobasic NaH2PO4·2H2O (Mwt: 156) and dibasic Na2HPO4·2H2O (Mwt: 178) (pH 7.0) containing 1 mM polyethyleneglycol (PEG), 1 mM phenylmethylsulfonyl fluoride (PMSF), 8% (w/v) polyvinylpyrolydone (PVP), and 0.01% (v/v) Triton X-100. These mixtures were centrifuged at 11,500 rpm for 10 min at 4 °C, and the resultant supernatant was employed to assess enzyme activity [22].

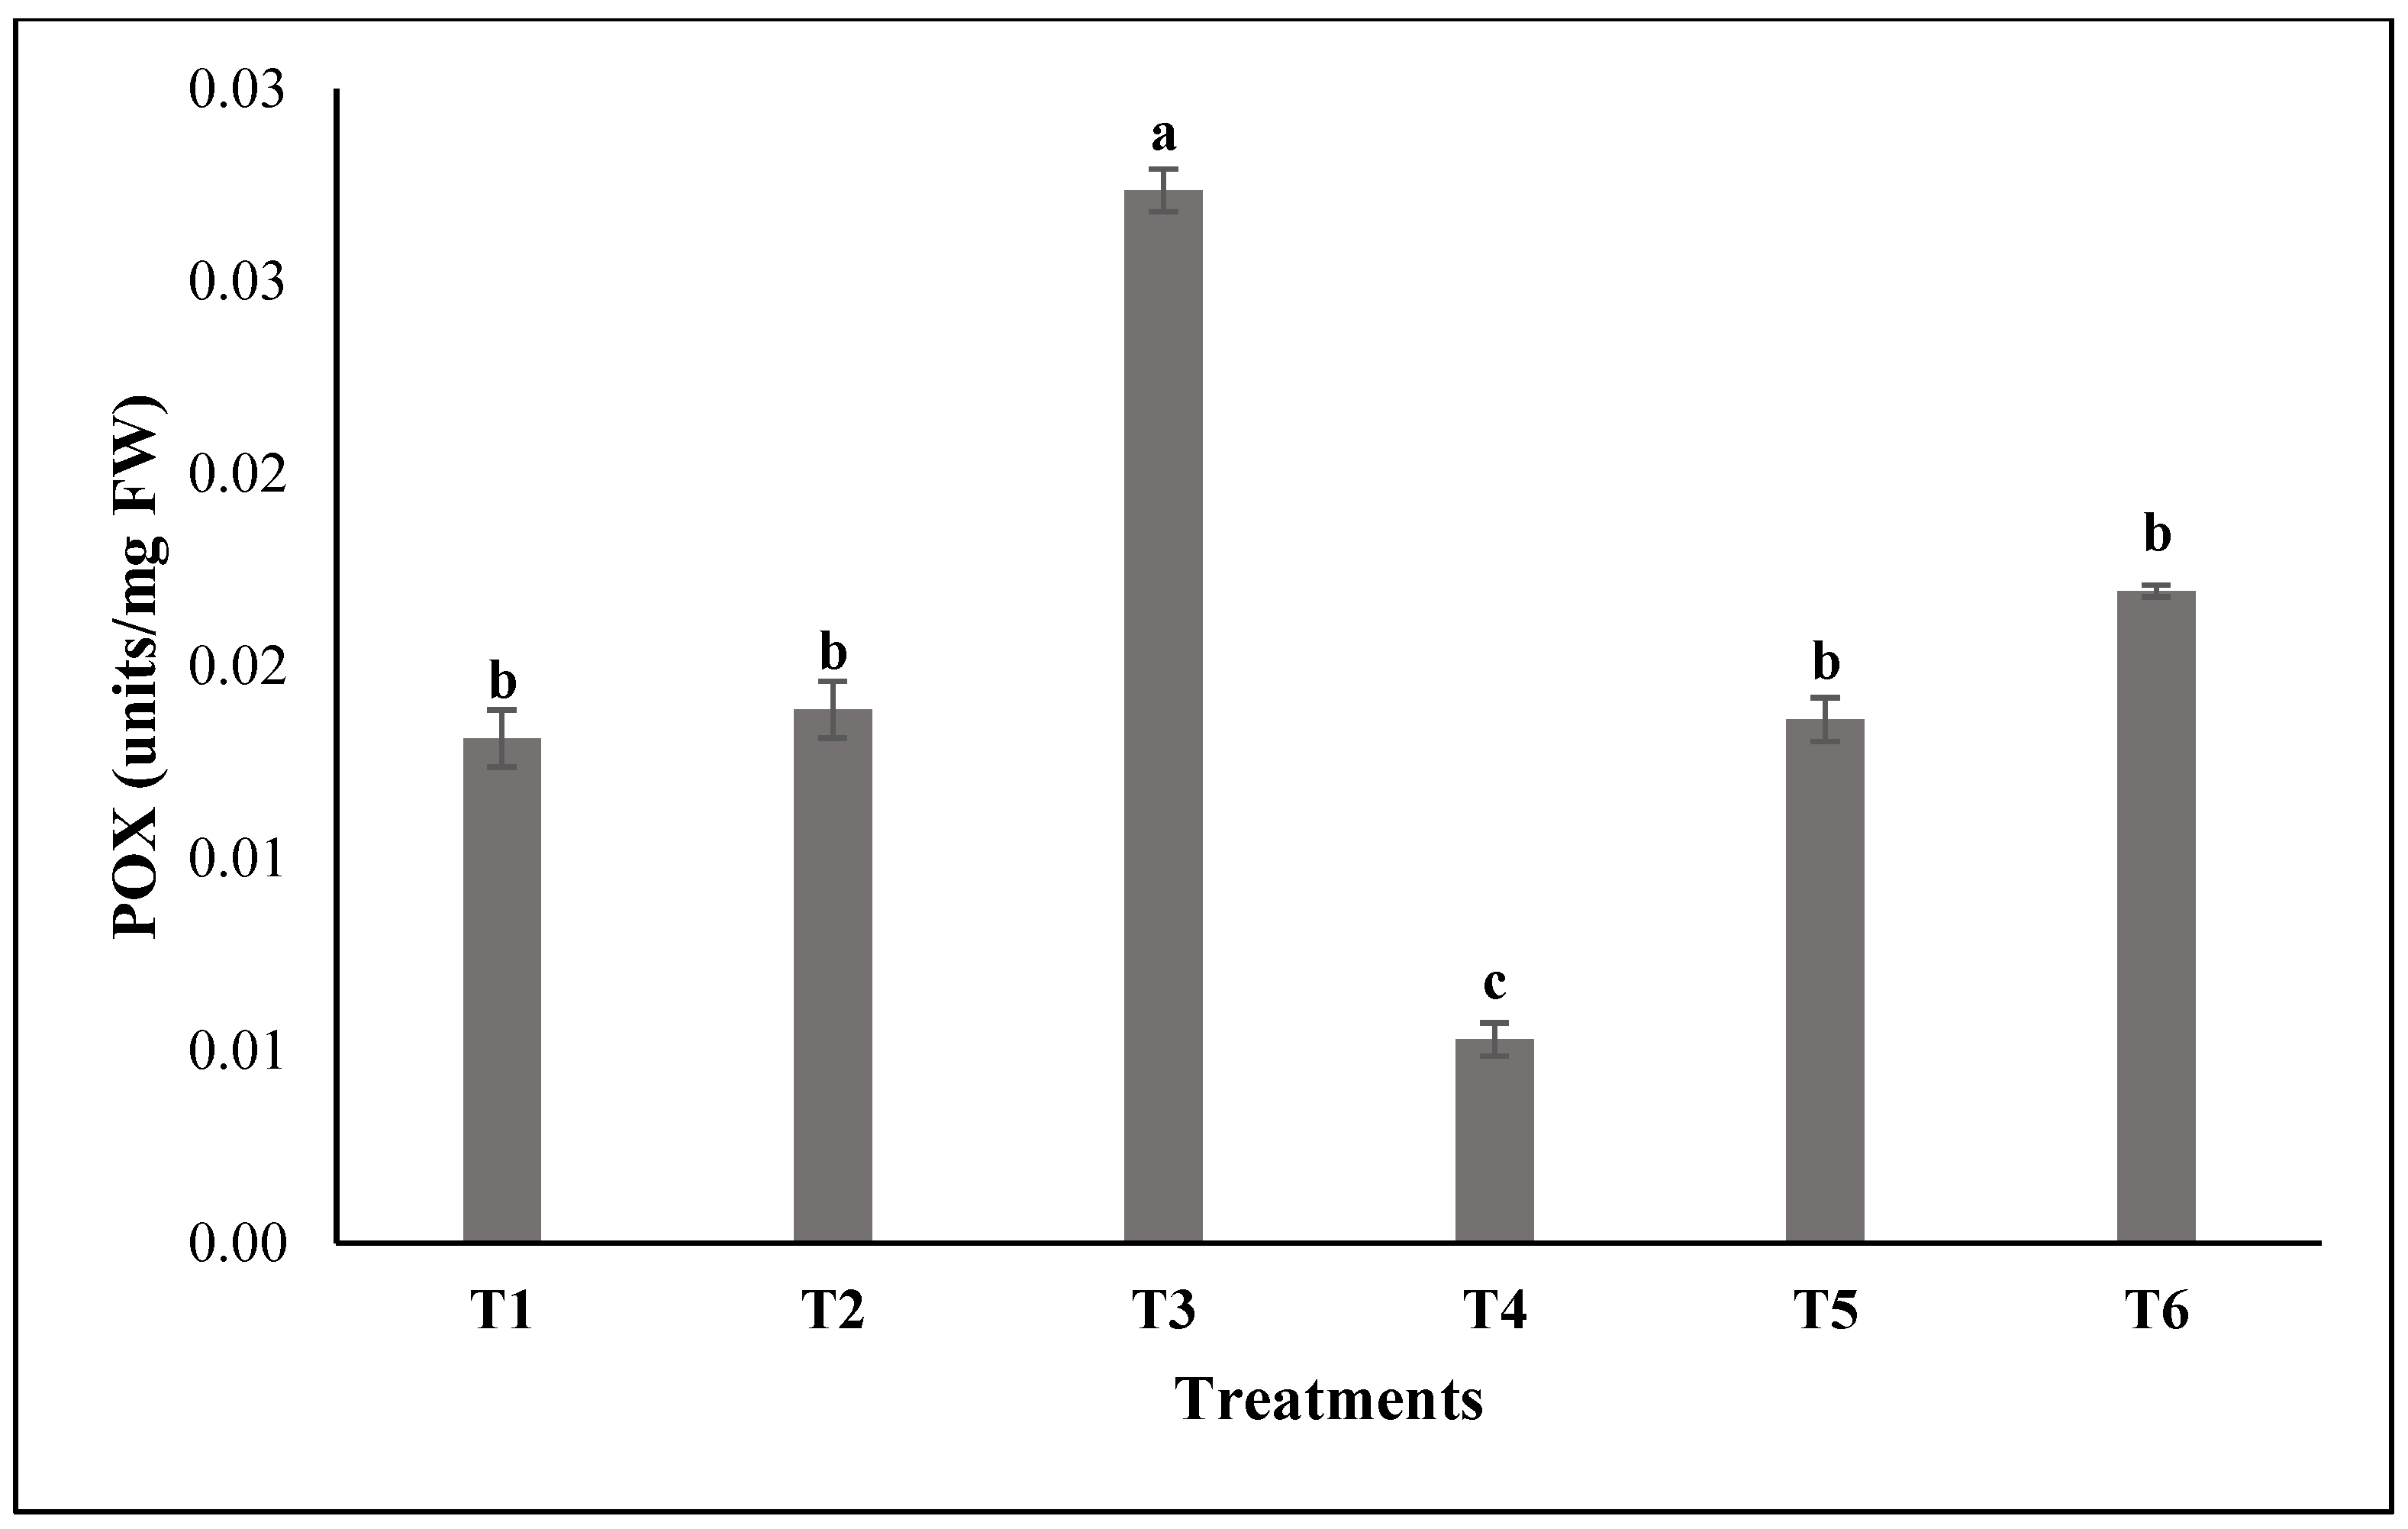
2.3.2. Estimation of Peroxidase Activity

A peroxidase enzyme unit will form 1.0 mg of purpurogallin (C11H8O5) from pyrogallol (C6H3(OH)3) in 20 s at pH 6.0 at 20 °C, equivalent to ~18 µM units per minute at 25 °C. The absorbance’s change was observed every 20 s for 2 min at 420 nm [23]. The reaction involved 0.05 mL of leaf extract + 2 mL of reaction mix. The reacted combination contained 100 mM phosphate buffer of monobasic NaH2PO4·2H2O (Mwt: 156) and dibasic Na2HPO4.2H2O (Mwt: 178) (pH 6), 5% (w/v) pyrrogallol, and 0.5% (v/v) hydrogen peroxide (H2O2).

2.3.3. Estimation of Glutathione Reductase’s Activity

A UV–Visible spectrophotometer (Genesys, PG Instruments Ltd., T 80, Leicestershire, UK) was employed to quantify the rate of nicotinamide adenine dinucleotide phosphate (NADPH) oxidation at 340 nm to assess the activity of glutathione reductase (GR) [22]. A total of 0.1 mL of the extract was reacted with 2 mL of an assay mixture of 0.1 M Tris buffer, 2 mM ethylene diamine tetra acetic acid (EDTA) (Mwt: 292.24), 50 µM NADPH (Mwt: 833), and 0.5 mM oxidized glutathione (GSSG) (Mwt: 612.7). The enzymatic activity was recorded using the extinction coefficient of the ß-NADPH (6.2 mM−1 cm−1) and expressed as unit/mg protein.

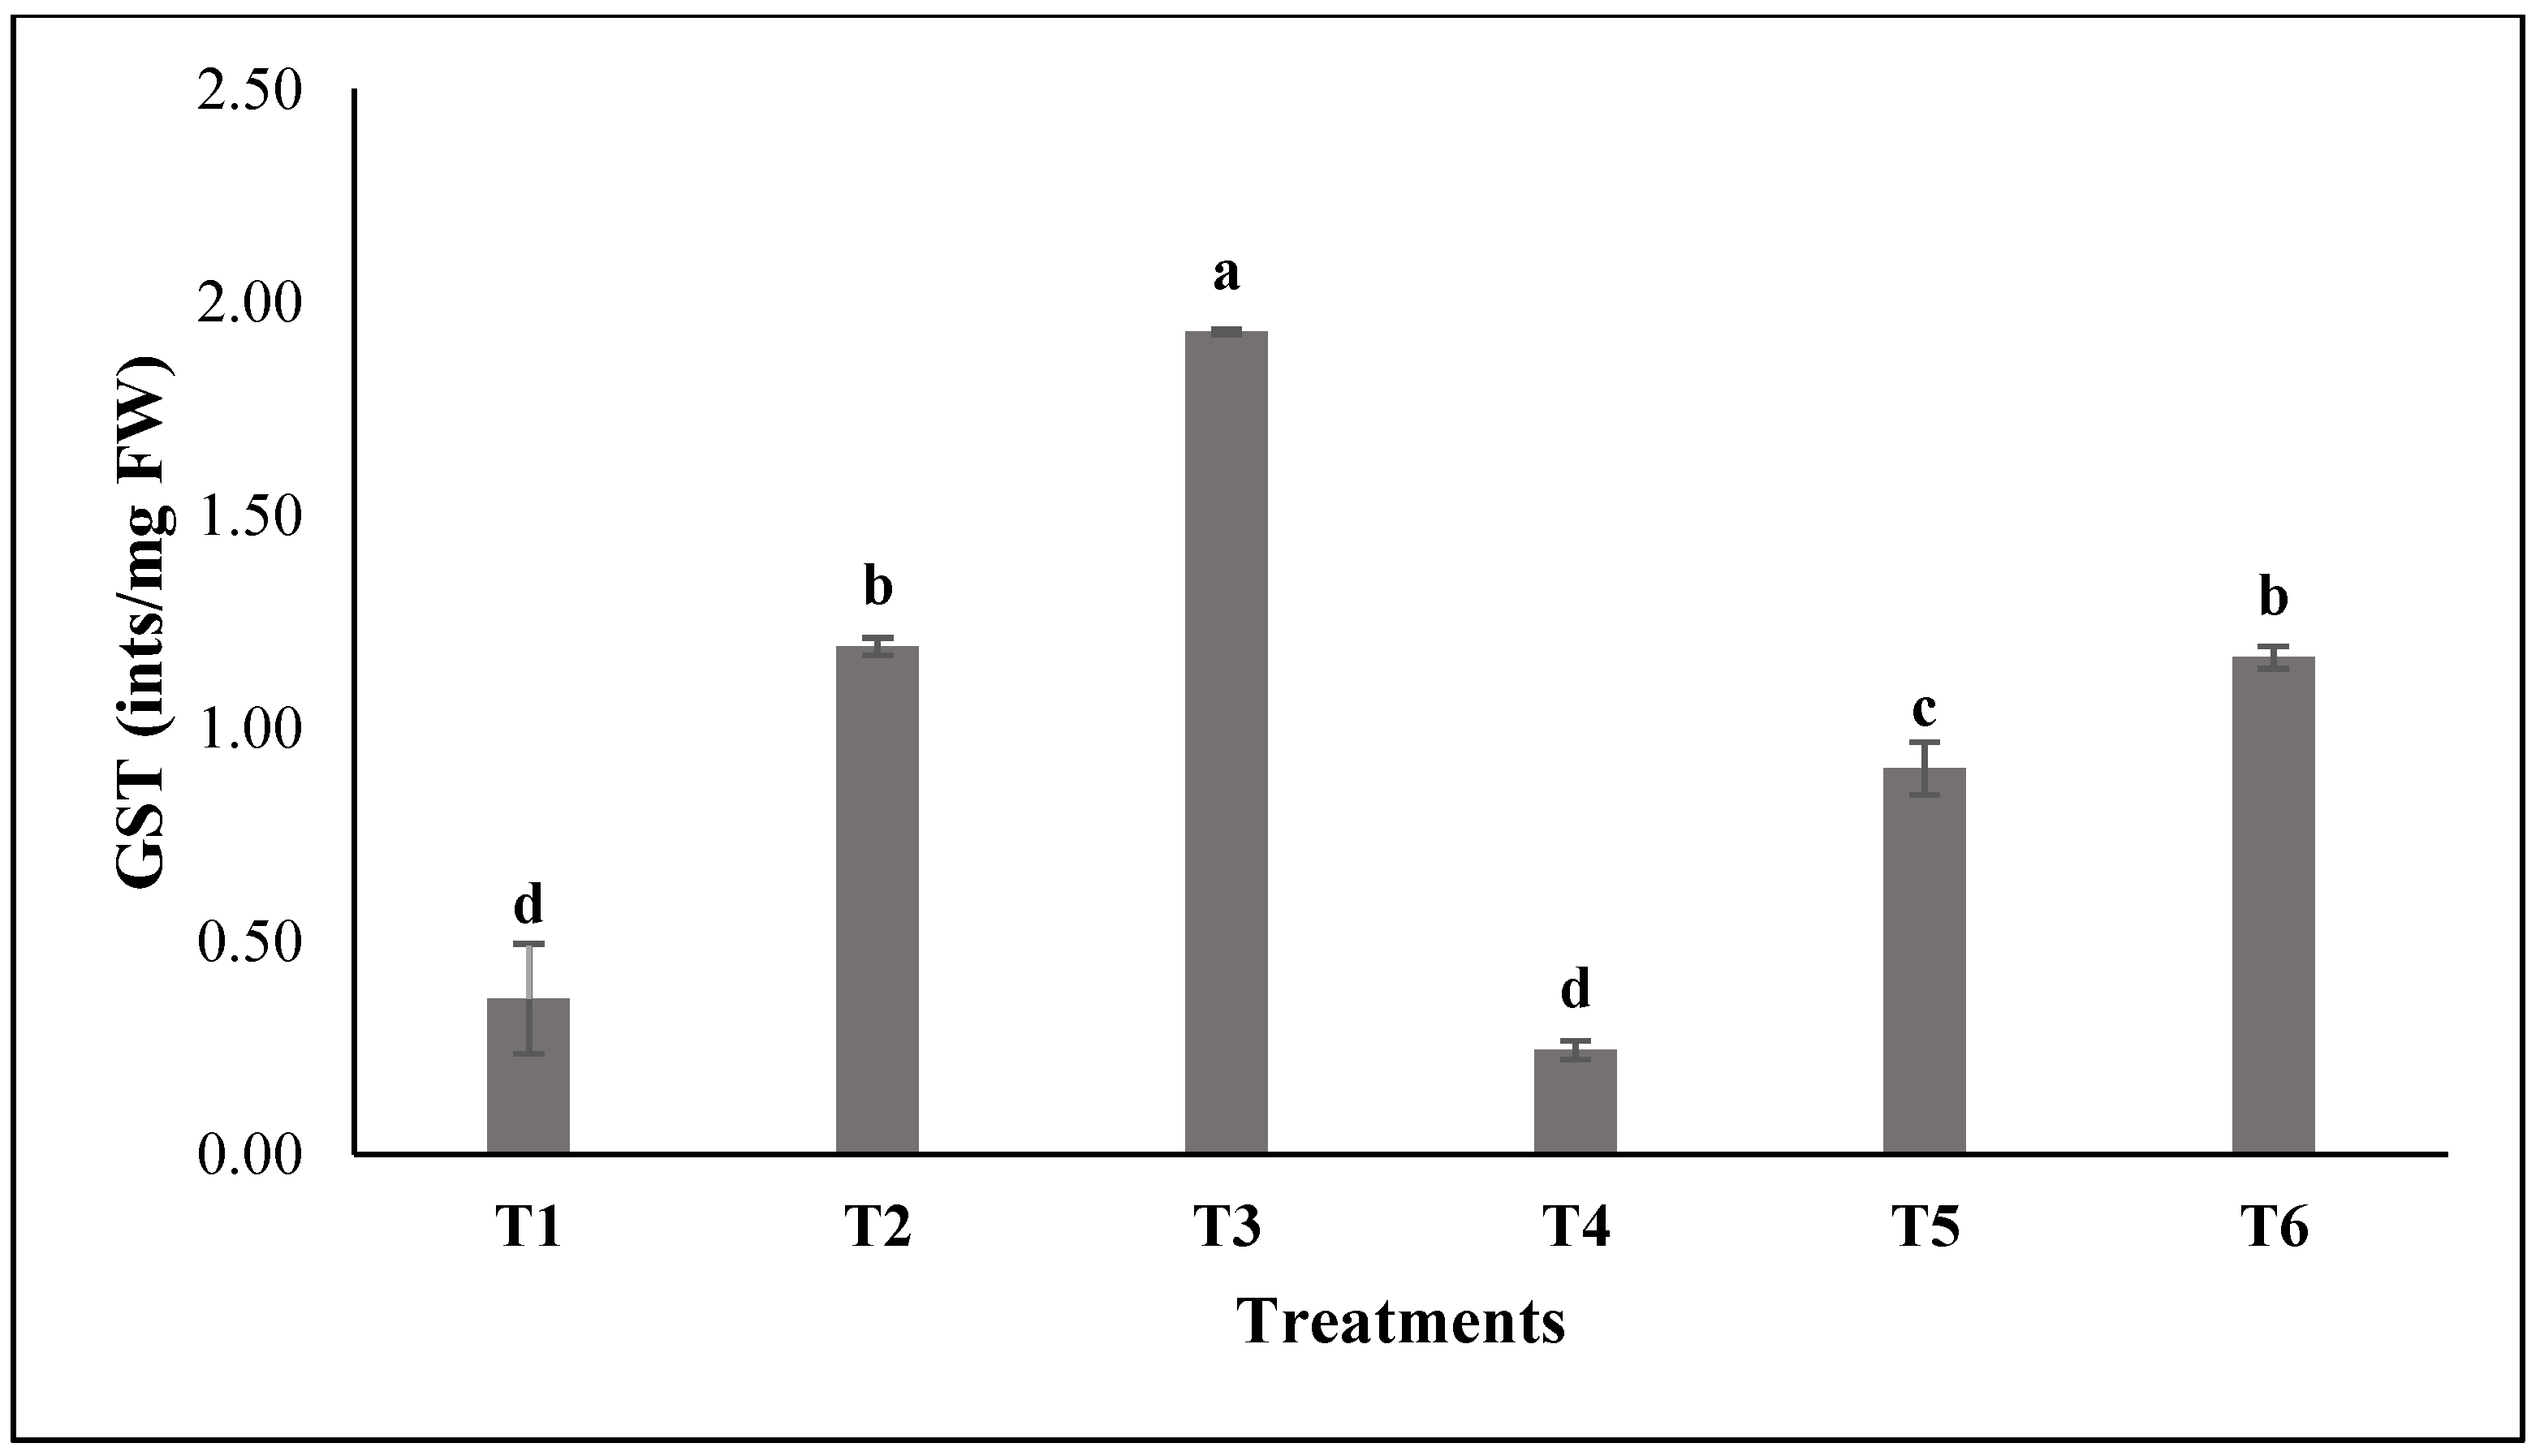
2.3.4. Estimation of Glutathione-S-Transferase’s Activity

The reaction involved 0.05 mL of leaf extract + 1 mL of reaction mix. The reaction mixture consisted of 6 mM reduced glutathione (GSH), 1 mM 1-chloro-2,4-dinitrobenzene (CDNB) (Mwt: 202.55) (Sigma-Aldrich, Darmstadt, Germany), and phosphate buffer of monobasic (KH2PO4) (Mwt: 136.086) and dibasic (K2HPO4) (Mwt: 174.2). The enzyme produced one nmol of conjugated product in 1 min for a total of 1 unit. Genesys (PG Instruments Ltd., T 80, Leicestershire, UK) was employed to spectrophotometrically measure the absorbance, and the extinction coefficient of CDNB (ε340) at 340 nm was 9.6 mmol L−1 cm−1 [24].

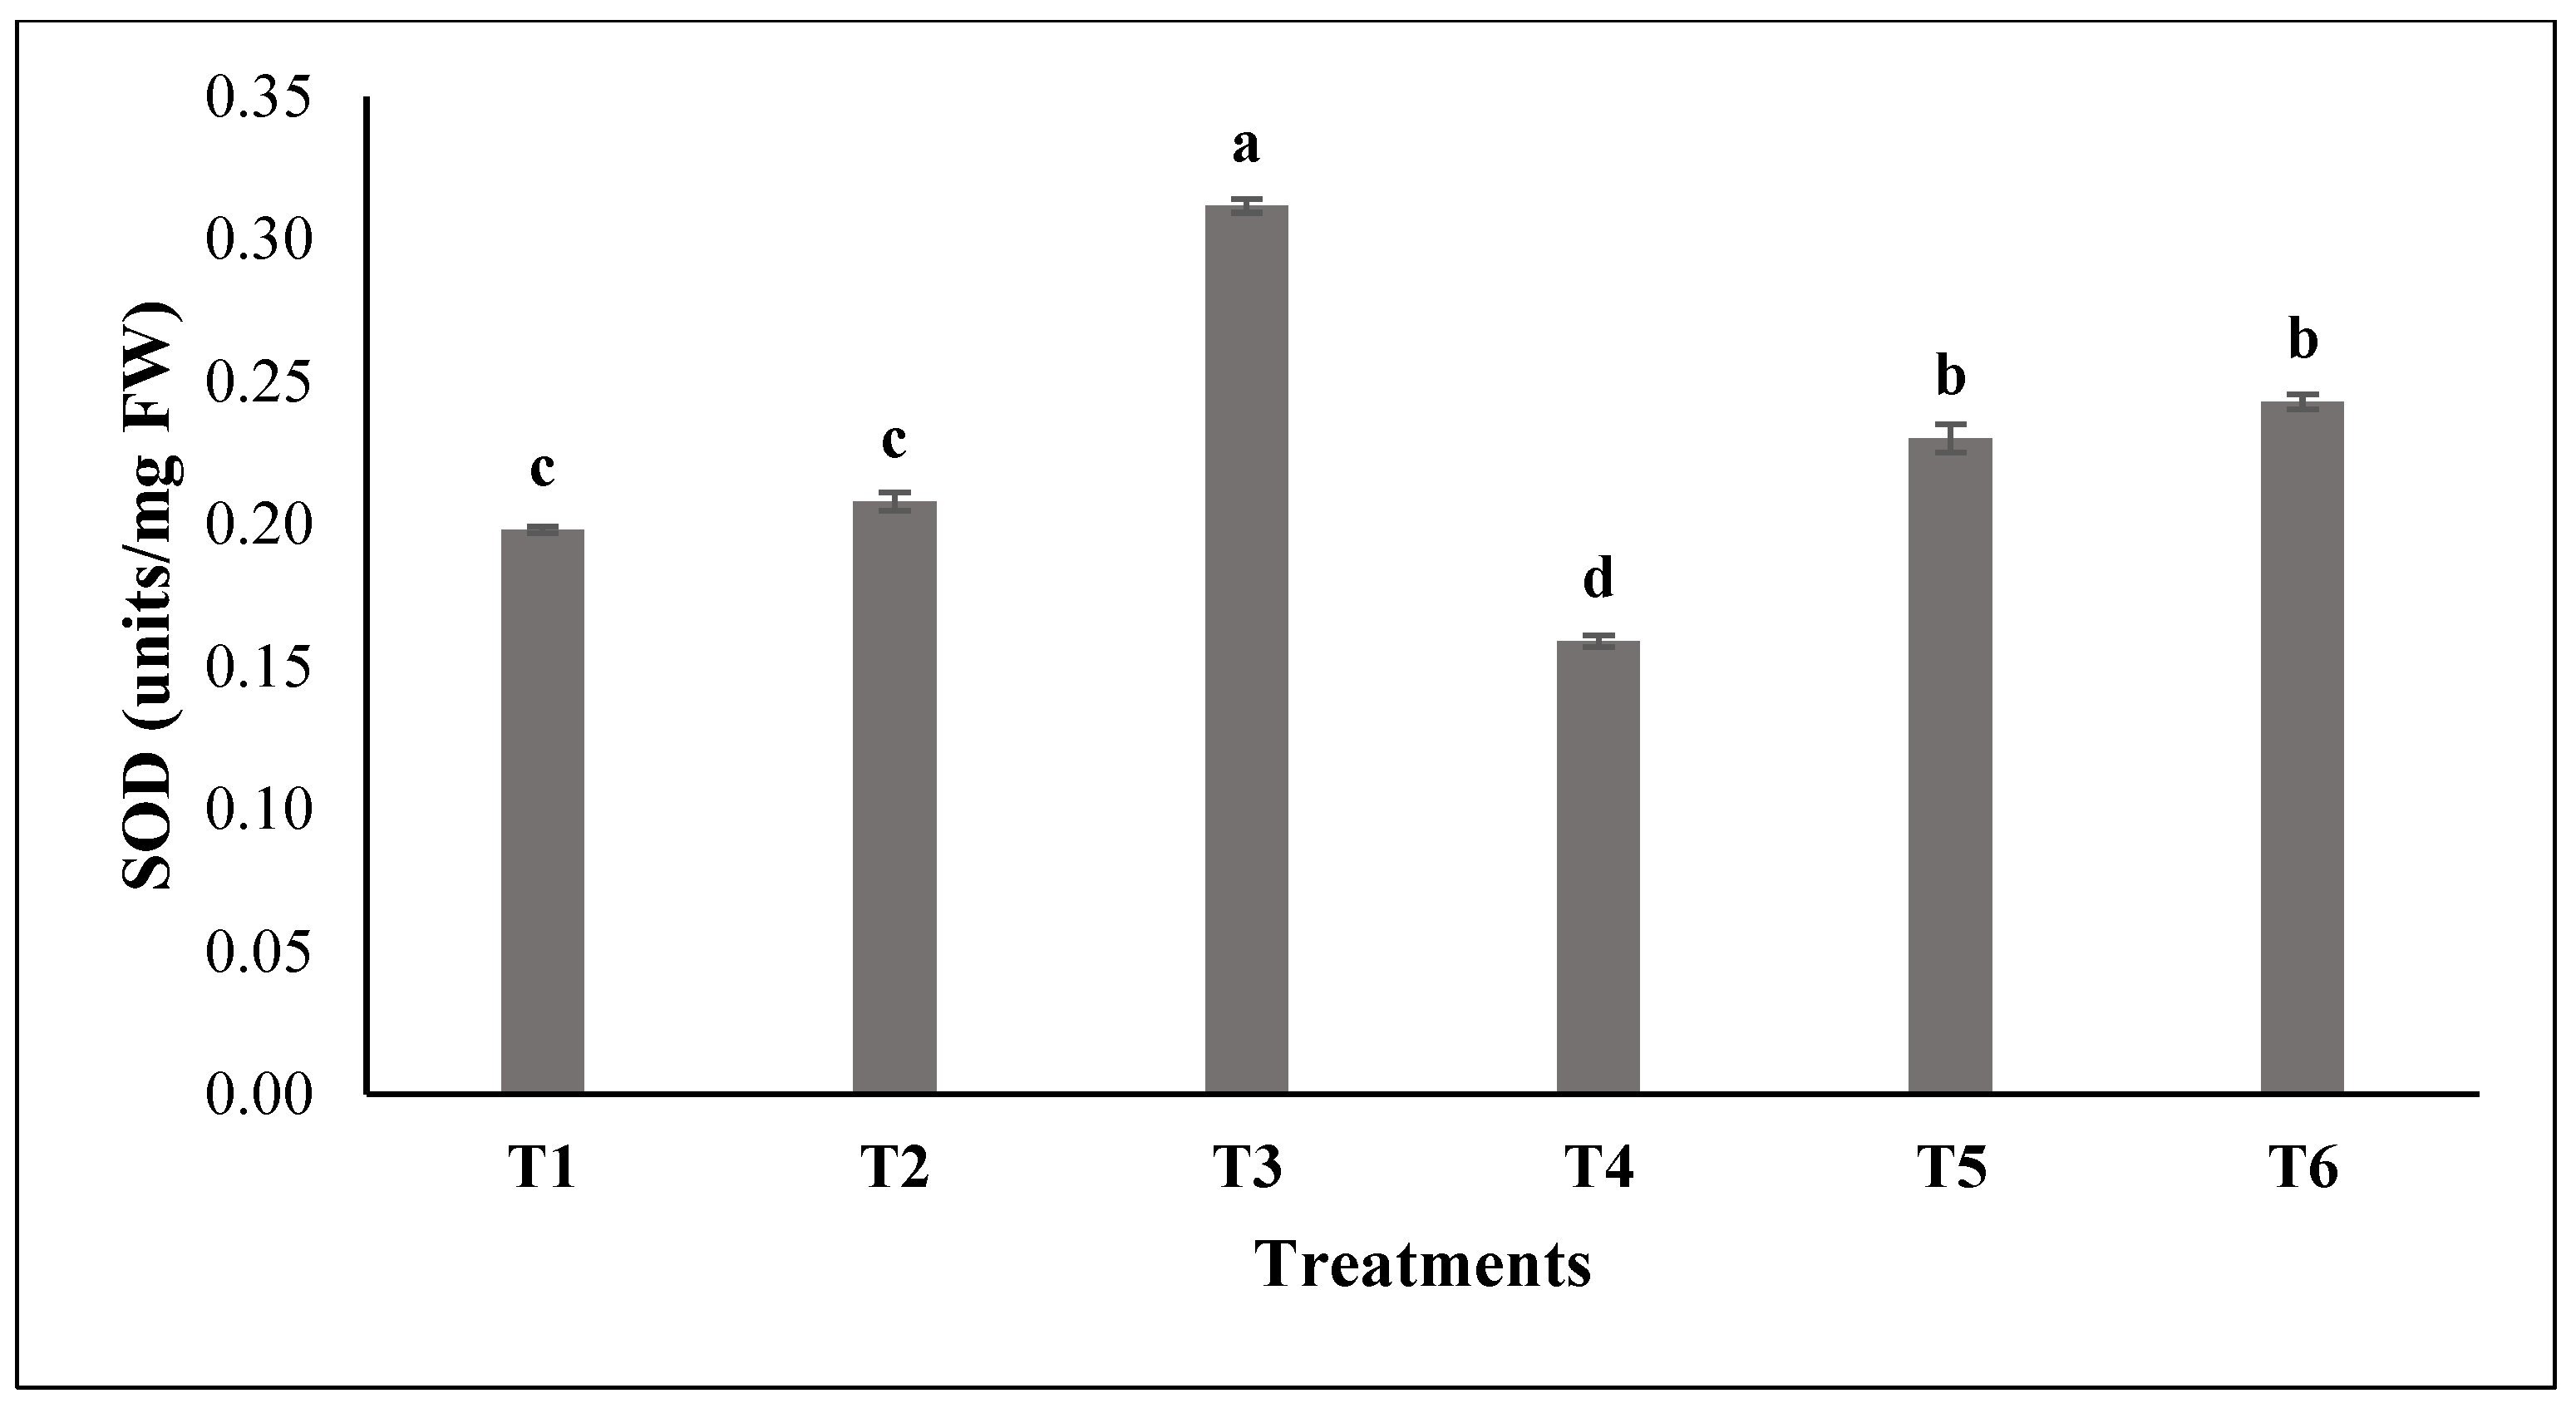
2.3.5. Estimation of Superoxide Dismutase’s Activity

The reacted combination contained 50 mM phosphate buffer of monobasic (NaH2PO4·2H2O) and dibasic (Na2HPO4·2H2O) (pH = 7.8), 20 μM vitamin B2 (riboflavin), 75 mM nitro blue tetrazolium chloride (NBT) (C40H30Cl2N10O6), 13 mM amino acid methionine, and 0.1 mM ethylene diamine tetra acetic acid (EDTA) (Mwt: 292.24) (EDTA). After 10 min, the development of a bluish color was observed and measured at 560 nm with a UV–Visible spectrophotometer (Genesys, PG Instruments Ltd., T 80, Leicestershire, UK). A SOD’s enzyme unit activity was defined as the concentration that induced half-maximal inhibition of NBT reduction. The units in which values were measured are units mg−1 fresh weight (FW) [25].

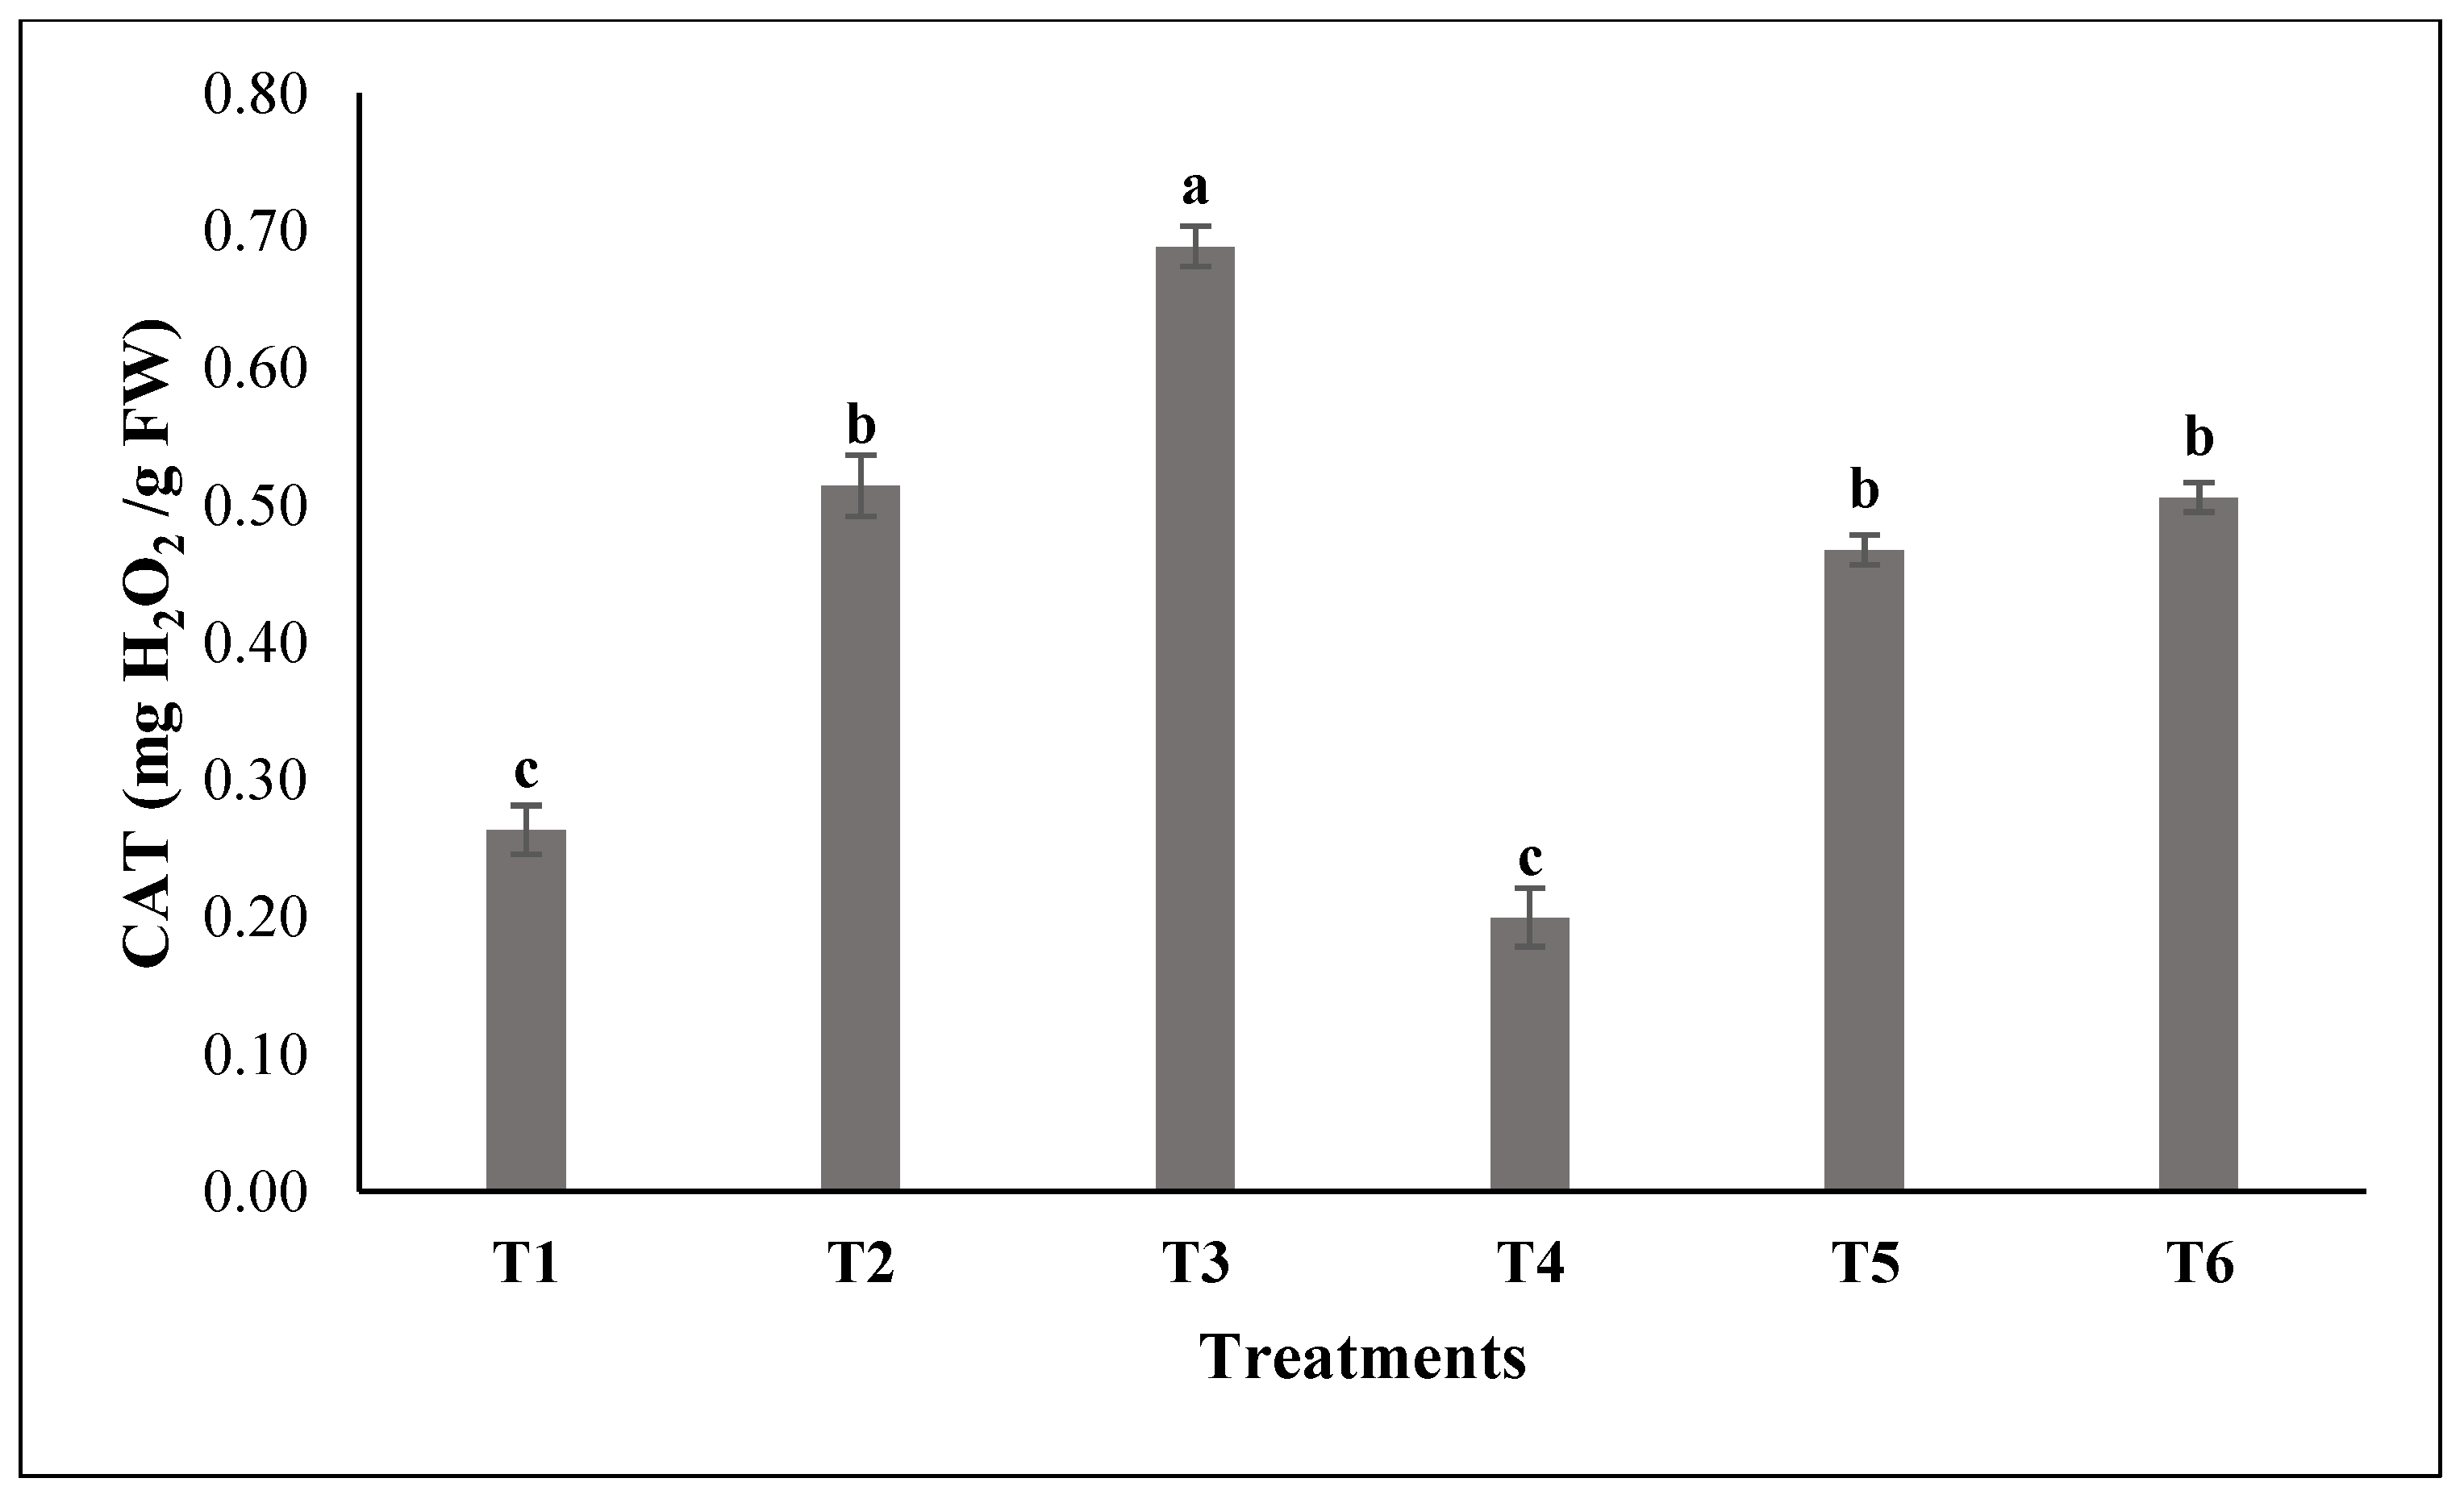
2.3.6. Estimation of Catalase’s Activity

Catalase catalyzes the decomposition of hydrogen peroxide (H2O2) into H2O + O2 [26,27]. The reaction mixture contained 1 mL of enzyme extract and 1 mL of 0.1 M hydrogen peroxide in a conical flask. The mixture was maintained at 28 ± 1 °C for 15 min in a dark environment. Five milliliters of 10% H2SO4 were added to the reaction mixture. The enzyme assay depends on estimating residual H2O2 by titration with 0.05 N potassium permanganate (KMnO4, Eq.wt: 31.6).

2.4. Transcriptomic Analysis

We used paramagnetic NEXTFLEX® Poly(A) Beads 2.0 to obtain messenger RNA (mRNA) from leaf tissue specimens. Only samples with an RNA integrity number (RIN) of 7 or above were good enough for further study. The NEXTFLEX® Rapid Directional RNA-Sequence Kit 2.0 facilitates the creation of strand-specific and directional RNA libraries suitable for sequencing with Illumina® sequencers. The Illumina NovaSeq 6000 technology was used for genome sequencing to sequence the completed library pools. Illumina NovaSeq is a platform for next-generation genome sequencing (https://bioconductor.org/packages/release/bioc/html/NOISeq.html) (accessed on 14 May 2025) using a deep sequencing technique (2 × 150 bp PE reads; average paired-end read count 50 million/sample) [17]. The sequencing service provider employed FastQC software version 0.12.0 (https://timkahlke.github.io/LongRead_tutorials/QC_F.html; accessed on 14 May 2025) [28] to evaluate and adjust essential quality parameters. To remove bases of inferior quality, secondary pre-filtration of the raw readings was performed using the Trimmomatic tool (http://www.usadellab.org/cms/index.php?page=trimmomatic; accessed on 14 May 2025) [29]. Subsequently, a de novo transcript was built from the pre-filtered and qualitatively suitable short reads without utilizing a reference genome using the Trinity tool in OmicsBox Biobam software version 3.4 (https://www.biobam.com/omicsbox/; accessed on 14 May 2025) [30]. The Trinity sequence assembler software version 2.15.2 can assemble short nucleotide sequences into longer contigs.
In this study, we used the cleaned, filtered SRA datasets from our treatments, which were deposited in the NCBI bankit [20], to construct the de novo transcriptome. In the applied method, previous information of the raw reads, especially the genome that will be used as a reference, is unnecessary for processing. The objective is to generate longer contigs from the intermediate reads, improving their interpretability.
Quantifying the transcript level is a method for determining the extent of transcripts’ biological expression [31]. To examine the genes and determine the individual expression levels of them, firstly, a count table was derived from the de novo transcriptome that was generated. When numerous treatments are administered, the transcript’s expression levels within each treatment are evaluated. Consequently, it was possible to identify the differences in levels of gene expression among treatments. The abundance of transcripts was quantified (count table).
Differentially expressed genes (DEGs) between each treatment became visible from this. Gene enrichment analysis was then used to identify which contigs were overexpressed in each treatment. Pairwise differential expression gene analyses (DEGs) were performed to narrow the ratio of up- and down-regulated genes under the selection criteria log2FC. The pairwise analysis was performed in 7 combinations: (1) between the datasets of non-treated (control) and salinity-stressed plants, (2) between the datasets of non-treated (control) and sprayed plants with 0.075 g/L ZnO NPs, (3) between the datasets of non-treated (control) and sprayed plants with 0.15 g/L ZnO NPs, (4) between the datasets of non-treated (control)and salinity-stressed but sprayed plants with 0.075 g/L ZnO NPs, (5) between the datasets of non-treated (control) and salinity-stressed but sprayed plants with 0.15 g/L ZnO NPs, (6) between the datasets of salinity-stressed and salinity-stressed + sprayed plants with 0.075 g/L ZnO NPs, and finally (7) between the datasets of salinity-stressed and salinity-stressed + sprayed plants with 0.15 g/L ZnO NPs. The comparisons can be summarized as (1) T1 vs. T4; (2) T1 vs. T2; (3) T1 vs. T3; (4) T1 vs. T5; (5) T1 vs. T6; (6) T4 vs. T5; (7) T4 vs. T6.
In the next step, functional analysis was applied to the dataset to identify transcriptomic contigs obtained from the step of de novo assembly. The unidentified contigs were transformed into a defined, mapped, and annotated dataset, with each contig accompanied by relevant metadata. The results showed what the biological role of the sequence was and how it was involved in a number of metabolic processes. This work utilized OmicsBox Biobam software version 3.4 to generate an annotation table through the analysis of Gene Ontology (GO) (accessed on 14 May 2025) [32]. In the final step, each of the previously identified genes that were differentially expressed between treatments was subjected to combined pathway analysis, determining which biochemical pathways they were involved in, as we conducted Gene Ontology (GO), plant reactome, and Kyoto Encyclopedia of Genes and Genomes (KEGG) enrichment analyses to elucidate the functions of differentially expressed genes (DEGs) and their interactions within regulatory pathways.

2.5. Statistical Analysis

This study employed experimental methodologies that involved conducting all treatments four times, with the results provided as averages alongside standard errors. The statistical analysis was conducted using JASP software version 0.19.3.0. The research employed a one-way ANOVA to examine differences between the examined groups, as the results met the assumptions of the normal distribution and homogeneity after applying the Shapiro–Wilk and Levene tests. Tukey’s range test was used with a level of significance of 5% [33,34].

3. Results

3.1. Synthesis and Characterization of ZnO NPs

Our previous study described the chemical synthesis and characterization of ZnO NPs [11]. The UV-Vis spectrophotometer showed a clear ZnO absorption peak at 370 nm. The electron micrograph (TEM image) showed that ZnO NPs are virtually hexagonal, indicating high quality. SEM images of ZnO nanoparticles show their homogeneous shape and size. Energy-dispersive X-ray spectroscopy showed that zinc (Zn) and oxygen (O) were evenly distributed on ZnO nanoparticle surfaces. ZnO nanoparticles precipitated at 200 °C for 2 h had a monomodal size distribution with a half-width of 41.166 nm. Chemically produced ZnO NPs were investigated using FTIR in the 3900 to 300 cm−1 wavelength range. ZnO NPs’ spectra showed peaks associated with six functional groups, and they were varied between 3150 and 370.23 cm−1. The measured Zeta potential was −30.214 mV.

3.2. Assessment of the Enzymatic Activities

Figure 1, Figure 2, Figure 3, Figure 4 and Figure 5 show the activity of the evaluated enzymes: glutathione reductase (GR), peroxidase (POX), glutathione-S-transferase (GST), superoxide dismutase (SOD), and catalase (CAT).
A trend was observed for all of the evaluated activities, where the non-stressed and sprayed with 0.075 g/L ZnO NPs (T3) had the highest activities of antioxidant enzymes. The plants that were stressed with 0.15 M NaCl and sprayed with ZnO NPs in two different concentrations (0.075 and 0.15 g/L ZnO NPs, i.e., T5 and T6, respectively) had a higher activity of GR, POX, GST, SOD, and CAT enzymes than the plants that were stressed with NaCl but were not sprayed with the zinc oxide nanoparticles (T4).
The majority of the enzymes analyzed exhibited reduced activity in the presence of NaCl, whereas the contrary effect was observed with NPs. Furthermore, in comparison to the controls, the stimulatory effect of NPs was particularly pronounced in the presence of elevated salt concentrations in the water. It was observed that the plants stressed with sodium chloride and not treated with ZnO NPs (T4) had the lowest values compared to all the other treatments.
The second treatment (T2), which was not stressed but treated with ZnO NPs, resulted in plants with higher values of the antioxidative enzymes compared to the control plants that were neither stressed nor sprayed with ZnO NPs (T1). According to the comparison between the fifth treatment (T5), which was stressed with 0.15 M NaCl and sprayed with 0.075 g/L ZnO NPs, and the second treatment, which was not stressed but sprayed, there was a significant difference in the level of GR and GST, with higher values for the second treatment. On the other hand, the higher values were observed in the fifth treatment plant in the case of SOD. There was minimal variance among the aforementioned interventions in the case of POX and CAT.

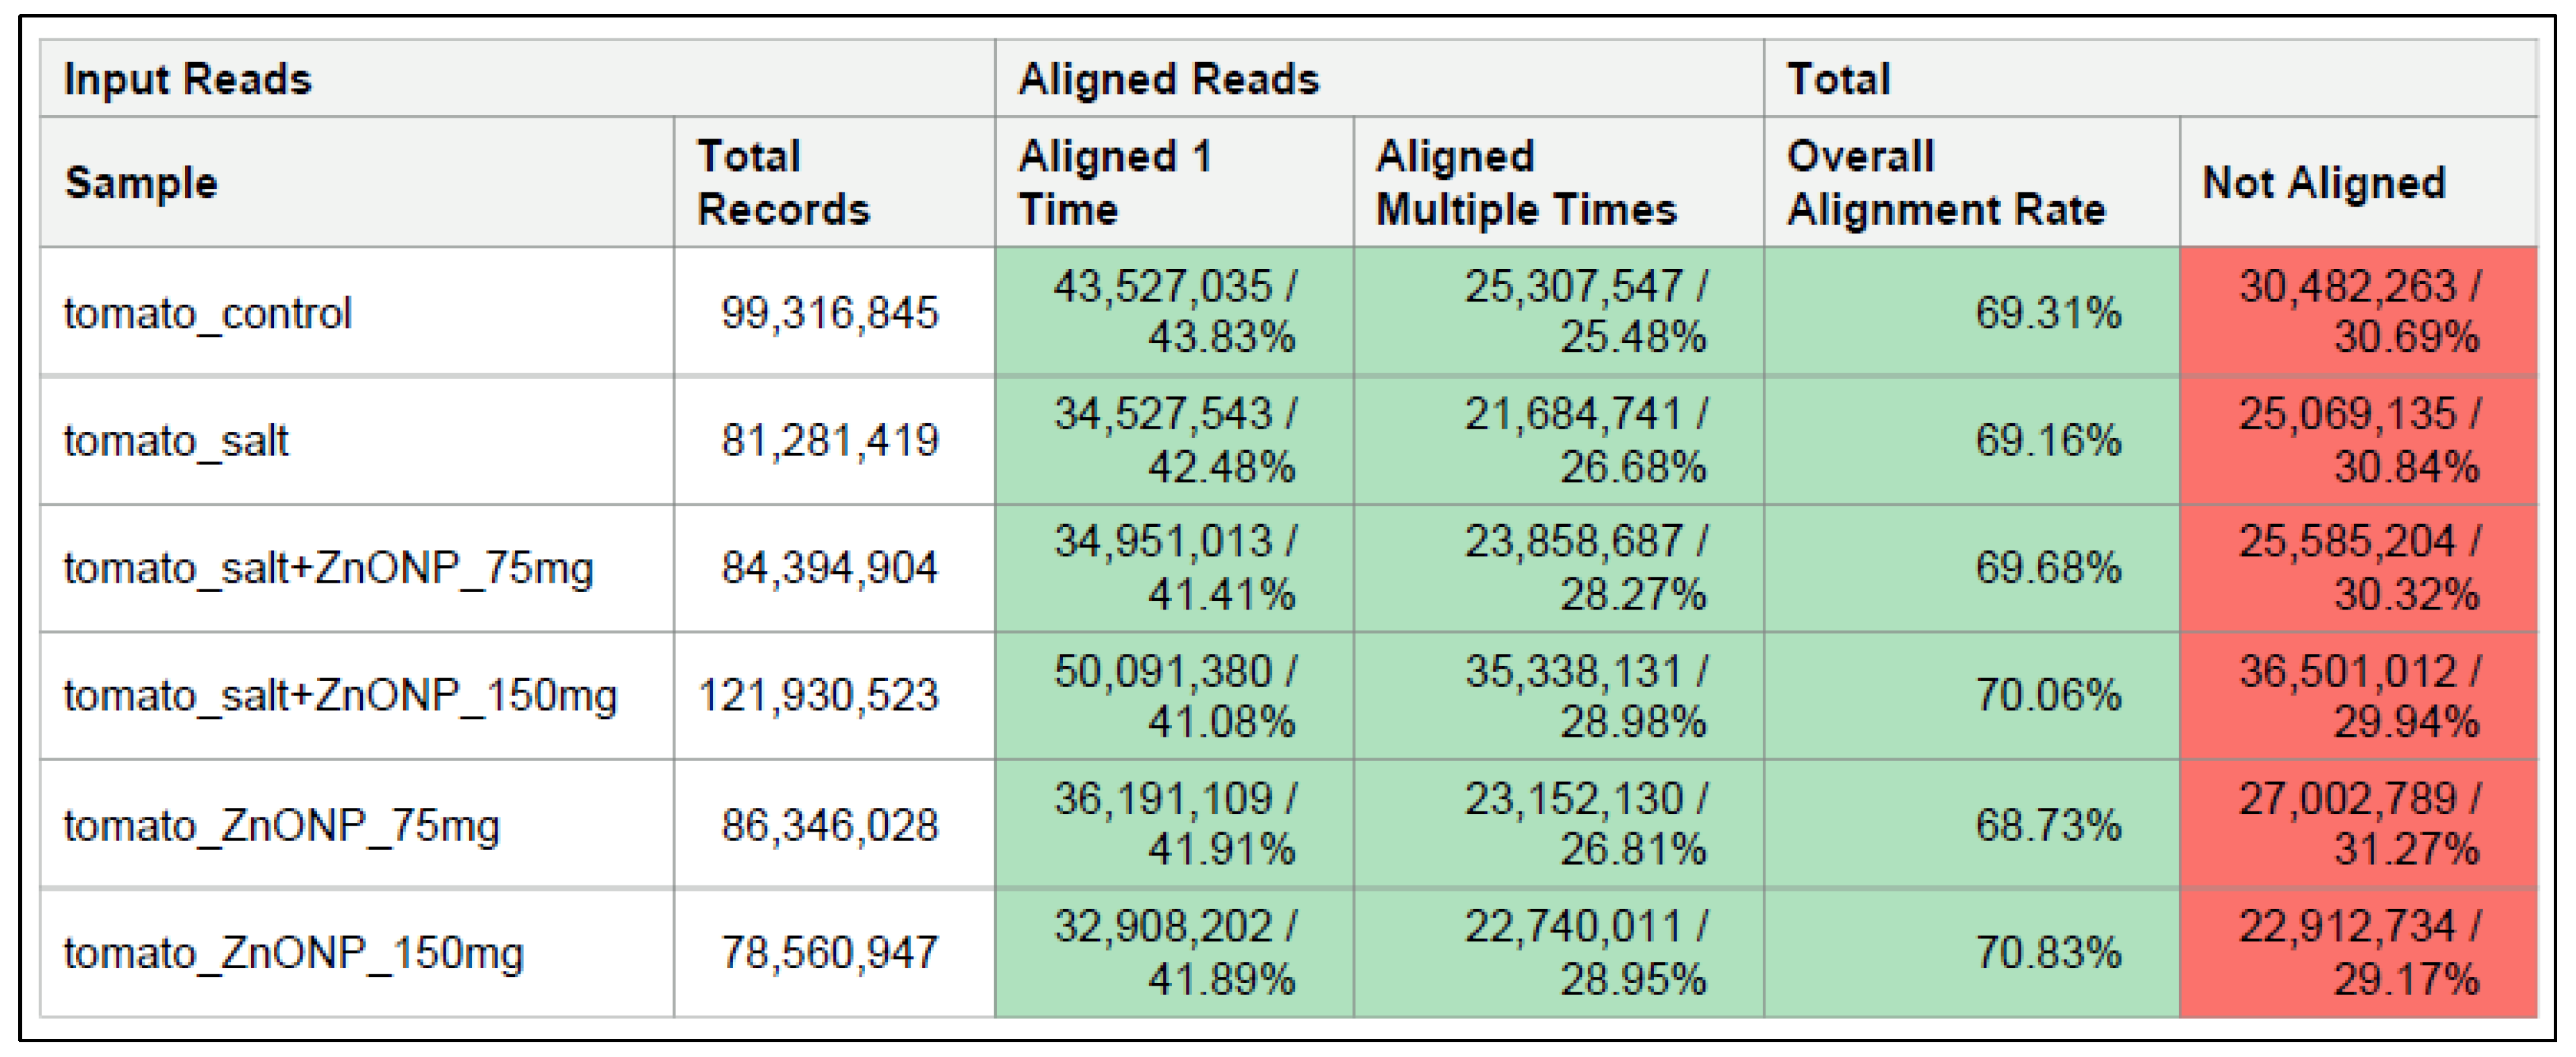
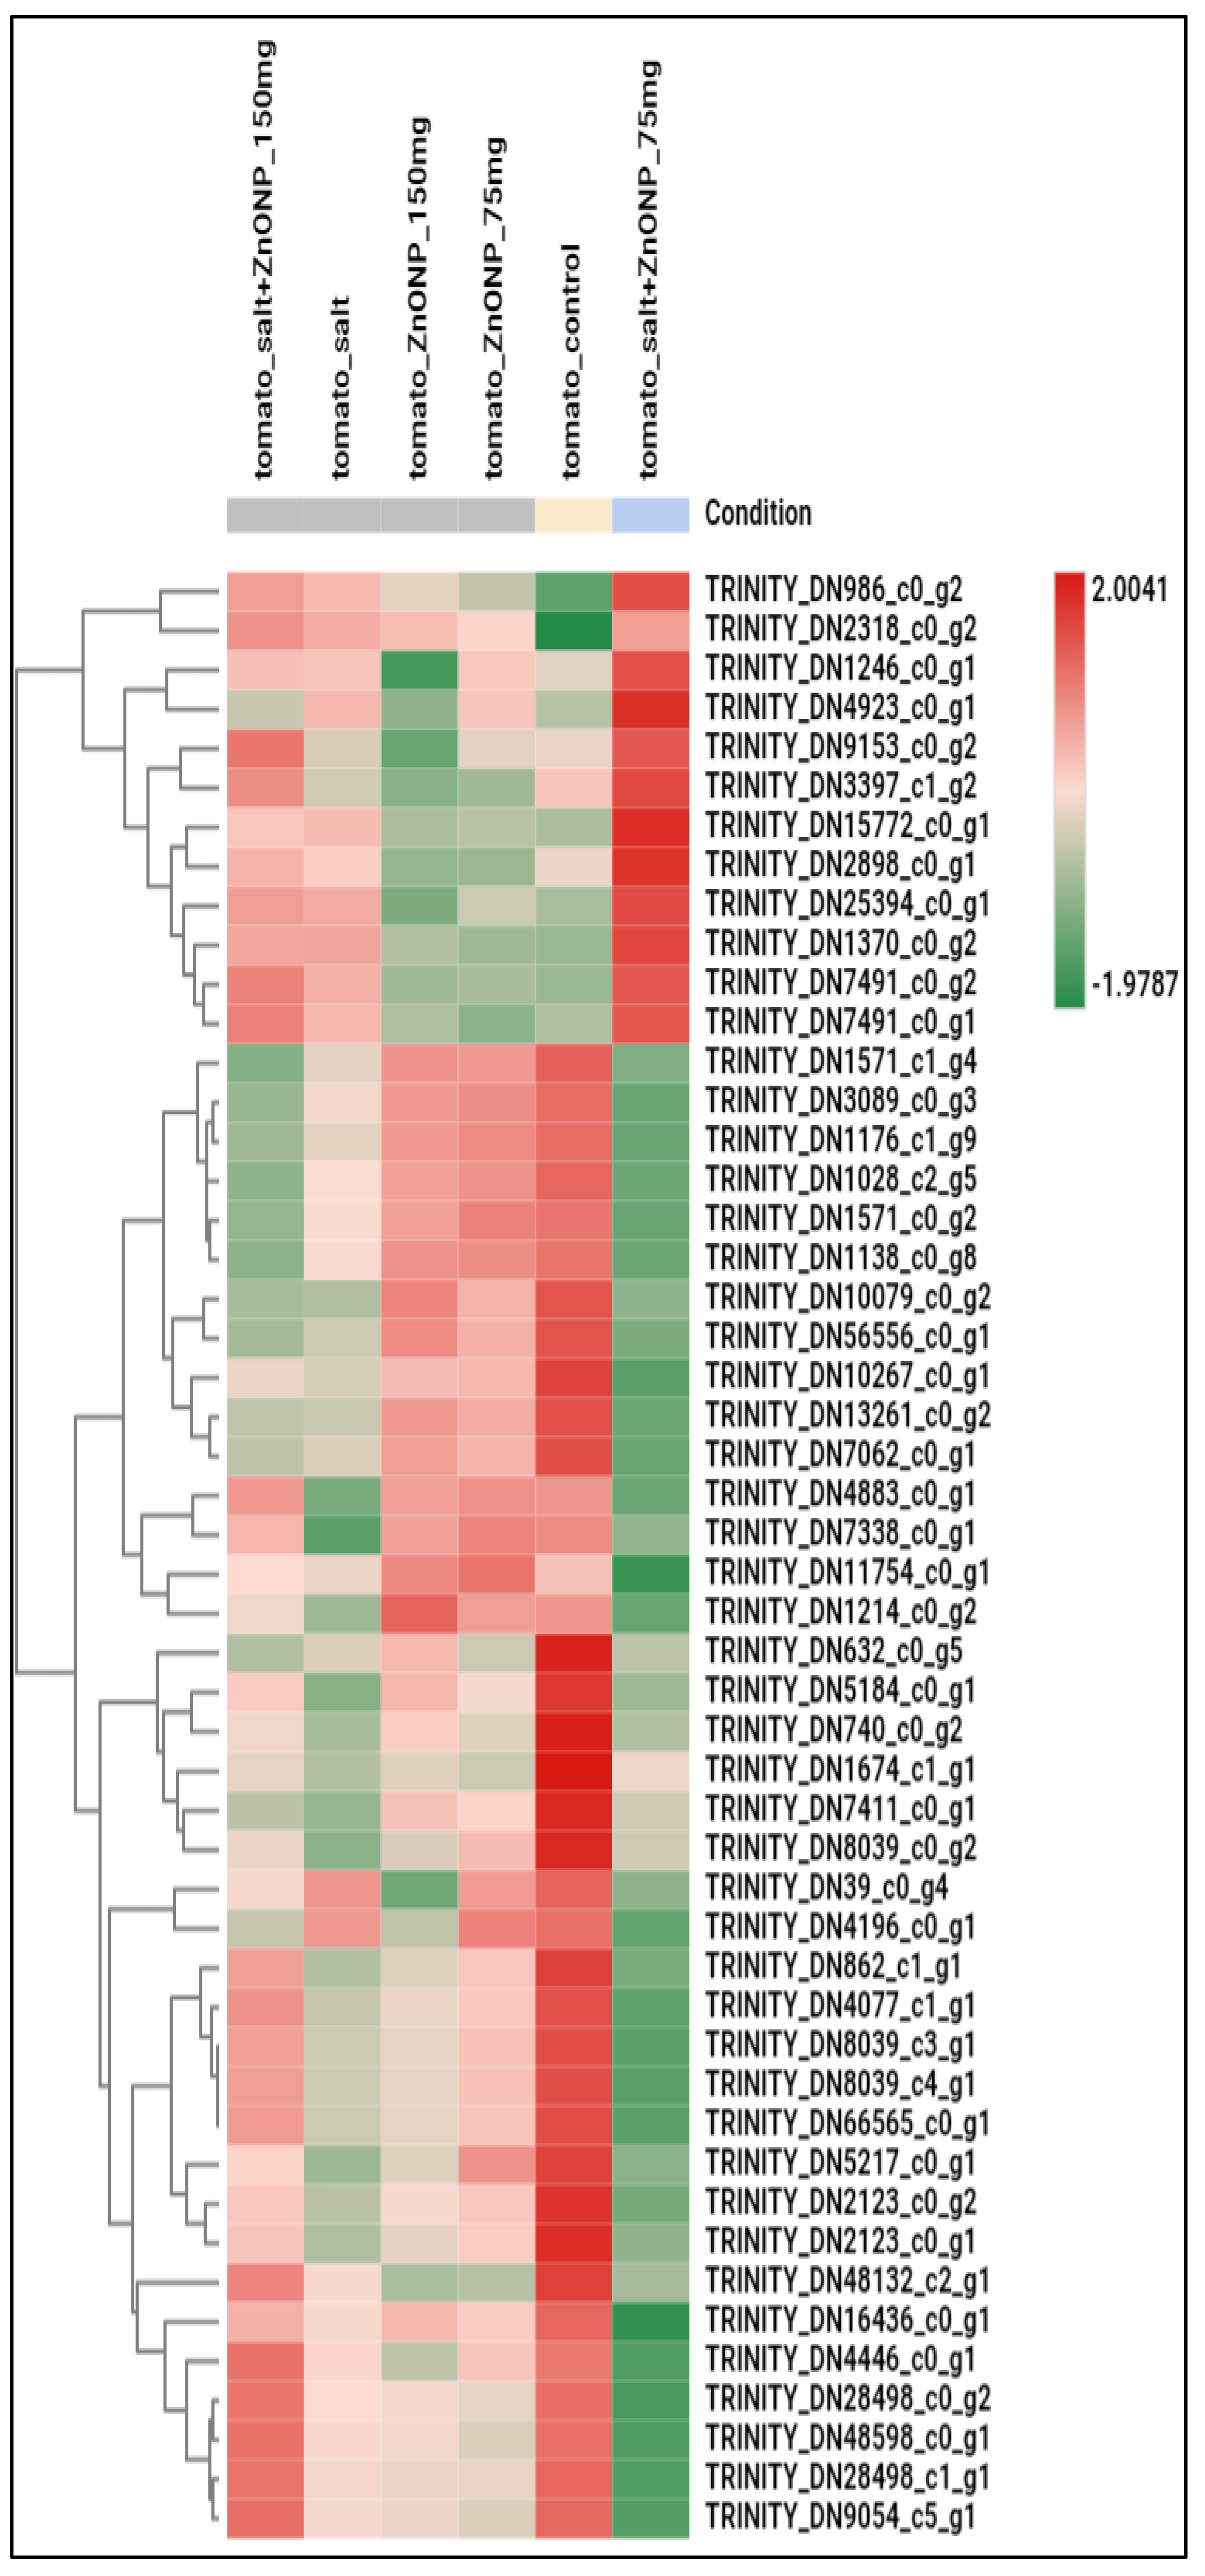
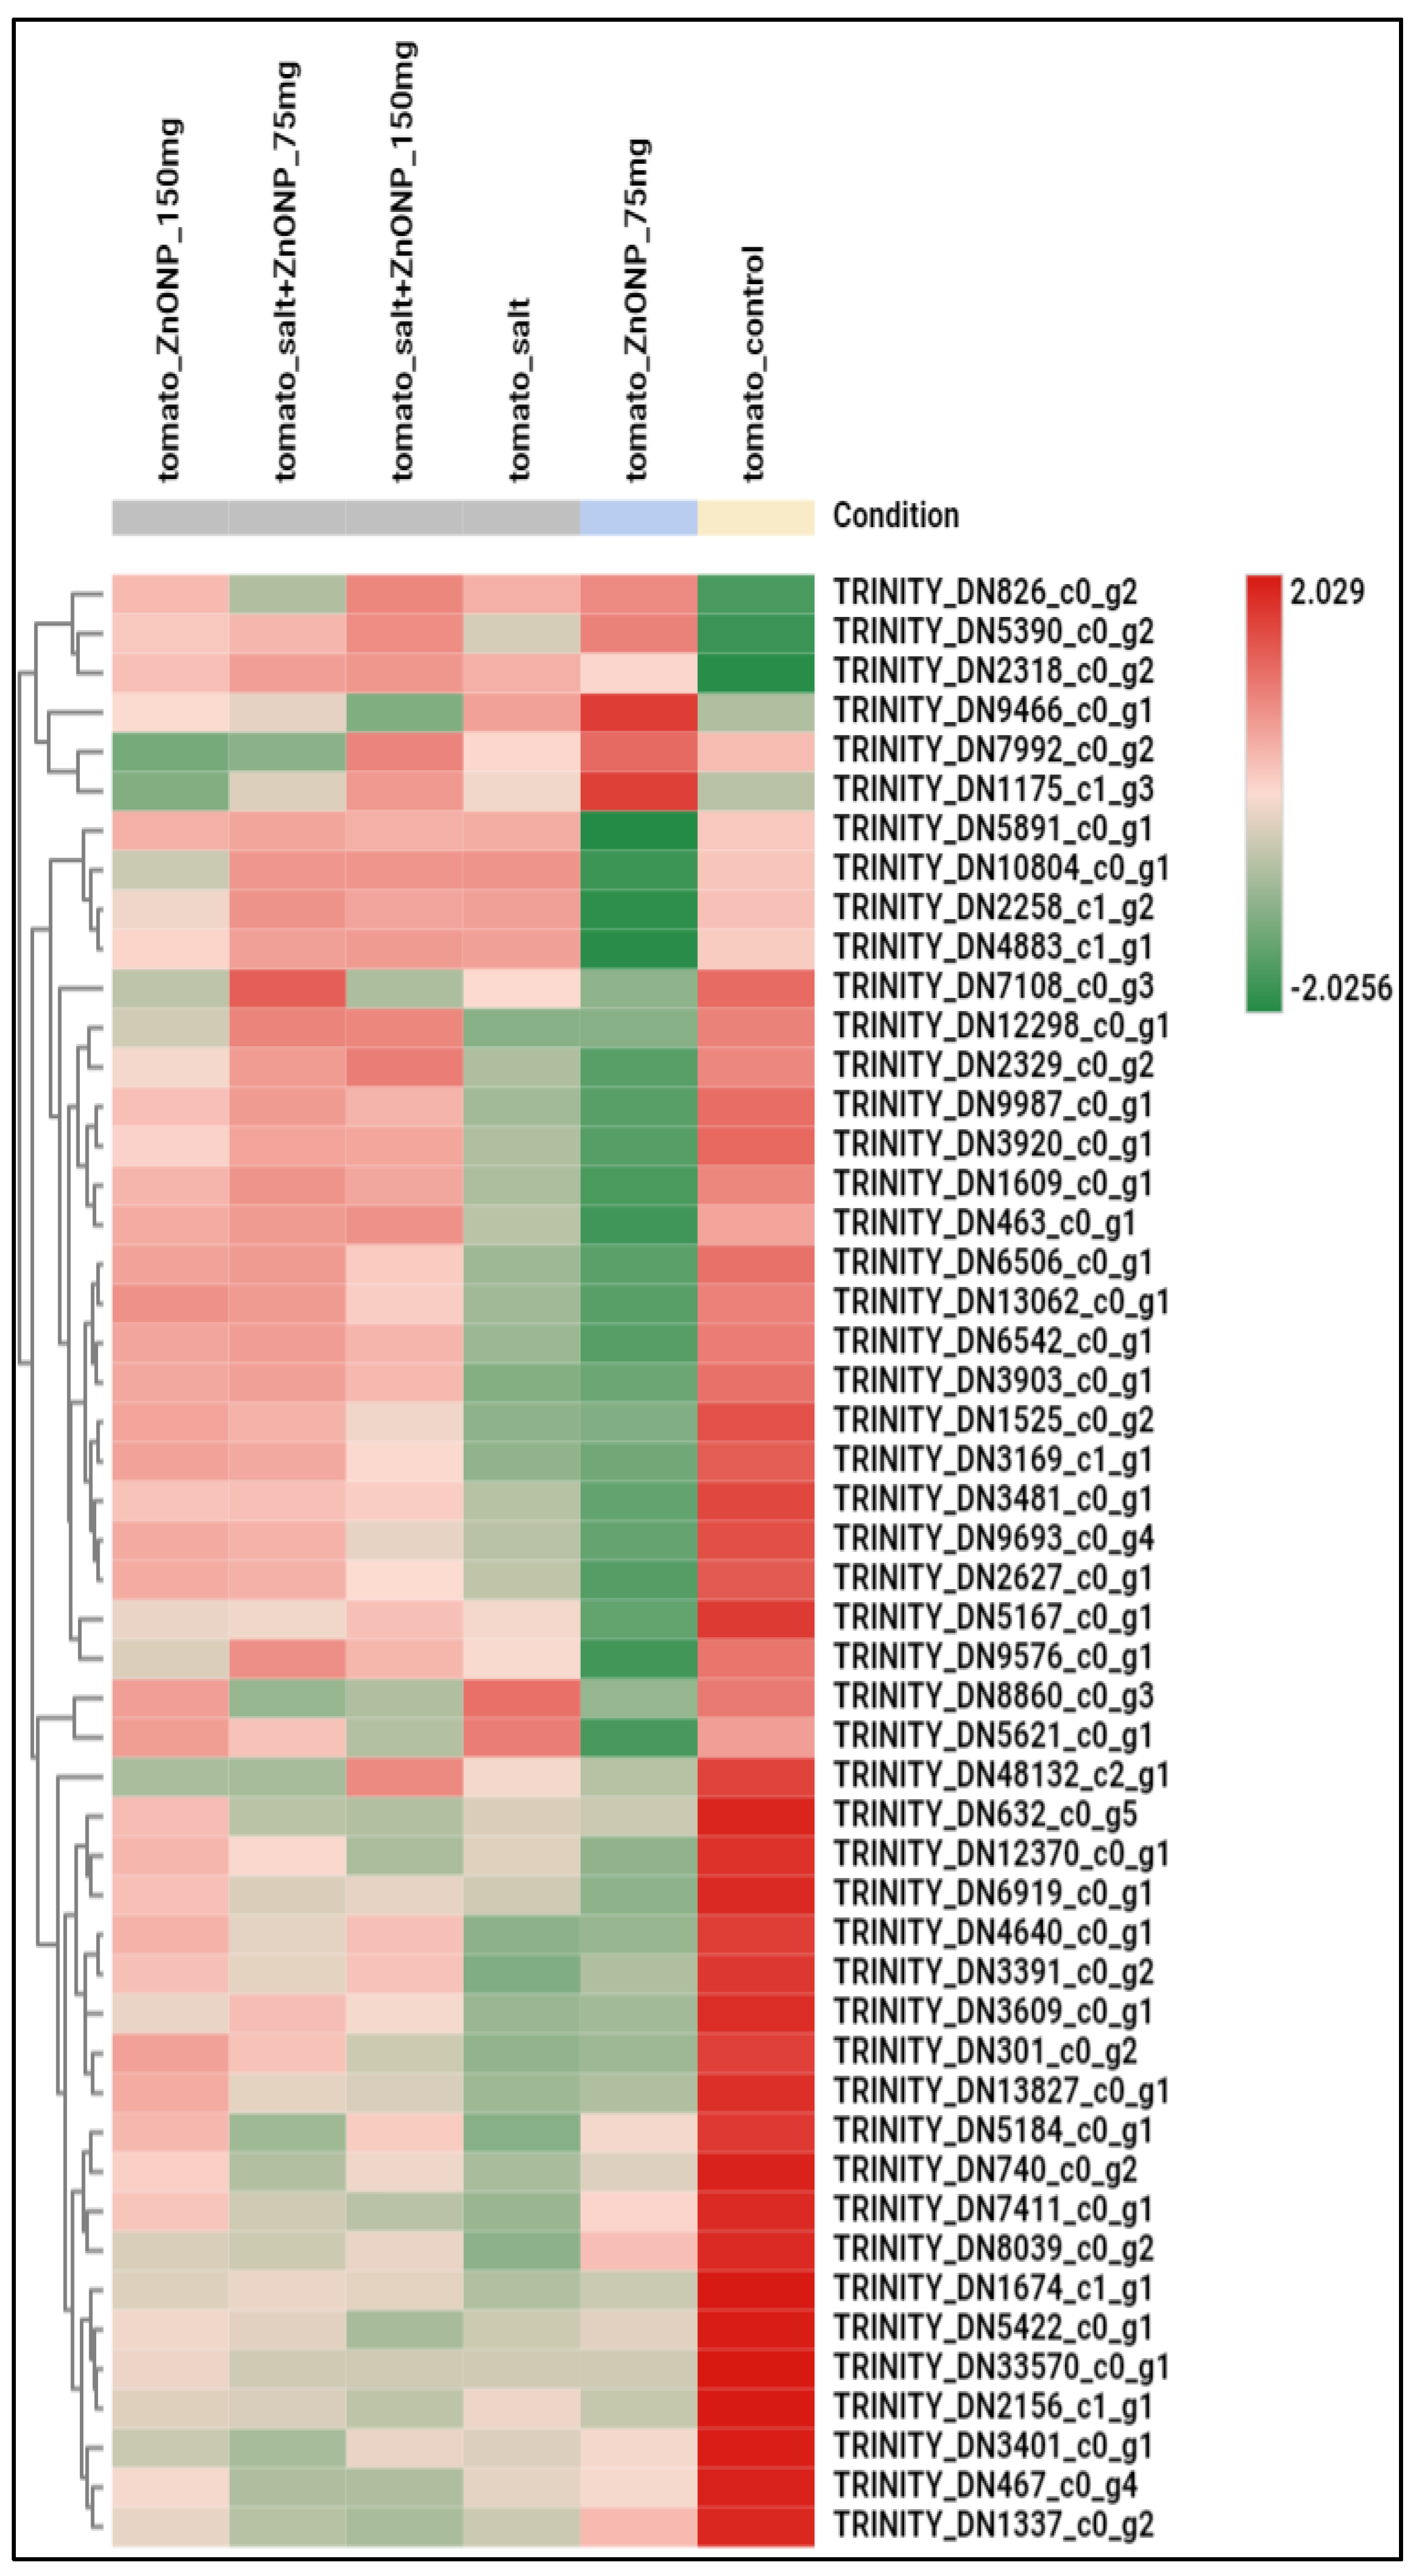
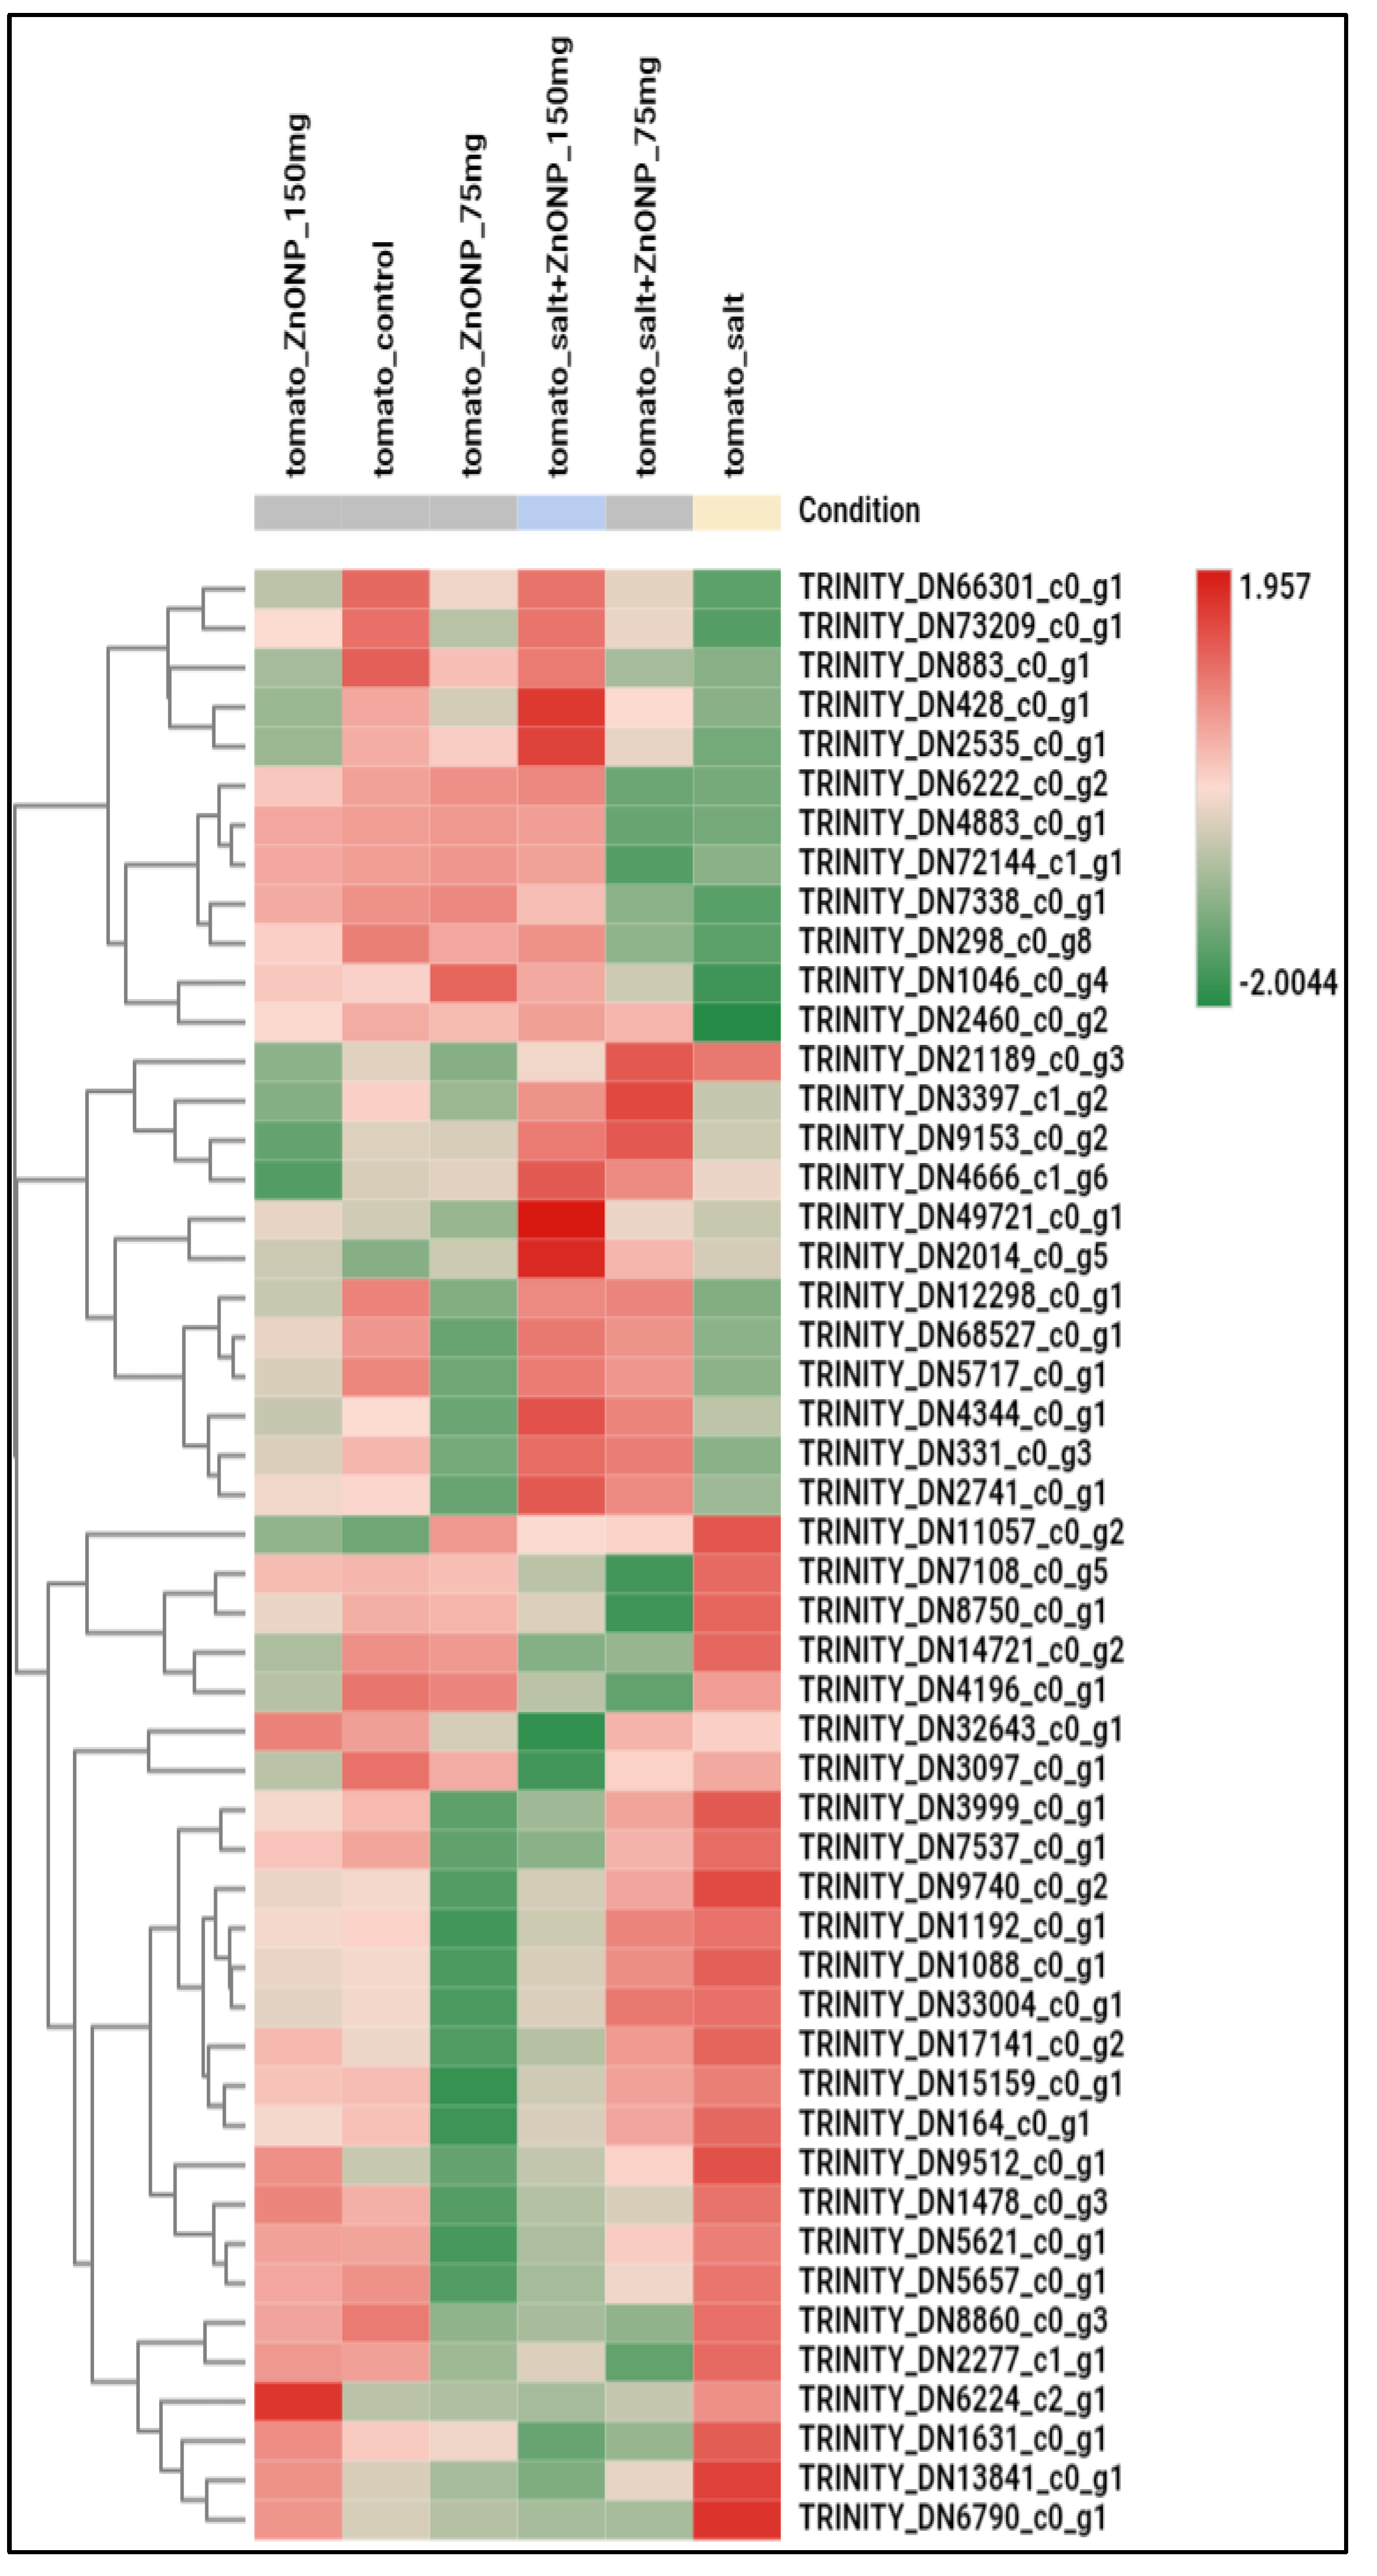
3.3. Genome-Wide Transcriptomic Analyses

Total raw reads (post-sequencing) of the different treatments varied between 40,332,114 and 63,450,658. The raw reads measured 151 bp in length, the total count of contigs after de novo assembling was 87,567 (Table S1-1), and the mean length of the contigs was 1176 bp [20]. The comprehensive supertranscriptome (Transcriptome Shotgun Assembly—TSA) serves as a depository of programmatically assembled transcript sequences obtained from primary sources of data, such as archived raw sequencing data (SRA) and next-generation sequencing. Overlapping reads from the entire transcriptome were computationally reconstructed into transcripts (in silico). The data underwent blasting, mapping, and annotation, subsequently followed by RNA sequencing read quantification to determine the level of expression of the de novo transcriptome contigs (Table S1-1). This was crucial since differential expression analysis requires the assessment of individual degrees of expression of the contigs. The number of reads that were aligned in more than one way is shown in Figure 6.
The number of supertranscript contigs reconstructed from the sequences modulated by the treatments was 71,284 (Table S1-2). The pairwise differential between the datasets of control and salinity-stressed plants showed that the number of differentially expressed (DE) sequences (Probability > 0.9) was 2740, with 1021 increased and 1719 reduced (Table S2-1). In the case of the comparison between the datasets of control and sprayed plants with 0.075 g/L ZnO NPs, 1609 differentially expressed (DE) sequences (Probability > 0.9) were obtained, with 495 increased and 1114 reduced (Table S2-2). The comparison between the datasets of control and sprayed plants with 0.15 g/L ZnO NPs resulted in 863 differentially expressed (DE) sequences (Probability > 0.9), with 441 increased and 422 reduced (Table S2-3). In the comparison between the datasets of salinity-stressed and salinity-stressed + sprayed plants with 0.075 g/L ZnO NPs, 3177 differentially expressed (DE) sequences (Probability > 0.9) were obtained, with 899 increased and 2278 reduced (Table S2-4).
The pairwise differential analysis between the datasets of salinity-stressed and salinity-stressed + sprayed plants with 0.15 g/L ZnO NPs resulted in 2492 differentially expressed (DE) sequences (Probability > 0.9) with 971 increased and 1521 reduced (Table S2-5). However, the comparison between the datasets of salinity-stressed and salinity-stressed + sprayed plants with 0.075 g/L ZnO NPs showed 659 differentially expressed (DE) sequences (Probability > 0.9) with 299 increased and 360 reduced (Table S2-6). Moreover, the comparison between the datasets of salinity-stressed and salinity-stressed + sprayed plants with 0.15 g/L ZnO NPs, 728 differentially expressed (DE) sequences (Probability > 0.9) were obtained, with 392 increased and 336 reduced (Table S2-7).
In case of supertranscript analysis, blasting, mapping, and annotating the obtained contigs were performed to find similar sequences, associating the blasted contigs with functional information (Gene Ontology), and finally to determine the biological meanings of the sequences. We employed the plant reactome and KEGG for a deep pathway analysis to identify biochemical pathways that responded positively or negatively to the treatments [35,36] to the supertranscriptome (Table S3). In all seven comparisons, we identified increased, reduced, and over-expressed sequences (genes) through executing their blasting, mapping, and functional annotation, grounded in the data acquired from the combined analyses.
The most significant number of differentially increased genes was found in the case of comparing T1 with T4, as it was found that 1019 sequences were increased and 445 were overexpressed. They could be linked to 129 biochemical pathways based on the KEGG database, with 109 sequences, while the plant reactome database found 313 pathways, with 383 linked sequences. On the other hand, for the comparison between T1 and T5, it had the highest number of differentially reduced genes, as it was found that 2271 sequences were reduced, while 1834 were overexpressed. They were linked to 897 and 240 pathways based on the plant reactome and KEGG databases, with 950 and 550 sequences, respectively.
The lowest number of differentially increased genes was found in the case of comparing T4 with T6, so it was found that 391 sequences were increased and 287 were overexpressed. They could be connected to 55 pathways based on the KEGG database, with 52 sequences, and the plant reactome database identified 168 pathways, with 167 linked sequences. On the other hand, the same comparison between T4 and T6 had the lowest number of differentially reduced genes; it was found that 336 sequences were reduced, while 194 were overexpressed. They could be connected to 71 biochemical pathways based on the KEGG database, with 51 sequences, and the plant reactome database identified 133 pathways, with 125 linked sequences.
In case of pairwise differential analysis of the top 50 contigs, blasting, mapping, and annotating the obtained contigs were performed. In all seven comparisons, we identified the top 50 increased and reduced sequences. The possible biochemical pathways and their linked sequences were studied based on the KEGG database (see Table S4), and the main results are summarized in Table 1.
Heat maps can be used to visualize the gene expression across samples. The top 50 increased and reduced differentially expressed contigs (Table S5) involved in the pairwise differential analysis between treatments were identified, as shown in the heat maps (Figure 7, Figure 8, Figure 9, Figure 10, Figure 11, Figure 12 and Figure 13).
According to the sub-cellular analysis, we aimed to reproduce the workflow using transcriptome analysis, employing the OmicsBox tool, particularly the functional analysis and transcriptomics modules. This firstly involved obtaining sequencing data and performing a combined differential expression analysis of the whole transcriptome (supertranscript) by replicating the original data within OmicsBox, thereby establishing a solid foundation for further analysis and ensuring comparability with the increased and reduced sequences, so we can figure out the different biochemical pathways that the treatments may trigger and also find out the linked sequences to those pathways through the plant reactome and KEGG databases (databases of plant metabolic and regulatory pathways). Secondly, we examined the top 50 increased and reduced sequences to visualize gene expression across samples and their associated biochemical pathways, as per the KEGG database.
For the species Solanum lycopersicum in the plant reactome database in case of the comparison between T1 and T4, there were 112 increased sequences linked to different pathways, for example, arsenic uptake and detoxification (12 genes), cytosolic glycolysis (7 genes), TCA cycle (plant) (6 genes), Calvin cycle (5 genes) sucrose biosynthesis (4 genes), regulation of seed germination and coleoptile growth under submergence, normal gravity environment (4 genes), choline biosynthesis I (3 genes), and short day regulated expression of florigens (3 genes) (Table S6-1). Moreover, for the same database, there were 322 reduced linked sequences (genes), for example, 14 genes for sterol biosynthesis, 11 for the regulation of seed germination and coleoptile growth under submergence and normal gravity environment, 10 for intracellular auxin transport, and 9 for recognition of fungal and bacterial pathogens and immunity response (Table S6-2).
In case of the comparison between T1 and T2, there were 102 increased sequences linked to different pathways in the plant reactome database, for example, photorespiration (8 genes), cytosolic glycolysis (7 genes), starch biosynthesis (6 genes), and sucrose biosynthesis (6 genes) (Table S6-3). And for the same database, there were 221 linked reduced sequences (genes), for example, 16 genes involved in sterol biosynthesis, 9 for the regulation of seed germination and coleoptile growth under submergence and normal gravity environment, 7 for mevalonate pathway, 5 for leucodelphinidin biosynthesis, and 9 for galactosylcyclitol biosynthesis (Table S6-4). But, in case of the comparison between T1 and T3, there were 41 increased sequences linked to different pathways in the plant reactome database, for example, regulation of seed germination and coleoptile growth under submergence and normal gravity environment with 7 genes and jasmonic acid signaling with 3 genes (Table S6-5). Moreover, for the same database, there were 85 reduced linked sequences (genes), for example, phenylpropanoid biosynthesis with 4 genes and cellulose biosynthesis with 4 genes (Table S6-6).
When comparing treatments T1 and T5, 76 increased sequences linked to different pathways were found, among which, 11 genes related to arsenic uptake and detoxification can be highlighted. There were also some genes found to be linked to sucrose biosynthesis (4 genes), jasmonic acid signaling (4 genes), development of root hair (3 genes), and the Calvin cycle (3 genes) (Table S6-7). Moreover, for the same database, there were 471 reduced linked sequences (genes), for example, lysine biosynthesis II (18 genes), lysine biosynthesis I (18 genes), activation of pre-replication complex (16 genes), DNA replication initiation (16 genes), and sterol biosynthesis (16 genes) (Table S6-8). And on the other hand, it showed 176 increased sequences linked to different pathways when T1 was compared to T6 in the plant reactome database, for example, photorespiration with 28 genes and cytosolic glycolysis with 19 genes (Table S6-9). Moreover, for the same database, there were 257 reduced linked sequences (genes), for example, sterol biosynthesis (16 genes) (Table S6-10).
By comparing T4 with T5, there were 26 increased sequences linked to different pathways in the plant reactome database, for example, salicylic acid signaling with 2 genes (Table S6-11). Moreover, for the same database, there were 44 reduced linked sequences (genes), for example, DNA replication Initiation (9 genes), activation of pre-replication complex (6 genes), and isoleucine biosynthesis from threonine (4 genes) (Table S6-12). And there were 66 increased sequences linked to different pathways in the plant reactome database in the case of comparing T4 with T6, for example, regulation of seed germination and coleoptile growth under submergence and normal gravity environment with 4 genes and cytokinins-O-glucoside biosynthesis with 3 genes (Table S6-13). Furthermore, for the same database, there were 61 reduced linked sequences (genes), for example, the ammonia assimilation cycle with 1 gene (Table S6-14).

4. Discussion

In plants, ROS are neutralized by both non-enzymatic antioxidants and antioxidative enzymes, among which SOD, GR, GST, CAT, etc., play important roles [37]. The presence of NaCl markedly decreased the activity of antioxidative enzymes in our current study. Plants capable of withstanding elevated salt stress frequently exhibit enhanced activity of antioxidant enzymes. It is crucial to note that salt stress induces plant responses contingent upon the concentration level. Numerous previous investigations indicated that antioxidant enzymes exhibited heightened activity under conditions of significant salt stress.
Conversely, in other investigations, heightened stress resulted in reduced enzyme activity. Ali et al. (2022) conducted a study demonstrating that NaCl stress negatively impacts the activity of antioxidant enzymes in broccoli, particularly superoxide dismutase, catalase, and ascorbate peroxidase (APX) [38]. Broccoli plants exhibited a significant reduction in APX activity under elevated NaCl stress (80 mM NaCl) compared to the control group. Salinity stress evidently diminishes the crude protein content in leaves, as our prior research indicated that tomato plants subjected to 150 mM NaCl stress had significantly reduced protein levels. A significant finding from this study is that the foliar application of chemically synthesized ZnO NPs enhanced the activity of antioxidative enzymes, regardless of the presence or absence of NaCl.
Superoxide dismutase facilitates the dismutation of superoxide free radicals into hydrogen peroxide (H2O2) and oxygen (O2), serving as the first defense against oxygen free radicals in the cytosol, chloroplast, and mitochondria [39,40]. Catalase (CAT) and other peroxidases serve as significant scavengers of excess H2O2, which is transformed into H2O and O2 [41]. CAT can effectively decompose elevated levels of hydrogen peroxide (H2O2) and mitigate the harm caused by hydroxyl radicals (OH) generated, for example, in Fenton- or Haber–Weiss-type reactions [42]. Faizan et al. (2021) [9] investigated the activity of SOD, POX, and CAT enzymes in tomato plants exposed to varying concentrations of ZnO NPs (10, 50, or 100 mg/L), either in the presence or absence of 150 mM NaCl. They found that those enzymes exhibited an upward trend when compared to the control group (plants not stressed or sprayed with ZnO NPs). The highest enhancement in the activity of CAT (57%), SOD (44%), and POX (59%) was observed in plants treated with 50 mg/L of ZnO NPs in conjunction with NaCl [9].
Glutathione reductase (GR), or glutathione disulfide reductase (GSR), is a flavoprotein classified under the NADPH-dependent oxidoreductase family. It facilitates the conversion of oxidized glutathione (glutathione disulfide) (GSSG) to reduced glutathione (GSH), which is crucial for cellular defense against reactive oxygen species (ROS) [43]. GSTs exhibiting GSH-dependent reductase activity, such as dehydroascorbate reductase (DHAR) and glutathione-s-transferase lambda class GSTL, may contribute to the preservation of reductant pools (including ascorbic acid, α-tocopherol, and anthocyanins), while other isoenzymes facilitate the detoxification of reactive metabolites [44,45].
The GST activity depletes GSH, which explains why the overproduction of GST competes with other antioxidant mechanisms. In tomatoes, salt reduces ascorbic acid and glutathione (GSH) levels, promoting lipid peroxidation [46]. Preserving a high GSH/GSSG ratio is essential for the salt and drought tolerance of tomato, maize, and wheat [44,47], which aligns with the findings of the current study.
Recent research has revealed the significance of nanotechnology in enhancing the ability of many plant species to tolerate salt. The primary aim of this work was to clarify the function of ZnO nanoparticles in the modulation of salt (NaCl) stress tolerance in tomato plants, and how the salt stress and foliar application may contribute to changes on the transcriptomic level. Plants exposed to NaCl stress accumulate ROS; nonetheless, maintaining an equilibrium between the generation and degradation of ROS is crucial to prevent oxidative damage [9,48]. El-Zohri et al. (2021) proved that in response to foliar application of ZnO NPs, antioxidant enzymes such as SOD, CAT, and APX were increased in tomato plants to reduce the negative effects of drought stress by reducing oxidative stress [40]. The referred figures show the general biochemical pathways to which some of the DEG could be assigned (Figure 14 and Figure 15).
Table 2 shows the possible biochemical pathways linked to the increased and reduced sequences from the supertranscript according to the KEGG database. The values in front of each biochemical pathway refer to the number of increased/reduced sequences connected to that pathway. Salinity stress significantly elevated the expression of genes involved in the metabolism of purine, thiamine, starch, sucrose, and other secondary metabolites in plants [49], which aligns with the findings of the current study.
Sun et al. (2020) discovered that foliar application of ZnO nanoparticles increased zinc in leaves while decreasing zinc in roots [19]. The findings indicated that the increased Zn+2 in leaves negatively regulates Zn+2 transport to the roots. In support of this hypothesis, two ZIP families, such as Zrt- and Irt-like protein (which facilitate the transport of Zn2+, Fe+2, Mn+2, and Cd+2 across cellular membranes) (ZIP3 and ZIP5), demonstrated reduced expression in ZnO NP-treated roots relative to untreated plants. The analysis of the transcriptome indicated that foliar application of ZnO NPs stimulated the expression of various metal transporters and two ZIP-like transporters in iron-deficient tomato leaves treated with ZnO NPs.
As shown in Table 2, salinity stress significantly reduced the purine and thiamine metabolism genes, particularly when comparing the control (T1) with treatments T4, T5, and T6. Thiamine induces systemic acquired resistance (SAR) in plants (Figure 14), which is linked to plant immunity and defense [50]; so, sometimes, there is a need to decrease the metabolic rate and accumulate total thiamine and purine content.
Thiamine, vitamin B1, is necessary for several metabolic activities [51]. Active thiamine pyrophosphate (TPP) cofactors are critical for metabolic activities like glycolysis, the hexose monophosphate shunt, and the citric acid cycle in all living things [52]. According to Tunc-Ozdemir et al. (2009), TPP (the active form of thiamine) is a crucial stress response molecule that induces thiamine production in Arabidopsis in response to various abiotic stimuli [53]. Arabidopsis seedlings exposed to cold, osmotic, and salt conditions showed a substantial increase in total thiamine content compared to control seedlings [51]. Thiamine content increased due to a significant rise in TPP.
Salinity stress dramatically increased transcript abundance of thiamine biosynthesis genes (THI4, THIC, TH1, and TPK). The transcript expressions are the highest in leaves, supporting the assumption that thiamine production occurs in chloroplasts [51]. Increasing polyethylene glycol (PEG) and NaCl concentrations caused osmotic and salt stress, leading to a substantial rise in total thiamine content in maize seedlings. Higher thiamine levels were in turn linked to higher abscisic acid (ABA) levels [53]. Additionally, drought and salinity stress conditions led to a slight increase in transketolase activity, a key TPP-dependent enzyme. The disruption of transketolase activity shows that thiamine metabolism plays a role in plant stress adaptation [53]. The mechanism of how thiamine metabolism is regulated is presented in Figure 16.
Purine nucleotides serve as substrates for coenzymes such as nicotinamide adenine dinucleotide (NADH) and coenzyme A (CoA), which are essential for cellular metabolic activities, including stress signaling and the initiation of adaptive responses [54,55,56]. Purine metabolism is essential for alleviating drought and salinity stress in plants. Initially, plant cells can modify osmotic pressure in response to drought/salinity stress by adjusting the concentration of purine molecules. Then, certain compounds originating from purines can affect hormone metabolism or regulate the equilibrium of ROS and antioxidants in drought/salinity conditions [54,55,57,58]. Finally, plants may modify adenosine triphosphate (ATP) levels to cope with drought stress [54,59].
Li et al. (2025) proved that the primary trend in the gene expression profile associated with metabolic pathways, secondary metabolite biosynthesis, plant hormone signal transduction, and carbon metabolism was enhanced following drought treatment in rice [54]. Conversely, the reduced differentially expressed genes (DEGs) were predominantly associated with metabolic pathways and the manufacture of secondary metabolites. The findings of the current study revealed that under salinity stress, tomato leaves can respond to environmental changes by modulating the expression of genes associated with specific adaptive biological processes. Notably, analysis of the DEGs revealed that several genes associated with purine metabolism (Figure 17) exhibited responsiveness to salinity and ZnO NPs, suggesting that this pathway is crucial for the adaptive response to salinity stress in tomato.

5. Conclusions

In recent years, salinity stress has been considered one of the biggest challenges that face the agricultural sector. Using synthesized nanoparticles, such as ZnO NPs, is one of the promising solutions to overcome the harmful effects of salinity stress on the yield and productivity of different crops. In the current study, the foliar spray of chemically synthesized zinc oxide nanoparticles showed a significant contribution in maintaining the levels of antioxidative enzymes in the leaves of tomato plants that were stressed with the sodium chloride solution. They also showed a significant increase in the level of those enzymes in the treatments that were not stressed but sprayed with the ZnO nanoparticles.
The expression level of set genes that may contribute to different synthesis or metabolic pathways was studied. It was found that the foliar spray of ZnO NPs to the salinity-stressed tomato plants positively affected the gene expression level of the stress-responsive genes that trigger the plants to accumulate some helpful biomolecules, which are crucial for stress tolerance. Our previous study examined the impact of severe salt stress (0.15 M NaCl) on plant growth by investigating plant height, stem width, leaf area, and chlorophyll content. The outcomes varied based on the dosage of ZnO-NPs applied to the plants (0.075 and 0.15 g/L). At elevated NaCl concentrations (0.15 M), the chlorophyll content, plant height, stem diameter, and leaf area all decreased. Nonetheless, the use of ZnO NPs as a foliar spray mitigated the adverse impact on chlorophyll content and the growth parameters of tomato plants.
Further studies on the combination of using some salted soil amendments and foliar application with ZnO NPs would be useful in the future to elucidate the molecular mechanism of ZnO NP-induced alterations in soil microorganisms’ diversity and functions. ZnO NPs, as a foliar spray, mitigated the adverse impact on chlorophyll content and growth parameters, which can in part be explained by the findings of the present research. They are promising regulators for the environmental stresses in the plants through triggering variant physiological processes and enhancing the defensive mechanisms in the plants.

Supplementary Materials

The following supporting information can be downloaded at: https://www.mdpi.com/article/10.3390/agronomy15071715/s1, Supplementary Excel file 1. Table S1-1: Count table of the de novo transcript; Table S1-2: Increased and reduced supertranscript genes. Supplementary Excel file 2. Table S2-1: Increased and reduced contigs_Tomato_control_vs_salt stress (T1 vs. T4); Table S2-2: Increased and reduced contigs_Tomato_control_vs_ZnONPs_0.075 g/L (T1 vs. T2); Table S2-3: Increased and reduced contigs_Tomato_control_vs_ZnO NPs_0.15 g/L (T1 vs. T3); Table S2-4: Increased and reduced contigs_Tomato_control_vs_salt+ZnO NPs_0.075 g/L (T1 vs. T5); Table S2-5: Increased and reduced contigs_Tomato_control_vs_salt+ZnO NPs_0.15 g/L (T1 vs. T6); Table S2-6: Increased and reduced contigs_Tomato_salt_vs_salt+ZnO NPs_0.075 g/L (T4 vs. T5); Table S2-7: Increased and reduced contigs_Tomato_salt_vs_salt+ZnO NPs_0.15 g/L (T4 vs. T6). Supplementary Excel file 3. Table S3-1: Combined pathway analysis using the plant reactome and KEGG databases of blasted, mapped, and annotated increased and reduced contigs_Tomato_control_vs_salt stress (T1 vs. T4); Table S3-2: Combined pathway analysis using the plant reactome and KEGG databases of blasted, mapped, and annotated increased and reduced contigs_Tomato_control_vs_ZnONPs_0.075 g/L (T1 vs. T2); Table S3-3: Combined pathway analysis using the plant reactome and KEGG databases of blasted, mapped, and annotated increased and reduced contigs_Tomato_control_vs_ZnONPs_0.15 g/L (T1 vs. T3); Table S3-4: Combined pathway analysis using the plant reactome and KEGG databases of blasted, mapped, and annotated increased and reduced contigs_Tomato_control_vs_salt+ZnO NPs_0.075 g/L (T1 vs. T5); Table S3-5: Combined pathway analysis using the plant reactome and KEGG databases of blasted, mapped, and annotated increased and reduced contigs_Tomato_control_vs_salt+ZnO NPs_0.15 g/L (T1 vs. T6); Table S3-6: Combined pathway analysis using the plant reactome and KEGG databases of blasted, mapped, and annotated increased and reduced contigs_Tomato_salt_vs_salt+ZnO NPs_0.075 g/L (T4 vs. T5); Table S3-7: Combined pathway analysis using the plant reactome and KEGG databases of blasted, mapped, and annotated increased and reduced contigs_Tomato_salt_vs_salt+ZnO NPs_0.15 g/L (T4 vs. T6). Supplementary Excel file 4. Table S4-1: Pairwise analysis of Top 50 increased and reduced blasted, mapped, and annotated contigs_Tomato_control_vs_salt stress (T1 vs. T4); Table S4-2: Pairwise analysis of Top 50 increased and reduced blasted, mapped, and annotated contigs_Tomato_control_vs_ZnONPs_0.075 g/L (T1 vs. T2); Table S4-3: Pairwise analysis of Top 50 increased and reduced blasted, mapped, and annotated contigs_Tomato_control_vs_ZnO NPs_0.15 g/L (T1 vs. T3); Table S4-4: Pairwise analysis of Top 50 increased and reduced blasted, mapped, and annotated contigs_Tomato_control_vs_salt+ZnO NPs_0.075 g/L (T1 vs. T5); Table S4-5: Pairwise analysis of Top 50 increased and reduced blasted, mapped, and annotated contigs_Tomato_control_vs_salt+ZnO NPs_0.15 g/L (T1 vs. T6); Table S4-6: Pairwise analysis of Top 50 increased and reduced blasted, mapped, and annotated contigs_Tomato_salt_vs_salt+ZnO NPs_0.075 g/L (T4 vs. T5); Table S4-7: Pairwise analysis of Top 50 increased and reduced blasted, mapped, and annotated contigs_Tomato_salt_vs_salt+ZnO NPs_0.15 g/L (T4 vs. T6). Supplementary Excel file 5. Table S5-1: Heat map and top 50 DEG contigs_Tomato_control_vs_salt stress (T1 vs. T4); Table S5-2: Heat map and top 50 DEG contigs_Tomato_control_vs_ZnONPs_0.075 g/L (T1 vs. T2); Table S5-3: Heat map and top 50 DEG contigs_Tomato_control_vs_ZnO NPs_0.15 g/L (T1 vs. T3); Table S5-4: Heat map and top 50 DEG contigs_Tomato_control_vs_salt+ZnO NPs_0.075 g/L (T1 vs. T5); Table S5-5: Heat map and top 50 DEG contigs_Tomato_control_vs_salt+ZnO NPs_0.15 g/L (T1 vs. T6); Table S5-6: Heat map and top 50 DEG contigs_Tomato_salt_vs_salt+ZnO NPs_0.075 g/L (T4 vs. T5); Table S5-7: Heat map and top 50 DEG contigs_Tomato_salt_vs_salt+ZnO NPs_0.15 g/L (T4 vs. T6). Supplementary Excel file 6. Table S6-1: Pathways and their increased sequences linked to Solanum lycopersicum in the plant reactome database_Tomato_control_vs_salt stress (T1 vs. T4); Table S6-2: Pathways and their reduced sequences linked to Solanum lycopersicum in the plant reactome database_Tomato_control_vs_salt stress (T1 vs. T4); Table S6-3: Pathways and their increased sequences linked to Solanum lycopersicum in the plant reactome database__Tomato_control_vs_ZnONPs_0.075 g/L (T1 vs. T2); Table S6-4: Pathways and their reduced sequences linked to Solanum lycopersicum in the plant reactome database__Tomato_control_vs_ZnONPs_0.075 g/L (T1 vs. T2); Table S6-5: Pathways and their increased sequences linked to Solanum lycopersicum in the plant reactome database_Tomato_control_vs_ZnO NPs_0.15 g/L (T1 vs. T3); Table S6-6: Pathways and their reduced sequences linked to Solanum lycopersicum in the plant reactome database_Tomato_control_vs_ZnO NPs_0.15 g/L (T1 vs. T3); Table S6-7: Pathways and their increased sequences linked to Solanum lycopersicum in the plant reactome database_Tomato_control_vs_salt+ZnO NPs_0.075 g/L (T1 vs. T5); Table S6-8: Pathways and their reduced sequences linked to Solanum lycopersicum in the plant reactome database_Tomato_control_vs_salt+ZnO NPs_0.075 g/L (T1 vs. T5); Table S6-9: Pathways and their increased sequences linked to Solanum lycopersicum in the plant reactome database_Tomato_control_vs_salt+ZnO NPs_0.15 g/L (T1 vs. T6); Table S6-10: Pathways and their reduced sequences linked to Solanum lycopersicum in the plant reactome database_Tomato_control_vs_salt+ZnO NPs_0.15 g/L (T1 vs. T6); Table S6-11: Pathways and their increased sequences linked to Solanum lycopersicum in the plant reactome database_Tomato_salt_vs_salt+ZnO NPs_0.075 g/L (T4 vs. T5); Table S6-12: Pathways and their reduced sequences linked to Solanum lycopersicum in the plant reactome database_Tomato_salt_vs_salt+ZnO NPs_0.075 g/L (T4 vs. T5); Table S6-13: Pathways and their increased sequences linked to Solanum lycopersicum in the plant reactome database_Tomato_salt_vs_salt+ZnO NPs_0.15 g/L (T4 vs. T6), Table S6-14: Pathways and their reduced sequences linked to Solanum lycopersicum in the plant reactome database_Tomato_salt_vs_salt+ZnO NPs_0.15 g/L (T4 vs. T6). Supplementary Excel file 7. Table S7-1: Pathways and their sequences linked to KEGG database_Tomato_control_vs_salt stress (T1 vs. T4); Table S7-2: Pathways and their sequences linked to KEGG database; Table S7-3: Pathways and their sequences linked to KEGG database_Tomato_control_vs_ZnO NPs_0.15 g/L (T1 vs. T3); Table S7-4: Pathways and their sequences linked to KEGG database_Tomato_control_vs_salt+ZnO NPs_0.075 g/L (T1 vs. T5); Table S7-5: Pathways and their sequences linked to KEGG database_Tomato_control_vs_salt+ZnO NPs_0.15 g/L (T1 vs. T6); Table S7-6: Pathways and their sequences linked to KEGG database_Tomato_salt_vs_salt+ZnO NPs_0.075 g/L (T4 vs. T5); Table S7-7: Pathways and their sequences linked to KEGG database_Tomato_salt_vs_salt+ZnO NPs_0.15 g/L (T4 vs. T6).

Author Contributions

Conceptualization, M.A. and K.D.; data curation, M.A., K.D., R.R. and D.A.-H.; formal analysis, M.A. and K.D.; funding acquisition, Z.T.; investigation, M.A., K.D., R.R. and Z.T.; methodology, M.A. and K.D.; project administration, K.D. and Z.T.; resources, Z.T.; software, M.A., K.D. and Z.T.; supervision, K.D. and Z.T.; validation, M.A., K.D., R.R. and D.A.-H.; visualization, M.A., K.D., D.A.-H. and R.R.; writing—original draft, M.A.; writing—review and editing, M.A., K.D., R.R., D.A.-H. and Z.T. All authors have read and agreed to the published version of the manuscript.

Funding

The Hungarian University of Agriculture and Life Sciences Research Excellence Programme and Flagship Research Groups Programme supported this work.

Institutional Review Board Statement

Not applicable.

Data Availability Statement

Data are available at the following link: https://doi.org/10.1016/j.dib.2025.111282.

Conflicts of Interest

The authors declare no conflicts of interest.

References

  1. Corma, A.; Iborra, S.; Velty, A. Chemical Routes for the Transformation of Biomass into Chemicals. Chem. Rev. 2007, 107, 2411–2502. [Google Scholar] [CrossRef] [PubMed]
  2. Isikgor, F.H.; Remzi Becer, C. Lignocellulosic Biomass: A Sustainable Platform for the Production of Bio-Based Chemicals and Polymers. Polym. Chem. 2015, 6, 4497–4559. [Google Scholar] [CrossRef]
  3. Bazzarelli, F.; Mazzei, R.; Papaioannou, E.; Giannakopoulos, V.; Roberts, M.R.; Giorno, L. Biorefinery of Tomato Leaves by Integrated Extraction and Membrane Processes to Obtain Fractions That Enhance Induced Resistance against Pseudomonas syringae Infection. Membranes 2022, 12, 585. [Google Scholar] [CrossRef] [PubMed]
  4. Trouvelot, S.; Héloir, M.-C.; Poinssot, B.; Gauthier, A.; Paris, F.; Guillier, C.; Combier, M.; Trdá, L.; Daire, X.; Adrian, M. Carbohydrates in Plant Immunity and Plant Protection: Roles and Potential Application as Foliar Sprays. Front. Plant Sci. 2014, 5, 592. [Google Scholar] [CrossRef] [PubMed]
  5. Friedman, M. Nutritional Value of Proteins from Different Food Sources. A Review. J. Agric. Food Chem. 1996, 44, 6–29. [Google Scholar] [CrossRef]
  6. Chaudhary, P.; Sharma, A.; Singh, B.; Nagpal, A.K. Bioactivities of Phytochemicals Present in Tomato. J. Food Sci. Technol. 2018, 55, 2833–2849. [Google Scholar] [CrossRef] [PubMed]
  7. Campbell, R.; Freitag, S.; Bryan, G.J.; Stewart, D.; Taylor, M.A. Environmental and Genetic Factors Associated with Solanesol Accumulation in Potato Leaves. Front. Plant Sci. 2016, 7, 1263. [Google Scholar] [CrossRef] [PubMed]
  8. Taylor, M.A.; Fraser, P.D. Solanesol: Added Value from Solanaceous Waste. Phytochemistry 2011, 72, 1323–1327. [Google Scholar] [CrossRef] [PubMed]
  9. Faizan, M.; Bhat, J.A.; Chen, C.; Alyemeni, M.N.; Wijaya, L.; Ahmad, P.; Yu, F. Zinc Oxide Nanoparticles (ZnO-NPs) Induce Salt Tolerance by Improving the Antioxidant System and Photosynthetic Machinery in Tomato. Plant Physiol. Biochem. 2021, 161, 122–130. [Google Scholar] [CrossRef] [PubMed]
  10. Dietz, K.-J.; Herth, S. Plant Nanotoxicology. Trends Plant Sci. 2011, 16, 582–589. [Google Scholar] [CrossRef] [PubMed]
  11. Ahmed, M.; Marrez, D.A.; Rizk, R.; Zedan, M.; Abdul-Hamid, D.; Decsi, K.; Kovács, G.P.; Tóth, Z. The Influence of Zinc Oxide Nanoparticles and Salt Stress on the Morphological and Some Biochemical Characteristics of Solanum Lycopersicum L. Plants. Plants 2024, 13, 1418. [Google Scholar] [CrossRef] [PubMed]
  12. Ahmed, M.; Marrez, D.A.; Rizk, R.; Abdul-Hamid, D.; Tóth, Z.; Decsi, K. Interventional Effect of Zinc Oxide Nanoparticles with Zea mays L. Plants When Compensating Irrigation Using Saline Water. Nanomaterials 2024, 14, 1341. [Google Scholar] [CrossRef] [PubMed]
  13. Ahmed, M.; Tóth, Z.; Decsi, K. The Impact of Salinity on Crop Yields and the Confrontational Behavior of Transcriptional Regulators, Nanoparticles, and Antioxidant Defensive Mechanisms under Stressful Conditions: A Review. Int. J. Mol. Sci. 2024, 25, 2654. [Google Scholar] [CrossRef] [PubMed]
  14. Venkatachalam, P.; Jayaraj, M.; Manikandan, R.; Geetha, N.; Rene, E.R.; Sharma, N.C.; Sahi, S.V. Zinc Oxide Nanoparticles (ZnONPs) Alleviate Heavy Metal-Induced Toxicity in Leucaena leucocephala Seedlings: A Physiochemical Analysis. Plant Physiol. Biochem. 2017, 110, 59–69. [Google Scholar] [CrossRef] [PubMed]
  15. Ahmed, M.; Decsi, K.; Tóth, Z. Different Tactics of Synthesized Zinc Oxide Nanoparticles, Homeostasis Ions, and Phytohormones as Regulators and Adaptatively Parameters to Alleviate the Adverse Effects of Salinity Stress on Plants. Life 2023, 13, 73. [Google Scholar] [CrossRef] [PubMed]
  16. Gaafar, R.; Diab, R.; Halawa, M.; Elshanshory, A.; El-Shaer, A.; Hamouda, M. Role of Zinc Oxide Nanoparticles in Ameliorating Salt Tolerance in Soybean. Egypt. J. Bot. 2020, 60, 733–747. [Google Scholar] [CrossRef]
  17. Van Dijk, E.L.; Jaszczyszyn, Y.; Thermes, C. Library Preparation Methods for Next-Generation Sequencing: Tone down the Bias. Exp. Cell Res. 2014, 322, 12–20. [Google Scholar] [CrossRef] [PubMed]
  18. Parkhomchuk, D.; Borodina, T.; Amstislavskiy, V.; Banaru, M.; Hallen, L.; Krobitsch, S.; Lehrach, H.; Soldatov, A. Transcriptome Analysis by Strand-Specific Sequencing of Complementary DNA. Nucleic Acids Res. 2009, 37, e123. [Google Scholar] [CrossRef] [PubMed]
  19. Sun, L.; Wang, Y.; Wang, R.; Wang, R.; Zhang, P.; Ju, Q.; Xu, J. Physiological, Transcriptomic, and Metabolomic Analyses Reveal Zinc Oxide Nanoparticles Modulate Plant Growth in Tomato. Environ. Sci. Nano 2020, 7, 3587–3604. [Google Scholar] [CrossRef]
  20. Ahmed, M.; Tóth, Z.; Marrez, D.A.; Rizk, R.; Abdul-Hamid, D.; Decsi, K. Transcriptome Datasets of Salt-Stressed Tomato Plants Treated with Zinc Oxide Nanoparticles. Data Brief 2025, 58, 111282. [Google Scholar] [CrossRef] [PubMed]
  21. Gupta, A.; Bharati, R.; Kubes, J.; Popelkova, D.; Praus, L.; Yang, X.; Severova, L.; Skalicky, M.; Brestic, M. Zinc Oxide Nanoparticles Application Alleviates Salinity Stress by Modulating Plant Growth, Biochemical Attributes and Nutrient Homeostasis in Phaseolus vulgaris L. Front. Plant Sci. 2024, 15, 1432258. [Google Scholar] [CrossRef] [PubMed]
  22. Venisse, J.-S.; Gullner, G.; Brisset, M.-N. Evidence for the Involvement of an Oxidative Stress in the Initiation of Infection of Pear by Erwinia Amylovora. Plant Physiol. 2001, 125, 2164–2172. [Google Scholar] [CrossRef] [PubMed]
  23. Chance, B.; Maehly, A.C. Assay of Catalases and Peroxidases. In Methods in Enzymology; Academic Press: Cambridge, MA, USA, 1955; Volume 2, pp. 764–775. [Google Scholar]
  24. Habig, W.H.; Pabst, M.J.; Jakoby, W.B. Glutathione S-transferases: The first enzymatic step in mercapturic acid formation. J. Biol. Chem. 1974, 249, 7130–7139. [Google Scholar] [CrossRef] [PubMed]
  25. Beauchamp, C.; Fridovich, I. Superoxide Dismutase: Improved Assays and an Assay Applicable to Acrylamide Gels. Anal. Biochem. 1971, 44, 276–287. [Google Scholar] [CrossRef] [PubMed]
  26. Bonnichsen, R.K.; Chance, B.; Theorell, H. Catalase Activity. Acta Chem. Scand. 1947, 1, 685–709. [Google Scholar] [CrossRef]
  27. Maehly, A.C. The Assay of Catalases and Peroxidases. In Methods of Biochemical Analysis; Wiley: Hoboken, NJ, USA, 1954; pp. 357–424. [Google Scholar]
  28. Wingett, S.W.; Andrews, S. FastQ Screen: A Tool for Multi-Genome Mapping and Quality Control. F1000Res 2018, 7, 1338. [Google Scholar] [CrossRef] [PubMed]
  29. Bolger, A.M.; Lohse, M.; Usadel, B. Trimmomatic: A Flexible Trimmer for Illumina Sequence Data. Bioinformatics 2014, 30, 2114–2120. [Google Scholar] [CrossRef] [PubMed]
  30. Grabherr, M.G.; Haas, B.J.; Yassour, M.; Levin, J.Z.; Thompson, D.A.; Amit, I.; Adiconis, X.; Fan, L.; Raychowdhury, R.; Zeng, Q.; et al. Full-Length Transcriptome Assembly from RNA-Seq Data without a Reference Genome. Nat. Biotechnol. 2011, 29, 644–652. [Google Scholar] [CrossRef] [PubMed]
  31. Li, B.; Dewey, C.N. RSEM: Accurate Transcript Quantification from RNA-Seq Data with or without a Reference Genome. BMC Bioinform. 2011, 12, 323. [Google Scholar] [CrossRef] [PubMed]
  32. OmicsBox. Bioinformatics Made Easy; BioBam Bioinformatics: Valencia, Spain, 2019. [Google Scholar]
  33. Berkhout, S.W.; Haaf, J.M.; Gronau, Q.F.; Heck, D.W.; Wagenmakers, E.-J. A Tutorial on Bayesian Model-Averaged Meta-Analysis in JASP. Behav. Res. 2024, 56, 1260–1282. [Google Scholar] [CrossRef]
  34. Hoffmann, T.; Hofman, A.; Wagenmakers, E.-J. Bayesian Tests of Two Proportions: A Tutorial With R and JASP. Methodology 2022, 18, 239–277. [Google Scholar] [CrossRef]
  35. Fabregat, A.; Jupe, S.; Matthews, L.; Sidiropoulos, K.; Gillespie, M.; Garapati, P.; Haw, R.; Jassal, B.; Korninger, F.; May, B.; et al. The Reactome Pathway Knowledgebase. Nucleic Acids Res. 2018, 46, D649–D655. [Google Scholar] [CrossRef] [PubMed]
  36. Kanehisa, M.; Goto, S. KEGG: Kyoto Encyclopedia of Genes and Genomes. Nucleic Acids Res. 2000, 28, 27–30. [Google Scholar] [CrossRef] [PubMed]
  37. Mishra, N.; Jiang, C.; Chen, L.; Paul, A.; Chatterjee, A.; Shen, G. Achieving Abiotic Stress Tolerance in Plants through Antioxidative Defense Mechanisms. Front. Plant Sci. 2023, 14, 1110622. [Google Scholar] [CrossRef] [PubMed]
  38. Ali, L.; Shaheen, M.R.; Ihsan, M.Z.; Masood, S.; Zubair, M.; Shehzad, F.; Khalid, A.-U.-H. Growth, Photosynthesis and Antioxidant Enzyme Modulations in Broccoli (Brassica oleracea L. Var. Italica) under Salinity Stress. South Afr. J. Bot. 2022, 148, 104–111. [Google Scholar] [CrossRef]
  39. Demidchik, V. Mechanisms of Oxidative Stress in Plants: From Classical Chemistry to Cell Biology. Environ. Exp. Bot. 2015, 109, 212–228. [Google Scholar] [CrossRef]
  40. El-Zohri, M.; Al-Wadaani, N.A.; Bafeel, S.O. Foliar Sprayed Green Zinc Oxide Nanoparticles Mitigate Drought-Induced Oxidative Stress in Tomato. Plants 2021, 10, 2400. [Google Scholar] [CrossRef] [PubMed]
  41. Smirnoff, N. Plant Resistance to Environmental Stress. Curr. Opin. Biotechnol. 1998, 9, 214–219. [Google Scholar] [CrossRef] [PubMed]
  42. Chawla, L.S.; Beers-Mulroy, B.; Tidmarsh, G.F. Therapeutic Opportunities for Hepcidin in Acute Care Medicine. Crit. Care Clin. 2019, 35, 357–374. [Google Scholar] [CrossRef] [PubMed]
  43. Vokkaliga, T.H.; Wu, T.-M.; Hong, C.-Y. Glutathione Reductase and Abiotic Stress Tolerance in Plants. In Glutathione in Plant Growth, Development, and Stress Tolerance; Springer: Berlin/Heidelberg, Germany, 2017; pp. 265–286. ISBN 978-3-319-66681-5. [Google Scholar]
  44. Csiszár, J.; Horváth, E.; Váry, Z.; Gallé, Á.; Bela, K.; Brunner, S.; Tari, I. Glutathione Transferase Supergene Family in Tomato: Salt Stress-Regulated Expression of Representative Genes from Distinct GST Classes in Plants Primed with Salicylic Acid. Plant Physiol. Biochem. 2014, 78, 15–26. [Google Scholar] [CrossRef] [PubMed]
  45. Dixon, D.P.; Edwards, R. Glutathione Transferases. Arab. Book Am. Soc. Plant Biol. 2010, 8, e0131. [Google Scholar] [CrossRef] [PubMed]
  46. Mittova, V.; Guy, M.; Tal, M.; Volokita, M. Salinity Up-regulates the Antioxidative System in Root Mitochondria and Peroxisomes of the Wild Salt-tolerant Tomato Species Lycopersicon pennellii. J. Exp. Bot. 2004, 55, 1105–1113. [Google Scholar] [CrossRef] [PubMed]
  47. Shalata, A.; Neumann, P.M. Exogenous Ascorbic Acid (Vitamin C) Increases Resistance to Salt Stress and Reduces Lipid Peroxidation. J. Exp. Bot. 2001, 52, 2207–2211. [Google Scholar] [CrossRef] [PubMed]
  48. Meneguzzo, S.; Navari-Izzo, F.; Izzo, R. Antioxidative Responses of Shoots and Roots of Wheat to Increasing NaCl Concentrations. J. Plant Physiol. 1999, 155, 274–280. [Google Scholar] [CrossRef]
  49. Decsi, K.; Ahmed, M.; Abdul-Hamid, D.; Rizk, R.; Tóth, Z. Verification of Seed-Priming-Induced Stress Memory by Genome-Wide Transcriptomic Analysis in Wheat (Triticum aestivum L.). Agronomy 2025, 15, 1365. [Google Scholar] [CrossRef]
  50. Li, W.; Mi, X.; Jin, X.; Zhang, D.; Zhu, G.; Shang, X.; Zhang, D.; Guo, W. Thiamine Functions as a Key Activator for Modulating Plant Health and Broad-Spectrum Tolerance in Cotton. Plant J. 2022, 111, 374–390. [Google Scholar] [CrossRef] [PubMed]
  51. Yusof, Z.N.B. Thiamine and Its Role in Protection Against Stress in Plants (Enhancement in Thiamine Content for Nutritional Quality Improvement). In Nutritional Quality Improvement in Plants; Jaiwal, P.K., Chhillar, A.K., Chaudhary, D., Jaiwal, R., Eds.; Springer International Publishing: Cham, Germany, 2019; pp. 177–186. ISBN 978-3-319-95354-0. [Google Scholar]
  52. Goyer, A. Thiamine in Plants: Aspects of Its Metabolism and Functions. Phytochemistry 2010, 71, 1615–1624. [Google Scholar] [CrossRef] [PubMed]
  53. Tunc-Ozdemir, M.; Miller, G.; Song, L.; Kim, J.; Sodek, A.; Koussevitzky, S.; Misra, A.N.; Mittler, R.; Shintani, D. Thiamin Confers Enhanced Tolerance to Oxidative Stress in Arabidopsis. Plant Physiol. 2009, 151, 421–432. [Google Scholar] [CrossRef] [PubMed]
  54. Li, Y.; Ye, Z.; Xiang, J.; Li, S.; Zheng, Z.; Li, Y.; Fang, Y.; Zhang, X.; Chen, X.; Xue, D. Purine Nucleotide Metabolism Response to Drought Stress in Rice. Plant Growth Regul. 2025, 105, 821–832. [Google Scholar] [CrossRef]
  55. Sun, L.R.; Zhao, Z.J.; Hao, F.S. NADPH Oxidases, Essential Players of Hormone Signalings in Plant Development and Response to Stresses. Plant Signal. Behav. 2019, 14, 1657343. [Google Scholar] [CrossRef] [PubMed]
  56. Zrenner, R.; Stitt, M.; Sonnewald, U.; Boldt, R. Pyrimidine and Purine Biosynthesis and Degradation in plants. Annu. Rev. Plant Biol. 2006, 57, 805–836. [Google Scholar] [CrossRef] [PubMed]
  57. Watanabe, S.; Matsumoto, M.; Hakomori, Y.; Takagi, H.; Shimada, H.; Sakamoto, A. The Purine Metabolite Allantoin Enhances Abiotic Stress Tolerance through Synergistic Activation of Abscisic Acid Metabolism. Plant Cell Environ. 2014, 37, 1022–1036. [Google Scholar] [CrossRef] [PubMed]
  58. Werner, A.K.; Witte, C.-P. The Biochemistry of Nitrogen Mobilization: Purine Ring Catabolism. Trends Plant Sci. 2011, 16, 381–387. [Google Scholar] [CrossRef] [PubMed]
  59. Qiao, M.; Hong, C.; Jiao, Y.; Hou, S.; Gao, H. Impacts of Drought on Photosynthesis in Major Food Crops and the Related Mechanisms of Plant Responses to Drought. Plants 2024, 13, 1808. [Google Scholar] [CrossRef] [PubMed]
Figure 1. The effects of different treatments on the concentration of glutathione reductase (GR) enzyme in tomato leaves. Data represent the mean plus or minus the standard error. Mean values sharing the same letter above the bar exhibited no statistically significant difference at p < 0.05. T1: control (untreated) (distilled water ‘dw’); T2: (dw + ZnO NPs at 0.075 g/L); T3: (dw + ZnO NPs at 0.15 g/L); T4: sodium chloride (0.15 M); T5: (0.15 M NaCl + 0.075 g/L ZnO NPs); T6: (0.15 M NaCl + 0.15 g/L ZnO NPs).
Agronomy 15 01715 g001
Figure 2. The effects of different treatments on the concentration of peroxidase (POX) enzyme in tomato leaves. Data represent the mean plus or minus the standard error. Mean values sharing the same letter above the bar exhibited no statistically significant difference at p < 0.05. T1: control (untreated) (distilled water ‘dw’); T2: (dw + ZnO NPs at 0.075 g/L); T3: (dw + ZnO NPs at 0.15 g/L); T4: Sodium chloride (0.15 M); T5: (0.15 M NaCl + 0.075 g/L ZnO NPs); T6: (0.15 M NaCl + 0.15 g/L ZnO NPs).
Agronomy 15 01715 g002
Figure 3. The effects of different treatments on the concentration of glutathione-s-transferase (GST) enzyme in tomato leaves. Data represent the mean plus or minus the standard error. Mean values sharing the same letter above the bar exhibited no statistically significant difference at p < 0.05. T1: control (untreated) (distilled water ‘dw’); T2: (dw + ZnO NPs at 0.075 g/L); T3: (dw + ZnO NPs at 0.15 g/L); T4: Sodium chloride (0.15 M); T5: (0.15 M NaCl + 0.075 g/L ZnO NPs); T6: (0.15 M NaCl + 0.15 g/L ZnO NPs).
Agronomy 15 01715 g003
Figure 4. The effects of different treatments on the concentration of superoxide dismutase (SOD) enzyme in tomato leaves. Data represent the mean plus or minus the standard error. Mean values sharing the same letter above the bar exhibited no statistically significant difference at p < 0.05. T1: control (untreated) (distilled water ‘dw’); T2: (dw + ZnO NPs at 0.075 g/L); T3: (dw + ZnO NPs at 0.15 g/L); T4: sodium chloride (0.15 M); T5: (0.15 M NaCl + 0.075 g/L ZnO NPs); T6: (0.15 M NaCl + 0.15 g/L ZnO NPs).
Agronomy 15 01715 g004
Figure 5. The effects of different treatments on the concentration of catalase (CAT) enzyme in tomato leaves. Data represent the mean plus or minus the standard error. Mean values sharing the same letter above the bar exhibited no statistically significant difference at p < 0.05. T1: control (untreated) (distilled water ‘dw’); T2: (dw + ZnO NPs at 0.075 g/L); T3: (dw + ZnO NPs at 0.15 g/L); T4: sodium chloride (0.15 M); T5: (0.15 M NaCl + 0.075 g/L ZnO NPs); T6: (0.15 M NaCl + 0.15 g/L ZnO NPs).
Agronomy 15 01715 g005
Figure 6. Transcript-level quantification. The figure is obtained in its original form from OmicsBox https://www.biobam.com/omicsbox/ (accessed on 14 May 2025).
Agronomy 15 01715 g006
Figure 7. Comparative transcriptome analysis of control vs. salinity-stressed treatments. Increased and reduced DEGs are observed in red and green, respectively.
Agronomy 15 01715 g007
Figure 8. Comparative transcriptome analysis of control vs. 0.075 g/L ZnO NP-sprayed treatments. Increased and reduced DEGs are observed in red and green, respectively.
Agronomy 15 01715 g008
Figure 9. Comparative transcriptome analysis of control vs. 0.15 g/L ZnO NP-sprayed treatments. Increased and reduced DEGs are observed in red and green, respectively.
Agronomy 15 01715 g009
Figure 10. Comparative transcriptome analysis of control vs. salinity-stressed and 0.075 g/L ZnO NP-sprayed treatments. Increased and reduced DEGs are observed in red and green, respectively.
Agronomy 15 01715 g010
Figure 11. Comparative transcriptome analysis of control vs. salinity-stressed and 0.15 g/L ZnO NP-sprayed treatments. Increased and reduced DEGs are observed in red and green, respectively.
Agronomy 15 01715 g011
Figure 12. Comparative transcriptome analysis of salinity-stressed vs. salinity-stressed + 0.07 g/L ZnO NP-sprayed treatments. Increased and reduced DEGs are observed in red and green, respectively.
Agronomy 15 01715 g012
Figure 13. Comparative transcriptome analysis of salinity-stressed vs. salinity-stressed + 0.15 g/L ZnO NP-sprayed treatments. Increased and reduced DEGs are observed in red and green, respectively.
Agronomy 15 01715 g013
Figure 14. Recognition of fungal and bacterial pathogens and immune response. The figure is obtained in its original form from OmicsBox https://www.biobam.com/omicsbox/ (accessed on 14 May 2025). The figure illustrates the processes activated by the identified genes. GDP: guanosine diphosphate. GTP: guanosine triphosphate. RBOHB: respiratory burst oxidative homolog. SP(L/IN): squamosa promoter binding protein. LYP4: lysin motif–containing protein. CERK1: chitin elicitor receptor kinase 1. RAC: ras-related C3 botulinum toxin substrate 1. RAC-GEF1: rac guanine nucleotide exchange factor. RLCK: receptor-like cytoplasmic kinase.
Agronomy 15 01715 g014
Figure 15. Biosynthesis of L-isoleucine amino acid (aa) from threonine (aa). The figure is obtained in its original form from OmicsBox https://www.biobam.com/omicsbox/ (accessed on 14 May 2025). The figure illustrates the processes activated by the identified genes. L-Thr: L-threonine. 2OBUTA: 2-oxobutanoate. L-Glu: L-glutamate. 2OG: 2-oxoglutarate (α-ketoglutarate). L-Ile: L-isoleucine.
Agronomy 15 01715 g015
Figure 16. Induction of thiamine metabolism-activating enzymes during salinity stress. The figure is obtained in its original form from OmicsBox software https://www.biobam.com/omicsbox/ (accessed on 14 May 2025) and is presented in its original form. Genes start subprocesses, as shown in the picture. The letters stand for all the genes and enzymes (EC: code classification name) that are part of the biochemical pathway. The colors show how essential the treatment effects are.
Agronomy 15 01715 g016
Figure 17. Induction of purine metabolism activating enzymes during salinity stress. The figure is obtained in its original form from OmicsBox software https://www.biobam.com/omicsbox/ (accessed on 14 May 2025) and is presented in its original form. Genes start subprocesses, as shown in the picture. The letters stand for all the genes and enzymes (EC: code classification name) that are part of the biochemical pathway. The colors show how essential the treatment effects are.
Agronomy 15 01715 g017
Table 1. Possible pathways of the top 50 increased and reduced sequences according to the KEGG database.
ComparisonPathways Linked to KEGGNo. of Sequences Linked to KEGG Database
T1 vs. T4Fatty acid elongation, Biosynthesis of unsaturated fatty acids, Brassinosteroid and Phenylpropanoid biosynthesis, Steroids and steroid hormone biosynthesis, Metabolism of Phenylalanine, Ascorbate and aldarate, Purine, Glycerolipid, Inositol phosphate, Riboflavin, and Thiamine.19
T1 vs. T2Metabolism of Purine, Glycerolipid, Riboflavin, and Thiamine. Steroid degradation, Terpenoid backbone biosynthesis, Steroid hormone biosynthesis, and Brassinosteroid biosynthesis.10
T1 vs. T3Metabolism of Nicotinate and nicotinamide, Porphyrin, Glyoxylate and dicarboxylate, Phenylalanine, Ascorbate and aldarate, Purine and pyrimidine, Glycerolipid, Inositol phosphate, Riboflavin, and Thiamine. Pantothenate and CoA biosynthesis.20
T1 vs. T5Metabolism of Purine and Pyrimidine, Ascorbate and aldarate, Methane, Nicotinate and nicotinamide, Inositol phosphate, Riboflavin, Drugs/other enzymes, Thiamine, Pyruvate, Starch and sucrose, Oxidative phosphorylation, Citrate cycle, Glycolysis, Pantothenate and CoA biosynthesis, Carbon fixation pathways in prokaryotes, Gluconeogenesis, and Carbon fixation in photosynthetic organisms.26
T1 vs. T6Metabolism of Thiamine, Starch and sucrose, Galactose, Glycerolipid, and Riboflavin. Phenylpropanoid biosynthesis, Oxidative phosphorylation, and Photosynthesis, 10
T4 vs. T5Metabolism of xenobiotics by cytochrome P450, Thiamine, Drugs/other enzymes, Glutathione, Purine, and Amino sugar and nucleotide sugar. Tight junction, Longevity-regulating pathway—worm, MAPK signaling pathway—yeast, Endocytosis, and Ubiquitin-mediated proteolysis.11
T4 vs. T6Cysteine and methionine metabolism, Arachidonic acid, Linoleic acid, Tyrosine, Purine, Sulfur metabolism, and Thiamine. Synthesis and secretion of cortisol, Prolactin signaling pathway, Steroid hormone biosynthesis, Ovarian steroidogenesis, Serotonergic synapse, Isoquinoline alkaloid biosynthesis, Inflammatory mediator regulation of TRP channels, Tight junction, Biosynthesis of various antibiotics, MAPK signaling pathway—yeast, Endocytosis, Monoterpenoid biosynthesis, Ubiquitin-mediated proteolysis, and Diterpenoid biosynthesis.24
T1: control (non-treated) (dw). T2: (dw + ZnO NPs 0.075 g/L). T3: (dw + ZnO NPs 0.15 g/L). T4: NaCl (0.15 M). T5: (0.15 M NaCl + ZnO NPs 0.075 g/L). T6: (0.15 M NaCl + ZnO NPs 0.15 g/L).
Table 2. Selected possible pathways in the KEGG database for the highest and most common supertranscript with increased and reduced sequences.
ComparisonPathways Linked to the KEGG Database and Their Responsible Sequences
Increased Sequences Reduced Sequences
T1 vs. T4
(Table S7-1)
  • Metabolism of Purine 23
  • Metabolism of Thiamine 18
  • Carbon fixation by the Calvin cycle 15
  • Methane metabolism 13
  • Metabolism of Starch and sucrose 13
  • Metabolism of Purine 43
  • Metabolism of Thiamine 38
  • Metabolism of Starch and sucrose 25
  • Pentose and glucuronate interconversions 19
  • Phenylpropanoid biosynthesis 16
T1 vs. T2
(Table S7-2)
  • Metabolism of Purine 24
  • Metabolism of Thiamine 22
  • Metabolism of Purine 21
  • Metabolism of Thiamine 20
T1 vs. T3
(Table S7-3)
  • Metabolism of Thiamine 12
  • Metabolism of Purine 10
  • Glyoxylate and dicarboxylate metabolism 6
  • Metabolism of Starch and sucrose 6
  • Thiamine metabolism 12
  • Metabolism of Purine 10
  • Glyoxylate and dicarboxylate metabolism 6
  • Metabolism of Starch and sucrose 6
T1 vs. T5
(Table S7-4)
  • Metabolism of Purine 18
  • Metabolism of Thiamine 16
  • Metabolism of Starch and sucrose 10
  • Metabolism of Purine 108
  • Metabolism of Thiamine 95
  • Metabolism of Starch and sucrose 38
T1 vs. T6
(Table S7-5)
  • Carbon fixation by Calvin cycle 41
  • Methane metabolism 37
  • Glycine, serine, and threonine metabolism 35
  • Glyoxylate and dicarboxylate metabolism 32
  • Purine metabolism 31
  • Thiamine metabolism 30
  • Glycolysis/Gluconeogenesis 28
  • Fructose and mannose metabolism 23
  • Pentose phosphate pathway 21
  • Lipoic acid metabolism 19
  • Cysteine and methionine metabolism 15
  • Tryptophan metabolism 11
  • Pyruvate metabolism 11
  • Metabolism of Purine 63
  • Metabolism of Thiamine 59
  • Metabolism of Starch and sucrose 31
  • Phenylpropanoid biosynthesis 22
  • Pentose and glucuronate interconversions 18
  • Oxidative phosphorylation 17
  • Cyanoamino acid metabolism 16
  • Glycerophospholipid metabolism 15
  • Biosynthesis of various plant secondary metabolites 15
  • Degradation of flavonoids 14
T4 vs. T5
(Table S7-6)
  • Metabolism of Purine 5
  • Metabolism of Thiamine 5
  • Phenylpropanoid biosynthesis 4
  • Metabolism of Purine 5
  • Metabolism of Thiamine 5
  • Phenylpropanoid biosynthesis 4
T4 vs. T6
(Table S7-7)
  • Metabolism of Purine 8
  • Metabolism of Thiamine 8
  • Pentose and glucuronate interconversions 6
  • Phenylpropanoid biosynthesis 9
  • Oxidative phosphorylation 6
  • Phenylalanine metabolism 6
T1: control (non-treated) (dw). T2: (dw + ZnO NPs 0.075 g/L). T3: (dw + ZnO NPs 0.15 g/L). T4: NaCl (0.15 M). T5: (0.15 M NaCl + ZnO NPs 0.075 g/L). T6: (0.15 M NaCl + ZnO NPs 0.15 g/L).
Disclaimer/Publisher’s Note: The statements, opinions and data contained in all publications are solely those of the individual author(s) and contributor(s) and not of MDPI and/or the editor(s). MDPI and/or the editor(s) disclaim responsibility for any injury to people or property resulting from any ideas, methods, instructions or products referred to in the content.

