1. Introduction
Nitrous oxide (N
2O) is a potent greenhouse gas with a 100-year global warming potential (GWP) 273 times that of CO
2, and is currently the most important substance depleting stratospheric ozone [
1,
2]. Agricultural soils represent the largest anthropogenic source of global N
2O emissions, contributing approximately 60% of total anthropogenic N
2O emissions [
3]. As the world’s largest rice producer, China cultivates approximately 30 million hectares of paddy rice annually, and N
2O emissions arising from nitrogen transformation processes in paddy soils constitute a significant component of agricultural greenhouse effects [
4]. However, conventional rice cultivation, which often relies on intensive nitrogen fertilization and continuous flooding, has limited capacity to mitigate N
2O emissions while sustaining productivity. In this context, exploring integrated rice–aquaculture models that can simultaneously enhance system productivity and reduce N
2O emissions has become a critical pathway toward the green and low-carbon transformation of paddy agriculture.
The rice–fish co-culture system is an integrated agricultural model in which rice cultivation and fish farming are conducted simultaneously in paddy fields. This system has attracted considerable attention for its ecological benefits, including reduced agrochemical inputs, improved soil fertility, and enhanced biodiversity [
5,
6]. Several field studies have reported lower N
2O emissions from rice–aquaculture co-culture systems than from rice monoculture [
7,
8], although meta-analytic evidence indicates that the overall N
2O response across paddy co-culture models is not consistently significant [
9]. These responses are primarily attributed to the regulatory effects of fish activities—such as feeding, excretion, and bioturbation—on the paddy “water–soil–microorganism” system [
8,
10]. However, the specific mechanisms through which fish activities influence N
2O emissions remain unclear, and existing studies have largely focused on changes in emission fluxes without providing in-depth insights into the underlying microbial driving mechanisms.
From a microbial perspective, N
2O emissions from paddy soils are predominantly driven by microbially mediated nitrification and denitrification, with denitrification being the primary pathway of N
2O production in flooded paddy fields [
11,
12]. During denitrification, NO
3− is sequentially reduced to NO
2−, NO, and N
2O by enzymes encoded by functional genes including
napA/
narG,
nirK/
nirS, and
norB, respectively, while N
2O reductase encoded by nosZ represents the only known microbial pathway for further reducing N
2O to N
2 [
13,
14]. Consequently, the relative abundance of
nosZ compared to
nirK/
nirS has been recognized as a critical indicator determining net N
2O emissions from denitrification [
15,
16]. In addition, dissimilatory nitrate reduction to ammonium (DNRA), in which the enzyme encoded by the
nrfA gene reduces NO
2− directly to NH
4+, competes with denitrification for NO
2− substrate, thereby reducing the substrate flux entering the N
2O production pathway, and is thus regarded as a potential N
2O mitigation route [
11,
17]. However, how fish activities modulate the community structure and abundance of these nitrogen-cycling functional microorganisms by altering paddy microenvironments, and consequently affect the balance between N
2O production and consumption, remains largely unexplored.
Another factor that warrants attention but has been insufficiently investigated is the duration of rice–fish co-culture. Long-term rice–aquatic animal co-culture (e.g., rice–crab and rice–crayfish systems) has been shown to alter soil organic matter and nutrient content [
18] and to reshape soil microbial community composition. Li et al. [
19] found that N
2O emissions from high-fertility soils did not increase significantly in long-term rice–crab co-culture systems, attributable to a more stable microbial community. Nevertheless, the effects of co-culture duration on N
2O-related functional microorganisms in rice–fish systems—particularly the denitrification cascade and DNRA genes—remain unreported. Because cumulative fish effects on soil microenvironments differ across timescales, short-term and long-term co-culture may influence the microbial functional potential for N
2O cycling through quantitatively or qualitatively distinct pathways, and this possibility requires explicit experimental comparison.
The rice–fish co-culture system of Qingtian County, Zhejiang Province, has a history exceeding 1200 years and was designated as one of the first Globally Important Agricultural Heritage Systems (GIAHSs) by the FAO in 2005 [
20]. This system has traditionally been managed under a low-input regime without chemical fertilizer or supplementary feed, providing a rare opportunity to investigate fish-mediated effects on paddy nitrogen cycling in a substrate-limited setting, where the confounding influence of high exogenous nitrogen loading is removed. In the present study, three treatments were established in this system: rice monoculture (RM), first-year rice–fish co-culture (RF1), and long-established rice–fish co-culture (RFN). We hypothesized that the influence of rice–fish co-culture on the nitrogen-cycling microbial community is duration-dependent rather than monotonic: that first-year co-culture would prime the rhizosphere community toward complete denitrification (an increase in
nosZ relative to the nitrite-reductase genes
nirK and
nirS), whereas long-established co-culture would not necessarily retain this shift, instead converging toward a new community state as cumulative fish effects on the water–soil microenvironment accumulate. Accordingly, our objectives were (1) to quantify how co-culture duration reshapes the rhizosphere microbial functional potential for nitrous oxide production and consumption under low-nitrogen conditions; (2) to identify the water- and soil-phase variables most strongly linking fish activity to this functional response; and (3) to assess whether the observed changes in functional potential are accompanied by measurable differences in N
2O flux.
2. Materials and Methods
2.1. Study Site
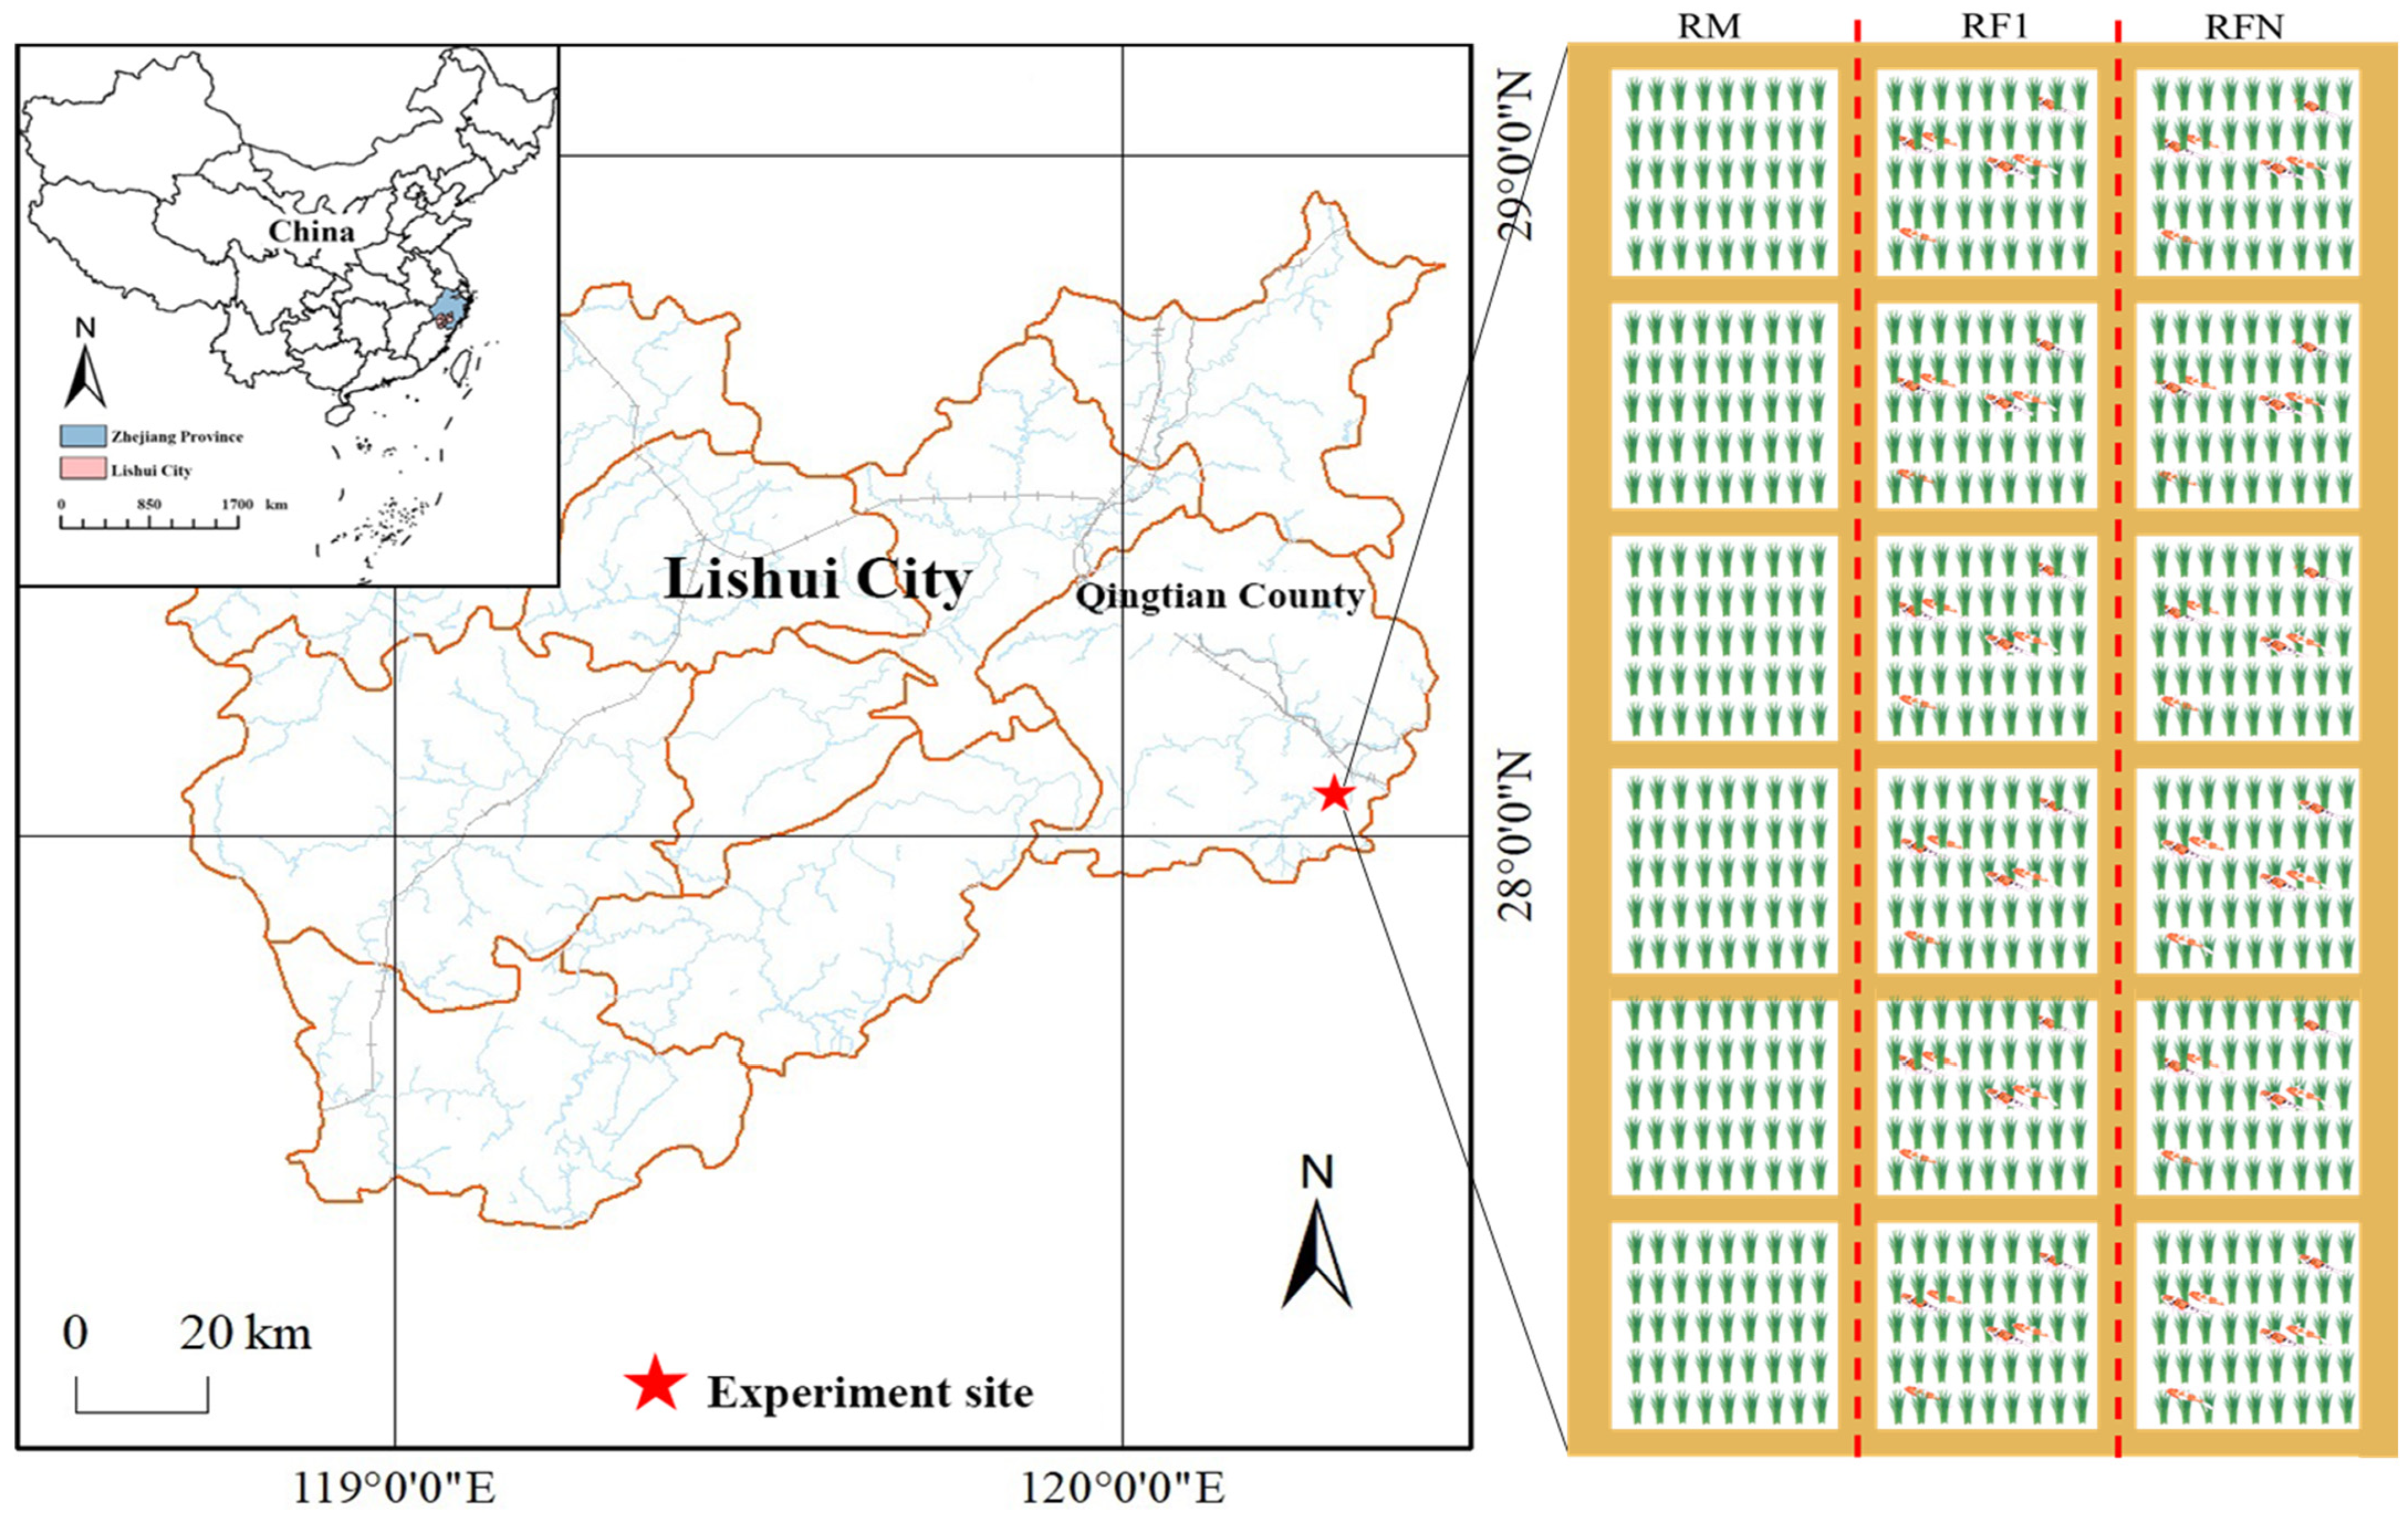
The study was conducted during the 2024 rice growing season at Shangzhuang Village, Fangshan Town, Qingtian County, Zhejiang Province, China (approximately 28°02′21″ N, 120°19′24″ E;
Figure 1). This site is part of the Qingtian rice–fish co-culture system, which has been established for over 1200 years and was designated as one of the first Globally Important Agricultural Heritage Systems (GIAHSs) by the FAO in 2005 [
20]. The region has a subtropical monsoon climate, with a mean annual temperature of 17–18 °C and mean annual precipitation of 1400–1450 mm. The paddy soils of this terraced system develop on alluvial/colluvial parent materials and, in common with the paddy soils of the region, are generally classified as Anthrosols (paddy soils); a representative rice–fish site in Qingtian has been described as possessing a sandy-loam soil, soil organic matter of about 31–33 g kg
−1 and total nitrogen of about 2.1–2.8 g kg
−1 [
18]. A site-specific physicochemical soil baseline was not collected at the study plots before the experiment, which we acknowledged as a limitation. The rice variety cultivated was “Yongyou 15”, an indica–japonica inter-subspecific hybrid requiring a single growing season of approximately 140–150 days. No chemical fertilizers were applied throughout the growing season to eliminate potential confounding effects on N
2O emissions. The fish species raised were the indigenous Qingtian paddy carp (
Cyprinus carpio var.
qingtianensis) [
21].
2.2. Experimental Design and Treatments
A single-factor field experiment was established with three treatments: (1) rice monoculture (RM), (2) first-year rice–fish co-culture (RF1), and (3) long-established (~10-year) rice–fish co-culture (RFN). Each treatment had six replicates (n = 6), giving 18 plots in total, with an individual plot size of 40 m2 (5 m × 8 m). Because the long-established (RFN) plots were located in pre-existing, farmer-managed rice–fish fields that could not be randomized with the monoculture and first-year plots, the comparison constitutes a space-for-time substitution rather than a true randomized block design; treatment is therefore partly confounded with field location, a limitation we address in the Discussion. The six replicate plots of each treatment were nonetheless independently bunded and managed as separate experimental units: all plots were enclosed by ~45 cm high concrete-brick barriers to prevent fish movement and cross-contamination between treatments, and each was equipped with an independent inlet and drainage pipe to ensure isolated water management.
The three treatments differed in their prior land-use history. The RM plots were established on fields that had never been used for fish rearing. The RF1 plots were established on fields with the same no-fish history as RM, subdivided by concrete-brick barriers at the start of the 2024 growing season and stocked with fish for the first time; RF1 therefore represents the first year of co-culture on previously fish-free soil. The RFN plots were sited within farmer-managed fields that had been under continuous rice–fish co-culture for approximately ten years prior to this study, and therefore represent a long-established co-culture state. Importantly, the RFN plots are immediately adjacent to the RM and RF1 plots and draw irrigation water from the same channel, so that climate, soil parent material, and water-supply chemistry are effectively shared across all treatments; this minimizes the scope for pre-existing abiotic heterogeneity to confound the RFN–RM contrast.
2.3. Crop and Fish Management
Rice was sown on 19 May 2024, and transplanted on 21 June 2024, at a spacing of 40 cm × 40 cm with one seedling per hill. All plots received water from the same irrigation source, and no chemical fertilizer was applied at any point during the growing season, eliminating a potential confounding influence on N2O emissions. For the RF1 and RFN treatments, Qingtian paddy carp (individual weight ~50 g) were stocked at a density of approximately 0.2–0.4 individuals m−2 on 11 July 2024, twenty days after transplantation to allow rice-seedling establishment. No supplementary feed was provided throughout the growing season, thereby removing the influence of exogenous nutrient input on N2O emissions. Water depth was maintained at approximately 25–30 cm across all treatments to ensure comparability.
2.4. N2O Flux Measurement
N
2O emissions were measured using static transparent chambers (50 cm × 50 cm × 120 cm, L × W × H) constructed from 5 mm thick Perspex, following a previously reported static-chamber protocol by our own group [
22]. Each chamber was equipped with a battery-powered fan for internal air circulation and a rubber sampling tube fitted with a three-way valve. Chambers were placed on pre-installed U-shaped stainless-steel grooves filled with water to ensure gas-tight seals [
23] and positioned ≥1 m from plot boundaries to avoid edge effects. To prevent short-term flux artifacts caused by direct fish disturbance within the enclosed chamber footprint, fish were temporarily excluded from the area beneath the chamber during each 30 min sampling period—a standard procedure in greenhouse-gas studies of rice–aquatic-animal co-culture systems [
24]. We emphasize that this exclusion applies only to the brief sampling window; fish remained present throughout the plots for the entire growing season, so their cumulative effects on the water–soil microenvironment were fully retained in the underlying system. Our measured fluxes therefore reflect the inter-event background of a fish-modified paddy environment rather than instantaneous emissions driven by active fish disturbance.
Gas sampling was performed on clear or cloudy days at three growth stages: tillering (4–5 August 2024), heading (2–3 September 2024), and maturity (1 and 3 October 2024). At each stage, samples were collected twice daily (9:00–11:00 and 14:00–16:00) over 30 min enclosure periods. Gas samples (50 mL) were withdrawn at 0, 10, 20, and 30 min after chamber closure using gas-tight syringes and stored in Fluode sampling bags. Chamber air temperature was recorded at each interval.
N2O concentrations were determined within 24 h using an Agilent 7820A gas chromatograph (Agilent Technologies, Santa Clara, CA, USA) equipped with an electron capture detector (ECD, 330 °C). Separation was achieved on dual packed columns (1 m and 3 m, 2 mm i.d.) filled with 80–100 mesh Porapak Q at 55 °C, with high-purity N2 as the carrier gas (35 cm3 min−1). Calibration was performed before each measurement batch using standard gas mixtures containing 0.2, 0.5, 1.0, and 2.0 μL L−1 N2O (National Center for Standard Materials, Beijing, China), with a detection limit of 0.01 μL L−1.
N
2O fluxes were calculated by linear regression of headspace concentration changes over time [
25]:
where ΔC/Δt is the concentration change rate, V is the chamber volume (L), A is the chamber cross-sectional area (m
2), T is the mean air temperature inside the chamber (°C), M is the molar mass of N
2O, and V
0 is the molar volume at standard conditions.
2.5. Water and Soil Physicochemical Analyses
Water and soil physicochemical properties were measured at the same three growth stages as gas sampling.
Water properties: Dissolved oxygen (DO) and pH were measured in situ at 5 cm below the water surface using a calibrated YSI ProDSS multiparameter water quality meter (YSI Inc., Yellow Springs, OH, USA). Measurements were taken between 9:00 and 11:00 and 14:00 and 16:00 to capture diurnal variation; three readings per plot were averaged to obtain a representative value. Surface water samples (1 L, 5 cm depth) were collected from each plot using polyethylene bottles. After filtration, concentrations of NH4+-N (W-NH4+) and NO3−-N (W-NO3−) were determined using a flow injection analyzer. Water total carbon (WTC) and water organic carbon (WOC) were determined on filtered water samples using a Shimadzu TOC-L analyzer (Shimadzu Corporation, Kyoto, Japan) according to the manufacturer’s standard protocol, with WTC measured in total carbon mode and WOC measured as non-purgeable organic carbon following acidification and sparging.
Soil properties: Composite soil samples (0–10 cm depth) were collected from three randomly selected locations within each plot between 9:00 and 11:00 and homogenized. Samples were stored at 4 °C and processed within 48 h. Soil NH4+-N (S-NH4+) and NO3−-N (S-NO3−) were extracted from fresh soil (<2 mm) with 2 mol L−1 KCl and quantified using a continuous flow analyzer. Soil organic carbon (SOC) was determined on air-dried, finely ground (<0.15 mm) subsamples by the potassium dichromate oxidation–external heating method. Soil total nitrogen (STN) was determined on the same subsamples by the Kjeldahl digestion method. For all analyses, analytical-grade reagents were used, and quality control was ensured by including standard reference materials and procedural blanks in each batch.
2.6. Metagenomic Sequencing and Functional Gene Analysis
Rhizosphere soil samples were collected at the tillering (3 August 2024), heading (4 September 2024), and maturity (2 October 2024) stages. For each of the 18 plots, approximately 5 g of soil within 5 mm of rice roots was collected, sealed in sterile 10 mL tubes, transported to the laboratory on ice, and stored at −80 °C until processing. A total of 54 samples (18 plots × 3 stages) were obtained.
DNA was extracted from ~0.25 g of soil per sample using the DNeasy PowerSoil Kit (Qiagen, Hilden, Germany) following the manufacturer’s protocol. DNA quality and quantity were assessed by NanoDrop 2000 spectrophotometry (Thermo Fisher Scientific, Waltham, MA, USA) and agarose gel electrophoresis; only samples with A260/A280 ratios of 1.8–2.0 were retained. Qualified DNA was subjected to metagenomic sequencing on the Illumina platform.
Raw sequencing reads were quality-filtered and host-decontaminated using fastp, then assembled into contigs and scaffolds using a combined IDBA-UD and Newbler pipeline. Open reading frames (ORFs) were predicted with Prodigal and aligned against the KEGG, NCBI-nr, and eggNOG databases using Diamond for taxonomic and functional annotation. Species relative abundances were estimated using Salmon and FOCUS2. Functional genes targeted in this study included the complete denitrification cascade—
narG (K00370),
napA (K02567),
nirK (K00368),
nirS (K15864),
norB (K04561), and
nosZ (K00376)—the DNRA gene
nrfA (K03385), the nitrification marker
amoA (K10944), the nitrogen fixation marker
nifH (K02588), and the ammonium assimilation gene
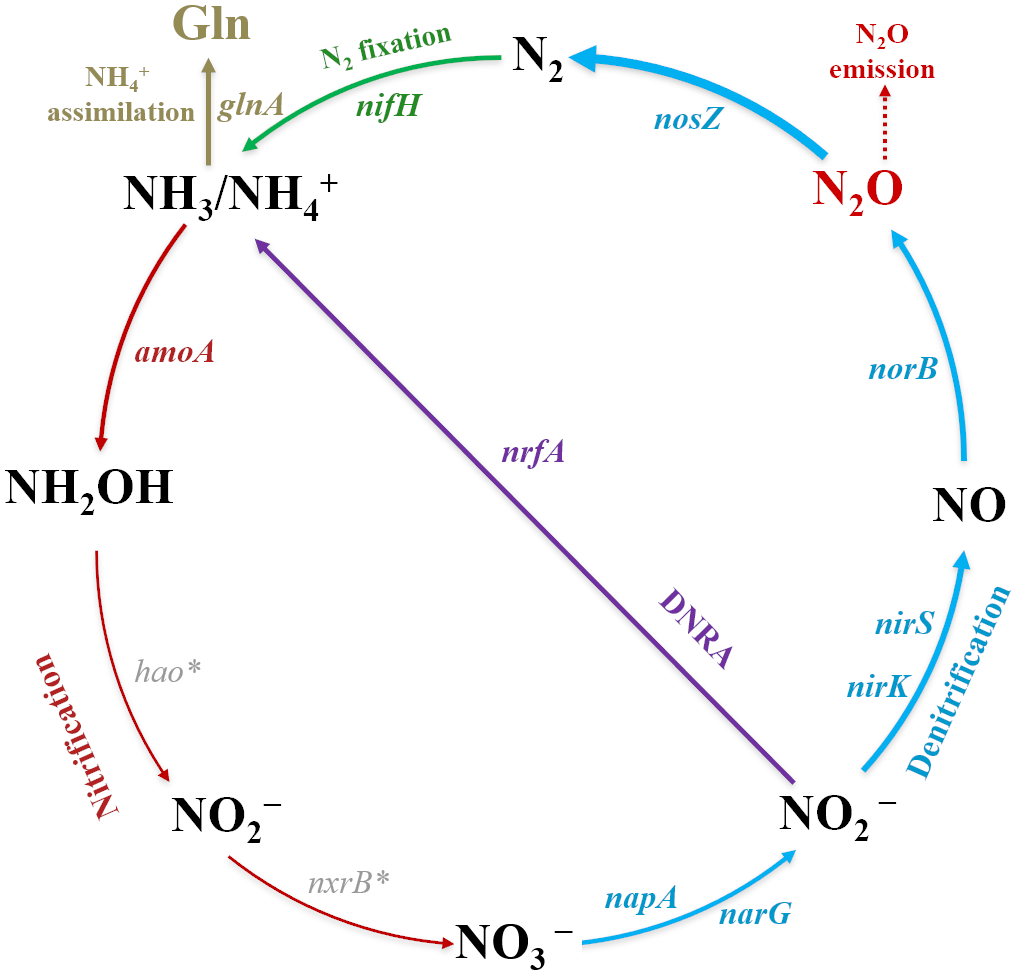
glnA (K01915). Relative abundances of these genes were calculated based on annotated read counts normalized to total mapped reads per sample. A schematic overview of the targeted N-cycling pathways and their associated functional genes is provided in
Figure 2.
The selection of target functional genes was guided by three criteria: (1) direct involvement in the denitrification cascade controlling N
2O production and consumption (
narG,
napA,
nirK,
nirS,
norB,
nosZ), which constitutes the primary N
2O pathway in flooded paddy soils [
11,
13]; (2) participation in competing pathways for shared substrates, specifically DNRA (
nrfA), which diverts NO
2− away from denitrification toward NH
4+ [
17]; and (3) representation of upstream processes that supply substrates to denitrification, including nitrification (
amoA), biological nitrogen fixation (
nifH), and ammonium assimilation (
glnA). Genes with extremely low or undetectable abundances across the dataset (e.g.,
hao,
napB, and anammox-related
hzsA/B/C) were excluded due to insufficient statistical power. The distinction between
nosZ clade I and clade II was not attempted, as the KEGG annotation framework assigns a single KO entry (K00376) to
nosZ; phylogenetic delineation of
nosZ clades warrants further investigation.
2.7. Statistical Analysis
All statistical analyses were performed in R (version 4.3.0). For each response variable, differences among the three treatments (RM, RF1, RFN) at each growth stage were first assessed using the Kruskal–Wallis H test. When the omnibus test was significant (p < 0.05), Dunn’s post hoc test with Benjamini–Hochberg correction for the false discovery rate was applied to identify which pairs of treatments differed. Treatments sharing the same letter in the figures are not significantly different at α = 0.05. Spearman’s rank correlation was used to evaluate relationships among functional gene abundances, environmental variables, and N2O fluxes across all 54 samples (18 plots × 3 growth stages). We note that pooling samples across stages does not fully account for temporal non-independence within plots, and the reported correlations should therefore be interpreted as overall co-variation patterns rather than as strict statistical inference. Key functional gene ratios—nosZ/(nirK + nirS), (nirK + nirS + norB)/nosZ, nirK/nirS, and nrfA/(nirK + nirS)—were calculated for each sample and analyzed as integrated indicators of the N2O production–consumption potential. Figures were generated using the OriginLab 2026 and pheatmap packages.
3. Results
3.1. N2O Emission Fluxes
N
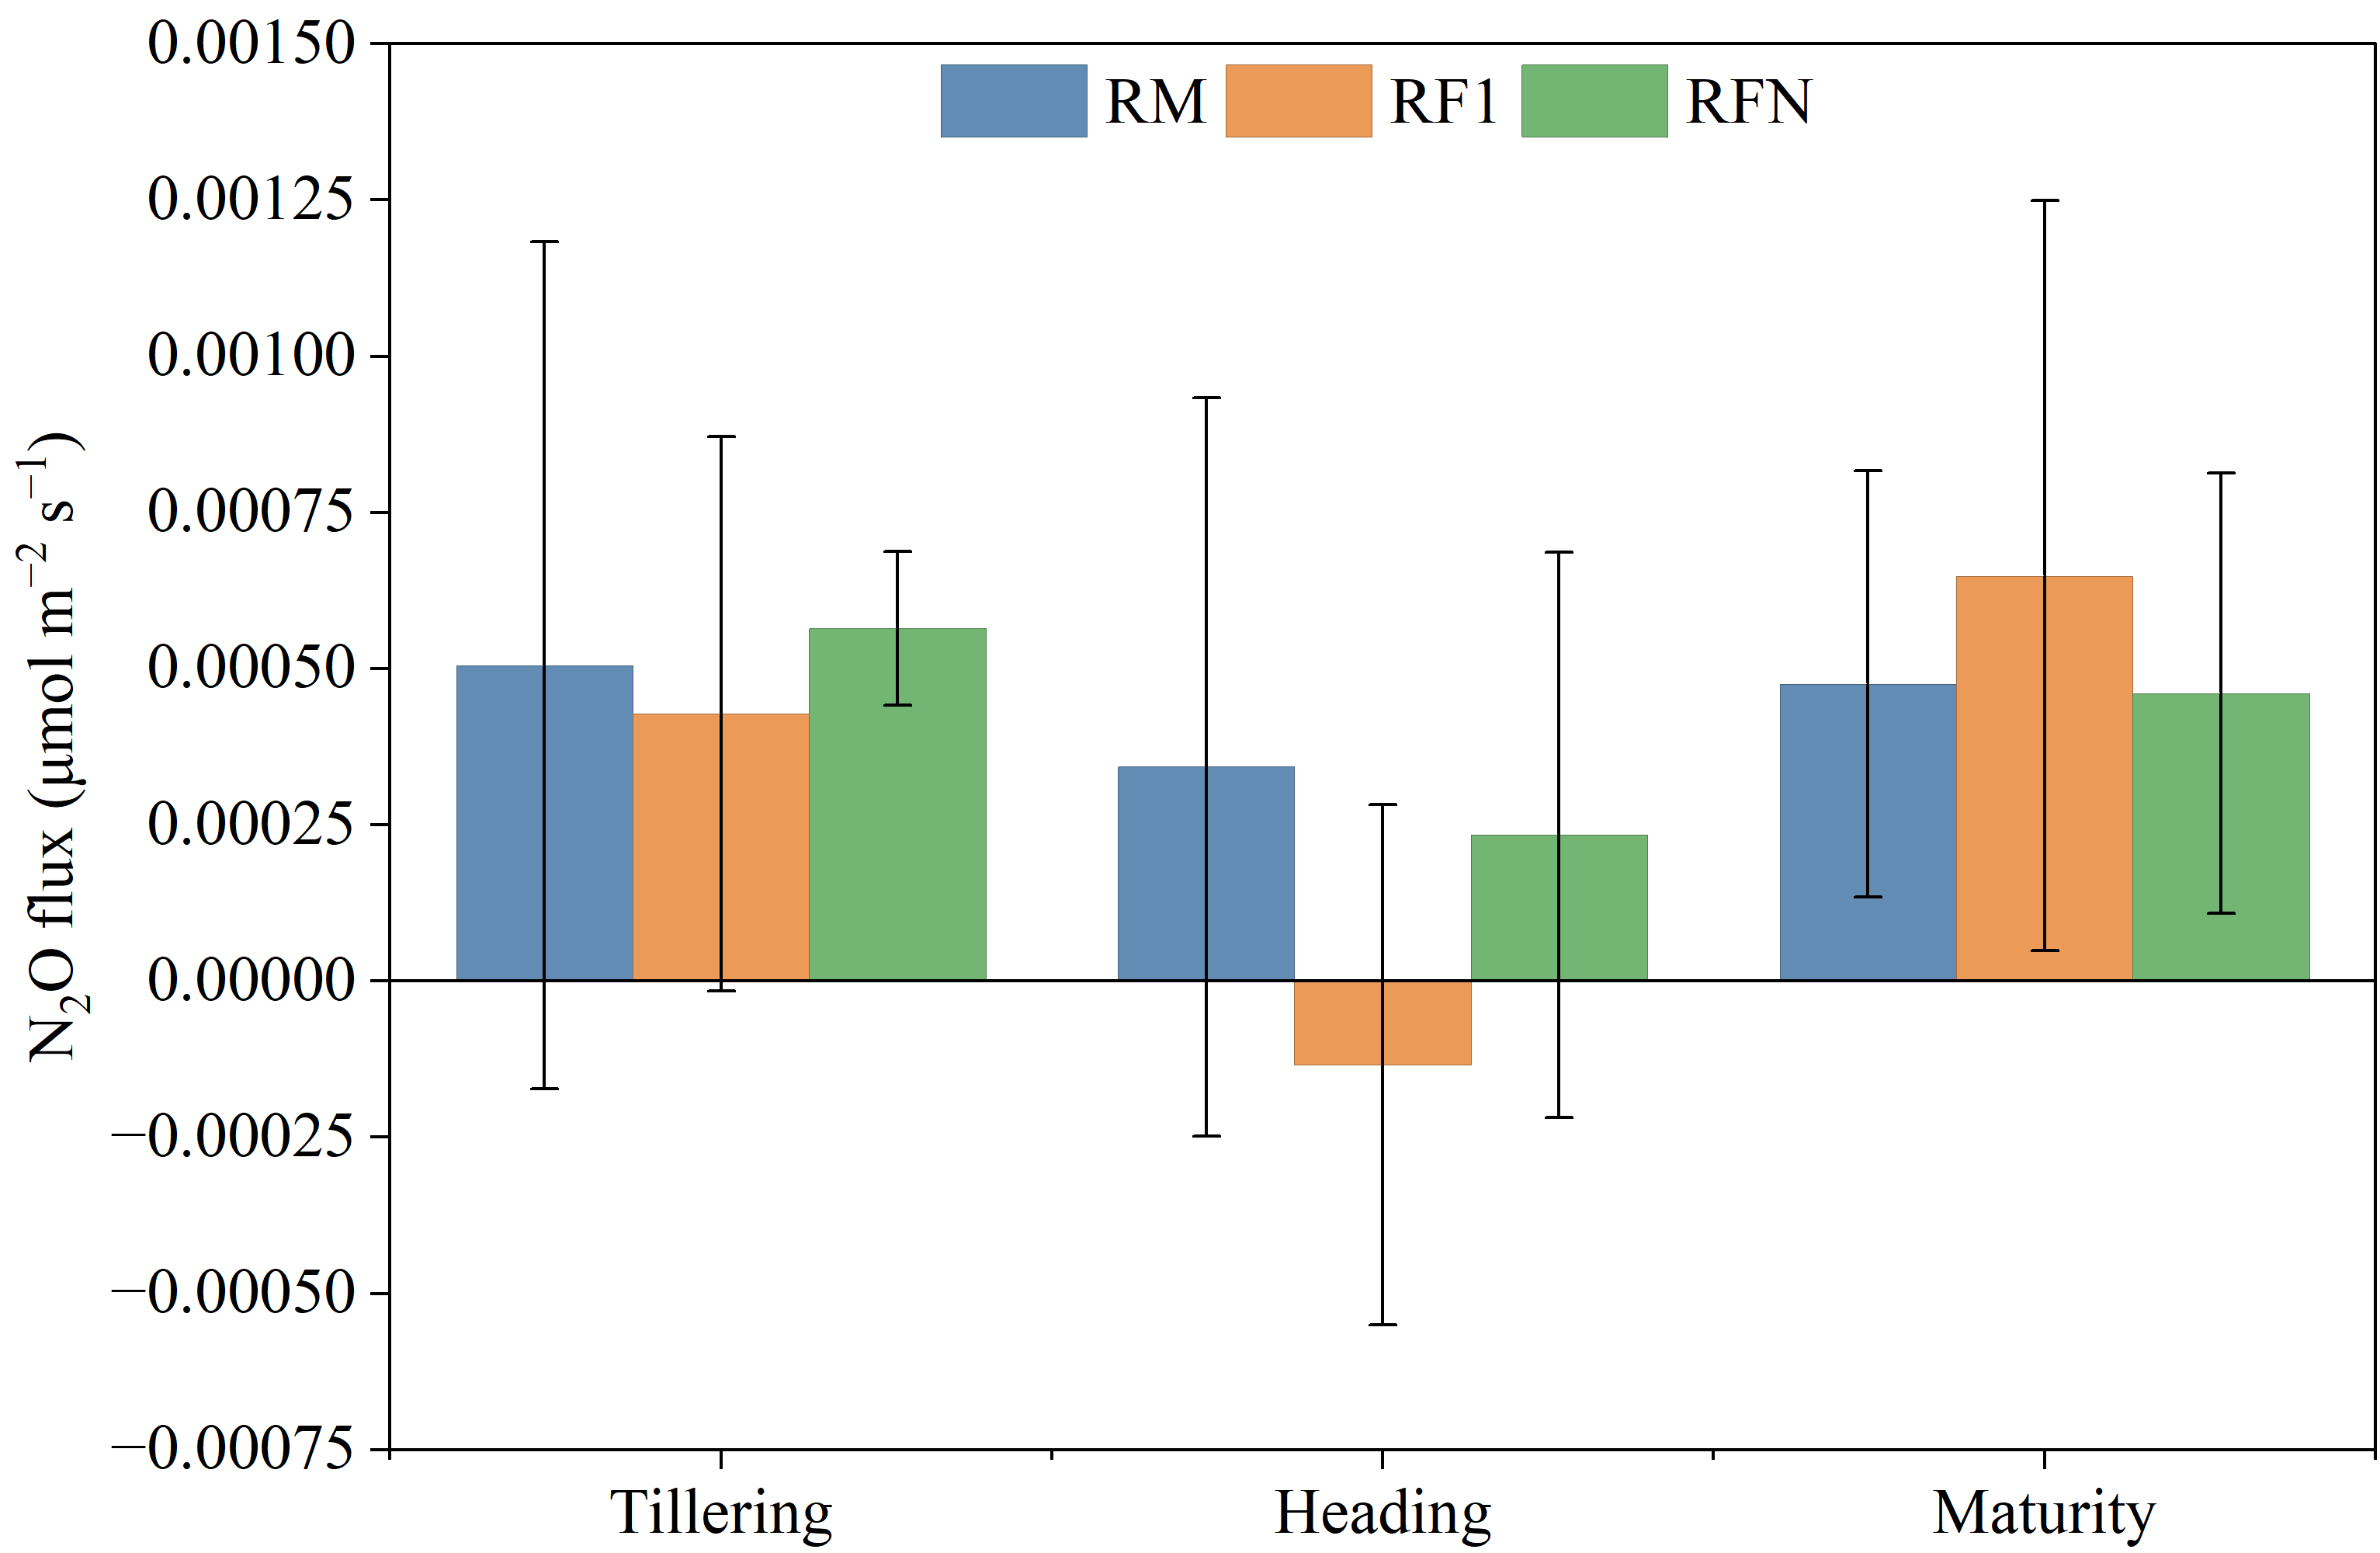
2O emission fluxes remained at consistently low levels across all three treatments throughout the rice growing season, with no significant differences detected at any growth stage (Kruskal–Wallis,
p > 0.05;
Figure 3). Mean fluxes ranged from approximately 0.00043 to 0.00057 μmol m
−2 s
−1 at tillering and from 0.00046 to 0.00065 μmol m
−2 s
−1 at maturity, while at heading all three treatments fluctuated around zero with wide within-treatment variability. Of the 54 flux observations across all treatments and growth stages, 10 were slightly negative, all with absolute magnitudes within the analytical detection limit (|F| < 0.01 μL L
−1). This low and undifferentiated flux background is consistent with the substrate-limited nature of the Qingtian GIAHS system, in which no chemical fertilizer or supplementary fish feed is applied, and it sets the boundary condition within which the microbial functional responses reported below must be interpreted.
3.2. Effects of Co-Culture Duration on Water and Soil Physicochemical Properties
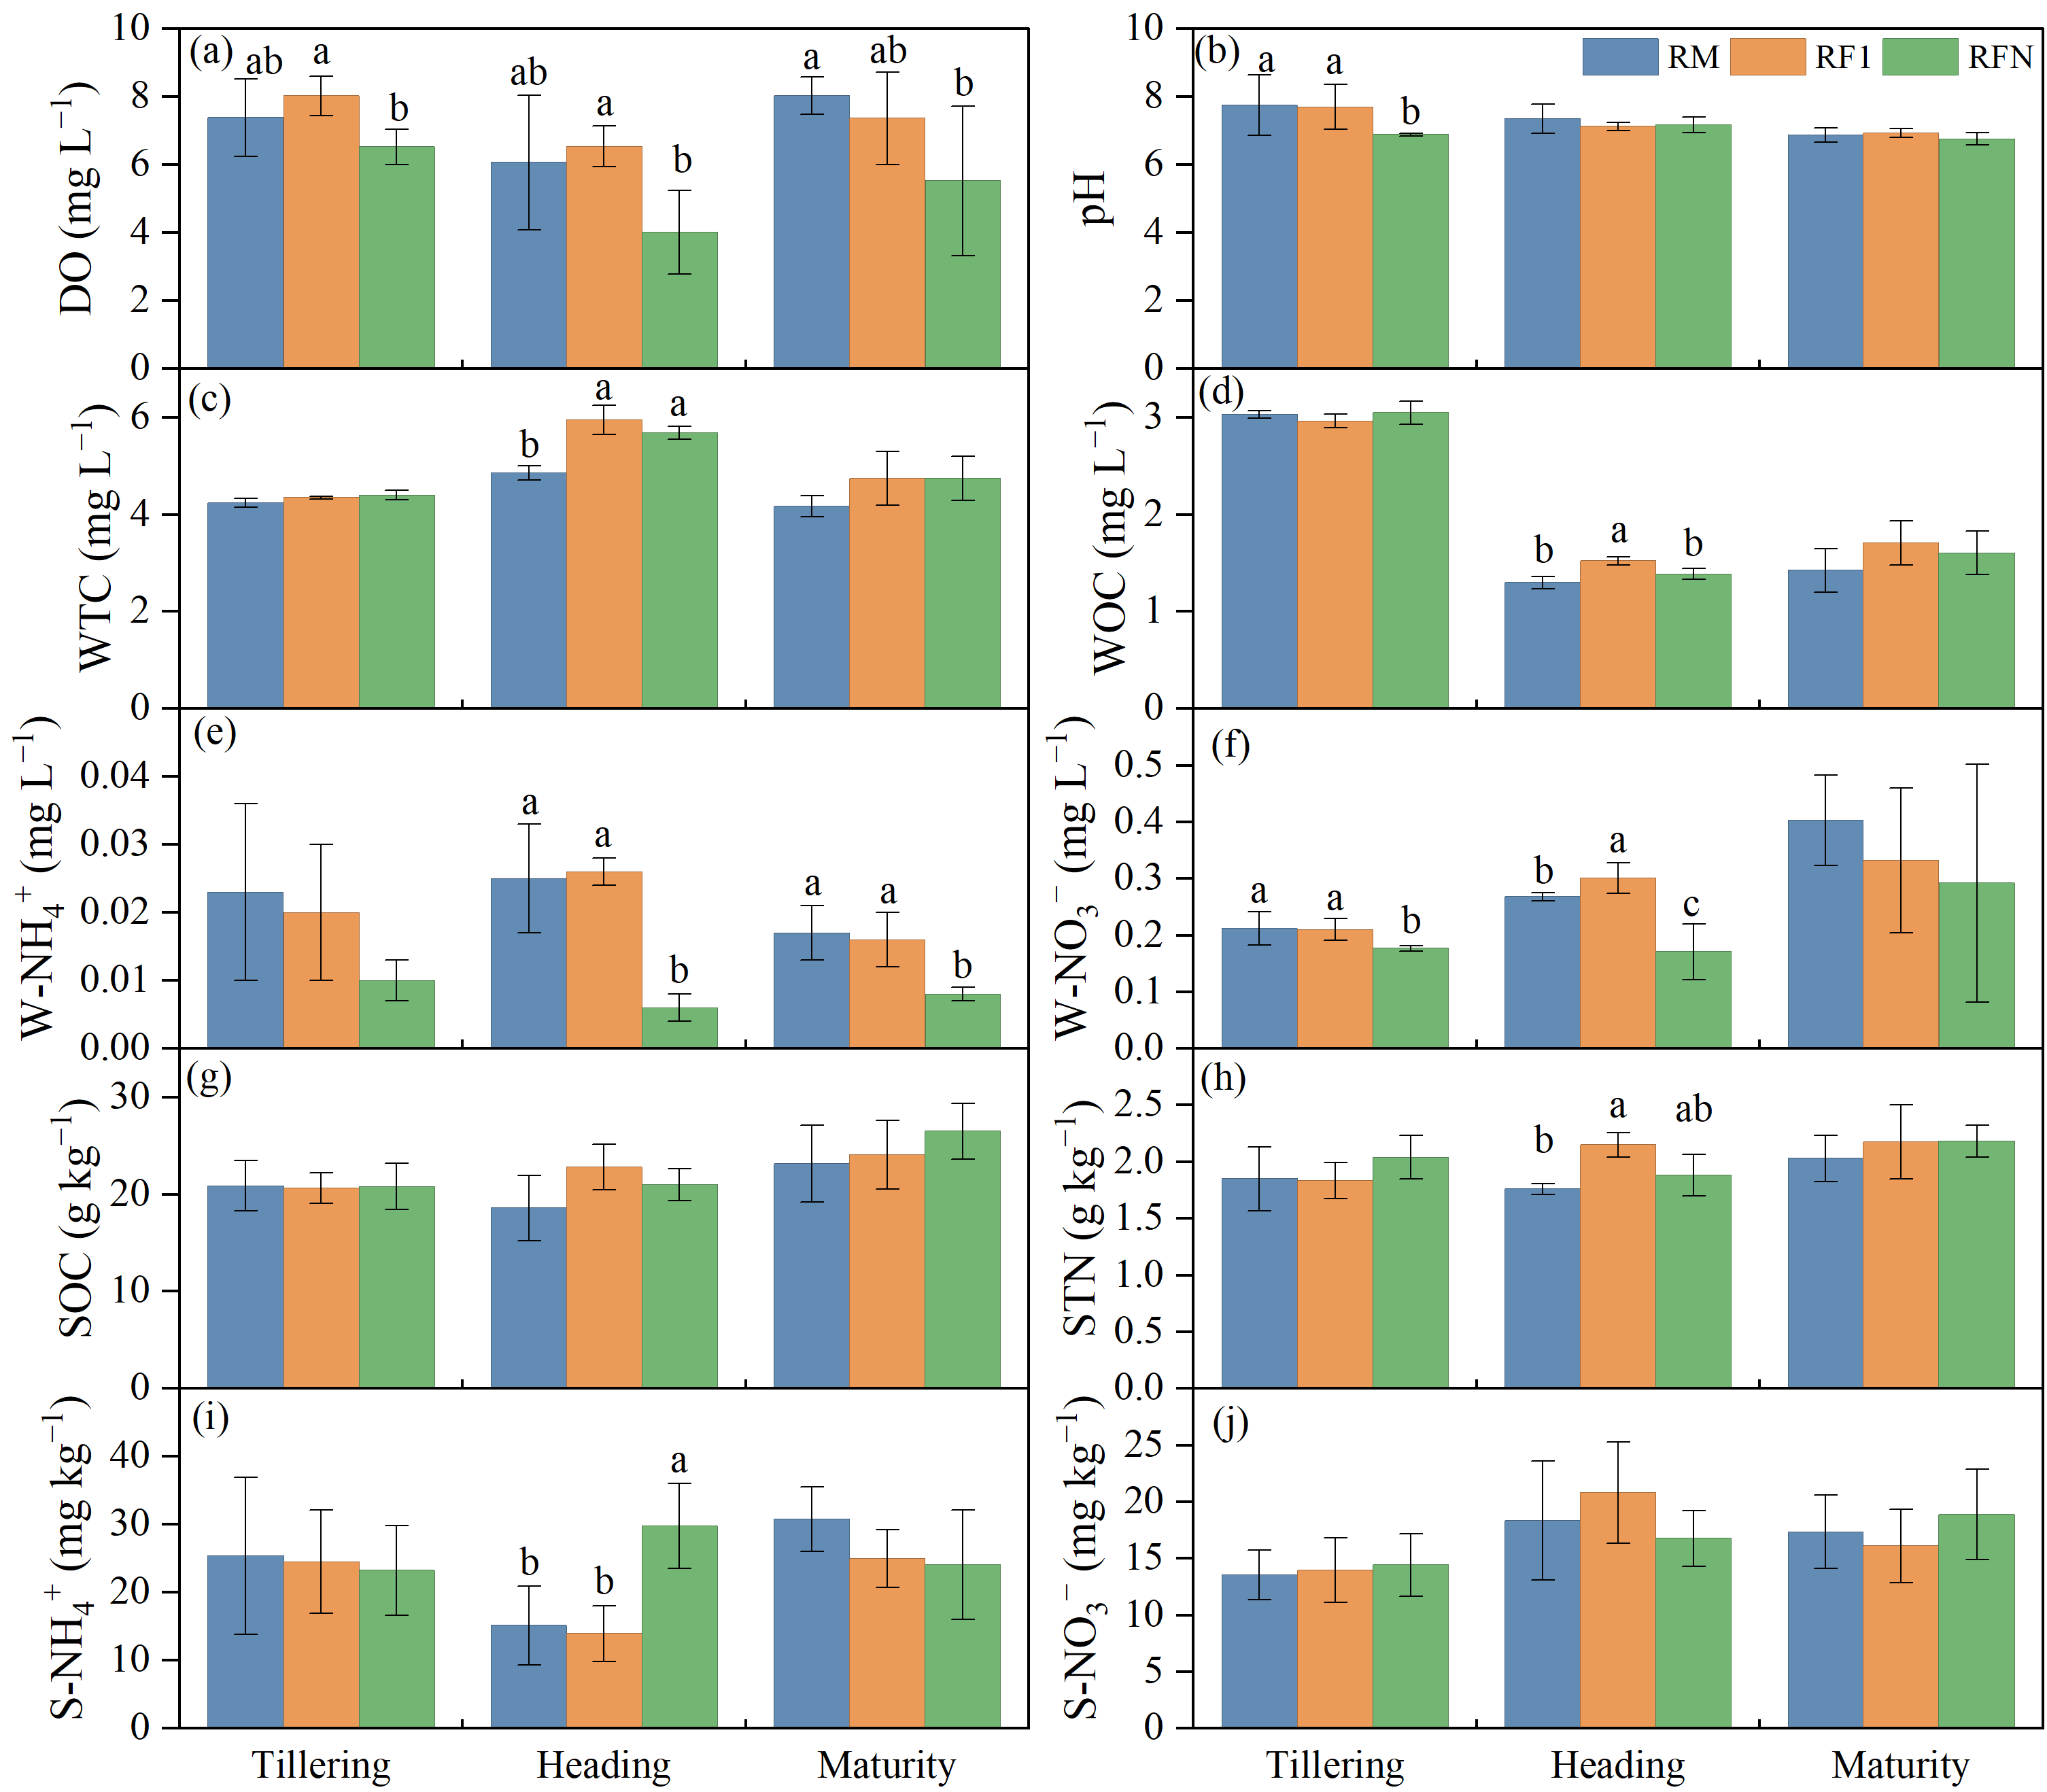
Fish-mediated changes to the paddy microenvironment were most pronounced in the water column, while soil bulk properties showed more limited responses (
Figure 4).
Water dissolved oxygen (DO) in RFN was consistently the lowest of the three treatments across all growth stages, differing significantly from RF1 at both the tillering and heading stages and from RM at maturity. RF1 maintained DO at levels comparable to or slightly higher than RM throughout the early and mid-season. Water pH was only weakly affected: RFN was slightly more acidic than RM at the tillering stage (p < 0.05), but this difference disappeared at heading and maturity. Water total carbon (WTC) at heading was significantly elevated in both co-culture treatments relative to RM, being highest in RF1. Water organic carbon (WOC) showed a more striking pattern at the heading stage: WOC in RF1 was significantly higher than in both RM and RFN, while RM and RFN were statistically indistinguishable. Water NH4+-N in RFN was significantly depleted at both the heading and maturity stages, being 60–80% lower than in RM and RF1, whereas RM and RF1 remained statistically indistinguishable. Water NO3−-N was lowest in RFN throughout the whole growing season, and reached its highest value in RF1 at heading; treatment differences disappeared by maturity.
Bulk soil organic carbon (SOC) showed no significant treatment effect at any growth stage. Soil total nitrogen (STN) was significantly elevated in RF1 relative to RM at the heading stage, with RFN being intermediate and not significantly different from either. Soil NH4+-N exhibited a clear treatment effect only at the heading stage, when RFN reached approximately double the values in RM and RF1—revealing a water-to-soil partitioning of ammonium nitrogen specific to the long-established co-culture system. Soil NO3−-N remained stable across treatments and growth stages.
3.3. Denitrification Functional Gene Abundances
Among the six denitrification genes examined,
nosZ—encoding the terminal N
2O reductase and the sole known enzymatic sink for N
2O (
Figure 1)—exhibited the most consistent response to co-culture duration (
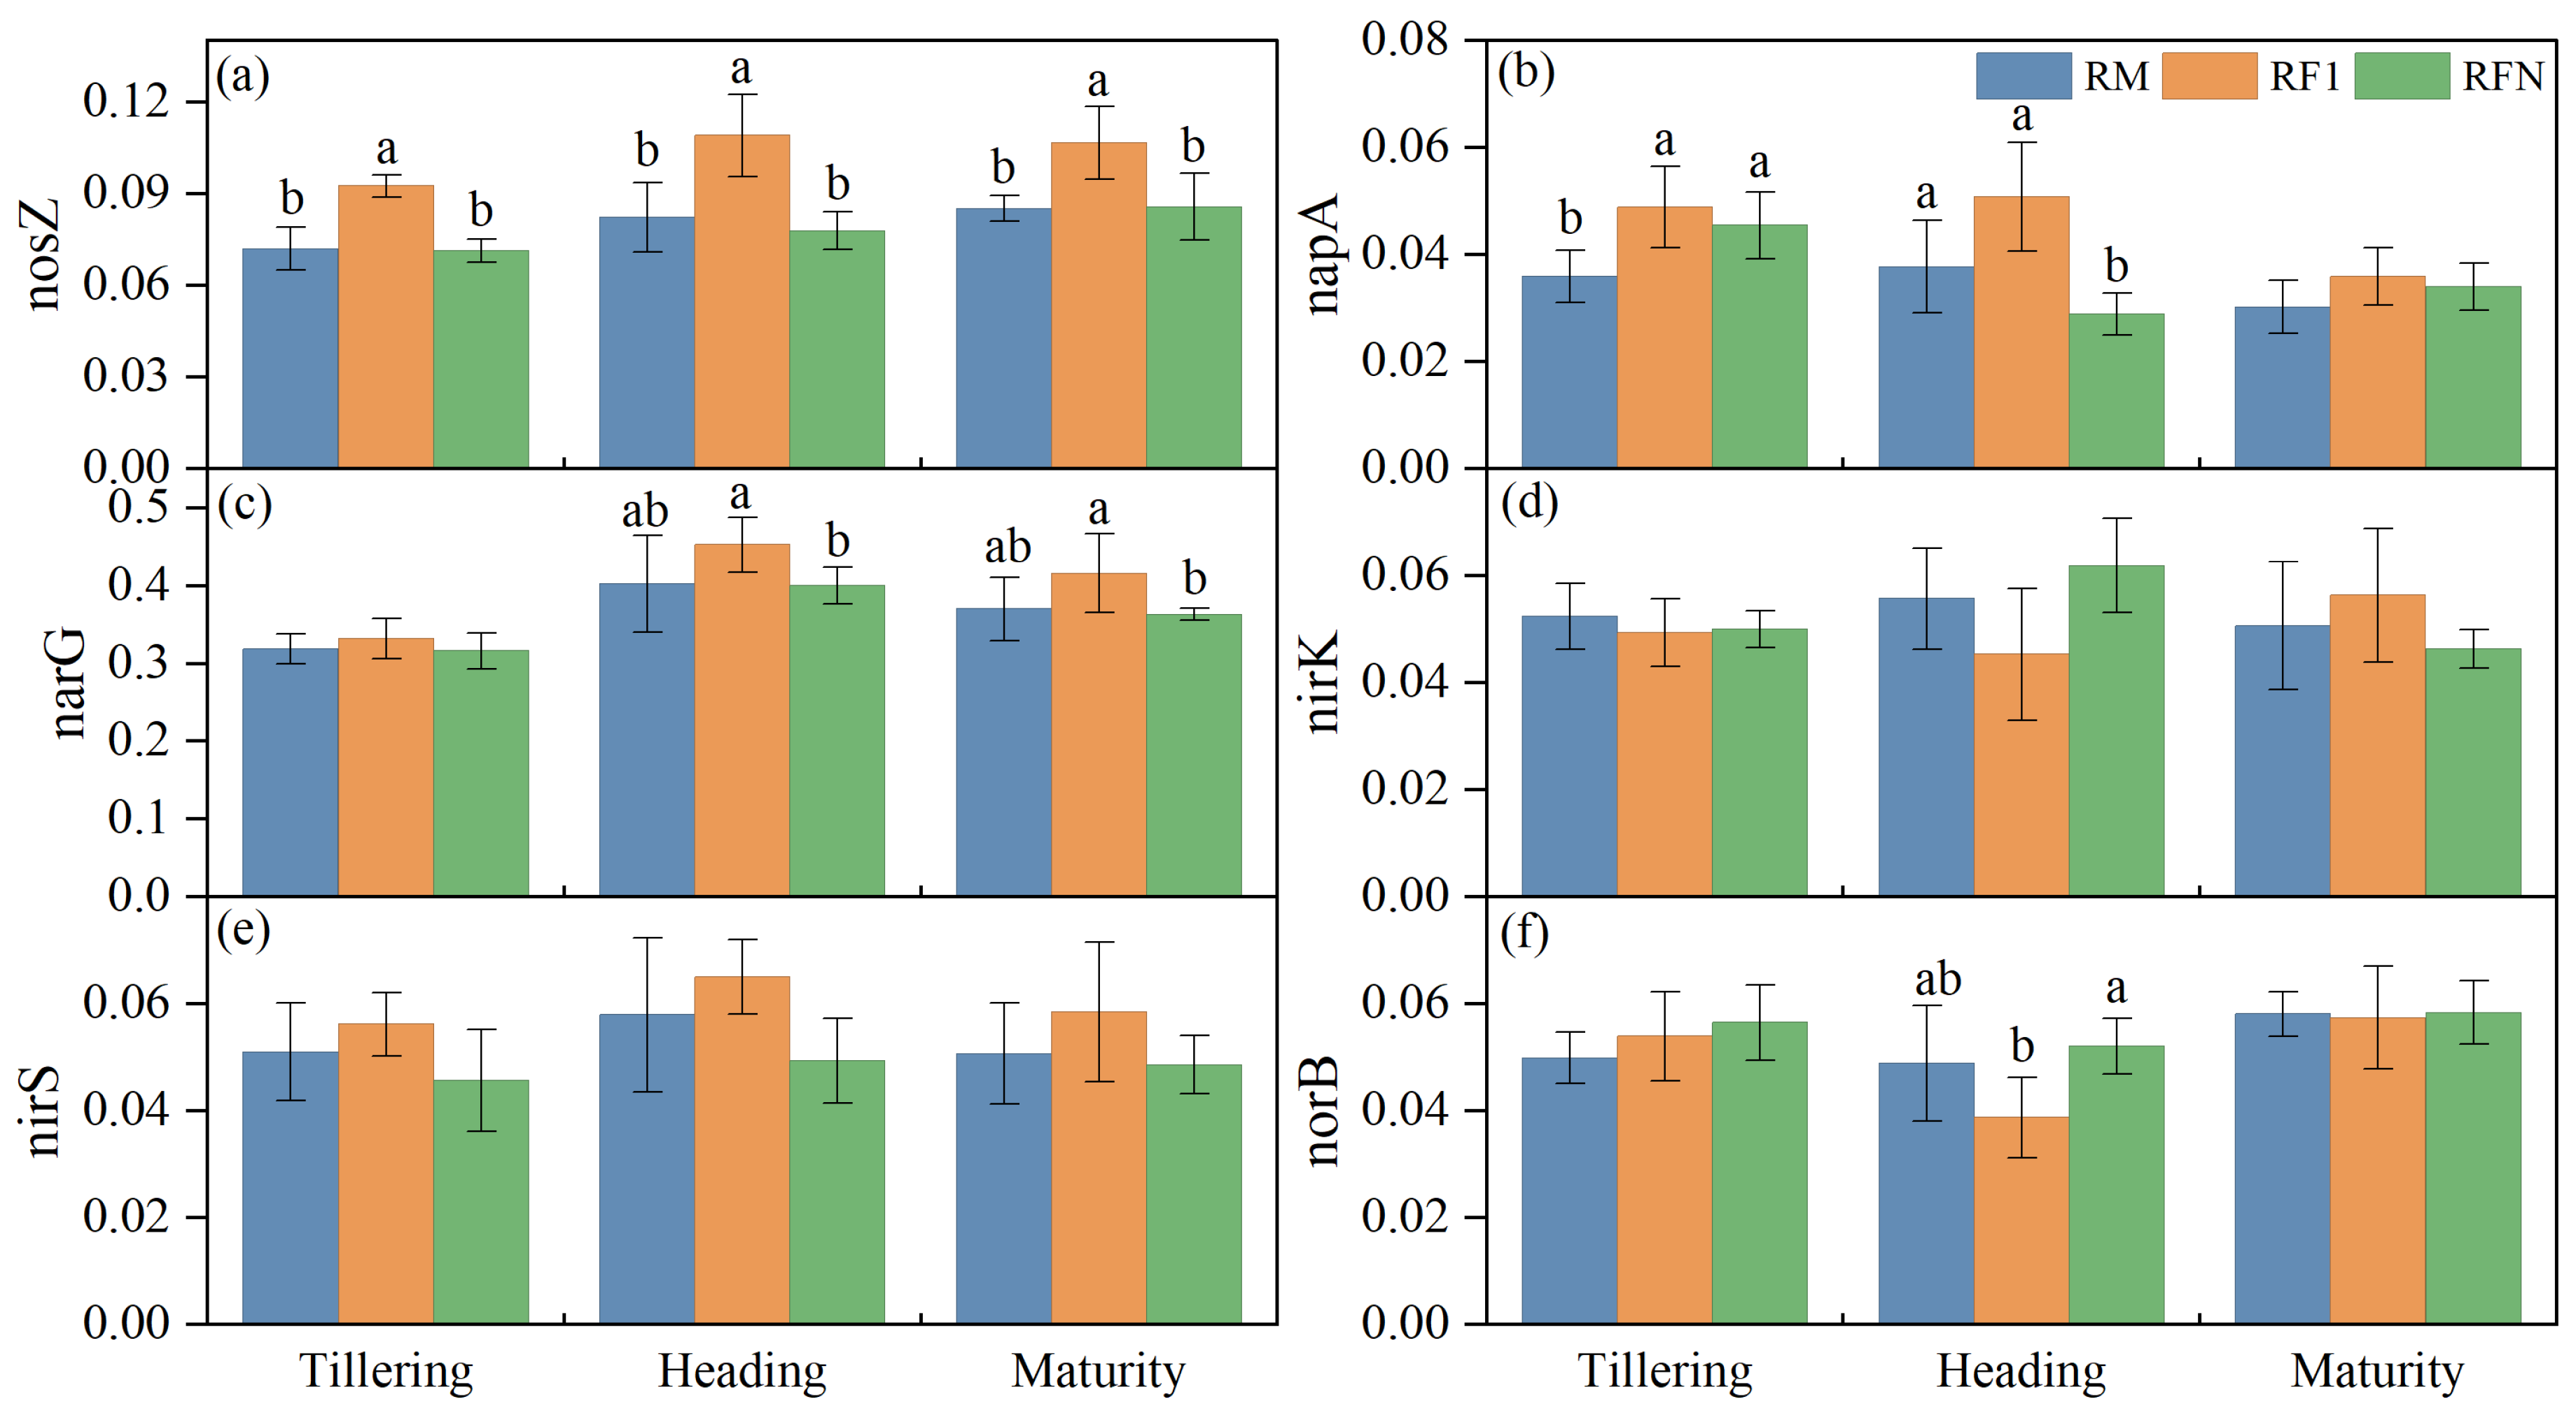
Figure 5a).
nosZ relative abundance in RF1 was significantly higher than in both RM and RFN across all three growth stages, being 25–33% above RM at each stage (
p < 0.05), while RFN was non-significant compared to RM at every stage. This pattern points to a transient but temporally consistent enhancement of the N
2O consumption potential under first-year co-culture that was not retained under long-established co-culture.
The upstream genes of the denitrification cascade showed milder and more stage-specific responses.
napA, encoding the periplasmic nitrate reductase, was elevated in both co-culture treatments at the tillering stage, but by heading had diverged such that RF1 remained elevated while RFN had dropped below RM (
Figure 5b).
narG was significantly higher in RF1 than in RFN at both the heading and maturity stages (
Figure 5a). Neither
nirK nor
nirS showed a significant omnibus treatment effect at any growth stage (
p > 0.05).
The terminal gene norB, encoding nitric oxide reductase and catalyzing the direct production of N2O from NO, was significantly lower in RF1 than in RFN at the heading stage, while RM occupied an intermediate position not significantly different from either.
3.4. DNRA, Nitrification, and Other N-Cycling Gene Abundances
Beyond the denitrification cascade, several N-cycling genes displayed stage-specific responses (
Figure 6). At the heading stage,
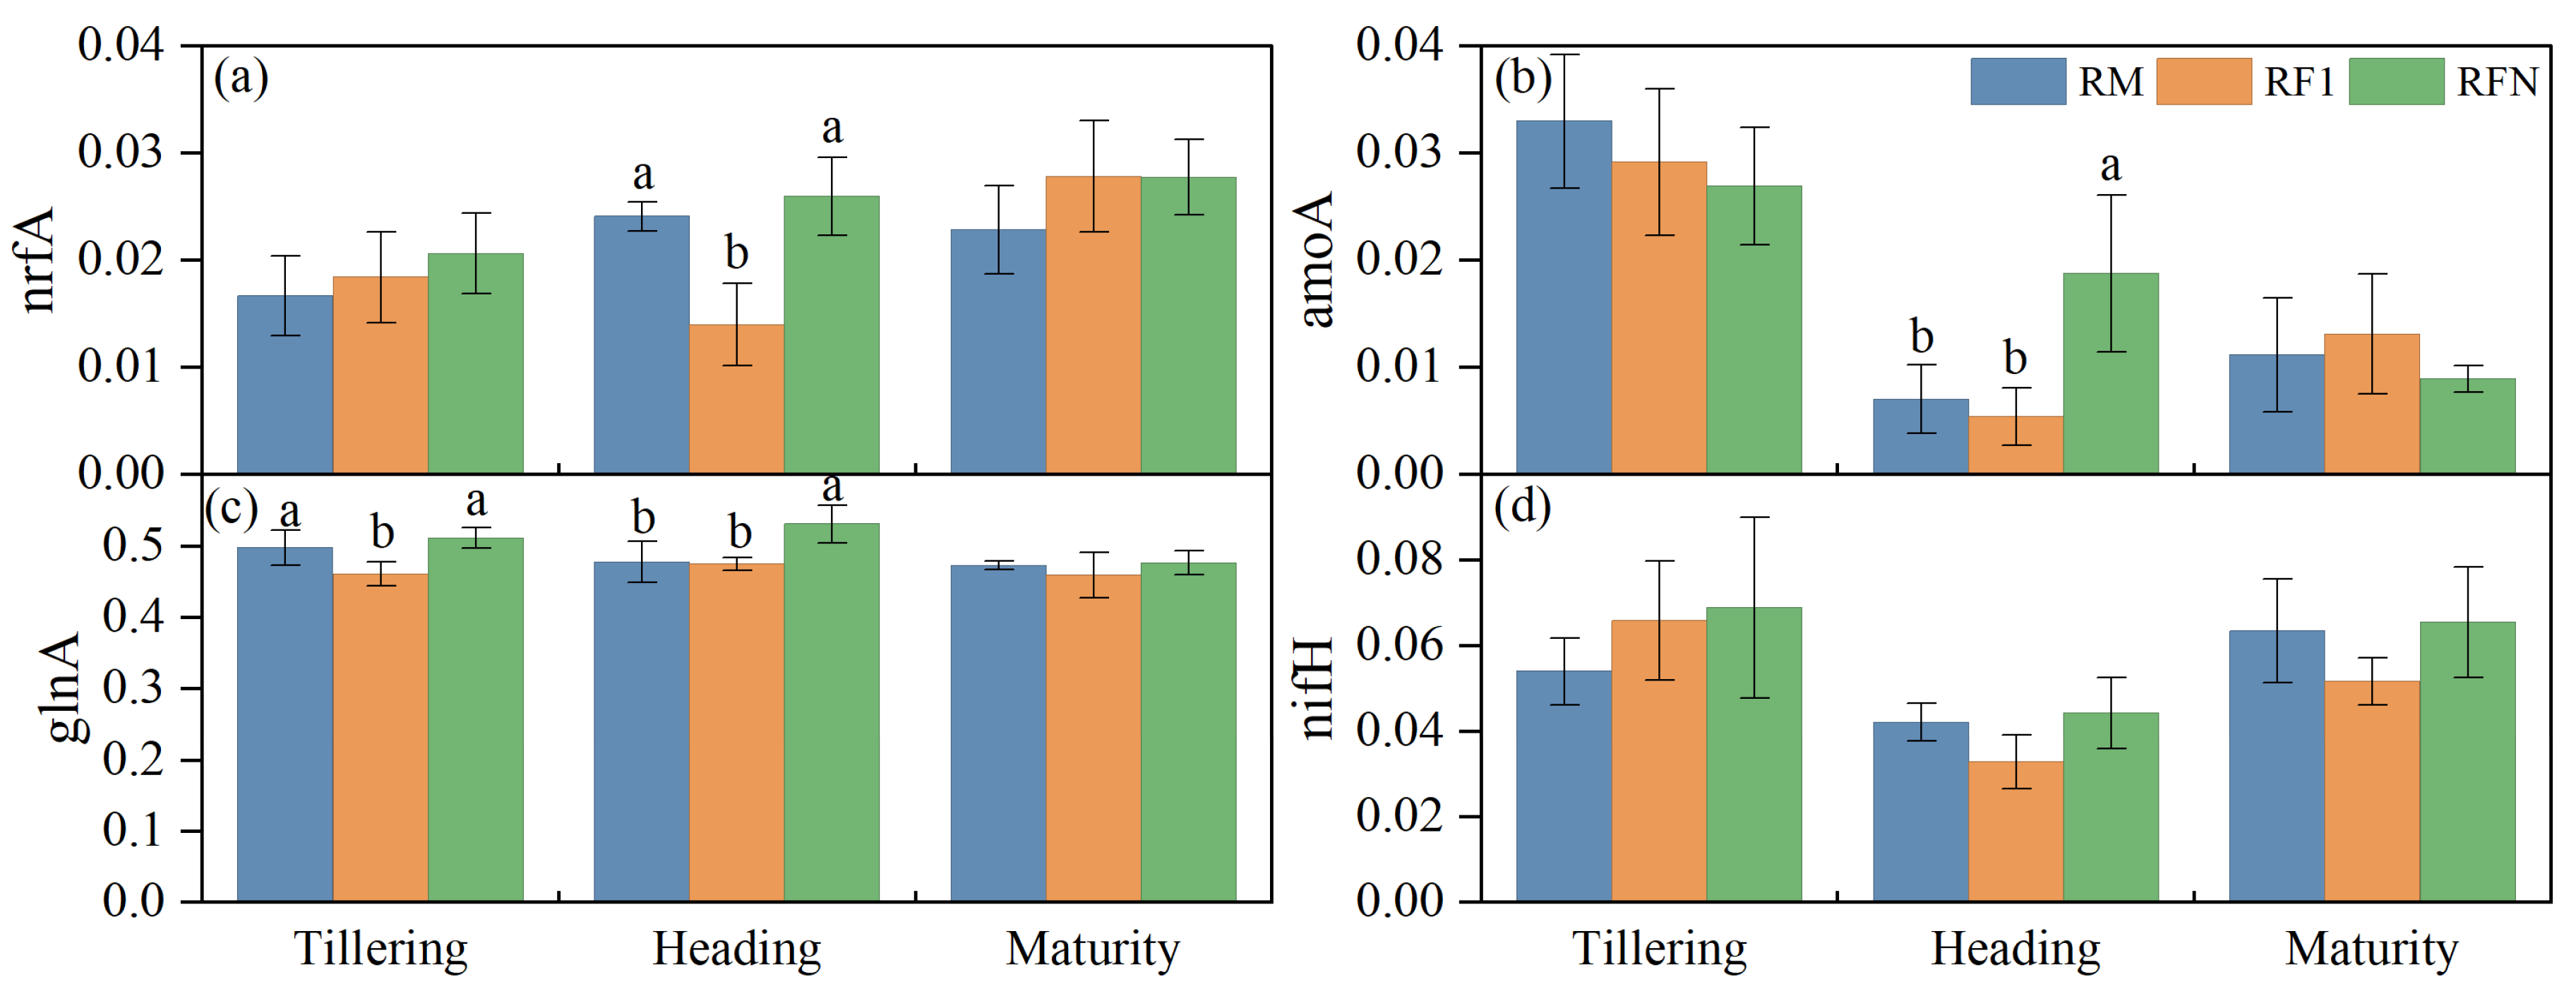
nrfA—the marker gene for DNRA—showed a significant treatment effect:
nrfA abundance in RF1 was reduced by 42% relative to RM, while RFN did not differ significantly from RM.
The nitrification gene amoA also responded at the heading stage, but with a distinctive pattern: amoA abundance in RFN was 2.7-fold higher than RM and 3.4-fold higher than RF1 (p < 0.05), while RM and RF1 were statistically indistinguishable.
glnA (glutamine synthetase, NH4+ assimilation) was consistently elevated in RFN relative to RF1, reaching statistical significance at both the tillering and heading stages, consistent with enhanced microbial NH4+ assimilation potential under long-term co-culture. nifH (nitrogenase iron protein, N2 fixation) showed no significant treatment effect at any growth stage.
3.5. Functional Gene Ratios Related to N2O Production–Consumption Balance
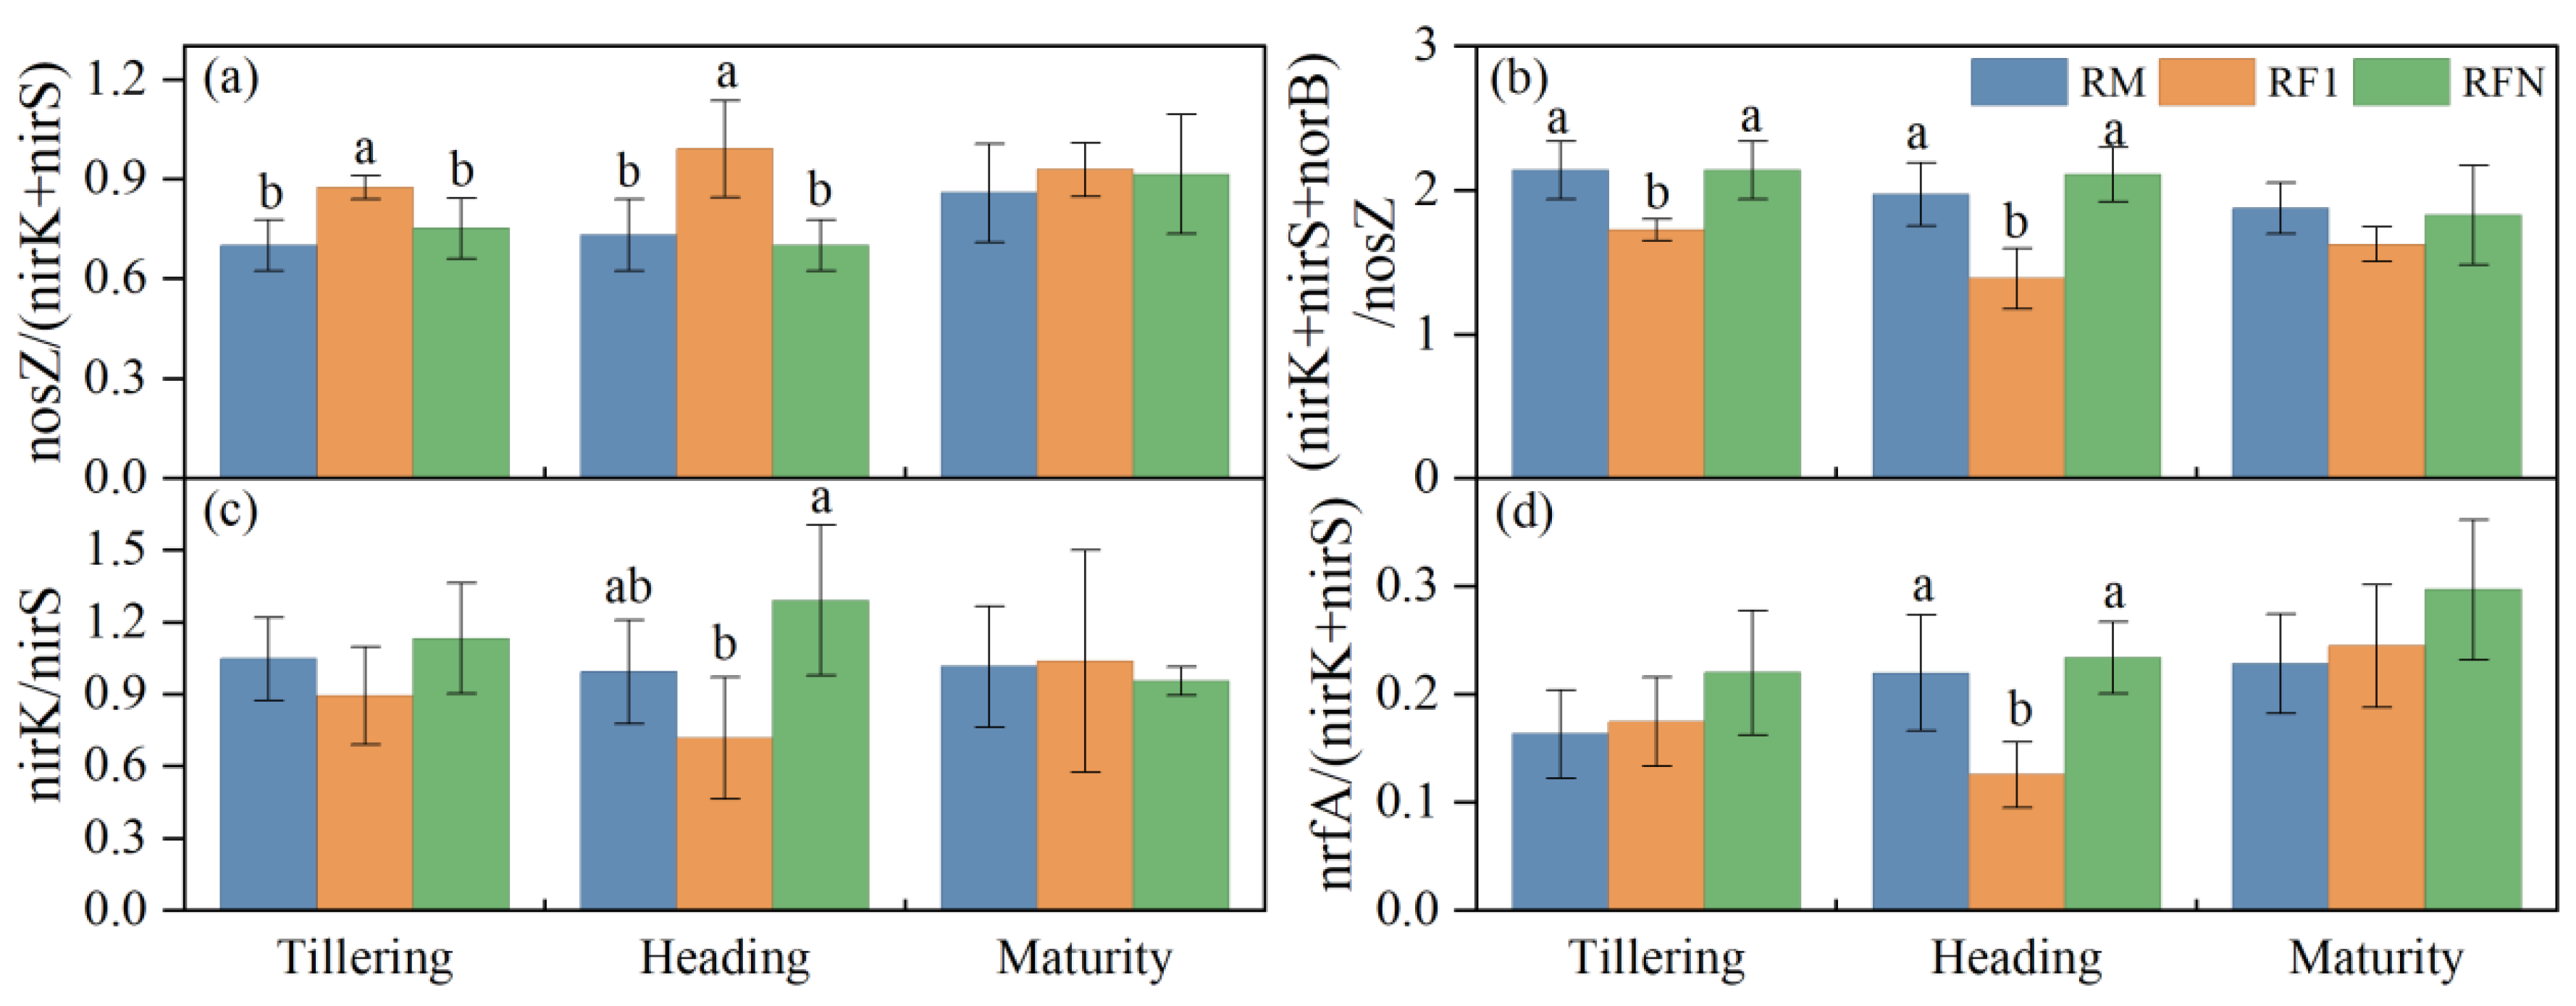
Four integrated ratios were calculated to synthesize the competing N
2O production and consumption potentials (
Figure 7). The sink-to-source ratio
nosZ/(
nirK +
nirS) was significantly elevated in RF1 at both the tillering and heading stages (
p < 0.05), reaching 0.99 ± 0.15 at heading—approaching unity—compared with 0.73 ± 0.11 in RM and 0.70 ± 0.08 in RFN, which did not differ from each other. The inverse production-to-consumption ratio (
nirK +
nirS +
norB)/
nosZ mirrored this pattern: RF1 was significantly lower than RM and RFN at the tillering and heading stage (
p < 0.05), while RFN remained statistically indistinguishable from RM throughout. Both ratios converge on the same conclusion: first-year co-culture shifted the denitrification cascade toward complete reduction of N
2O to N
2, whereas long-term co-culture did not sustain this shift.
Two additional ratios illuminated complementary aspects of the community-level response at the heading stage. The
nirK/
nirS ratio diverged between RF1 (0.72,
nirS-dominant) and RFN (1.29,
nirK-dominant;
p < 0.05), with RM (1.01) being intermediate and not significantly different from either treatment (
Figure 7c). Although the individual abundances of
nirK and
nirS were not significantly affected by treatment, their ratio revealed an underlying divergence in denitrifier community composition between short-term and long-term co-culture. This is because within-sample ratios capture co-variation between the two denitrifier sub-communities that is invisible in between-sample comparisons of absolute abundances; the ratio therefore integrates community-compositional information at a level of resolution not accessible from marginal gene abundances alone. The DNRA competition index
nrfA/(
nirK +
nirS) was significantly reduced in RF1 at the heading stage relative to both RM and RFN (
Figure 7d), consistent with the transient DNRA suppression documented in
Section 3.4.
We note an important interpretive caveat: these ratios are derived from metagenomic relative abundances and should not be directly equated with qPCR-based gene-copy ratios or with enzyme activity ratios. A nosZ/(nirK + nirS) value approaching unity does not literally imply a biochemical equilibrium between N2O production and consumption, but rather reflects a relative shift in the underlying community composition and functional potential.
3.6. Correlations Between Functional Genes and Environmental Factors
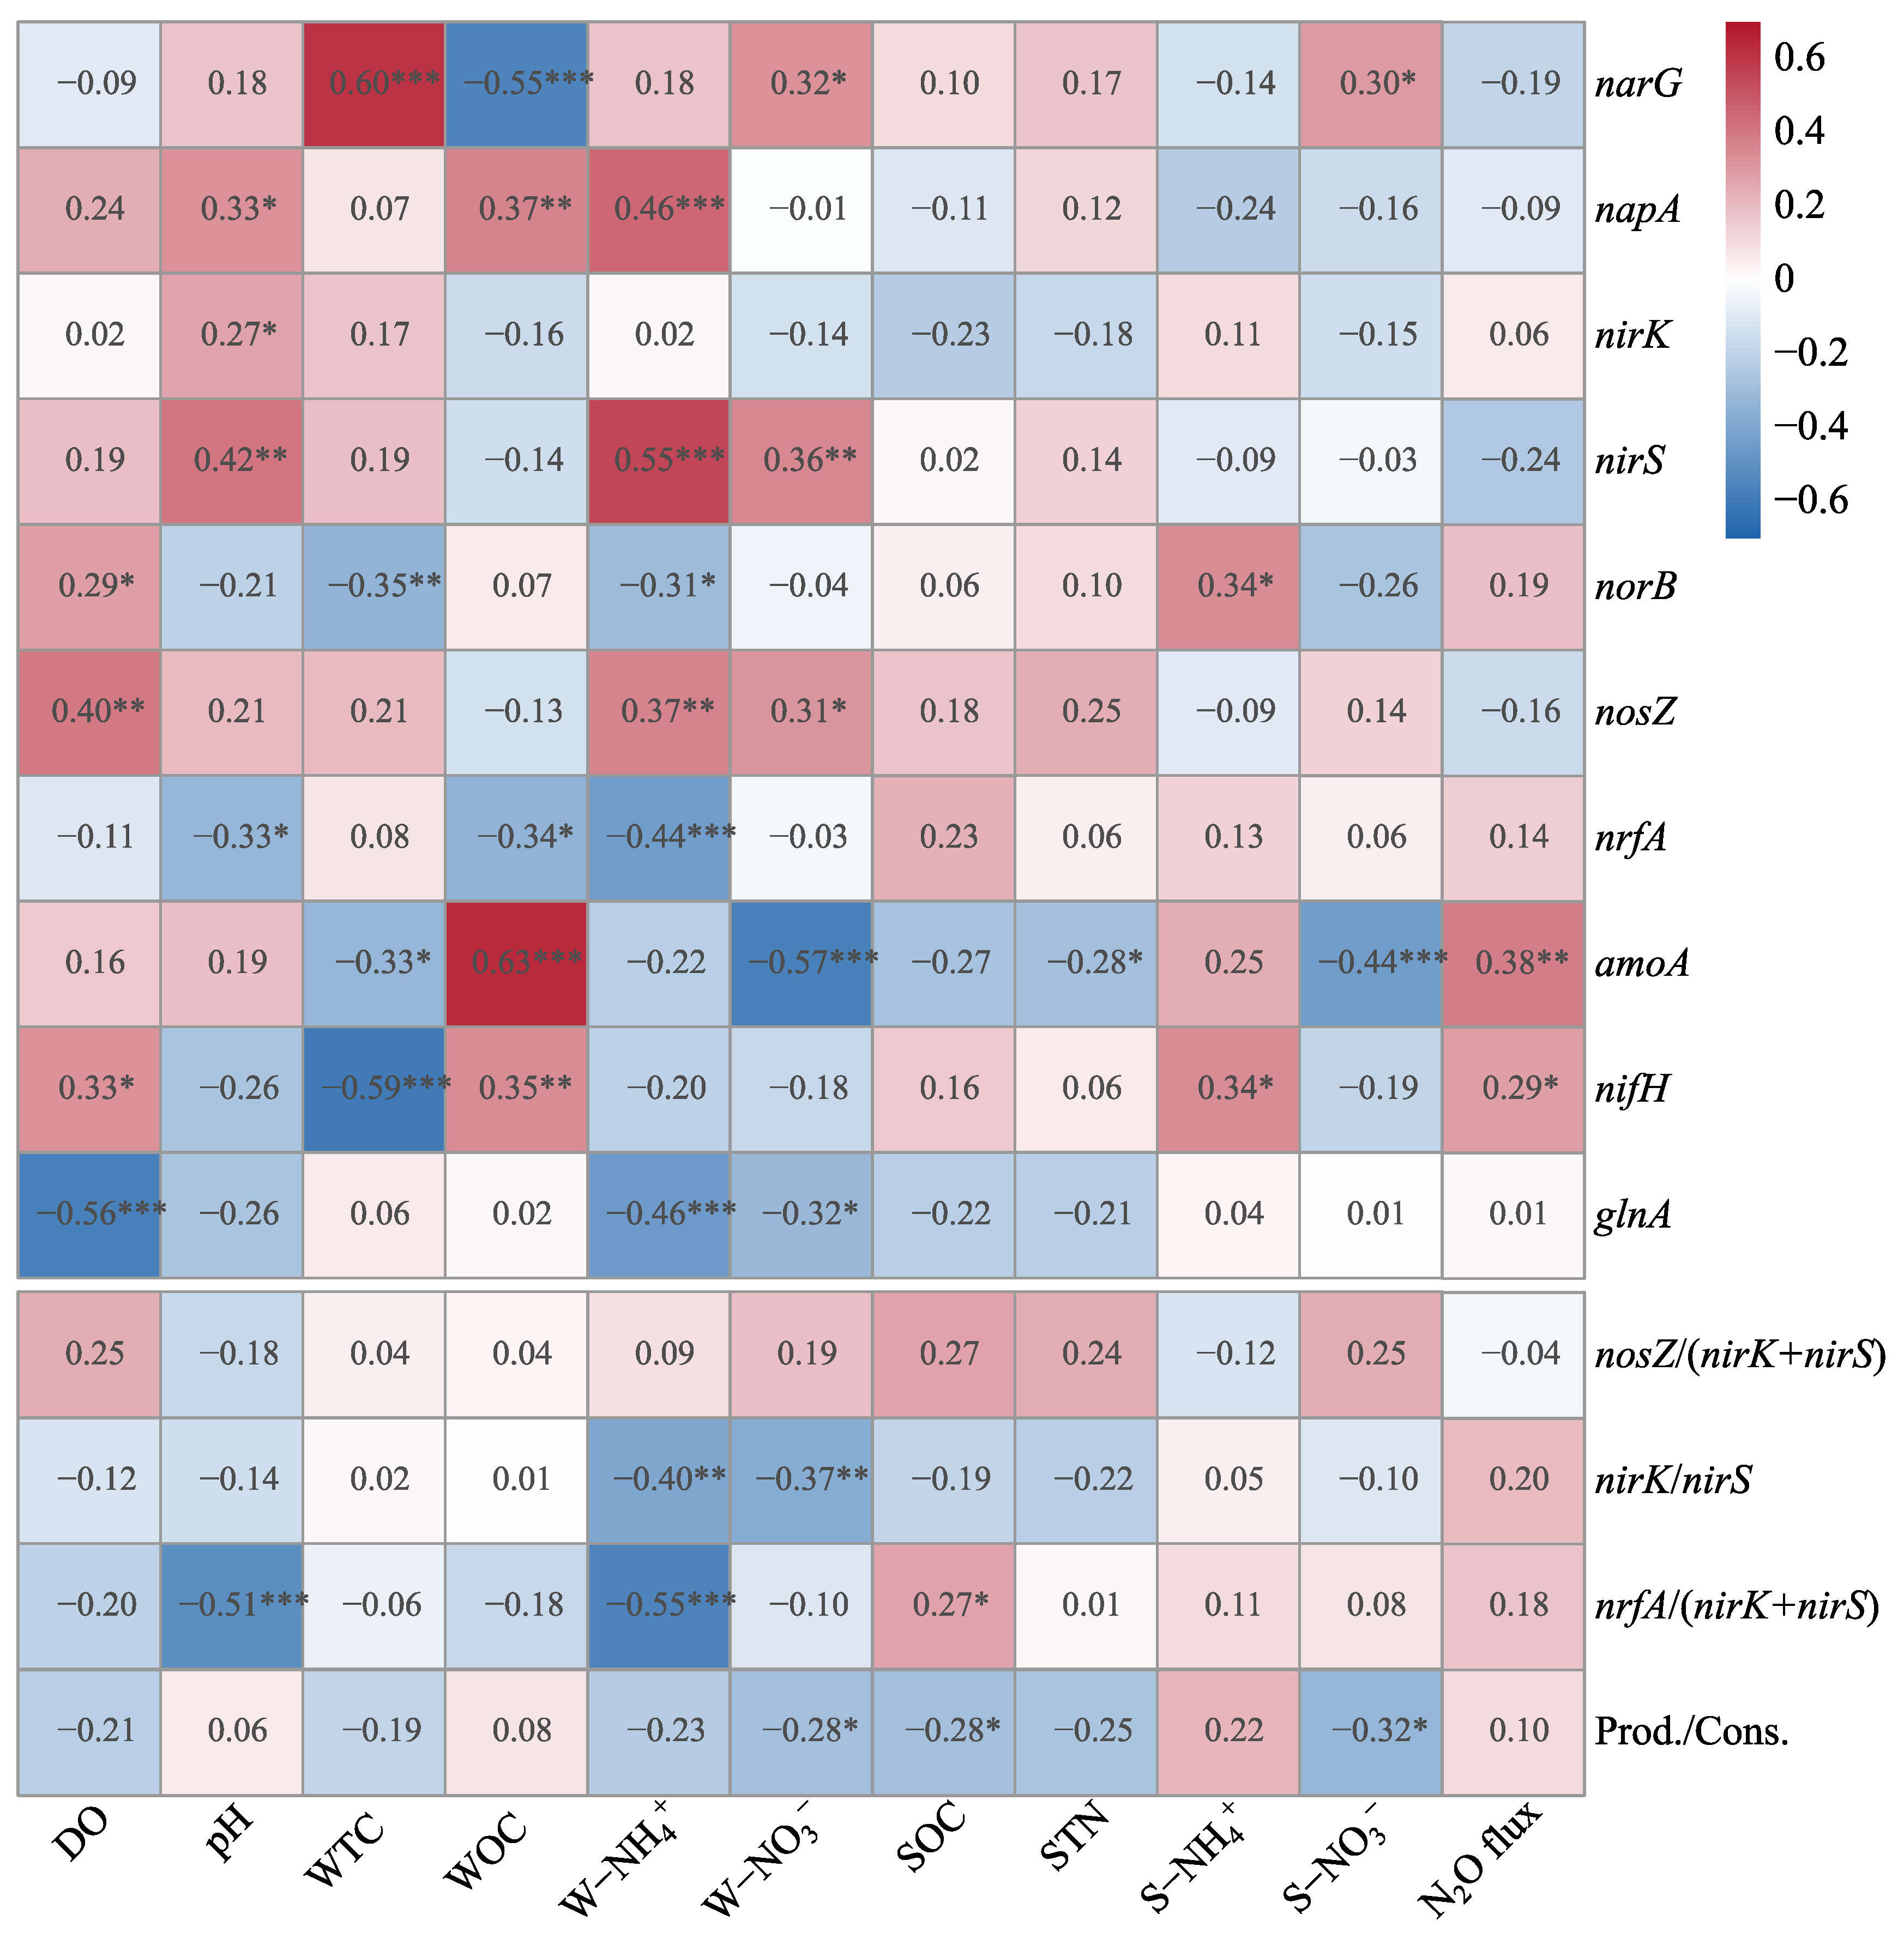
Spearman correlation analysis showed that water-phase variables were the dominant environmental correlates of the nitrogen-cycling functional gene network, whereas soil-phase variables showed comparatively few associations (
Figure 8). Water ammonium had the most extensive correlation network of any single variable; dissolved oxygen was the strongest single positive correlate of
nosZ (ρ = 0.40,
p < 0.01), consistent with redox-sensitive selection on facultative-aerobic
nosZ-harboring organisms; and water organic carbon was most strongly and positively associated with
amoA (ρ = 0.63,
p < 0.001).
A consistent nitrification-feedback signal also emerged: water nitrate co-varied positively with the denitrification cascade (narG, nirS, nosZ) and strongly negatively with amoA (ρ = −0.57, p < 0.001), and a parallel negative soil nitrate–amoA correlation was the most notable soil-phase signal. amoA was the only individual gene whose abundance correlated significantly with the measured N2O flux.
4. Discussion
4.1. N2O Emission Fluxes in the Qingtian Rice–Fish System
N
2O fluxes in this study (about 43–65 μg N
2O–N m
−2 h
−1 at tillering and maturity) were far below those reported for conventionally fertilized rice systems [
22], and did not differ among the three treatments. This agrees with recent evidence that the N
2O response of rice–animal co-culture is highly variable and often not significant relative to monoculture, and that it depends on the co-culture type, management and rice cultivar [
9,
26,
27,
28]; this contrasts with field studies that reported significant reductions [
7,
8].
The low absolute fluxes are consistent with the high in situ N
2O reduction efficiency of flooded paddy soils under low nitrogen, where most of the N
2O produced is reduced to N
2 by
nosZ before emission [
29]. We attribute this background to the low-input management of the Qingtian system, which uses neither chemical fertilizer nor supplementary feed. The resulting scarcity of mineral nitrogen limits the substrate available for nitrification and denitrification [
8], and water NO
3− and NH
4+ here were far lower than in fed rice–fish systems [
30]. In this low-flux regime, a between-treatment difference of a few μg N
2O–N m
−2 h
−1 would fall within the detection limit of static-chamber sampling. The absence of a significant treatment effect on flux therefore does not rule out the contrasting microbial signatures described below; it means those signatures should be read as differences in functional potential, not as measured emission differences.
Two limits on the flux result should be stated. First, sampling on two days per stage under stable weather captures the inter-event background and under-represents the episodic peaks that often dominate cumulative paddy N
2O budgets [
23,
31]. Second, because the system is substrate-limited, the absence of treatment-level flux differences is a boundary condition rather than a true null result: any fish-mediated effect on the nitrogen-cycling community is expressed as altered functional potential that may or may not translate into emissions once substrate limitation is relaxed.
4.2. Short-Term Priming Toward Complete Denitrification Under First-Year Co-Culture
The clearest microbial result was the consistent enrichment of
nosZ in RF1 across all three growth stages (25–33% above RM), together with
norB suppression at heading (significant in the per-stage test, but not retained in the mixed-model analysis;
Supplementary Table S2). Because
nosZ encodes the only known enzymatic sink for N
2O [
13,
14] and
norB catalyzes the preceding N
2O-producing step, these shifts point to a denitrification cascade tuned toward complete reduction of N
2O to N
2. Consistent with this, the
nosZ/(
nirK +
nirS) ratio approached unity (0.99) at heading in RF1, and the (
nirK +
nirS +
norB)/
nosZ ratio fell from 1.97 in RM to 1.39, a change comparable to those linked to N
2O mitigation in agricultural meta-analyses [
32].
Two fish-mediated mechanisms can explain this RF1-specific shift. The first, and the one most directly supported by our data, acts on the competing DNRA pathway through labile carbon. Water organic carbon in RF1 was significantly higher at heading than in RM and RFN, consistent with a transient pulse from fish excretion and bioturbation. Although water organic carbon did not correlate directly with
nosZ, it correlated negatively with
nrfA. This offers a coherent explanation for the simultaneous nrfA suppression and the lower production-to-consumption ratio in RF1: by diverting NO
2− away from DNRA, the carbon pulse leaves more NO
2− for complete denitrification. The pattern agrees with reports that labile-carbon inputs favor complete denitrification to N
2 over competing NO
2− sinks [
16,
32].
The second mechanism acts on the producer community through redox conditions, and works mainly as a constraint on the long-term signature rather than as a driver of the initial RF1 response. Dissolved oxygen was the strongest environmental correlate of
nosZ across the dataset, which fits the preference of many
nosZ-harboring bacteria for oscillating oxic–anoxic conditions [
14,
33]. RF1 and RM did not differ in dissolved oxygen at any stage, so oxygen cannot account for the
nosZ enrichment in RF1; its role is instead seen in RFN, where persistently lower oxygen would gradually select against facultative
nosZ-harboring organisms. The two mechanisms therefore act on different parts of the non-monotonic pattern: the carbon pulse drives the rise from RM to RF1, and the oxygen gradient drives the fall back from RF1 to RFN.
Both mechanisms depend on enough NH
4+ substrate being retained in RF1. Ammonium is increasingly seen as a master regulator of denitrifier activity in paddy systems: it fuels nitrification and so sustains the downstream NO
3−–NO
2− pool [
3,
11], and it weakens the competitive advantage of DNRA [
17,
34,
35]. In line with this, water NH
4+ correlated positively with
nosZ and
nirS and negatively with
nrfA. In RF1, water NH
4+ stayed close to RM values through the season, preserving the substrate base on which both mechanisms operate.
4.3. Microbial Convergence Toward the Monoculture Baseline Under Long-Established Co-Culture
In contrast to RF1, the long-established RFN system showed no comparable changes: nosZ, norB, nirK, nirS, nrfA and the sink-to-source ratio were all statistically indistinguishable from RM at every stage, despite persistently lower dissolved oxygen and water NH4+ and higher soil NH4+ at heading. Because the design is cross-sectional, a genuine temporal trajectory cannot be fully separated from pre-existing differences between field clusters; the adjacent siting and shared irrigation source limit the main abiotic confounders, but plot-scale management history remains entangled with the co-culture signal.
The most marked RFN change in the water column is the sustained depletion of water NH
4+, which at heading and maturity was 60–80% lower than in RM and RF1. Water NH
4+ was the environmental variable most closely tied to the active denitrifier community here, and is a recognized regulator of nitrification–denitrification coupling in paddies [
11,
17], so its erosion in RFN offers a simple explanation for why the RF1 priming is not retained. The depletion coincided with soil NH
4+ accumulation, which points to enhanced water-to-soil transfer of ammonium rather than a system-level loss; fish movement and bioturbation plausibly accelerate this transfer into the rhizosphere [
24].
Once in the rhizosphere, the NH
4+ pool appears to be drawn down by two microbial sinks. The first is stage-specific nitrification, shown by the 2.7- to 3.4-fold rise in
amoA at heading seen only in RFN. The second is stronger NH
4+ assimilation, shown by the consistently elevated
glnA in RFN at tillering and heading, glutamine synthetase being the main high-affinity assimilation enzyme under low nitrogen [
36]. A minor contribution from fish biomass nitrogen retention cannot be excluded but is unlikely to dominate given the low stocking density. The net effect is a water column whose NH
4+ pool is both drained into the rhizosphere and turned over more quickly there, eroding the substrate base that the RF1-style shift would require.
amoA in RFN was also the only individual gene correlated with measured N2O flux, which raises the possibility that nitrification-derived N2O is a stage-specific emission pathway in this otherwise denitrification-dominated system; given the pooled correlation structure, this link is exploratory and would need isotopic source partitioning to confirm. DNRA, by contrast, was not activated under long-term co-culture: nrfA and nrfA/(nirK + nirS) in RFN did not differ from RM, so the significant RF1–RFN difference in nrfA reflects transient suppression in RF1 rather than activation in RFN.
Bulk soil organic carbon showed no treatment effect and was not correlated with any core denitrification gene, indicating that the residual RFN signatures do not arise from carbon accumulation but from selection acting at finer levels than gene abundance resolves. Whether the convergence reflects true acclimation, a return to a resilient baseline, or pre-existing heterogeneity cannot be resolved by a cross-sectional design.
4.4. Restructuring of Denitrifier Communities Across Co-Culture Durations
The
nirK/
nirS ratio, a common indicator of denitrifier community structure [
14,
19], diverged at heading between RF1 and RFN, with RM being intermediate. As noted in
Section 4.3, this divergence was significant in the per-stage test but only marginal in the mixed-model analysis (
Supplementary Table S2), so it is best read as a suggestive compositional signal. It is nonetheless informative, because it emerged without significant changes in
nirK or
nirS individually, illustrating that compositional ratios can capture restructuring that marginal abundances miss, which is useful in low-nitrogen systems where abundance changes are small.
Ecologically,
nirS-type denitrifiers are generally more responsive to environmental fluctuation and more strongly linked to N
2O fluxes in fertilized paddies [
37], whereas
nirK-type denitrifiers occupy a broader niche [
38] and respond more strongly under denitrification-inducing conditions in rice paddy soil [
39]. Under the persistently low oxygen of RFN, the more oxygen-sensitive
nirS-type would be selected against while the broader-niche
nirK-type is favored; RF1, by keeping an RM-like redox profile, retains the gradient that keeps
nirS-type organisms competitive. This is reinforced by the dataset-wide pattern that
nirK/
nirS declined as water NH
4+ and NO
3− increased, so that
nirK dominance co-occurs with the low water-phase inorganic nitrogen that characterizes RFN.
4.5. Implications, Limitations, and Future Perspectives
Across the full correlation network, fish-mediated effects on the nitrogen-cycling genes are carried mainly by water-phase variables (water NH4+, dissolved oxygen and water organic carbon) rather than by bulk soil variables, consistent with the mechanisms above.
The main practical implication is that short-term and long-established rice–fish systems should not be treated as equivalent in greenhouse-gas accounting: the rhizosphere signature shifts within the first season after fish introduction and does not persist in the same form over a decade. Whether the first-year priming would lower actual N2O emissions under higher nitrogen loading remains open, because added substrate could either scale up complete denitrification or saturate the nosZ step and allow for transient N2O accumulation.
Several limitations bound these inferences. Metagenomic abundances describe potential rather than expression or process rates, and the single KEGG entry for
nosZ does not separate clade I from clade II; metatranscriptomics and
15N isotopocule analysis would be needed to link the priming signature to fluxes. The flux sampling captures only inter-event background and omits episodic peaks [
40], including those driven by drainage [
23], so the absence of treatment-level flux differences is not an emission-based null result. Finally, the cross-sectional design cannot fully separate a temporal trajectory from residual differences between field clusters, and the reported correlations should be read as overall co-variation rather than strict inference. The most defensible reading of our results is that first-year rice–fish co-culture reconfigures the rhizosphere community toward complete denitrification, whereas long-established co-culture does not retain this signature, a non-monotonic pattern whose consequences for cumulative N
2O emissions remain to be tested.





 and
and