Article

The Winter Wheat Yield in the North China Plain Could Be Improved Through Nitrogen-Mediated Enhanced Tiller Formation and Biomass Production


1
State Key Laboratory of Wheat Improvement, Shandong Agricultural University, Tai’an 271018, China
2
Agricultural Information Institute, Chinese Academy of Agricultural Sciences, Beijing 100081, China
*
Author to whom correspondence should be addressed.
Agronomy 2026, 16(11), 1079; https://doi.org/10.3390/agronomy16111079
Submission received: 13 March 2026 / Revised: 19 April 2026 / Accepted: 27 April 2026 / Published: 29 May 2026
(This article belongs to the Section Soil and Plant Nutrition)

Abstract

Rational regulation of nitrogen input represents a crucial approach for simultaneously boosting cereal productivity and enhancing the efficiency of agricultural input use. Nevertheless, the intrinsic mechanisms of how nitrogen application regimes in the North China Plain (NCP) regulate grain yield and nitrogen use efficiency (NUE) of winter wheat (Triticum aestivum L.) by modulating tiller physiological traits remain elusive. A two-year field experiment from 2023 to 2025 was carried out with four nitrogen application levels: conventional rate of 210 kg N ha−1 (N2), 10% nitrogen increase (N1), 10% nitrogen reduction (N3), and 20% nitrogen reduction (N4). Physiological traits of the wheat population were systematically investigated, and the correlations among grain yield, NUE and physiological indices were analyzed. The results indicated that moderate nitrogen reduction (N3) effectively inhibited ineffective tillers and maintained sufficiently stable stems at maturity. Meanwhile, N3 enhanced flag leaf photosynthesis, sucrose synthase and sucrose phosphate synthase activities, delayed flag leaf senescence during mid-late grain filling, and facilitated grain photoassimilate accumulation. On average across two years, N3 increased yield by 6.53% and 9.49% compared with N1 and N4, showing no remarkable difference from N2, while achieving the highest NUE. Further analysis demonstrated that tiller establishment and photoassimilate accumulation dominate wheat yield formation. In conclusion, optimized nitrogen management of N3 realizes synergistic improvement of yield and NUE, reduces agricultural resource input, and promotes sustainable green development of winter wheat production in the NCP.

1. Introduction

With global population expansion and continuous reduction in cultivated land area, sustaining and enhancing wheat output has become imperative for ensuring worldwide food sufficiency [1]. The North China Plain, as the most important wheat-producing region in China, maintaining the stability and increase in its output, is of irreplaceable strategic significance for ensuring national food security. With the research and technological innovation of agricultural scientists, numerous high-yield wheat fields with an average yield exceeding 12,000 kg ha−1 have been developed in this region. However, the area of medium- and low-yield wheat fields in this region accounts for about two-thirds of the total wheat field area, resulting in an average wheat yield of only 6000–7500 kg ha−1 in this area. Therefore, medium- and low-yield wheat fields have become the core bottleneck restricting the increase in wheat production capacity and the optimization of production efficiency in the North China Plain. It is urgent to break through the limitations of their yield potential through targeted cultivation and management techniques. Yu et al. found that 45% of the increase in crop yield in China between 1955 and 2014 was attributable to nitrogen fertilization input [2]. However, excessive nitrogen fertilizer is widely applied by farmers; the excessive nitrogen fertilizer addition results in no utilization of more than 50% of nitrogen fertilizer worldwide, which has triggered severe environmental problems, including soil nitrate leaching, groundwater contamination, and greenhouse gas emissions [3]. Given the challenges of food security and environmental risks, further increases in wheat production will have to rely on existing farmland while finding ways to make the most efficient use of available resources.
Nitrogen is an essential nutrient for wheat production that supports the current and future human population [4]. Nitrogen fertilizer application is used to increase the grain yield of winter wheat (Triticum aestivum L.), but inappropriate fertilization management methods and excessive nitrogen rates lead to high nitrogen losses and low nitrogen use efficiency through nitrate leaching and nitrogen gaseous losses, mostly through ammonia (NH3) volatilization and denitrification (N2O, N2) [5]. In order to meet the demand for sufficient supply during wheat growth, excessive nitrogen fertilizer has been generally adopted by farmers in China [6]. By 2022, national fertilizer consumption in Chinese agriculture totaled 50.79 million metric tons, including 16.54 million metric tons of nitrogenous fertilizers—representing a 4-fold and 1.77-fold increase compared to 1980 levels, in that order. The actual nitrogen application rate in China far exceeds the economically optimal rate [7]. Previous studies had demonstrated that rational nitrogen application significantly increased the grain yield of wheat [8], but excessive nitrogen application not only led to waste of agricultural production resources and decrease in NUE, but also caused a series of environmental problems (e.g., soil NO3- leaching into groundwater, eutrophication of surface water and an increase in greenhouse gas N2O emission) [9]. An important goal of sustainable agriculture is to increase production while reducing nitrogen fertilizer application [10]; thus, finding suitable reducing nitrogen fertilizer application in medium- and low-yield wheat fields is very necessary for the green and sustainable development of agriculture.
Since nitrogen is the most important factor in the formation of wheat grain yield, optimizing nitrogen application is the most effective method to increase grain yield. A previous study showed that an increased amount of nitrogen application could greatly increase grain yield in winter wheat [11]. Similarly, more researchers believe that increasing nitrogen fertilizer application amount is a vital approach to enhance grain yield [12,13]. Xue et al. have shown that split nitrogen fertilizer application significantly increased grain yield [14]. A global-scale meta-analysis also indicated a 7.0% increase in grain yield with three to four times of nitrogen fertilizer compared with a single application [15]. Tillering is a vital agronomic trait that governs population structure, individual plant architecture, and final grain yield formation in wheat and other cereal crops [16]. Appropriate tiller development plays an indispensable roles in organic carbon and nutrient reservation within wheat plants. The quantity and quality of tillers directly determine the number of effective spikes, which is a core component of wheat yield. Moreover, reasonable tiller growth facilitates the proliferation of adventitious roots, strengthens farmland water and nutrient acquisition efficiency, and consequently regulates grain yield formation throughout the whole growth period [6]. Many studies have demonstrated that nitrogen fertilizer significantly regulates wheat tillering [6,17]. However, there is little research on how tillering growth dynamics respond to nitrogen fertilizer management at different tillering stages and how they regulate tillering and yield formation [17]. To understand these pivotal factors, we conducted a two-year field experiment in the North China Plain. We aimed to systematically examine the effects of different nitrogen fertilizer management treatment on tillers and photosynthetic matter accumulation in a single stem of winter wheat as well as the different tillering effects on grain yield factors. We hypothesized that moderate nitrogen reduction could regulate tiller differentiation, reduce ineffective tillers, enhance post-anthesis photosynthetic function and assimilate transport, thereby synchronously improving grain yield and NUE of winter wheat. This study provides some new ideas for expanding tillering regulation, particularly for winter wheat production in the North China Plain.

2. Materials and Methods

2.1. Experimental Site

This experiment was carried out in the Wheat Industry Research Institute of Shandong Agricultural University (36°40′ N, 116°65′ E), in De’zhou City, Shandong Province, during the 2023–2025 wheat growing season. The two-year experiment was carried out in two separate but adjacent fields within the same experimental station, with a distance of approximately 50 m between them. Both fields had maize as the preceding crop, and all maize straw was mechanically crushed and returned to the field immediately after harvest. The soil types of the two test sites were loam, which is classified as Eutric Cambisols according to the World Reference Base for Soil Resources (WRB) [16].
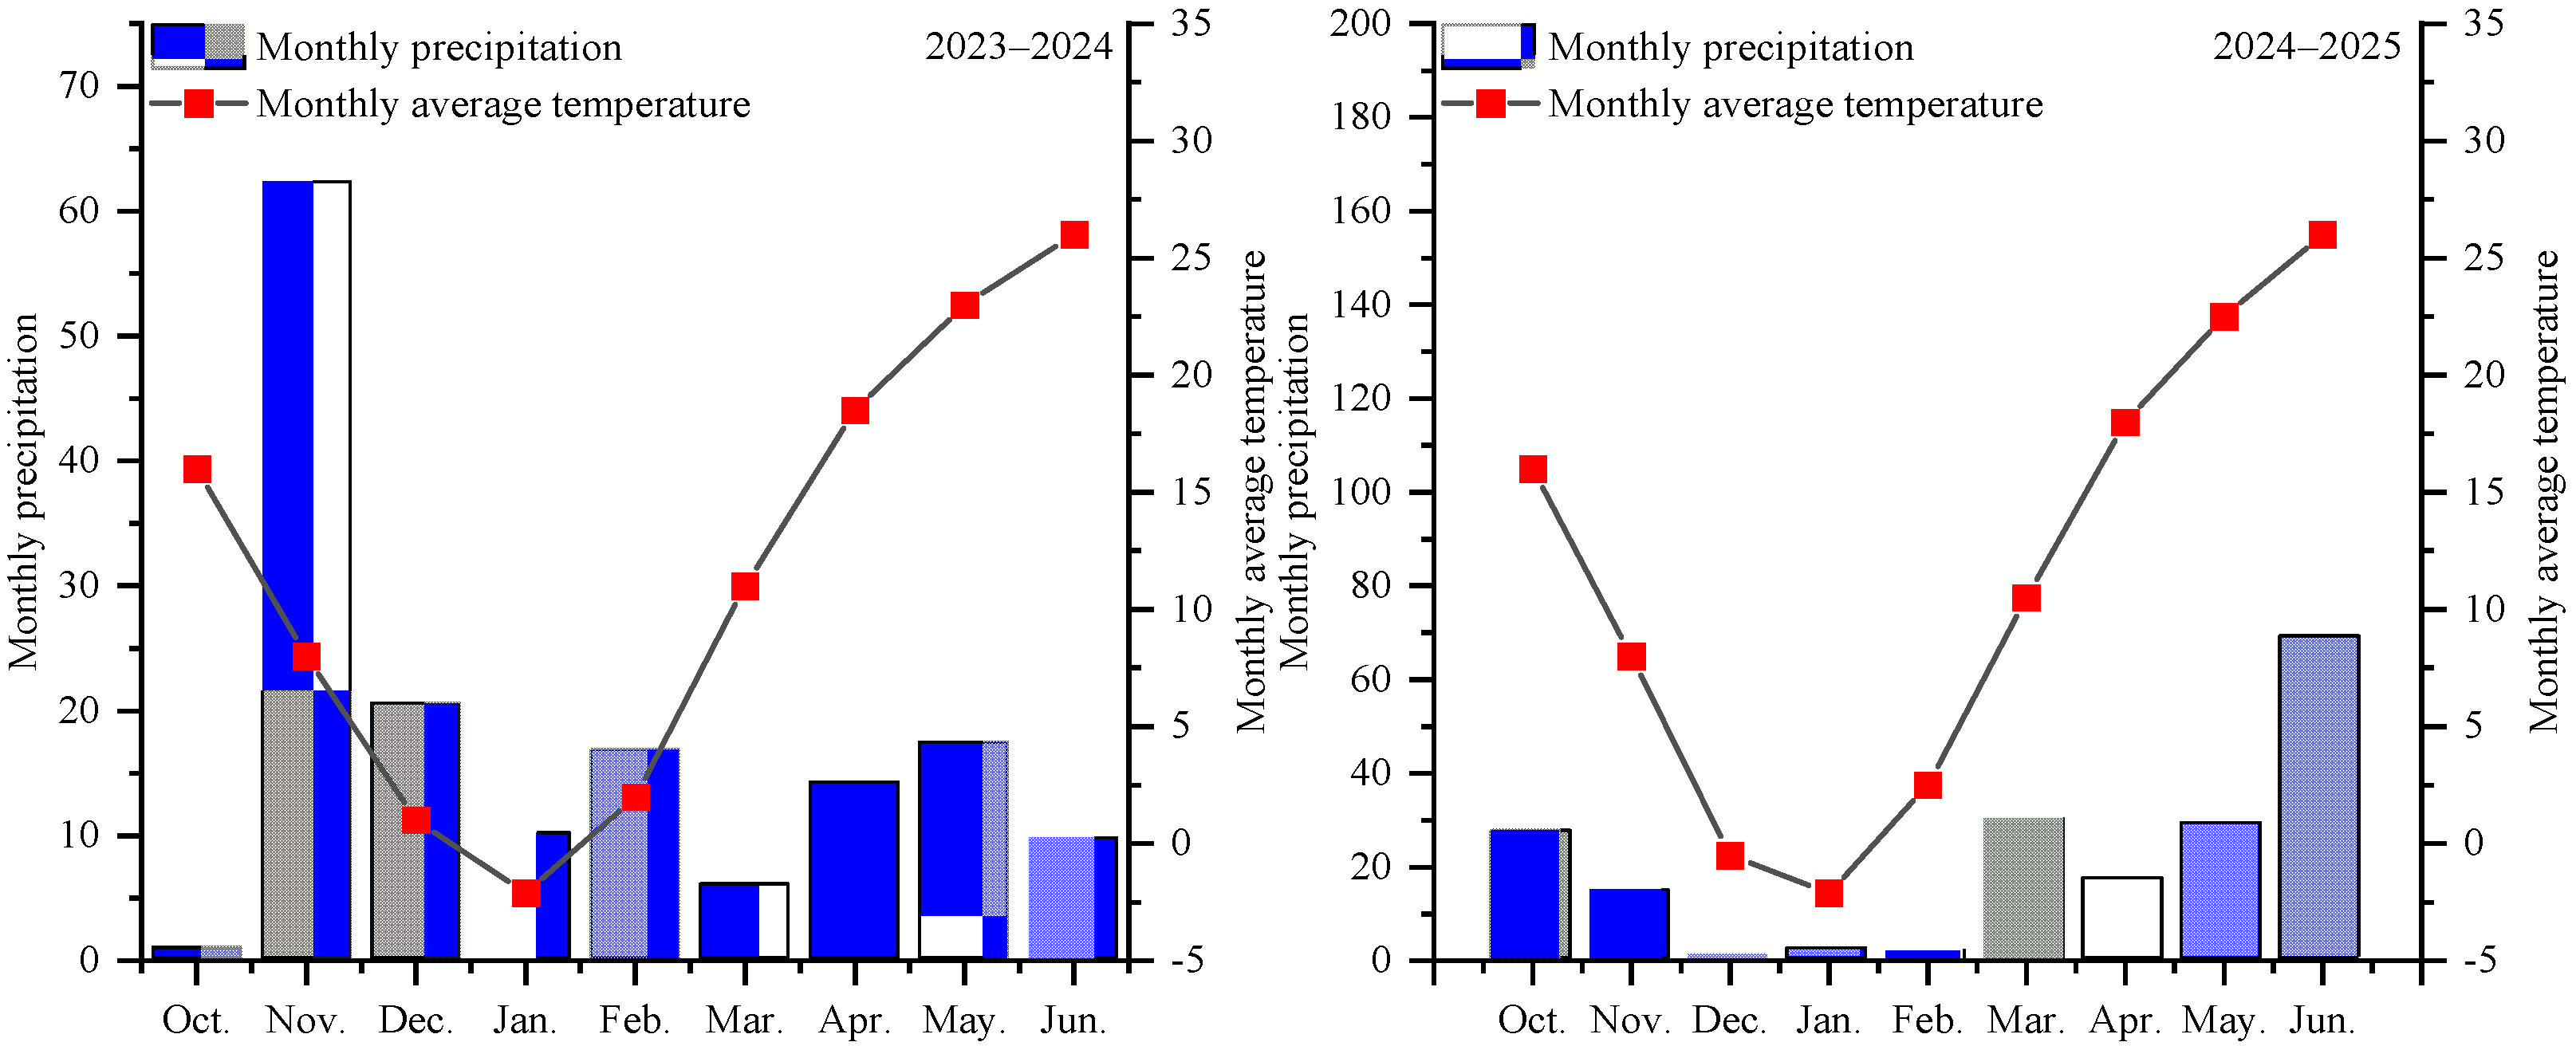
In 2023–2024, the soil organic matter content of 0–20 cm soil depth before wheat sowing was 10.1 g · kg−1, PH was 7.3, total nitrogen was 0.79 g · kg−1, alkali-hydrolyzed nitrogen was 85.42 mg · kg−1, available phosphorus was 34.54 mg · kg−1 and available potassium was 115.1 mg · kg−1. In 2024–2025, the soil organic matter content of 0–20 cm soil depth before wheat sowing was 10.1 g · kg−1, PH was 7.3, total nitrogen was 0.8 g · kg−1, alkali-hydrolyzed nitrogen was 85.8 mg · kg−1, available phosphorus was 36.3 mg · kg−1 and available potassium was 116.3 mg · kg−1. Soil chemical properties were determined using standard methods: soil organic matter by the potassium dichromate oxidation method [18], total nitrogen by the Kjeldahl method [19], alkali-hydrolyzed nitrogen by the alkaline hydrolysis diffusion method [18], available phosphorus by the Olsen method [20], and available potassium by the ammonium acetate extraction-flame photometry method [18]. The precipitation (mm) and temperature (°C) of wheat growing season are shown in Figure 1.

2.2. Experimental Design

The variety of wheat for the trial was ‘Jimai 22’. A randomized complete block design (RCBD) was adopted for the field trial. Experimental plots were established in wheat-producing areas with typical local productivity, averaging around 6750 kg ha−1 per annum. The conventional nitrogen application rate of 210 kg N ha−1 (N2) was adopted according to the local recommended fertilization standard for winter wheat in the North China Plain. On this basis, the fertilizer is increased by 10% (N1) and the fertilizer is reduced by 10% (N3) and 20% (N4) respectively, totaling four nitrogen application rates. Each treatment was repeated three times. The test area is 2 m × 15 m = 30 m2, and 2 m protection line is set between the cells. Before sowing, 150 kg ha−1 P2O5 (calcium superphosphate) and 150 kg ha−1 K2O (Potassium sulfate) were applied at the bottom of each treatment, and the ratio of bottom to top dressing of nitrogen fertilizer was 5:5. Specifically, 50% of the nitrogen fertilizer was applied as urea at sowing, and the remaining 50% was topdressed as urea at the jointing stage. The seedlings were fixed at the three-leaf stage of wheat. The sowing dates were 16 October 2023 and 15 October 2024, respectively. The harvest dates were June 14 and June 12. The planting densities were 24 plants m−2 and 22.5 plants m−2. Insecticides and herbicides were applied as needed. Supplemental irrigation was applied by surface flooding, with 60 mm irrigation at the jointing and anthesis stages, respectively, totaling 120 mm. Irrigation volume was measured by a water meter.

2.3. Measurements and Calculations

2.3.1. Tillering Markers and Tiller Number per Plant

After the three-leaf stage of wheat, the main stem and tillers of different tiller positions were marked with different colors according to the order of tiller occurrence. O represents the main stem, I, II, III and IV represent the first first tiller, the second first tiller, the third first tiller and the fourth first tiller, respectively. I-p represents the first second tiller produced by I tiller, and the tillers that occur after that are not marked and recorded as other tillers.
At the wintering and jointing of wheat, 60 representative wheat plants were selected per treatment (20 plants per replicate, three replicates). The number of tillers at each tiller position and the total number of tillers per plant were recorded.
At maturity, 20 representative wheat plants were selected from each treatment and repeated three times. The number of spikes per tiller and the total number of spikes per plant were recorded.

2.3.2. Total Tiller Number of Population

During the wintering, reviving, jointing, anthesis and maturity of wheat, 1 m2 of wheat with uniform growth was selected to investigate the total number of tillers (104 · hm−2).

2.3.3. Investigation on the Number of Spikes per Plant at Different Tiller Positions

At the maturity stage of wheat, 60 marked wheat plants were taken for each treatment, with a total of 3 replicates (20 plants per replicate). The average number of spikes per tiller position and total spikes per plant were measured.

2.3.4. Photosynthetic Parameters

The flag leaves of the main stem, I and II tillers were measured at 0, 7, 14, 21 and 28 days after anthesis. Photosynthetic gas exchange parameters—net assimilation rate (Pn), stomatal aperture conductance (Gs), and transpiration velocity (Tr)—were monitored using a portable infrared gas analyzer (LI-6400, LI-COR, Lincoln, NE, USA) during mid-morning hours (09:00–11:00 h) under clear sky conditions.

2.3.5. Sucrose Content and Sucrose Phosphate Synthase Activity

Three flag leaves with consistent growth were collected per sample at 0, 7, 14, 21 and 28 days after anthesis, and stored in an ultra-low temperature (−40 °C) refrigerator after quick freezing with dry ice. The sucrose (SS) content and sucrose phosphate synthase (SPS) activity in flag leaves of the main stem, tiller I and tiller II were determined by anthrone colorimetry with reference to Li et al. [9].

2.3.6. Superoxide Dismutase Activity, Malondialdehyde and Soluble Protein Content

Three flag leaves with consistent growth were collected per sample at 0, 7, 14, 21 and 28 days after anthesis, and stored in an ultra-low temperature (−40 °C) refrigerator after quick freezing with dry ice. The superoxide dismutase (SOD) activity, malondialdehyde (MDA) content and soluble protein (SP) content in flag leaves of main stem, I and II tillers were determined according to Li et al. [9].

2.3.7. Grain Weight per Spike and Grain Yield per Plant of Different Tillers

At the maturity stage of wheat, 60 labeled wheat plants were taken for each treatment, with a total of 3 replicates (20 plants per replicate). To investigate the number of grains per spike per tiller, each tiller was randomly numbered Thousand Kernel Weight (TKW), and the grain weight was measured. The calculation formula is:
Grain weight per spike   ( g   ·   spike 1 )   =   grain weight   ×   grain number per spike
Grain yield of each tiller   ( g   ·   stem 1 )   =   grain weight per spike   ×   number of spikes
Grain yield per plant   ( g   ·   plant 1 )   =   ( grain yield of each tiller )

2.3.8. Nitrogen Use Efficiency Calculation

Agronomic nitrogen use efficiency (ANUE, kg kg−1) = (grain yield of N application treatment − grain yield of zero N treatment)/nitrogen application rate.

2.4. Statistical Analysis

Normality and homogeneity of variances were verified using SPSS 12.5 (Chicago, IL, USA) prior to analysis. Differences among treatments were compared using Duncan’s multiple-range test at p < 0.05.

3. Results

3.1. Total Tiller Number of Population at Different Growth Stages

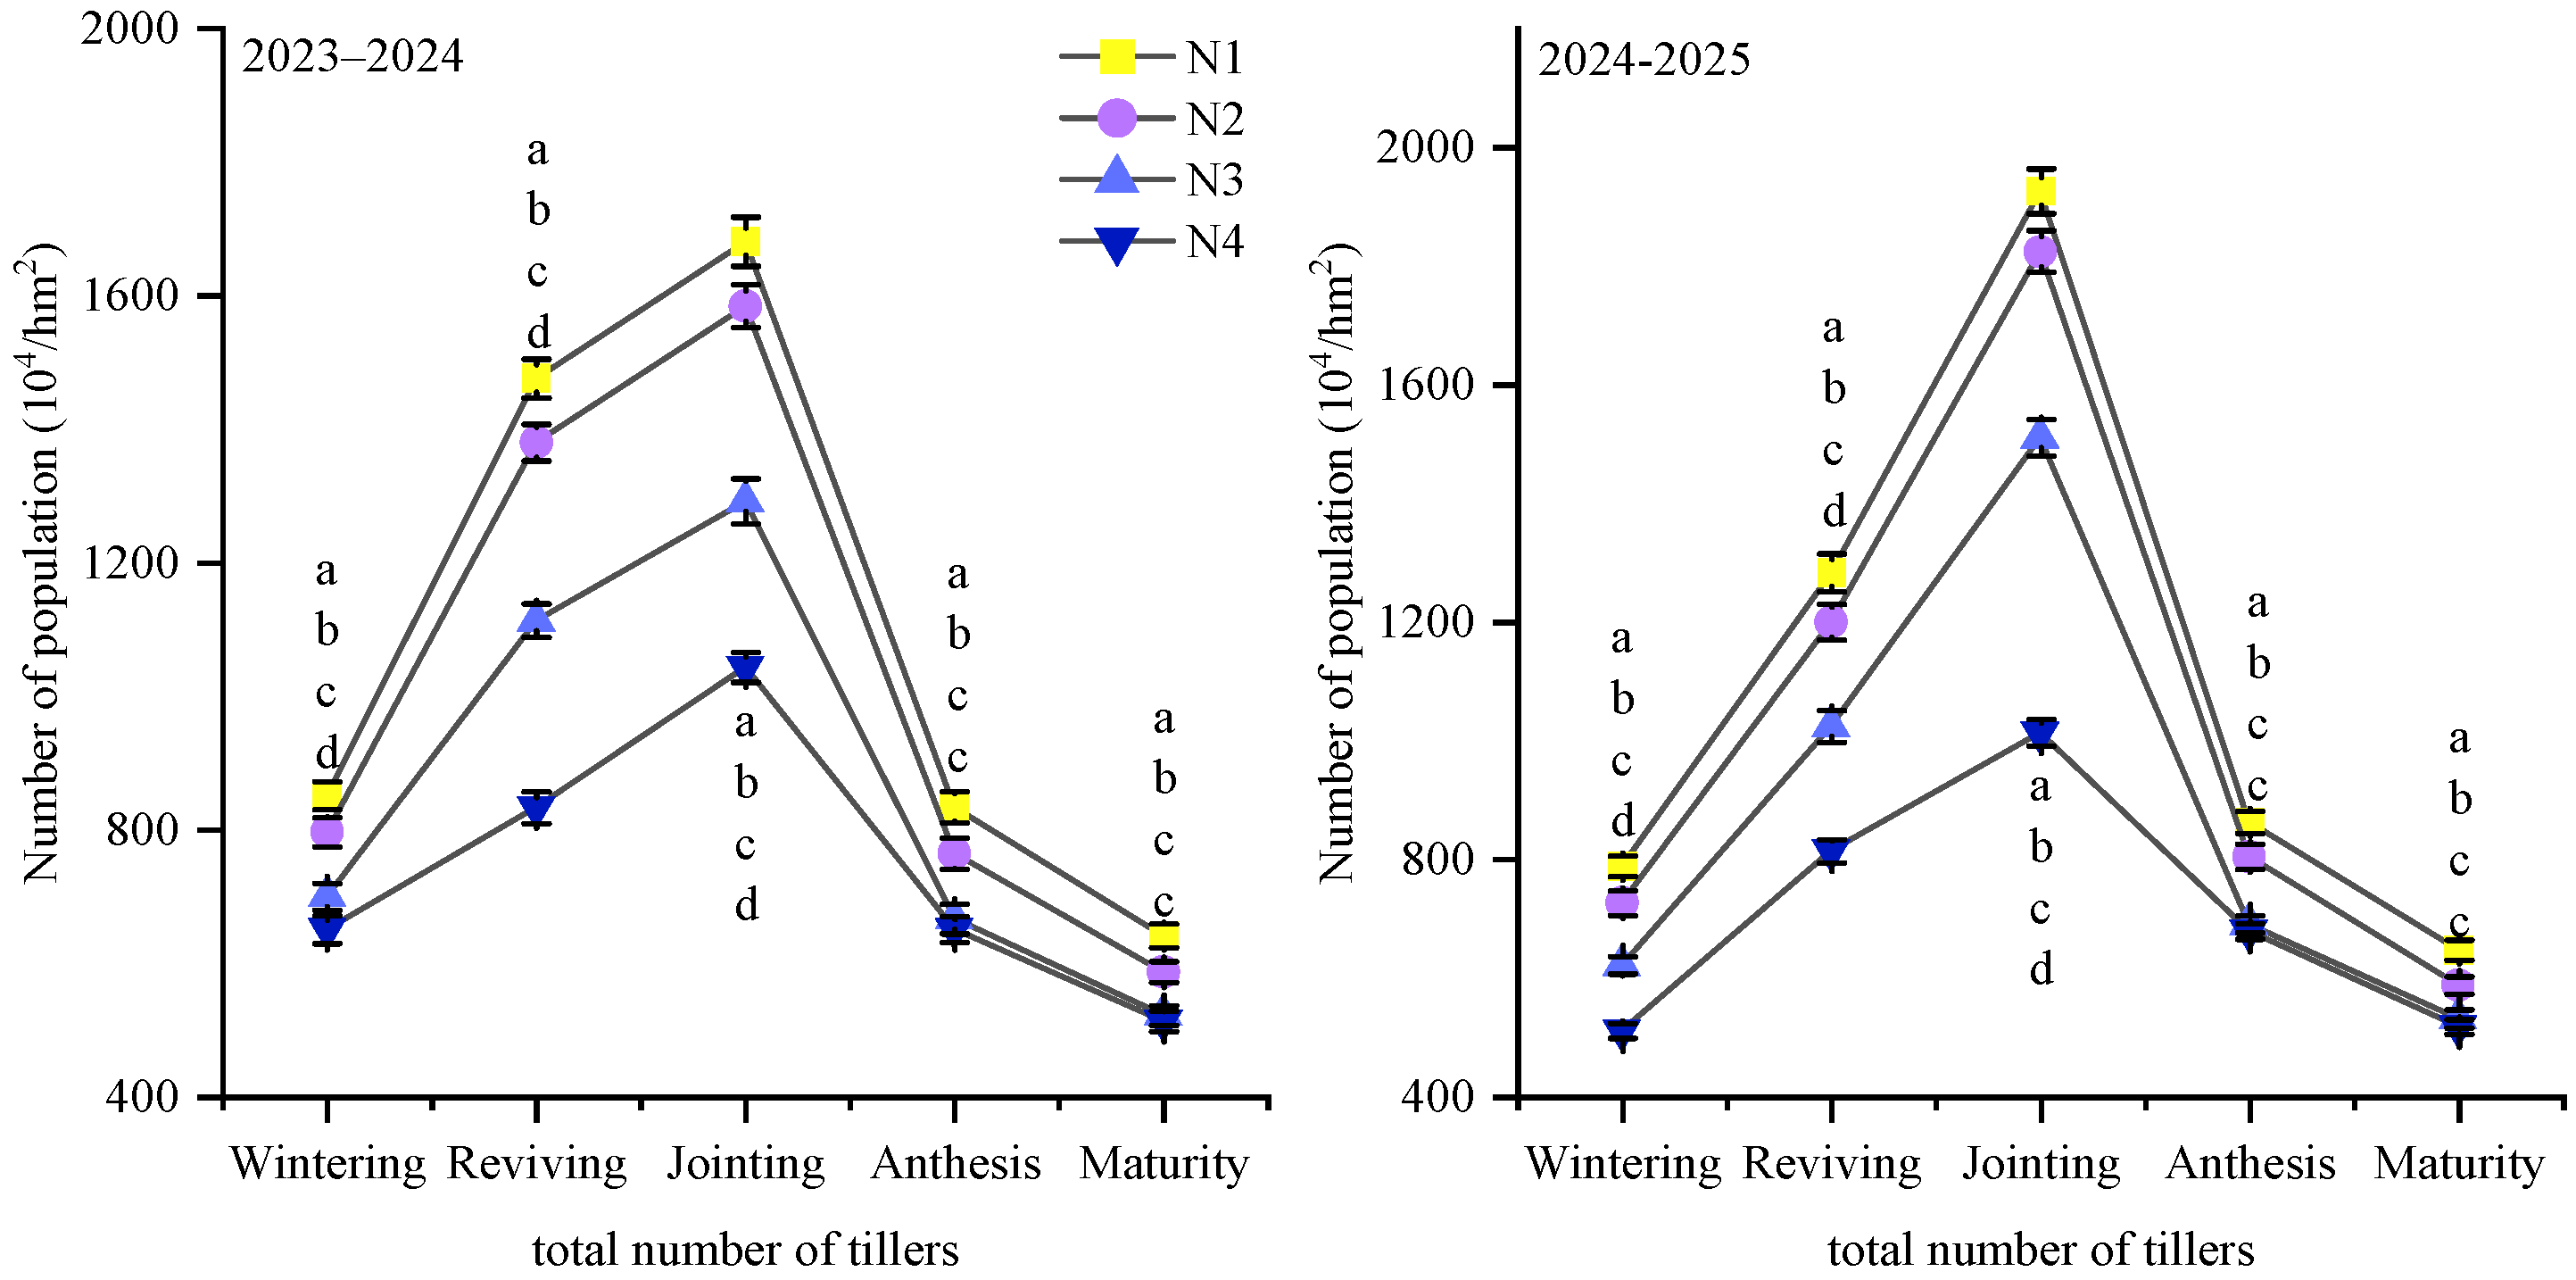
Nitrogen application rate significantly influenced the total number of tillers in wheat populations across different growth stages (Figure 2). During both growing seasons, the total tiller count in each treatment increased rapidly from the overwintering stage to the jointing stage, peaking at the jointing stage before gradually declining due to the death of weak tillers. During the overwintering, reviving and jointing stages, the total tiller number followed the pattern N1 > N2 > N3 > N4, whereas during anthesis and maturity, it was N1 > N2 > N3 > N4. These results indicate that the N3 treatment effectively balanced early tiller formation with late-season population stability, thereby optimizing the population structure.

3.2. Number of Spikes of Different Tillers

Nitrogen application rate significantly influenced the number of tillers at each tillering stage and the total number of spikes per plant (Table 1). In both growing seasons, the main stems of all treatments formed spikelet structures, with no significant differences among nitrogen application rates. As nitrogen application rates decreased from N1 to N4, both tillers I and II showed a significant decline in occurrence. During the 2023–2024 growing season, the occurrence of tillers I and II followed the pattern N1 > N2 > N3, N4, while in the 2024–2025 season, it was N1, N2 > N3, N4. The total number of spikes per plant in both growing seasons showed a pattern of N1 > N2 > N3 and N4.

3.3. Net Photosynthetic Rate

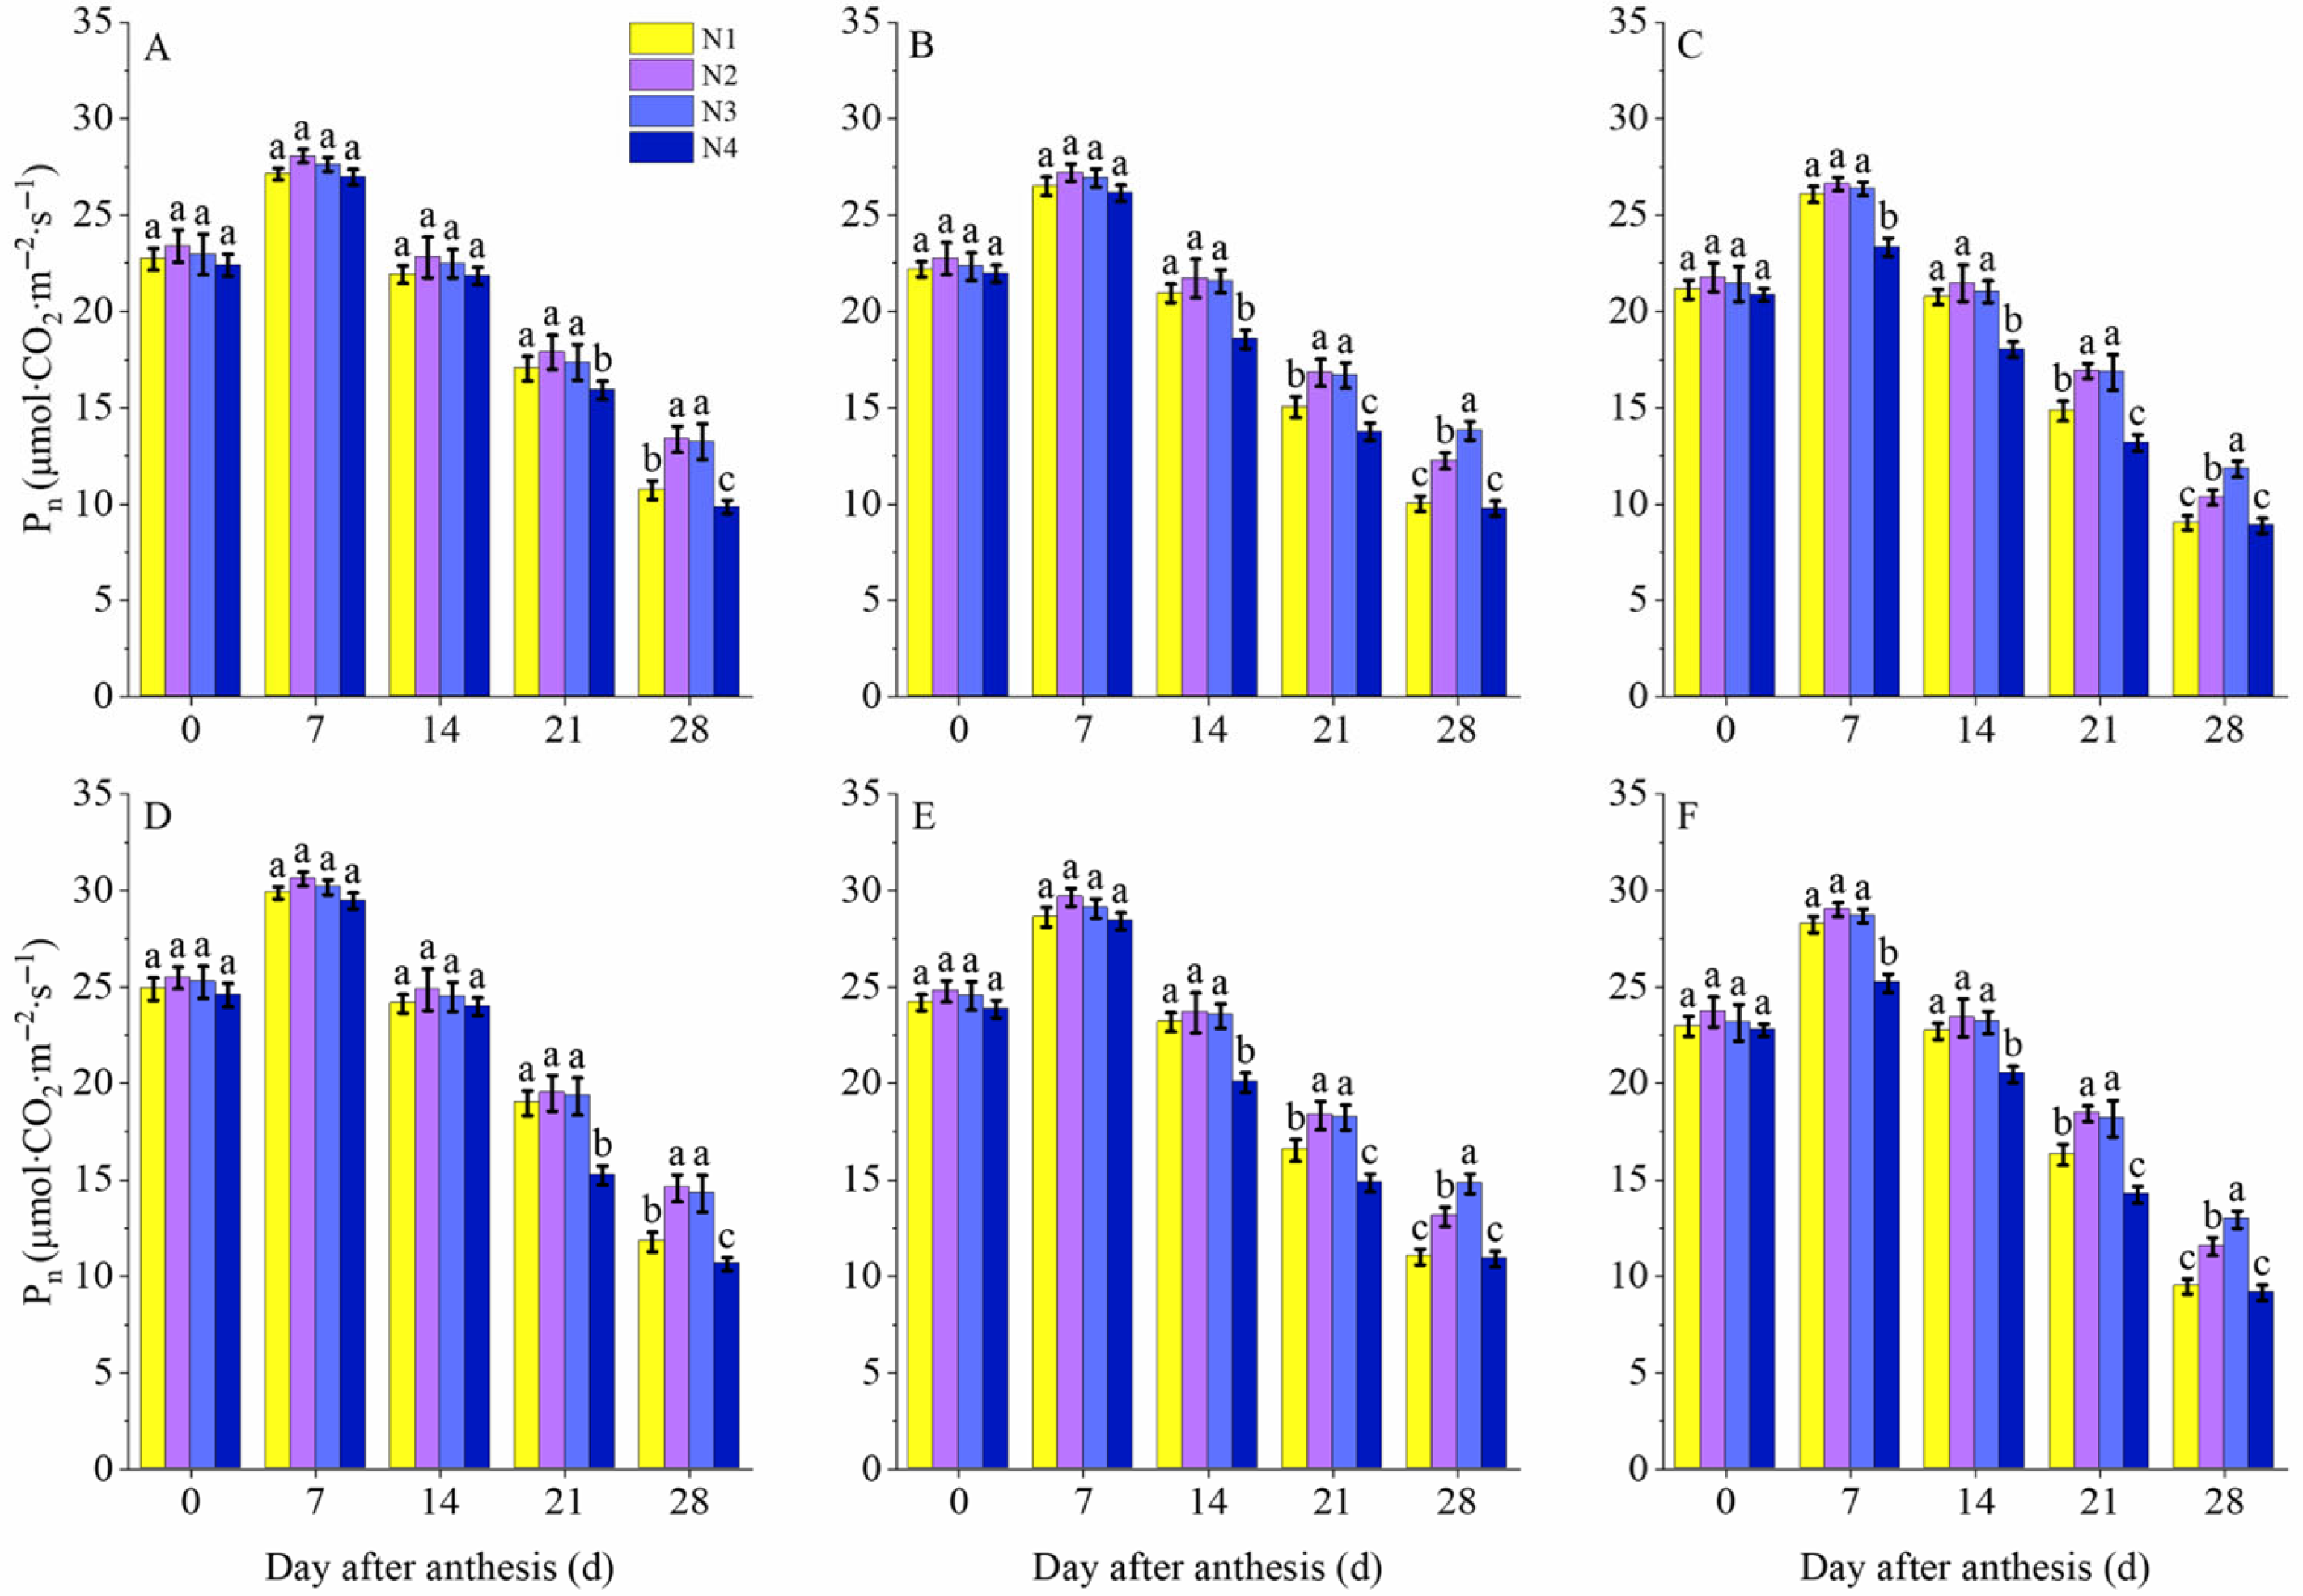
Nitrogen application rate significantly influenced the net photosynthetic rate of flag leaves across different tillers in wheat (Figure 3). During both growing seasons, the net photosynthetic rate of flag leaves in each treatment exhibited a pattern of initial increase followed by decline throughout the growth process, peaking at 7 DAA. No significant differences in flag leaf net photosynthetic rates were observed among nitrogen application treatments for the main stem at 0, 7, and 14 DAA, tillers I at 0 and 7 DAA, and tillers II at 0 DAA. Compared with N1 and N4 treatments, the N3 treatment significantly increased the net photosynthetic rates of flag leaves on the main stem at 28 DAA, and on tillers I and tillers II at 21 DAA, while showing no significant difference from the N2 treatment. Additionally, the N3 treatment significantly increased the net photosynthetic rate of flag leaves on tillers I and tillers II at 28 DAA compared to other treatments. Results indicate that the N3 treatment is beneficial for maintaining the net photosynthetic rate of flag leaves on all tillers at 21 and 28 DAA.

3.4. Stomatal Conductance

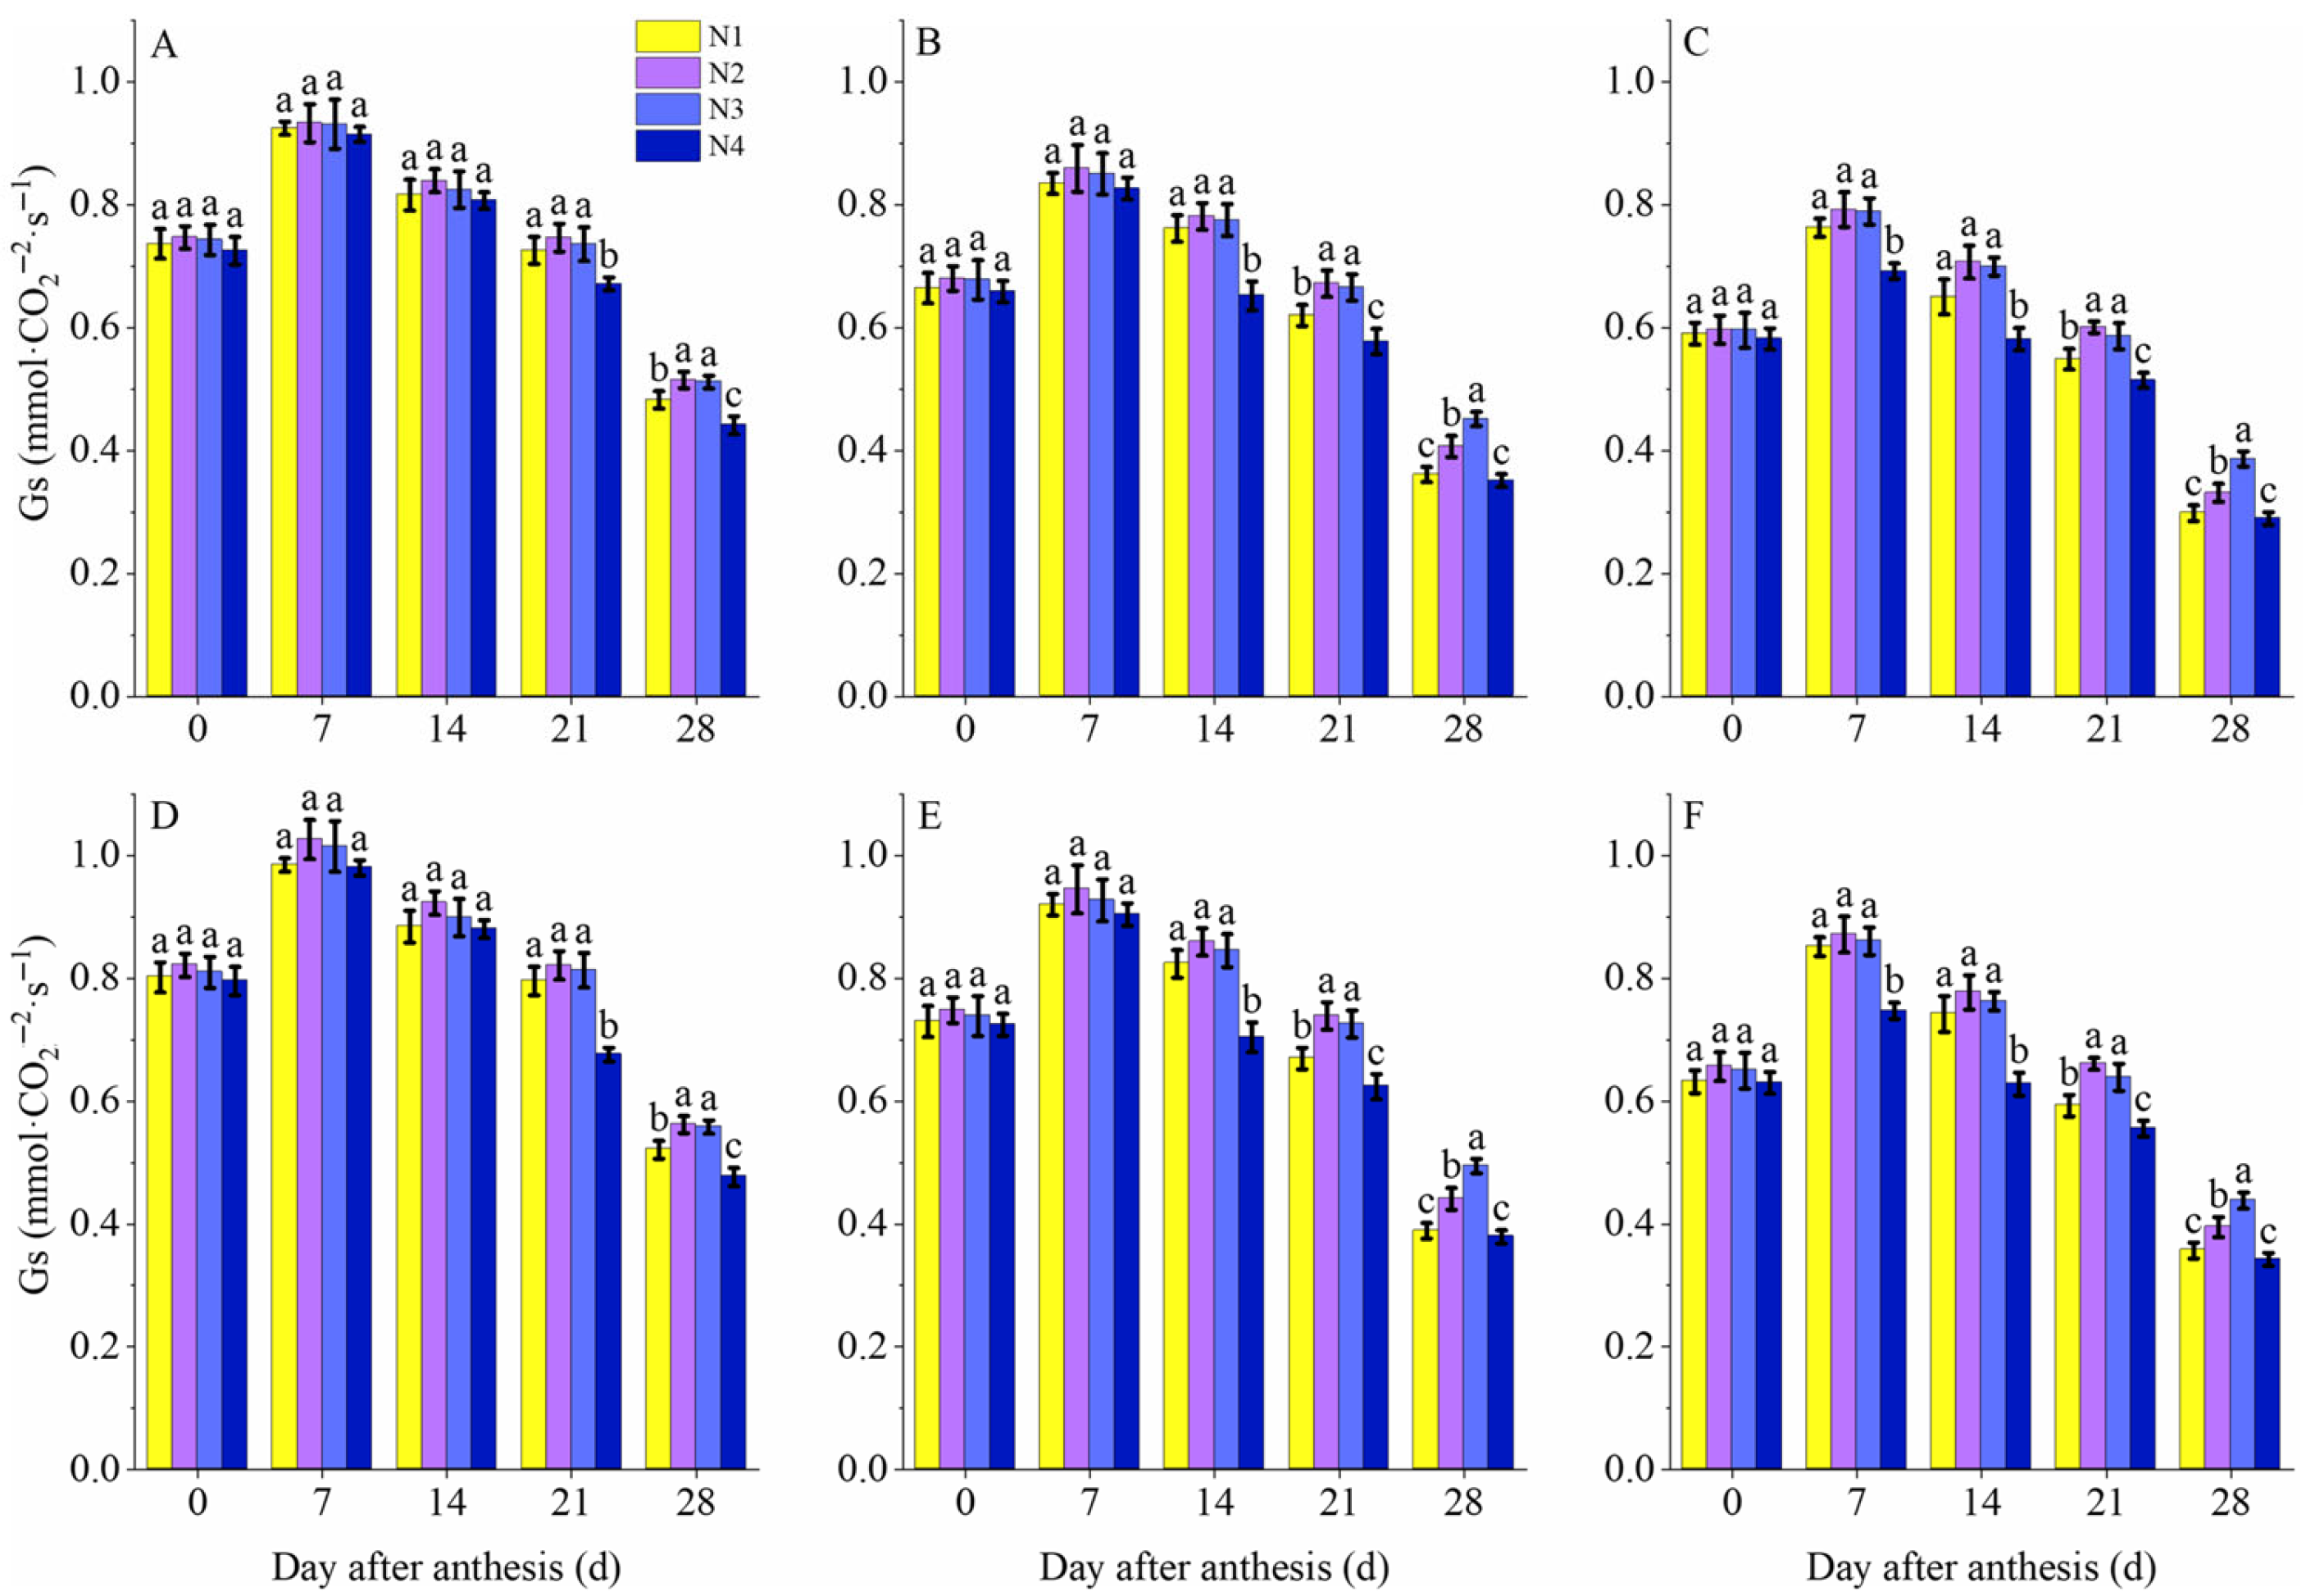
Nitrogen application rate significantly influenced the stomatal conductance of flag leaves on different tillers of wheat (Figure 4). Across both growing seasons, flag leaf stomatal conductance in all treatments exhibited a pattern of initial increase followed by decline throughout the growth stage, peaking at DAA 7. No significant differences in flag leaf stomatal conductance were observed among nitrogen application rates for the main stem at 0, 7, and 14 DAA (DAA), the tillers I at 0 and 7 DAA, or the tillers II at 0 DAA. Compared with N1 and N4 treatments, the N3 treatment significantly increased flag leaf stomatal conductance in the main stem at 28 DAA and in the flag leaves of tillers I and tillers II at 21 DAA, showing no significant difference from the N2 treatment. Additionally, the N3 treatment significantly increased the flag leaf stomatal conductance of tillers I and tillers II at 28 DAA compared to other treatments. The results indicate that the N3 treatment is beneficial for maintaining the stomatal conductance of flag leaves on all tillers at 21 and 28 DAA.

3.5. Transpiration Rate

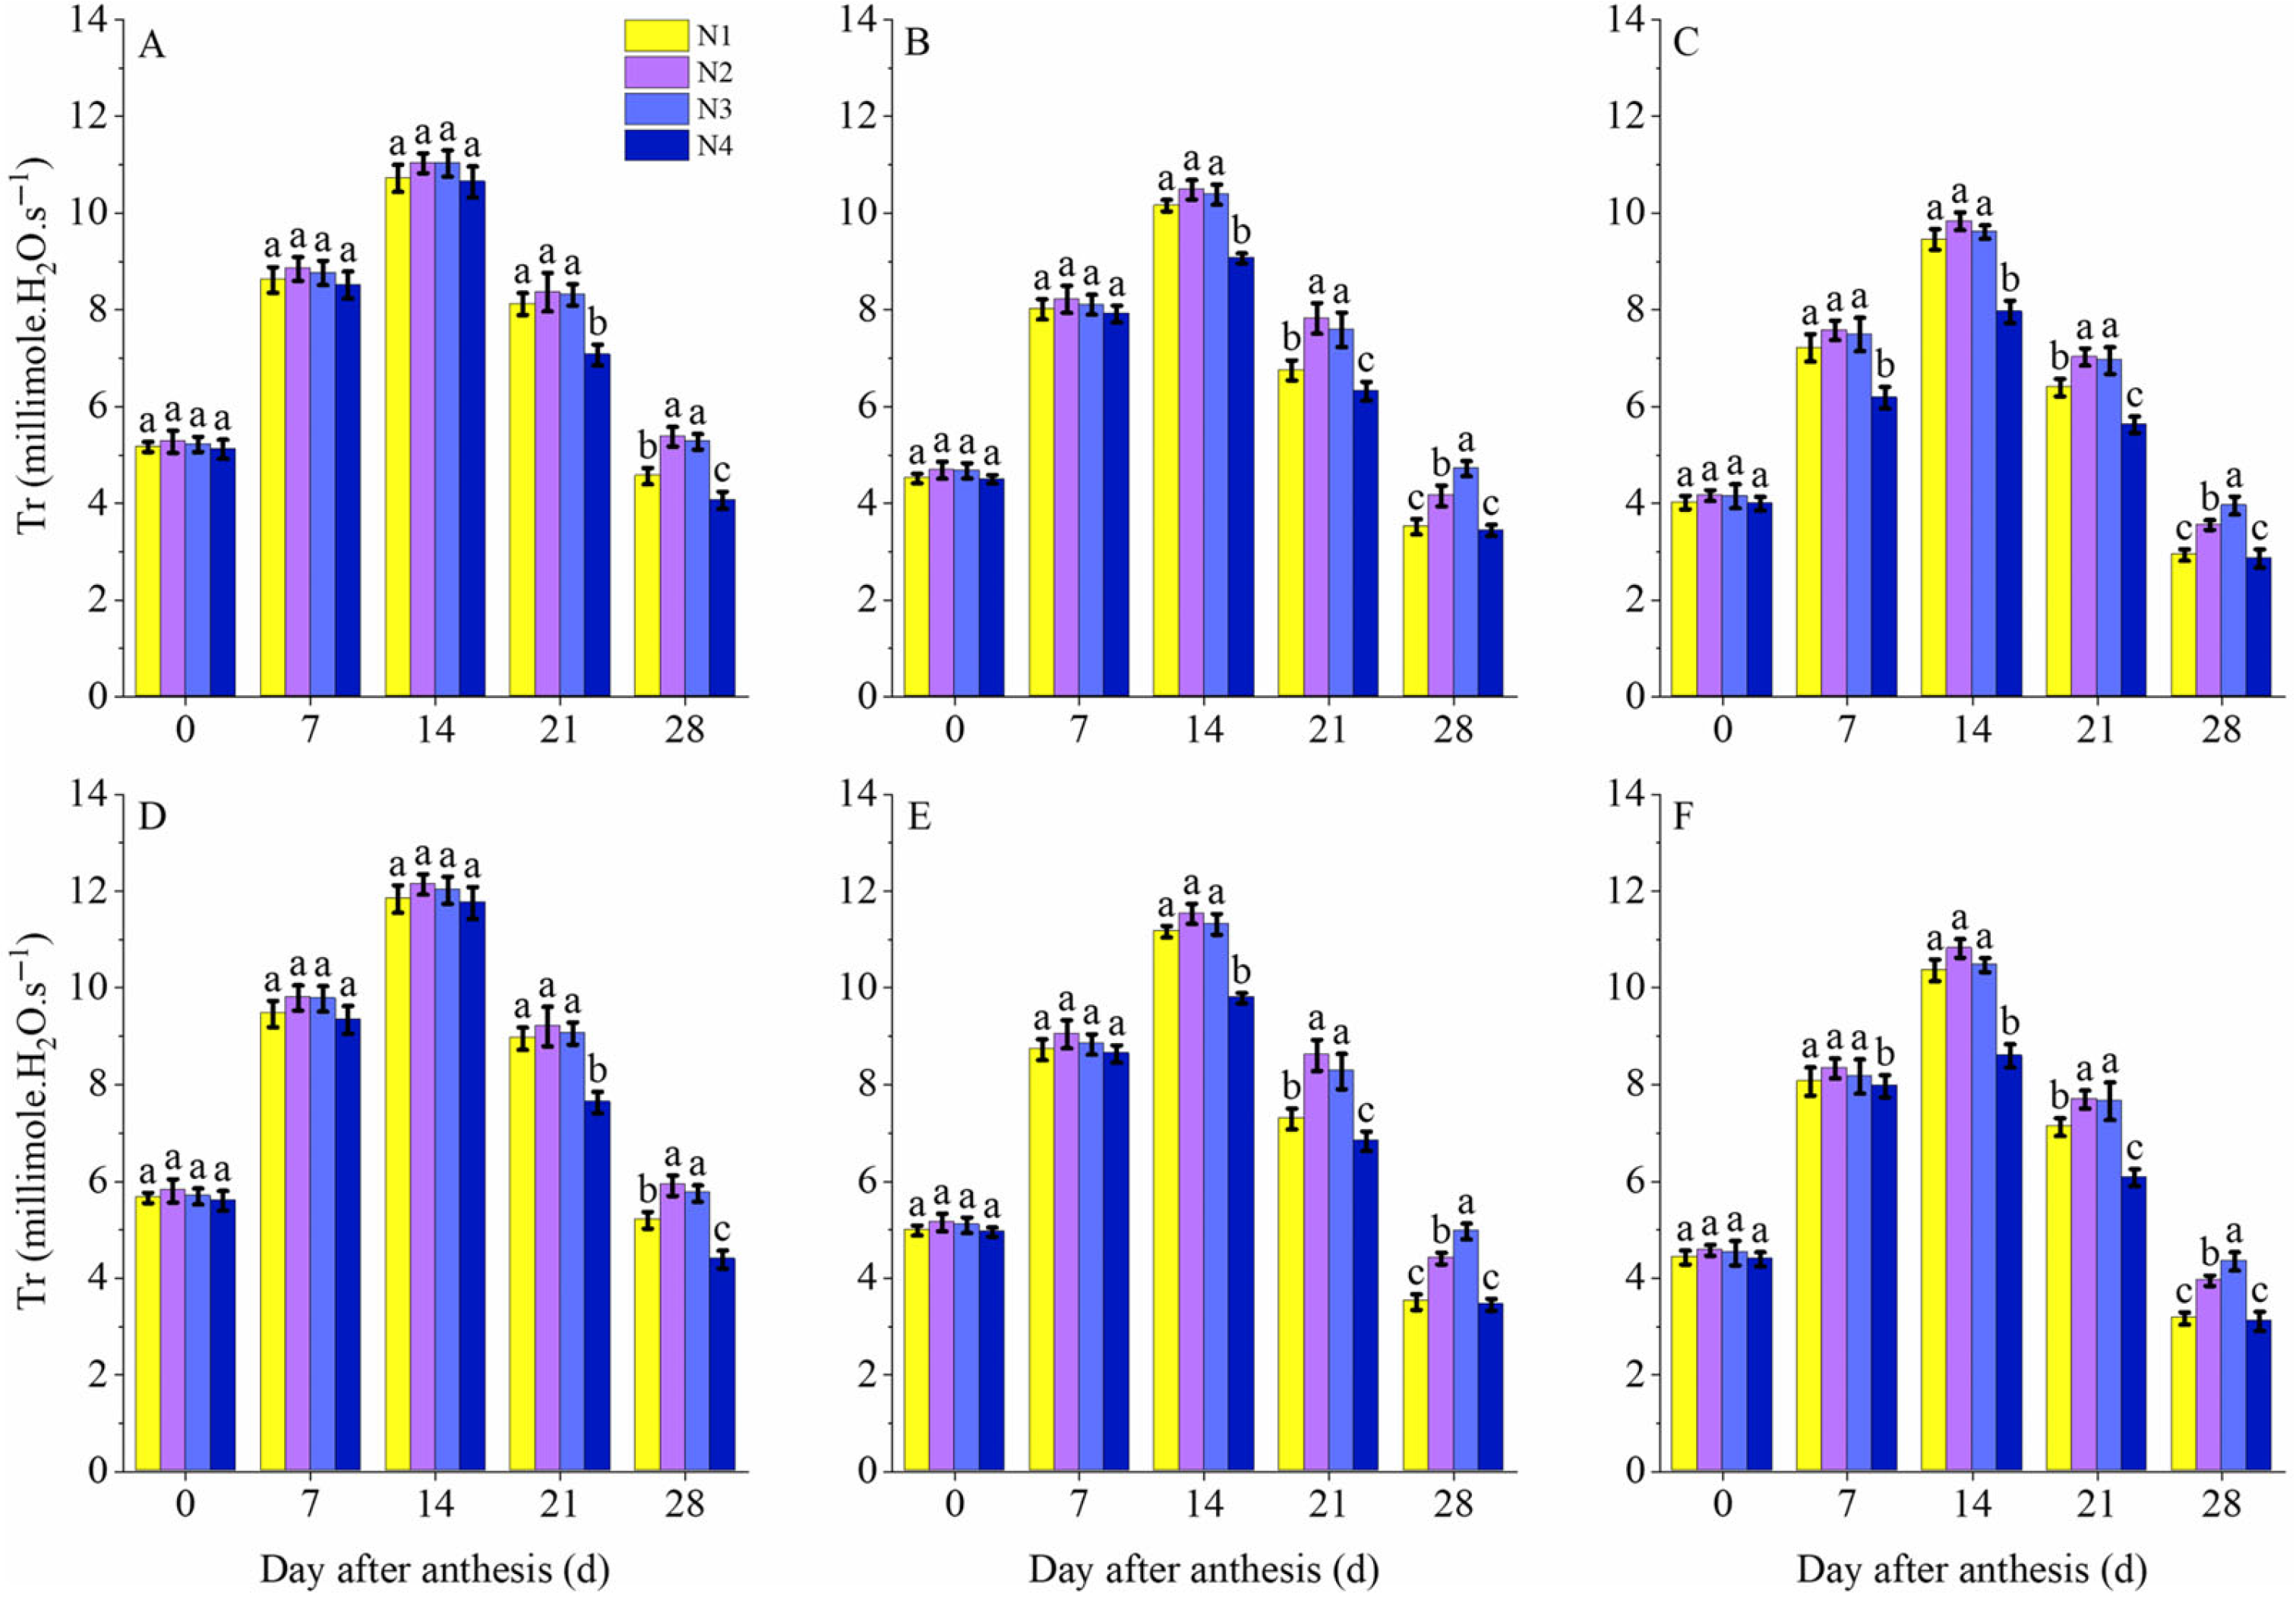
Nitrogen application rate significantly influenced the transpiration rates of flag leaves on different tillers of wheat (Figure 5). Across both growing seasons, flag leaf transpiration rates in all treatments exhibited a pattern of initial increase followed by decline throughout the growth process, peaking at 7 DAA. No significant differences in flag leaf transpiration rates were observed among nitrogen application treatments for the main stem at 0, 7, and 14 DAA, tillers I at 0 and 7 DAA, or tillers II at 0 DAA. Compared with N1 and N4 treatments, the N3 treatment significantly increased the flag leaf transpiration rates of the main stem at 28 DAA and of tillers I and tillers II at 21 DAA, showing no significant difference from the N2 treatment. Additionally, the N3 treatment significantly increased the flag leaf transpiration rates of tillers I and tillers II at 28 DAA compared to other treatments. Results indicate that the N3 treatment is beneficial for maintaining the transpiration rates of flag leaves on all tillers at 21 and 28 DAA.

3.6. Sucrose Content and Sucrose Phosphate Synthase Activity

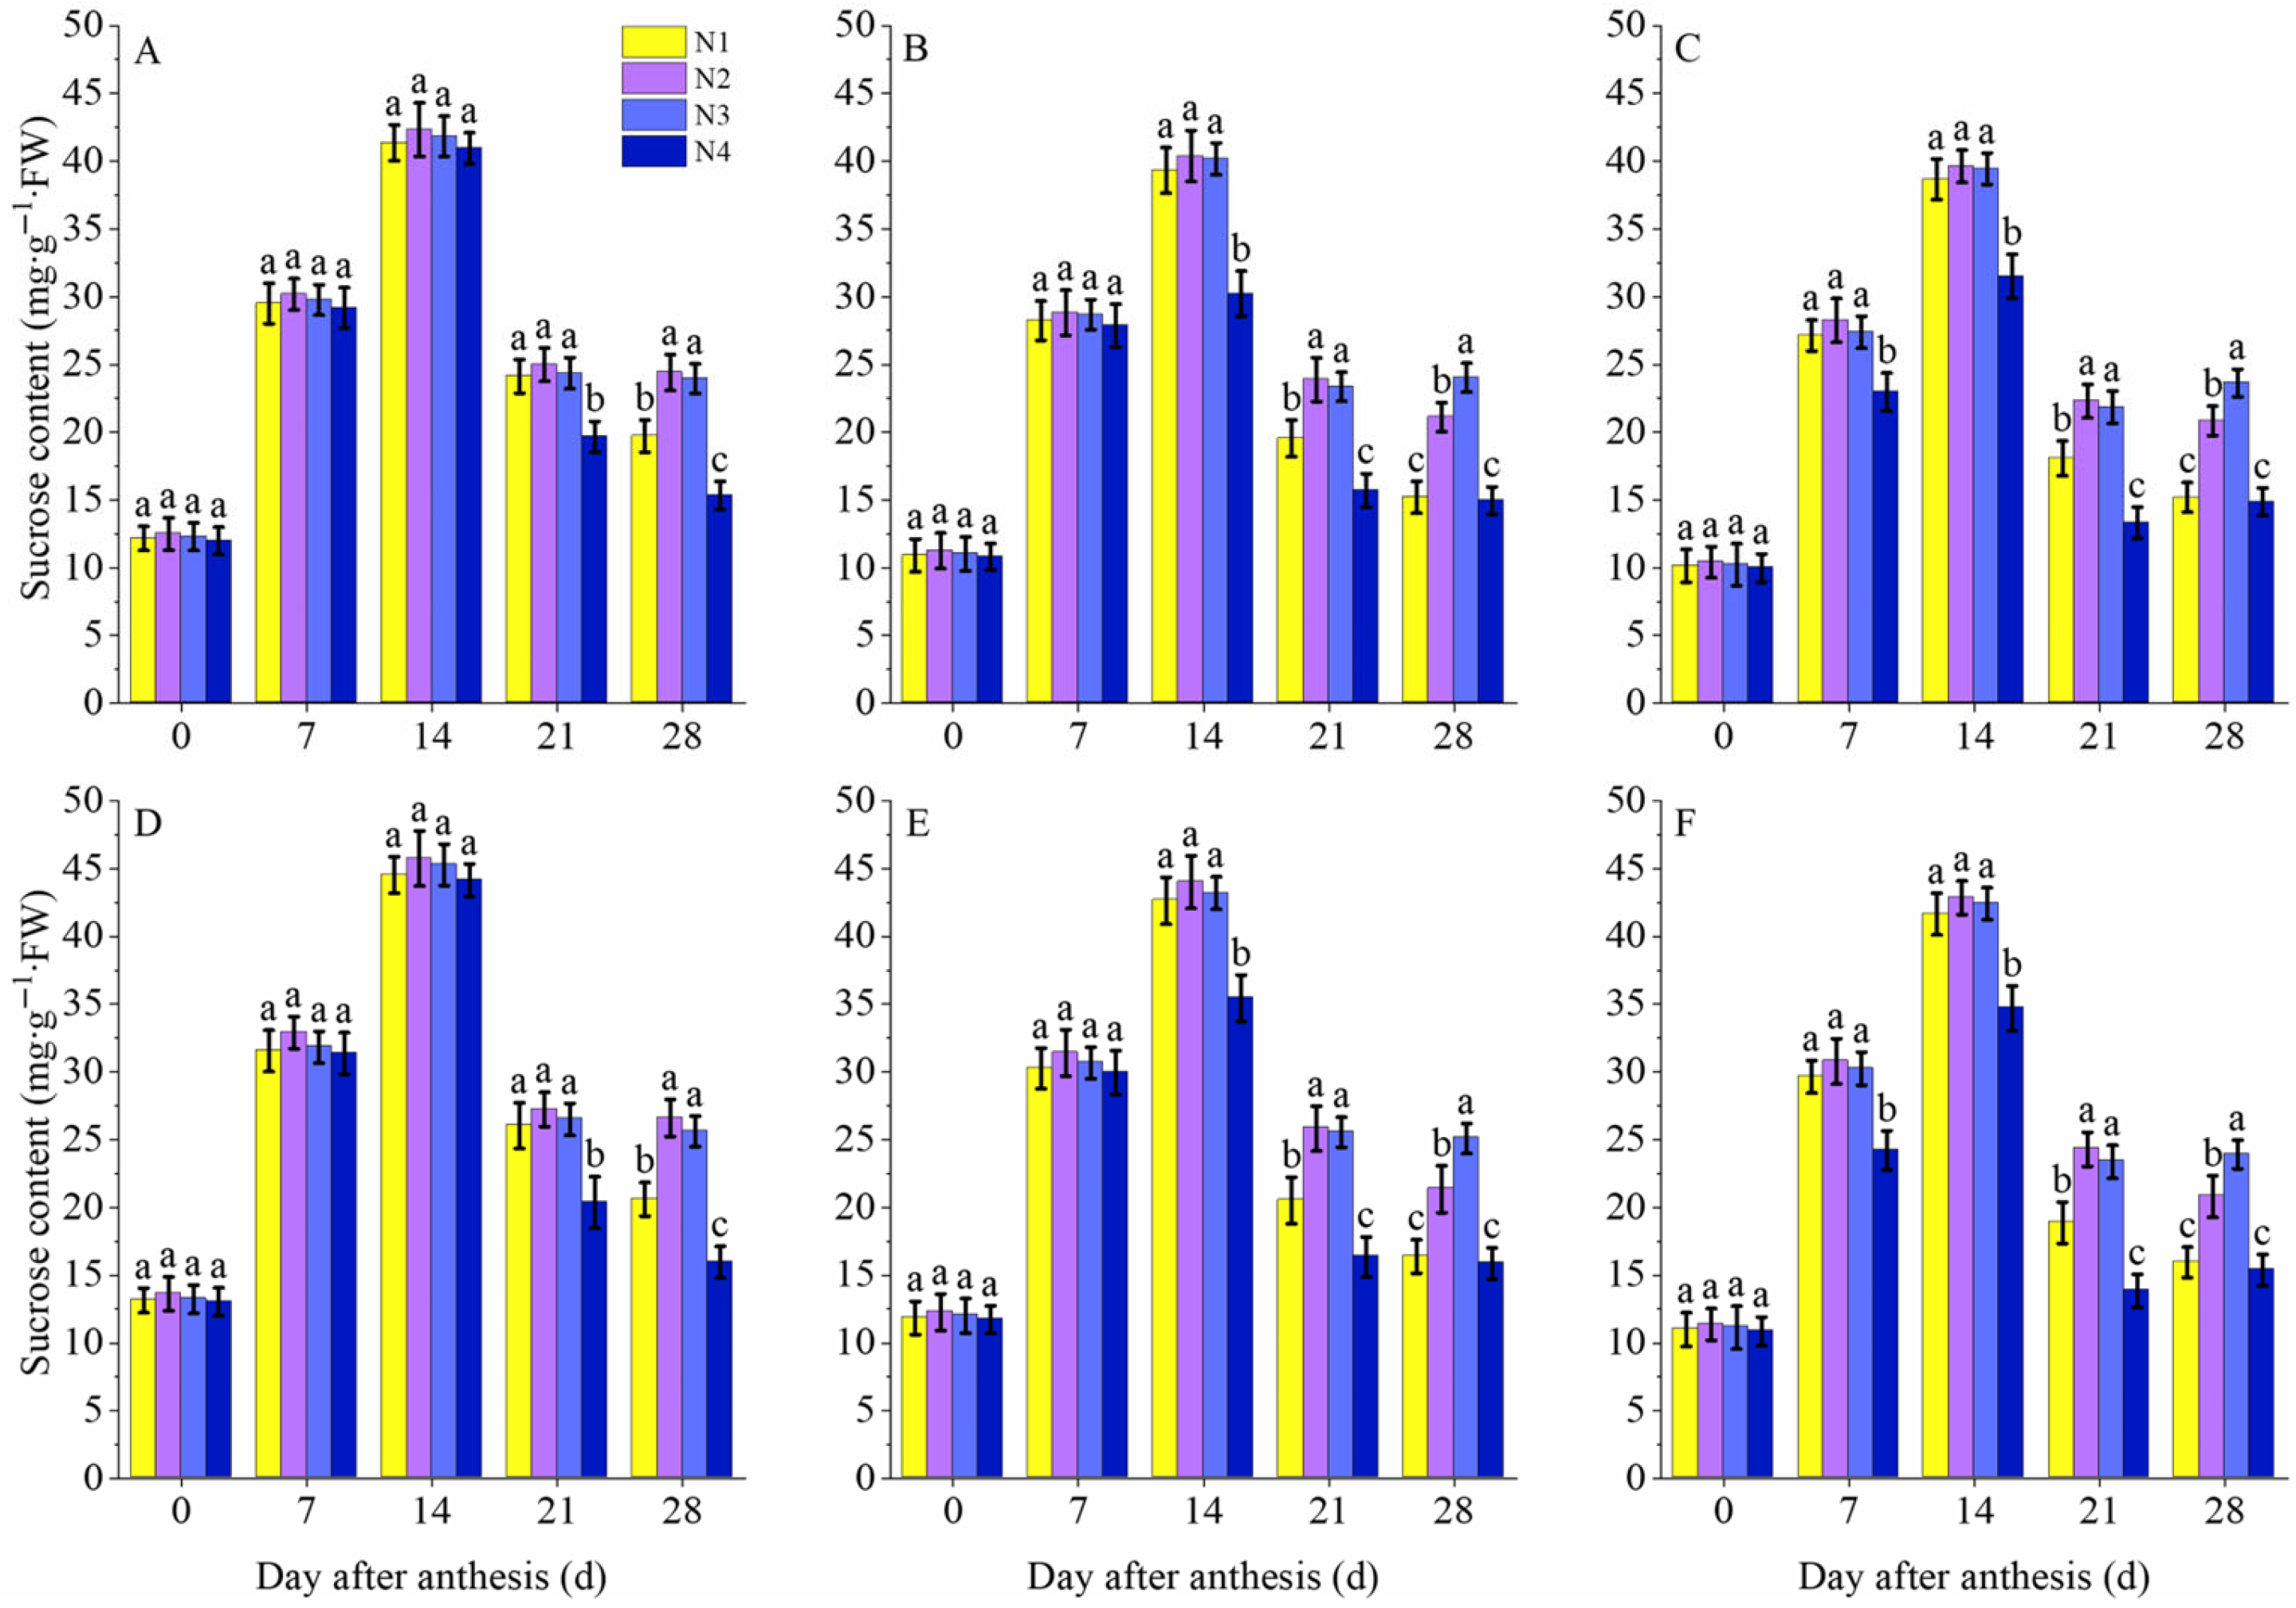
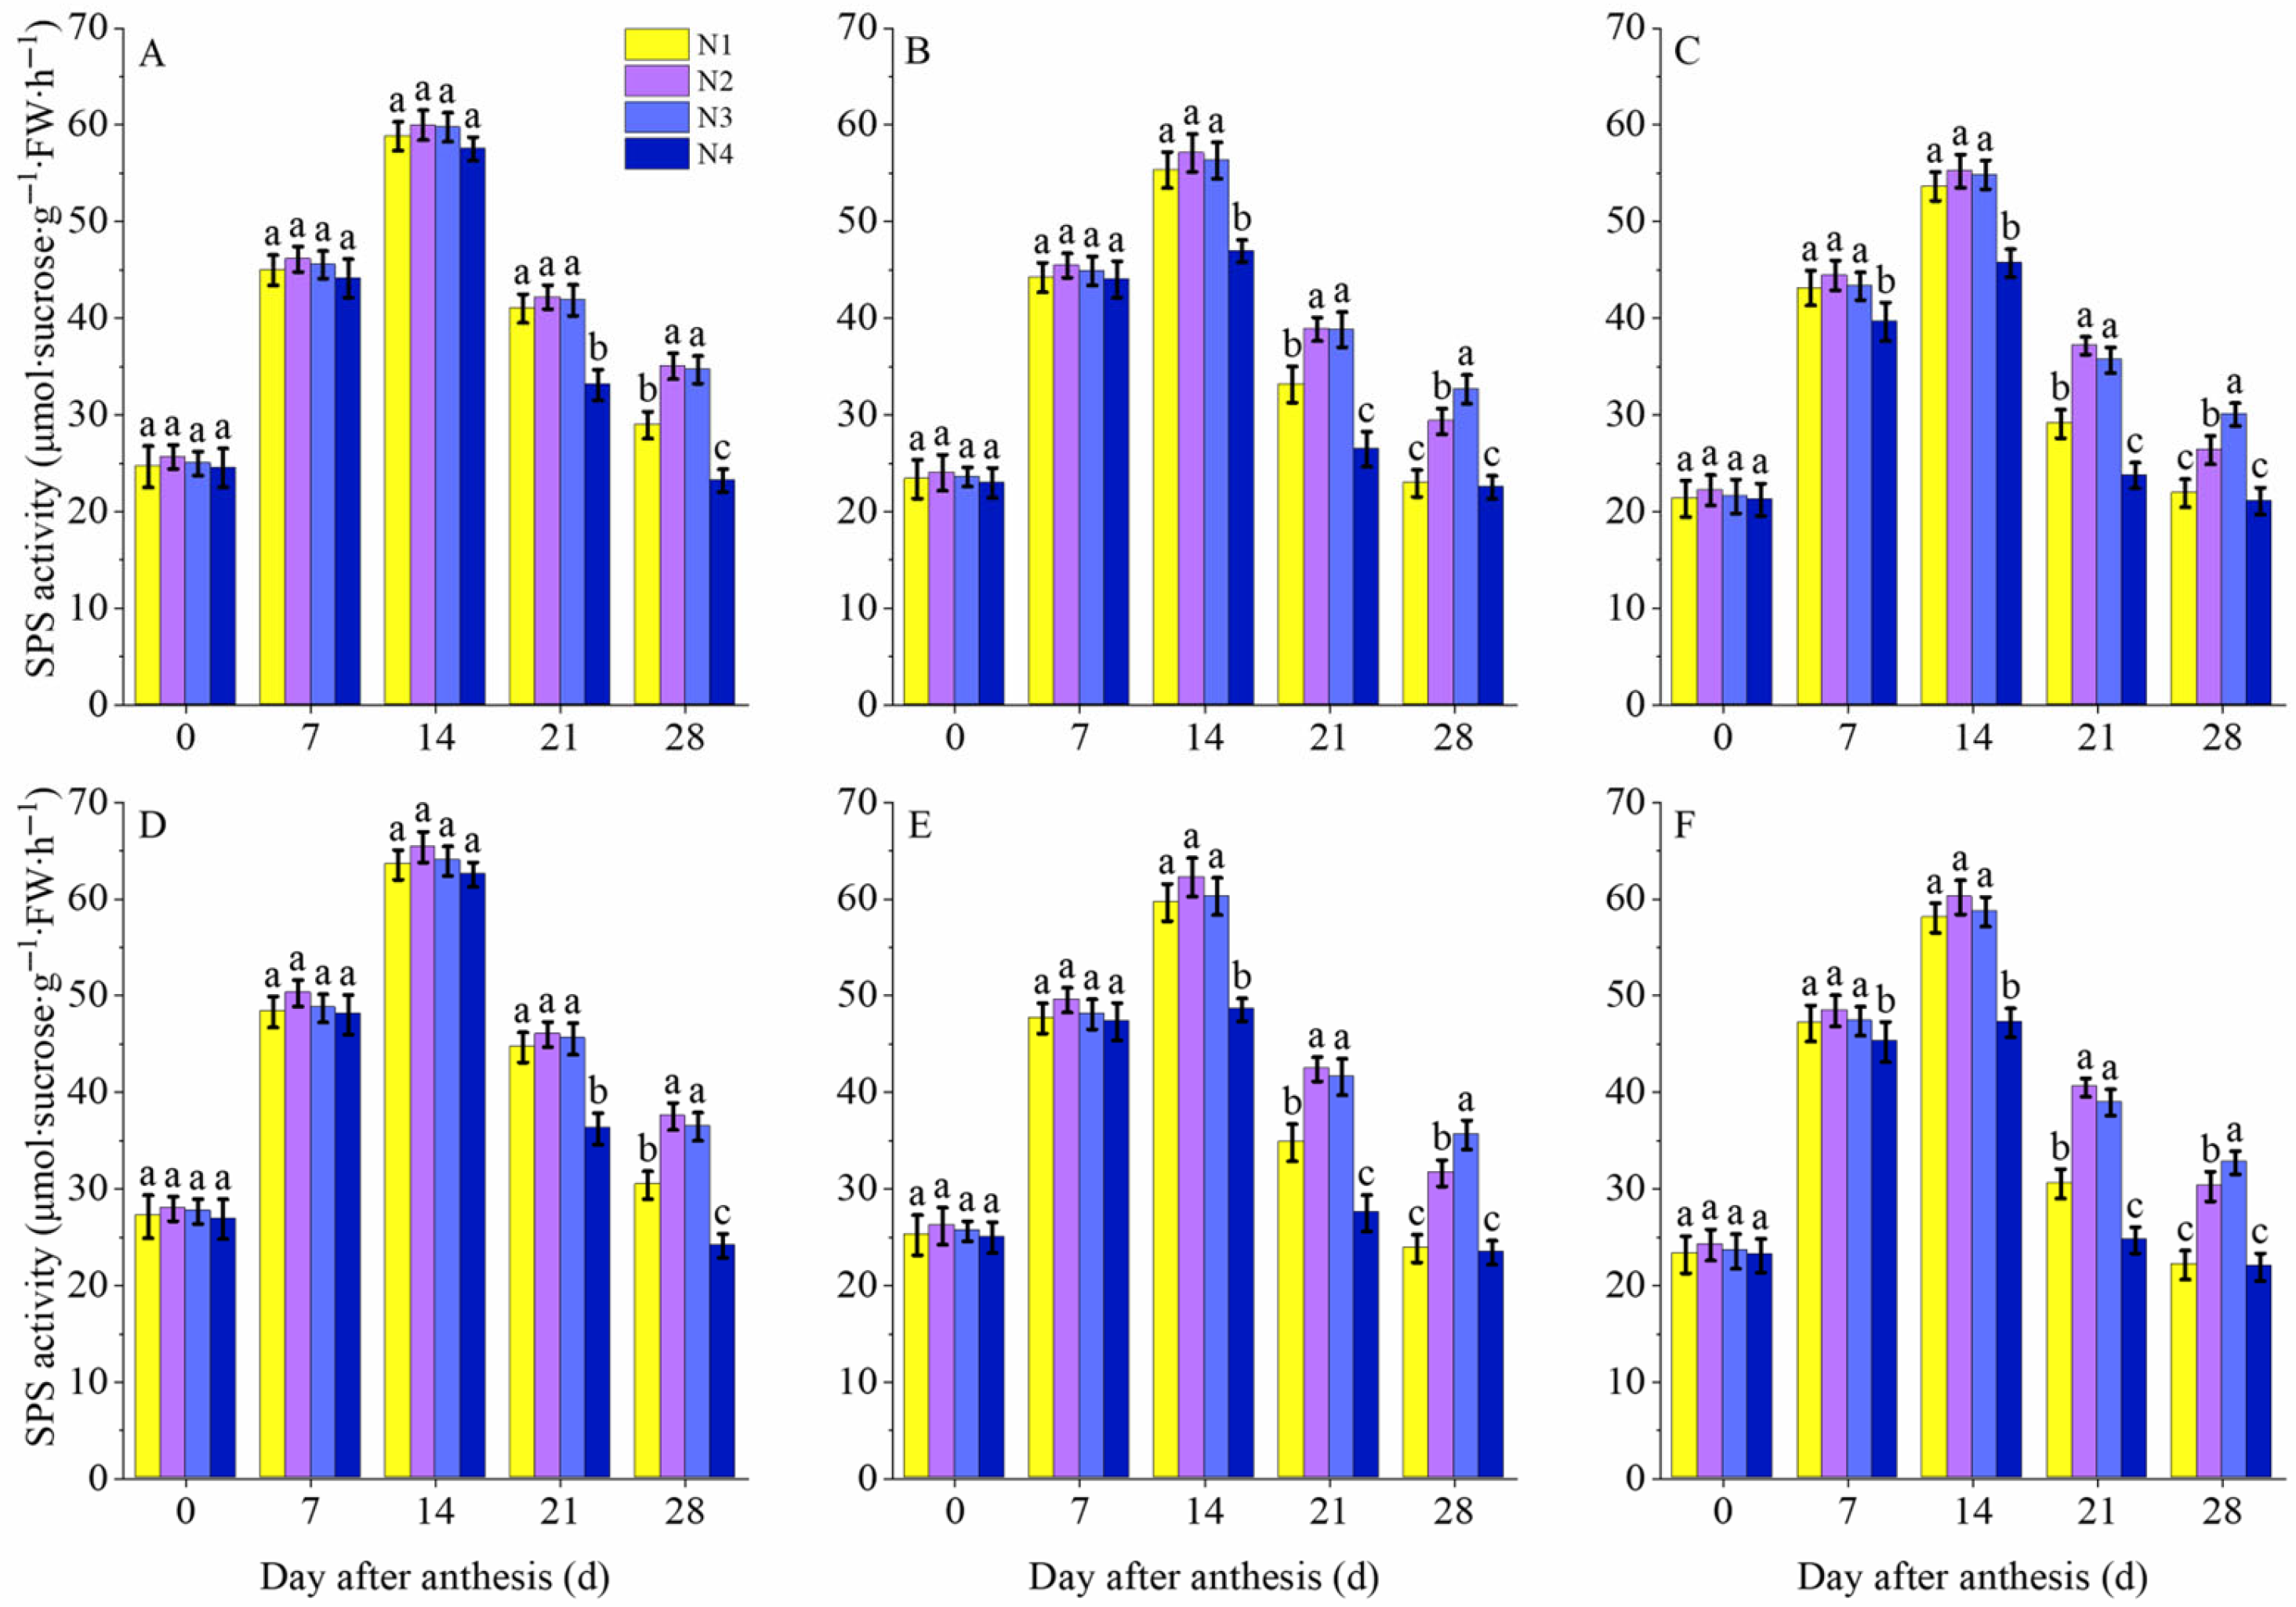
Nitrogen application rate significantly influenced sucrose content and sucrose phosphate synthase activity in flag leaves of different tillers in wheat (Figure 6 and Figure 7). During both growing seasons, sucrose content and sucrose phosphate synthase activity in flag leaves across all treatments exhibited a pattern of initial increase followed by decline throughout the growth stage, peaking at DAA 7. No significant differences in flag leaf sucrose content and sucrose phosphate synthase activity were observed among nitrogen application rates for the main stem at 0, 7, and 14 DAA, tillers I at 0 and 7 DAA, and tillers II at 0 DAA. Compared with N1 and N4 treatments, the N3 treatment significantly increased sucrose content and sucrose phosphate synthase activity in the flag leaves of the main stem at 28 DAA, as well as in the flag leaves of tillers I and tillers II at 21 DAA. There was no significant difference compared with the N2 treatment. Additionally, the N3 treatment significantly increased the sucrose content and sucrose phosphate synthase activity in the flag leaves of tillers I and tillers II at 28 DAA compared to other treatments. The results indicate that the N3 treatment is beneficial for maintaining the sucrose content and sucrose phosphate synthase activity in the flag leaves of all tillers at 21 and 28 DAA.

3.7. Aging Characteristics of Flag Leaves of Different Tillers

3.7.1. Superoxide Dismutase Activity

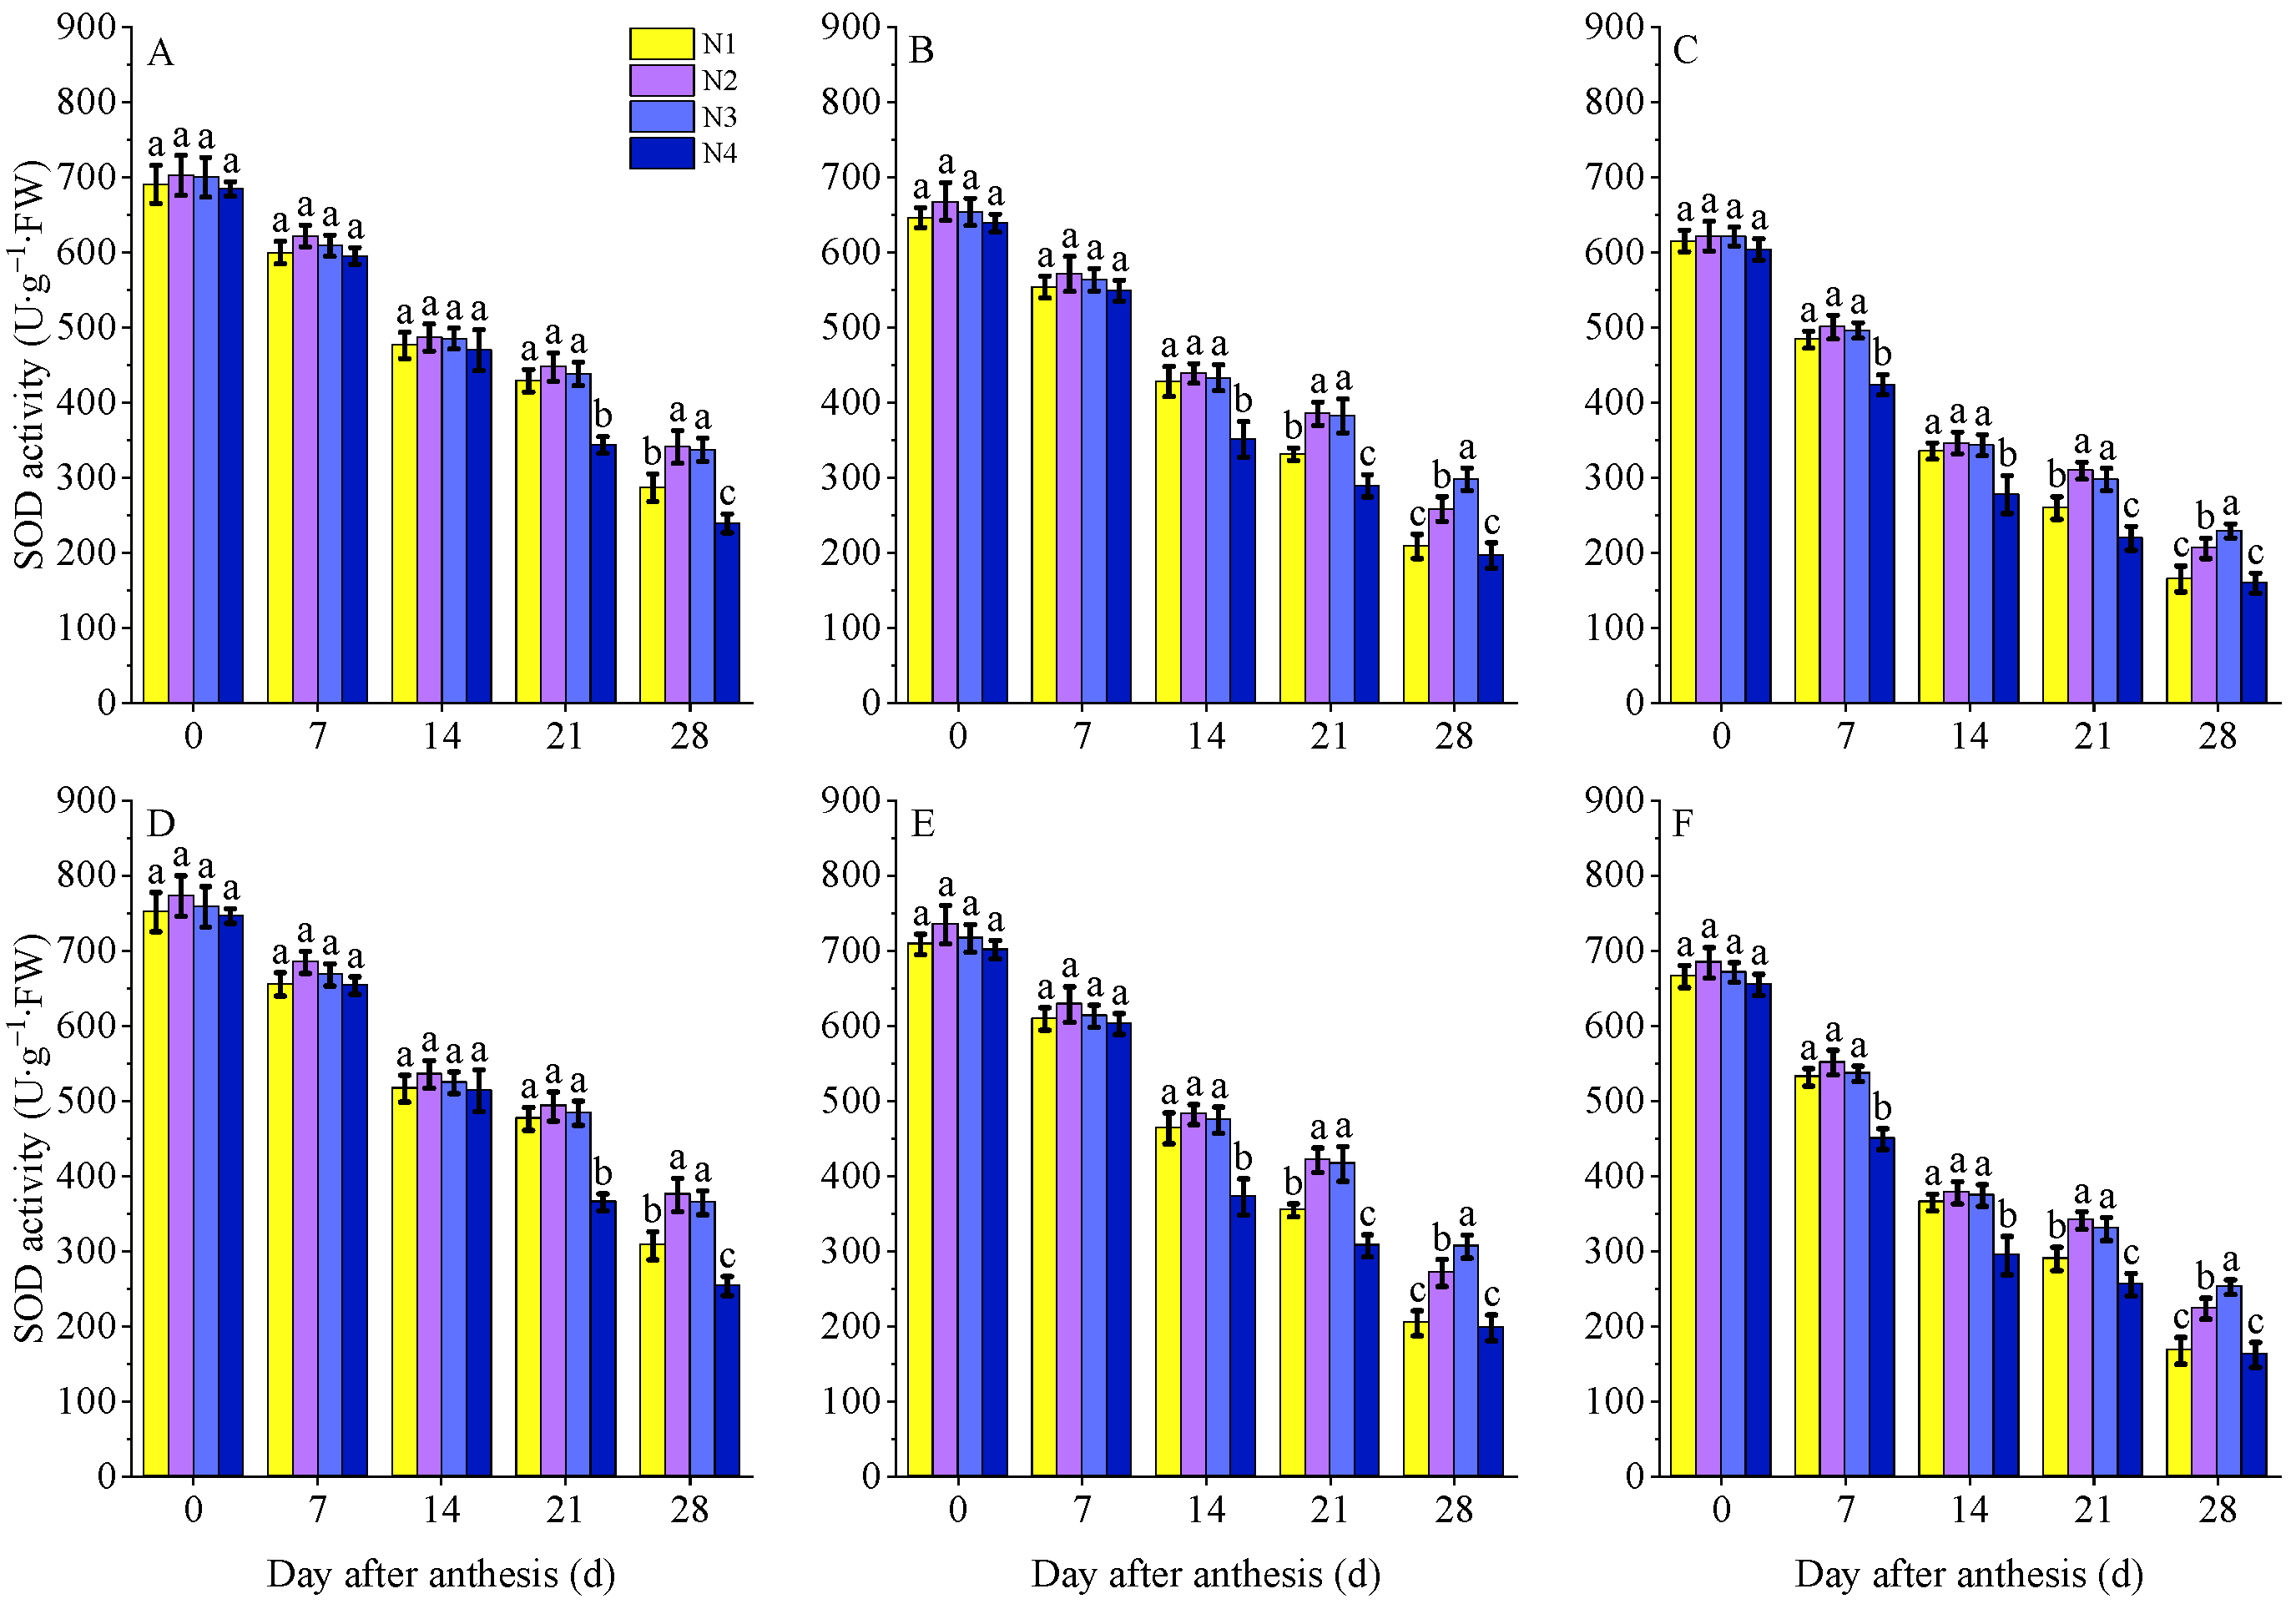
Nitrogen application rate significantly influenced superoxide dismutase activity in flag leaves of different tillers in wheat (Figure 8). During both growing seasons, superoxide dismutase activity in flag leaves decreased progressively throughout the growth stages across all treatments. No significant differences in flag leaf SOD activity were observed among nitrogen application rates for the main stem at 0, 7, and 14 DAA, tillers I at 0 and 7 DAA, and tillers II at 0 DAA. Compared with N1 and N4 treatments, N3 significantly increased SOD activity in flag leaves of the main stem at 28 DAA, and in flag leaves of tillers I and tillers II at 21 DAA, showing no significant difference from N2. Additionally, N3 significantly increased SOD activity in flag leaves of tillers I and tillers II at 28 DAA compared with other treatments. Results indicate that the N3 treatment is beneficial for maintaining superoxide dismutase activity in flag leaves of all tillers at 21 and 28 DAA.

3.7.2. Soluble Protein Content

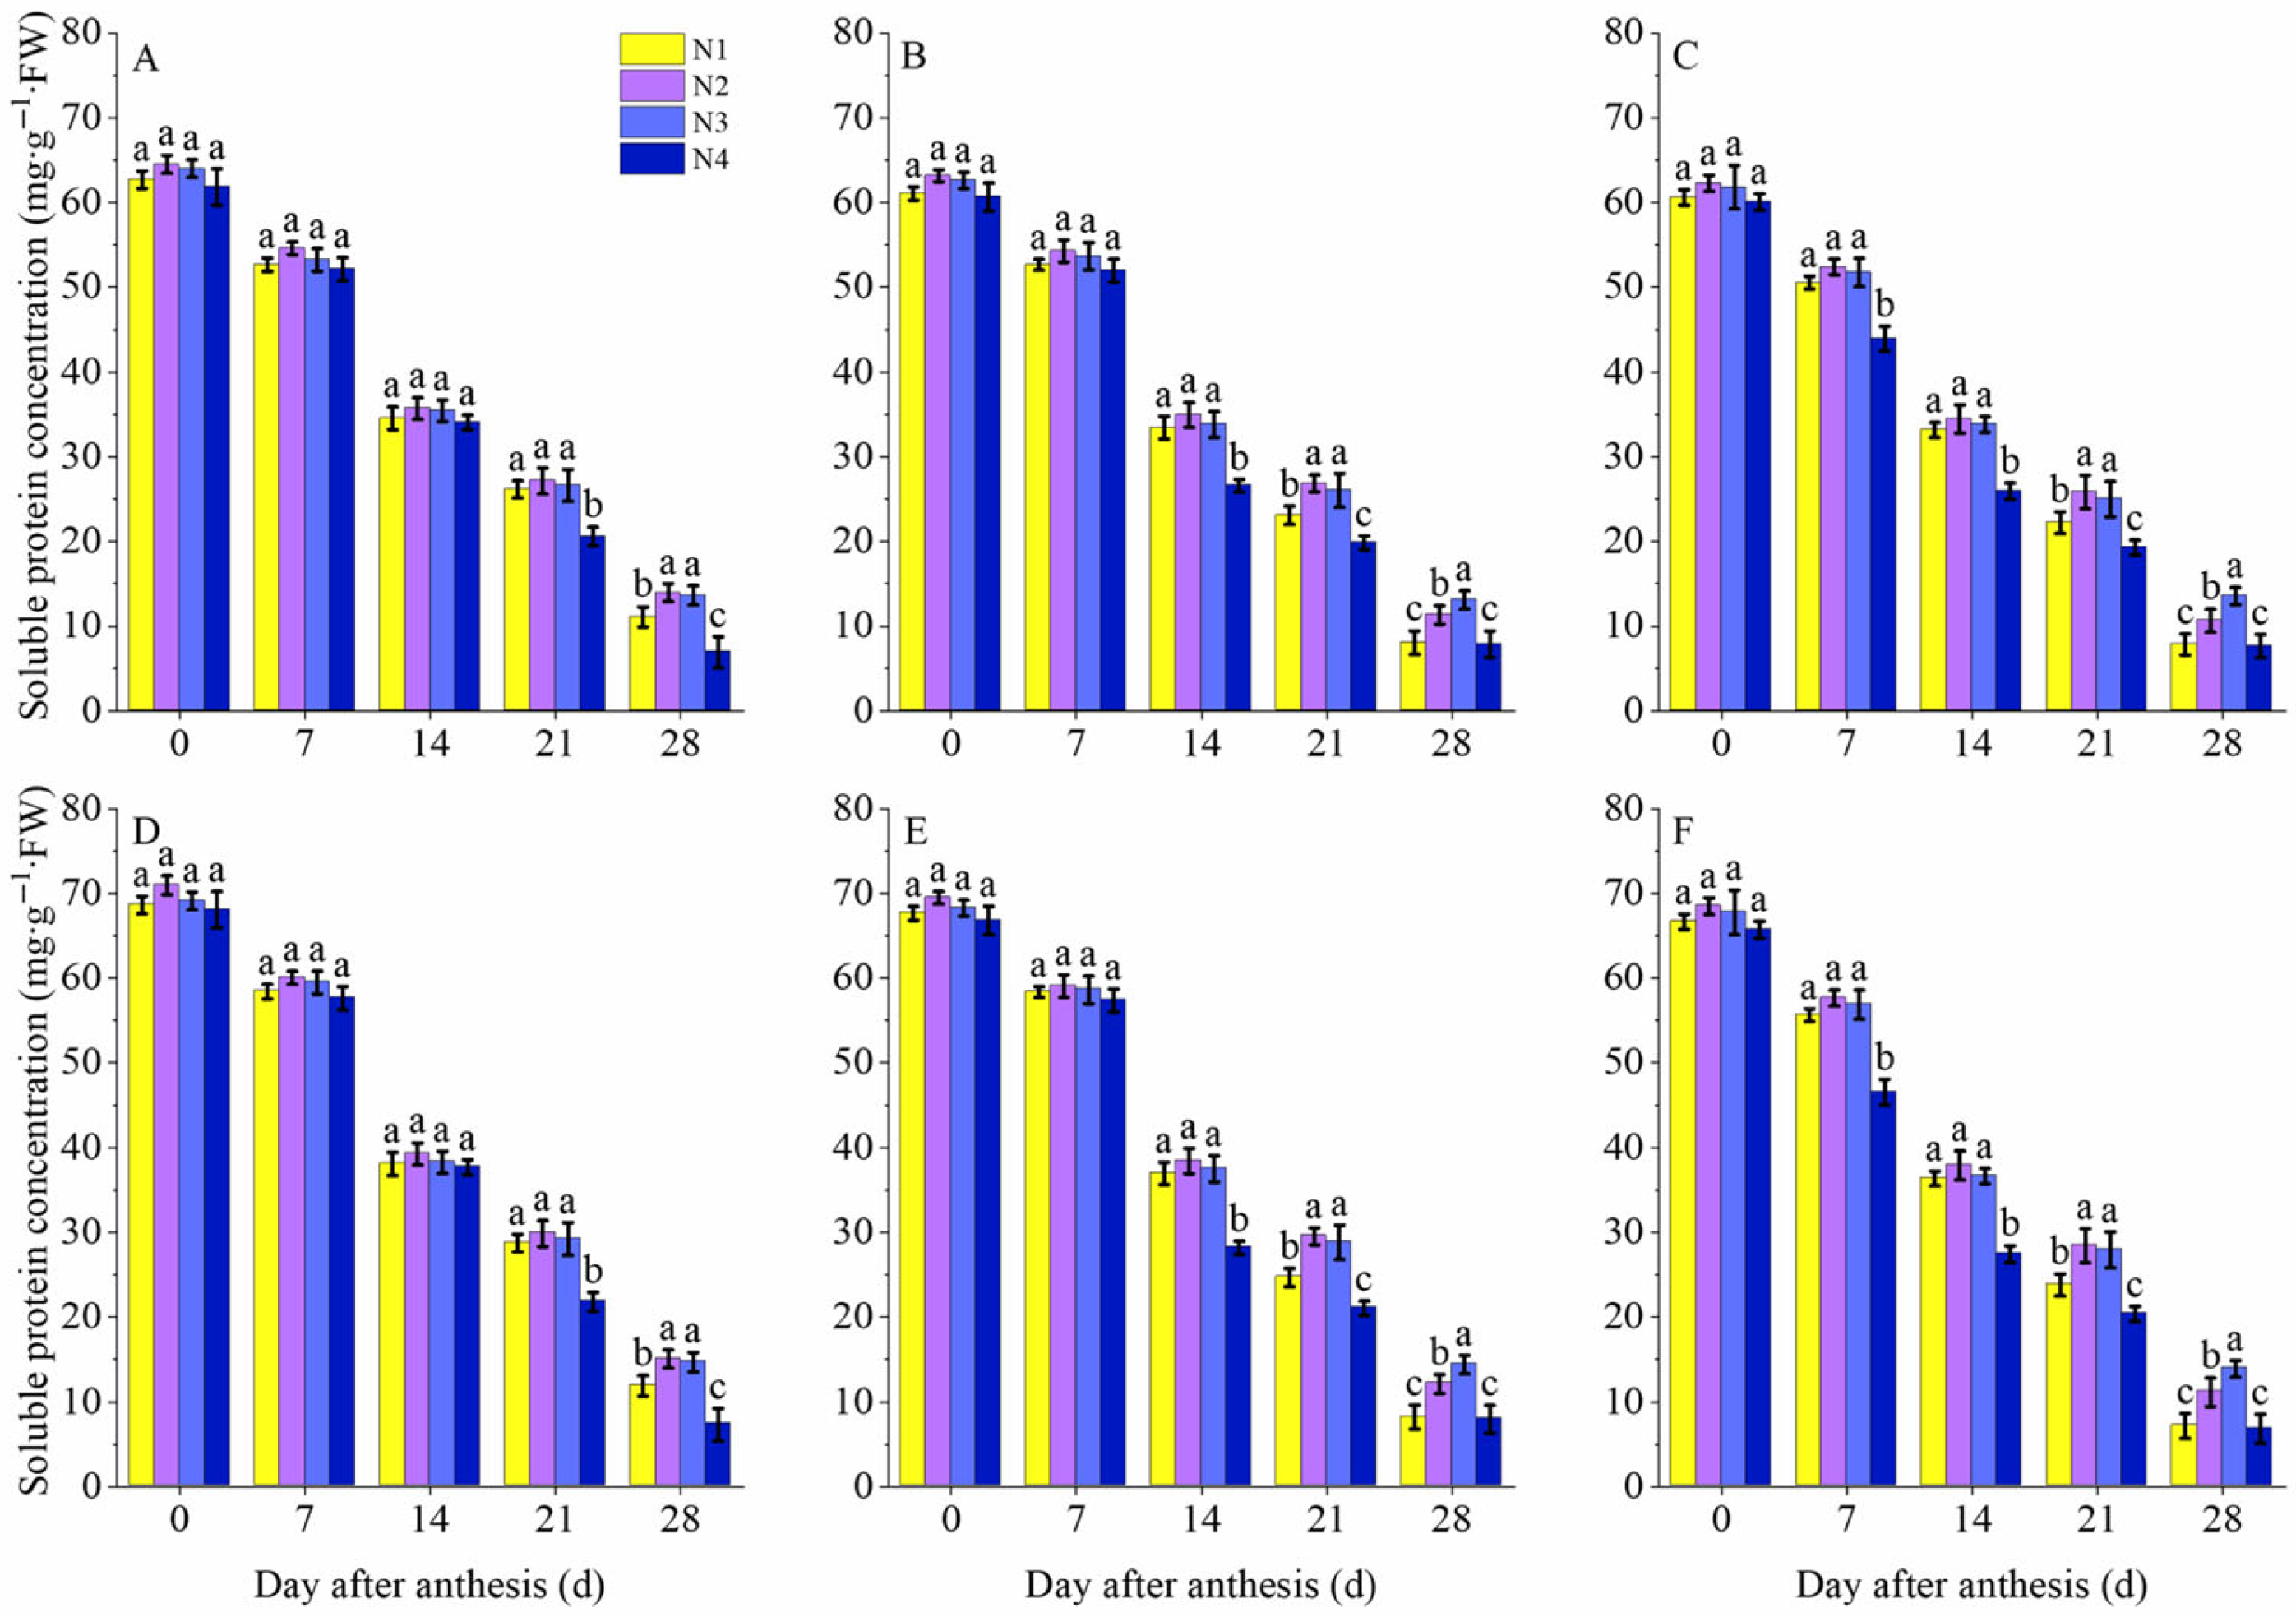
Nitrogen application rate significantly influenced soluble protein content in flag leaves of different tillers in wheat (Figure 9). Across both growing seasons, soluble protein content in flag leaves decreased progressively throughout the growth stages under all treatments. No significant differences in flag leaf soluble protein content were observed among nitrogen application rates for the main stem at 0, 7, and 14 DAA (DAA), the tillers I at 0 and 7 DAA, or the tillers II at 0 DAA. Compared with N1 and N4 treatments, the N3 treatment significantly increased soluble protein content in flag leaves of the main stem at 28 DAA, and in flag leaves of tillers I and tillers II at 21 DAA, with no significant difference compared to the N2 treatment. Additionally, the N3 treatment significantly increased soluble protein content in flag leaves of both tillers I and tillers II at 28 DAA compared to other treatments. Results indicate that the N3 treatment is beneficial for maintaining soluble protein content in flag leaves of all tillers at 21 and 28 DAA.

3.7.3. MDA Content

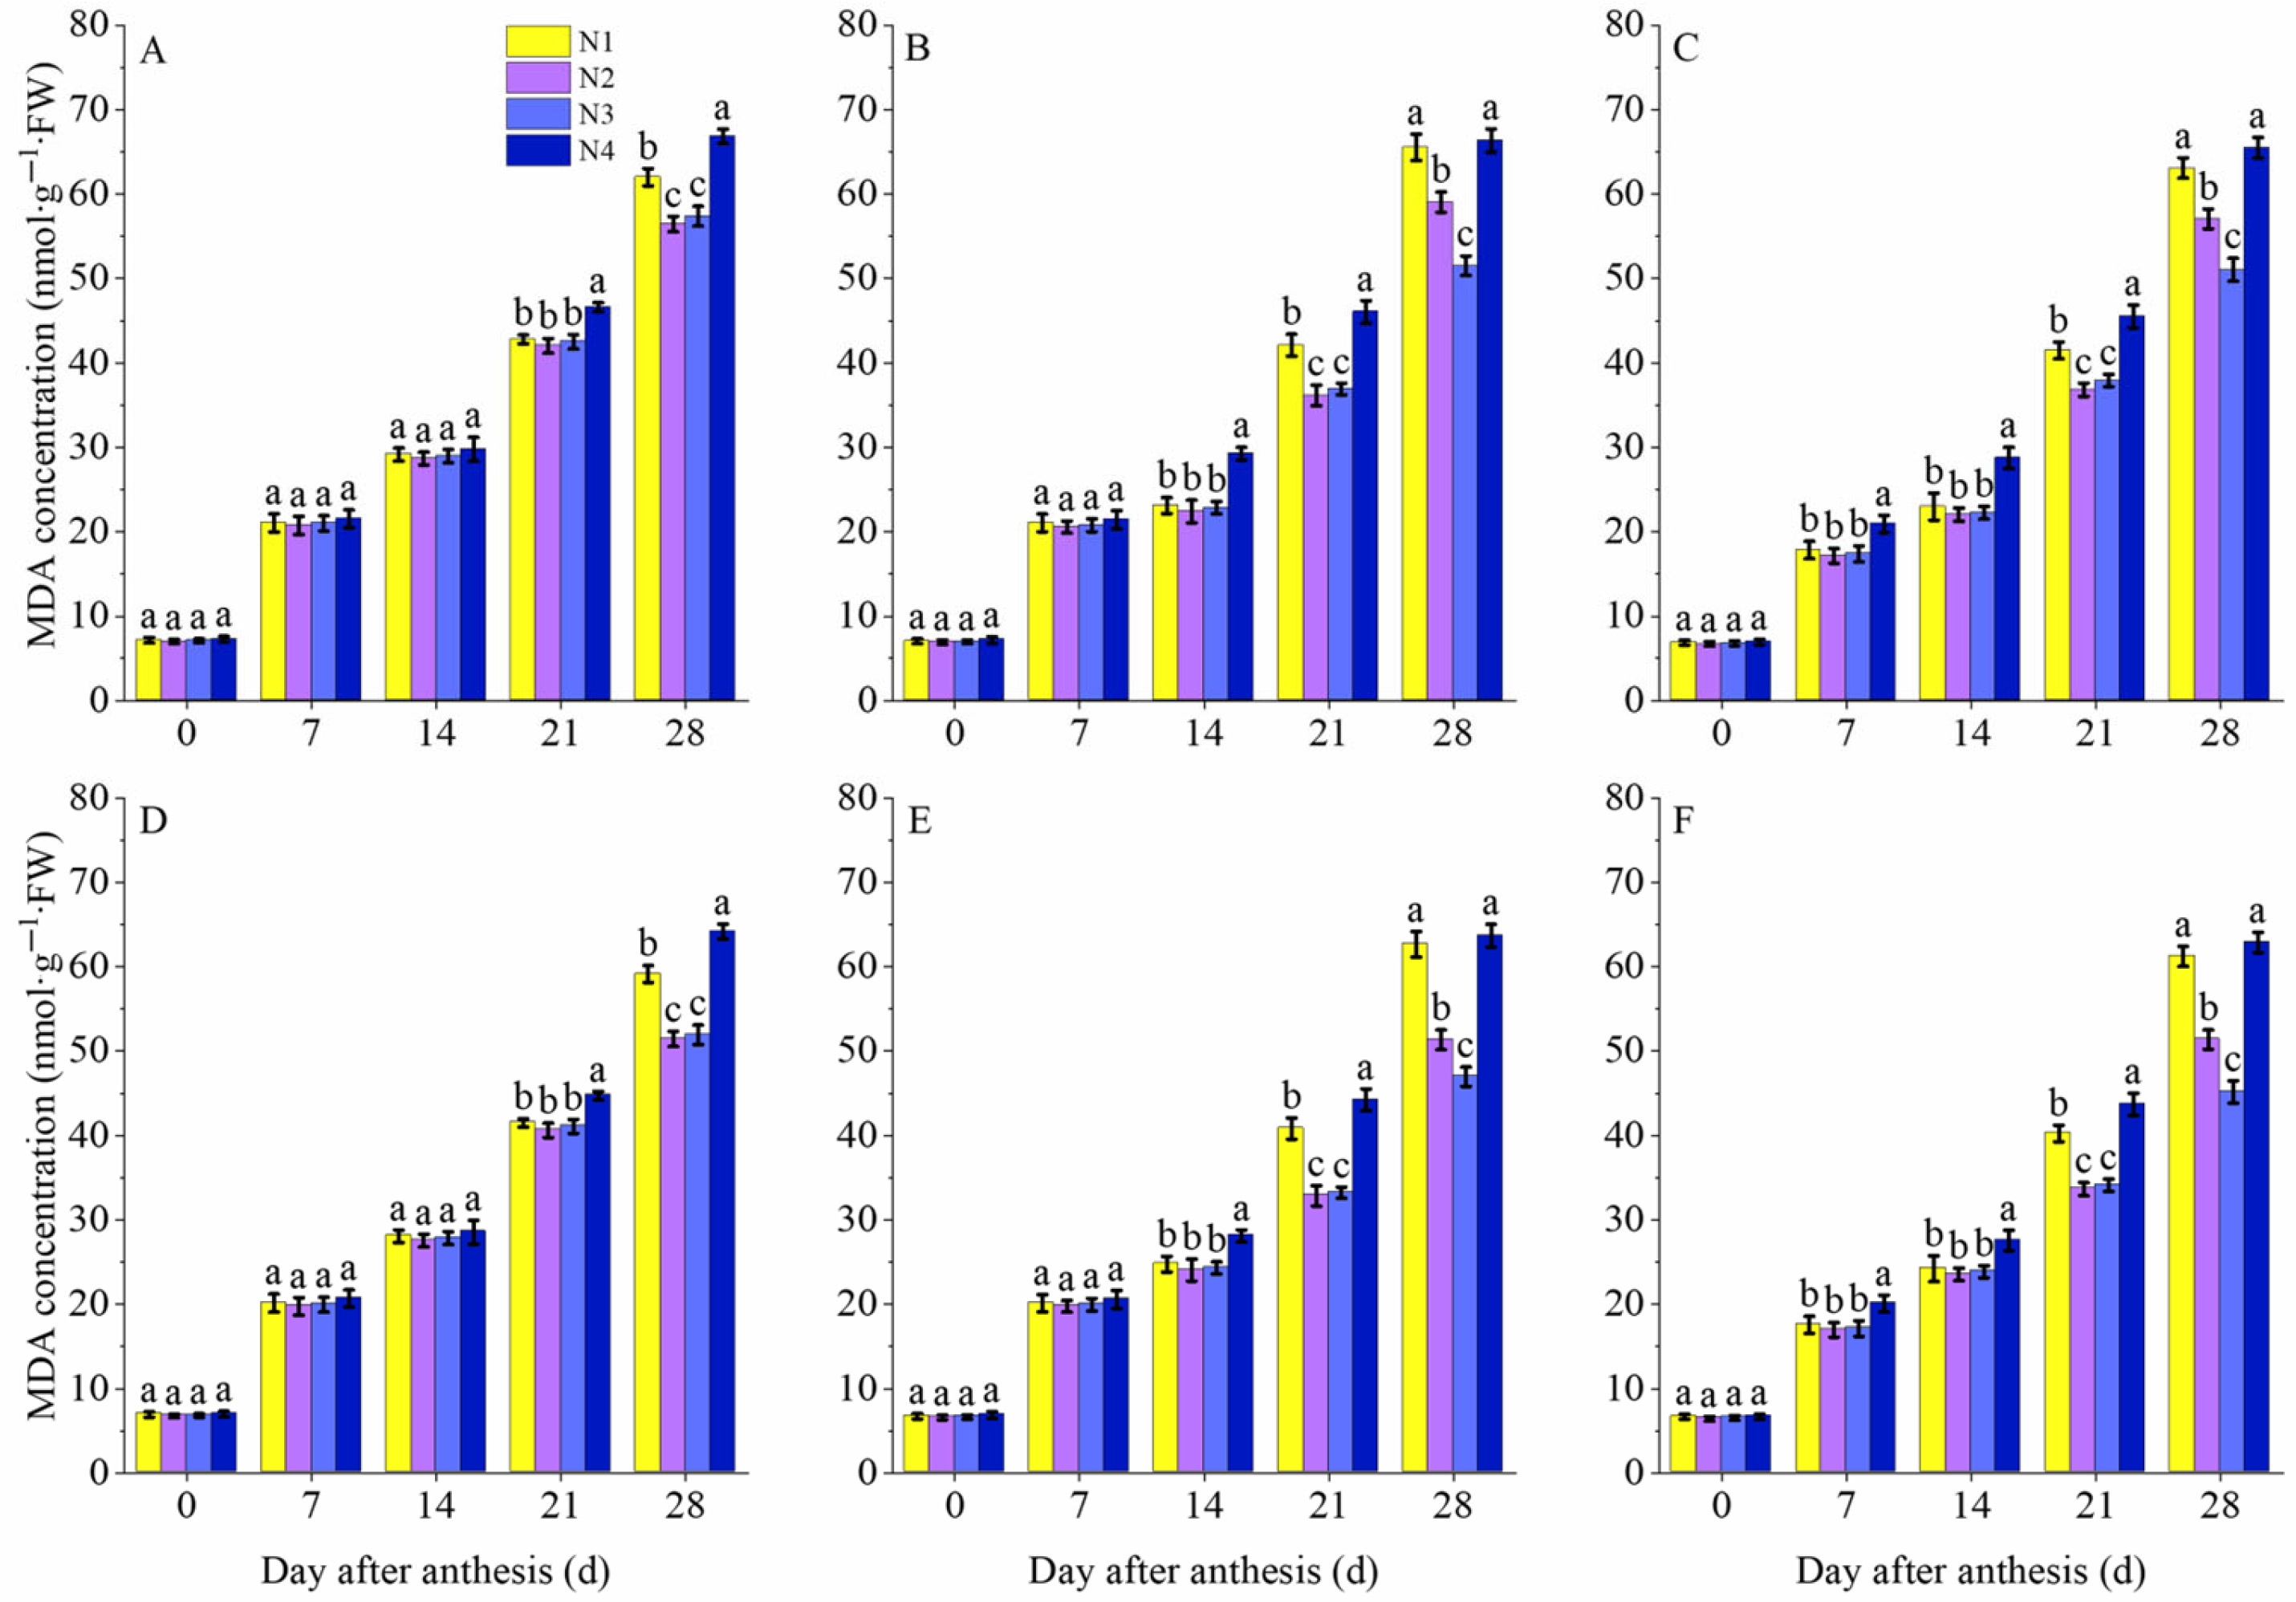
Nitrogen application rate significantly influenced malondialdehyde (MDA) content in flag leaves of different tillers in wheat (Figure 10). Across both growing seasons, malondialdehyde content in flag leaves increased progressively throughout the growth stages under all treatments. Significant differences in flag leaf malondialdehyde content were not observed among nitrogen treatments for the main stem at 0, 7, and 14 DAA, tillers I at 0 and 7 DAA, or tillers II at 0 DAA. Compared with N1 and N4 treatments, the N3 treatment significantly reduced the malondialdehyde content in flag leaves of the main stem at 28 DAA, and in flag leaves of tillers I and tillers II at 21 DAA, while showing no significant difference compared with the N2 treatment. Additionally, the N3 treatment significantly reduced malondialdehyde content in the flag leaves of both tillers I and tillers II at 28 DAA compared to other treatments. Results indicate that the N3 treatment is beneficial for reducing malondialdehyde content in the flag leaves of all tillers at 21 and 28 DAA.

3.8. Effects of Nitrogen Application Rate on Grain Weight per Tiller and Grain Yield per Plant of Wheat Under Water-Saving Supplementary Irrigation

Nitrogen application rate significantly influenced grain yield per tiller, total grain yield, and agronomic nitrogen use efficiency in wheat (Table 2 and Table 3). Across both growing seasons, grain yield per tiller followed the pattern: main stem > tiller I > tiller II, with grain yield decreasing as tiller position increased. Significant differences in grain yield among tiller positions were confirmed by Duncan’s multiple-range test. Compared to the N1 treatment, the N3 treatment increased grain yield on the main stem and tiller I by 23.0% and 20.5% on average, respectively, with no significant difference from the N2 and N4 treatments. Grain yield on tiller II increased by 38.1%, 25.0%, and 26.7% on average compared to the N1, N2, and N4 treatments, respectively. Grain yield under N3 treatment significantly exceeded that of N1 and N4 treatments by 6.5% and 9.5%, respectively, across both growing seasons, with no significant difference from N2 treatment. Nitrogen fertilizer agronomic efficiency under N3 treatment significantly increased by 30.2% and 12.1% compared to N1 and N2 treatments, respectively, showing no significant difference from N4 treatment. The results indicate that the N3 treatment maintains high agronomic nitrogen use efficiency while ensuring high grain yield, with its yield-enhancing effect primarily achieved through significantly increased grain yield per tiller.

4. Discussion

4.1. Nitrogen Improves Spike Formation of Tillers to Increase Grain Yield

In recent decades, rational nitrogen fertilizer application has played a crucial role in improving plant growth and increasing grain yield [21]. Some reports have proved that grain yield increased with the increase in fertilizer application, but that excessive fertilization would lead to diminishing yields, which is consistent with the results of this study [22]. Although the spike numbers have little potential to increase wheat yield under super-high yield conditions, it is necessary to ensure sufficient spikes to achieve high yield [23]. Two lines of evidence from this experiment demonstrate that ensuring sufficient spike numbers guaranteed the higher level of grain yield. Firstly, the grain yield of N2 and N3 treatments was significantly higher than that of N1 and N4 treatments. Reasons that the tiller number of population varied between different treatments are mainly attributed to the fact that the nitrogen application amount in N3 treatments was lower than that in N1 and N2 treatments, which did not favor the occurrence of tillers and significantly decreased the number of tillers at different stages. However, to maintain the spike formation of tillers during wintering and increase spike formation of spring tillers, the nitrogen fertilizer application at jointing was an important agronomic measure [24]. As expected, nitrogen fertilizer application increased grain yield from 7233.93 to 7898.12 kg ha−1 (2023–2024) and 7427.03 to 8154.67 kg ha−1 (2024–2025). Further analysis found that the main stem (O) and primary tillers (I and II) produced spikes at harvest. Increased nitrogen application promoted the generation of tillers, but high-position tillers failed to develop into effective spikes even under sufficient nitrogen supply and did not contribute to yield formation. These results confirmed that optimizing nitrogen fertilizer application amount improves spike formation in low-position tillers to increase grain yield rather than conversion to more high-position productive tillers.

4.2. Nitrogen Improves Photosynthetic Performance of Tillering Leaves and Delay of Leaf Senescence to Increase Grain Yield

Photosynthetic capacity is typically constrained under low nitrogen stress conditions, and surplus light energy is prone to trigger photoinhibition and even lead to photooxidation, thereby causing damage to the photosynthetic membrane system [25]. Malondialdehyde (MDA), a secondary metabolite of membrane lipid peroxidation in flag leaves, is commonly employed as an indicator to reflect the extent of oxidative damage sustained by the membrane system under stress [8]. To cope with oxidative damage induced by low nitrogen stress, plants usually synthesize a variety of oxygen-related chemical defense systems, such as superoxide dismutase (SOD) and catalase (CAT) [26]. In the present study, the reduction in MDA content coupled with the elevation of SOD and CAT activities facilitated yield formation [27]. An increase in MDA content generally signifies a rise in oxidative damage to the membrane system, which can disrupt the normal structure and functional integrity of the membrane system [28,29]. While low nitrogen stress resulted in an increase in MDA content, the treatments involving nitrogen fertilizer application exhibited lower MDA content compared to the control group. Meanwhile, the senescence of flag leaves post-anthesis was significantly delayed with the increase of nitrogen application. The wheat grain weight is determined from anthesis to maturity, which is closely related to post-anthesis dry matter accumulation, and the higher photosynthetic capacity of flag leaves is the key to obtaining larger grain weight [17]. In this study, nitrogen fertilizer application improved Pn. Our study found that the 10% N reduction (N3) treatment maintained a more stable Pn in flag leaves, thereby better preserving the stability of the photosynthetic system. Hence, the improved post-anthesis photosynthetic capacity (Pn, Tr, Ci) promoted post-anthesis dry matter accumulation, forming the biological foundation for yield enhancement [20]. A good understanding of the response of photosynthesis rate (Pn) and transpiration rate (Tr) in different tillers to nitrogen fertilizer application during post-anthesis is important to cumulative photosynthetic production [30]. The 10% N reduction (N3) significantly enhanced the photosynthetic capacity of individual tillers, increased photosynthetic rate, and further boosted wheat yield.

4.3. Nitrogen Fertilizer Management Increases Grain Yield and Nitrogen Use Efficiency

The ultimate goal of the current experiment was to determine the most efficient nitrogen fertilizer application amount for improving winter wheat productivity. However, nitrogen fertilization is critical in increasing wheat yield [31]. When the rate of nitrogen fertilization surpasses a tolerable range, crop development can be severely impacted by decreased stress tolerance, excessive vegetative growth, and reduced light energy use, resulting in lower yield [32]. In this work, increasing the nitrogen application rate promoted the grain yield per tiller. Ren et al. also concluded that the nitrogen application significantly optimized the photosynthetic characteristics of flag leaves, increased the matter transport efficiency, and improved photosynthate distribution to the grain, ultimately enhancing grain yield per tiller [33]. However, there is a threshold of nitrogen application rate. Jiang et al. [16] also found in the study of the nitrogen application rate that grain weight began to decrease when the nitrogen application rate was increased to a certain extent. Wang et al. [34] established that increasing nitrogen application rate from 150 kg N ha−1 to 300 kg ha−1 significantly increased starch accumulation in grains, where the highest values were depicted for nitrogen application at 225 kg N ha−1. The different nitrogen treatments used in the current study significantly influenced wheat grain yield. The N3 treatment resulted in the highest grain yield and nitrogen use efficiency during both winter wheat-growing seasons. This is in line with the findings of Zhang et al., Zain et al., and Abubakar et al. in a similar experimental environment. Excessive N application (N1) did not lead to the highest grain yield in either growing season [35,36,37]. A similar observation was also reported by Abubakar et al. [35]. However, in this experiment, there was no significant difference in grain yield between the N3 treatment and the N2 treatment, but the decrease in nitrogen application led to a significant increase in nitrogen use efficiency. The higher grain yield and nitrogen use efficiency reported in this experiment could imply that the N3 was appropriate for achieving crop nitrogen demand at the application time.

5. Conclusions

For the cultivar Jimai 22 grown on loamy textured soils in the North China Plain with a basal-to-topdressing urea ratio of 1:1, reducing the conventional nitrogen input by 10% (to 189 kg N ha−1) emerged as the most appropriate fertilization strategy. This rate maintains grain yield equal to the conventional 210 kg N ha−1, significantly improves agronomic nitrogen use efficiency, optimizes effective tiller spike formation, enhances post-anthesis photosynthetic capacity of tiller flag leaves, and delays leaf senescence. This optimized nitrogen management can reduce nitrogen input while ensuring yield, which is a practical strategy for green and sustainable development of winter wheat production in the North China Plain.

Author Contributions

Z.Z.: Writing—original draft, Software, Data curation, Methodology. Y.S. (Yueyan Song): Writing—original draft, Software, Visualization. Z.Y.: Writing—review and editing, Project administration, Methodology. Y.S. (Yu Shi): Writing—review and editing, Validation, Resources. Y.Z.: Data curation, Formal analysis, Validation. J.Z.: Data curation, Writing—review and editing, Supervision. All authors have read and agreed to the published version of the manuscript.

Funding

This work was supported by the National Natural Science Foundation of China (32502037) and the China Agriculture Research System of MOF and MARA (CARS-03-1-19).The Article Processing Charge (APC) was funded by Shandong Agricultural University.

Data Availability Statement

The original contributions presented in this study are included in the article. Further inquiries can be directed to the corresponding author.

Conflicts of Interest

The authors declare no conflicts of interest.

References

  1. Zhang, T.Y.; He, Y.; DePauw, R.; Jin, Z.O.; Garvin, D.; Yue, X.; Anderson, W.; Li, T.; Dong, X.; Zhang, T.; et al. Climate change may outpace current wheat breeding yield improvements in North America. Nat. Commun. 2022, 13, 5591. [Google Scholar] [CrossRef] [PubMed]
  2. Yu, C.; Huang, X.; Chen, H.; Godfray, H.C.J.; Wright, J.S.; Hall, J.W.; Gong, P.; Ni, S.Q.; Qiao, S.C.; Huang, G.R.; et al. Managing nitrogen to restore water quality in China. Nature 2019, 567, 516–520. [Google Scholar] [CrossRef] [PubMed]
  3. Chang, Y.L.; Liu, J.M.; Li, Y.H.; Sun, B.H.; Zhang, S.L.; Yang, X.Y. Investigation and evaluation of fertilization under Winter wheat and summer maize rotation system in Guanzhong Plain, Shanxi Province. J. Northwest. A&F Univ. 2014, 42, 51–61. (In Chinese) [Google Scholar]
  4. Maaz, T.M.; Sapkota, T.B.; Eagle, A.J.; Kantar, M.B.; Bruulsema, T.W.; Majumdar, K. Meta-analysis of yield and nitrous oxide outcomes for nitrogen management in agriculture. Glob. Change Biol. 2021, 27, 2343–2360. [Google Scholar] [CrossRef] [PubMed]
  5. Van Grinsven, H.J.M.; ten Berge, H.F.M.; Dalgaard, T.; Fraters, B.; Durand, P.; Hart, A.; Hofman, G.; Jacobsen, B.H.; Lalor, S.T.J.; Lesschen, J.P.; et al. Management, regulation and environmental impacts of nitrogen fertilization in northwestern Europe under the Nitrates Directive; a benchmark study. Biogeosciences 2012, 9, 5143–5160. [Google Scholar] [CrossRef]
  6. Yu, H.; Yang, J.; Cui, H.; Li, Z.; Jia, F.; Chen, J.; Li, X. Effects of plant density on tillering in the weed grass aegilops tauschii coss. and its phytohormonal regulation. Plant Physiol. Biochem. 2020, 157, 70–78. [Google Scholar] [CrossRef]
  7. Shi, C.; Guo, Y.; Zhu, J. Evaluation of over fertilization in China and its influencing factors. Res. Agric. Mod. 2016, 37, 671–679. [Google Scholar]
  8. Tao, Z.Q.; Wang, D.M.; Ma, S.K.; Yang, Y.S.; Zhao, G.C.; Chang, X.H. Light interception radiation use efficiency response to tridimensional uniform sowing in winter wheat. J. Integr. Agric. 2018, 17, 566–578. [Google Scholar] [CrossRef]
  9. Li, H.S. Principles and Techniques of Plant Physiological Biochemical Experiments; Higher Education Press: Beijing, China, 2000; pp. 123–156. [Google Scholar]
  10. Gao, F.; Li, Z.; Gao, Y.; Gaoyang, E.; Li, M.; Li, C.; Cheng, Y.; Zhang, T.; Wang, S.; Wu, L.; et al. The effect of long-term controlledrelease urea application on the relative abundances of plant growth-promoting microorganisms. Eur. J. Agron. 2023, 151, 126971. [Google Scholar] [CrossRef]
  11. Zhang, P.; Ma, G.; Wang, C.; Lu, H.; Li, S.; Xie, Y.; Ma, D.; Zhu, Y.; Guo, T. Effect of irrigation and nitrogen application on grain amino acid composition and protein quality in winter wheat. PLoS ONE 2017, 12, e0178494. [Google Scholar] [CrossRef]
  12. Tian, Z.; Liu, X.; Gu, S. Postponed and reduced basal nitrogen application improves nitrogen use efficiency and plant growth of winter wheat. J. Integr. Agr. 2018, 17, 2648–2661. [Google Scholar] [CrossRef]
  13. Zhou, Y.; Xu, L.; Zhang, J.; Li, W.; Jiang, Y.; Wang, S.; Ding, Y.; Liu, Z.; Li, G. Low N apparent surplus with higher rice yield under long-term fertilizer postponing in the rice-wheat cropping system. Crop J. 2022, 10, 1178–1186. [Google Scholar] [CrossRef]
  14. Xue, C.; Matros, A.; Mock, H.P.; Muhling, K.H. Protein composition and baking quality of wheat flour as affected by split nitrogen application. Front. Plant Sci. 2019, 10, 642. [Google Scholar] [CrossRef]
  15. IUSS Working Group—World Reference Base. World Reference Base for Soil Resources 2014, update 2015: International Soil Classification System for Naming Soils and Creating Legends for Soil Maps; World Soil Resources Reports No. 106; FAO: Rome, Italy, 2015. [Google Scholar]
  16. Lecarpentier, C.; Barillot, R.; Blanc, E.; Abichou, M.; Goldringer, I.; Barbillon, P.; Enjalbert, J.; Andrieu, B. WALTer: A three-dimensional wheat model to study competition for light through the prediction of tillering dynamics. Ann. Bot. 2019, 123, 961–975. [Google Scholar] [CrossRef] [PubMed]
  17. Müller, D.; Leyser, O. Auxin, cytokinin and the control of shoot branching. Ann. Bot. 2011, 107, 1203–1212. [Google Scholar] [CrossRef] [PubMed]
  18. Bao, S.D. Soil and Agricultural Chemistry Analysis; China Agriculture Press: Beijing, China, 2000. [Google Scholar]
  19. Bremner, J.M. Total nitrogen. In Methods of Soil Analysis: Part 1 Physical and Mineralogical Properties; Black, C.A., Ed.; American Society of Agronomy: Madison, WI, USA, 1965; pp. 1149–1178. [Google Scholar]
  20. Olsen, S.R.; Cole, C.V.; Watanabe, F.S.; Dean, L.A. Estimation of Available Phosphorus in Soils by Extraction with Sodium Bicarbonate; US Department of Agriculture: Washington, DC, USA, 1954. [Google Scholar]
  21. Zhang, G.X.; Zhao, D.H.; Fan, H.Z.; Liu, S.J.; Liao, Y.C.; Han, J. Combining controlled-release urea and normal urea with appropriate nitrogen application rate to reduce wheat stem lodging risk and increase grain yield and yield stability. J. Integr. Agric. 2023, 22, 3006–3021. [Google Scholar] [CrossRef]
  22. Li, J. Study on the relationship between nitrogen application rate and wheat yield and nitrogen use efficiency. Acta Agron. Sin. 1987, 13, 23–30. [Google Scholar]
  23. Gautam, S.; Lisa, M.B.; Robert, B.M. Senescence, dormancy and tillering in perennial C4 grasses. Plant Sci. 2014, 217–218, 140–151. [Google Scholar] [CrossRef] [PubMed]
  24. Ferrante, A.; Cartelle, J.; Savin, R.; Slafer, G.A. Yield determination, interplay between major components and yield stability in a traditional and a contemporary wheat across a wide range of environments. Field Crop Res. 2017, 203, 114–127. [Google Scholar] [CrossRef]
  25. Liu, G.; Zhou, B.; Hou, Y. Effects of Nitrogen on Winter Wheat Growth under Different Salt Stress. J. Irrig. Drain. 2019, 38, 36–40. [Google Scholar]
  26. Zheng, B.; Zhao, H.; Zhou, Q.; Cai, J.; Wang, X.; Cao, W.; Dai, T.; Jiang, D. Relationships of protein composition, gluten structure and dough rheological properties with short biscuits quality of soft wheat varieties. Agron. J. 2020, 112, 1921–1930. [Google Scholar] [CrossRef]
  27. Shanahan, J.F.; Kitchen, N.R.; Raun, W.R.; Schepers, J. Responsive in season nitrogen management for cereals. Comput. Electron. Agric. 2008, 61, 51–62. [Google Scholar] [CrossRef]
  28. Norby, R.J.; Warren, J.M. CO2 enhancement of forest productivity constrained by limited nitrogen availability. Proc. Natl. Acad. Sci. USA 2010, 107, 19368–19373. [Google Scholar] [CrossRef] [PubMed]
  29. Noor, H.; Sun, M.; Algwaiz, H.I.; Sher, A.; Fiaz, S.; Attia, K.A.; Wani, S.H.; AlKahtani, M.D.; Husnain, L.A.; Lin, W. Chlorophyll fluorescence and grain filling characteristic of wheat (Triticum aestivum L.) in response to nitrogen application level. Mol. Biol. Rep. 2022, 49, 7157–7172. [Google Scholar] [CrossRef]
  30. Zhou, C.; Huang, Y.; Jia, B.; Wang, S.; Dou, F.; Samonte, S.O.P.; Chen, K.; Wang, Y. Optimization of nitrogen rate and planting density for improving the grain yield of different rice genotypes in northeast China. Agronomy 2019, 9, 555. [Google Scholar] [CrossRef]
  31. Vogeler, I.; Jensen, J.L.; Thomsen, I.K.; Labouriau, R.; Hansen, E.M. Fertilizer N rates interact with sowing time and catch crops in cereals and affect yield and nitrate leaching. Eur. J. Agron. 2021, 124, 126244. [Google Scholar] [CrossRef]
  32. Xue, H.; Han, Y.; Li, Y.; Wang, G.; Feng, L.; Fan, Z.; Du, W.; Beifang, Y.; Cao, C.; Mao, S. Spatial distribution of light interception by different plant population densities and its relationship with yield. Field Crops Res. 2015, 184, 17–27. [Google Scholar] [CrossRef]
  33. Ren, H.; Jiang, Y.; Zhao, M.; Qi, H.; Li, C.F. Nitrogen supply regulates vascular bundle structure and matter transport characteristics of spring maize under high plant density. Front. Plant Sci. 2021, 11, 602739. [Google Scholar] [CrossRef] [PubMed]
  34. Wang, J.; Wen, Z.R.; Fu, P.X.; Lu, W.P.; Lu, D.L. Effects of Nitrogen Rates on the Physicochemical Properties of Waxy Maize Starch. Starch-Starke 2019, 71, 1900146. [Google Scholar] [CrossRef]
  35. Abubakar, M.; Zhang, J.; Li, G.; Zhao, W. Optimized nitrogen application rate improves yield and nitrogen use efficiency of winter wheat in the North China Plain. J. Integr. Agric. 2022, 21, 345–354. [Google Scholar]
  36. Zain, M.; Si, Z.; Li, S.; Gao, Y.; Mehmood, F.; Rahman, S.U.; Hamani, A.K.M. Effects of nitrogen application rate on growth, yield and nitrogen use efficiency of winter wheat. Chin. J. Eco-Agric. 2021, 29, 123–132. [Google Scholar]
  37. Zhang, Z.; Yu, Z.; Zhang, Y.; Shi, Y. Split nitrogen fertilizer application improved grain yield in winter wheat (Triticum aestivum L.) via modulating antioxidant capacity and 13C photosynthate mobilization under water-saving irrigation conditions. Ecol. Process. 2021, 10, 21. [Google Scholar] [CrossRef]
Figure 1. Monthly precipitation and average temperature during wheat growing season in 2023–2024 and 2024–2025.
Agronomy 16 01079 g001
Figure 2. Effect of nitrogen application rate on total tiller number of wheat population at different growth stages. N1: 10% N increase; N2: conventional N rate; N3: 10% N reduction; N4: 20% N reduction. Different lowercase letters indicate significant differences among treatments at p < 0.05. Vertical scales of the two growing seasons are consistent for comparison.
Agronomy 16 01079 g002
Figure 3. Effects of different treatments on net photosynthetic rate of tiller flag leaves of wheat after anthesis in main stem (A), tiller I (B), tiller II (C) in 2023–2024 and main stem (D), tiller I (E), tiller II (F) in 2024–2025. N1: 10% N increase; N2: conventional N rate; N3: 10% N reduction; N4: 20% N reduction. Different lowercase letters indicate significant differences among treatments at p < 0.05.
Agronomy 16 01079 g003
Figure 4. Effects of different treatments on stomatal conductance of flag leaf of each stem and tiller after anthesis of wheat in main stem (A), tiller I (B), tiller II (C) in 2023–2024 and main stem (D), tiller I (E), tiller II (F) in 2024–2025. N1: 10% N increase; N2: conventional N rate; N3: 10% N reduction; N4: 20% N reduction. Different lowercase letters indicate significant differences among treatments at p < 0.05.
Agronomy 16 01079 g004
Figure 5. Effect of different treatments on transpiration rate of flag leaf of each stem and tiller after anthesis of wheat in main stem (A), tiller I (B), tiller II (C) in 2023–2024 and main stem (D), tiller I (E), tiller II (F) in 2024–2025. N1: 10% N increase; N2: conventional N rate; N3: 10% N reduction; N4: 20% N reduction. Different lowercase letters indicate significant differences among treatments at p < 0.05.
Agronomy 16 01079 g005
Figure 6. Effect of different treatments on sucrose content in flag leaves of various stems and tillers after anthesis of wheat in main stem (A), tiller I (B), tiller II (C) in 2023–2024 and main stem (D), tiller I (E), tiller II (F) in 2024–2025. N1: 10% N increase; N2: conventional N rate; N3: 10% N reduction; N4: 20% N reduction. Different lowercase letters indicate significant differences among treatments at p < 0.05.
Agronomy 16 01079 g006
Figure 7. Effect of different treatments on the activities of sucrose phosphate synthase in flag leaves of various stems and tillers after anthesis of wheat in the main stem (A), tiller I (B), tiller II (C) in 2023–2024 and main stem (D), tiller I (E), tiller II (F) in 2024–2025. N1: 10% N increase; N2: conventional N rate; N3: 10% N reduction; N4: 20% N reduction. Different lowercase letters indicate significant differences among treatments at p < 0.05.
Agronomy 16 01079 g007
Figure 8. Effect of different treatments on superoxide dismutase activity of flag leaves of stems and tillers after anthesis of wheat in main stem (A), tiller I (B), tiller II (C) in 2023–2024 and main stem (D), tiller I (E), tiller II (F) in 2024–2025. N1: 10% N increase; N2: conventional N rate; N3: 10% N reduction; N4: 20% N reduction. Different lowercase letters indicate significant differences among treatments at p < 0.05.
Agronomy 16 01079 g008
Figure 9. Effect of different treatments on soluble protein content of flag leaves of various stems and tillers after anthesis of wheat in main stem (A), tiller I (B), tiller II (C) in 2023–2024 and main stem (D), tiller I (E), tiller II (F) in 2024–2025. N1: 10% N increase; N2: conventional N rate; N3: 10% N reduction; N4: 20% N reduction. Different lowercase letters indicate significant differences among treatments at p < 0.05.
Agronomy 16 01079 g009
Figure 10. Effect of different treatments on malondialdehyde content of flag leaves of various stems and tillers after anthesis of wheat in main stem (A), tiller I (B), tiller II (C) in 2023–2024 and main stem (D), tiller I (E), tiller II (F) in 2024–2025.
Agronomy 16 01079 g010
Table 1. Effect of nitrogen application rate on the number of ears per stalk and tiller of wheat at maturity. N1: 10% N increase; N2: conventional N rate; N3: 10% N reduction; N4: 20% N reduction. O: main stem; I: first primary tiller; II: second primary tiller. Different lowercase letters in the same column indicate significant differences among treatments at p < 0.05.
Growth SeasonTreatmentNumber of Spike per Plant with Different Stems and Tillers (Stem · Plant−1)Total Number of Spikes per Plant
(Stem · Plant−1)
OIII
2023–2024N11.00 a0.93 a0.92 a2.85 a
N21.00 a0.68 b0.53 b2.21 b
N31.00 a0.46 c0.30 c1.76 c
N41.00 a0.43 c0.25 c1.68 c
2024–2025N11.00 a1.00 a1.00 a3.32 a
N21.00 a1.00 a1.00 a3.01 b
N31.00 a0.88 b0.68 b2.56 c
N41.00 a0.84 b0.63 b2.47 c
Table 2. Effects of different treatments on grain yield per tillering plant of wheat (2023–2025). N1: 10% N increase; N2: conventional N rate; N3: 10% N reduction; N4: 20% N reduction. O: main stem; I: first primary tiller; II: second primary tiller. Different lowercase letters in the same column indicate significant differences among treatments at p < 0.05.
TreatmentStem TillersGrain Yield of Each Tiller
(g · Stem−1)
2023–20242024–2025
N1O1.82 b1.87 b
N2O2.05 a2.11 a
N3O2.24 a2.30 a
N4O2.00 a2.06 a
N1I1.18 b1.21 b
N2I1.38 a1.42 a
N3I1.42 a1.46 a
N4I1.35 a1.39 a
N1II0.66 c0.68 c
N2II0.73 b0.75 b
N3II0.91 a0.94 a
N4II0.72 a0.74 a
Table 3. Effects of different treatments on wheat grain yield and nitrogen fertilizer agronomic efficiency. N1: 10% N increase; N2: conventional N rate; N3: 10% N reduction; N4: 20% N reduction. Different lowercase letters in the same column indicate significant differences among treatments at p < 0.05.
Growth SeasonTreatmentGrain Yield
(kg · hm−2)
Nitrogen Fertilizer Agronomic Efficiency
(kg · kg−1)
2023–2024N17413.71 b32.09 c
N27831.21 a37.29 b
N37898.12 a41.79 a
N47233.93 b43.06 a
2024–2025N17654.52 b33.14 c
N28085.59 a38.50 b
N38154.67 a43.15 a
N47427.03 b44.21 a
Disclaimer/Publisher’s Note: The statements, opinions and data contained in all publications are solely those of the individual author(s) and contributor(s) and not of MDPI and/or the editor(s). MDPI and/or the editor(s) disclaim responsibility for any injury to people or property resulting from any ideas, methods, instructions or products referred to in the content.