Review

Synergistic Carbon-Nitrogen Pollution Reduction and Emission Mitigation in Agricultural Land: A CiteSpace-Based Bibliometric Analysis


1
School of Spatial Planning and Design, Hangzhou City University, Hangzhou 310015, China
2
Land Consolidation Center of Zhejiang Province, Hangzhou 310007, China
3
Institut National de la Recherche Agronomique, Info&Sols, 45075 Orléans, France
4
Université Paris-Saclay, Institut National de la Recherche Agronomique, AgroParisTech, UMR EcoSys, 91120 Palaiseau, France
*
Authors to whom correspondence should be addressed.
Agronomy 2026, 16(11), 1047; https://doi.org/10.3390/agronomy16111047
Submission received: 1 April 2026 / Revised: 8 May 2026 / Accepted: 19 May 2026 / Published: 25 May 2026
(This article belongs to the Special Issue New Pathways Towards Carbon Neutrality in Agricultural Systems)

Abstract

Global climate change poses escalating ecological challenges, with agriculture contributing approximately 30% of anthropogenic greenhouse gas emissions, primarily from nitrous oxide (N2O) and methane (CH4). The farmland carbon-nitrogen cycle represents a key nexus for coordinating pollution control and carbon mitigation. This study applies bibliometric methods, including co-occurrence analysis, clustering, and burst detection, to 1286 publications retrieved from the Web of Science Core Collection (1990–2025) and CiteSpace 6.2.R4. Results indicate that China (444 papers, centrality 0.42), the United States (211 papers), and Germany (151 papers) are leading contributors, with major institutions forming a multi-centered international collaboration network. Keyword analysis identified 11 core clusters (modularity Q = 0.82, silhouette S = 0.91), with nitrous oxide emerging as the central theme (frequency 670). The field has evolved through three stages: fundamental emission mechanism studies (1990–2005), agricultural management practices (2006–2015), and integrated mitigation strategies with microbial mechanism exploration (2016–2025). Current frontiers emphasize microbial-mediated carbon-nitrogen cycling and yield-scaled emission assessments bridging theory and practice. Future research should prioritize cross-scale coupling analysis, multi-objective management frameworks, smart agricultural technologies, and policy integration. This study provides a systematic bibliometric mapping of the evolution of synergistic carbon-nitrogen research in agricultural systems, offering a quantitative overview of development trends and research gaps.

1. Introduction

1.1. Research Background and Significance

Global warming has emerged as a critical ecological challenge confronting humanity today [1]. According to the IPCC Sixth Assessment Report, the global average temperature has risen by 1.1 °C compared to pre-industrial levels [2]. Without implementing robust emission reduction measures, temperature increases could exceed the 2 °C threshold by the end of this century [3]. The continuous rise in greenhouse gas concentrations remains the primary driver of this issue [4]. Among these, the primary agricultural greenhouse gases, carbon dioxide, nitrous oxide, and methane, demonstrate significant differences in warming potentials [5]. Notably, nitrous oxide exhibits a warming potential 298 times greater than that of carbon dioxide over a century [6]. Agricultural ecosystems, serving as major sources of greenhouse gas emissions and crucial carbon sinks, represent both key emission hotspots and potential carbon sequestration reservoirs [7]. Harnessing their capacity to enhance carbon storage has become pivotal in global climate response strategies [8]. The carbon-nitrogen cycles within farmland ecosystems are intricately interconnected, influencing greenhouse gas production/emission processes (CO2, N2O, CH4) and carbon fixation mechanisms, while also being closely linked to agricultural non-point source pollution caused by nitrogen leaching, ammonia volatilization, and runoff erosion [9]. The pollution issues caused by excessive nitrogen input and greenhouse gas emissions exhibit a synergistic effect [10]. The coordinated regulation of these two factors serves as the core approach to improving agro-ecological environmental quality and reducing greenhouse gas emissions, while also representing a critical pathway to resolving the conflict between agricultural development and ecological conservation [11].
Carbon-nitrogen interactions in farmland are inherently synergistic rather than antagonistic: rational nitrogen regulation mitigates nitrate leaching and ammonia volatilization while simultaneously inhibiting nitrification-denitrification pathways and reducing N2O emission intensity [12,13]. Conversely, increasing soil organic carbon enhances the carbon sink capacity of farmland, improves soil physicochemical properties, and raises nitrogen use efficiency, thereby reducing both the greenhouse effect and nitrogen pollution [14]. However, realizing these synergies in practice remains challenging, as trade-offs between emission reduction and yield maintenance are context-dependent and not yet fully resolved [15].
At the policy level, multiple international frameworks now promote integrated carbon-nitrogen management. The EU Green Deal, the U.S. Agricultural Climate Intelligence Program, and the FAO Farmland Carbon and Nitrogen Management Initiative all emphasize coordinated pollution control and emission mitigation in agricultural systems [16]. In China, the “dual carbon” goals (carbon peak by 2030, carbon neutrality by 2060) and the “Implementation Plan for Agricultural and Rural Emission Reduction and Carbon Sequestration” have placed farmland carbon-nitrogen co-management at the center of national climate governance [17,18]. Against this backdrop, systematically reviewing global research progress and identifying key hotspots and collaborative frameworks hold significant theoretical and practical value for advancing green, low-carbon agricultural development [19,20].

1.2. Overview of Domestic and International Research Status

Research on carbon and nitrogen management in farmland originated in the mid-to-late 20th century [21]. Early studies primarily focused on fundamental carbon and nitrogen transformation processes in agricultural soils and their individual influencing factors [22]. Extensive field experiments and laboratory simulations were conducted to investigate the impacts of monoculture systems and conventional fertilization practices on soil organic carbon accumulation, nitrogen mineralization, and fixation [23]. These efforts initially elucidated the basic carbon and nitrogen cycling pathways in farmland soils, though they had not yet addressed greenhouse gas emissions or environmental pollution issues [24]. With advancing global climate change research, studies on farmland greenhouse gas emissions emerged as an international research hotspot starting in the 1990s [25]. Domestic and international scholars conducted multi-scale observations and experiments at plot, regional, and global levels to investigate the spatio-temporal characteristics of N2O, CO2, and CH4 emissions from farmland, their driving factors (such as soil physicochemical properties, climatic conditions, and management practices), and quantification methodologies [26]. These studies gradually revealed the intrinsic correlations between farmland carbon-nitrogen cycles and greenhouse gas emissions, clarified the regulatory role of carbon-nitrogen coupling processes in greenhouse gas generation, and laid the foundation for subsequent integrated research [27].
Since the beginning of 21st century, synergistic pollution reduction and carbon mitigation have become a central focus in farmland carbon-nitrogen research [28]. Progress has been achieved in three main areas. Technologically, nitrification inhibitors, biochar applications, straw incorporation, and crop rotation have been developed into comprehensive emission reduction systems [29,30]. Mechanistically, researchers have clarified how carbon-nitrogen interactions regulate greenhouse gas emissions and nitrogen loss, identifying critical thresholds for synergistic effects [31]. Methodologically, yield-scaled emission assessments and life cycle evaluations now enable simultaneous accounting of emission reduction and production efficiency [32]. Despite these advances, critical limitations persist. First, most studies have been conducted at individual plot or regional scales, and the mechanisms governing cross-scale carbon-nitrogen co-regulation remain poorly understood [33]. Second, existing management frameworks typically target single objectives (e.g., emission reduction or yield improvement) rather than integrating pollution control, carbon mitigation, and yield stabilization simultaneously [34,35]. Third, there is a notable disconnect between research findings and policy implementation, partly because standardized evaluation criteria applicable across diverse agricultural systems are still lacking [36]. Fourth, global research activity is unevenly distributed, with limited collaboration between major contributing regions [37,38]. These gaps highlight the need for a systematic review that maps the evolution, hotspots, and collaborative structure of this field, which is the objective of the present study.

1.3. Research Content and Technical Approach

This study analyzes international literature from the Web of Science (WOS) Core Collection on synergistic carbon-nitrogen pollution reduction and emission mitigation in agricultural systems [39]. Specifically, we address three research questions: (RQ1) What are the global patterns and collaborative structures in synergistic carbon-nitrogen research? (RQ2) What are the core research hotspots and how are they thematically interconnected? (RQ3) How has the field evolved over time, and what are the current frontiers? The analysis is organized along three corresponding dimensions: (1) bibliometric characteristics of research output, collaboration networks, and leading contributors [40]; (2) identification of research hotspots through keyword co-occurrence and cluster analysis [41]; and (3) thematic evolution and emerging trends via timeline and burst detection analysis [42]. Unlike previous bibliometric studies that have examined individual aspects such as soil carbon or nitrogen management in isolation, this study provides an integrated, multi-dimensional mapping of the synergistic carbon-nitrogen research landscape, covering the full chain from mechanism studies to management practices and policy implications [43]. The detailed technical workflow (data collection, cleaning, CiteSpace parameterization, visualization, and interpretation) is described in Section 2 [44,45,46,47,48].

2. Research Data and Methods

2.1. Data Sources

The literature data for this study were sourced from the Web of Science Core Collection (WOS Core Collection), a database that comprehensively covers high-quality academic publications in global fields such as natural sciences, agricultural sciences, and environmental sciences [49,50]. The following Boolean search query was used:
TS = ((“farmland” OR “agricultural soil” OR “cropland”) AND (“carbon-nitrogen cycle” OR “carbon-nitrogen coupling” OR “carbon nitrogen interaction”) AND (“pollution reduction” OR “emission mitigation” OR “greenhouse gas” OR “nitrous oxide” OR “carbon sequestration”)) [51,52].
The time span was set from 1990 to December 2025. The year 1990 was chosen because it marks the beginning of systematic research on agricultural greenhouse gas emissions following the establishment of the IPCC and the UNFCCC process [53]. Only English-language articles were included. We acknowledge that this language restriction may introduce coverage bias by excluding relevant studies published in Chinese and other languages; this limitation is discussed further in Section 6.2.
A multi-step data cleaning procedure was applied to the initial retrieval results [54]: (1) non-article document types (conference abstracts, proceedings, editorials, and correspondence) were excluded (n removed = 312) [55]; (2) thematic relevance screening removed records unrelated to farmland carbon-nitrogen management, including forestry-, animal husbandry-, and industry-focused studies (n removed = 198) [56]; (3) duplicate records were identified and merged using automated tools combined with manual verification (n removed = 45) [57]; and (4) records lacking authors, keywords, or abstracts were removed (n removed = 27) [58]. The final dataset comprised 1286 valid research articles [59,60].

2.2. Research Methods

This study employed CiteSpace 6.2.R4 [61], a widely used bibliometric visualization tool that supports co-occurrence, clustering, burst, timeline, and collaboration network analyses [62,63,64].
The key parameter settings were configured as follows [65]: time slices were set to 1 year to capture annual changes in the research landscape. Node types included Country, Institution, Author, and Keyword. The g-index (k = 25) was adopted for threshold pruning, as it balances the inclusion of high-impact nodes while controlling network complexity; a sensitivity check with k = 20 and k = 30 yielded qualitatively consistent clustering results. The Log-Likelihood Ratio (LLR) algorithm was used for cluster labeling due to its superior accuracy in extracting semantically representative terms. Graph pruning was activated to optimize network readability.
The analysis covered five dimensions: (1) keyword co-occurrence networks for hotspot identification [66]; (2) LLR-based cluster analysis for thematic categorization [67]; (3) timeline analysis for tracking cluster evolution; (4) burst detection for identifying emerging research fronts; and (5) collaboration network analysis at the national, institutional, and author levels [68]. We note that bibliometric analysis inherently depends on the keywords assigned by authors and indexers, which may not fully capture all research dimensions. Additionally, citation-based metrics can be influenced by self-citation patterns and disciplinary citation norms. These methodological constraints should be considered when interpreting the results.

3. Bibliometric Feature Analysis

3.1. National/Regional Cooperation Network Analysis

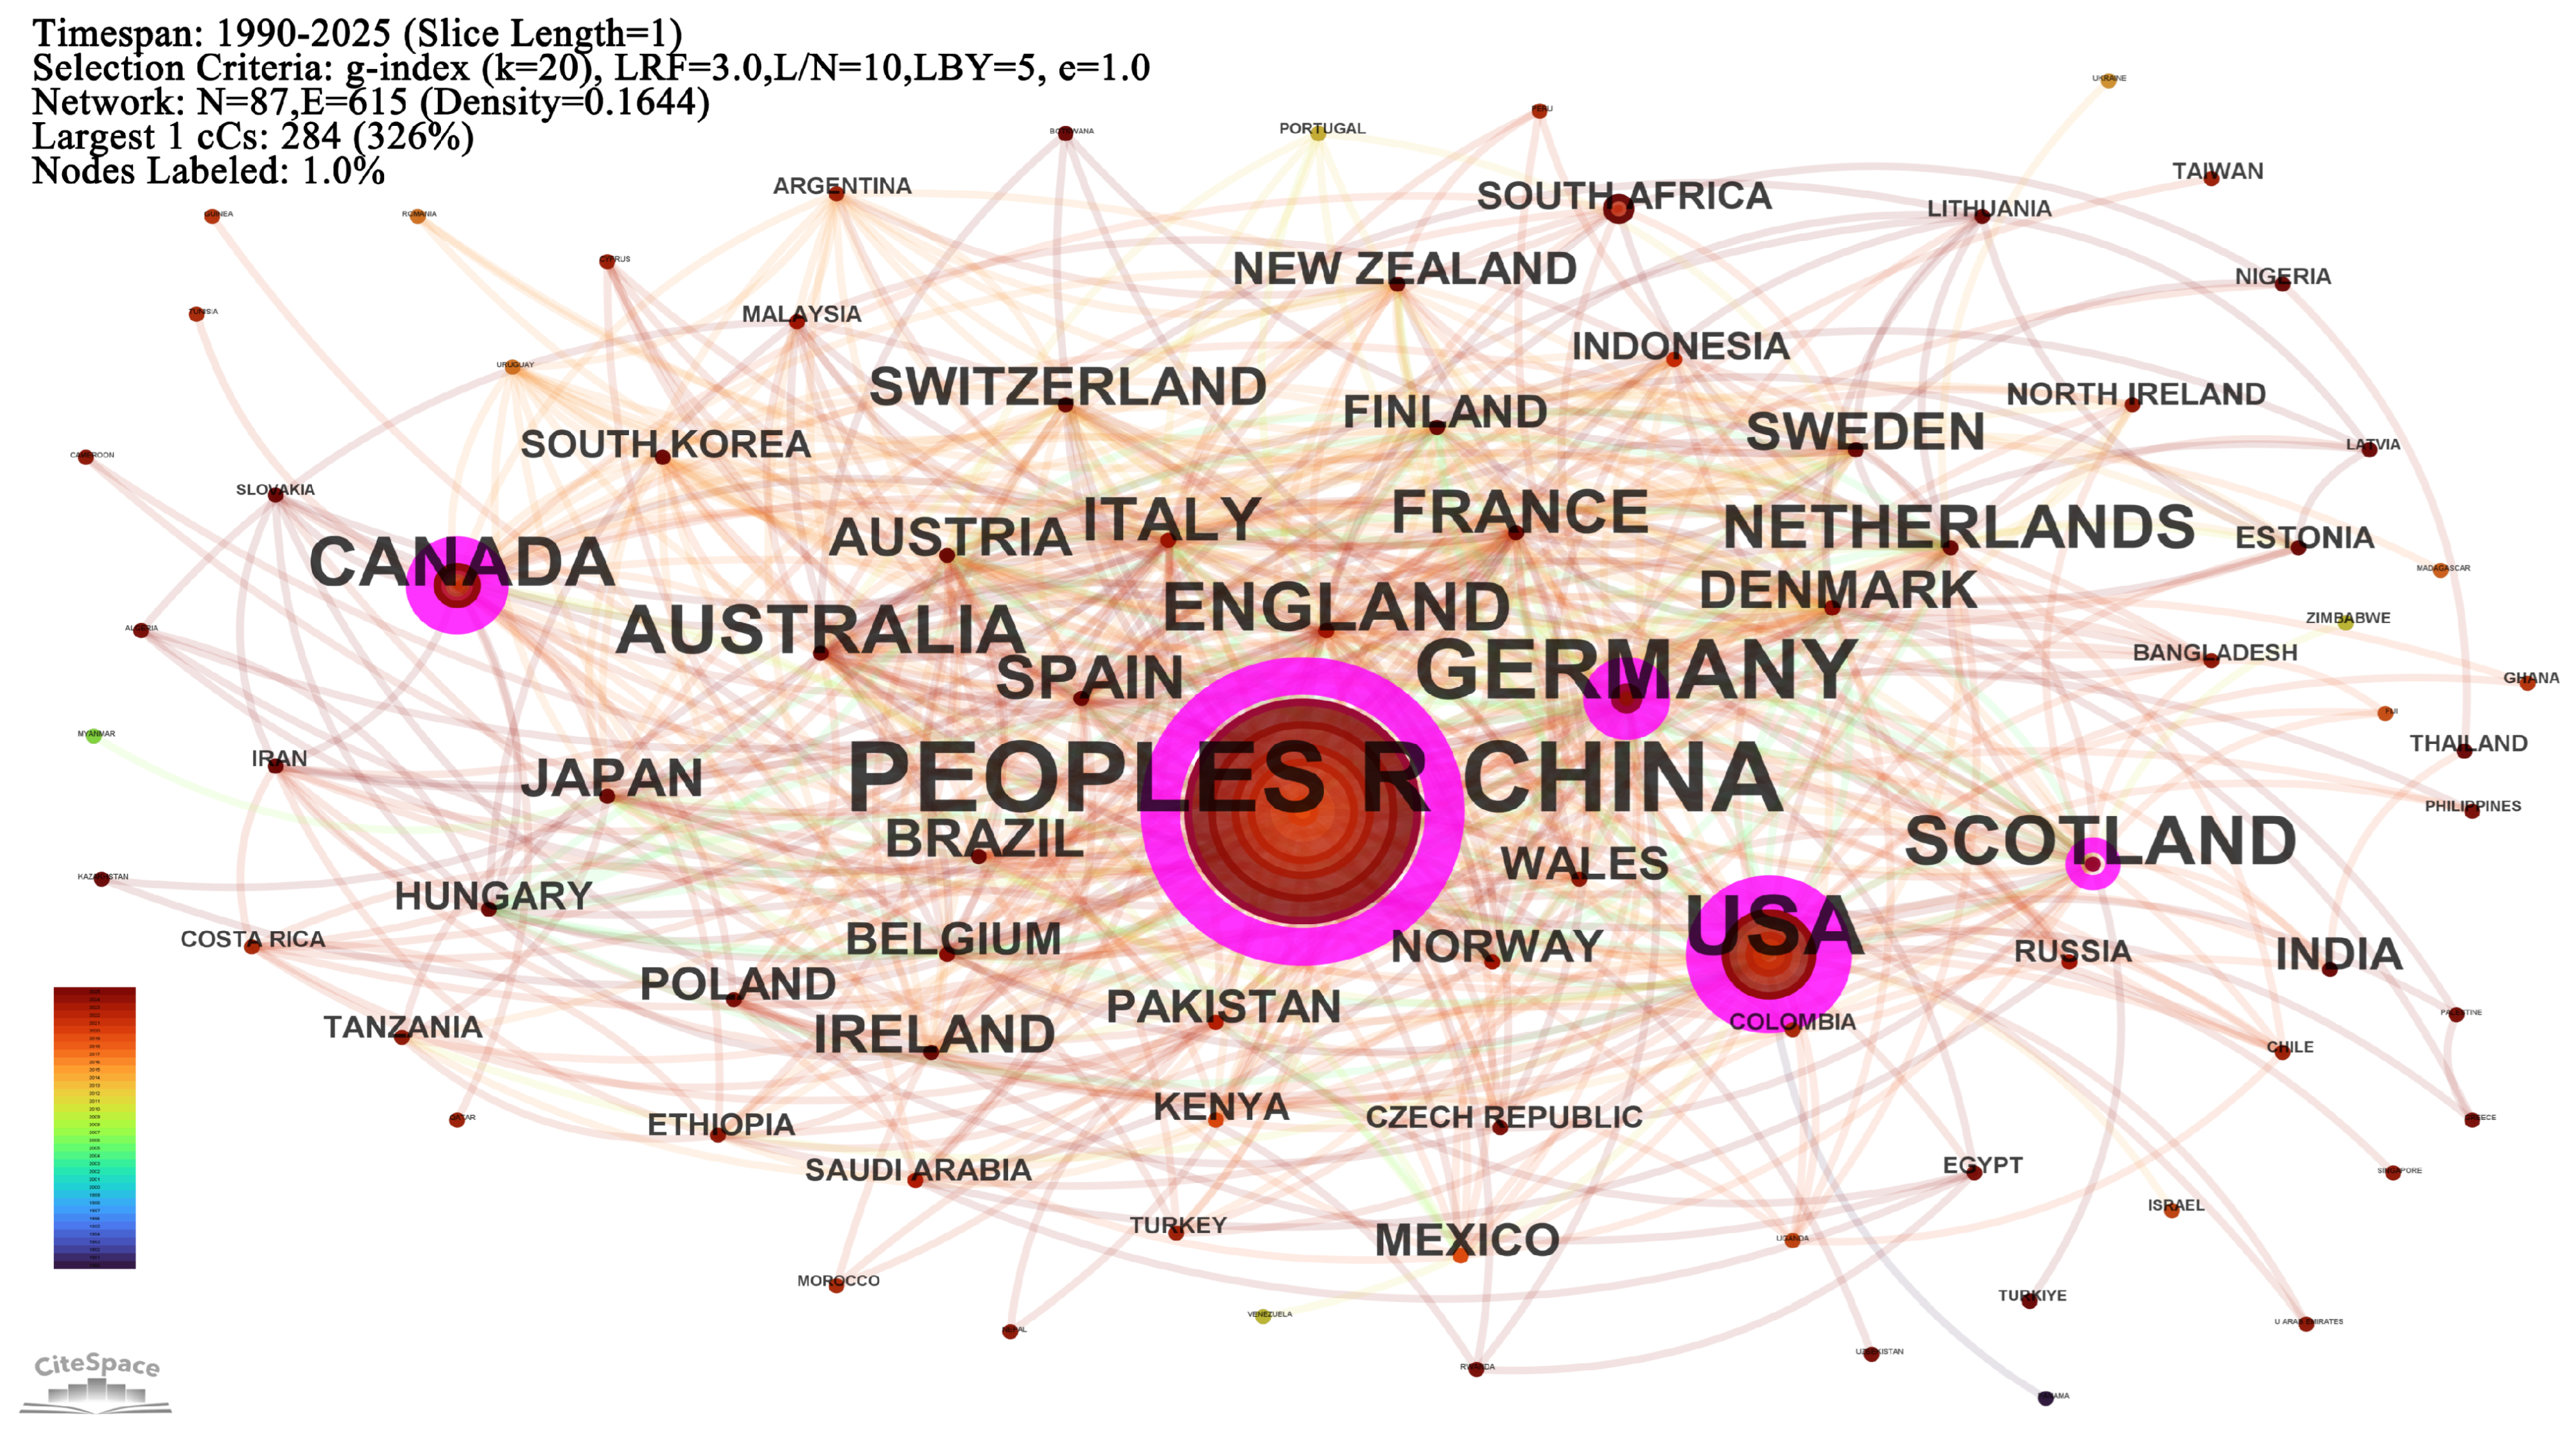
The national/regional cooperation network (Figure 1, Table S1) shows that China, the United States, and Germany are the three most productive countries in this field. China has published 444 papers (34.5% of the global total, centrality 0.42), followed by the United States (211 papers, 16.4%, centrality 0.37) and Germany (151 papers, 11.7%, centrality 0.19). The United Kingdom, Canada, and Australia also contribute substantially. The high centrality values of China and the United States (both above 0.35) indicate that they function as key bridging nodes in the global collaboration network. These patterns likely reflect the strong policy emphasis on agricultural emission reduction in China (e.g., the “dual carbon” goals) and the long-standing investment in fundamental agricultural and environmental research in the United States and Europe.
From the perspective of the characteristics of international cooperation, the connections formed by cooperation among core countries are extremely close, resulting in a highly dense cooperative network that spans regional boundaries. In this context, China and developed countries such as the United States, Germany, the United Kingdom, and the Netherlands have established cooperative relationships characterized by high frequency and strong interconnectivity, with the density of connections significantly higher than other nodes. This reflects the continuous enhancement of China’s international cooperation activity and discourse power in this field. European countries like Germany, the United Kingdom, France, the Netherlands, and Denmark have formed a tightly interconnected regional cooperative sub-network, frequently sharing internal resources and jointly tackling research challenges, becoming a crucial collaborative platform for global farmland carbon and nitrogen studies. Agricultural-developed countries such as Canada, Australia, and Japan have also established stable, long-term cooperative relationships with core countries like China, the United States, and Germany, actively participating in the construction of global research networks. Overall, international cooperation in this field has shifted from unilateral bilateral collaboration to multilateral regional cooperation, with the integration of global research capabilities continuously improving.
From the perspective of differences in regional research, various countries have clearly demonstrated differentiated emphases in their research approaches, which aligns with their respective agricultural development needs: Developed countries in Europe and America focus on studying the mechanisms of carbon and nitrogen cycles at a global scale, simulating greenhouse gas emission models, and constructing methodologies. For instance, the United States and Germany have conducted extensive cutting-edge research on microbial mechanisms of farmland carbon and nitrogen cycles, global emission inventory accounting, and the development of mechanistic models, emphasizing theoretical breakthroughs and methodological innovations. However, as a major agricultural country, China has a vast arable land area and diverse cultivation patterns. Its research prioritizes optimizing localized farmland carbon and nitrogen management models and applying emission reduction technologies. Focusing on the production characteristics of different agricultural regions such as the Northeast black soil area, the Huang-Huai-Hai Plain, and the southern rice-growing areas, China conducts empirical studies on optimizing fertilization practices, improving cultivation systems, applying novel emission-reduction materials, and assessing carbon sequestration potential. This reflects the research characteristics of China’s agricultural demand-driven approach and theory-practice integration, placing greater emphasis on the practical performance of technologies and their value in promotion.

3.2. Institutional Cooperation Network Analysis

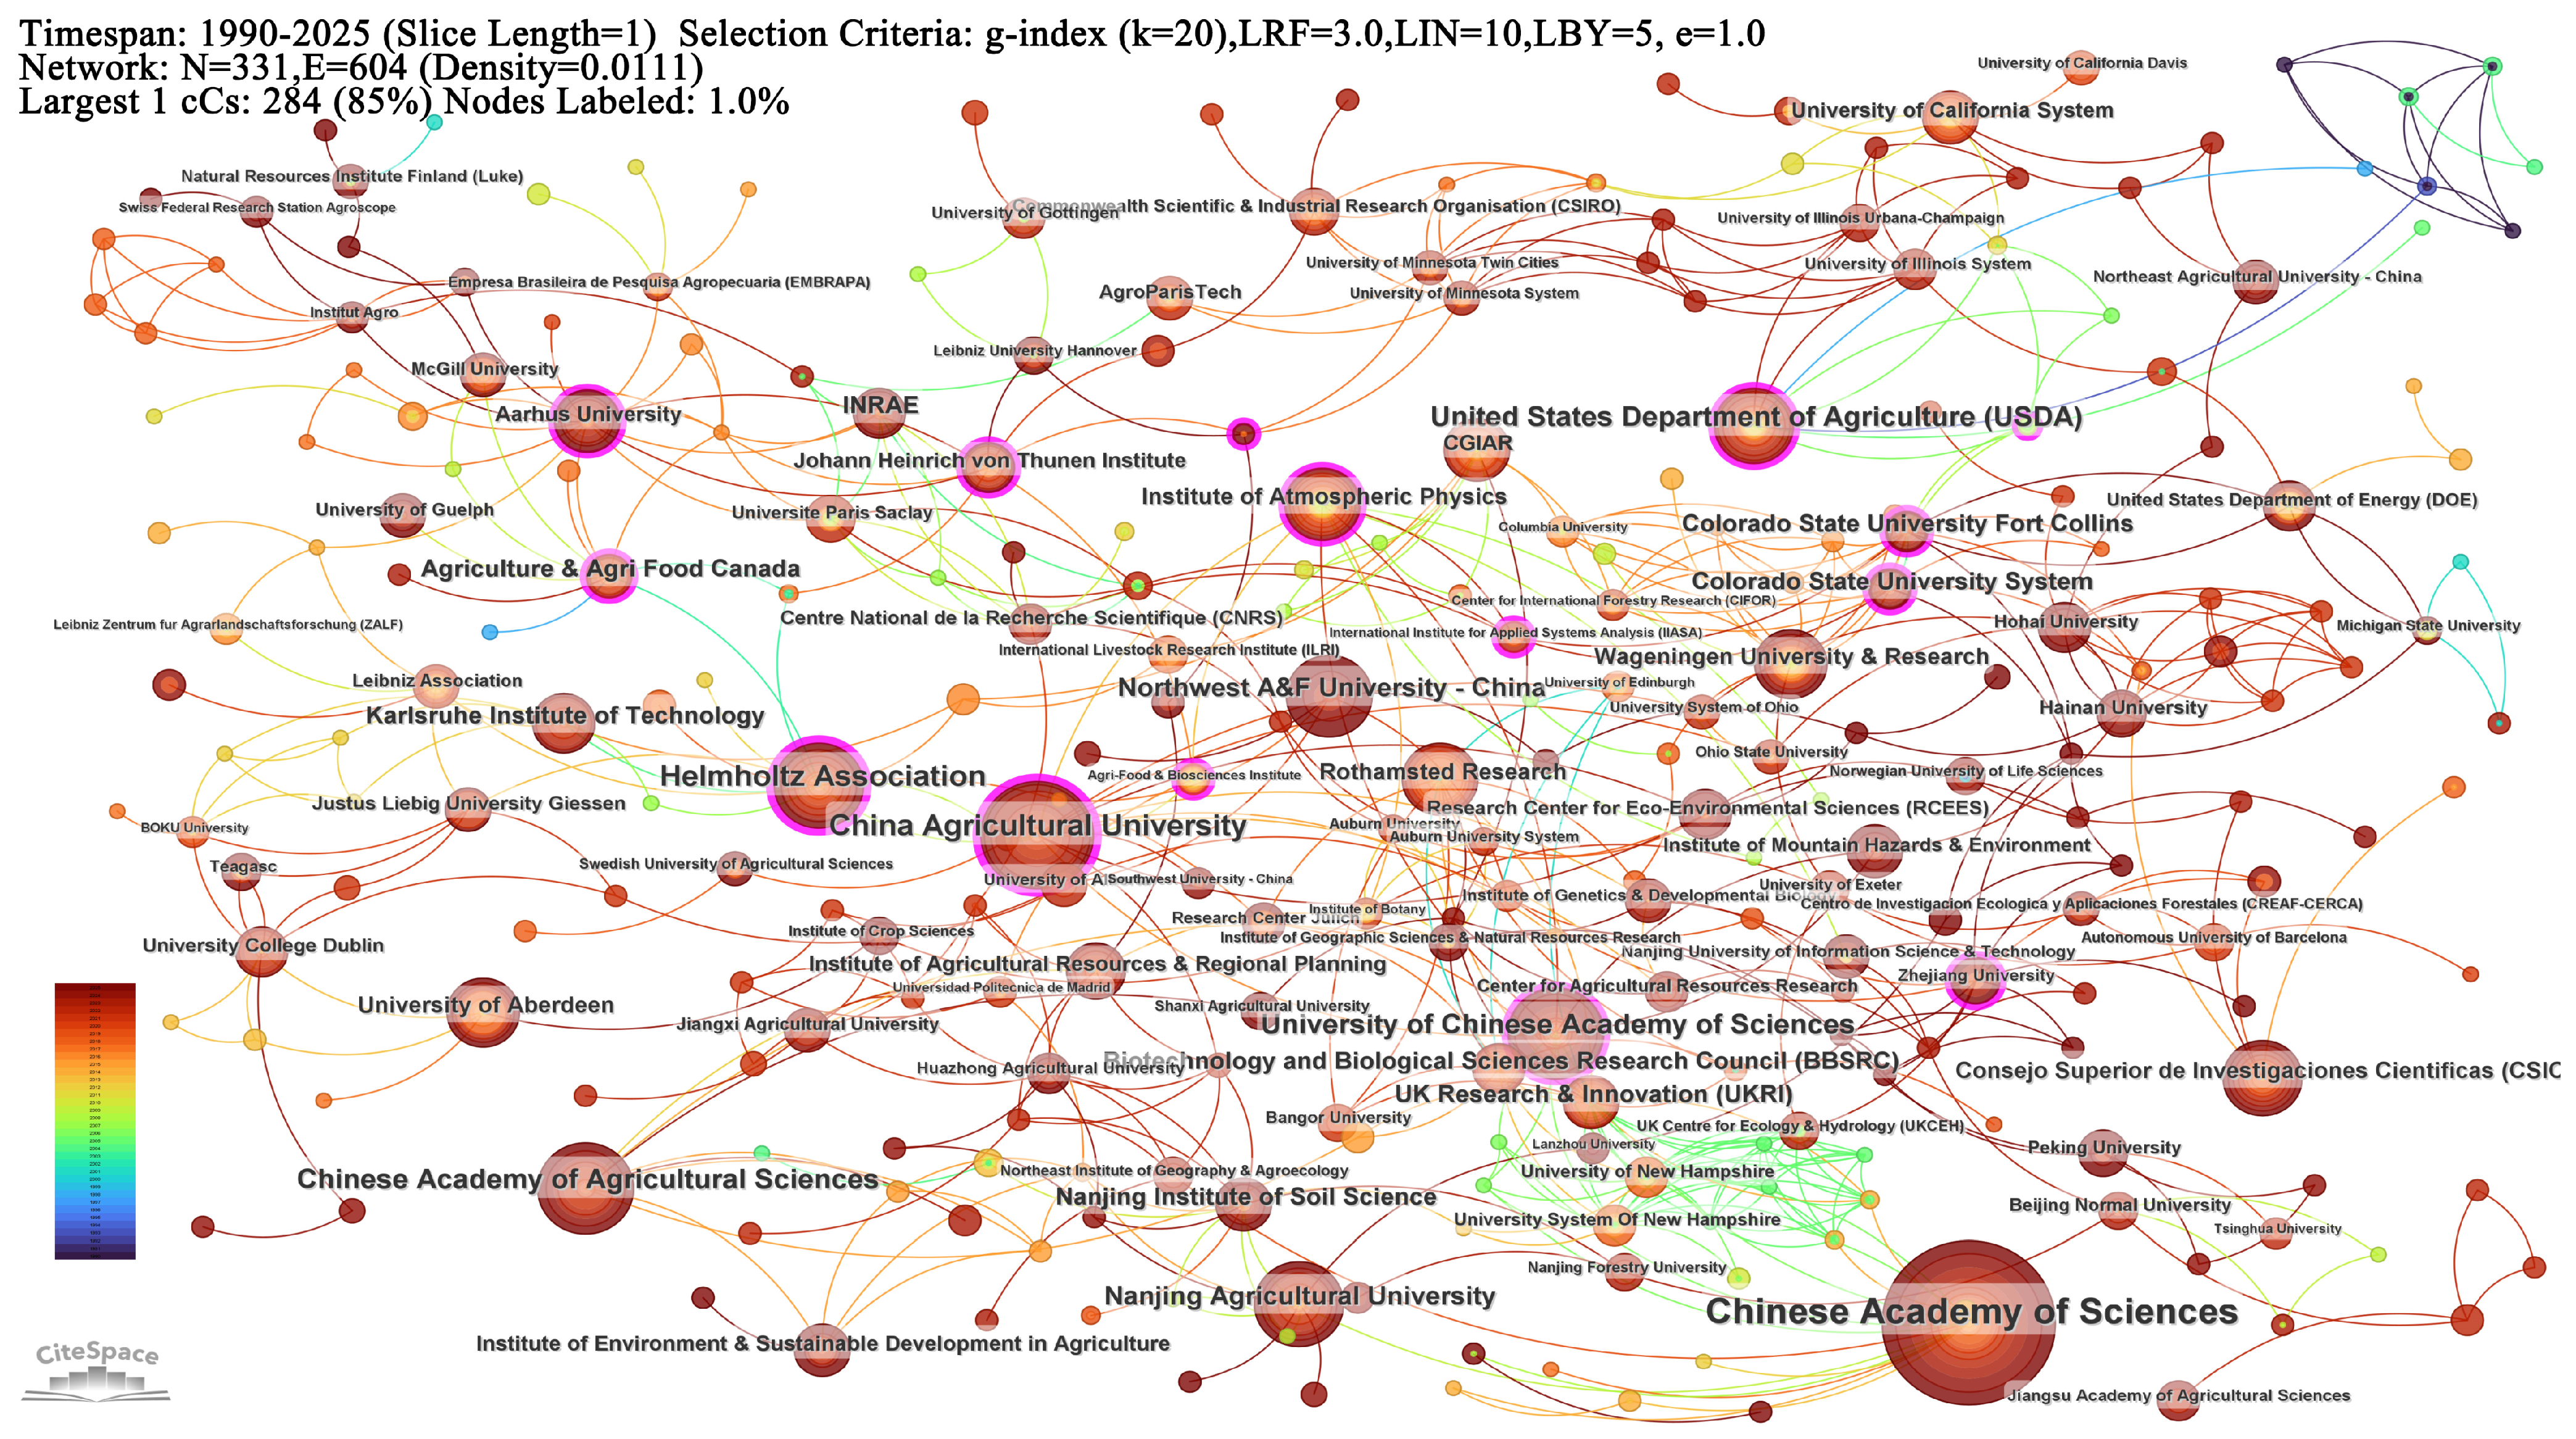
The collaborative network formed by research institutions and the characteristics of published articles are presented (Figure 2, Table S2). Globally, this field is dominated by top-tier agricultural research institutes and universities, forming a cluster of core institutions with high influence. Key participants include China Agricultural University, Chinese Academy of Sciences, U.S. Department of Agriculture (USDA), Wageningen University, Helmholtz Association, Nanjing Agricultural University, and Chinese Academy of Agricultural Sciences. Among them, the Chinese Academy of Sciences published the most articles (150 papers, centrality 0.09), China Agricultural University (70 papers, centrality 0.31), the Helmholtz Association (55 papers, centrality 0.29), and the University of Chinese Academy of Sciences (51 papers, centrality 0.11) exceeded the 0.1 centrality threshold, indicating that they serve as key bridging nodes connecting diverse collaborative clusters. The U.S. Department of Agriculture (46 papers, centrality 0.10) and Wageningen University (22 papers, centrality 0.08) also play pivotal roles in global research advancement.
Collaboration patterns reveal a dual structure of strong domestic networks and targeted international partnerships. Chinese institutions (e.g., CAS, CAU, CAAS, NAU) form dense internal clusters, while their international links with USDA, Wageningen University, and the Helmholtz Association focus on complementary strengths-mechanism research, technology development, and model construction. This division likely reflects differences in funding structures and research priorities: Chinese institutions emphasize applied field-scale management and emission reduction technologies suited to diverse regional cropping systems, whereas European and American institutions tend to focus on fundamental carbon-nitrogen cycling mechanisms, emission factor estimation, and model development. Such complementarity suggests that deeper cross-institutional collaboration could accelerate the translation of mechanistic insights into practical management strategies.

3.3. Author Collaboration Network Analysis

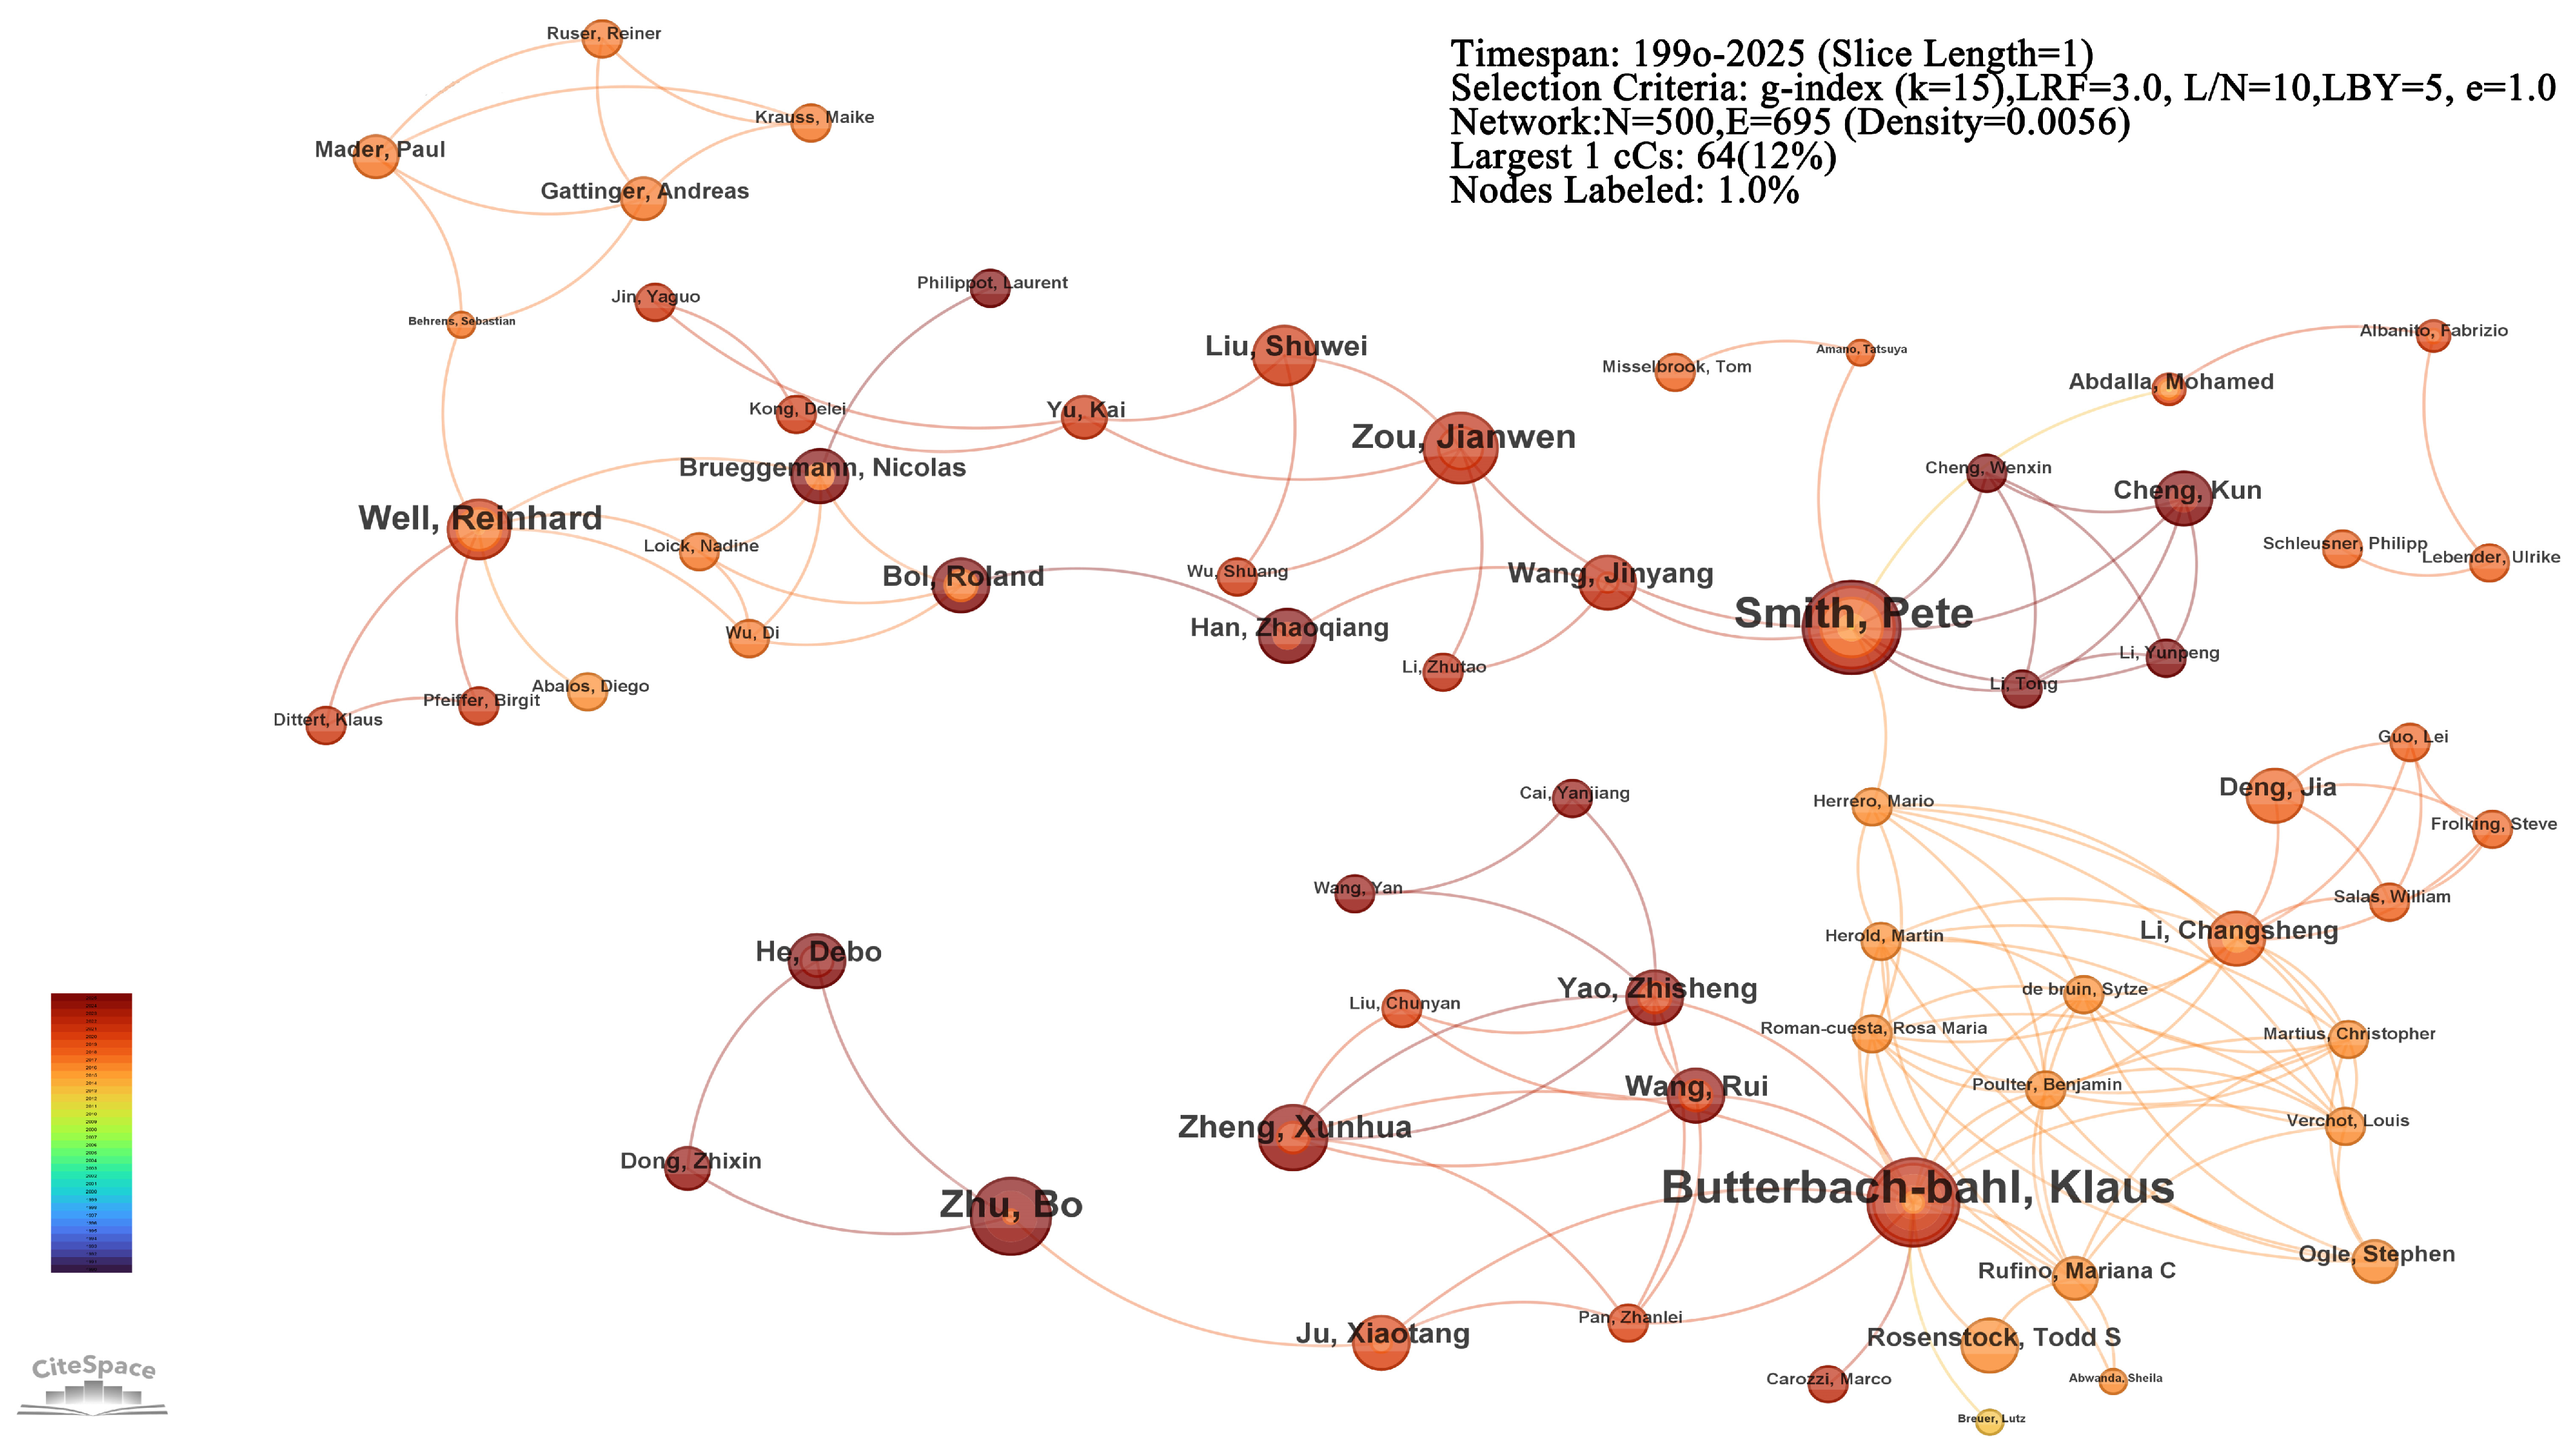
Analysis of the author collaboration network (Figure 3, Table S3) reveals a multi-tiered research landscape. Internationally, Butterbach-Bahl and Klaus (16 publications) and Pete Smith (14 publications) are the most prolific authors. Domestically, Bo Zhu (9 publications), Jianwen Zou (8), Xunhua Zheng (6), and Xiaotang Ju (5) have established stable core research teams. Notably, betweenness centrality values for all authors are below 0.1 (the highest being 0.02 for Pete Smith), indicating that the author collaboration network is composed of multiple tightly-knit disciplinary sub-groups with limited cross-group bridging, a pattern commonly observed in specialized research fields where researchers collaborate primarily within established teams rather than spanning distant thematic communities.
The collaboration structure features multiple tightly-knit sub-networks centered around core authors, with growing cross-regional partnerships. For example, Chinese research teams have partnered with Klaus Butterbach-Bahl and Pete Smith on greenhouse gas monitoring and emission inventory development. While publication counts and centrality metrics provide useful indicators of collaborative activity, a more comprehensive assessment of author influence would require additional analysis of citation impact and thematic contributions, which falls beyond the scope of the present bibliometric study.

4. Research Hotspots and Theme Clustering Analysis

4.1. Co-Occurrence Network Analysis of Keywords

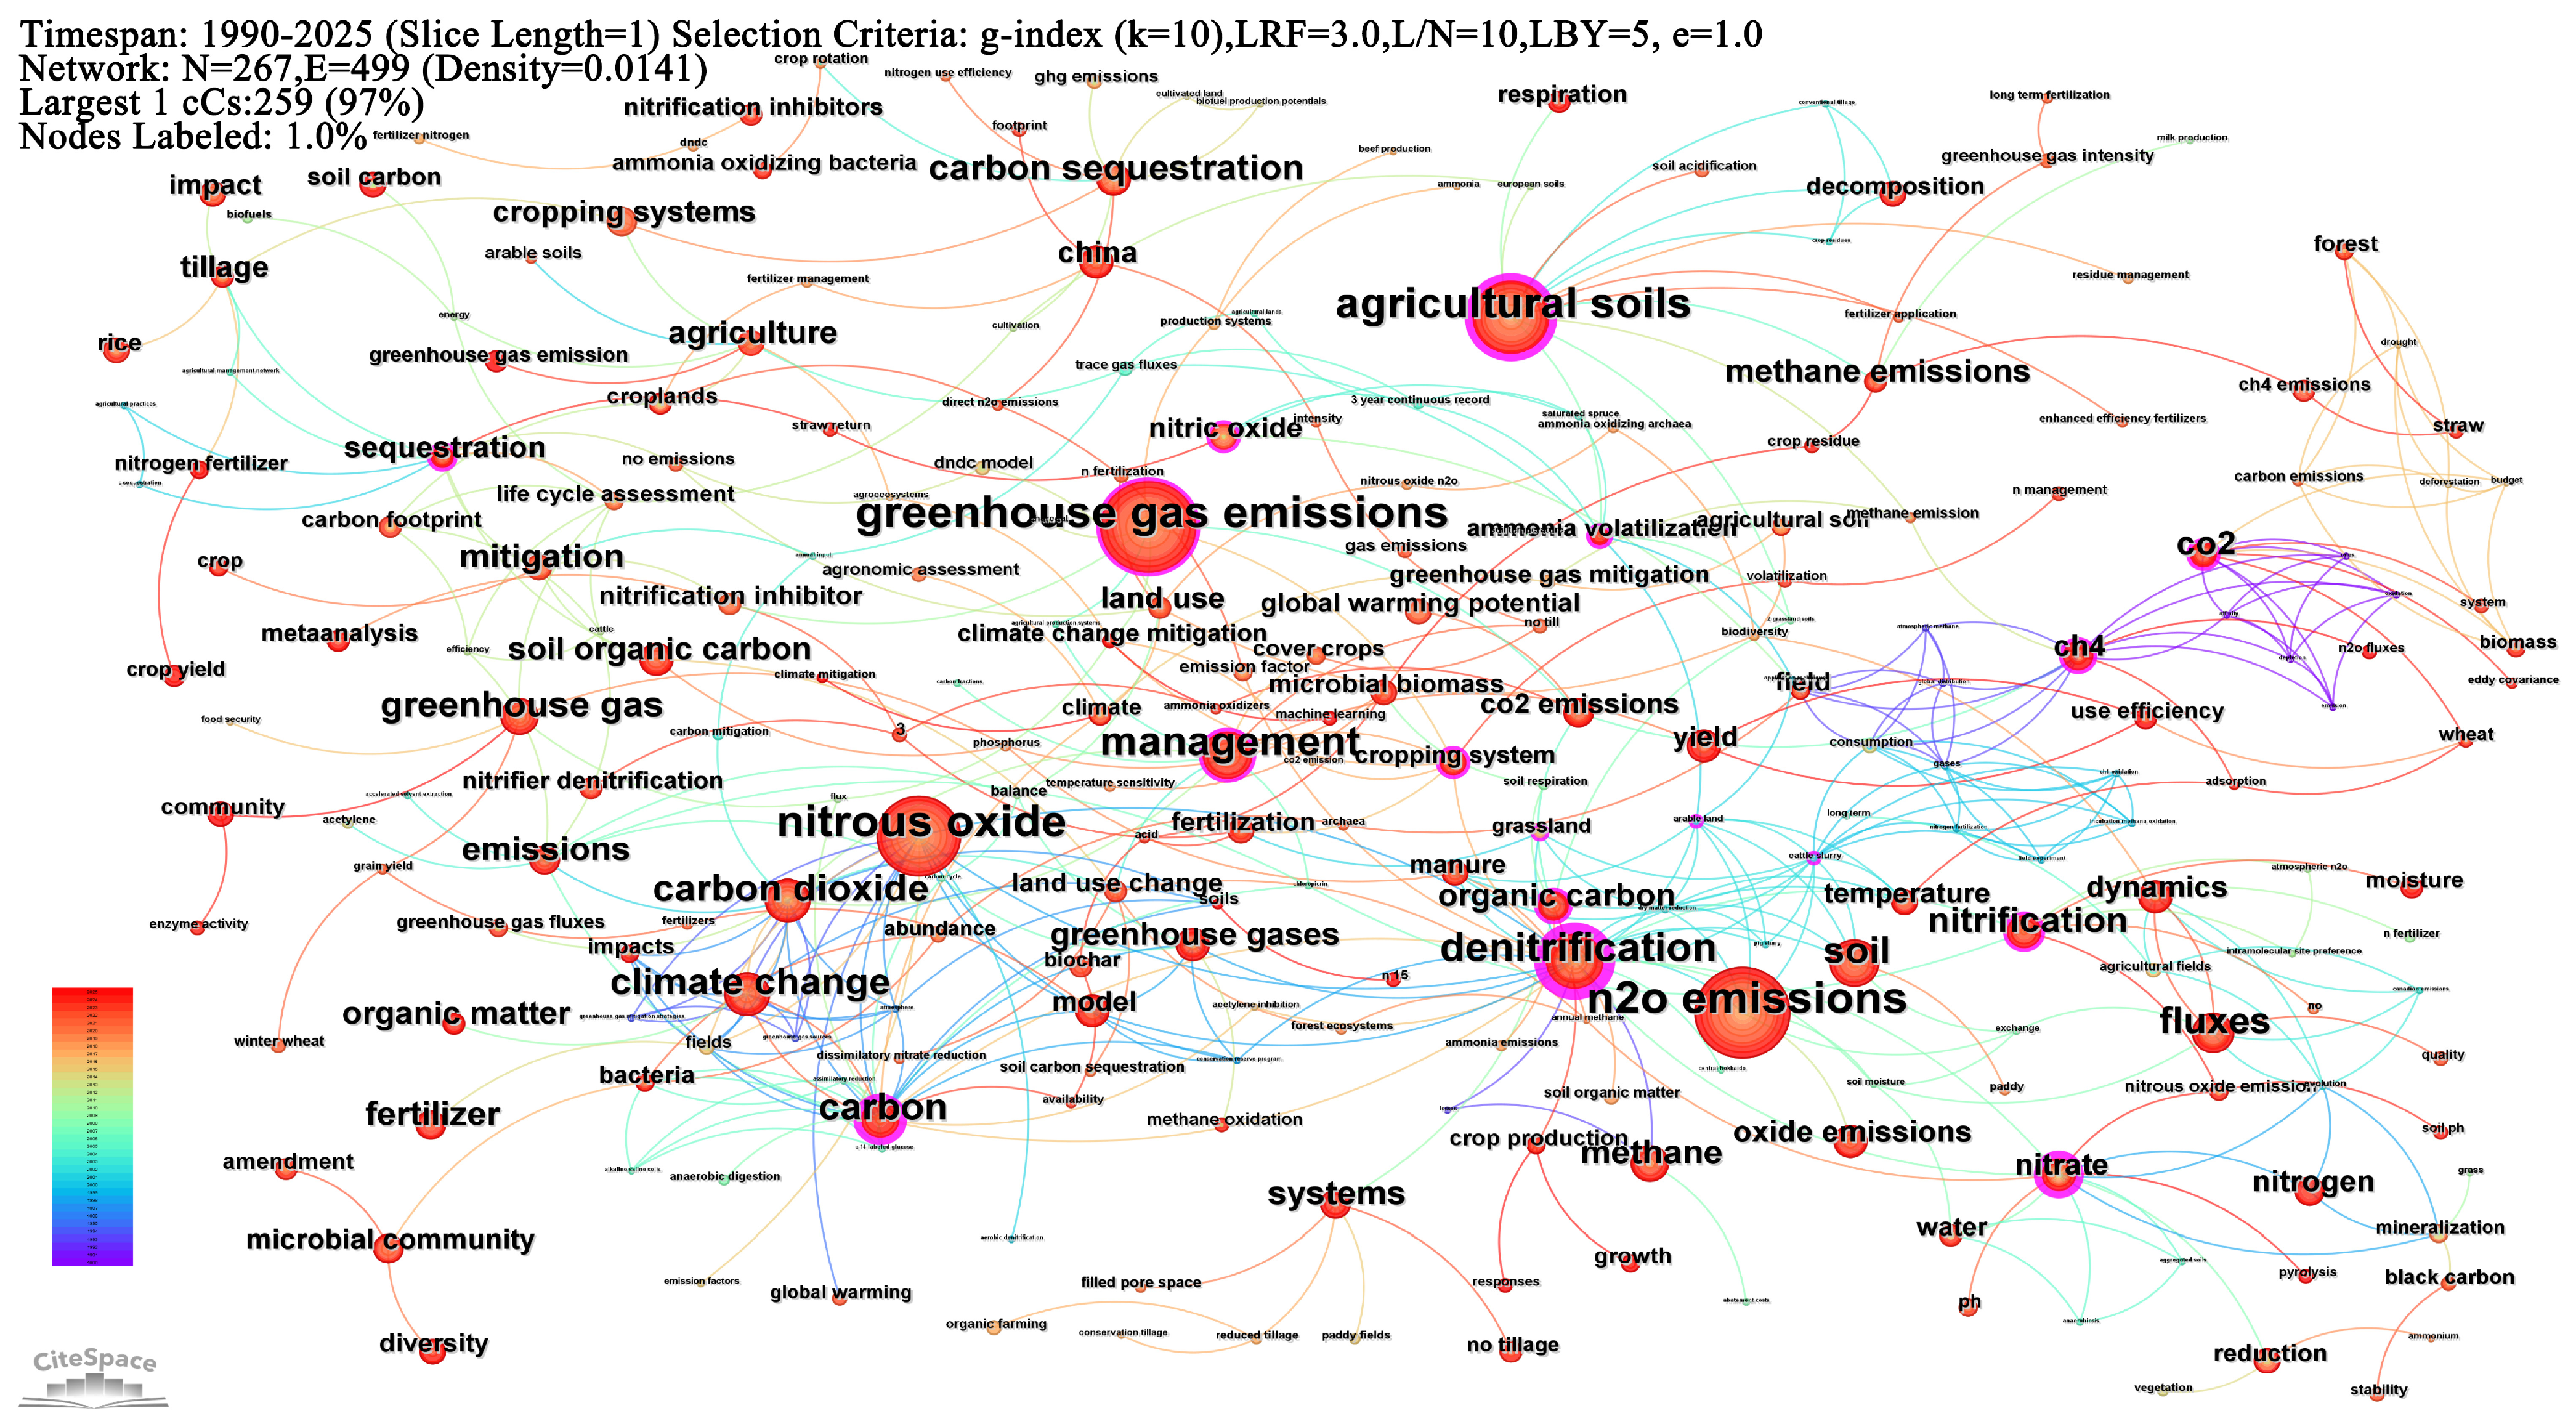
Co-occurrence analysis of keywords from the 1286 articles (Figure 4, Table S4) reveals the thematic structure of this field through two complementary metrics: occurrence frequency (reflecting research volume) and betweenness centrality (reflecting bridging capacity across research themes; values exceeding 0.1 indicate key interdisciplinary nodes).
Nitrous oxide ranks first in frequency (670) but has low centrality (0.07), indicating that it is the dominant single topic yet operates within a relatively self-contained research cluster rather than bridging diverse themes. In contrast, denitrification (frequency 159, centrality 0.58, the highest in the network) serves as the principal interdisciplinary hub, connecting N2O emission mechanisms with soil microbiology, nitrogen cycling, and management interventions. This asymmetry suggests that while N2O research is volumetrically dominant, driven by its exceptionally high warming potential (298 times that of CO2 over 100 years), denitrification functions as the mechanistic linchpin that bridges emission-oriented and process-oriented research communities.
Several keywords exhibit both high frequency and high centrality, marking them as structurally central themes: agricultural soils (frequency 231, centrality 0.22), carbon (103, 0.33), greenhouse gas emissions (246, 0.14), and nitrification (82, 0.12). These nodes occupy bridging positions linking emission characterization, soil process research, and management strategy development. In particular, the high centrality of “carbon” (0.33) reflects its dual role in both greenhouse gas emission (CO2, CH4) and carbon sequestration research, functioning as the conceptual pivot connecting pollution and mitigation perspectives.
Conversely, keywords with moderate frequency but low centrality, such as climate change (103, 0.02) and N2O emissions (275, 0.03), are frequently studied yet largely confined to their own thematic domains. The co-occurrence network further reveals three coherent thematic axes: (1) soil carbon-nitrogen cycling processes (denitrification, nitrification, nitrate [centrality 0.21], organic carbon [centrality 0.19]); (2) greenhouse gas emission and accounting (N2O, CO2, CH4 [centrality 0.17], emission factors); and (3) management and mitigation strategies (sequestration [centrality 0.16], ammonia volatilization [centrality 0.15], tillage, fertilization). The high centrality of process-oriented keywords in axis (1) indicates that mechanistic understanding of soil biogeochemical processes remains the primary bridge linking emission diagnosis to mitigation practice.

4.2. Keyword Cluster Analysis

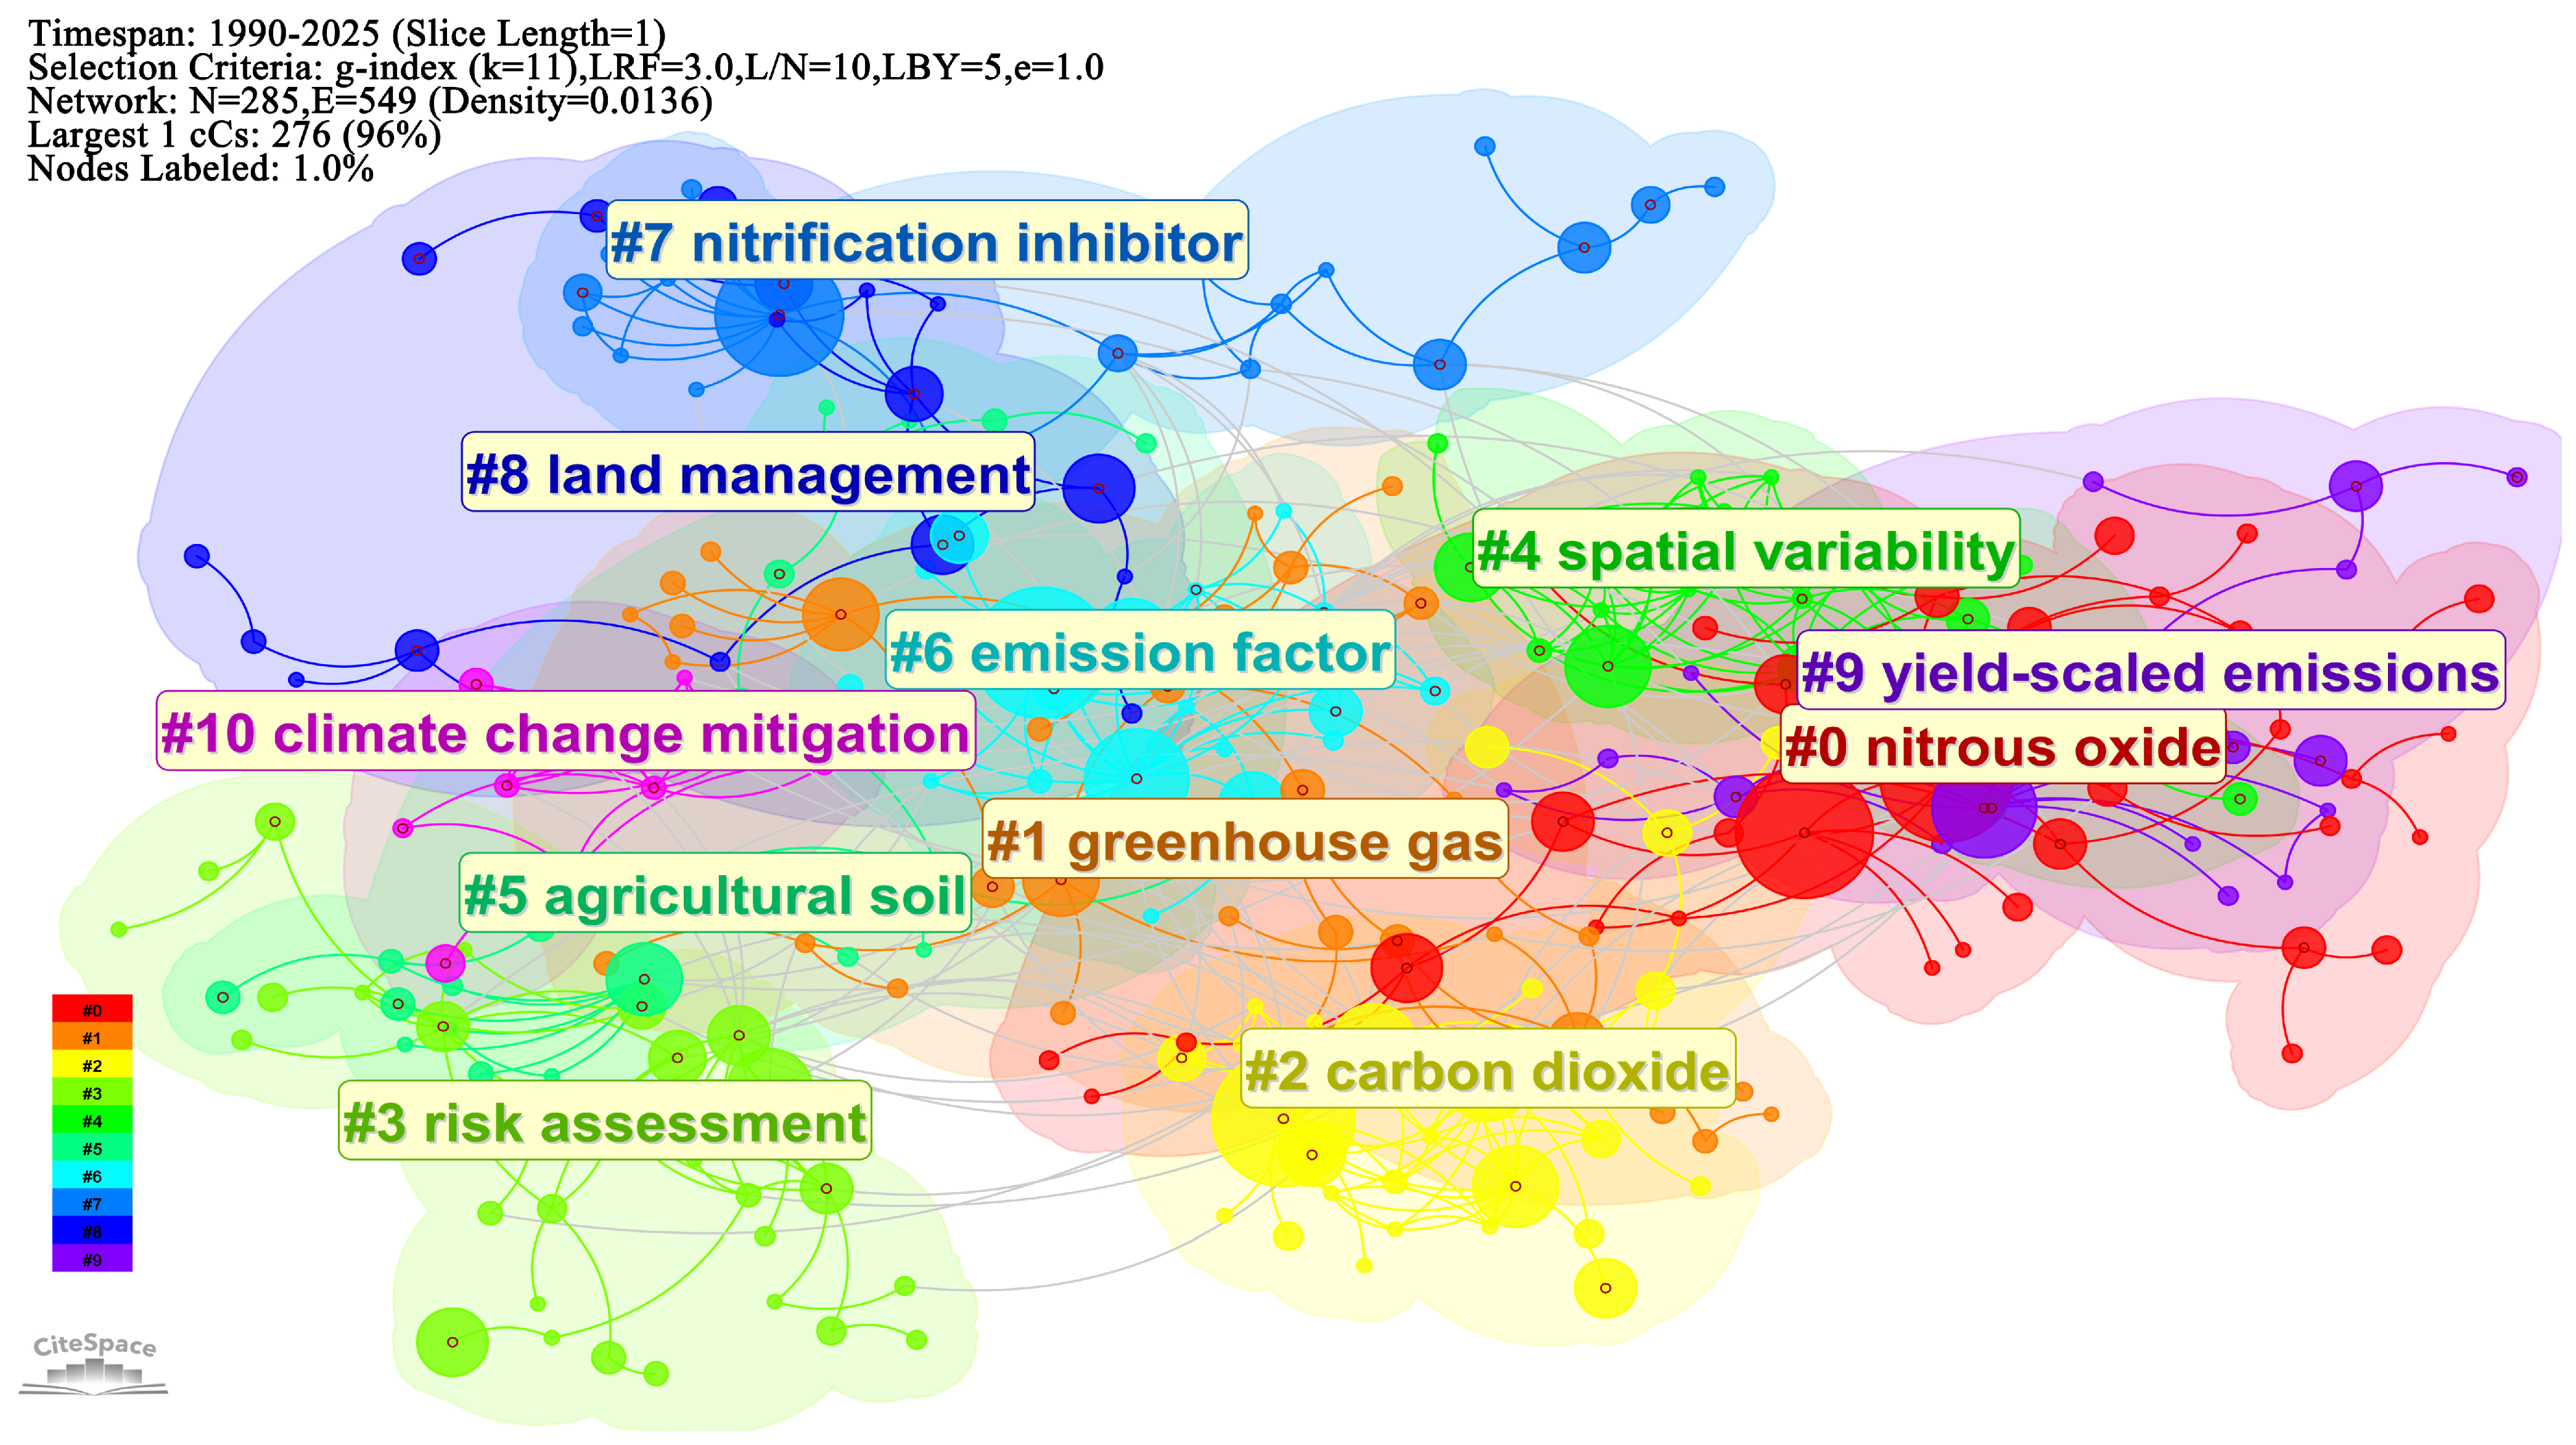
The LLR (Log-Likelihood Ratio) clustering analysis was performed on the co-occurrence networks of keywords, with cluster module value Q set at 0.82 (where Q > 0.3 indicates significant clustering structure) and average silhouette value S set at 0.91 (where S > 0.7 signifies reliable clustering results). The results are presented in Figure 5 and Figure 6, demonstrating that research topics in the field of “farmland carbon and nitrogen pollution reduction and carbon mitigation” can be clustered into 11 core clusters. Each cluster exhibits clear boundaries and well-defined connotations, forming a comprehensive collaborative research network centered around the framework of “farmland carbon and nitrogen cycling—greenhouse gas emissions—pollution reduction and carbon mitigation regulation—application of management technologies”. The cluster numbering, names, and core research content are detailed in Table 1.
Analysis of cluster association features reveals that #0 (nitrous oxide) serves as a core hub connecting multiple clusters, exhibiting strong correlations with #1 (greenhouse gases), #5 (agricultural soils), #7 (nitrification inhibitors), and #8 (land management). This is attributed to N2O’s pivotal role in coupling carbon-nitrogen cycles in farmland ecosystems and its status as the most significant greenhouse gas contributing to agricultural warming effects. Emission control strategies for N2O involve multiple research dimensions including soil nitrogen cycling mechanisms, agricultural management practices, emission reduction technologies, and comprehensive greenhouse gas governance, establishing it as a convergence point for interdisciplinary studies. The clusters demonstrate interconnected synergistic relationships, forming an integrated research framework: #8 (land management) provides actionable control pathways for #0 (nitrous oxide) and #2 (carbon dioxide); #6 (emission factors) offers foundational data support for #1 (greenhouse gases) and #10 (climate change mitigation); #9 (yield-scale emissions) establishes scientific methodologies for evaluating and promoting emission reduction technologies; while #3 (risk assessment) provides risk mitigation criteria for carbon-nitrogen co-management, comprehensively covering the entire chain of theoretical frameworks, technological applications, and evaluation systems for integrated farmland carbon-nitrogen pollution reduction and decarbonization efforts.

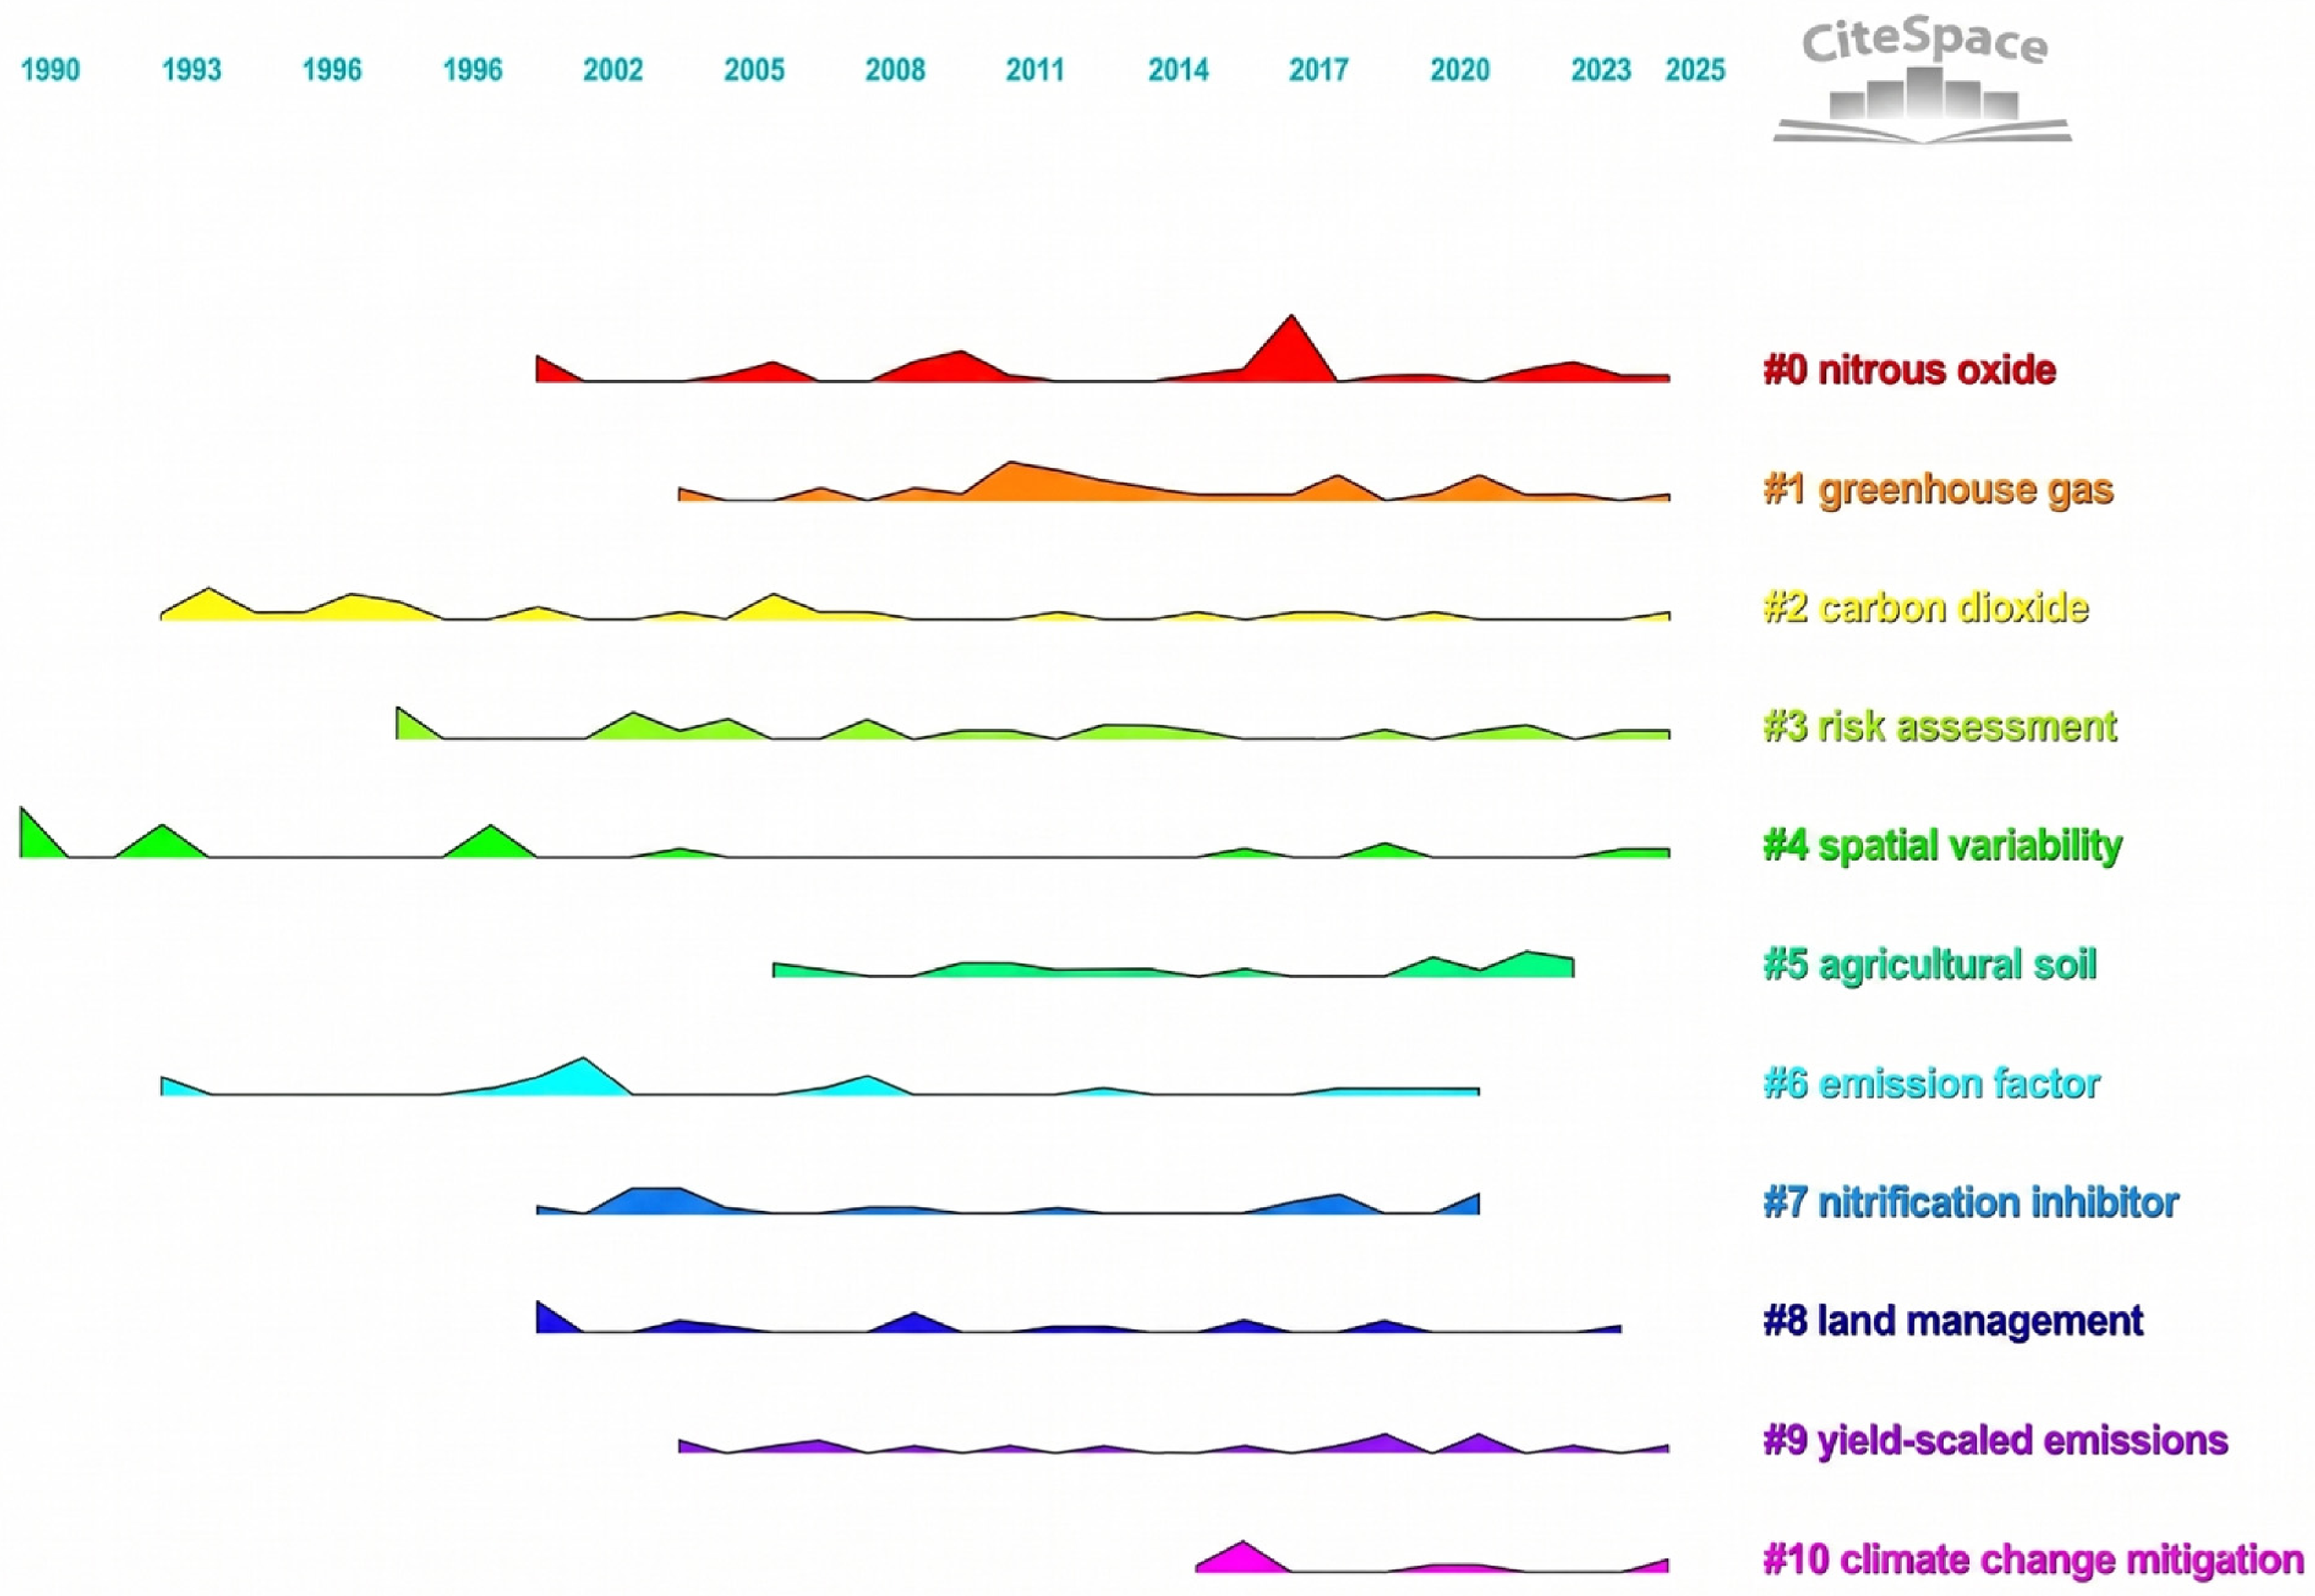
4.3. Time Evolution Analysis

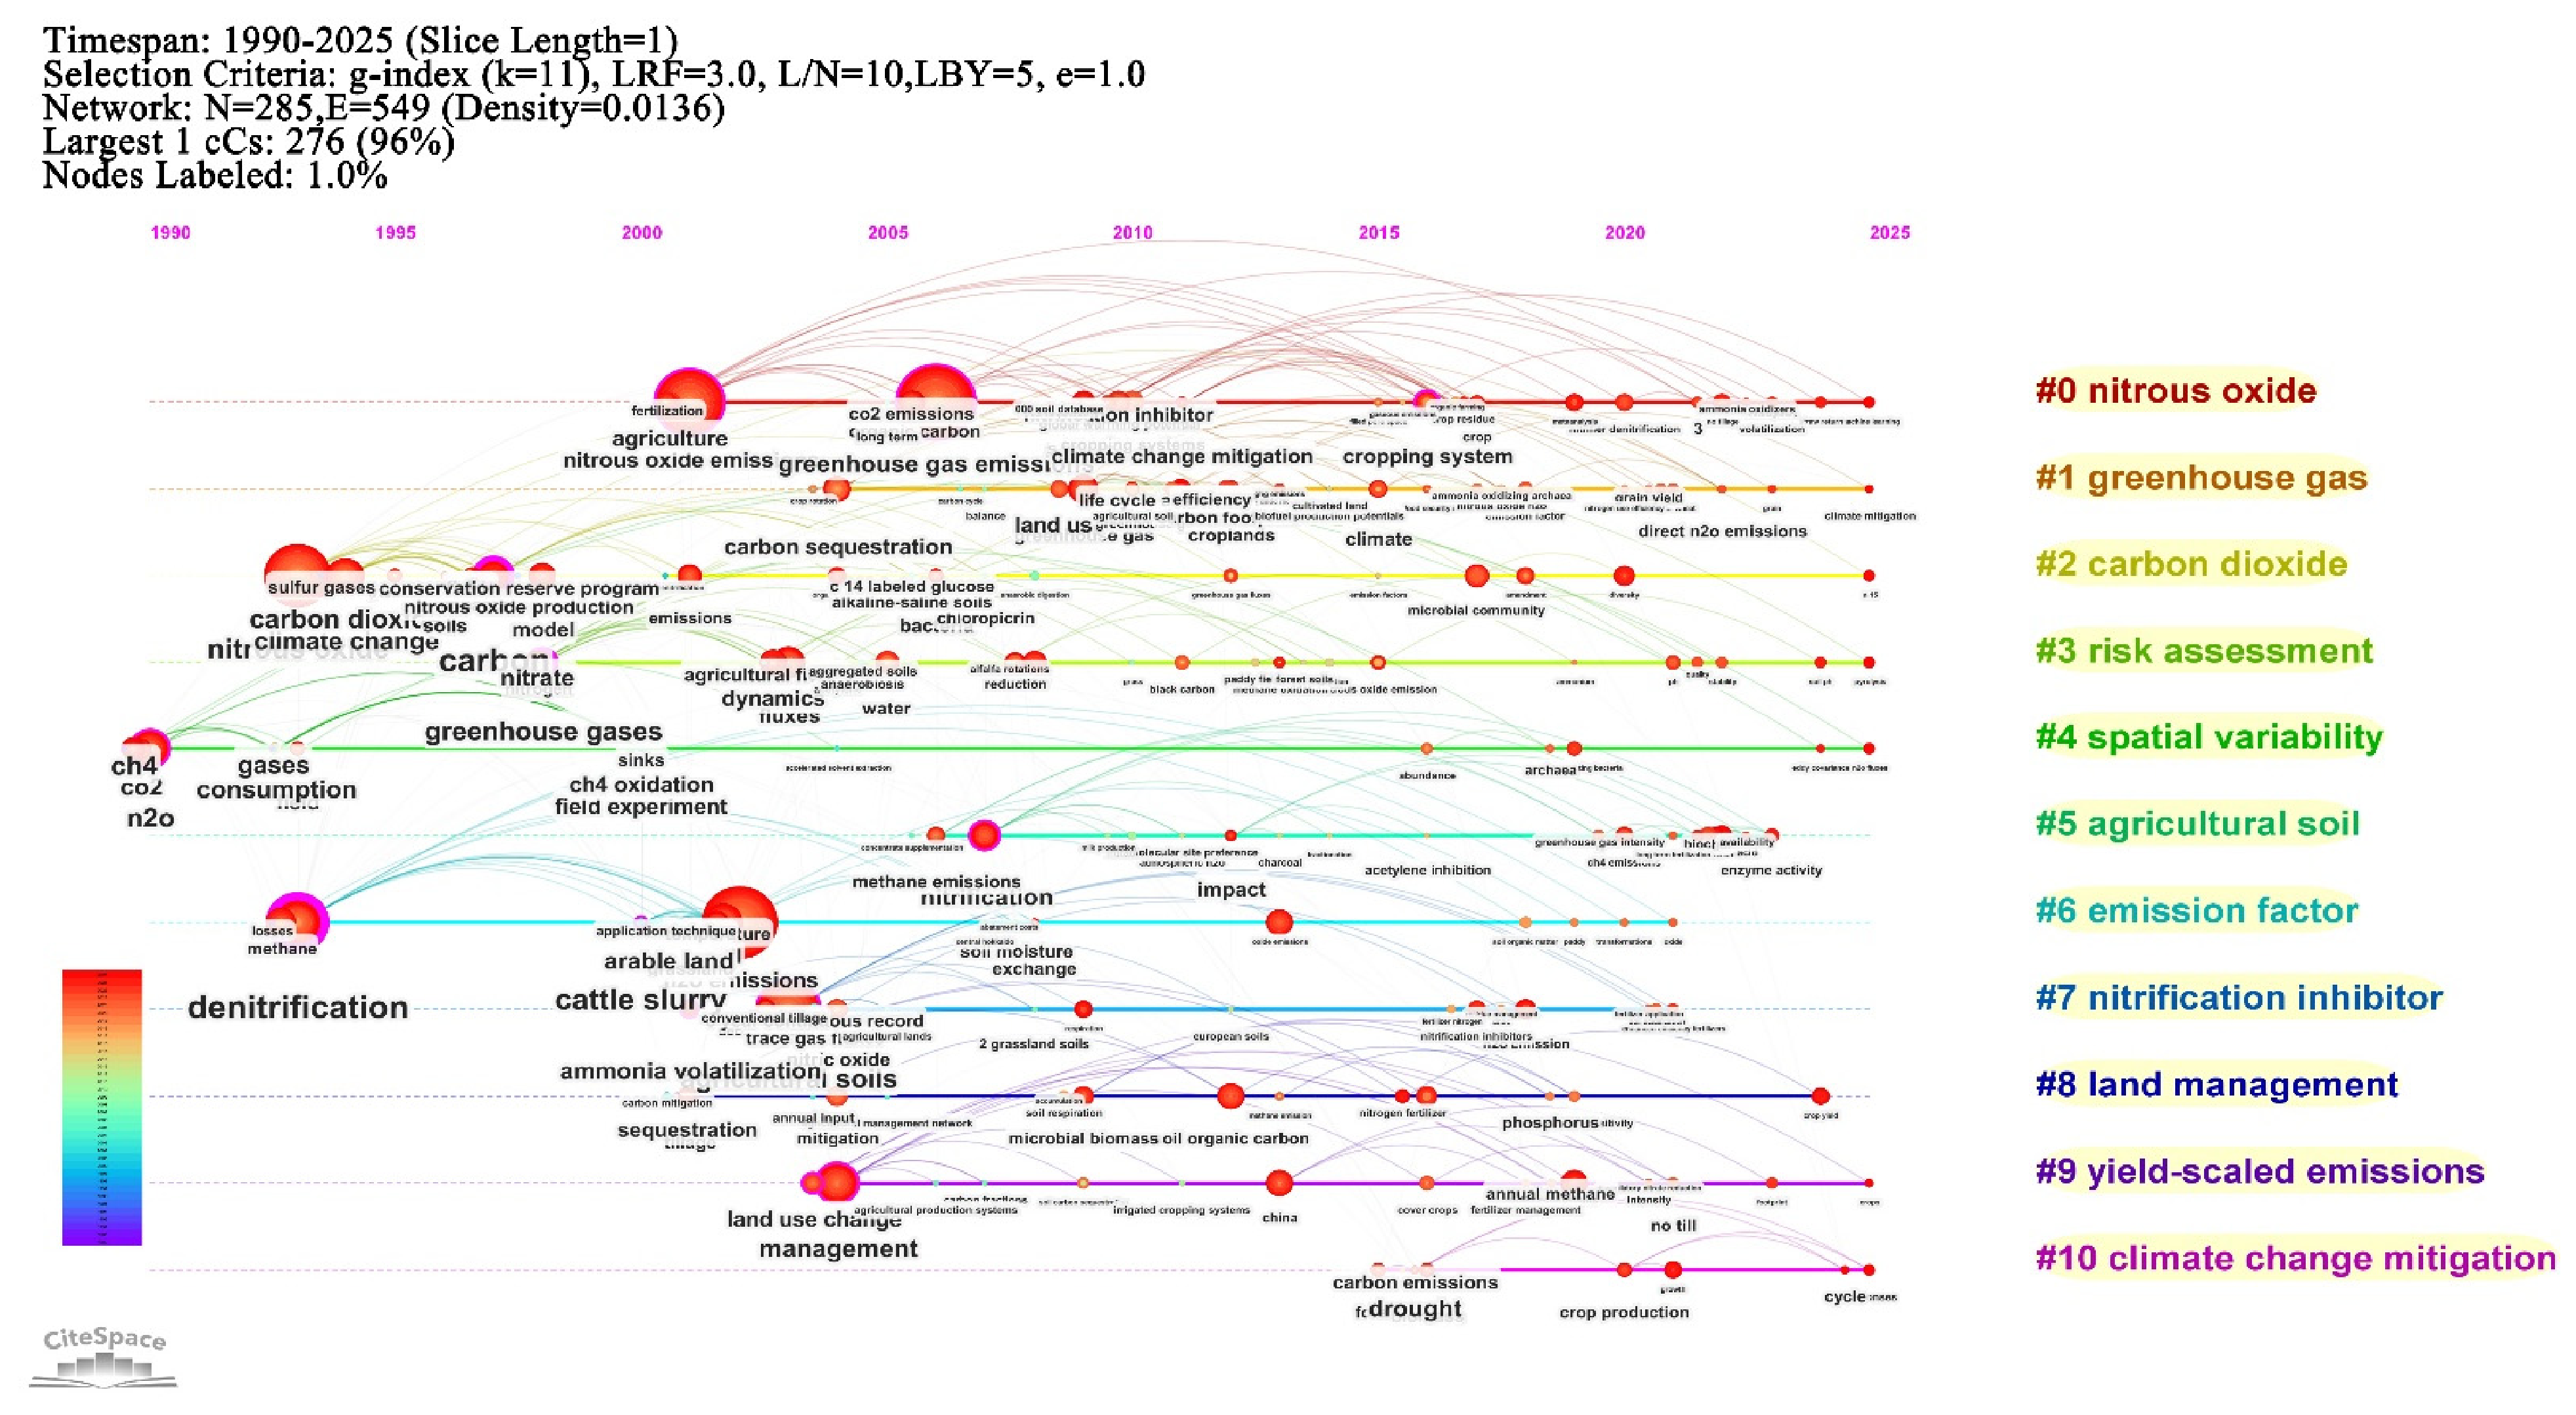
Integrating the keyword timeline map (Figure 6) with the clustering timeline map (Figure 7), we identified three major phases of thematic evolution from 1990 to 2025. The stage boundaries (2005, 2015) are supported by distinct shifts in keyword burst patterns and publication volume trends observed in the data.
During the initial phase (1990–2005), research focused on fundamental emission mechanisms. Driven by growing awareness of agricultural greenhouse gas contributions following the adoption of the UNFCCC (1992) and the Kyoto Protocol (1997), core themes included nitrous oxide, carbon dioxide, denitrification, and nitrification. Field observations and laboratory simulations revealed intrinsic connections between nitrification/denitrification and N2O emissions, though studies remained largely fragmented, addressing individual gases without integrated pollution-mitigation frameworks.
The mid-term phase (2006–2015) shifted toward agricultural management practices, catalyzed by the post-Kyoto emphasis on national emission inventories and the EU Nitrates Directive. Research expanded to methane control, carbon sequestration, tillage optimization, and fertilization systems. Field experiments comparing different management practices revealed their effects on carbon-nitrogen dynamics and greenhouse gas emissions, and the scope expanded from plot-level to regional scales with the aid of model-based simulations.
The recent phase (2016–2025) represents integrated pollution reduction and carbon mitigation, propelled by the Paris Agreement (2015), China’s “dual carbon” goals, and the EU Green Deal. Research has shifted toward microbial-level carbon-nitrogen coupling mechanisms, multi-objective management frameworks, and yield-scaled emission assessments. Emerging technologies including molecular biology, remote sensing, and big data analytics have been increasingly integrated, enabling cross-scale analyses from microbial functional genes to regional emission inventories.

5. Research Frontiers and Trend Analysis

5.1. Keyword Highlight Analysis

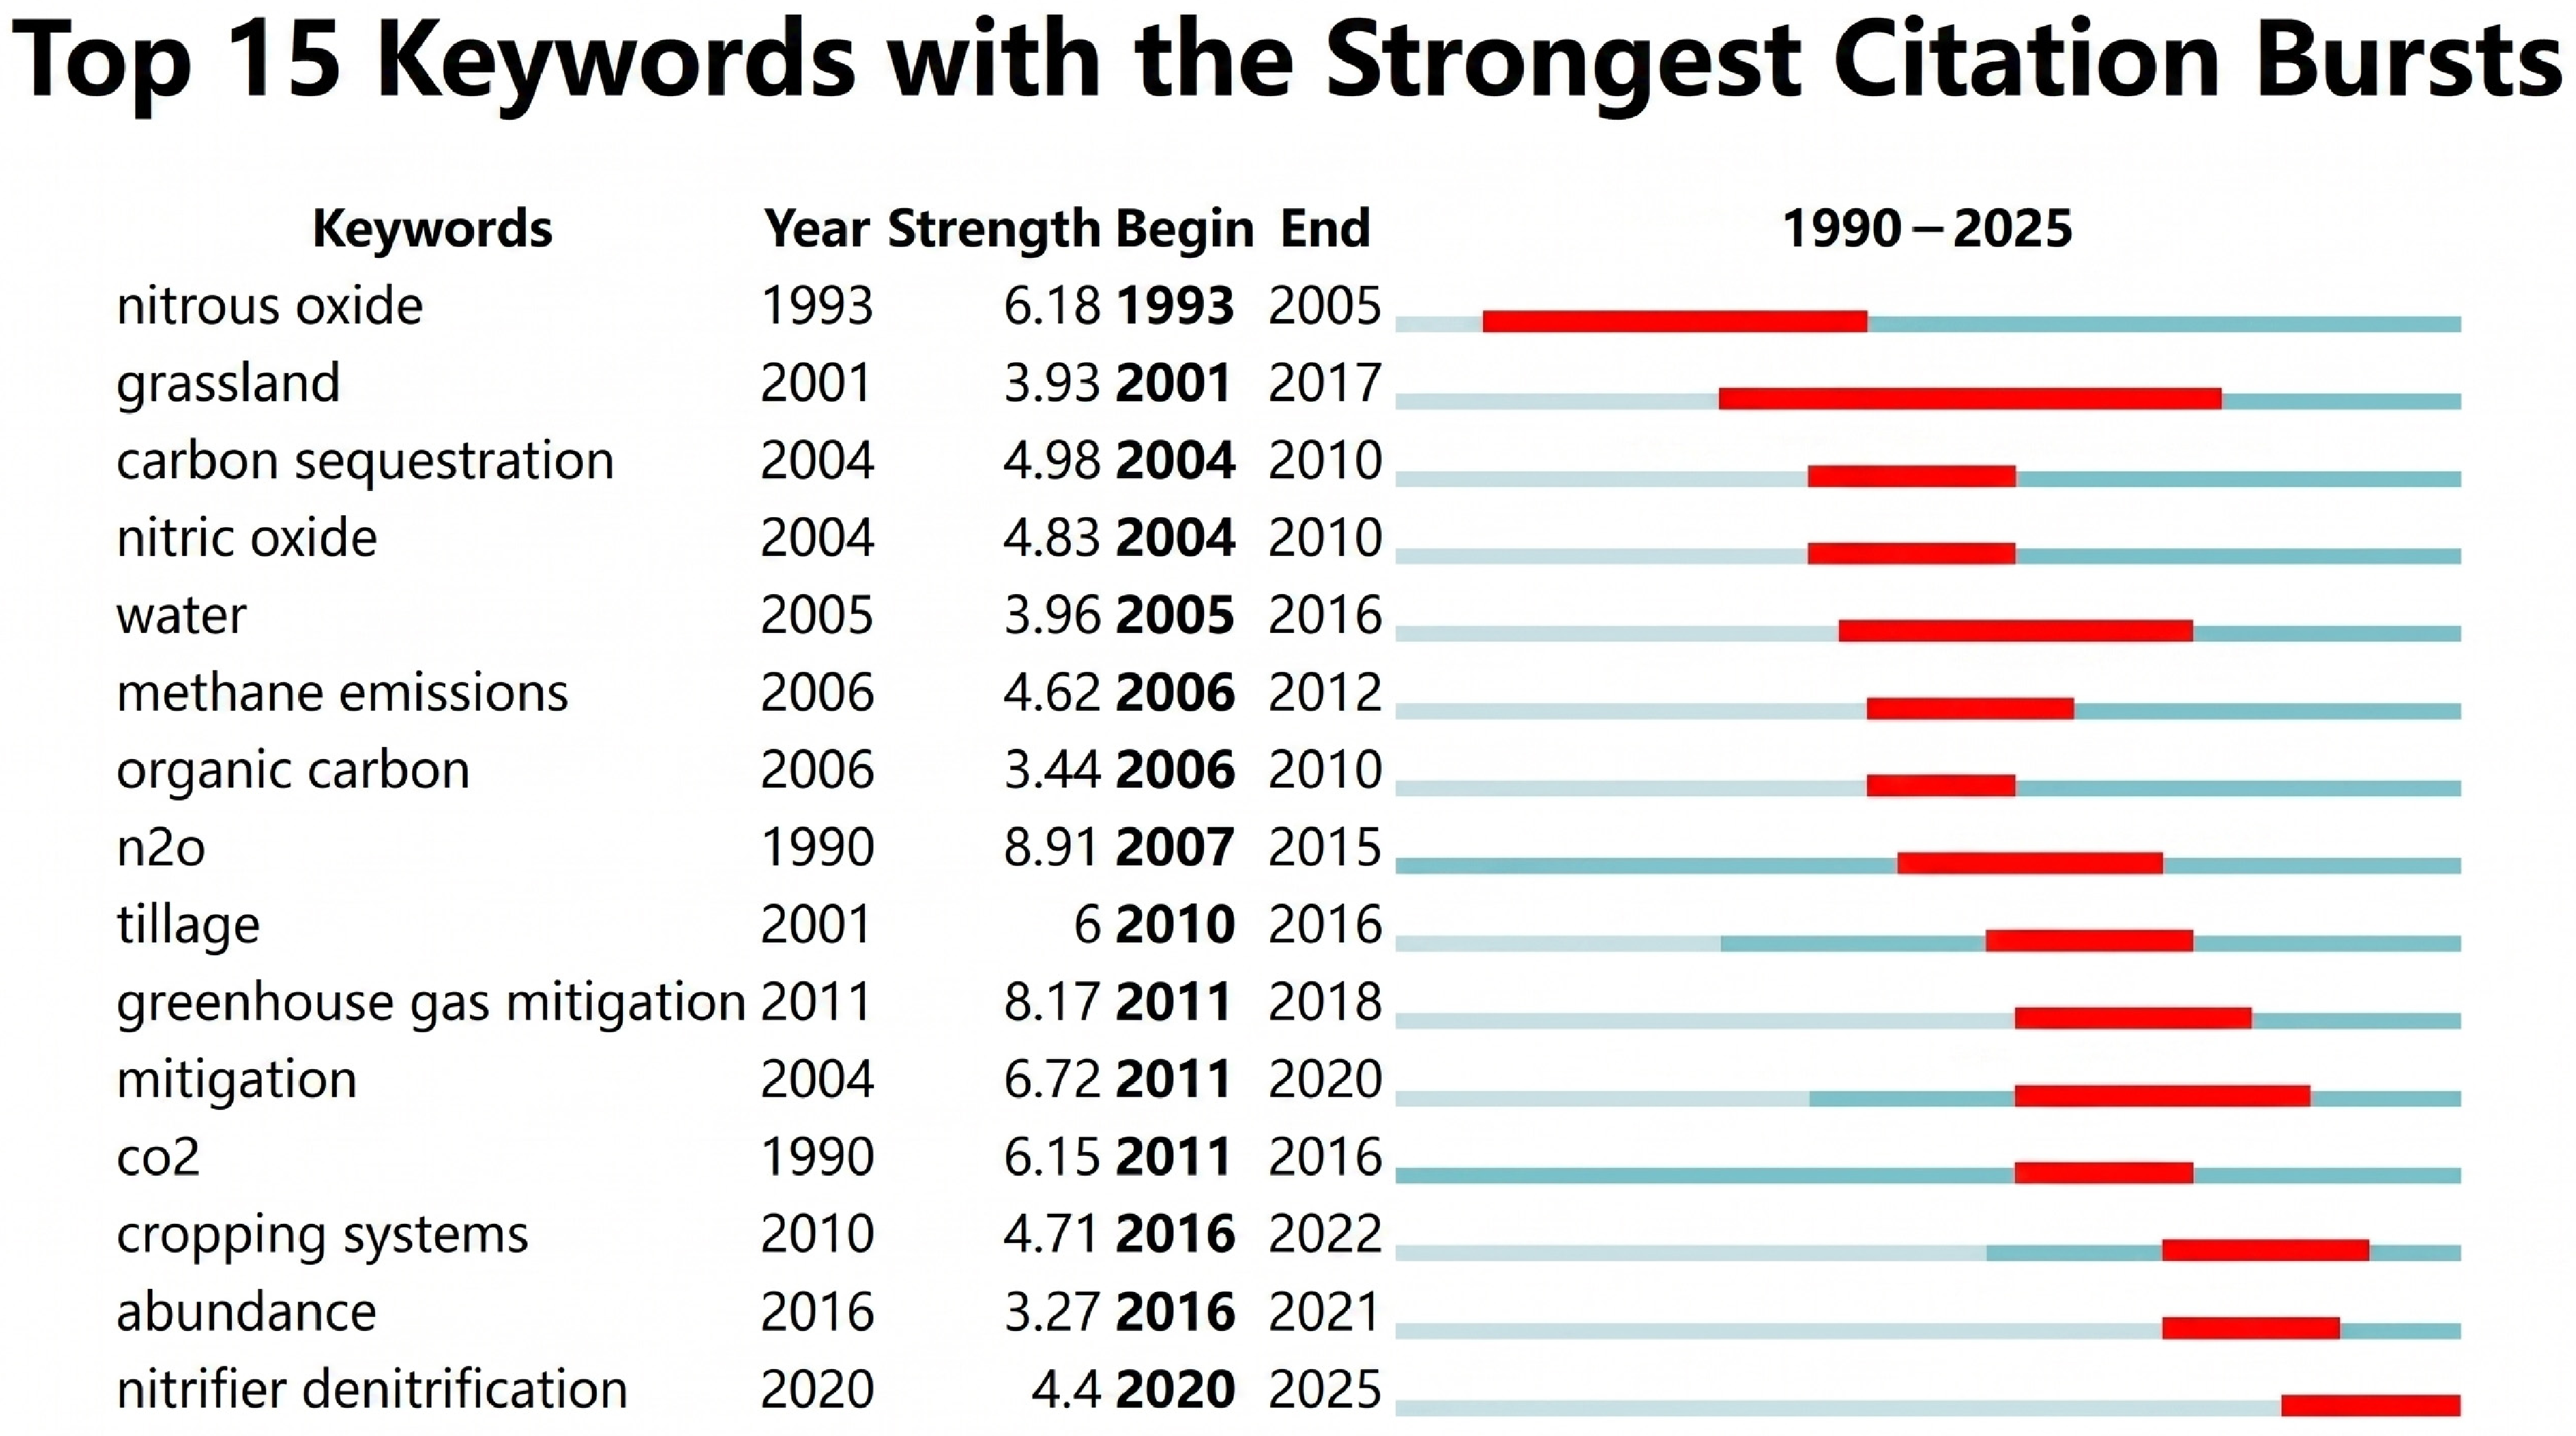
Conducting keyword emergence analysis enables precise identification of sudden shifts in research focus and shifts in academic hotspots. By measuring keyword emergence intensity, duration cycles, and initial timelines, this approach helps pinpoint cutting-edge research trends across different developmental stages of a field. Our study performed keyword emergence analysis (Figure 8), identifying 15 keywords exhibiting emergent patterns. Based on emergence timing, research content, and field development phases, these keywords were categorized into three stages: early, mid-term, and recent. The distinct characteristics of keywords emerging during each phase, along with their associated research frontiers, allow for clear differentiation and the accurate reconstruction the evolution of academic hotspots within the field.
During the early emergence phase (1990–2010), foundational emissions research and traditional management practices emerged as key research frontiers. Dominant keywords included nitrous oxide (with prominence intensity of 6.18, 1993–2005), nitric oxide (intensity 4.83, 2004–2010), and carbon sequestration (intensity 4.98, 2004–2010). Additionally, fundamental topics such as organic carbon (intensity 3.44, 2006–2010) and methane emissions (intensity 4.62, 2006–2012) gained significant traction. This period saw concentrated efforts on fundamental emission mechanisms and conventional agricultural management strategies, with research priorities focusing on greenhouse gas emission principles in farmland systems and emission reduction effects of traditional cultivation methods and fertilization practices. Nitrous oxide, emerging as the first core keyword in this field, demonstrated prolonged prominence and high intensity, becoming a long-term research focus that underscores its pivotal role in agricultural carbon-nitrogen management, a trend further solidified by a massive subsequent citation burst for its chemical formula, N2O (intensity 8.91, 2007–2015). The early emergence of traditional practices like tillage also reflects early research trends emphasizing human intervention in greenhouse gas emissions, laying practical foundations for subsequent collaborative studies.
The medium-term phase (2011–2020) was characterized by cutting-edge research in collaborative emission reduction and system regulation control. Key indicators included greenhouse gas mitigation (with a second-highest peak intensity of 8.17, 2011–2018), general mitigation initiatives (mitigation, intensity 6.72, 2011–2020), CO2 emissions management (CO2, intensity 6.15, 2011–2016), and cropping system optimization (cropping systems, intensity 4.71, 2016–2022). This phase emphasized climate change mitigation strategies and agricultural system regulation, with research priorities shifting toward coordinated greenhouse gas reduction strategies and optimized cultivation system control mechanisms. The “greenhouse gas mitigation” sector has demonstrated exceptionally strong performance intensity, signaling a significant shift in research focus from emission reduction targeting individual gases to coordinated emission reduction strategies for multiple gases. The remarkable achievements in cropping systems reflect a paradigm transition from isolated regulatory measures to comprehensive optimization of entire agricultural ecosystems. Scholars increasingly focused on the holistic regulatory effects of crop rotation and intercropping models on carbon-nitrogen cycles, with collaborative research approaches gradually taking shape.
During the recent phase (2020–2025), key emerging keywords in research on micro-level mechanisms and technological innovation included nitrifier denitrification (with a prominence intensity of 4.40, 2020–2025) and microbial abundance (intensity of 3.72, 2016–2021). These keywords primarily reflect advancements in microbial micro-mechanisms, system optimization strategies, and novel technology implementations, representing the latest research frontiers in integrated carbon and nitrogen pollution mitigation and carbon reduction within agricultural systems. Among these, “nitrifier denitrification” emerged as an important keyword, signifying that research on microbial-mediated carbon-nitrogen cycle mechanisms has become the pinnacle of this field. Scholars have analyzed carbon-nitrogen coupling emission reduction mechanisms from perspectives such as microbial community structure, functional genes, and metabolic pathways, providing theoretical support for developing precision emission reduction technologies. Concurrently, broader literature trends outside of peak citation bursts indicate that yield-emission synergistic evaluation has become a core criterion for technology screening, while broader literature trends outside of peak citation bursts indicate a growing methodological need for advanced data integration tools to handle the increasing complexity of multi-scale carbon-nitrogen emission predictions.
Beyond this, yield-scaled emissions, an essential concept that emerged gradually rather than abruptly, has consistently garnered significant attention. It has become an essential node bridging theoretical research and practical applications throughout the mid-term and recent phases of field studies. This metric establishes a deep correlation between greenhouse gas emissions and crop yields, overcoming the limitations of isolated emission reduction approaches. It enables simultaneous evaluation of emission control effectiveness and production efficiency enhancement, providing scientific basis for field-based screening and demonstration promotion of emission reduction technologies. Serving as a core driver for translating research findings into agricultural practices, it represents a critical direction for future studies in this field.

5.2. Future Research Trends

Based on the bibliometric findings presented above, particularly the keyword burst analysis (Section 5.1), cluster gaps, and the temporal evolution of research themes, we identify four evidence-based directions for future research:
First, there is a critical need to advance cross-scale coupling research. The burst of “nitrifier denitrification” and “microbial abundance” (Section 5.1) signals growing interest in microbial mechanisms, yet most studies remain at individual scales. Future work should integrate molecular-level analyses (microbial functional genes, enzyme activity) with field-plot and regional-scale assessments using remote sensing, GIS, and big data, bridging the gap identified in the cluster analysis between mechanistic studies (#0, #5) and management applications (#8, #10).
Second, future frameworks should prioritize multi-objective collaborative management. The emergence of “yield-scaled emissions” as a persistent frontier keyword highlights the need for management frameworks that simultaneously address pollution mitigation, carbon reduction, yield stabilization, and economic viability—moving beyond the single-objective approaches that dominate existing clusters (#7, #8). Differentiated strategies tailored to diverse agro-climatic regions are needed.
A third crucial direction lies in continuous technological innovation. The cluster analysis reveals that nitrification inhibitor technology (#7) remains a highly active area. Future efforts, building upon current active areas like nitrification inhibitors (#7) and land management (#8), may increasingly focus on developing more efficient formulations and integrating advanced agricultural monitoring technologies with carbon-nitrogen management.
Finally, the successful implementation of these advancements relies on stronger policy-research integration. The limited connection between policy-oriented research and mechanistic studies observed in the collaboration networks suggests that closer engagement between researchers and policymakers is needed. Future research could help bridge this gap by focusing on the development of standardized greenhouse gas accounting systems and exploring how international frameworks (such as the EU Green Deal and the Paris Agreement) influence regional agricultural management practices.

6. Conclusions and Prospects

6.1. Main Conclusions

Drawing on 1286 publications retrieved from the Web of Science Core Collection (1990–2025), this study employed CiteSpace 6.2.R4 to map the knowledge landscape of synergistic carbon-nitrogen pollution reduction and emission mitigation in agricultural systems. The co-authorship network reveals a pronounced concentration of research output in China (444 papers, centrality 0.42), followed by the United States (211 papers) and Germany (151 papers), with the Chinese Academy of Sciences, China Agricultural University, USDA, and Wageningen University serving as the principal institutional hubs. Keyword co-occurrence clustering yielded 11 well-delineated thematic groups (Q = 0.82, S = 0.91), among which nitrous oxide emerged as the dominant bridging node connecting emission mechanism studies, field management practices, and mitigation strategy assessments. A temporal perspective indicates that the field has progressed through three broadly distinguishable stages: an initial focus on fundamental emission processes (1990–2005), a subsequent emphasis on agronomic management interventions (2006–2015), and a recent shift toward integrated mitigation frameworks coupled with microbial mechanism exploration (2016–2025). Burst detection analysis further highlights microbial-mediated carbon-nitrogen coupling, particularly nitrifier denitrification, and yield-scaled emission intensity as the most active current frontiers, signaling a convergence of process-level understanding with production-oriented sustainability assessment.

6.2. Limitations

Several methodological constraints of the present study warrant acknowledgment. The bibliometric dataset was drawn solely from the Web of Science Core Collection, thereby omitting contributions indexed in regional databases such as CNKI, Wanfang, and VIP. Given that a substantial body of agricultural carbon-nitrogen research originates from Chinese-language journals, this reliance on a single English-language repository may underrepresent certain geographic and thematic contributions. Moreover, bibliometric analysis is inherently dependent on structured metadata, including keywords, citation links, and co-authorship records, rather than on the substantive content of individual publications. As such, this approach is better suited to revealing macroscopic patterns than to capturing the mechanistic depth or context-specific policy insights embedded within primary studies. Finally, although the burst detection and timeline analyses provide indirect evidence of how external drivers shape research agendas, the present work does not incorporate a systematic mapping of policy instruments onto publication trends, leaving the governance-research nexus only partially explored.

6.3. Future Outlook

To address these limitations, future bibliometric studies in this field should: (1) integrate multilingual databases (e.g., CNKI and WOS) to construct comprehensive datasets enabling cross-linguistic comparative analyses; (2) complement quantitative bibliometric mapping with qualitative content analysis of highly cited core papers to deepen mechanistic understanding; and (3) incorporate policy document analysis to systematically examine the interplay between governance frameworks and research priorities.

Supplementary Materials

The following supporting information can be downloaded at: https://www.mdpi.com/article/10.3390/agronomy16111047/s1, Table S1: Top 10 countries/regions by publication count in synergistic carbon-nitrogen research (1990–2025). Centrality refers to betweenness centrality in the co-authorship network; higher values indicate stronger bridging roles; Table S2: Top 10 research institutions by publication count. Centrality refers to betweenness centrality in the institutional co-authorship network; Table S3: Top 10 authors by publication count. Centrality refers to betweenness centrality in the co-authorship network. All author centrality values are below the 0.1 threshold, reflecting the tightly-knit, sub-group-dominated structure typical of specialized research fields; Table S4: Top 10 keywords by occurrence frequency. Centrality refers to betweenness centrality in the keyword co-occurrence network; higher values indicate keywords that bridge multiple research themes.

Author Contributions

Conceptualization, Y.Y.; Methodology, Y.Y.; Software, X.X.; Validation, Z.X., Y.Y., and Y.L.; Formal Analysis, Z.X.; Investigation, X.X.; Resources, Z.X.; Data Curation, X.X.; Writing—Original Draft Preparation, Y.Y.; Writing—Review & Editing, Q.C., Y.L.; Visualization, X.X.; Supervision, Q.C., Y.L.; Project Administration, X.X.; Funding Acquisition, Y.Y., Y.L. All authors have read and agreed to the published version of the manuscript.

Funding

This study was supported by the National Natural Science Foundation of China (No. U24A20575, No. 42101061, No. 42507645, No. 42307594). Qianqian Chen has received the support of a PhD scholarship from the China Scholarship Council (Grant Number 202206320054).

Data Availability Statement

No new data were created or analyzed in this study. Data sharing is not applicable to this article.

Conflicts of Interest

The authors declare no conflict of interest.

Abbreviations

N2O Nitrous Oxide
CH4Methane
CO2Carbon Dioxide
WOSWeb of Science
LLRLog-Likelihood Ratio
LRFLocal Rank Factor
GISGeographic Information System
IoTInternet of Things
AIArtificial Intelligence
CNKIChina National Knowledge Infrastructure
CASChinese Academy of Sciences
CAUChina Agricultural University
CAASChinese Academy of Agricultural Sciences
NAUNanjing Agricultural University
USDAUnited States Department of Agriculture
FAOFood and Agriculture Organization
IPCCIntergovernmental Panel on Climate Change
UNFCCCUnited Nations Framework Convention on Climate Change

References

  1. IPCC. Climate Change 2023: Synthesis Report. In Contribution of Working Groups I, II and III to the Sixth Assessment Report of the Intergovernmental Panel on Climate Change; IPCC: Geneva, Switzerland, 2023. [Google Scholar]
  2. Masson-Delmotte, V.; Zhai, P.; Pirani, A.; Connors, S.L.; Péan, C.; Berger, S.; Caud, N.; Chen, Y.; Goldfarb, L.; Gomis, M.I.; et al. (Eds.) Climate Change 2021: The Physical Science Basis. In Contribution of Working Group I to the Sixth Assessment Report of the Intergovernmental Panel on Climate Change; Cambridge University Press: Cambridge, UK; New York, NY, USA, 2021. [Google Scholar]
  3. Raftery, A.E.; Zimmer, A.; Frierson, D.M.W.; Startz, R.; Liu, P. Less than 2 °C warming by 2100 unlikely. Nat. Clim. Change 2017, 7, 637–641. [Google Scholar] [CrossRef] [Scilit]
  4. Friedlingstein, P.; O’Sullivan, M.; Jones, M.W.; Andrew, R.M.; Gregor, L.; Hauck, J.; Le Quéré, C.; Luijkx, I.T.; Olsen, A.; Peters, G.P.; et al. Global Carbon Budget 2022. Earth Syst. Sci. Data 2022, 14, 4811–4900. [Google Scholar] [CrossRef] [Scilit]
  5. Tubiello, F.N.; Salvatore, M.; Rossi, S.; Ferrara, A.; Fitton, N.; Smith, P. The FAOSTAT database of greenhouse gas emissions from agriculture. Environ. Res. Lett. 2013, 8, 015009. [Google Scholar] [CrossRef] [Scilit]
  6. Ravishankara, A.R.; Daniel, J.S.; Portmann, R.W. Nitrous oxide (N2O): The dominant ozonedepleting substance emitted in the 21st century. Science 2009, 326, 123–125. [Google Scholar] [CrossRef] [Scilit] [PubMed]
  7. Robertson, G.P.; Paul, E.A.; Harwood, R.R. Greenhouse gases in intensive agriculture: Contributions of individual gases to the radiative forcing of the atmosphere. Science 2000, 289, 1922–1925. [Google Scholar] [CrossRef] [Scilit]
  8. Paustian, K.; Lehmann, J.; Ogle, S.; Reay, D.; Robertson, G.P.; Smith, P. Climate-smart soils. Nature 2016, 532, 49–57. [Google Scholar] [CrossRef] [Scilit]
  9. Gruber, N.; Galloway, J.N. An Earth-system perspective of the global nitrogen cycle. Nature 2008, 451, 293–296. [Google Scholar] [CrossRef] [Scilit] [PubMed]
  10. Tian, H.; Xu, R.; Canadell, J.G.; Thompson, R.L.; Winiwarter, W.; Suntharalingam, P.; Davidson, E.A.; Ciais, P.; Jackson, R.B.; Janssens-Maenhout, G.; et al. A comprehensive quantification of global nitrous oxide sources and sinks. Nature 2020, 586, 248–256. [Google Scholar] [CrossRef] [Scilit]
  11. Snyder, C.S.; Bruulsema, T.W.; Jensen, T.L.; Fixen, P.E. Review of greenhouse gas emissions from crop production systems and fertilizer management effects. Agric. Ecosyst. Environ. 2009, 133, 247–266. [Google Scholar] [CrossRef] [Scilit]
  12. Reay, D.S.; Davidson, E.A.; Smith, K.A.; Smith, P.; Melillo, J.M.; Dentener, F.; Crutzen, P.J. Global agriculture and nitrous oxide emissions. Nat. Clim. Change 2012, 2, 410–416. [Google Scholar] [CrossRef] [Scilit]
  13. Butterbach-Bahl, K.; Baggs, E.M.; Dannenmann, M.; Kiese, R.; Zechmeister-Boltenstern, S. Nitrous oxide emissions from soils: How well do we understand the processes and their controls? Philos. Trans. R. Soc. B Biol. Sci. 2013, 368, 20130122. [Google Scholar] [CrossRef] [Scilit]
  14. Lal, R. Soil carbon sequestration impacts on global climate change and food security. Science 2004, 304, 1623–1627. [Google Scholar] [CrossRef] [Scilit]
  15. Pittelkow, C.M.; Liang, X.; Linquist, B.A.; van Groenigen, K.J.; Lee, J.; Lundy, M.E.; van Gestel, N.; Six, J.; Venterea, R.T.; van Kessel, C. Productivity limits and potentials of the principles of conservation agriculture. Nature 2015, 517, 365–368. [Google Scholar] [CrossRef] [Scilit]
  16. Frank, S.; Havlík, P.; Soussana, J.F.; Levesque, A.; Valin, H.; Wollenberg, E.; Kleinwechter, U.; Fricko, O.; Gusti, M.; Herrero, M.; et al. Reducing greenhouse gas emissions in agriculture without compromising food security? Environ. Res. Lett. 2017, 12, 105004. [Google Scholar] [CrossRef] [Scilit]
  17. Zhang, W.; Dou, Z.; He, P.; Ju, X.T.; Powlson, D.; Chadwick, D.; Norse, D.; Lu, Y.L.; Zhang, Y.; Wu, L.; et al. New technologies reduce greenhouse gas emissions from nitrogenous fertilizer in China. Proc. Natl. Acad. Sci. USA 2013, 110, 8375–8380. [Google Scholar] [CrossRef] [Scilit] [PubMed]
  18. Ju, X.T.; Xing, G.X.; Chen, X.P.; Zhang, S.L.; Zhang, L.J.; Liu, X.J.; Cui, Z.L.; Yin, B.; Christie, P.; Zhu, Z.L.; et al. Reducing environmental risk by improving N management in intensive Chinese agricultural systems. Proc. Natl. Acad. Sci. USA 2009, 106, 3041–3046. [Google Scholar] [CrossRef] [Scilit]
  19. Donthu, N.; Kumar, S.; Mukherjee, D.; Pandey, N.; Lim, W.M. How to conduct a bibliometric analysis: An overview and guidelines. J. Bus. Res. 2021, 133, 285–296. [Google Scholar] [CrossRef] [Scilit]
  20. Zupic, I.; Cater, T. Bibliometric methods in management and organization. Organ. Res. Methods 2015, 18, 429–472. [Google Scholar] [CrossRef] [Scilit]
  21. Jenkinson, D.S. The Rothamsted long-term experiments: Are they still of use? Agron. J. 1991, 83, 2–10. [Google Scholar] [CrossRef] [Scilit]
  22. Stanford, G.; Smith, S.J. Nitrogen mineralization potentials of soils. Soil Sci. Soc. Am. J. 1972, 36, 465–472. [Google Scholar] [CrossRef] [Scilit]
  23. Six, J.; Conant, R.T.; Paul, E.A.; Paustian, K. Stabilization mechanisms of soil organic matter: Implications for C-saturation of soils. Plant Soil 2002, 241, 155–176. [Google Scholar] [CrossRef] [Scilit]
  24. Bremner, J.M.; Blackmer, A.M. Nitrous oxide: Emission from soils during nitrification of fertilizer nitrogen. Science 1978, 199, 295–296. [Google Scholar] [CrossRef] [Scilit] [PubMed]
  25. Mosier, A.R.; Kroeze, C.; Nevison, C.; Oenema, O.; Seitzinger, S.; van Cleemput, O. Closing the global N2O budget: Nitrous oxide emissions through the agricultural nitrogen cycle. Nutr. Cycl. Agroecosystems 1998, 52, 225–248. [Google Scholar] [CrossRef] [Scilit]
  26. Bouwman, A.F.; Boumans, L.J.M.; Batjes, N.H. Emissions of N2O and NO from fertilized fields: Summary of available measurement data. Glob. Biogeochem. Cycles 2002, 16, 1058. [Google Scholar] [CrossRef] [Scilit]
  27. Robertson, G.P.; Vitousek, P.M. Nitrogen in agriculture: Balancing the cost of an essential resource. Annu. Rev. Environ. Resour. 2009, 34, 97–125. [Google Scholar] [CrossRef] [Scilit]
  28. Smith, P.; Martino, D.; Cai, Z.; Gwary, D.; Janzen, H.; Kumar, P.; McCarl, B.; Ogle, S.; O’Mara, F.; Rice, C.; et al. Greenhouse gas mitigation in agriculture. Philos. Trans. R. Soc. B Biol. Sci. 2008, 363, 789–813. [Google Scholar] [CrossRef] [Scilit] [PubMed]
  29. Akiyama, H.; Yan, X.; Yagi, K. Evaluation of effectiveness of enhanced-efficiency fertilizers as mitigation options for N2O and NO emissions from agricultural soils: Meta-analysis. Glob. Change Biol. 2010, 16, 1837–1846. [Google Scholar] [CrossRef] [Scilit]
  30. Cayuela, M.L.; van Zwieten, L.; Singh, B.P.; Jeffery, S.; Roig, A.; Sánchez-Monedero, M.A. Biochar’s role in mitigating soil nitrous oxide emissions: A review and meta-analysis. Agric. Ecosyst. Environ. 2014, 191, 5–16. [Google Scholar] [CrossRef] [Scilit]
  31. van Groenigen, J.W.; Velthof, G.L.; Oenema, O.; van Groenigen, K.J.; van Kessel, C. Towards an agronomic assessment of N2O emissions: A case study for arable crops. Eur. J. Soil Sci. 2010, 61, 903–913. [Google Scholar] [CrossRef] [Scilit]
  32. Venterea, R.T.; Halvorson, A.D.; Kitchen, N.; Liebig, M.A.; Cavigelli, M.A.; Del Grosso, S.J.; Motavalli, P.P.; Nelson, K.A.; Spokas, K.A.; Singh, B.P.; et al. Challenges and opportunities for mitigating nitrous oxide emissions from fertilized cropping systems. Front. Ecol. Environ. 2012, 10, 562–570. [Google Scholar] [CrossRef] [Scilit]
  33. Groffman, P.M.; Butterbach-Bahl, K.; Fulweiler, R.W.; Gold, A.J.; Morse, J.L.; Stander, E.K.; Tague, C.; Tonitto, C.; Vidon, P. Challenges to incorporating spatially and temporally explicit phenomena (hotspots and hot moments) in denitrification models. Biogeochemistry 2009, 93, 49–77. [Google Scholar] [CrossRef] [Scilit]
  34. Zhang, X.; Davidson, E.A.; Mauzerall, D.L.; Searchinger, T.D.; Dumas, P.; Shen, Y. Managing nitrogen for sustainable development. Nature 2015, 528, 51–59. [Google Scholar] [CrossRef] [Scilit]
  35. Garnett, T.; Appleby, M.C.; Balmford, A.; Bateman, I.J.; Benton, T.G.; Bloomer, P.; Burlingame, B.; Dawkins, M.; Dolan, L.; Fraser, D.; et al. Sustainable intensification in agriculture: Premises and policies. Science 2013, 341, 33–34. [Google Scholar] [CrossRef] [Scilit]
  36. Sutton, M.A.; Oenema, O.; Erisman, J.W.; Leip, A.; van Grinsven, H.; Winiwarter, W. Too much of a good thing. Nature 2011, 472, 159–161. [Google Scholar] [CrossRef] [Scilit]
  37. Aria, M.; Cuccurullo, C. bibliometrix: An R-tool for comprehensive science mapping analysis. J. Informetr. 2017, 11, 959–975. [Google Scholar] [CrossRef] [Scilit]
  38. Ellegaard, O.; Wallin, J.A. The bibliometric analysis of scholarly production: How great is the impact? Scientometrics 2015, 105, 1809–1831. [Google Scholar] [CrossRef] [Scilit] [PubMed]
  39. Mongeon, P.; Paul-Hus, A. The journal coverage of Web of Science and Scopus: A comparative analysis. Scientometrics 2016, 106, 213–228. [Google Scholar] [CrossRef] [Scilit]
  40. Cobo, M.J.; López-Herrera, A.G.; Herrera-Viedma, E.; Herrera, F. Science mapping software tools: Review, analysis, and cooperative study among tools. J. Am. Soc. Inf. Sci. Technol. 2011, 62, 1382–1402. [Google Scholar] [CrossRef] [Scilit]
  41. Callon, M.; Courtial, J.P.; Turner, W.A.; Bauin, S. From translations to problematic networks: An introduction to co-word analysis. Soc. Sci. Inf. 1983, 22, 191–235. [Google Scholar] [CrossRef] [Scilit]
  42. Kleinberg, J. Bursty and hierarchical structure in streams. Data Min. Knowl. Discov. 2003, 7, 373–397. [Google Scholar] [CrossRef] [Scilit]
  43. Waltman, L. A review of the literature on citation impact indicators. J. Informetr. 2016, 10, 365–391. [Google Scholar] [CrossRef] [Scilit]
  44. van Eck, N.J.; Waltman, L. Software survey: VOSviewer, a computer program for bibliometric mapping. Scientometrics 2010, 84, 523–538. [Google Scholar] [CrossRef] [Scilit]
  45. Chen, C.; Ibekwe-SanJuan, F.; Hou, J. The structure and dynamics of cocitation clusters: A multiple-perspective cocitation analysis. J. Am. Soc. Inf. Sci. Technol. 2010, 61, 1386–1409. [Google Scholar] [CrossRef] [Scilit]
  46. Small, H. Co-citation in the scientific literature: A new measure of the relationship between two documents. J. Am. Soc. Inf. Sci. 1973, 24, 265–269. [Google Scholar] [CrossRef] [Scilit]
  47. White, H.D.; Griffith, B.C. Author cocitation: A literature measure of intellectual structure. J. Am. Soc. Inf. Sci. 1981, 32, 163–171. [Google Scholar] [CrossRef] [Scilit]
  48. Garfield, E. Citation analysis as a tool in journal evaluation. Science 1972, 178, 471–479. [Google Scholar] [CrossRef] [Scilit] [PubMed]
  49. Falagas, M.E.; Pitsouni, E.I.; Malietzis, G.A.; Pappas, G. Comparison of PubMed, Scopus, Web of Science, and Google Scholar: Strengths and weaknesses. FASEB J. 2008, 22, 338–342. [Google Scholar] [CrossRef] [Scilit] [PubMed]
  50. Aghaei Chadegani, A.; Salehi, H.; Yunus, M.M.; Farhadi, H.; Fooladi, M.; Farhadi, M.; Ebrahim, N.A. A comparison between two main academic literature collections: Web of Science and Scopus databases. Asian Soc. Sci. 2013, 9, 18–26. [Google Scholar] [CrossRef] [Scilit]
  51. Gusenbauer, M.; Haddaway, N.R. Which academic search systems are suitable for systematic reviews or meta-analyses? Evaluating retrieval qualities of Google Scholar, PubMed, and 26 other resources. Res. Synth. Methods 2020, 11, 181–217. [Google Scholar] [CrossRef] [Scilit]
  52. Pranckutė, R. Web of Science (WoS) and Scopus: The titans of bibliographic information in today’s academic research world. Publications 2021, 9, 12. [Google Scholar] [CrossRef] [Scilit]
  53. Houghton, J.T.; Jenkins, G.J.; Ephraums, J.J. (Eds.) Climate Change: The IPCC Scientific Assessment; Cambridge University Press: Cambridge, UK, 1990. [Google Scholar]
  54. Moher, D.; Liberati, A.; Tetzlaff, J.; Altman, D.G. Preferred reporting items for systematic reviews and meta-analyses: The PRISMA statement. PLoS Med. 2009, 6, e1000097. [Google Scholar] [CrossRef] [Scilit]
  55. Harzing, A.W.; Alakangas, S. Google Scholar, Scopus and the Web of Science: A longitudinal and cross-disciplinary comparison. Scientometrics 2016, 106, 787–804. [Google Scholar] [CrossRef] [Scilit]
  56. Tranfield, D.; Denyer, D.; Smart, P. Towards a methodology for developing evidence-informed management knowledge by means of systematic review. Br. J. Manag. 2003, 14, 207–222. [Google Scholar] [CrossRef] [Scilit]
  57. Paul, J.; Lim, W.M.; O’Cass, A.; Hao, A.W.; Bresciani, S. Scientific procedures and rationales for systematic literature reviews (SPAR-4-SLR). Int. J. Consum. Stud. 2021, 45, O1–O16. [Google Scholar] [CrossRef] [Scilit]
  58. Page, M.J.; McKenzie, J.E.; Bossuyt, P.M.; Boutron, I.; Hoffmann, T.C.; Mulrow, C.D.; Shamseer, L.; Tetzlaff, J.M.; Akl, E.A.; Brennan, S.E.; et al. The PRISMA 2020 statement: An updated guideline for reporting systematic reviews. BMJ 2021, 372, n71. [Google Scholar] [CrossRef] [Scilit]
  59. Perianes-Rodriguez, A.; Waltman, L.; van Eck, N.J. Constructing bibliometric networks: A comparison between full and fractional counting. J. Informetr. 2016, 10, 1178–1195. [Google Scholar] [CrossRef] [Scilit]
  60. Moral-Muñoz, J.A.; Herrera-Viedma, E.; Santisteban-Espejo, A.; Cobo, M.J. Software tools for conducting bibliometric analysis in science: An up-to-date review. Prof. Inf. 2020, 29, e290103. [Google Scholar] [CrossRef] [Scilit]
  61. Chen, C. CiteSpace II: Detecting and visualizing emerging trends and transient patterns in scientific literature. J. Am. Soc. Inf. Sci. Technol. 2006, 57, 359–377. [Google Scholar] [CrossRef] [Scilit]
  62. Chen, C. Science mapping: A systematic review of the literature. J. Data Inf. Sci. 2017, 2, 1–40. [Google Scholar] [CrossRef] [Scilit]
  63. Synnestvedt, M.B.; Chen, C.; Holmes, J.H. CiteSpace II: Visualization and knowledge discovery in bibliographic databases. In Proceedings of the AMIA Annual Symposium Proceedings; American Medical Informatics Association: Bethesda, MD, USA, 2005; Volume 2005, pp. 724–728. [Google Scholar]
  64. Chen, C. Searching for intellectual turning points: Progressive knowledge domain visualization. Proc. Natl. Acad. Sci. USA 2004, 101, 5303–5310. [Google Scholar] [CrossRef] [Scilit] [PubMed]
  65. Chen, C.; Hu, Z.; Liu, S.; Tseng, H. Emerging trends in regenerative medicine: A scientometric analysis in CiteSpace. Expert Opin. Biol. Ther. 2012, 12, 593–608. [Google Scholar] [CrossRef] [Scilit]
  66. He, Q. Knowledge discovery through co-word analysis. Libr. Trends 1999, 48, 133–159. [Google Scholar]
  67. Dunning, T. Accurate methods for the statistics of surprise and coincidence. Comput. Linguist. 1993, 19, 61–74. [Google Scholar]
  68. Newman, M.E.J. Coauthorship networks and patterns of scientific collaboration. Proc. Natl. Acad. Sci. USA 2004, 101, 5200–5205. [Google Scholar] [CrossRef] [Scilit]
Figure 1. National/regional cooperation network map. Each node (circle) represents a country or region. Node size is proportional to the number of publications. The concentric color rings within each node follow a cool-to-warm spectrum indicating publication years from early to recent. A purple outer ring indicates that the node’s betweenness centrality exceeds 0.1, a widely adopted threshold in CiteSpace identifying nodes that function as interdisciplinary bridges or theoretical turning points connecting otherwise separate research domains. Links between nodes represent co-authorship relations. Link thickness reflects collaboration frequency, and link color corresponds to the year of first collaboration.
Agronomy 16 01047 g001
Figure 2. Institutional cooperation network map. Each node represents a research institution. Node size is proportional to its total publication count. Color rings within nodes indicate publication timing along a cool-to-warm gradient (blue: early years; red: recent years). A purple outer ring marks nodes whose betweenness centrality exceeds 0.1, indicating institutions that act as interdisciplinary bridges or turning points linking otherwise separate collaborative clusters. Links denote inter-institutional co-authorship; thicker links indicate more frequent collaboration.
Agronomy 16 01047 g002
Figure 3. Author collaboration network map. Each node represents an author; node size reflects the number of publications. Color rings within nodes encode publication years along a cool-to-warm gradient (blue: early years; red: recent years). In CiteSpace, a purple outer ring appears when a node’s betweenness exceeds 0.1, signifying an interdisciplinary bridge or theoretical turning point. Links denote co-authorship between authors. Link thickness is proportional to the number of co-authored papers, and link color corresponds to the year of first joint publication.
Agronomy 16 01047 g003
Figure 4. Keyword co-occurrence network map. Each node represents a keyword. Node size is proportional to its occurrence frequency across the 1286 articles. Color rings within each node indicate the temporal distribution of keyword usage (blue: early years; red: recent years). A purple outer ring indicates that the keyword’s betweenness centrality exceeds 0.1, identifying it as an interdisciplinary bridge or theoretical turning point that connects otherwise separate research themes. Links connect keywords that co-occur within the same publication. Link thickness reflects co-occurrence strength, and link color indicates the year of first co-occurrence.
Agronomy 16 01047 g004
Figure 5. Keyword clustering map. Nodes represent keywords. Node size corresponds to occurrence frequency. Nodes sharing the same background color belong to the same thematic cluster, identified by the LLR algorithm. Cluster labels (#0–#10) are displayed adjacent to their respective groups. Links between nodes indicate keyword co-occurrence. Link thickness reflects co-occurrence strength. The modularity Q = 0.82 and mean silhouette S = 0.91 confirm significant and reliable clustering structure.
Agronomy 16 01047 g005
Figure 6. Keyword timeline chart. Each horizontal band corresponds to one thematic cluster (#0–#10, listed in the right-hand legend). The horizontal axis represents publication year (1990–2025). Each node is a keyword positioned at its first appearance year. Node size is proportional to occurrence frequency. Links connect co-occurring keywords within and across clusters. This layout reveals how keywords within each thematic cluster have emerged and persisted over time.
Agronomy 16 01047 g006
Figure 7. Cluster timeline map. Each horizontal band corresponds to one thematic cluster (#0–#10, labeled on the right). The horizontal axis represents publication year (1990–2025). The filled area (wave form) within each band indicates the relative publication activity of that cluster over time: peaks denote periods of high research output, and flat segments indicate low activity. Each cluster is assigned to a distinct color. This visualization reveals the temporal span, active periods, and relative intensity of each research theme.
Agronomy 16 01047 g007
Figure 8. Keyword prominence intensity map. Each row represents one keyword exhibiting a statistically significant citation or frequency burst. The blue line spans the full analysis period (1990–2025). The red segment highlights the burst interval during which the keyword experienced a sharp increase in usage frequency. The “Strength” column indicates burst intensity. Keywords are sorted by burst onset year, enabling identification of temporal shifts in research frontiers.
Agronomy 16 01047 g008
Table 1. Interpretation of core clusters of keywords in research on synergistic carbon and nitrogen pollution reduction and carbon emission reduction in farmland.
Cluster IDCluster NameCore Research Content
#0nitrous oxideMechanisms and Regulation of Nitrous Oxide Emissions: Analyzing core factors such as soil drivers, microbial mediation, and climatic impacts on agricultural N2O emissions, elucidating transformation processes including nitrification-denitrification, and developing targeted emission reduction technologies and control strategies.
#1greenhouse gasComprehensive research on agricultural greenhouse gases, investigating emission characteristics, interactions, and synergistic mitigation mechanisms of three major core greenhouse gases (CO2, N2O, and CH4) in farmland, and establishing a greenhouse gas emission accounting and assessment system.
#2carbon dioxideCarbon dioxide emissions and carbon sequestration enhancement: Investigating CO2 emission patterns from soil respiration and plant respiration in farmland, exploring effective approaches to increase soil organic carbon and carbon sinks through straw returning to fields, organic fertilizer application, and no-till farming practices.
#3risk assessmentEnvironmental risk assessment of carbon and nitrogen in farmland, establishment of risk assessment indicator systems and models for carbon and nitrogen emissions and nitrogen loss, implementation of regional-scale pollution and emission risk early warning, and development of risk prevention and control strategies.
#4spatial variabilityThe spatial variability of carbon and nitrogen emissions, combined with remote sensing and GIS technologies, analyzes spatial differences in agricultural carbon and nitrogen emissions across different climate zones, soil types, and cropping systems to identify core influencing factors and high-emission areas.
#5agricultural soilFarmland soil carbon and nitrogen processes involve the study of mineralization, fixation, nitrification, denitrification, and leaching of carbon and nitrogen in agricultural soils, as well as the analysis of the coupling effects between soil physicochemical properties and carbon-nitrogen cycling.
#6emission factorEstimation of greenhouse gas emission factors, determining greenhouse gas emission factors under different farmland types, management measures, and climatic conditions, and modifying global emission inventories to provide foundational data support for regional emission reduction accounting.
#7nitrification inhibitorNitration inhibitor emission reduction technology: Development of novel, efficient, environmentally friendly, and low-cost nitration inhibitors; investigation of their regulatory mechanisms and emission reduction effects on soil nitrogen cycling and N2O emissions; optimization of field application methods and formulation ratios.
#8land managementManagement measures for farmland land use, investigating the regulatory effects of cultivation practices, fertilization, irrigation, straw returning to fields, crop rotation, and fallow periods on carbon-nitrogen cycling and greenhouse gas emissions, and selecting optimal management models for synergistic emission reduction.
#9yield-scaled emissionsEmission assessment at yield scale, establishing a greenhouse gas emission evaluation method based on yield metrics, simultaneously accounting for crop yield and greenhouse gas emissions, to achieve synergistic evaluation of emission reduction and stable production alongside technology screening.
#10climate change mitigationClimate change mitigation strategies: constructing a synergistic pollution reduction and carbon Emission reduction climate change response strategy and policy support System at the farmland ecosystem level, integrating regional climate characteristics and agricultural production needs.
Disclaimer/Publisher’s Note: The statements, opinions and data contained in all publications are solely those of the individual author(s) and contributor(s) and not of MDPI and/or the editor(s). MDPI and/or the editor(s) disclaim responsibility for any injury to people or property resulting from any ideas, methods, instructions or products referred to in the content.