Article

Organic Amendment Source Affects Soil Aggregation, Carbon–Nitrogen Allocation, and Wheat Yield in a Long-Term Rice–Wheat Rotation System

1
College of Resources and Environment, Anhui Science and Technology University, Chuzhou 233100, China
2
Key Laboratory of Nutrient Cycling and Arable Land Conservation of Anhui Province, Soil and Fertilizer Research Institute, Anhui Academy of Agricultural Sciences, Hefei 230031, China
*
Authors to whom correspondence should be addressed.
These authors contributed equally to this work.
Agronomy 2026, 16(11), 1046; https://doi.org/10.3390/agronomy16111046
Submission received: 24 April 2026 / Revised: 17 May 2026 / Accepted: 21 May 2026 / Published: 25 May 2026
(This article belongs to the Topic Soil Health and Nutrient Management for Crop Productivity)

Abstract

Long-term reliance on mineral fertilizers may degrade soil structure and weaken carbon and nitrogen retention in rice–wheat rotation systems. Organic amendments combined with mineral fertilizers can provide organic substrates, promote aggregate formation, and improve soil C–N retention, but the contrasting effects of plant- and animal-derived amendments remain unclear. A long-term field experiment initiated in 2012 in Chaohu, China, compared no fertilization (CK), chemical fertilizer alone (CF), chemical fertilizer plus oil cake (OC), and chemical fertilizer plus cattle manure (CM). At wheat maturity in 2025, soil aggregate distribution, stability, aggregate-associated soil organic carbon (SOC) and total nitrogen (TN), C and N contribution rates, and yield components were determined; wheat yield was further evaluated using annual records from 2021 to 2025. Compared with CK, OC and CM increased water-stable macroaggregates (>0.25 mm) by 17.35% and 17.94% and reduced aggregate destruction by 54.61% and 53.57%, respectively. In large macroaggregates (>2 mm), OC and CM increased SOC by 58.30% and 84.83% and TN by 141.76% and 200.00%, respectively. Five-year mean yield increased by 208.09%, 240.78%, and 225.15% under CF, OC, and CM, respectively, relative to CK, but did not differ significantly among fertilized treatments. Overall, oil cake showed a numerical advantage in maintaining wheat yield, whereas cattle manure had greater potential to improve aggregate-scale C–N retention and soil structural stability.

1. Introduction

Wheat (Triticum aestivum L.) is a major global food crop, and maintaining stable and high yields is critical for food security [1]. The middle and lower reaches of the Yangtze River are a typical rice–wheat rotation region in China, where wheat production is closely linked to the sustainability of paddy–upland rotation systems [2]. However, long-term intensive cultivation and irrational use of chemical fertilizers can lead to soil organic carbon (SOC) loss, soil aggregate degradation, and reduced aggregate stability [3]. These changes may weaken soil physicochemical properties and ultimately limit wheat yield potential [4]. Therefore, improving soil structural quality and nutrient-retention capacity through optimized fertilization management is essential for sustainable wheat production in rice–wheat rotation systems.
Soil aggregates are the fundamental units of soil structure and play important roles in regulating water retention, nutrient availability, aeration, and thermal regimes [5]. They also serve as key physical carriers for SOC and total nitrogen (TN) stabilization because organic matter and nutrients can be occluded and protected within aggregate structures [6]. Among aggregate-size fractions, macroaggregates are generally sensitive to organic matter input and management changes, whereas smaller aggregate fractions are closely related to the redistribution and stabilization of C and N pools. Therefore, aggregate-size distribution, aggregate stability indices, and aggregate-associated SOC and TN contents are important indicators for evaluating the effects of fertilization strategies on soil structure and C–N retention. In rice–wheat rotation systems, improving aggregate distribution and stability is particularly important for enhancing soil C and N storage, cultivated land quality, and stable crop productivity [7].
Combined application of organic amendments and mineral fertilizers has been widely recognized as an effective strategy for improving soil structure and fertility. Previous studies have shown that organic–inorganic fertilization can increase the proportion of macroaggregates, improve aggregate structure, and enhance soil stability [8]. Organic fertilizer application can also regulate soil organic carbon pools and improve soil aggregation processes through the input of organic substrates and binding materials [9]. In addition, organic amendments can influence soil aggregate stability, carbon sequestration, and resource-use efficiency in wetland paddy cultivation systems [10]. These findings suggest that evaluating aggregate stability together with aggregate-associated SOC and TN allocation can provide a more comprehensive understanding of how fertilization practices regulate soil fertility in rice–wheat rotation systems.
However, the effects of organic amendments may vary depending on their source, nutrient composition, decomposition characteristics, and persistence in soil. Oil cake, as a typical plant-derived organic fertilizer, contains relatively abundant labile organic components and active nutrient sources, and its combination with mineral fertilizer can improve nutrient uptake and crop performance [11]. In contrast, cattle manure, as a representative animal-derived organic amendment, generally contains more complex organic materials and decomposes more slowly, which may contribute to soil fertility improvement and longer-term nutrient retention [12]. At the cropping-system scale, organic fertilizer application has been shown to improve crop yield and soil properties in rice–wheat rotation systems [13]. Nevertheless, most previous studies have focused on the general effects of organic–inorganic fertilization, whereas direct comparisons between plant-derived and animal-derived amendments in terms of aggregate formation, aggregate-associated SOC and TN allocation, and crop yield response remain limited, particularly under the same long-term rice–wheat rotation system.
Accordingly, this study was conducted using a long-term rice–wheat rotation experiment initiated in 2012 in Chaohu, Anhui Province, China. The treatments included no fertilization, chemical fertilizer alone, chemical fertilizer plus plant-derived oil cake, and chemical fertilizer plus animal-derived cattle manure. The specific objective was to determine how organic amendment source affects soil aggregate distribution and stability, aggregate-associated SOC and TN allocation, and wheat yield performance. The main contribution of this study lies in integrating soil aggregate fractionation, aggregate stability assessment, aggregate-associated C–N analysis, and five-year wheat yield records to compare the functional roles of plant- and animal-derived amendments under the same mineral fertilization background. We hypothesized that: (1) combined organic–inorganic fertilization would improve water-stable macroaggregate formation and aggregate stability compared with chemical fertilizer alone; (2) oil cake and cattle manure would differ in their effects on aggregate-associated SOC and TN allocation because of their contrasting nutrient composition and decomposition characteristics; and (3) wheat yield would be associated with improved aggregate stability and enhanced SOC and TN retention in macroaggregates. This study aimed to provide field-based evidence for optimizing organic amendment source selection in sustainable rice–wheat rotation systems.

2. Materials and Methods

2.1. Study Site

The field experiment was conducted in Zhonghan Town, Chaohu City, Anhui Province, China (31°39′7″ N, 117°47′52″ E). This region is located in the middle and lower reaches of the Yangtze River and is characterized by a humid subtropical monsoon climate. The annual total solar radiation is 110–120 kcal·cm−2, the annual sunshine duration is 2019.2–2074.1 h, and the annual precipitation is 1032–1205 mm. Rice–wheat rotation is the dominant local cropping system, with rice grown during the summer season and wheat grown during the winter season.
The soil at the experimental site is a hydromorphic paddy soil. Before the establishment of the long-term fertilization experiment in 2012, composite soil samples were collected from the 0–20 cm plow layer to determine the baseline soil physicochemical properties. These values represented the initial soil condition before the continuous fertilization treatments were imposed. The baseline properties of the 0–20 cm soil layer were as follows: organic matter, 34.07 g·kg−1; total nitrogen, 1.58 g·kg−1; total phosphorus, 0.78 g·kg−1; available phosphorus, 25.97 mg·kg−1; available potassium, 136.31 mg·kg−1; and pH, 6.99 [14].

2.2. Experimental Design

The long-term rice–wheat rotation experiment was initiated in 2012. The wheat-season sampling reported in this study was conducted in May 2025, after 13 years of continuous fertilization under the same rotation system. A randomized block design was used, with four fertilization treatments and three replicates. Each plot covered 36 m2 (4 m × 9 m). To reduce potential interference among plots, ridges were constructed between adjacent plots and lined with plastic film to prevent lateral movement of water and nutrients. Drainage and irrigation ditches were arranged between blocks, and each plot had independent water inlet and outlet structures. Guard rows were established around the plots to reduce edge effects.
The four treatments were designed to compare chemical fertilizer alone with combined organic–inorganic fertilization using plant- and animal-derived organic amendments. The treatments were as follows: CK, no fertilizer input; CF, chemical fertilizer only; OC, chemical fertilizer plus oil cake; and CM, chemical fertilizer plus cattle manure. The chemical fertilizers used were urea (46% N; CNSG Anhui Hongsifang Fertilizer Co., Ltd., Hefei, China), triple superphosphate (42% P2O5; Jiangsu Meile Fertilizer Co., Ltd., Xinghua, China), and potassium chloride (60% K2O; SDIC Xinjiang Luobupo Potash Co., Ltd., Bayingolin, China), and the organic amendments were oil cake and cattle manure (prepared by the authors, Hefei, China).
For the wheat season, CF received 180 kg N·ha−1, 60 kg P2O5·ha−1, and 90 kg K2O·ha−1. The OC treatment received the same chemical fertilizer rates as CF plus 2250 kg·ha−1 oil cake, which contained 79.86 g·kg−1 N, 34.65 g·kg−1 P2O5, and 15.08 g·kg−1 K2O. The CM treatment received the same chemical fertilizer rates as CF plus 30,000 kg·ha−1 cattle manure, which contained 3.66 g·kg−1 N, 3.75 g·kg−1 P2O5, and 2.15 g·kg−1 K2O. The chemical fertilizer rates were kept identical among CF, OC, and CM to evaluate the additional effects of different organic amendment sources under the same mineral fertilization background (Table 1).
The different application rates of oil cake and cattle manure reflected their contrasting nutrient concentrations and the established design of the long-term field experiment. Oil cake had higher nutrient concentrations and was therefore applied at a lower rate, whereas cattle manure had lower nutrient concentrations and was applied at a higher rate to represent a manure-based organic amendment input. Nitrogen fertilizer was split between basal and jointing applications at a ratio of 6:4, whereas phosphorus fertilizer, potassium fertilizer, and organic amendments were applied once as basal fertilizer. The wheat cultivar was Yangmai 17 (Anhui Future Seed Industry Co., Ltd., Hefei, China). Except for fertilization, all plots received the same field management practices, including sowing, irrigation, drainage, weed control, pest management, and harvest.

2.3. Sample Collection and Analytical Methods

2.3.1. Soil Sampling and Pretreatment

Soil samples were collected at wheat maturity in May 2025. In each plot, five sampling points were selected using an S-shaped sampling pattern to improve the representativeness of the composite sample. Sampling points were located in the central area of each plot and away from plot borders to reduce edge effects. After removing surface crop residues and weeds, undisturbed soil samples were collected from the 0–20 cm plow layer using a shovel.
The five subsamples from each plot were gently mixed to obtain one composite sample per plot. The samples were placed in rigid plastic boxes and transported to the laboratory to minimize disturbance and compression of the natural aggregate structure. In the laboratory, fresh soil samples were gently broken along natural cracks into approximately 10 mm clods. Visible roots, stones, and plant residues were removed manually. The samples were then air-dried at room temperature for subsequent aggregate fractionation and physicochemical analyses.

2.3.2. Soil Aggregate Fractionation

Soil aggregate fractionation was performed using a combination of dry sieving and wet sieving methods [15]. For dry sieving, 500 g of air-dried soil was placed on a stacked sieve set (TTF-100; Shaoxing Shangyu Shunlong Experimental Instrument Factory, Shaoxing, China) with mesh sizes of 2 mm, 0.25 mm, and 0.053 mm and mechanically shaken for 2 min. The materials retained on each sieve and those passing through the bottom sieve were collected and weighed. Four aggregate-size fractions were obtained: large macroaggregates (>2 mm), small macroaggregates (2–0.25 mm), microaggregates (0.25–0.053 mm), and the silt + clay fraction (<0.053 mm). Aggregates larger than 0.25 mm were defined as macroaggregates [16].
For wet sieving, a 50 g composite aggregate sample was prepared according to the mass proportion of each size fraction obtained from dry sieving. The sample was placed on the top sieve of the same stacked sieve set with mesh sizes of 2 mm, 0.25 mm, and 0.053 mm. Before oscillation, the sample was soaked in deionized water for 5 min to allow gradual wetting and to reduce slaking caused by trapped air. The sieve set was then oscillated vertically using an aggregate sieving apparatus (IN-TL200; Shandong Laiyin Optoelectronic Technology Co., Ltd., Weifang, China) at 30 cycles min−1 for 5 min with an amplitude of 3 cm. After wet sieving, the aggregates retained on each sieve were carefully rinsed into aluminum boxes, dried at 40 °C to constant weight, and weighed. The mass percentage of each water-stable aggregate fraction was then calculated.

2.3.3. Determination of SOC and TN in Soil Aggregates

Water-stable aggregates from each size fraction were collected after wet sieving, air-dried, ground, and passed through a 0.149 mm sieve before chemical analysis. Soil organic carbon (SOC) was determined by the external heating potassium dichromate oxidation method, and soil total nitrogen (TN) was determined by the Kjeldahl method using a Kjeldahl apparatus (Jinan Hanon Instruments Co., Ltd., Jinan, China) [17]. To ensure analytical reliability, all chemical analyses were conducted with replicate measurements, and reagent blanks were included during digestion and titration procedures. The same analytical procedures were applied to all aggregate-size fractions and fertilization treatments to ensure comparability among treatments.

2.3.4. Measurement of Wheat Yield Components and Grain Yield

At wheat maturity, wheat yield components and grain yield were measured for each plot. The number of effective spikes was recorded within a 1 m2 area located in the central part of each plot, where plant growth was representative and border effects were avoided. Twenty representative wheat plants were randomly selected from the same central sampling area and transported to the laboratory to determine the number of kernels per spike.
After threshing, 1000 kernels were randomly counted and weighed, with three repeated measurements, and the mean value was used as the thousand-kernel weight. At harvest, each plot was harvested and threshed separately. After removing impurities, the fresh grain weight was recorded, and grain moisture content was measured. Actual grain yield was converted to a hectare basis and adjusted to a standard moisture content of 13% [18].

2.4. Calculations

The following parameters were calculated from soil aggregate data: mean weight diameter (MWD, mm), geometric mean diameter (GMD, mm), proportion of macroaggregates > 0.25 mm (R0.25, %), percentage of aggregate destruction (PAD, %), and the contribution rate of the i-th aggregate-size fraction to total SOC or TN (Gi, %):
M W D = i = 1 4 X i M i M t
G M D = exp M i ln X i M i
R 0.25 = M > 0.25 M t × 100
P A D = D R > 0.25 W R > 0.25 D R > 0.25 × 100 %
G i = C i × W i i = 1 n ( C i × W i ) × 100 %
where Xi is the mean diameter of the i-th aggregate fraction (mm), Mi is the mass of the i-th aggregate fraction (g), Mt is the total mass of aggregates (g), M>0.25 is the mass of water-stable macroaggregates larger than 0.25 mm (g), DR>0.25 is the proportion of mechanically stable aggregates > 0.25 mm (%), WR>0.25 is the proportion of water-stable aggregates > 0.25 mm (%), Gi is the contribution rate of the i-th aggregate-size fraction to total SOC or TN (%), Ci is the SOC or TN content of the i-th aggregate-size fraction (g·kg−1), and Wi is the mass fraction of the i-th aggregate-size fraction after wet sieving (%).

2.5. Data Analysis

Statistical analyses were performed using SPSS 22.0 (IBM Corp., Armonk, NY, USA). All data are presented as mean ± standard deviation (Mean ± SD). Before analysis of variance, the normality of residuals and homogeneity of variance were checked using the Shapiro–Wilk test and Levene’s test, respectively. One-way analysis of variance (ANOVA) was used to compare differences among fertilization treatments, and Duncan’s multiple range test was used for mean separation at p < 0.05.
For the five-year mean yield, annual plot-level wheat yield values from 2021 to 2025 were averaged for each replicate before statistical comparison among treatments. Pearson correlation analysis was performed to evaluate the relationships between actual wheat grain yield in 2025 and soil aggregate stability indices, aggregate-associated SOC and TN contents, and SOC and TN contribution rates in different aggregate-size fractions.
To further evaluate the integrated response of soil aggregation, aggregate-associated C–N retention, and wheat yield to different fertilization treatments, principal component analysis (PCA) was performed using standardized plot-level variables measured in the 2025 wheat season. The variables included MWD, GMD, R0.25, PAD, SOC and TN contents in large macroaggregates, SOC and TN contribution rates of large macroaggregates, and actual grain yield in 2025. PCA was used as an exploratory multivariate analysis to visualize the overall separation among fertilization treatments and to identify the major variables contributing to treatment differences. Figures were prepared using Origin 2021 (OriginLab Corporation, Northampton, MA, USA).

3. Results

3.1. Effects of Different Fertilization Treatments on Soil Aggregate Distribution and Stability

3.1.1. Aggregate-Size Distribution Under Different Fertilization Treatments

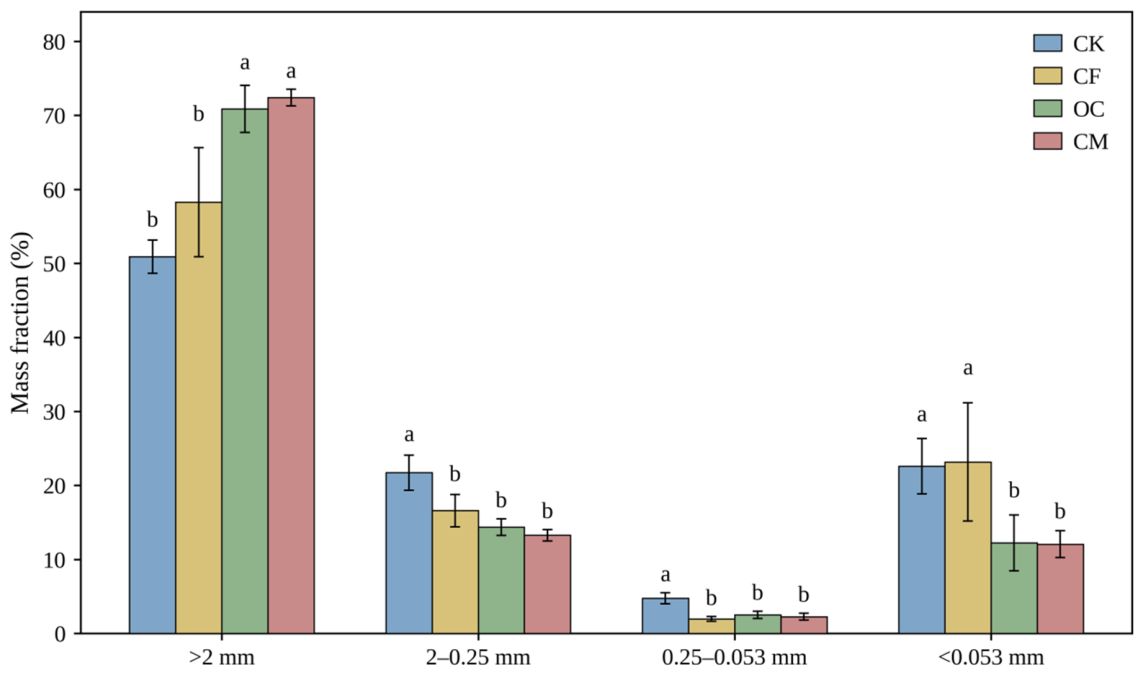
As shown in Figure 1, fertilization altered the distribution pattern of soil aggregate-size fractions. Large macroaggregates (>2 mm) were the dominant fraction under all treatments, and their proportions were significantly higher under OC (70.87%) and CM (72.40%) than under CK (50.90%) and CF (58.27%). In contrast, the proportions of small macroaggregates (2–0.25 mm), microaggregates (0.25–0.053 mm), and the silt + clay fraction (<0.053 mm) generally decreased under organic amendment addition. The silt + clay fraction was reduced to 12.23% and 12.07% under OC and CM, respectively, compared with 22.60% under CK and 23.17% under CF. Overall, combined organic–inorganic fertilization promoted a shift from smaller aggregate fractions to large macroaggregates, indicating improved soil structural organization under organic amendment addition.

3.1.2. Effects of Different Fertilization Treatments on Soil Aggregate Stability

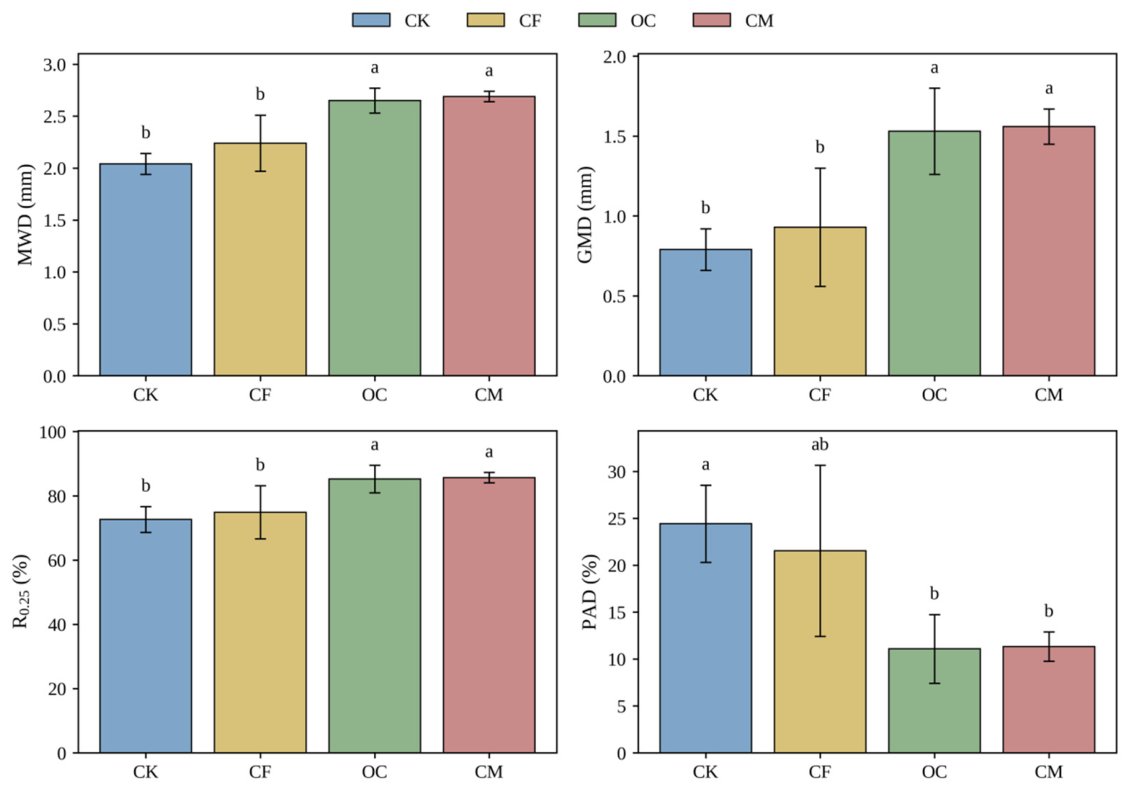
Figure 2 shows clear differences in soil aggregate stability among fertilization treatments. Compared with CK, CF slightly increased MWD and GMD, but the differences were not significant. In contrast, OC and CM significantly increased MWD, GMD, and R0.25, while reducing PAD. The R0.25 values under OC and CM reached 85.23% and 85.67%, respectively, compared with 72.63% under CK and 74.87% under CF. Meanwhile, PAD decreased by 54.61% and 53.57% under OC and CM relative to CK. These results indicate that organic amendment addition enhanced water-stable macroaggregate formation and improved resistance to aggregate breakdown.

3.2. Effects of Different Fertilization Treatments on Aggregate-Associated SOC and TN and Their Contribution Rates

3.2.1. Effects of Different Fertilization Treatments on SOC, TN, and C/N Ratio in Aggregate-Size Fractions

As shown in Table 2, fertilization generally increased SOC and TN contents in all aggregate-size fractions, with a stronger response under combined organic–inorganic fertilization. In large macroaggregates (>2 mm), OC and CM increased SOC contents by 58.30% and 84.83% and TN contents by 141.76% and 200.00%, respectively, compared with CK. CM generally showed the highest SOC and TN contents, especially in large macroaggregates, where TN under CM was significantly higher than that under CF and OC. The C/N ratio was lower under fertilized treatments than under CK across aggregate-size fractions, indicating stronger N accumulation relative to C accumulation. Overall, combined organic–inorganic fertilization enhanced aggregate-associated SOC and TN accumulation, with cattle manure showing a stronger tendency to promote C and N retention within aggregates.

3.2.2. Effects of Different Fertilization Treatments on SOC and TN Contribution Rates in Different Aggregate-Size Fractions

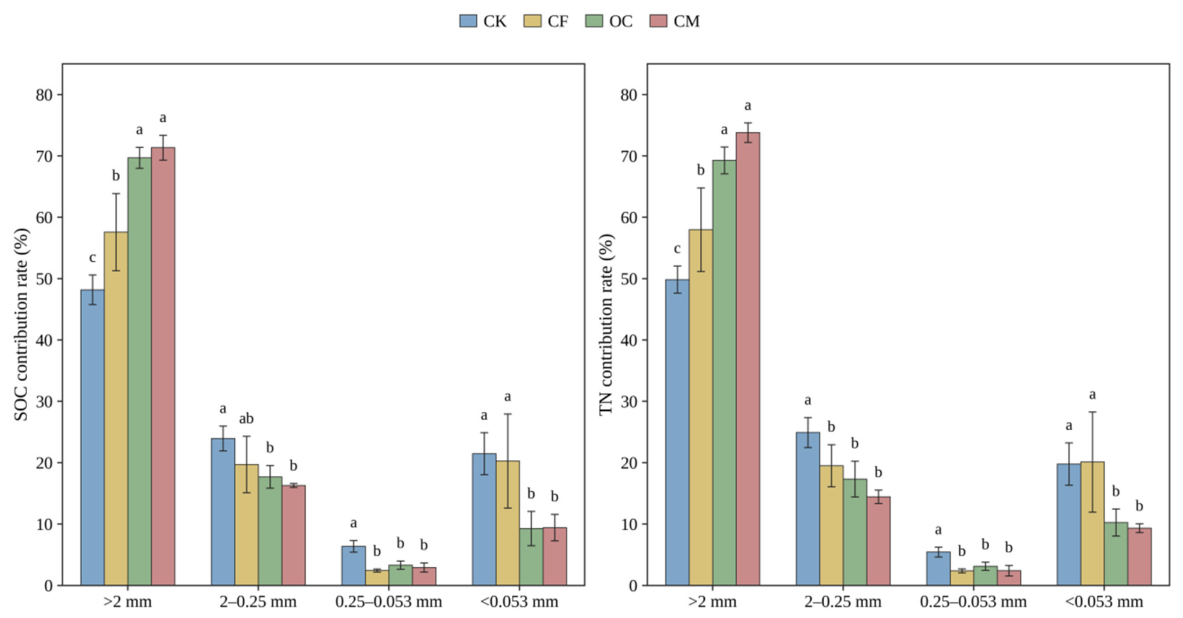
As shown in Figure 3, fertilization significantly altered the contribution patterns of different aggregate-size fractions to SOC and TN. Large macroaggregates (>2 mm) contributed the largest proportion of SOC and TN under all treatments, and their contribution rates were further increased by organic amendment addition. Under OC and CM, the SOC contribution rate of large macroaggregates increased to 69.70–71.35%, and the TN contribution rate increased to 69.28–73.80%, both significantly higher than those under CK and CF. In contrast, the contribution rates of small macroaggregates, microaggregates, and the silt + clay fraction generally decreased under OC and CM. These results indicate that combined organic–inorganic fertilization promoted the redistribution of SOC and TN toward large macroaggregates, thereby strengthening the role of macroaggregates as major carriers of soil C and N retention.

3.3. Effects of Different Fertilization Treatments on Five-Year Wheat Yield and Yield Components

As shown in Table 3, wheat grain yield varied among years from 2021 to 2025, but the response pattern to fertilization was consistent. Fertilization significantly increased wheat yield relative to CK in each year and in the five-year mean. Based on the five-year mean yield, CF, OC, and CM increased wheat yield by 208.09%, 240.78%, and 225.15%, respectively, compared with CK. OC showed the highest numerical five-year mean yield, followed by CM and CF, but no significant difference was detected among the fertilized treatments. In 2025, fertilization also increased effective spikes and kernels per spike; OC had the highest effective spike number, whereas CM had the highest thousand-kernel weight (Table 4). Overall, fertilization was essential for maintaining wheat productivity, while organic amendment addition showed a tendency to improve multi-year yield performance.

3.4. Correlation Analysis Among Soil Aggregate Characteristics, Carbon and Nitrogen Distribution, and Wheat Yield in 2025

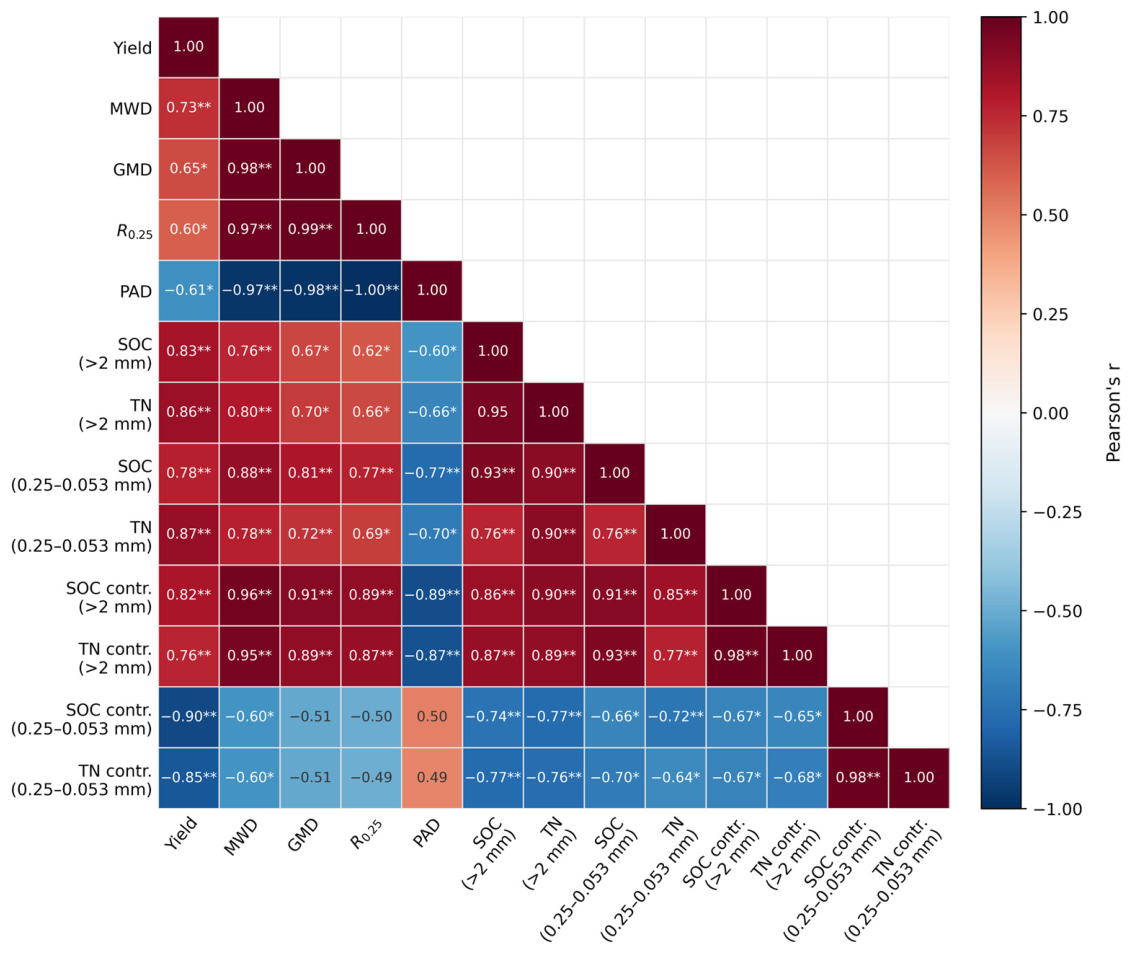
As shown in Figure 4, actual wheat grain yield in 2025 was closely associated with soil aggregate stability and aggregate-associated C and N distribution. Yield was positively correlated with MWD (r = 0.733, p < 0.01), GMD (r = 0.653, p < 0.05), and R0.25 (r = 0.604, p < 0.05), but negatively correlated with PAD (r = −0.612, p < 0.05). Yield was also positively correlated with SOC and TN contents in large macroaggregates (r = 0.827 and 0.860, respectively; p < 0.01) and with their SOC and TN contribution rates (r = 0.822 and 0.758, respectively; p < 0.01). In contrast, yield was negatively correlated with the SOC and TN contribution rates of microaggregates (r = −0.896 and −0.847, respectively; p < 0.01). These results indicate that wheat yield in 2025 was associated with improved aggregate stability and enhanced C and N retention in large macroaggregates. However, these correlations should be interpreted as associations rather than direct evidence of causality.

3.5. Integrated Response of Soil Aggregation, Aggregate-Associated C–N Retention, and Wheat Yield

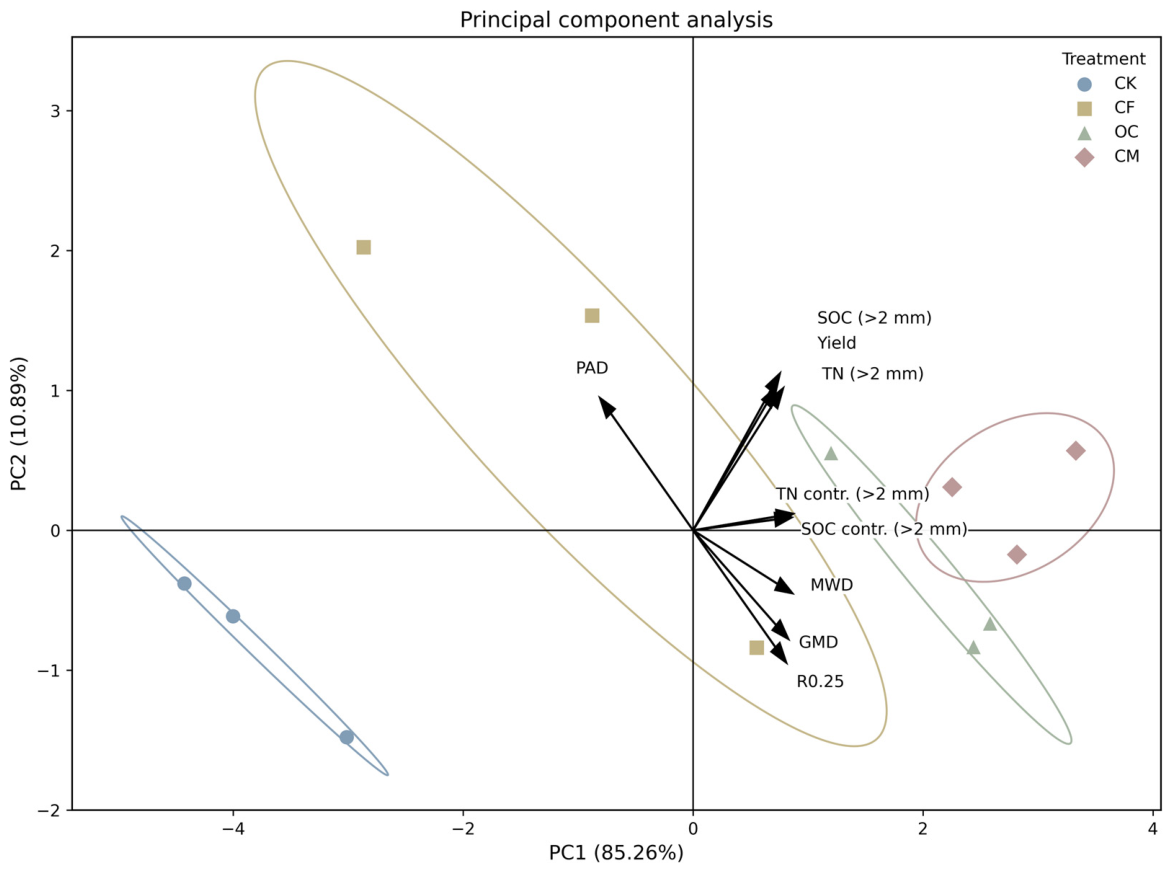
As shown in Figure 5, PCA was used to evaluate the integrated response of soil aggregate stability, aggregate-associated C–N retention, and wheat yield in 2025. The first two principal components explained 96.15% of the total variance, with PC1 and PC2 accounting for 85.26% and 10.89%, respectively. PC1 was positively associated with MWD, GMD, R0.25, SOC and TN contents and their contribution rates in large macroaggregates, and actual grain yield, whereas PAD showed the opposite direction. CK was clearly separated from the fertilized treatments, CF occupied an intermediate position, and OC and CM were mainly distributed on the positive side of PC1. Considering that wheat yield did not differ significantly among CF, OC, and CM, the PCA results suggest that organic amendment addition mainly promoted coordinated improvements in soil structural stability and aggregate-associated C–N retention while maintaining high wheat yield performance.

4. Discussion

4.1. Long-Term Yield Response Under Different Fertilization Treatments

Wheat yield is an important indicator for evaluating the agronomic effectiveness of long-term fertilization strategies. In the present study, the five-year yield data from 2021 to 2025 showed that fertilization significantly increased wheat grain yield compared with the unfertilized control in each year and in the five-year mean. This result indicates that continuous nutrient input is essential for maintaining wheat productivity in the rice–wheat rotation system [19]. However, the differences in grain yield among CF, OC, and CM were not statistically significant, although OC and CM showed numerically higher five-year mean yields than CF. Therefore, the yield results mainly reflected the response to fertilization relative to CK, while the differences among fertilized treatments were not sufficient to confirm a clear yield advantage of organic amendment addition over chemical fertilizer alone.
The lack of significant yield differences among CF, OC, and CM may be related to the sufficient nutrient supply provided by chemical fertilization during the wheat season [20]. Under the present experimental conditions, chemical fertilizer alone supplied the major nutrients required for wheat growth, thereby reducing the apparent yield gap between CF and the organic amendment treatments. Nevertheless, the numerically higher five-year mean yields under OC and CM suggest that organic amendment addition may have potential benefits for maintaining yield performance over time, especially when considered together with the improvements in soil aggregate stability and aggregate-associated carbon and nitrogen retention [21].
The two organic amendments showed different functional tendencies. Oil cake showed the highest numerical five-year mean wheat yield, which may be associated with its relatively high nutrient concentration and faster nutrient release during the wheat growing season [22]. In contrast, cattle manure did not produce the highest five-year mean yield, but it showed stronger effects on SOC and TN accumulation in large macroaggregates. These results suggest that oil cake may be more closely related to yield maintenance through nutrient supply, whereas cattle manure may contribute more to long-term soil fertility improvement through aggregate-associated C and N retention [23]. Therefore, the agronomic value of combined organic–inorganic fertilization should be evaluated not only by direct yield increase, but also by its effects on soil structure, nutrient retention, and yield sustainability.

4.2. Soil Aggregate Stability as Affected by Organic Amendment Source

Soil aggregate stability is a key indicator of soil structural quality and plays an important role in regulating water retention, nutrient supply, aeration, and root growth [24]. In the present study, OC and CM significantly increased the proportion of large macroaggregates and improved aggregate stability indices, including MWD, GMD, and R0.25, while reducing PAD. These results support our first hypothesis that combined organic–inorganic fertilization would improve aggregate stability compared with chemical fertilizer alone. The improvement in aggregate stability may be attributed to the continuous input of organic materials, which provides binding agents for soil particles and promotes the transformation of fine aggregate fractions into macroaggregates [25].
In rice–wheat rotation systems, soil structure is repeatedly affected by seasonal flooding, drainage, drying–wetting alternation, and mechanical disturbance. These processes can accelerate aggregate breakdown and reorganization [26]. Under such conditions, organic material input is particularly important for maintaining aggregate integrity. Chemical fertilizer alone mainly supplies mineral nutrients but contributes little organic binding material to the soil [27]. Therefore, CF showed only a limited effect on aggregate stability, whereas OC and CM more effectively promoted macroaggregate formation and improved resistance to water-induced breakdown.
The two organic amendments showed similar overall trends but differed slightly in their functional emphasis. Oil cake contains relatively high nutrient concentrations and more readily decomposable organic components, which may rapidly stimulate root growth and provide active organic substrates for aggregate formation during the wheat season. In contrast, cattle manure is applied at a much higher rate and contains more slowly decomposable organic materials, which may contribute to more persistent organic binding agents and longer-term structural stabilization [28]. This may explain why CM showed slightly stronger effects on some aggregate stability indicators. Therefore, the improvement of aggregate stability under combined organic–inorganic fertilization was not only related to nutrient input but also to the source, decomposition characteristics, and persistence of the added organic materials.
Overall, these findings indicate that combined organic–inorganic fertilization can improve soil structural quality by increasing water-stable macroaggregates and reducing aggregate destruction. The comparison between OC and CM further suggests that plant- and animal-derived organic amendments may regulate soil aggregation through partly different pathways, with oil cake contributing more to rapid nutrient-associated aggregation and cattle manure contributing more to persistent structural stabilization.

4.3. Aggregate-Associated SOC and TN Allocation Under Different Organic Amendment Sources

Soil aggregates are important physical carriers for SOC and TN retention, and the redistribution of C and N among aggregate-size fractions reflects changes in soil fertility and structural stability [29]. In the present study, combined organic–inorganic fertilization significantly increased SOC and TN contents in different aggregate-size fractions, especially in large macroaggregates. Meanwhile, the SOC and TN contribution rates of large macroaggregates increased under OC and CM, whereas those of microaggregates and the silt + clay fraction decreased. These results support our second hypothesis that organic amendment source would influence aggregate-associated SOC and TN allocation.
The enrichment of SOC and TN in large macroaggregates may be closely related to the increase in macroaggregate proportion under organic amendment treatments [30]. Organic inputs can provide particulate organic matter and binding agents that promote the formation of macroaggregates. Once incorporated into macroaggregates, organic C and N can be partly protected from rapid decomposition through physical occlusion. Therefore, the increase in large macroaggregates under OC and CM not only improved soil structural stability but also provided more favorable physical space for SOC and TN retention.
The two organic amendments showed different tendencies in aggregate-associated C and N accumulation. Compared with OC, CM generally produced higher SOC and TN contents in large macroaggregates, suggesting that cattle manure had a stronger effect on aggregate-scale C and N retention. This may be related to the higher application rate of cattle manure and its relatively slower decomposition characteristics, which can provide more persistent organic substrates for aggregate stabilization and nutrient retention. In contrast, oil cake contains higher nutrient concentrations and more readily decomposable organic components [31], which may favor faster nutrient release during the wheat season but may have a relatively weaker effect on long-term C and N accumulation than cattle manure.
The decrease in C/N ratio under fertilized treatments also indicates that N accumulation in aggregates was enhanced more strongly than C accumulation. This pattern may be associated with long-term mineral N input and the additional N supplied by organic amendments [32]. In particular, the higher TN content in large macroaggregates under CM suggests that cattle manure may be more effective in improving N retention within stable aggregate structures. Therefore, the effect of combined organic–inorganic fertilization was not limited to increasing total SOC and TN contents, but also involved changing the spatial allocation of C and N among aggregate-size fractions.
Overall, these results indicate that large macroaggregates were the major fraction driving SOC and TN accumulation under combined organic–inorganic fertilization. Oil cake and cattle manure both promoted aggregate-associated C and N retention, but cattle manure showed a stronger tendency to enhance SOC and TN accumulation in large macroaggregates. This finding highlights the importance of organic amendment source in regulating soil C and N sequestration at the aggregate scale.

4.4. Linkage Among Soil Aggregation, C–N Retention, and Wheat Yield

The relationship among soil aggregation, aggregate-associated C–N retention, and actual wheat yield in 2025 is central to understanding the agronomic significance of long-term fertilization. In the present study, actual wheat yield in 2025 was positively correlated with MWD, GMD, and R0.25, but negatively correlated with PAD. These relationships indicate that a more stable aggregate structure was associated with higher wheat productivity. Stable aggregates can improve soil porosity, water retention, aeration, and root growth conditions, thereby creating a more favorable soil environment for nutrient uptake and yield formation [33].
In addition to aggregate stability, actual wheat yield in 2025 was positively correlated with SOC and TN contents and their contribution rates in large macroaggregates. This result suggests that yield formation was not only related to nutrient input itself, but also to the physical allocation of C and N within soil aggregates. Large macroaggregates may function as important structural and nutrient-retention units because they provide physical protection for organic matter and create microsites for C and N accumulation [34]. In contrast, the negative correlations between yield and the SOC and TN contribution rates of microaggregates suggest that greater C and N allocation to smaller fractions may reflect weaker macroaggregate development and a less favorable soil structural condition for wheat growth.
These results support the third hypothesis that wheat yield would be positively associated with aggregate stability and SOC/TN enrichment in macroaggregates. However, because the correlation analysis was based on soil properties and actual grain yield measured in 2025, it should not be interpreted as direct evidence that the five-year mean yield was solely determined by aggregate-associated C and N retention. Instead, the results indicate a coupling relationship among soil structural improvement, aggregate-scale C–N retention, and wheat yield formation in the final experimental year. Together with the five-year yield results, this suggests that combined organic–inorganic fertilization can support wheat productivity by improving both nutrient supply and the soil structural–nutrient foundation.
The PCA results further supported the linkage among soil aggregation, aggregate-associated C–N retention, and wheat yield. CK was clearly separated from the fertilized treatments, indicating that fertilization substantially changed the overall soil structure–nutrient–yield relationship. CF occupied an intermediate position, suggesting that chemical fertilizer improved yield relative to CK but had a weaker effect on aggregate-associated C–N retention. In contrast, OC and CM were more closely associated with higher aggregate stability and greater SOC and TN retention in large macroaggregates. Because wheat yield did not differ significantly among CF, OC, and CM, the PCA results suggest that organic amendment addition mainly promoted coordinated improvements in soil structural stability and C–N retention while maintaining high wheat yield performance.

4.5. Limitations and Future Perspectives

Although this study provides evidence that combined organic–inorganic fertilization improves soil aggregate stability, aggregate-associated C and N retention, and wheat productivity in a long-term rice–wheat rotation system, several limitations should be acknowledged. First, this study was conducted at a single long-term experimental site in Chaohu, Anhui Province. Therefore, the results may be influenced by local soil type, climate conditions, cropping system, and fertilization history. Further studies across different soil types and rice–wheat rotation regions are needed to verify the broader applicability of these findings.
Second, although five-year wheat yield data from 2021 to 2025 were included, soil aggregate stability and aggregate-associated SOC and TN characteristics were measured only in the 2025 wheat season. Therefore, the relationships among multi-year yield performance, soil aggregate stability, and aggregate-associated C–N retention should still be interpreted cautiously. Similarly, the PCA provided an integrated evaluation of soil structure, C–N retention, and yield response in 2025, but it should be regarded as exploratory evidence rather than direct proof of causal mechanisms.
Third, this study mainly focused on soil aggregate distribution, aggregate stability, SOC and TN allocation, and wheat yield. However, the mechanisms by which different organic amendment sources regulate soil aggregation and C–N retention may also involve microbial activity, soil enzyme activity, root growth, particulate organic matter, mineral-associated organic matter, and different active carbon fractions [35]. These indicators were not measured in the present study. Future studies should integrate soil biological properties, root traits, and organic carbon fractions to better clarify the mechanisms linking organic amendment source, aggregate formation, C–N stabilization, and crop productivity.
Overall, long-term monitoring and multi-site experiments are needed to further evaluate the effects of plant- and animal-derived organic amendments on soil fertility improvement and yield sustainability. Such information will help optimize organic–inorganic fertilization strategies for sustainable rice–wheat rotation systems.


5. Conclusions

Long-term combined organic–inorganic fertilization improved soil aggregate stability and aggregate-associated C and N retention in the rice–wheat rotation system. Compared with chemical fertilizer alone, oil cake and cattle manure both promoted water-stable macroaggregate formation and enhanced SOC and TN enrichment in large macroaggregates, while maintaining high wheat yield performance. The main difference between the two organic amendment sources was their functional emphasis: oil cake showed a numerical advantage in maintaining wheat yield, whereas cattle manure had greater potential to enhance aggregate-associated SOC and TN accumulation and soil structural stability. PCA further supported this source-dependent response by showing a more coordinated improvement in soil structure and aggregate-scale C–N retention under organic amendment addition. These findings highlight that plant- and animal-derived amendments may play different roles in long-term rice–wheat systems, and that organic amendment source selection should be matched with specific goals, such as yield maintenance or soil fertility improvement.

Author Contributions

Conceptualization, J.W. and Y.L.; methodology, P.W., Y.S. and M.Y.; software, C.L. and M.Y.; validation, Q.M., G.W. and Z.S.; formal analysis, M.Y.; investigation, Q.M.; resources, H.W.; data curation, H.W.; writing—original draft preparation, Y.L. and J.W.; writing—review and editing, J.W.; visualization, C.L.; supervision, M.Y.; project administration, Y.S.; funding acquisition, H.W. All authors have read and agreed to the published version of the manuscript.

Funding

This research was funded by the Key University Science Research Project of Anhui Province (grant no. 2023AH040280), the Open Research Fund of the Anhui Provincial Key Laboratory of Nutrient Cycling and Arable Land Conservation (grant no. 2026YL078), and Anhui Science and Technology University (grant no. XK-XJGY001).

Data Availability Statement

The original contributions presented in the study are included in the article. Further inquiries can be directed to the corresponding authors.

Acknowledgments

The authors would like to thank Teacher Pei Huan for her administrative support, and colleagues in the laboratory for their technical assistance. The authors have reviewed and edited the output and take full responsibility for the content of this publication.

Conflicts of Interest

The authors declare no conflicts of interest.

Abbreviations

The following abbreviations are used in this manuscript:
CKNo fertilization
CFChemical fertilizer only
OCChemical fertilizer plus oil cake
CMChemical fertilizer plus cattle manure
CCarbon
NNitrogen
SOCSoil organic carbon
TNTotal nitrogen
MWDMean weight diameter
GMDGeometric mean diameter
R0.25Proportion of water-stable aggregates > 0.25 mm
PADPercentage of aggregate destruction

References

  1. Nadeem, M.Y.; Zhang, J.; Zhou, Y.; Ahmad, S.; Ding, Y.; Li, G. Quantifying the Impact of Reduced Nitrogen Rates on Grain Yield and Nitrogen Use Efficiency in the Wheat and Rice Rotation System of the Yangtze River Region. Agronomy 2022, 12, 920. [Google Scholar] [CrossRef]
  2. Meng, Q.H.; Zhang, Y.; Ru, Y.; Shi, J.Y.; He, F.; Zhang, N.; Liu, L.J.; Zhang, H. Evolution characteristics and influencing factors of water footprint of food crop production in the middle and lower reaches of the Yangtze River during 1989–2018. Ying Yong Sheng Tai Xue Bao J. Appl. Ecol. 2025, 36, 885–894. [Google Scholar] [CrossRef]
  3. Wang, P.; Yu, A.; Jiang, K.; Pang, X.; Huo, J.; Wang, Y.; Shang, Y.; Hou, S. Green manure incorporation with 20% nitrogen reduction enhances soil organic carbon storage by improving aggregate stability and functional group composition. Agric. Ecosyst. Environ. 2026, 401, 110298. [Google Scholar] [CrossRef]
  4. Li, X.; Li, B.; Chen, L.; Liang, J.; Huang, R.; Tang, X.; Zhang, X.; Wang, C. Partial substitution of chemical fertilizer with organic fertilizer over seven years increases yields and restores soil bacterial community diversity in wheat–rice rotation. Eur. J. Agron. 2022, 133, 126445. [Google Scholar] [CrossRef]
  5. Mustafa, A.; Minggang, X.; Shah, S.A.A.; Abrar, M.M.; Nan, S.; Baoren, W.; Zejiang, C.; Saeed, Q.; Naveed, M.; Mehmood, K.; et al. Soil aggregation and soil aggregate stability regulate organic carbon and nitrogen storage in a red soil of southern China. J. Environ. Manag. 2020, 270, 110894. [Google Scholar] [CrossRef]
  6. He, Y.; Yang, M.; Huang, R.; Wang, Y.; Ali, W. Soil organic matter and clay zeta potential influence aggregation of a clayey red soil (Ultisol) under long-term fertilization. Sci. Rep. 2021, 11, 20498. [Google Scholar] [CrossRef]
  7. Zhao, Z.; Mao, Y.; Gao, S.; Lu, C.; Pan, C.; Li, X. Organic carbon accumulation and aggregate formation in soils under organic and inorganic fertilizer management practices in a rice-wheat cropping system. Sci. Rep. 2023, 13, 3665. [Google Scholar] [CrossRef]
  8. Wu, Y.; Dong, M.; Wang, Y.; Yu, X.; Wang, Z.; Ye, X. The mechanisms of microbial and soil carbon pool responses to soil aggregates improvement by different organic fertilizers. J. Environ. Manag. 2025, 395, 127814. [Google Scholar] [CrossRef] [PubMed]
  9. Ren, L.; Yang, H.; Li, J.; Zhang, N.; Han, Y.; Zou, H.; Zhang, Y. Organic fertilizer enhances soil aggregate stability by altering greenhouse soil content of iron oxide and organic carbon. J. Integr. Agric. 2025, 24, 306–321. [Google Scholar] [CrossRef]
  10. Rahman, M.M.; Kamal, M.Z.U.; Ranamukhaarachchi, S.; Alam, M.S.; Alam, M.K.; Khan, M.A.R.; Islam, M.M.; Alam, M.A.; Jiban, S.I.; Mamun, M.A.A.; et al. Effects of Organic Amendments on Soil Aggregate Stability, Carbon Sequestration, and Energy Use Efficiency in Wetland Paddy Cultivation. Sustainability 2022, 14, 4475. [Google Scholar] [CrossRef]
  11. Mondal, M.M.; Hashem, M.A.; Hoque, M.A.; Rahman, M.E.; Bashar, M.K.I.; Islam, Z.; Hossain, M.S.; Islam, M.R.; Tauhid, M.T.A. Effects of Cotton Oil Cake with Recommended Fertilizer Dose on Nutrient Uptake, Yield Contributing Characters, and Yield of BRRI dhan29 Rice. Asian J. Res. Crop Sci. 2025, 10, 72–87. [Google Scholar] [CrossRef]
  12. Helseth, C.M.; Norton, U. Effects of composted cattle manure and cover crops on winter wheat performance and soil fertility. Soil Sci. Soc. Am. J. 2025, 89, e70040. [Google Scholar] [CrossRef]
  13. Li, Y.B.; Li, P.; Wang, S.H.; Xu, L.Y.; Deng, J.J.; Jiao, J.G. Effects of organic fertilizer application on crop yield and soil properties in rice-wheat rotation system: A meta-analysis. Ying Yong Sheng Tai Xue Bao J. Appl. Ecol. 2021, 32, 3231–3239. [Google Scholar] [CrossRef]
  14. Zhang, X.; Sun, Y.; Wang, W.; Yuan, M.; Wu, G.; Hu, P.; Yang, Y. Organic Manure Partial Replacing Chemical Fertilizer: Effect on Supply Ability and Apparent Budget of Rice Soil Nitrogen. J. Agric. 2018, 8, 28–34. [Google Scholar] [CrossRef]
  15. Elliott, E.T. Aggregate structure and carbon, nitrogen, and phosphorus in native and cultivated soils. Soil Sci. Soc. Am. J. 1986, 50, 627–633. [Google Scholar] [CrossRef]
  16. Tisdall, J.M.; Oades, J.M. Organic matter and water-stable aggregates in soils. J. Soil Sci. 1982, 33, 141–163. [Google Scholar] [CrossRef]
  17. Bao, S.D. Soil and Agricultural Chemistry Analysis; China Agriculture Press: Beijing, China, 2005. [Google Scholar]
  18. Xu, H.; Liu, M.; Tang, Y.; Zhao, F.; Cao, W.; He, M.; Peng, D.; Dai, X. Optimized management strategy increased grain yield, promoted nitrogen balance, and improved water productivity in winter wheat. Front. Plant Sci. 2023, 14, 1182568. [Google Scholar] [CrossRef]
  19. Han, X.; Hu, Z.; Chen, Y.; Qiao, Y.; Liu, D.; Fan, J.; Li, S.; Zhang, Z. Crop yield stability and sustainability in a rice-wheat cropping system based on 34-year field experiment. Eur. J. Agron. 2020, 113, 125965. [Google Scholar] [CrossRef]
  20. Yang, Y.J.; Lei, T.; Du, W.; Liang, C.L.; Li, H.D.; Lv, J.L. Substituting chemical fertilizer nitrogen with organic manure and comparing their nitrogen use efficiency and winter wheat yield. J. Agric. Sci. 2020, 158, 262–268. [Google Scholar] [CrossRef]
  21. Cheng, W.; Bu, R.; Han, S.; Tang, S.; Wang, H.; Li, M.; Zhu, R.; Jiang, F.; Tang, M.; Wu, J. Effects of deep tillage combined with organic amendments application on carbon and nitrogen storage within aggregates and wheat yield. Front. Plant Sci. 2025, 16, 1669580. [Google Scholar] [CrossRef]
  22. Ghasal, P.C.; Choudhary, J.; Dutta, D.; Bhanu, C.; Meena, A.L.; Kumar, L.; Kumar, K.; Mishra, R.P.; Singh, R. Effect of mustard oilcake integration in organic nutrient management on the performance of wheat during conversion period. Indian J. Agron. 2025, 70, 92–96. [Google Scholar] [CrossRef]
  23. Li, P.; Kong, D.; Zhang, H.; Xu, L.; Li, C.; Wu, M.; Jiao, J.; Li, D.; Xu, L.; Li, H.; et al. Different regulation of soil structure and resource chemistry under animal- and plant-derived organic fertilizers changed soil bacterial communities. Appl. Soil Ecol. 2021, 165, 104020. [Google Scholar] [CrossRef]
  24. Hamza, A.; Karčauskienė, D.; Mockevičienė, I.; Repšienė, R.; Tahir, M.A.; Manzoor, M.Z.; Kousar, S.; Lodhi, S.S.; Rasool, N.; Ullah, I. Soil Aggregate Dynamics and Stability: Natural and Anthropogenic Drivers. Agriculture 2025, 15, 2500. [Google Scholar] [CrossRef]
  25. Ma, P.; Nan, S.; Yang, X.; Qin, Y.; Ma, T.; Li, X.; Yu, Y.; Bodner, G. Macroaggregation is promoted more effectively by organic than inorganic fertilizers in farmland ecosystems of China: A meta-analysis. Soil Tillage Res. 2022, 221, 105394. [Google Scholar] [CrossRef]
  26. Liu, S.; Huang, X.; Gan, L.; Zhang, Z.; Dong, Y.; Peng, X. Drying-wetting cycles affect soil structure by impacting soil aggregate transformations and soil organic carbon fractions. Catena 2024, 243, 108188. [Google Scholar] [CrossRef]
  27. Acar, M.; Wahab, T.S.; Kaya Karaca, Ö.; Işık, M.; Sariyev, A.; Ortaş, İ. Exposing How Long-Term Organic and Inorganic Fertilizers Affect the Physical Characteristics of Soil. J. Soil Sci. Plant Nutr. 2025, 25, 5187–5201. [Google Scholar] [CrossRef]
  28. Zhang, Y.; E, S.; Wang, Y.; Su, S.; Bai, L.; Wu, C.; Zeng, X. Long-term manure application enhances the stability of aggregates and aggregate-associated carbon by regulating soil physicochemical characteristics. Catena 2021, 203, 105342. [Google Scholar] [CrossRef]
  29. Niu, Z.; An, F.; Su, Y.; Liu, T.; Yang, R.; Du, Z.; Chen, S. Effect of Long-Term Fertilization on Aggregate Size Distribution and Nutrient Accumulation in Aeolian Sandy Soil. Plants 2022, 11, 909. [Google Scholar] [CrossRef] [PubMed]
  30. Qiu, S.; Hu, C.; Liu, D.; Li, S.; Zhao, S.; Xu, X.; Zhao, Y.; He, P.; Zhou, W. Long-term combined organic manure and chemical fertilizer application enhances aggregate-associated C and N storage in an agricultural Udalfs soil. PLoS ONE 2023, 18, e0276197. [Google Scholar] [CrossRef]
  31. Fu, Y.; Li, G.; Wang, S.; Dai, Z.; Zhang, X. Study on the potential capacity of cake fertilizer agricultural solid emission reduction and soil improvement based on CiteSpace. Front. Plant Sci. 2025, 16, 1400159. [Google Scholar] [CrossRef]
  32. Wang, J.; Sun, X.; Zhang, Y.; Fang, Y.; Zhan, Y.; Guo, R.; Qian, R.; Cai, T.; Liu, T.; Jia, Z.; et al. Soil Aggregates and Aggregate-Associated Carbon and Nitrogen in Farmland in Relation to Long-Term Fertilization on the Loess Plateau, China. Agronomy 2023, 13, 1312. [Google Scholar] [CrossRef]
  33. Sainju, U.M.; Liptzin, D.; Jabro, J.D. Relating soil physical properties to other soil properties and crop yields. Sci. Rep. 2022, 12, 22025. [Google Scholar] [CrossRef] [PubMed]
  34. Li, Y.; Abalos, D.; Arthur, E.; Feng, H.; Siddique, K.H.M.; Chen, J. Different straw return methods have divergent effects on winter wheat yield, yield stability, and soil structural properties. Soil Tillage Res. 2024, 238, 105992. [Google Scholar] [CrossRef]
  35. Wang, J.; Sha, Z.; Qin, Q.; Sun, L.; Sun, Y.; Yang, S.; Xue, Y.; Cao, L. Soil aggregate-associated organic nitrogen pools, enzyme activities, and microbial community fertilized with food waste-derived organic fertilizer. Appl. Soil Ecol. 2024, 202, 105580. [Google Scholar] [CrossRef]
Figure 1. Distribution of soil aggregate size fractions under different fertilization treatments in the wheat season. Notes: CK, no fertilization; CF, chemical fertilizer only; OC, chemical fertilizer plus oil cake; CM, chemical fertilizer plus cattle manure. Soil aggregates were separated into four size fractions: large macroaggregates (>2 mm), small macroaggregates (2–0.25 mm), microaggregates (0.25–0.053 mm), and the silt + clay fraction (<0.053 mm). Values are means ± SD (n = 3). Different lowercase letters indicate significant differences among fertilization treatments within the same aggregate-size fraction according to Duncan’s multiple range test at p < 0.05.
Agronomy 16 01046 g001
Figure 2. Soil aggregate stability indices under different fertilization treatments in the wheat season. Notes: CK, no fertilization; CF, chemical fertilizer only; OC, chemical fertilizer plus oil cake; CM, chemical fertilizer plus cattle manure. Soil aggregates were separated into four size fractions: >2 mm, 2–0.25 mm, 0.25–0.053 mm, and <0.053 mm. MWD, mean weight diameter; GMD, geometric mean diameter; R0.25, proportion of water-stable aggregates with a diameter > 0.25 mm; PAD, percentage of aggregate destruction. Values are means ± standard deviation (SD) (n = 3). Different lowercase letters indicate significant differences among fertilization treatments within the same index according to Duncan’s multiple range test at p < 0.05.
Agronomy 16 01046 g002
Figure 3. SOC and TN contribution rates of different aggregate-size fractions under different fertilization treatments. Notes: SOC, soil organic carbon; TN, total nitrogen; CK, no fertilization; CF, chemical fertilizer only; OC, chemical fertilizer plus oil cake; CM, chemical fertilizer plus cattle manure. Aggregate-size fractions were classified as large macroaggregates (>2 mm), small macroaggregates (2–0.25 mm), microaggregates (0.25–0.053 mm), and the silt + clay fraction (<0.053 mm). SOC contribution and TN contribution represent the percentage contribution of each aggregate-size fraction to total aggregate-associated SOC and TN, respectively. Values are means ± standard deviation (SD) (n = 3). Different lowercase letters indicate significant differences among fertilization treatments within the same aggregate-size fraction according to Duncan’s multiple range test at p < 0.05.
Agronomy 16 01046 g003
Figure 4. Pearson correlation heatmap of wheat yield in 2025, soil aggregate stability indices, and SOC and TN distribution characteristics. Notes: Yield, actual wheat grain yield in 2025; MWD, mean weight diameter; GMD, geometric mean diameter; R0.25, proportion of water-stable aggregates with a diameter > 0.25 mm; PAD, percentage of aggregate destruction; >2 mm and 0.25–0.053 mm represent large macroaggregates and microaggregates, respectively; SOC and TN denote soil organic carbon and total nitrogen contents; SOC contribution and TN contribution denote the contribution rates of each aggregate-size fraction to total SOC and TN, respectively. Values in the cells are Pearson correlation coefficients (r). * and ** indicate significance at p < 0.05 and p < 0.01, respectively.
Agronomy 16 01046 g004
Figure 5. Principal component analysis of soil aggregate stability, aggregate-associated C–N retention, and wheat yield under different fertilization treatments in 2025. Notes: CK, no fertilization; CF, chemical fertilizer only; OC, chemical fertilizer plus oil cake; CM, chemical fertilizer plus cattle manure; MWD, mean weight diameter; GMD, geometric mean diameter; R0.25, proportion of water-stable aggregates > 0.25 mm; PAD, percentage of aggregate destruction; SOC, soil organic carbon; TN, total nitrogen. SOC and TN contents and contribution rates refer to the large macroaggregate fraction (>2 mm). Yield represents actual wheat grain yield in 2025.
Agronomy 16 01046 g005
Table 1. Fertilizer and organic amendment application rates during the wheat growing season.
TreatmentN
(kg·ha−1)
Basal
(%)
Jointing
(%)
P2O5
(kg·ha−1)
K2O
(kg·ha−1)
Oil Cake
(kg·ha−1)
Cattle Manure
(kg·ha−1)
CK0000000
CF1806040609000
OC1806040609022500
CM18060406090030,000
Table 2. SOC content, TN content, and C/N ratio in different aggregate-size fractions under different fertilization treatments.
Aggregate-Size FractionTreatmentSOC (g·kg−1)TN (g·kg−1)C/N
>2 mmCK19.45 ± 0.96 c1.44 ± 0.03 c13.53 ± 0.49 a
CF27.67 ± 2.39 b3.16 ± 0.39 b8.83 ± 1.35 b
OC30.79 ± 1.29 b3.47 ± 0.30 b8.89 ± 0.41 b
CM35.95 ± 2.28 a4.31 ± 0.44 a8.40 ± 0.99 b
2–0.25 mmCK22.68 ± 0.74 d1.68 ± 0.04 b13.47 ± 0.16 a
CF32.79 ± 3.08 c3.72 ± 0.46 a8.93 ± 1.55 b
OC38.49 ± 0.82 b4.26 ± 0.46 a9.09 ± 0.85 b
CM44.85 ± 2.21 a4.63 ± 0.75 a9.93 ± 2.24 b
0.25–0.053 mmCK27.48 ± 0.66 d1.68 ± 0.06 b16.40 ± 0.46 a
CF34.69 ± 1.64 c3.87 ± 0.62 a9.12 ± 1.58 b
OC40.87 ± 1.19 b4.39 ± 0.52 a9.38 ± 0.87 b
CM46.69 ± 1.79 a4.51 ± 1.30 a11.17 ± 4.25 b
<0.053 mmCK19.54 ± 0.90 c1.28 ± 0.05 b15.23 ± 0.50 a
CF24.33 ± 2.67 b2.71 ± 0.02 a8.99 ± 1.01 b
OC23.77 ± 0.92 b3.02 ± 0.15 a7.89 ± 0.43 b
CM28.28 ± 2.76 a3.33 ± 0.73 a8.91 ± 2.99 b
Note: Values are means ± SD (n = 3). Different lowercase letters within the same column and aggregate-size fraction indicate significant differences among treatments at p < 0.05 according to Duncan’s multiple range test.
Table 3. Wheat grain yield from 2021 to 2025 and five-year mean yield under different fertilization treatments.
Treatment2021 Yield
(kg·ha−1)
2022 Yield
(kg·ha−1)
2023 Yield
(kg·ha−1)
2024 Yield
(kg·ha−1)
2025 Yield
(kg·ha−1)
Five-Year Mean
(kg·ha−1)
CK648.15 ± 160.37 b1101.85 ± 256.22 b996.95 ± 153.64 b1182.23 ± 397.99 b2365.94 ± 210.61 b1259.02 ± 62.62 b
CF1722.22 ± 192.95 a4296.30 ± 675.06 a3634.41 ± 75.04 a4318.03 ± 1204.02 a5423.80 ± 180.55 a3878.95 ± 264.75 a
OC2033.33 ± 191.51 a4754.63 ± 495.80 a4332.59 ± 662.03 a4363.55 ± 702.27 a5968.30 ± 527.87 a4290.48 ± 314.10 a
CM1597.22 ± 577.51 a4361.11 ± 764.65 a3896.91 ± 566.77 a5067.08 ± 570.97 a5546.01 ± 443.87 a4093.67 ± 222.32 a
Note: Values for each year are means ± SD (n = 3). Different lowercase letters within the same year indicate significant differences among treatments at p < 0.05 according to Duncan’s multiple range test. The five-year mean was calculated from plot-level annual yield data from 2021 to 2025.
Table 4. Wheat yield components and grain yield in the 2025 wheat season.
TreatmentEffective Spikes
(104·ha−1)
Kernels per Spike1000-Kernel
Weight (g)
Theoretical Yield
(kg·ha−1)
Actual Grain Yield
(kg·ha−1)
CK270.67 ± 27.47 c22.52 ± 2.74 b42.38 ± 0.51 c2566.69 ± 203.12 b2365.94 ± 210.61 b
CF432.00 ± 21.52 b30.99 ± 0.51 a42.91 ± 0.48 bc5739.76 ± 136.16 a5423.80 ± 180.55 a
OC478.33 ± 12.34 a30.51 ± 0.97 a43.74 ± 0.91 ab6390.85 ± 492.15 a5968.30 ± 527.87 a
CM460.00 ± 23.81 ab29.36 ± 0.65 a44.42 ± 0.66 a6001.81 ± 424.74 a5546.01 ± 443.87 a
Note: Values are means ± SD (n = 3). Different lowercase letters within the same column indicate significant differences among treatments at p < 0.05 according to Duncan’s multiple range test.
Disclaimer/Publisher’s Note: The statements, opinions and data contained in all publications are solely those of the individual author(s) and contributor(s) and not of MDPI and/or the editor(s). MDPI and/or the editor(s) disclaim responsibility for any injury to people or property resulting from any ideas, methods, instructions or products referred to in the content.