Article

Developing a Universal Framework for Estimating Soybean Leaf Area Index Growth

State Key Laboratory of Severe Weather, Shenyang Institute of Agricultural and Ecological Meteorology, Chinese Academy of Meteorological Sciences, Beijing 100081, China
*
Author to whom correspondence should be addressed.
Agronomy 2025, 15(9), 2231; https://doi.org/10.3390/agronomy15092231
Submission received: 26 February 2025 / Revised: 2 September 2025 / Accepted: 4 September 2025 / Published: 22 September 2025
(This article belongs to the Section Precision and Digital Agriculture)

Abstract

Leaf Area Index (LAI) is a key variable in modeling plant growth because it is the site of photosynthesis. However, there are significant differences in LAI between different models and between models and satellite-derived estimates. Empirical studies show that LAI is closely related to temperature. The theory provides an alternative method for predicting steady-state LAI. We have implemented this theory in a simple universal model for estimating the growth of the soybean leaf area index (LAI). This study presents a novel, pivotal parameter for assessing plant growth and productivity. We hypothesized that the maximum leaf area index for a specific variety is a constant value. In 2021, a field experiment was conducted at the Liaoning Jinzhou Agricultural Meteorological Experimental Station, where soybean cultivation was manipulated across seven distinct sowing dates, using the local traditional sowing date as a baseline. The model developed in this study demonstrated remarkable accuracy in LAI estimation across various growth stages and environmental conditions. Our findings reveal a robust correlation between the model’s predictions and actual LAI measurements. This model serves as a reliable tool for researchers and agronomists to monitor and predict soybean growth, thereby facilitating more informed decision-making in agricultural management.

1. Introduction

Soybean (Glycine max (L.) Merrill) is a globally significant crop with substantial economic and nutritional value. The demand for soybean in China has been increasing continuously [1]. For a long time, China has heavily relied on international soybean imports. The imports of soybean increased from 10.4 million tons (Mt) in 2000 to 100.3 Mt in 2020. Currently, domestic soybean production only meets about 16% of the national demand, with the rest depending on imports from other countries, mainly the USA, Brazil, and Argentina [2].
The leaf area index (LAI), initially defined by Watson [3], is a dimensionless variable representing the total one-sided area of photosynthetic tissue per unit ground area. It is intrinsically linked to crop development, species diversity, and the climate environment [4,5,6,7]. LAI is a crucial parameter in plant physiological studies and agricultural practices, efficiently applied in monitoring plant photosynthesis, respiration, transpiration, soil respiration, and the energy exchange of the canopy-atmosphere [8,9]. The dynamics of leaf growth and development have long been recognized as vital indicators for crop growth evaluation [10]. Accurate LAI estimation is essential for understanding plant growth dynamics, optimizing crop management, and predicting yield potential. Variations in leaf shape and size reflect environmental adaptability and serve as significant indicators of environmental changes [11,12]. Slow leaf development may crucially limit final crop yields [13,14]. As the primary site for photosynthesis in plants, leaf area size directly affects the interception of light and is essential for crop organic matter and yield formation. A larger leaf area enhances the potential for photosynthesis and higher productivity. Accurate LAI determination can predict crop growth conditions and final yields. LAI is extensively used in research involving plant growth models, energy balance models, climate models, and canopy reflection models, and has been generally applied in fields such as precision agriculture, vegetation health monitoring, and crop yield estimation.
There are two main types of methods that have been developed to obtain LAI, which are indirect and direct methods [15]. The direct measurement of LAI is costly, labor-intensive, and time-consuming [16,17]. Consequently, indirect methods have been developed that relate LAI to the radiation intensity below the canopy via a radiative transfer model [18,19]. Remote sensing method is currently the most important and widely used indirect measurement approach [20]. However, the accuracy of remote sensing for LAI is impacted in agricultural production. The existence of clouds could hinder the sensor’s reception of reflected signals from crops, leading to a decline in data quality. Moreover, it may be impossible to obtain sufficient spatial resolution to capture the heterogeneity of the field, which could lead to imprecise estimates of crop growth conditions, thereby affecting the accuracy of yield predictions. Therefore, a simple and practically applicable leaf area estimation model is necessary.
Temperature, a critical environmental factor, plays a significant regulatory role in plant growth and leaf development [21,22,23]. The effective accumulated temperature refers to the accumulated effective temperature during the growth of crops to a certain stage, which is related to the upper and lower limit temperatures of the biological characteristics of the crops [24]. The effective accumulated temperature can reflect the intrinsic relationship between crop growth and meteorological conditions and describe the crop growth process accurately [25]. Therefore, using the effective accumulated temperature as the independent variable to establish the leaf area index growth model of crops has more biological significance. Currently, nonlinear functions are the primary method for quantitatively describing crop growth dynamics. The sigmoid curve is a typical nonlinear function and is commonly used to quantify plant leaf area index, plant height, and biomass [26,27]. In previous studies, the logistic model and Richards model have been the most commonly used sigmoid nonlinear models in growth analysis, and have been applied to the growth modeling of many crops, including winter wheat, summer maize, tomato, pepper, and pumpkin [28,29,30,31].
However, the logistic equation can only describe the growth process of crop indicators and is unable to analyze the decline process of some indicators in the late growth stages of the crop. Tong [32] proposed a modified logistic equation to describe the growth changes in maize throughout the entire growth period. In this study, we conducted an experiment to (1) explore the impacts of sowing date on LAI of soybean, and to (2) construct a universal model for estimating the growth of soybean LAI throughout the whole growth stage. The proposed model is expected to contribute to the field of precision agriculture by providing a tool that can aid in the timely and accurate assessment of soybean growth, thereby facilitating data-driven decision-making in agricultural management.

2. Materials and Methods

The experiment was conducted in 2021 at the Jinzhou Agricultural Meteorological Experiment Station (121.16~131.92° E, 40.94~48.23° N) in Liaoning, China. The soybean cultivar is “Liaodou 59”. The experimental field was flat and had no obvious obstructions around it. The region has cold dry winters and hot summers and is classified as Dwa in the Köppen–Geiger classification [33]. We used the soybean hybrid “Liaodou 59”, with a plant density of 16.7 plants m−2. Water and fertilizer were provided without restrictions in this experiment. The main experiment was set with 7 soybean sowing dates ranging from T1 to T7 (Table 1 and Figure 1). T3 is the local practical sowing date by farmers. Each sowing date was replicated four times, with each plot covering an area of over 30 m2 and a protective interval of 0.5 m left between plots. For each treatment, the entire growth period of the soybean was ensured to be unrestricted by water factors and free from the impact of diseases and pests.
Independent soybean experiments were also conducted in the Agricultural Meteorological Experiment Stations of Huangfan in Henan province, Suzhou in Anhui province, and Jinzhou. The soybean varieties were “Fandou 9”, “Wansu 1208”, and “Liaodou 15”, respectively, in the three places. The sowing time of soybeans was the same as the local time. Water and fertilizer were provided without restrictions in this experiment.

2.1. Experimental Design and Data Collection

All data are derived from experimental observations. The growth stages of soybeans are as follows: sowing, emergence, three-leaf, branching, flowering, podding, grain filling, and maturity. Measurements of leaf area are conducted at the three-leaf stage, 10 days after the three-leaf, branching, 10 days after branching, 20 days after branching, 30 days after branching, flowering, podding, 10 days after podding, and grain filling. In each plot, three plants are randomly selected to measure the length (L, m) and maximum width (M, m) of all green leaves with a ruler. The actual planting density (D, plants/m−2) of soybeans is measured and recorded at the three-leaf stage and maturity stage.

2.2. Statistics

2.2.1. Leaf Area and LAI

The leaf area of soybean was the product of leaf length (L, m) and maximum width (M, m), then multiplied by a correction coefficient (k) of soybean leaf with a value of 0.72 [34]:
L A = k × L × M .
LAI was calculated as following:
L A I = i = 1 m j = 1 n L A i j m × D ,
where m represents the number of sampling plants, n represents the total number of leaves on the ith soybean plant; D (plants m−2) is the density of soybean plants.

2.2.2. Effective Accumulated Temperature

The effective accumulated temperature Tc (°C·d) for soybeans refers to the sum of effective temperatures above the biological zero degree during a certain growth period:
T c = i = 1 n   T i B .
Ti represents the average daily temperature (°C) on the ith day, B is the biological zero degree for soybeans (10 °C for soybean), and n is the number of days after soybean sowing.

2.2.3. Characteristics of Leaf Area Index Growth

The time course of leaf area index can be divided into four stages during the growth and development process, namely the slow growth period, the rapid growth period, the relatively stable period, and the decline period. The change process presents a unimodal bell shape. Yin et al. [35] proposed a three-parameter growth equation with an initial value of zero:
L A I = L m   1 + t e t t e t m   t t e t e t e t m ,
C m = L m 2 t e t m t e   t e t m   t m t e t m t e t m ,
where LAI is the value of LAI. Lm is the maximal value of LAI, and te is the time at which this maximum was reached. Cm is the maximum growth rate of LAI and tm is the time at which this maximum growth rate was reached.

2.2.4. Modified Logistic Model Estimating Leaf Area Index

Based on the flowering stage as a boundary, the soybean growth period is divided into the vegetative stage and the reproductive stage, with the corresponding effective accumulated temperature above 10 °C represented by Te1 and Te2, respectively. Different varieties of soybean have varying lengths of growth periods, and consequently, their accumulated temperature values also differ. Therefore, it is necessary to standardize the effective accumulated temperature above 10 °C for different soybean varieties during their growth periods. The calculation formula is as follows:
A e 1 = i = 1 n   T i B ,
A e 2 = i = n + 1 n   T i B ,
R A e i = T e 1 m a x T e 1 1 + T e 2 m a x T e 2 ,
where Ti represents the average daily temperature on the ith day (°C), B is the biological zero point for crops (for soybean, B is taken as 10 °C), n and m are the number of days from emergence to flowering and from emergence to maturity of soybean, respectively (days), Te1 is the effective accumulated temperature from emergence to flowering (°C·days), Te2 is the effective accumulated temperature from flowering to maturity (°C·days), maxAe1 is the maximum value of effective accumulated temperature from emergence to flowering among at a certain station (or for a certain variety) (°C·days), maxAe2 is the maximum value of effective accumulated temperature from flowering to maturity (°C·days), and RAei is the relative value of effective accumulated temperature from emergence to the ith day for soybean. After processing, the relative values of effective accumulated temperature for the emergence to flowering period at each station range from 0 to 1 (dimensionless), and the relative values for the flowering to maturity period range from 1 to 2 (dimensionless).
The relative leaf area index (RLAI) of soybean could be estimated by the relative values of effective accumulated temperature during two growth stages with the modified Logistic equation:
R L A I i = k 1 + e x p ( a + b R A e i + c R A e i 2 ) ,
where k, a, b, and c are all fitting parameters. The fit is performed using the Nonlinear Least Squares (nls) module in R software (version 3.5.0).

3. Results

3.1. Development Stages of Soybean Under Different Planting Dates

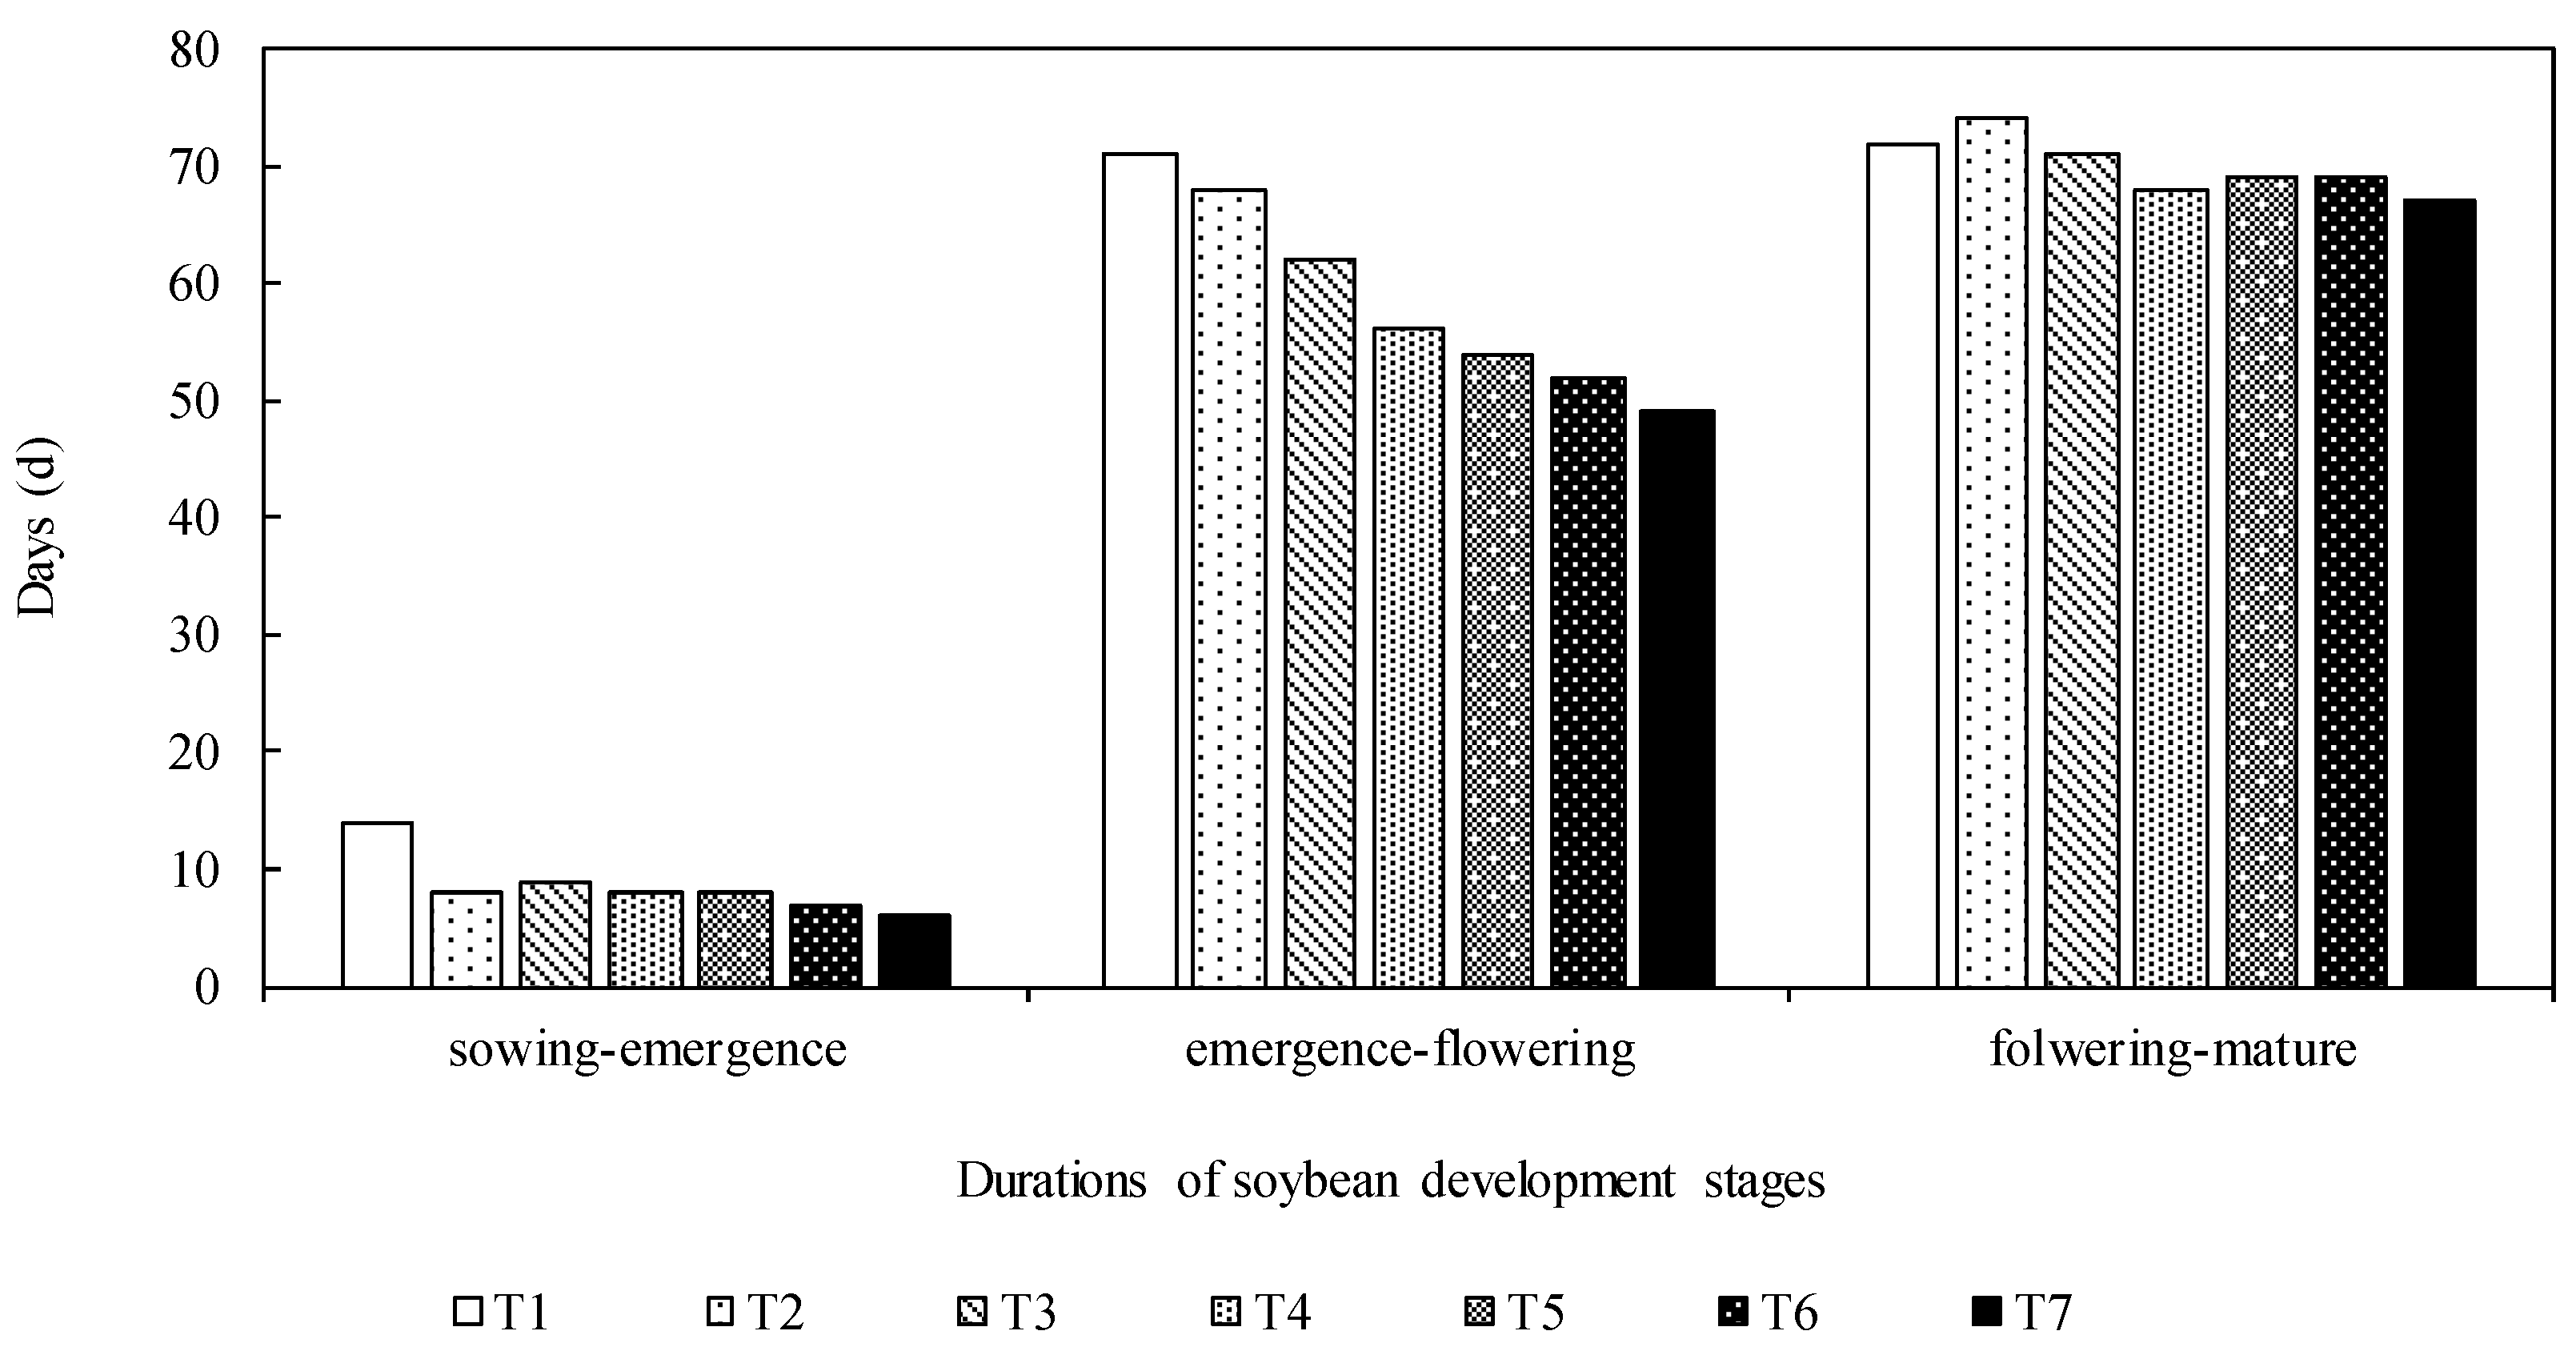
The growth and development cycle of soybean planted at different times remains between 122 and 157 days (Figure 2). The total growth period of soybean was shortened with the planting date delayed. With the delay in sowing date, the duration from sowing to emergence becomes shorter for 1–6 days, especially with a significant difference between the first and second sowing dates. The main reason may be that an earlier planting date coincides with lower soil temperatures, which affect the emergence of soybean. The duration from emergence to flowering also significantly decreases with delayed planting dates. The duration from emergence to flowering of T1 was 71 days, while it was reduced to 49 days of T7. The duration from flowering to maturity shows no significant difference under different sowing dates.

3.2. LAI of Soybean

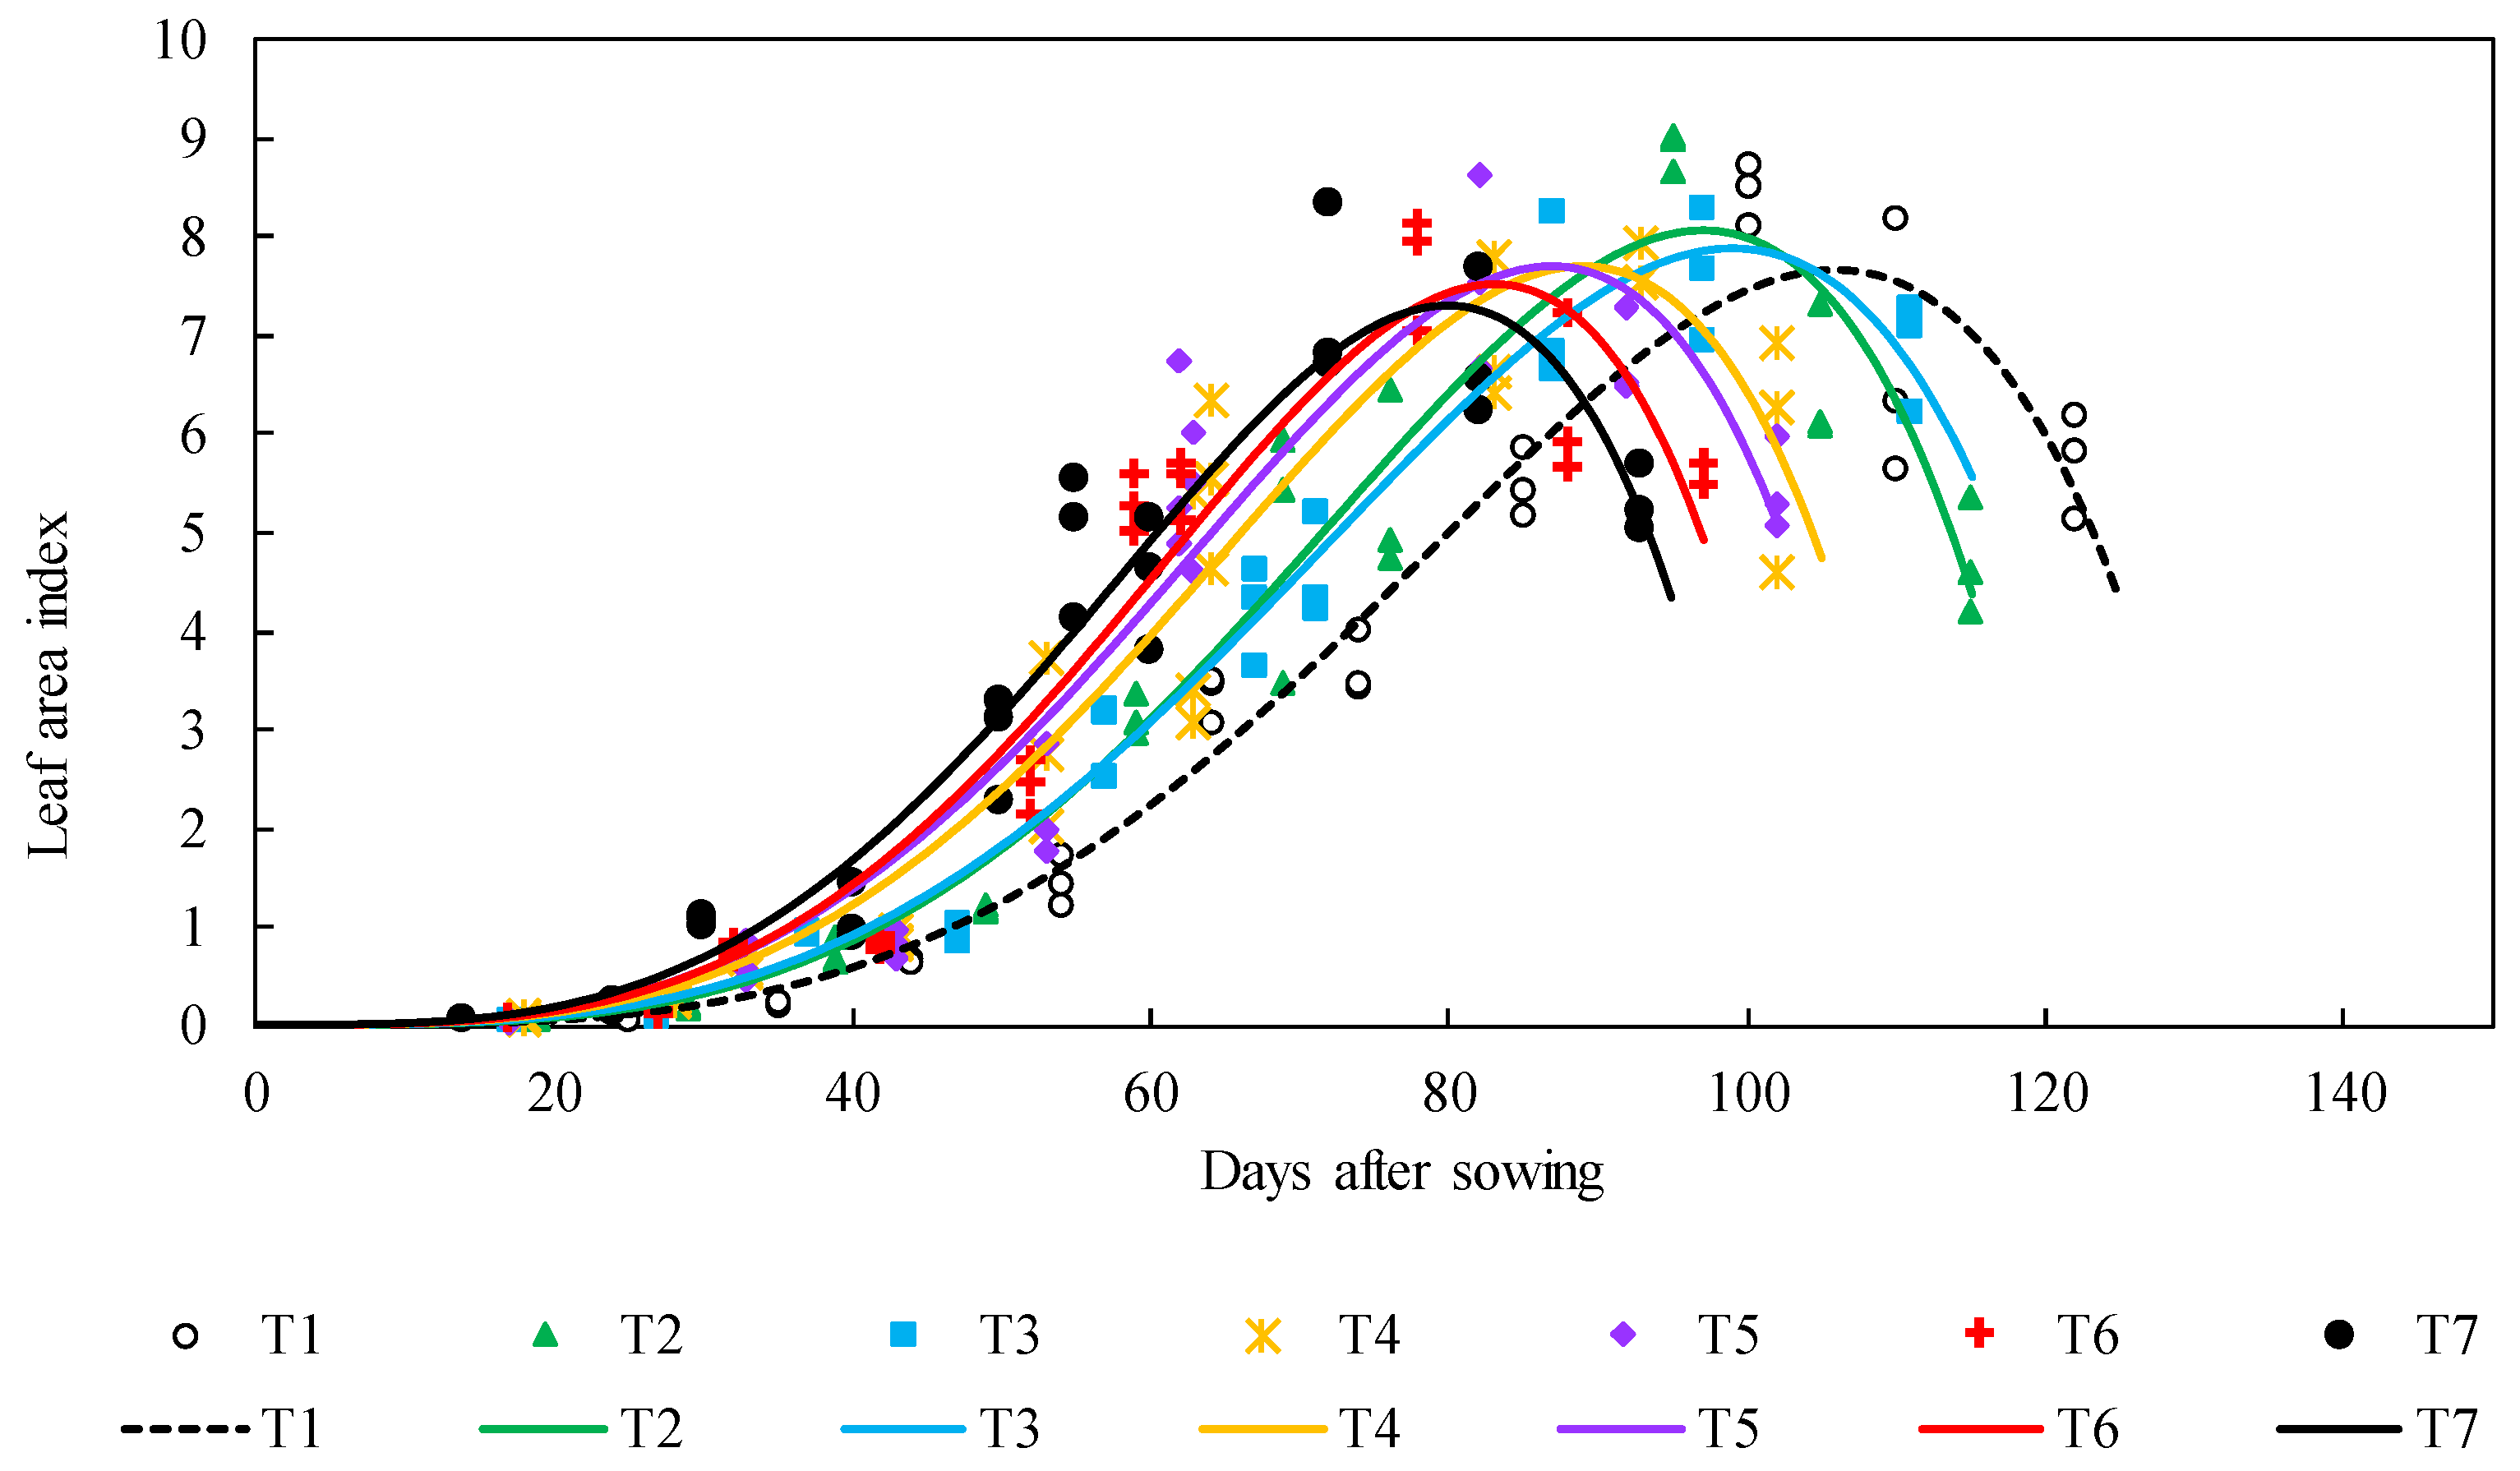
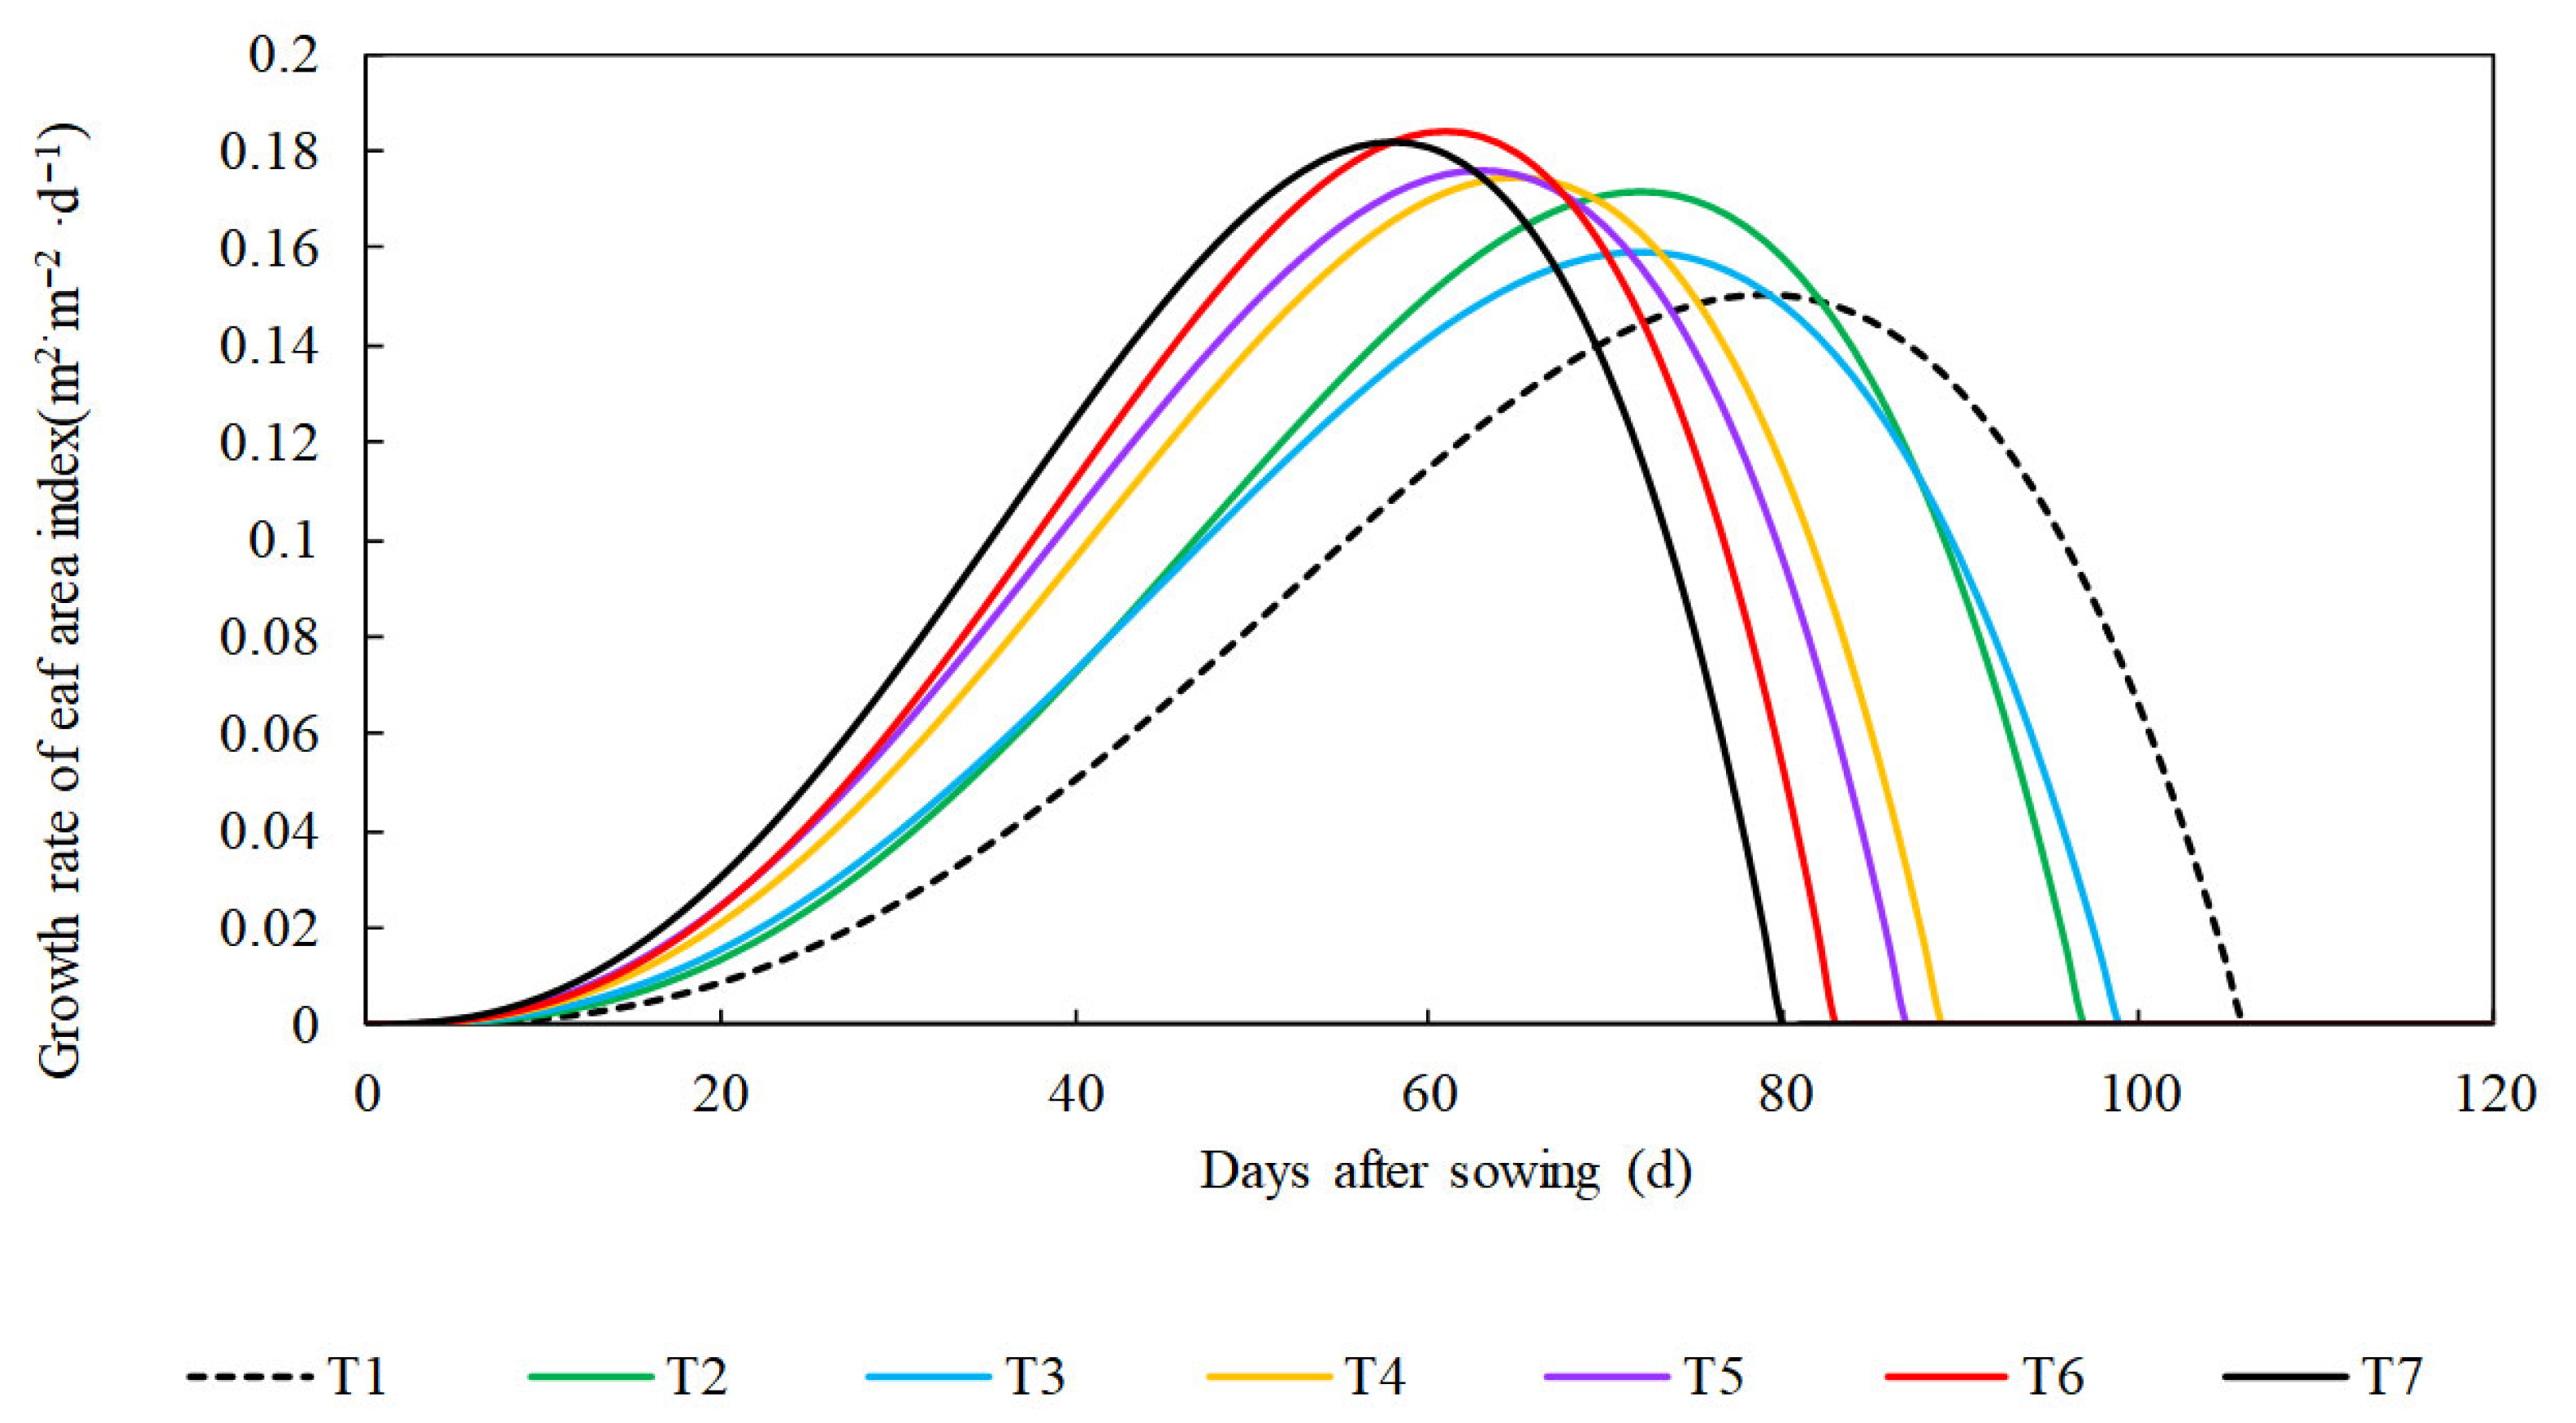
The growth of the leaf area index under different sowing dates was fitted using the beta equation (Equations (4) and (5)). The relationship between the days after sowing and the leaf area index varied with sowing dates (Figure 3). The growth process of the leaf area index conforms to the beta curve. Under a consistent condition of variety and location, adjusting the sowing date has led to significant changes in the growth and development process of soybean leaves. The maximum leaf area index decreases with the delay of the sowing date from T2 to T7. However, the maximum leaf area index of T1 is lower than that of T2, which may be due to the excessively early timing of T1. The external environmental temperature is not suitable for the growth of soybeans, thus limiting the growth of the leaves. The time (tm) reaching the maximum leaf area index advances with the delay of the sowing date (Figure 3). The days reaching the maximum leaf area index (tm) is 79 days after sowing at T1, while it was 58 days at T7. The difference in tm is mainly due to the variation in the growth rate of the leaf area. The maximum growth rate of the leaf area index increases with the delay of the sowing date. Before reaching the maximum growth rate of LAI, the growth rate of the LAI increases with the delay of the sowing date (Figure 4).

3.3. Universal Model of Soybean Leaf Area Index

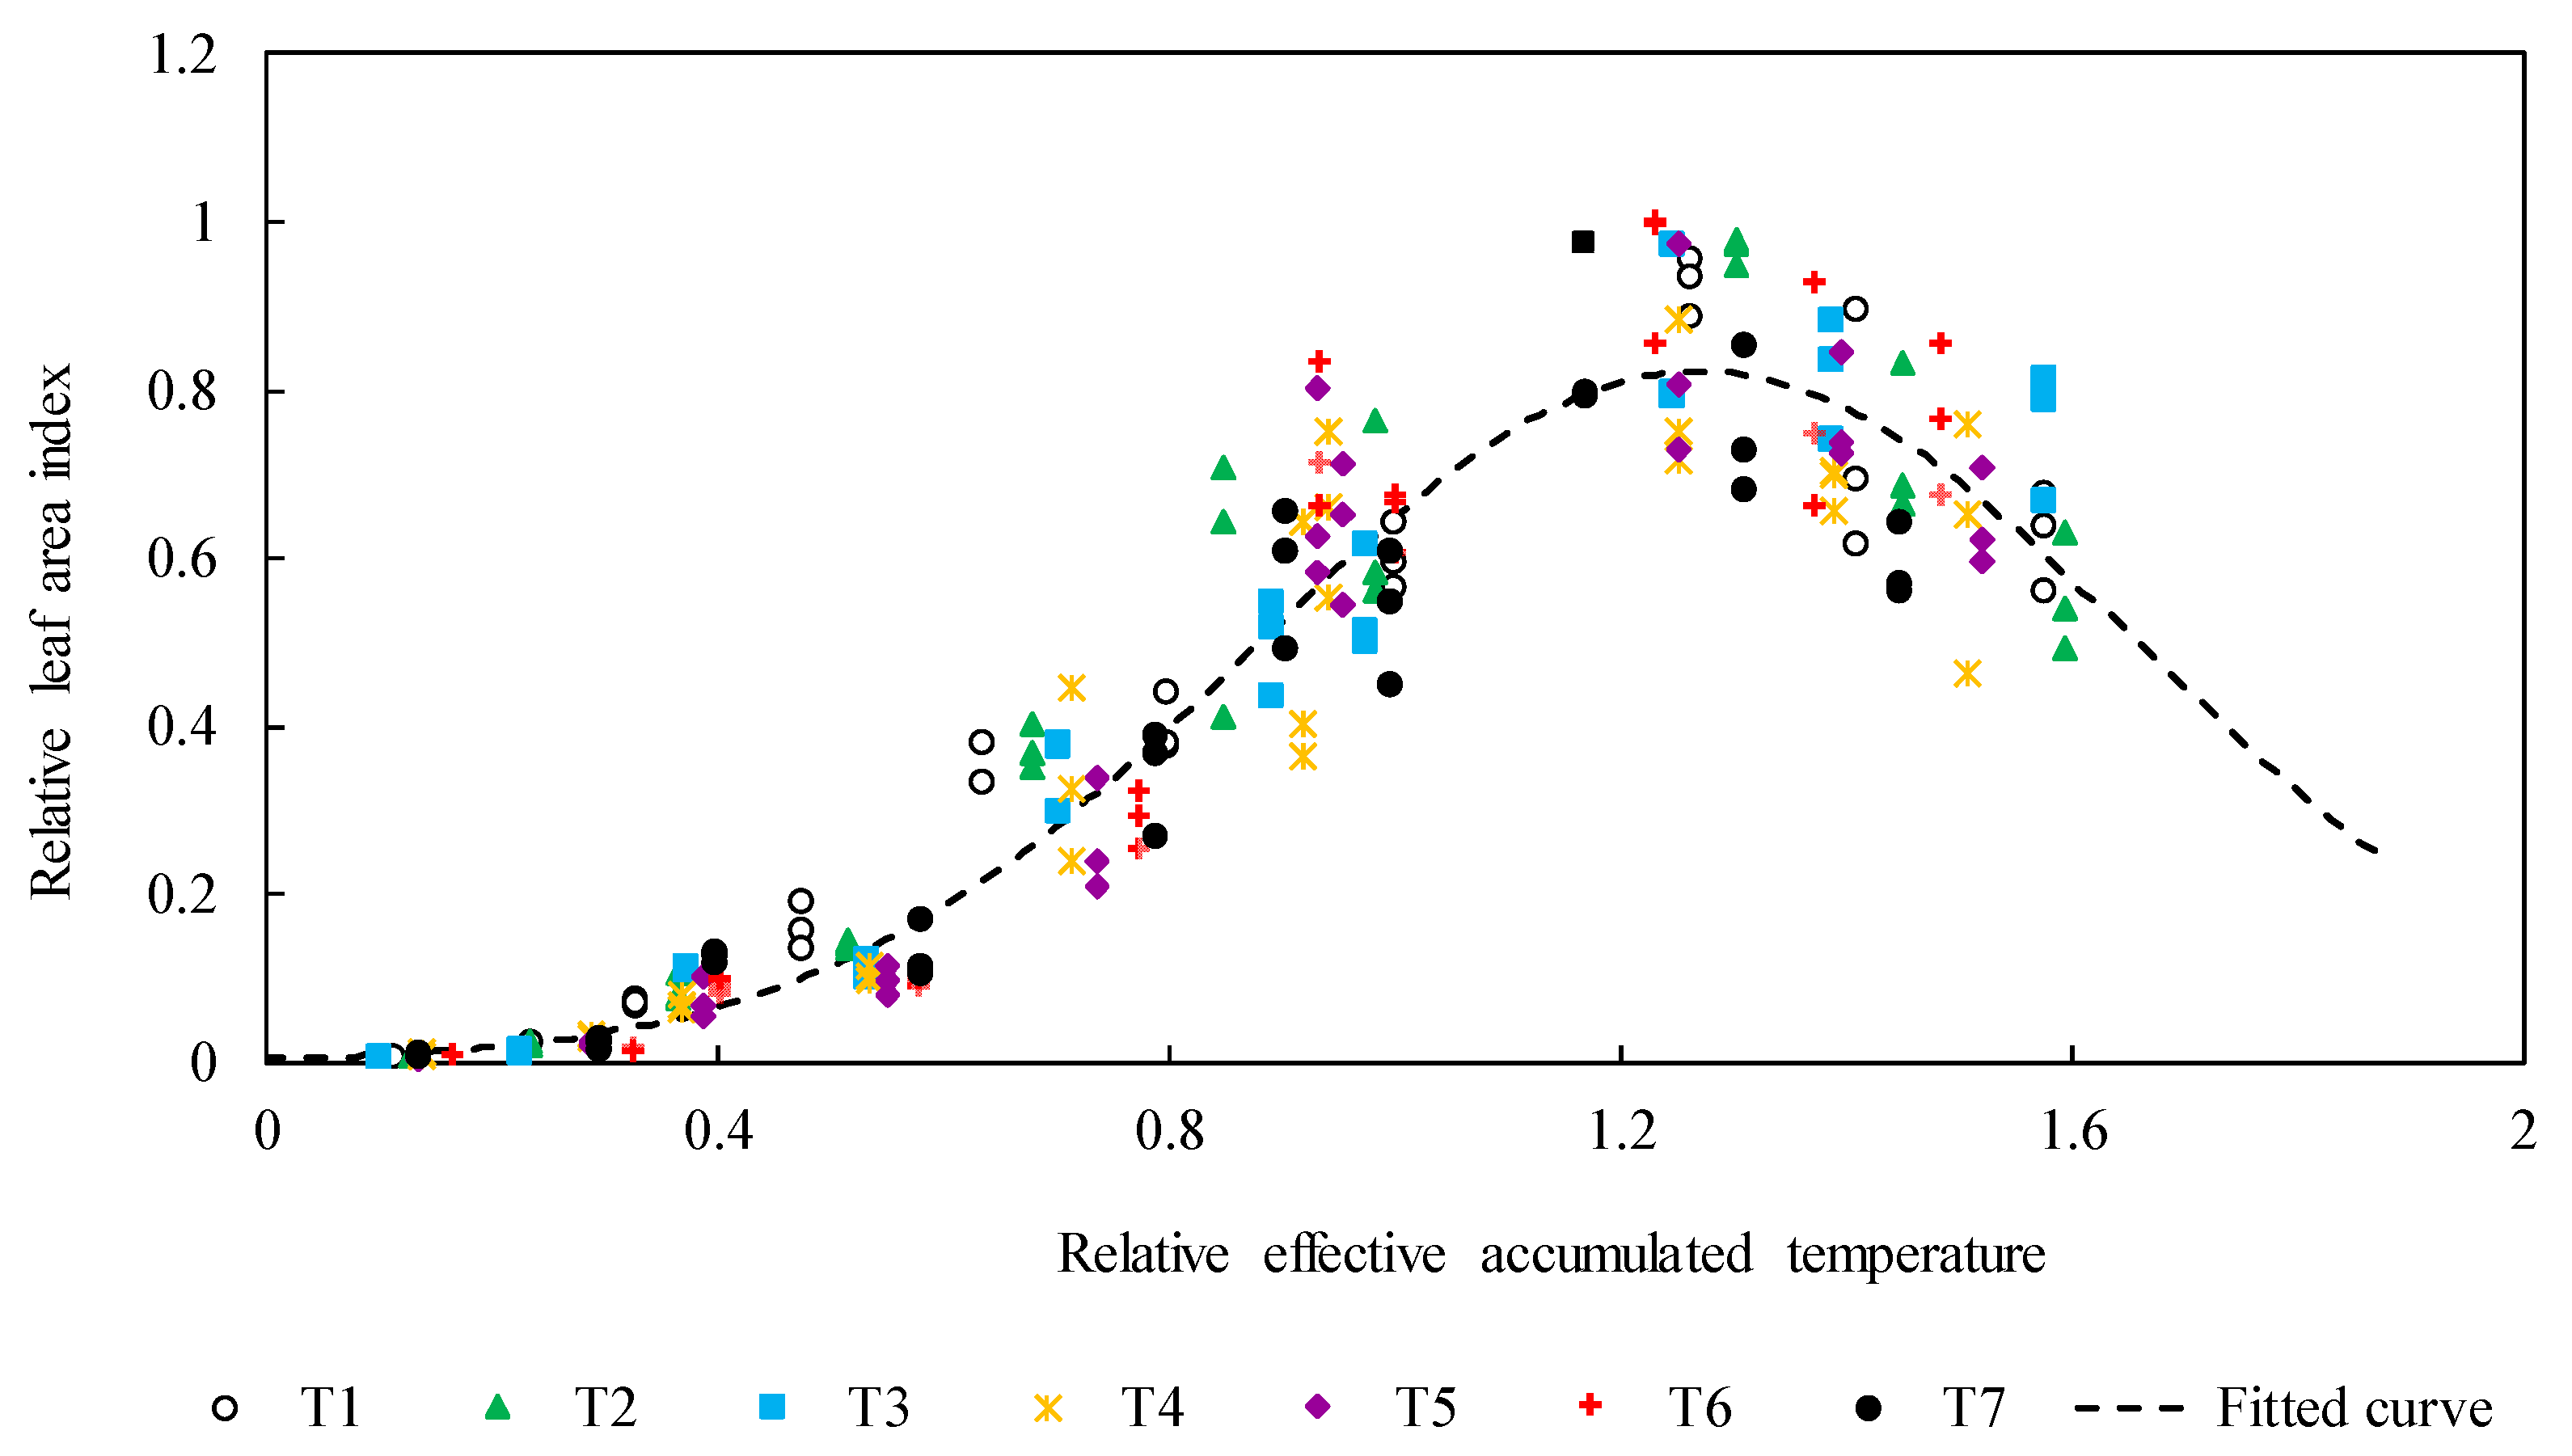
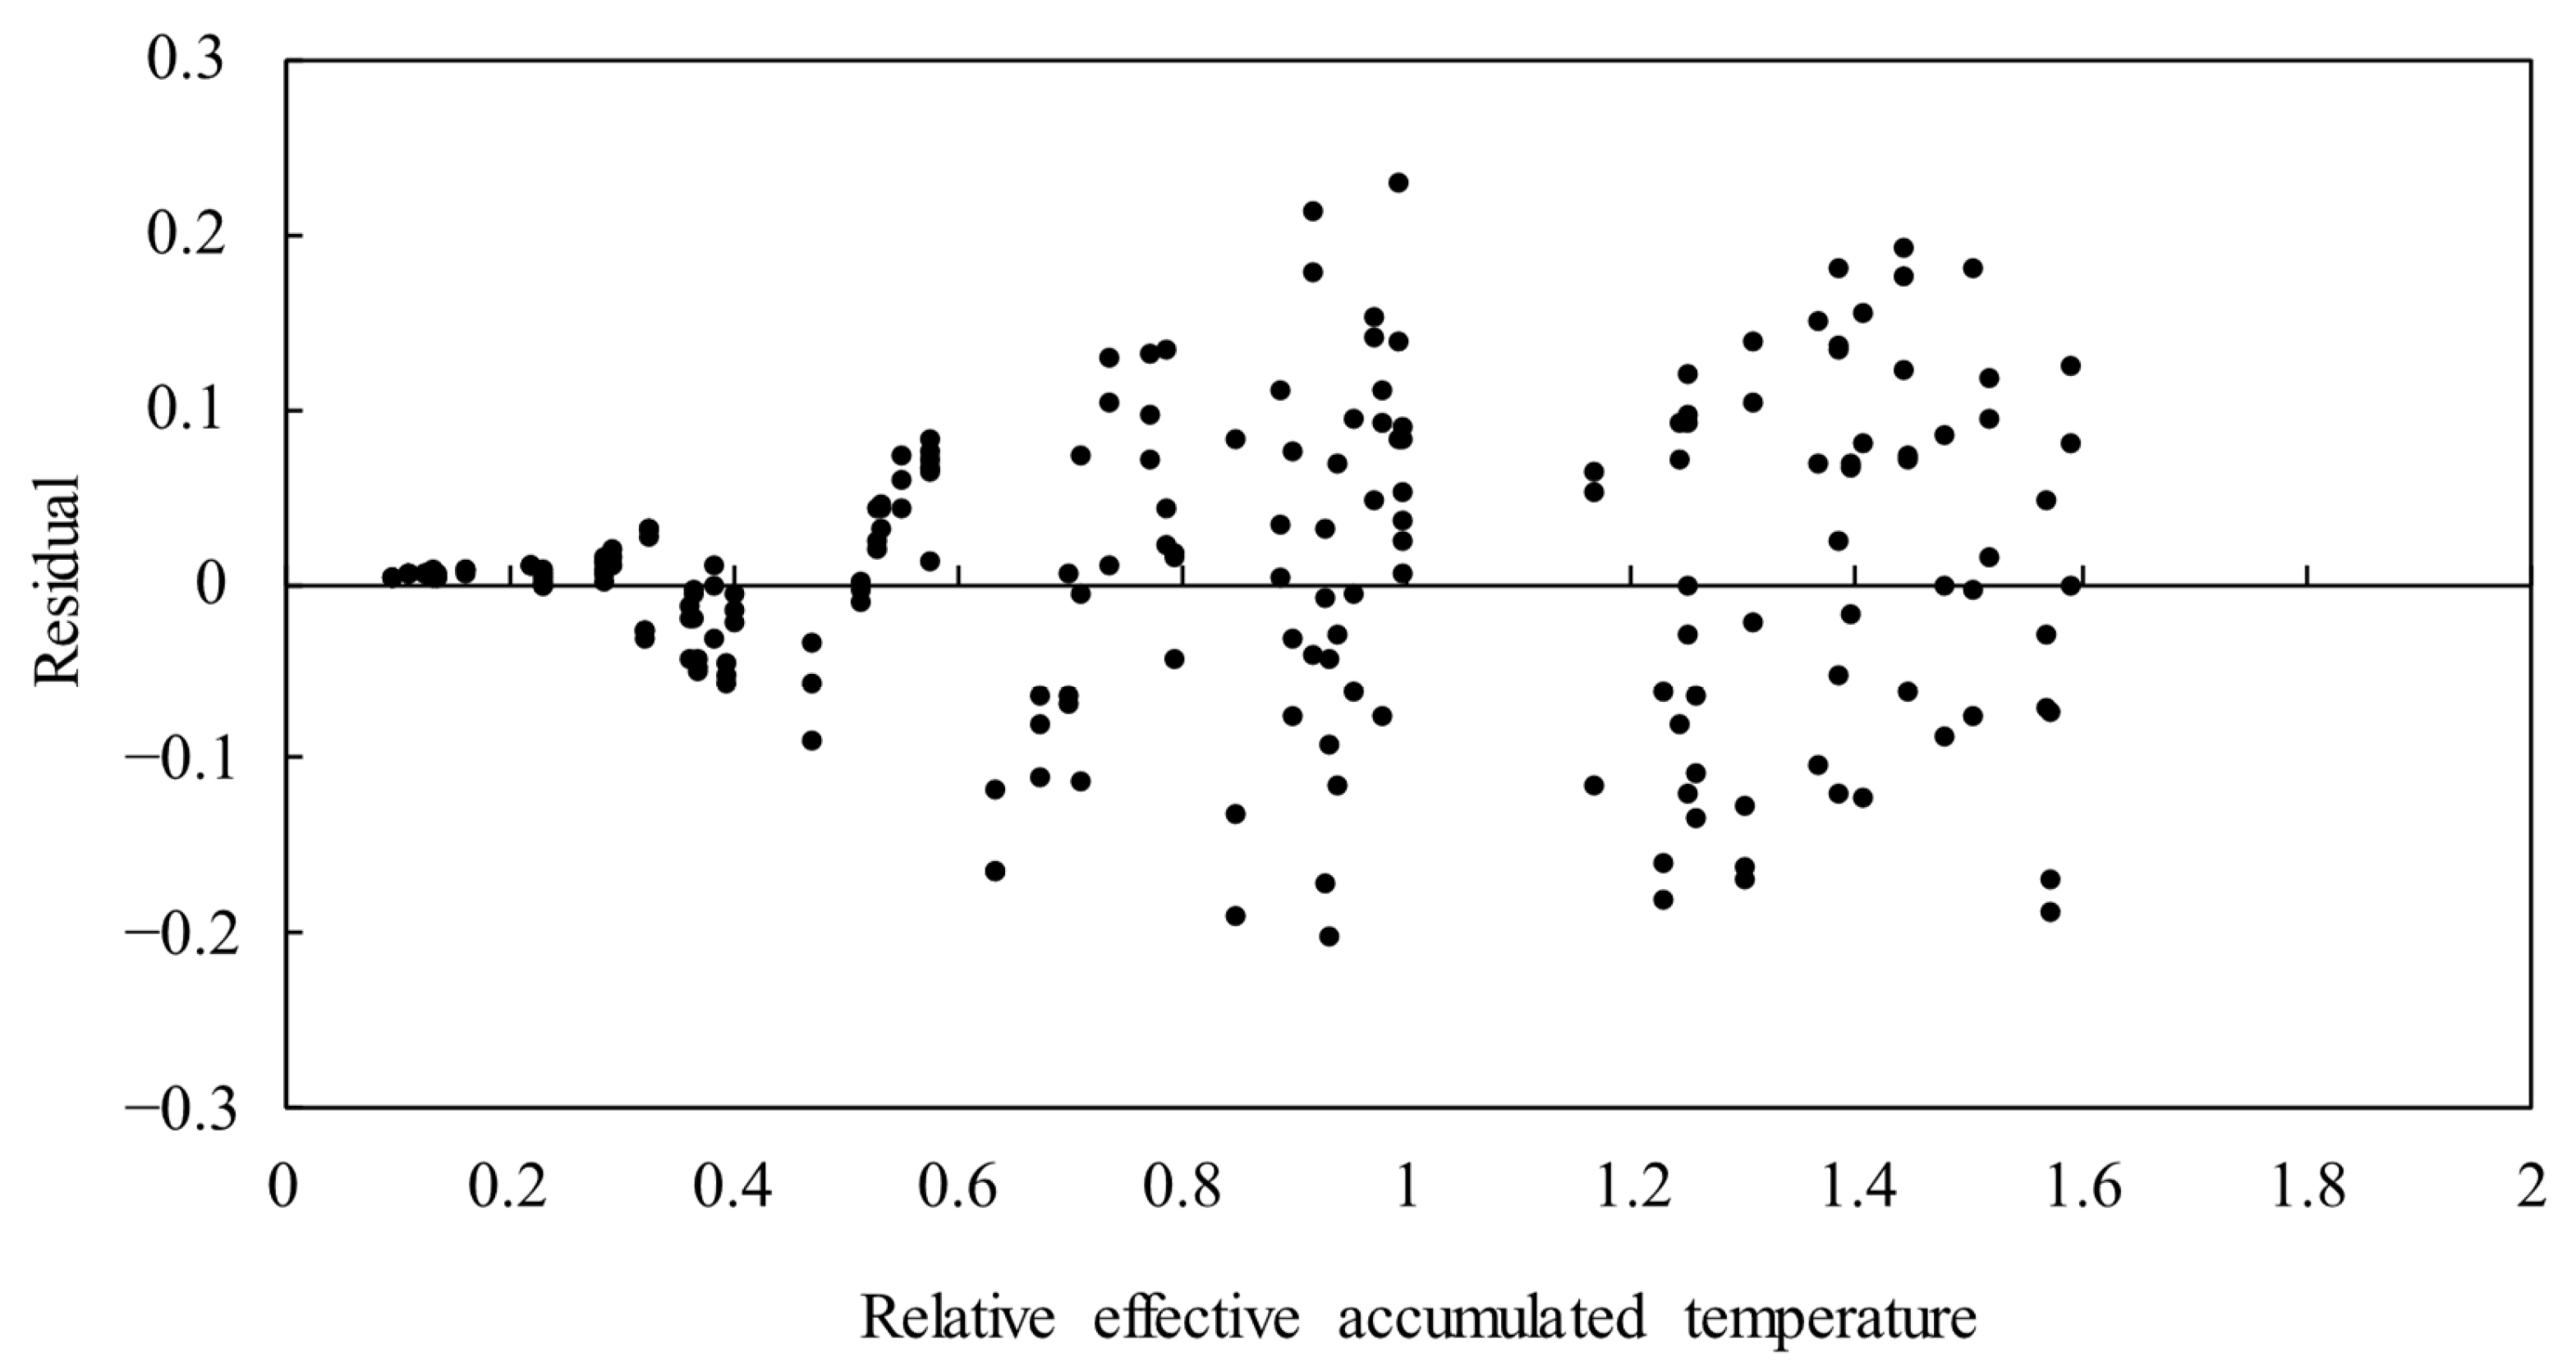
During the growth process of soybeans, the relative values of leaf area index and effective accumulated temperature fully conform to the modified logistic curve (Equation (8)). The determination coefficient of the fitting equation reaches 0.93, and the correlation coefficient has passed the significance test at the 0.01 level (Table 2). The results revealed that the relationship between RLAI values and relative effective accumulated temperature is generally not affected by the sowing period (Figure 5, Table 2). During the growing period, the measure values were basically distributed on both sides of the fitted curve. The residual fitting results are evenly distributed around zero (Figure 6), indicating high accuracy and reliability of the fitting results without significant systematic errors.

3.4. Validation of the Universal Model for Soybean Leaf Area Index

3.4.1. Back-Substitution Test

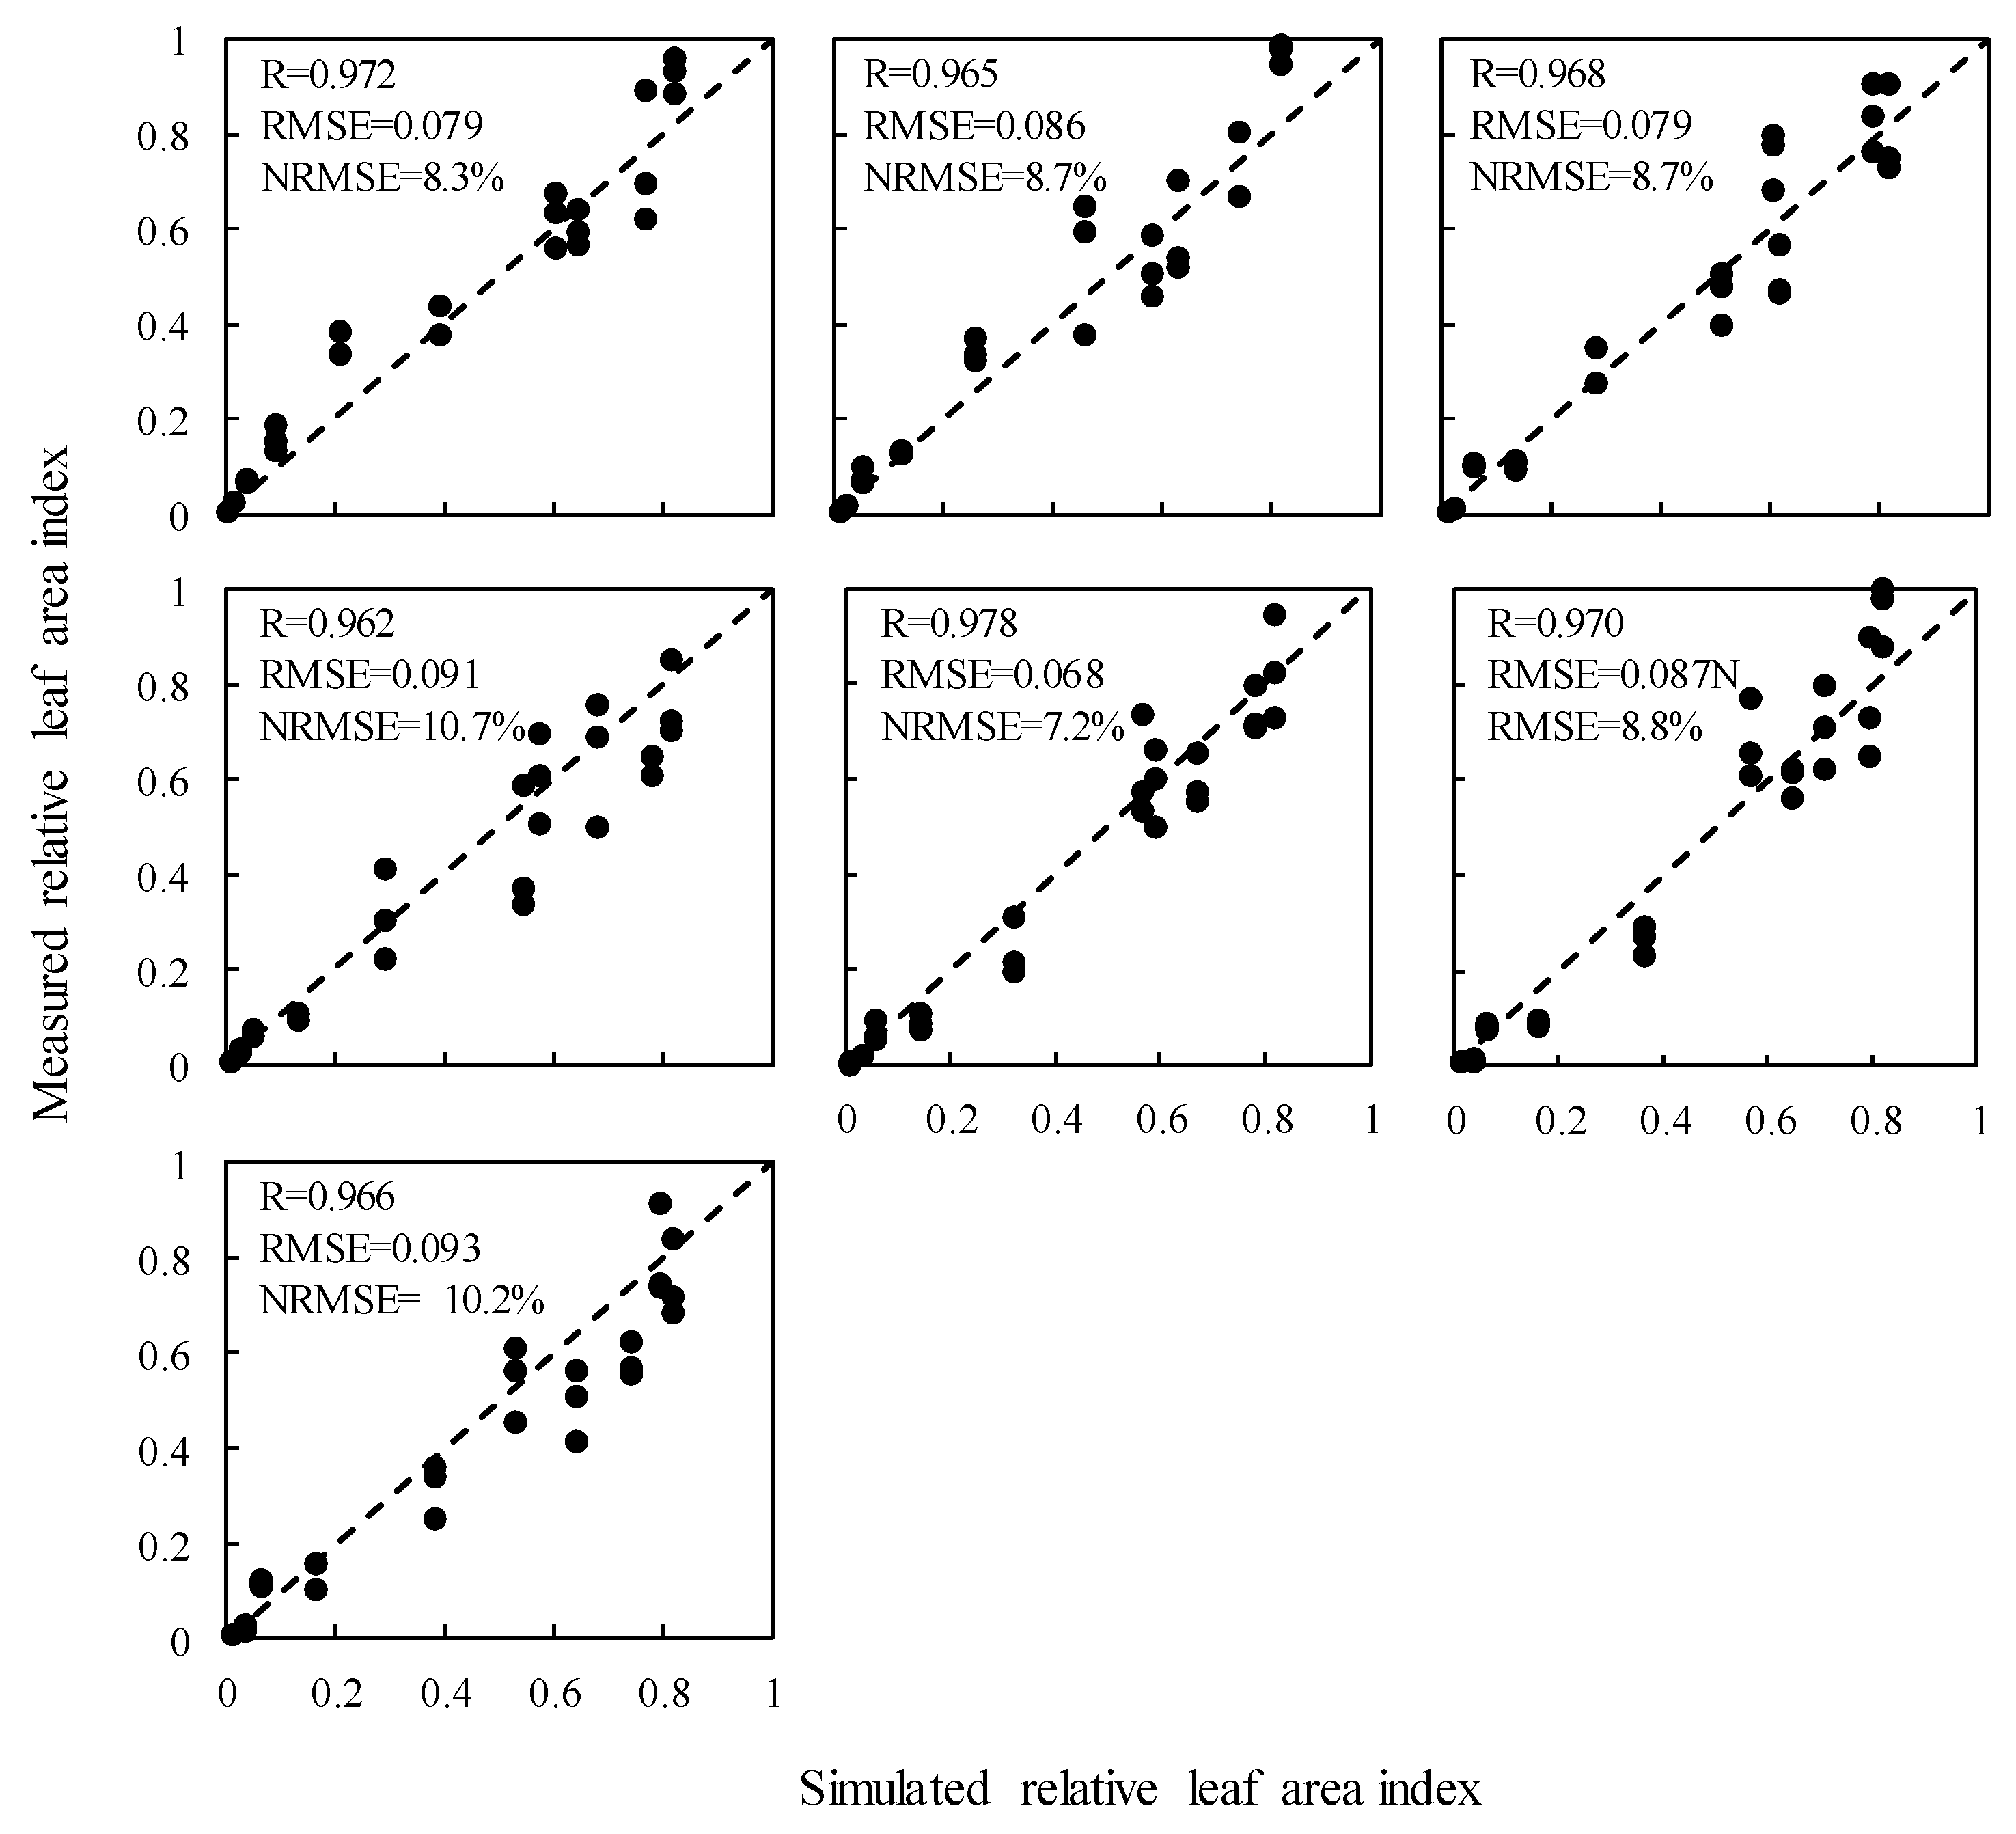
The back-substitution test was conducted using the data from seven sowing date experiments with the universal model. The measured relative effective accumulated temperature was used as the independent variable, and simulations were carried out based on the parameters in Table 2. The calculated fitted values of the relative leaf area index were compared with the actual measured values, as shown in Figure 7. The simulated values of the relative leaf area index for soybeans at different sowing dates maintained a high degree of consistency with the actual measured values, with all correlations exceeding 0.96. The lowest correlation coefficient was 0.962 for the fourth sowing date, while the highest was 0.978 for the fifth sowing period. The result indicated that the universal model for soybean had high credibility.

3.4.2. Independent Sample Validation

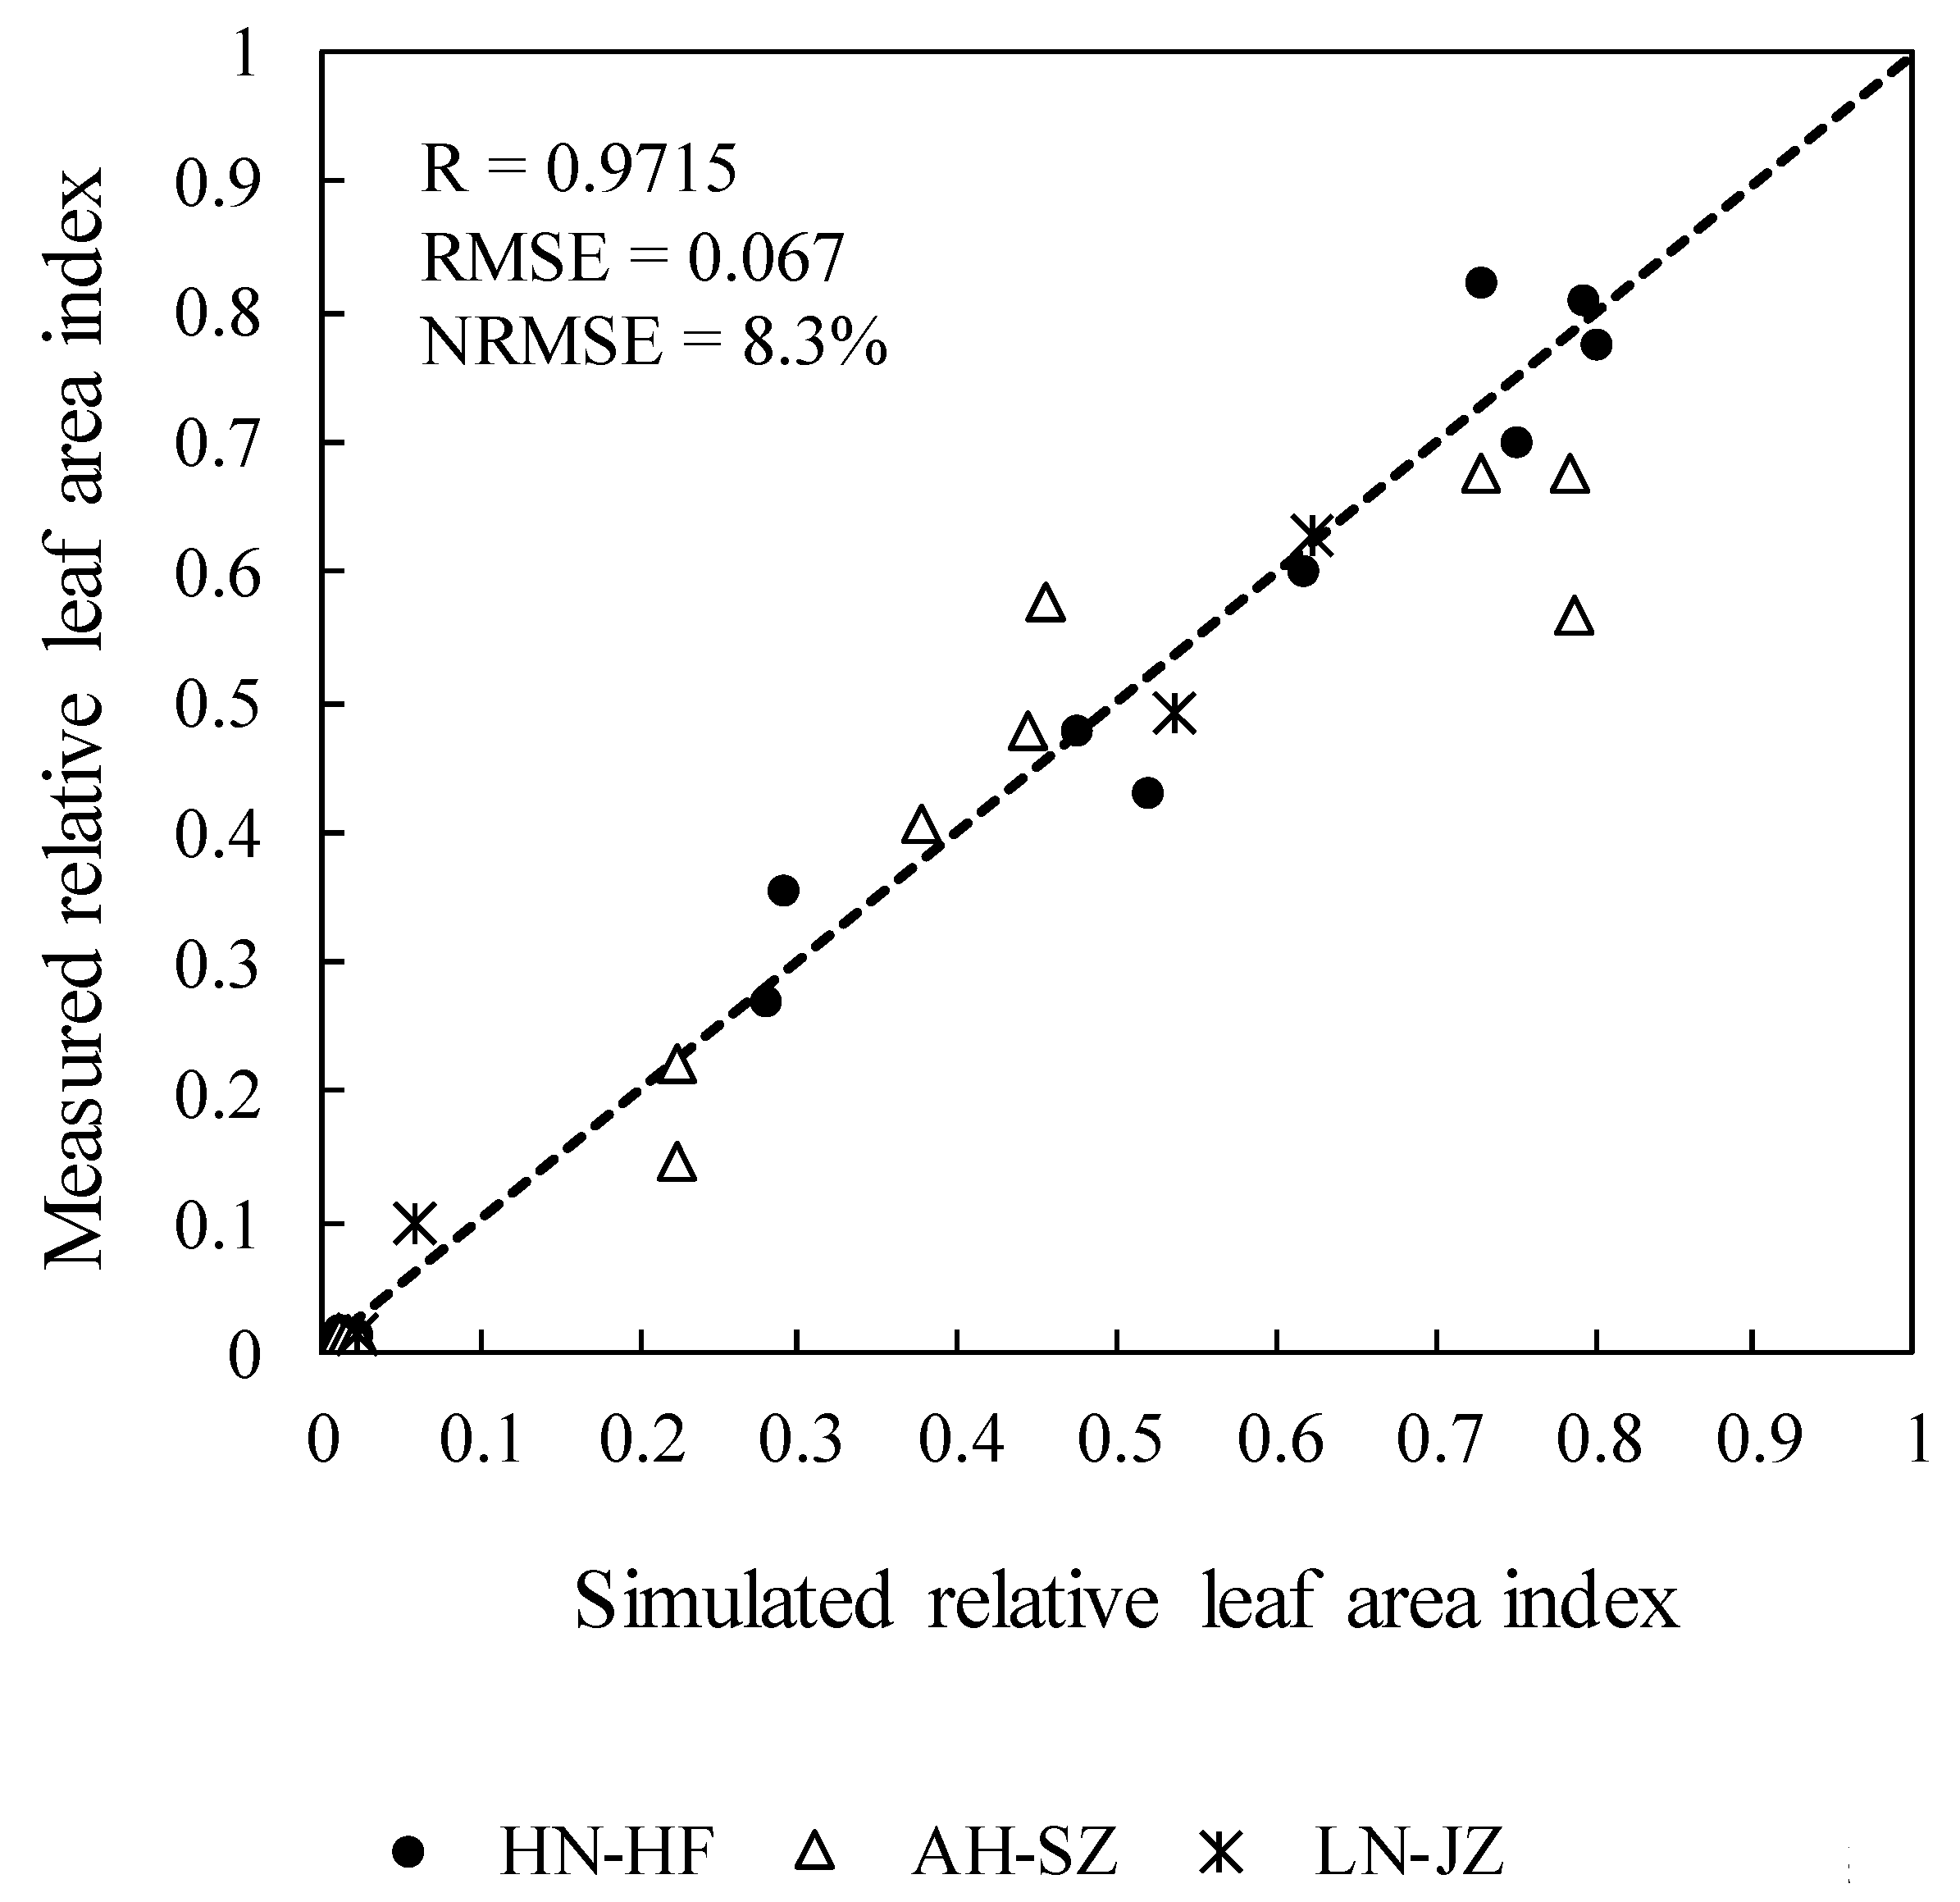
Dynamic observations were conducted for the leaf area index of different soybean varieties and sowing dates in three distinct locations: the Yellow River Floodplain in Henan, Suzhou City in Anhui, and Jinzhou City in Liaoning. The relative leaf area index and relative effective accumulated temperature were calculated for each location, serving as independent sample data. These data were used to validate the universal model of soybean leaf area index presented in Table 2. The results indicated a high correlation between the measured and simulated relative values of the soybean leaf area index under different varieties and climatic conditions (Figure 8), with a correlation coefficient of 0.97 and an average relative error of 21.2%.
HN-HF represents the experiment that was conducted in Huangfan, Henan province. AH-SZ represents the experiment that was conducted in Suzhou, Anhui province. LN-JZ represents the experiment that was conducted in Jinzhou, Liaoning province.

4. Discussion

Adjusting sowing date is a widely adopted strategy for mitigating the impact of temperatures during the critical growth stages of crops [36]. Previous studies showed that warming climate accelerated crop growth, with wheat, barley, and rapeseed exhibiting shortened growing periods over recent decades [37,38,39]. Our study confirmed the previous theories. A delayed sowing date will cause crops to experience a longer period of accumulated high temperatures from the seedling stage to the silking stage [40], resulting in a shortened growth period of crops. This exposure to high temperatures leads to accelerated vegetative growth [41]. Moreover, our findings demonstrated that delayed sowing (or elevated temperatures) primarily shortens the interval of sowing to emergence and emergence to flowing (Figure 2). However, it is important to note that the magnitude of this acceleration may vary depending on regional climates, soil conditions, and soybean varieties. For example, while delayed sowing may be beneficial in regions with long growing seasons and warm temperatures, it may not have the same effect in areas with shorter growing seasons or cooler climates. From a practical standpoint, the finding implies that farmers should consider the sowing date as a critical factor in soybean production management. By optimizing the sowing date based on local environmental conditions and soybean variety characteristics, it is possible to enhance vegetative growth, improve yield potential, and achieve more efficient use of resources such as water and nutrients.
Numerous studies have established that sowing date alterations significantly influence crop phenology [38,39,42]. Building upon this foundation, our results demonstrate that delayed sowing triggers accelerated leaf ontogeny, resulting in a precocious leaf area index (LAI) maximum. This physiological response primarily stems from the altered thermal and photoperiodic regimes encountered by late-sown cultivars, which collectively enhance foliar expansion rates. Mechanistically, early-sown crops experience suboptimal growing conditions characterized by lower temperatures and reduced daylength during initial growth stages, thereby postponing LAI peak development (Figure 3). In contrast, late-sown plants capitalize on more favorable thermal regimes and prolonged photoperiods, enabling expedited canopy establishment. These findings underscore the agronomic significance of sowing date optimization for achieving ideal LAI dynamics, a crucial physiological parameter that directly governs photosynthetic capacity and, consequently, determines final yield potential and harvest quality.
Compared to the crop growth simulation based on the number of days of after sowing, effective accumulated temperature is more scientifically meaningful for objectively and accurately describing the thermal requirements for crop growth. Traditional crop growth analysis often relies on days after sowing as a temporal metric for simulating developmental processes [35,43]. We hypothesized that soybean leaf area index (LAI) could be predicted based on sowing date. The results confirmed that the DAS presents a unimodal bell shape with LAI (Figure 3). However, this relationship exhibited substantial variability across sowing dates, indicating that DAS alone is an unreliable predictor of LAI due to its sensitivity to environmental fluctuations. However, our results also revealed that the relationship lacked consistency, rendering LAI prediction based solely on sowing date less reliable. Thus, we further analyzed the relationship between effective accumulated temperature and LAI, identifying a clear correlation between relative accumulated temperature and LAI (Figure 5) [28,44,45]. In our study, under the same variety and experimental conditions, the growth curves of LAI based on the number of growth days were affected by the sowing date, while they showed no significant difference with different sowing dates based on effective accumulated temperature. This indicates that the effective accumulated temperature takes both temperature and time into account, and it can more accurately reflect the actual thermal requirements of crops at different growth stages, avoiding the one-sidedness of simply using the passage of time to measure the progress of crop growth.
Remote sensing is widely used for crop LAI estimation, including multi-source data [46], UAV LiDAR [47], and spectral indices [48]. However, its accuracy can be limited by sensor resolution and environmental conditions. Unlike previous methods, our model directly incorporates soybean variety traits and weather data to predict future LAI, rather than just estimating current values. While many crop growth models exist [16,35,49], most focus on single varieties or planting dates. Our modified logistic model improves universality by accounting for multiple sowing dates and late-stage LAI decline, validated across different locations and cultivars. We use flowering time and thermal time (accumulated heat) to define growth stages, which is more robust than fixed growth phases. However, temperature variations may affect accuracy, suggesting future refinements with environmental adjustments.
While the universal model demonstrates promising results, it is important to acknowledge its current limitations. Firstly, the model’s reliability is strongly contingent on the quality and consistency of input data. To obtain specific leaf area index (LAI) values, the maximum achievable LAI for soybean varieties must be accurately known. Moreover, the model requires calibration for localized conditions, and its current form may not generalize well across diverse geographic or climatic regions without additional adjustment. Another critical limitation lies in its inability to account for abrupt and extreme external factors. The predictive accuracy of this model could be affected by unforeseen factors such as extreme weather events or pest outbreaks, which are not explicitly incorporated in the present formulation. Future studies should prioritize optimizing the model’s architecture through the inclusion of additional environmental variables and the integration of machine learning techniques. This approach would strengthen its predictive performance and facilitate adaptive learning in response to evolving data and changing environmental conditions. Further assessment is also warranted to evaluate the model’s applicability under diverse agricultural management systems. Research in this direction will deepen the understanding of soybean growth dynamics and offer both theoretical insights and technical support for enhancing precision in agricultural management. With these improvements, the model has the potential to become a valuable tool in supporting decision-making related to crop monitoring, yield forecasting, and resource optimization across global soybean production systems.

5. Conclusions

Our study presents a novel universal model for estimating the growth of the soybean leaf area index (LAI). The model was developed through a comprehensive analysis of soybean growth patterns across various developmental stages, integrating both empirical data and theoretical considerations. The main findings are as follows: (1) the total growth period of soybean was shortened with the planting date delayed, both on the duration from sowing to emergence and duration from emergence to flowering; (2) the growth characters of LAI with dates after sowing varied under different sowing dates; (3) the relationship between relative leaf area index and relative effective accumulated temperature completely conform to the modified logistic curve. The model’s performance was evaluated using a diverse dataset, including different soybean varieties and environmental conditions. The model in this study proposed a simple LAI estimation method and constructed a universal model for estimating soybean LAI based on growth stage and temperature.

Author Contributions

Conceptualization, Q.W. and J.G.; methodology, Q.W. and J.G.; software, Q.W.; validation, Q.W.; formal analysis, Q.W.; investigation, Q.W. and J.G.; resources, J.G.; data curation, Q.W.; writing—original draft preparation, Q.W.; writing—review and editing, Q.W.; visualization, Q.W.; supervision, J.G.; project administration, J.G.; funding acquisition, Q.W. All authors have read and agreed to the published version of the manuscript.

Funding

This research was funded by Science and Technology Development Fund of CAMS (2024KJ011) and National Natural Science Foundation of China (No. 32301725). The APC was funded by Science and Technology Development Fund of CAMS (2024KJ011).

Data Availability Statement

Data are contained within the article.

Acknowledgments

The financial support mentioned in the Funding part is gratefully acknowledged.

Conflicts of Interest

The authors declare no conflict of interest.

References

  1. Wang, Y.; Ling, X.; Ma, C.; Liu, C.; Zhang, W.; Huang, J.; Peng, S.; Deng, N. Can China get out of soy dilemma? A yield gap analysis of soybean in China. Agron. Sustain. Dev. 2023, 43, 47. [Google Scholar] [CrossRef]
  2. Gale, F.; Valdes, C.; Ash, M. Interdependence of China, United States, and Brazil in Soybean Trade. USDA, Economic Research Service. 2019. Available online: https://www.ers.usda.gov/webdocs/outlooks/93390/ocs-19f-01.pdf (accessed on 3 September 2025).
  3. Watson, D.J. Comparative physiological studies on the growth of field crops: I. Variation in net assimilation rate and leaf area between species and varieties, and within and between years. Ann. Bot. 1947, 11, 41–76. [Google Scholar] [CrossRef]
  4. Nemani, R.R.; Keeling, C.D.; Hashimoto, H.; Jolly, W.M.; Piper, S.C.; Tucker, C.J.; Myneni, R.B.; Running, S.W. Climate-driven increases in global terrestrial net primary production from 1982 to 1999. Science 2003, 300, 1560–1563. [Google Scholar] [CrossRef] [PubMed]
  5. Zhu, Z.; Bi, J.; Pan, Y.; Ganguly, S.; Anav, A.; Xu, L.; Samanta, A.; Piao, S.; Nemani, R.R.; Myneni, R.B. Global data sets of Vegetation Leaf Area Index (LAI)3g and Fraction of Photosynthetically Active Radiation (FPAR)3g derived from Global Inventory Modeling and Mapping Studies (GIMMS) Normalized Difference Vegetation Index (NDVI3g) for the period 1981 to 2011. Remote Sens. 2013, 5, 927–948. [Google Scholar] [CrossRef]
  6. Tesemma, Z.K.; Wei, Y.; Western, A.W.; Peel, M.C. Leaf area index variation for crop, pasture, and tree in response to climatic variation in the Goulburn–Broken Catchment, Australia. J. Hydrometeorol. 2014, 15, 1592–1606. [Google Scholar] [CrossRef]
  7. Liu, Z.; Chen, J.M.; Jin, G.; Qi, Y. Estimating seasonal variations of leaf area index using litterfall collection and optical methods in four mixed evergreen-deciduous forests. Agric. Forest Meteorol. 2015, 209–210, 36–48. [Google Scholar] [CrossRef]
  8. Soudani, K.; François, C.; Maire, G.L.; Dantec, V.L.; Dufrêne, E. Comparative analysis of IKONOS, SPOT, and ETM+ data for leaf area index estimation in temperate coniferous and deciduous forest stands. Remote Sens. Environ. 2006, 102, 161–175. [Google Scholar] [CrossRef]
  9. Campos-Taberner, M.; Garcia-Haro, F.J.; Camps-Valls, G.; Grau-Muedra, G.; Nutini, F.; Crema, A.; Boschetti, M. Multitemporal and multiresolution leaf area index retrieval for operational local rice crop monitoring. Remote Sens. Environ. 2016, 187, 102–118. [Google Scholar] [CrossRef]
  10. Xu, Y.; Zhou, M.Y.; Xue, Y.F. Spatial variability and relationships of rice leaf area index and yield. Trans. CSAE 2006, 22, 10–14. [Google Scholar]
  11. Lavorel, S.; Garnier, E. Predicting changes in community composition and ecosystem functioning from plant traits: Revisiting the Holy Grail. Funct. Ecol. 2010, 16, 545–556. [Google Scholar] [CrossRef]
  12. Chai, Y.F.; Yue, M.; Wang, M.; Xu, J.S.; Liu, X.; Zhang, R.C.; Wan, P.C. Plant functional traits suggest a change in novel ecological strategies for dominant species in the stages of forest succession. Oecologia 2016, 180, 771–783. [Google Scholar] [CrossRef]
  13. Inman-Bamber, N.G. Temperature and seasonal effects on canopy development and light interception of sugarcane. Field Crops Res. 1994, 36, 41–51. [Google Scholar] [CrossRef]
  14. Sinclaira, T.R.; Gilbertb, R.A.; Perdomoc, R.E.; Shine, J.M., Jr.; Powellc, G.; Montes, G. Sugarcane leaf area development under field conditions in Florida, USA. Field Crops Res. 2004, 88, 171–178. [Google Scholar] [CrossRef]
  15. Jonckheere, I.; Fleck, S.; Nackaerts, K.; Muys, B.; Coppin, P.; Weiss, M.; Baret, F. Review of methods for in situ leaf area index determination: Part I. Theories, sensors and hemispherical photography. Agric. For. Meteorol 2004, 21, 19–35. [Google Scholar] [CrossRef]
  16. Breda, N.J.J. Ground-based measurements of leaf area index: A review of methods, instruments and current controversies. J. Exp. Bot. 2003, 54, 2403–2417. [Google Scholar] [CrossRef] [PubMed]
  17. Colaizzi, P.; Evett, S.R.; Brauer, D.K.; Howell, T.R.; Tolk, J.R.; Copeland, K.S. Allometric method to estimate leaf area index for row crops. Agron. J. 2017, 109, 883–894. [Google Scholar] [CrossRef]
  18. Chason, J.W.; Baldocchi, D.D.; Huston, M.A. A comparison of direct and indirect methods for estimating forest canopy leaf-area. Agric. For. Meteor. 1991, 57, 107–128. [Google Scholar] [CrossRef]
  19. Olivas, P.C.; Oberbauer, S.F.; Clark, D.B.; Clark, D.A.; Ryan, M.G.; Brien, J.J.; Ordonez, H. Comparison of direct and indirect methods for assessing leaf area index across a tropical rain forest landscape. Agric. For. Meteor. 2013, 177, 110–116. [Google Scholar] [CrossRef]
  20. Hu, R.; Yan, G.; Mu, X.; Luo, J. Indirect measurement of leaf area index on the basis of path length distribution. Remote Sens. Environ. 2014, 155, 239–247. [Google Scholar] [CrossRef]
  21. Bonnett, G.D. Rate of leaf appearance in sugarcane, including a comparison of a range of varieties. Aust. J. Plant Physiol. 1998, 25, 829–834. [Google Scholar] [CrossRef]
  22. Campbell, J.A.; Robertson, M.J.; Grof, C.P.L. Temperature effects on node appearance in sugarcane. Aust. J. Plant Physiol. 1998, 25, 815–818. [Google Scholar] [CrossRef]
  23. Robertson, M.J.; Bonnett, G.D.; Hughes, R.M.; Muchow, R.C.; Campbell, J.A. Temperature and leaf area expansion of sugarcane: Integration of controlled-environment, field and model studies. Aust. J. Plant Physiol. 1998, 25, 819–828. [Google Scholar] [CrossRef]
  24. Mcmaster, G.S.; Wilhelm, W.W. Growing degree-days: One equation, two interpretations. Agric. For. Meteorol. 1997, 87, 291–300. [Google Scholar] [CrossRef]
  25. Xiao, Z.; Lei, H.; Jin, C.; Pan, H.; Lian, Y. Relationship between the Dynamic Characteristics of Tomato Plant Height and Leaf Area Index with Yield, under Aerated Drip Irrigation and Nitrogen Application in Greenhouses. Agronomy 2023, 13, 116. [Google Scholar] [CrossRef]
  26. Miguez, F.E.; Zhu, X.; Humphries, S.; Bollero, G.A.; Long, S.P. A semimechanistic model predicting the growth and production of the bioenergy crop Miscanthus giganteus: Description, parameterization and validation. GCB Bioenergy 2009, 1, 282–296. [Google Scholar] [CrossRef]
  27. Archontoulis, S.A.; Miguez, F.E. Nonlinear regression models and applications in agricultural research. Agron. J. 2015, 107, 786–798. [Google Scholar] [CrossRef]
  28. Ding, D.Y.; Feng, H.; Zhao, Y.; Robert, L.H.; Yan, H.M.; Chen, H.X.; Hou, H.J.; Chu, X.S.; Liu, J.C.; Wang, N.J.; et al. Effects of continuous plastic mulching on crop growth in a winter wheat-summer maize rotation system on the Loess Plateau of China. Agric. For. Meteorol. 2019, 271, 385–397. [Google Scholar] [CrossRef]
  29. Wu, Y.; Yan, S.; Fan, J.; Zhang, F.; Xiang, Y.; Zheng, J.; Guo, J. Responses of growth, fruit yield, quality and water productivity of greenhouse tomato to deficit drip irrigation. Sci. Hortic. 2021, 275, 109710. [Google Scholar] [CrossRef]
  30. Diel, M.I.; Lúcio, A.D.C.; Valera, O.V.S.; Sari, B.G.; Olivoto, T.; Pinheiro, M.V.M.; Melo, P.J.d.; Tartaglia, F.d.L.; Schmidt, D. Production of biquinho pepper in different growing seasons characterized by the logistic model and its critical points. Cienc. Rural 2020, 50, e20190477. [Google Scholar] [CrossRef]
  31. Lucio, A.D.; Nunes, L.F.; Rego, F. Nonlinear models to describe production of fruit in Cucurbita pepo and Capiscum annuum. Sci. Hortic. 2015, 193, 286–293. [Google Scholar] [CrossRef]
  32. Tong, P.Y.; Ling, B.Y.; Guan, Y.X. Dynamic simulation of dry matter accumulation in summer maize. Beijing Agric. Sci. 1996, 5, 22–25. (In Chinese) [Google Scholar]
  33. Peel, M.C.; Finlayson, B.L.; McMahon, T.A. Updated world map of the Köppen-Geiger climate classification. Hydrol. Earth Syst. Sci. 2007, 11, 1633–1644. [Google Scholar] [CrossRef]
  34. Schrader, J.; Shi, P.; Royer, D.L.; Peppe, D.J.; Gallagher, R.V.; Li, Y.; Wang, R.; Wright, I.J. Leaf size estimation based on leaf length, width and shape. Ann Bot. 2021, 128, 395–406. [Google Scholar] [CrossRef]
  35. Yin, X.; Goudriaan, J.; Lantinga, E.A.; Vos, J.; Spiertz, H.J. A flexible sigmoidfunction of determinate growth. Ann. Bot. 2003, 91, 361–371. [Google Scholar] [CrossRef]
  36. Hasegawa, T.; Wakatsuki, H.; Ju, H.; Vyas, S.; Nelson, G.C.; Farrell, A.; Deryng, D.; Meza, F.; Makowski, D. A global dataset for the projected impacts of climate change on four major crops. Sci. Data 2022, 9, 58. [Google Scholar] [CrossRef]
  37. Ma, S.X.; Churkina, G.; Trusilova, K. Investigating the impact of climate change on crop phenological events in Europe with a phenology model. Int. J. Biometeorol. 2012, 56, 749–763. [Google Scholar] [CrossRef] [PubMed]
  38. Tao, F.L.; Zhang, S.A.; Zhang, Z. Spatiotemporal changes of wheat phenology in China under the effects of temperature, day length and cultivar thermal characteristics. Eur. J. Agron. 2012, 43, 201–212. [Google Scholar] [CrossRef]
  39. Xiao, D.P.; Tao, F.L.; Liu, Y.J.; Shi, W.J.; Wang, M.; Liu, F.S.; Zhang, S.; Zhu, Z. Observed changes in winter wheat phenology in the North China Plain for 1981–2009. Int. J. Biometeorol. 2013, 57, 275–285. [Google Scholar] [CrossRef] [PubMed]
  40. Cao, Z.; Chen, Z.; Tang, B.; Zeng, Q.; Guo, H.; Huang, W.; Luo, Y.; Shen, S.; Zhou, S. The effects of sowing date on maize: Phenology, morphology, and yield formation in a hot subtropical monsoon region. Field Crops Res. 2024, 309, 109309. [Google Scholar] [CrossRef]
  41. Cicchino, M.; Edreira, J.I.R.; Uribelarrea, M.; Otegui, M.E. Heat stress in field-grown maize: Response of physiological determinants of grain yield. Crop Sci. 2010, 50, 1438–1448. [Google Scholar] [CrossRef]
  42. Liu, F.; Chen, Y.; Bai, N.; Xiao, D.; Bai, H.; Tao, F.; Ge, Q. Divergent climate feedbacks on winter wheat growing and dormancy periods as affected by sowing date in the North China Plain. Biogeosciences 2021, 18, 2275–2287. [Google Scholar] [CrossRef]
  43. Fang, S.L.; Kuo, Y.H.; Kang, L.; Chen, C.C.; Hsieh, C.Y.; Yao, M.H.; Kuo, B.J. Using sigmoid growth models to simulate greenhouse tomato growth and development. Horticulturae 2022, 8, 1021. [Google Scholar] [CrossRef]
  44. Li, G.Q.; Tang, L.; Zhang, W.Y.; Cao, W.X.; Zhu, Y. Dynamic analysis on response of dry matter accumulation and partitioning to nitrogen fertilizer in wheat cultivars with different plant types. Acta Agron. Sin. 2009, 35, 2258–2265. (In Chinese) [Google Scholar] [CrossRef]
  45. Shabani, A.; Sepaskhah, A.; Kamgar-Haghighi, A.A. Estimation of yield and dry matter of rapeseed using Logistic model under water, salinity and deficit irrigation. Arch. Agron. Soil Sci. 2014, 60, 951–969. [Google Scholar] [CrossRef]
  46. Hosseini, M.; McNairn, H.; Merzouki, A.; Pacheco, A. Estimation of Leaf Area Index (LAI) in corn and soybeans using multi-polarization C- and L-band radar data. Remote Sens. Environ. 2015, 170, 77–89. [Google Scholar] [CrossRef]
  47. Luo, S.; Liu, W.; Ren, Q.; Wei, H.; Wang, C.; Xi, X.; Nie, S.; Li, D.; Ma, D.; Zhou, G. Leaf area index estimation in maize and soybean using UAV LiDAR data. Precis. Agric. 2024, 25, 1915–1932. [Google Scholar] [CrossRef]
  48. Yuan, H.; Yang, G.; Li, C.; Wang, Y.; Liu, J.; Yu, H.; Feng, H.; Xu, B.; Zhao, X.; Yang, X. Retrieving Soybean Leaf Area Index from Unmanned Aerial Vehicle Hyperspectral Remote Sensing: Analysis of RF, ANN, and SVM Regression Models. Remote Sens. 2017, 9, 309. [Google Scholar] [CrossRef]
  49. Jin, M.; Zhang, D.L. Observed variations of leaf area index and its relationship with surface temperature during warm seasons. Meteorol. Atmos. Phys. 2002, 80, 117–129. [Google Scholar] [CrossRef]
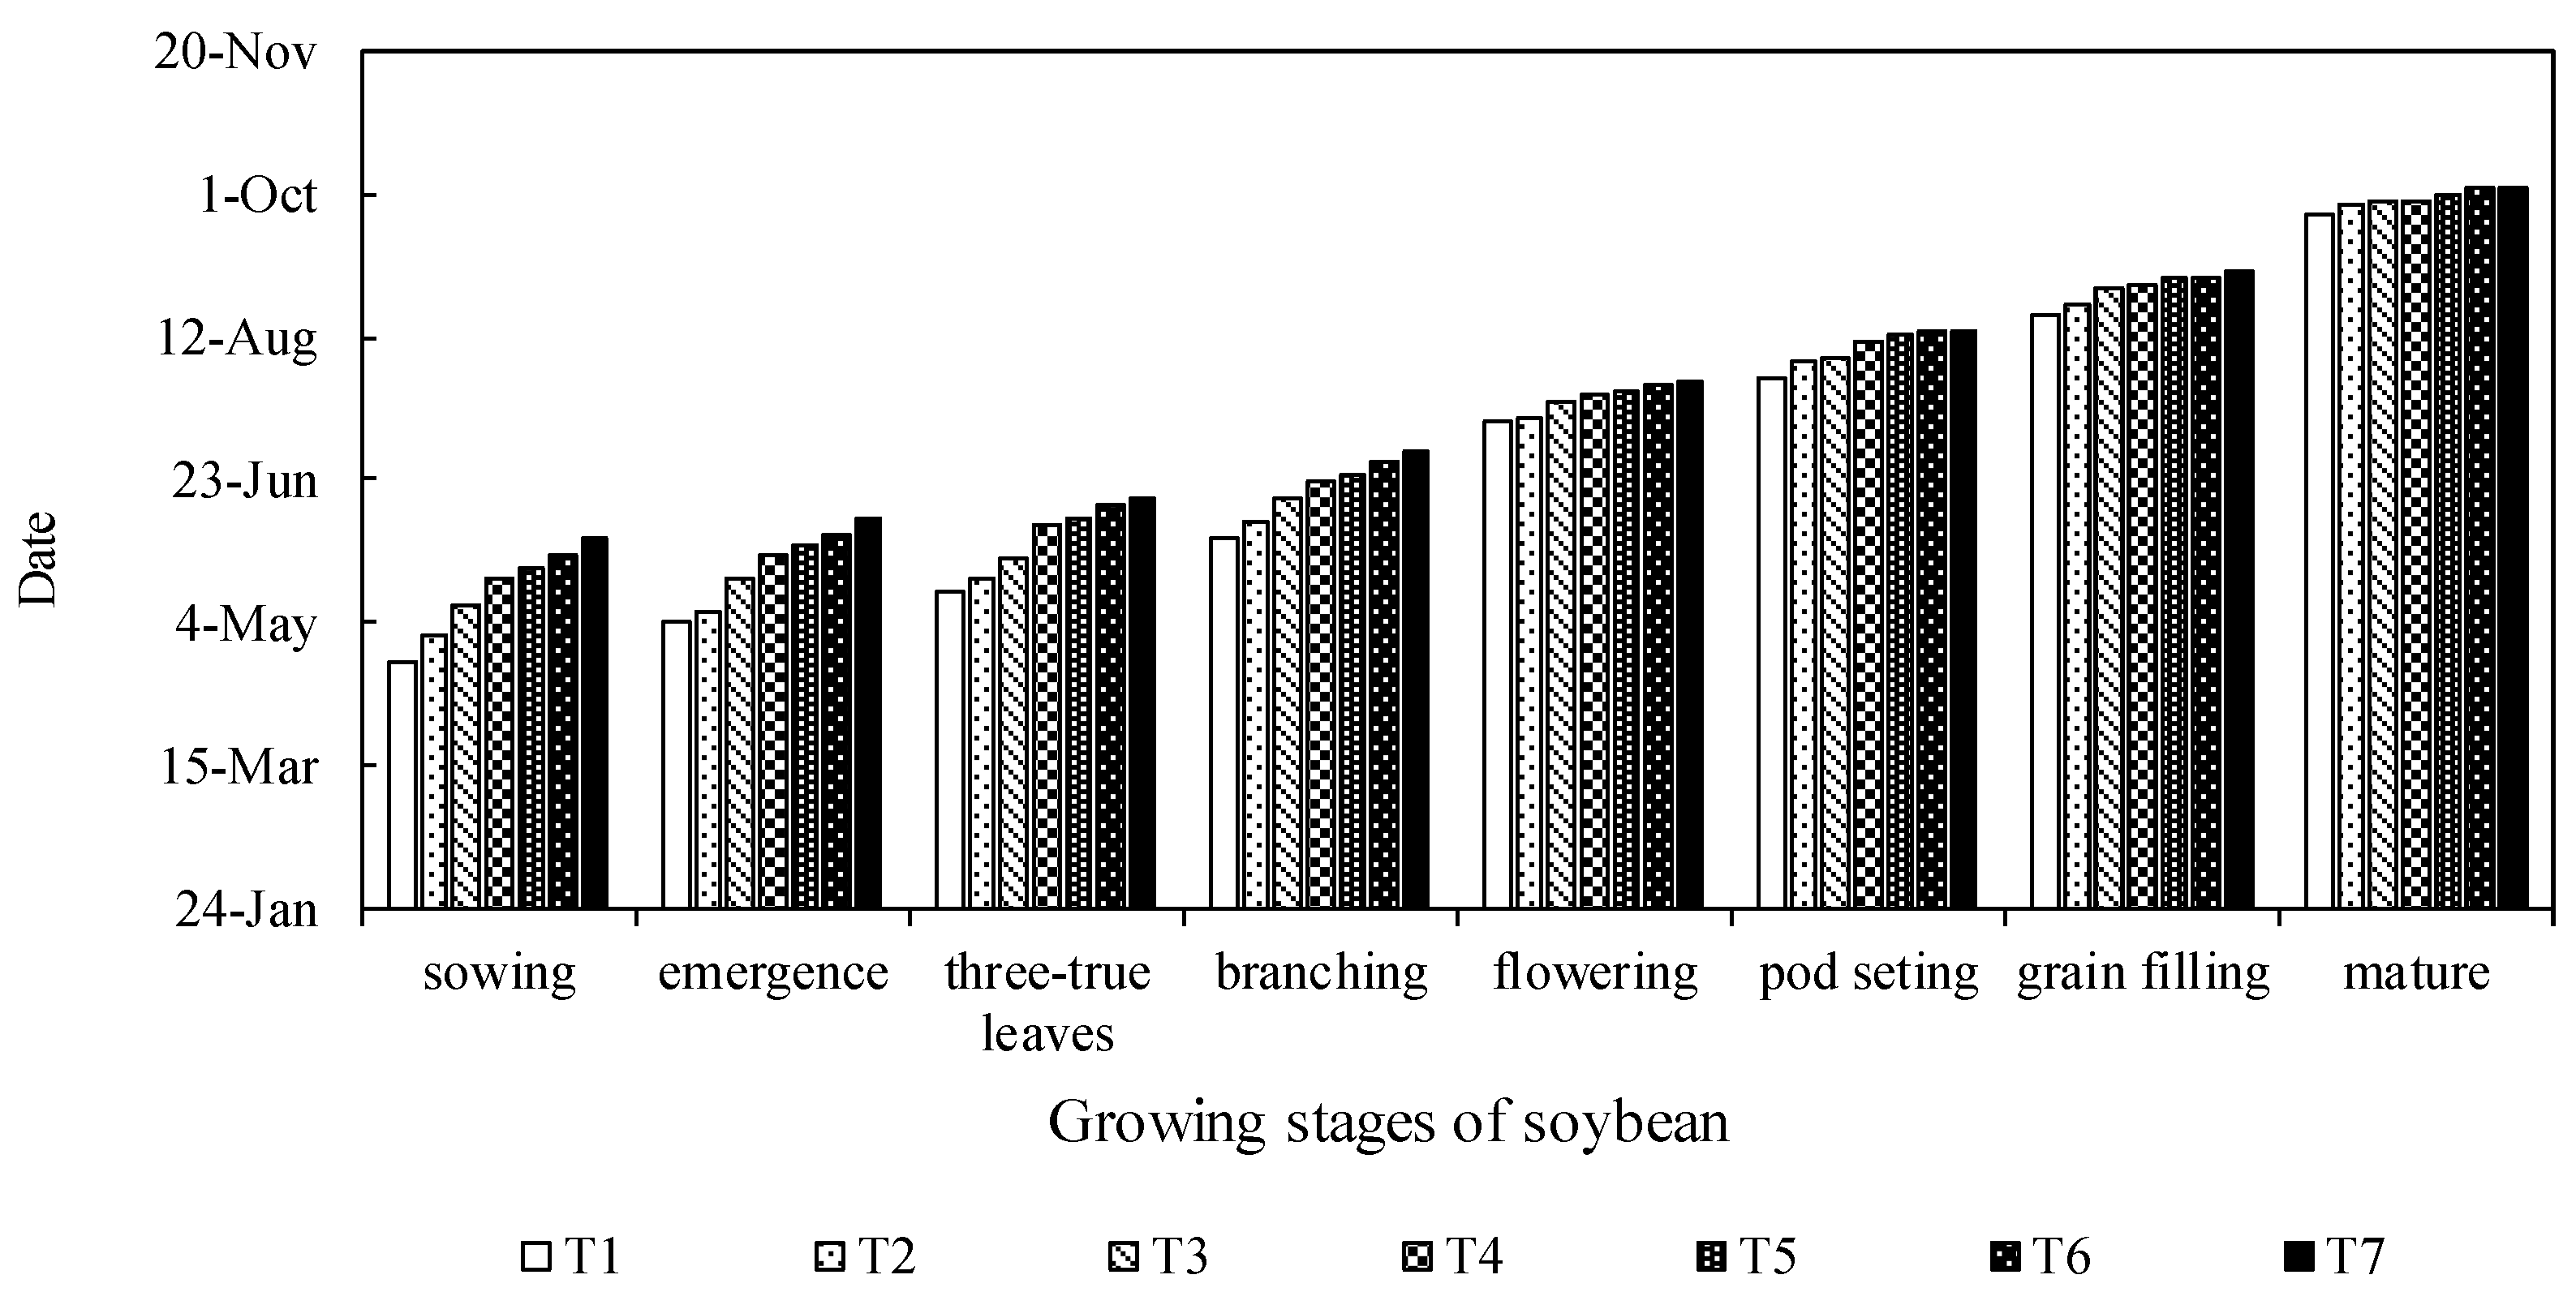
Figure 1. Growing stages of soybean with different sowing dates.
Agronomy 15 02231 g001
Figure 2. Duration of soybean growing cycle with different sowing dates.
Agronomy 15 02231 g002
Figure 3. Characteristics of soybean LAI with different sowing dates.
Agronomy 15 02231 g003
Figure 4. Growth rate of soybean LAI with different sowing dates.
Agronomy 15 02231 g004
Figure 5. Relationship between relative LAI and relative effective accumulated temperature with different sowing dates.
Agronomy 15 02231 g005
Figure 6. Residual of the simulation between relative LAI and relative effective accumulated temperature.
Agronomy 15 02231 g006
Figure 7. Preparation of simulated relative LAI and measured relative LAI.
Agronomy 15 02231 g007
Figure 8. Independent sample validation of a universal model for soybean leaf area index.
Agronomy 15 02231 g008
Table 1. Basic data for soybean different sowing dates.
TreatT1T2T3T4T5T6T7
Sowing dates20 April30 April10 May20 May23 May28 May3 June
Table 2. The universal model for soybean leaf area index.
ModelParametersDetermination Coefficient
R L A I = k 1 + e x p ( a + b R A e + c R A e 2 ) kabc
19.748.636−8.6643.4120.929
Disclaimer/Publisher’s Note: The statements, opinions and data contained in all publications are solely those of the individual author(s) and contributor(s) and not of MDPI and/or the editor(s). MDPI and/or the editor(s) disclaim responsibility for any injury to people or property resulting from any ideas, methods, instructions or products referred to in the content.