Article

Biochar and Nitrogen Fertilizer Synergies: Enhancing Soil Properties and Jujube Fruit Quality in Saline–Alkali Orchards of Southern Xinjiang

The National-Local Joint Engineering Laboratory of High Efficiency and Superior-Quality Cultivation and Fruit Deep Processing Technology on Characteristic Fruit Trees, College of Horticulture and Forestry Sciences, Tarim University, Alar 843300, China
*
Author to whom correspondence should be addressed.
These authors contributed equally to this work.
Agronomy 2025, 15(9), 2205; https://doi.org/10.3390/agronomy15092205
Submission received: 20 August 2025 / Revised: 9 September 2025 / Accepted: 16 September 2025 / Published: 17 September 2025
(This article belongs to the Section Soil and Plant Nutrition)

Abstract

Saline–alkali soils in southern Xinjiang present significant challenges for sustainable jujube cultivation, necessitating innovative fertilization strategies to improve soil health and enhance fruit quality. This study investigated the synergistic effects of biochar–nitrogen (N) co-application on soil amelioration and the improvement of jujube quality in saline–alkali jujube orchards. A field experiment was conducted using different biochar application rates (0, BC1, BC2) combined with various N fertilizer types (conventional nitrogen N1, N2, UI-N (urease inhibitor), and NI-N (nitrification inhibitor)), which systematically analyzed soil physicochemical properties, nutrient dynamics, enzyme activities, microbial community structure, and jujube fruit yield and quality parameters. The BC1 biochar application rate emerged as the optimal threshold for soil carbon and N sequestration, with BC1 + N2 treatment achieving the highest total carbon and total nitrogen concentrations, representing increases of 12.4% and 21.42%, respectively, compared to controls. Biochar–N co-application significantly enhanced soil available nutrients, with BC1 + UI-N treatment producing the greatest soil organic matter increase within the BC1 group (9.20–14.51% enhancement). Notably, the treatments modulated soil microelement profiles, suppressing potentially toxic Cu and Mn while enhancing the availability of beneficial Mg and Fe. Soil enzyme activities responded differently, with urease and sucrase activities reaching maximum levels under BC2 + N1 and BC1 + UI-N treatments, respectively. Microbial community analysis revealed that biochar–N combinations significantly restructured both bacterial and fungal communities, with BC1 + NI-N treatment demonstrating superior bacterial α-diversity across all indices. Soil enzyme activities exhibited distinct response patterns, with urease and sucrase activities reaching their peak under the BC2 + N1 and BC1 + UI-N treatments, respectively. Moreover, the co-application of biochar (BC1) with N fertilizer significantly improved fruit performance, increasing per-tree yield by 24.23% and fruit vitamin C content by 16.47%, compared to the control. This study demonstrates that moderate biochar application (BC1) combined with urease inhibitor- enhanced N fertilizer (UI-N) represents an optimal fertilization strategy for saline–alkali jujube orchards, achieving simultaneous soil amelioration and fruit quality enhancement through coordinated regulation of soil–microbe–plant interactions. The established quantitative relationships provide a scientific foundation for the implementation of precision agriculture in arid saline–alkali regions, offering significant implications for sustainable specialty fruit production and soil health restoration in environmentally challenged agricultural systems.

1. Introduction

Within the global imperative for sustainable agricultural development, optimizing resource utilization while mitigating environmental degradation has emerged as a critical challenge [1]. As arable land and freshwater resources become increasingly constrained, innovative strategies that enhance fertilizer use efficiency while reducing ecological footprints are urgently needed [2]. This imperative is particularly acute in arid and semi-arid regions, exemplified by southern Xinjiang, China, where soil salinization poses a severe threat to agricultural productivity and sustainability [3]. As the primary production region for jujube, secondary salinization in southern Xinjiang has degraded over 30% of cultivated land, substantially compromising soil structure, reducing nutrient availability, and ultimately impairing fruit quality [4]. While conventional high-N fertilization regimes provide short-term yield benefits, they exacerbate soil degradation through nutrient leaching, pH imbalance, and microbial community disruption [5]. Consequently, developing integrated soil amelioration strategies that harmonize productivity with ecological resilience is paramount in this ecologically vulnerable region.
Biochar, a carbon-rich material derived from biomass pyrolysis, represents a promising soil amendment that effectively alleviates saline–alkali stress through its high porosity, cation exchange capacity (CEC), and stable carbon matrix, which enhance water retention, reduce Na+ toxicity, and improve aggregate stability [6]. When co-applied with N fertilizers, biochar exhibits synergistic effects, reducing N losses through the adsorption of ammonium (NH4+) and nitrate (NO3) ions, while neutralizing soil acidification from urea hydrolysis due to its alkaline properties [7,8]. Critically, biochar functions as a microbial habitat that intensifies nutrient cycling, increasing microbial biomass carbon (MBC) by 40–120% [9]. Following N co-application, urease activity peaked under 8 t ha−1 biochar + 150 kg N ha−1 treatment, while invertase and catalase activities simultaneously increased by 35–58% [10]. These synergistic interactions enhance the carbon-nitrogen balance, elevate soil C:N ratios, drive organic matter mineralization, and extend the duration of N supply [11]. However, sole biochar application often fails to meet perennial fruit tree nitrogen requirements. Enhanced-efficiency N fertilizers (EENFs), particularly urease-inhibited and nitrification-inhibited formulations, achieve controlled nitrogen release by suppressing urea hydrolysis (reducing NH3 volatilization) and retarding ammonium-to-nitrate conversion (minimizing NO3 leaching and N2O emissions), respectively. Nevertheless, their efficacy remains susceptible to high pH and elevated base saturation conditions, with limited validation in saline–alkali environments [12,13]. Extensive research has validated the synergistic benefits of co-applying biochar and nitrogen across diverse agricultural systems. For instance, 30 t ha−1 biochar combined with 276 kg N ha−1 resulted in maize yields of 14,928 kg ha−1, with a nitrogen use efficiency (NUE) of 46.3% [11]. In rice systems, 30 t ha−1 biochar mitigated high-N (450 kg N ha−1) toxicity, increasing grain yield by 28% while improving NUE by 23% [14]. In saline–alkali rapeseed cultivation, 10 t ha−1 biochar with 20% reduced nitrogen maintained stable yields while decreasing the soil Na+ content by 12–15% [15,16]. Furthermore, co-application of biochar–N significantly optimizes soil structure and nutrient retention; specifically, 40 t ha−1 biochar with N increased the number of water-stable aggregates by 34.8% while enhancing macroaggregate N storage by 41.3% [17]. The porous structure adsorbs NH4+ and NO3, reducing N leaching by 30–50%. Meanwhile, alkaline surfaces (pH 8–10) neutralize H+ from urea hydrolysis, thereby alleviating soil acidification [9,14]. However, interaction mechanisms between biochar and EENFs under saline–alkali conditions remain unclear.
Despite the demonstrated potential of biochar and EENFs in ameliorating degraded soils and improving crop yields [18], jujube orchards in southern Xinjiang represent unique saline–alkali ecosystems where calcic horizons, high exchangeable sodium percentage (ESP > 15%), and perennial root system distributions may substantially modify co-application responses [19,20]. The complex interactions among biochar-mediated soil physicochemical improvements, N transformation kinetics, and mature jujube physiological adaptation mechanisms under compound saline–alkali stress necessitate comprehensive multi-indicator research frameworks. Therefore, this study aims to: (i) elucidate regulatory mechanisms of biochar–N co-application on saline–alkali soil physicochemical properties, nutrient availability, and microbial community structure; (ii) evaluate relationships between soil amelioration effects and jujube fruit quality and yield; (iii) determine optimal fertilization ratios for southern Xinjiang saline–alkali jujube orchards through multi-objective optimization incorporating soil improvement, NUE, and fruit quality. We therefore advance the following hypotheses: (i) moderate biochar application will ameliorate saline–alkali soil properties; (ii) elevated nitrogen fertilisation will enhance jujube yield and fruit quality; and (iii) the combined use of moderate biochar with increased nitrogen will elicit synergistic benefits exceeding those of either amendment alone.

2. Materials and Methods

2.1. Experimental Site Description

The field experiment was conducted at the First Company of the 224th Regiment in Kunyu City, Xinjiang Uygur Autonomous Region, China (37°16′ N, 79°15′ E), situated on the southern margin of the Taklamakan Desert, where abundant solar radiation and thermal resources are available. The experimental site featured 15-year-old jujube trees (Ziziphus jujuba Mill. cv. Junzao) planted in a regular pattern with intra-row spacing of 1.5 m and inter-row spacing of 3.0–4.0 m. The trees exhibited uniform characteristics with heights ranging from 2.3 to 2.6 m, canopy diameters of 1.7–2.1 m, and were trained in a central leader system. The orchard was managed under standardized conventional practices, resulting in relatively uniform tree vigor and growth conditions. The experimental soil was classified as sandy loam, with a pH of 8.21, a bulk density of 1.62 g cm−3, an organic matter content of 7.59 g kg−1, a total nitrogen content of 0.29 g kg−1, and a total carbon content of 14.1 g kg−1. According to the USDA Soil Taxonomy, the soil is classified as a Typic Haplocalcid (Aridisol), and under the World Reference Base it corresponds to a Haplic Solonchak (Salic).

2.2. Experimental Design

Treatments were arranged in randomized complete block design (RCBD) with four complete blocks positioned across the orchard. Each block contained fifteen plots, corresponding to the full factorial combination of three biochar rates (0, BC1 = 5000 kg ha−1, BC2 = 15,000 kg ha−1) and five N regimes (N0, no N; N1, conventional urea 250 kg N ha−1; N2, conventional urea 450 kg N ha−1; UI-N, NBPT-urea 250 kg N ha−1; NI-N, DMPP-urea 250 kg N ha−1) (Table 1). Within each block, the 15 treatment combinations were randomly assigned to plots using a random permutation generated in R 4.2.2 (set.seed = 1234). The biochar used in this study was a commercially available, crop-residue-derived granular product supplied by Henan Yuzhong’ao Agricultural Technology Co., Ltd. (Xuchang, Henan, China). In the absence of a formal supplier certificate, we assembled a complete physicochemical profile by cross-checking the product label, batch records and independent analyses performed by the local agricultural extension station; key indices (pH, EC and nutrient concentrations) were further verified in triplicate following standard protocols (Table S1). Urea fertiliser amended with NBPT (N-(n-butyl) thiophosphoric triamide, urease inhibitor) or with DMPP (3,4-dimethyl-pyrazole phosphate, nitrification inhibitor) was supplied by China Hanhe Biotechnology Co., Ltd., Hefei, Anhui, China. Conventional urea was purchased from Shandong Runyin Bio- chemical Co., Ltd. (Jinan, Shandong, China). Single super-phosphate and potassium sulfate were procured from Urumqi Xirun Baichuan Trading Co., Ltd. (Urumqi, Xinjiang, China). In April 2023 and again in April 2024, immediately before each growing season, the biochar and nitrogen fertiliser were thoroughly blended and applied once only: the mixture was band-placed into 50 cm-deep holes positioned 30 cm from the trunk; no subsequent applications were made. Each plot consisted of a single-row segment with nine consecutive jujube trees; guard rows and ≥10 m buffers were maintained between adjacent plots to eliminate edge effects. The central seven trees per plot were used for yield and fruit-quality determinations, while the outer two served as guards. Statistical replicates were the four plots per treatment (blocks). For soil physicochemical and fruit-quality parameters, three within-plot subsamples were averaged per plot, yielding six analytical replicates per treatment. High-throughput sequencing of soil microbial communities was conducted on a randomly selected subset of three plots per treatment (n = 3). Other agronomic measures were standardized in all experimental plots: (i) drip irrigation was carried out every 7 to 10 days; (ii) winter pruning was conducted in late February to maintain good air circulation in the tree canopy; (iii) integrated pest management (IPM) was implemented, including preventive spraying during the flowering and mid-season periods; (iv) manual weeding was carried out monthly; (v) buds and tips were regularly removed; (vi) no cover crops or organic fertilizers were used except for the other contents stipulated in the experimental design.

2.3. Soil Sample Collection and Analysis of Soil Properties

In late October 2024, a 5 cm-diameter soil auger was used to sample the entire 20–60 cm profile from each treatment plot. Equal volumes (approximately 200 cm3) were extracted from the 20–40 cm, and 40–60 cm increments, then thoroughly mixed before laboratory analysis. This method ensures a comprehensive analysis of the soil profile. Three representative trees per block were sampled, with a total of four blocks in the experiment. Collected samples were processed into three portions: (1) air-dried and sieved for pH and total nutrient analysis; (2) air-dried and stored at 4 °C for enzyme activity determination; (3) preserved at −80 °C for microbial diversity and DNA extraction analyses. Soil pH and electrical conductivity (EC) were measured using pH and EC meter (HI5522, Hana Instruments, Woonsocket, RI, USA) from suspensions of soil and water (1:2.5) [21]. Organic matter (SOM) content was quantified via the modified Walkley-Black method with potassium permanganate oxidation and external heating. Available nutrients included alkaline hydrolyzable nitrogen (AHN) by alkaline hydrolysis diffusion, available phosphorus (AP) through sodium bicarbonate extraction with molybdenum-antimony colorimetry, and available potassium (AK) via ammonium acetate extraction analyzed by flame photometry [22,23]. Total carbon (TC) and total nitrogen (TN) were analyzed using a FlashSmartTM elemental analyzer (Thermo Fisher Scientific, Waltham, MA, USA). Total phosphorus (TP), total potassium (TK)and Calcium (Ca), Copper (Cu), Zinc (Zn), Manganese (Mn), Magnesium (Mg), Iron (Fe) were extracted using inductively coupled plasma optical emission spectrometry (ICP-OES; Avio 200, PerkinElmer, Springfield, IL, USA) [24]. Soil enzyme activities were determined following national standards at 25 °C: urease activity (URE) by phenol sodium-sodium hypochlorite colorimetry (units: mg g−1 d−1), sucrase activity (SUC) using 3,5-dinitrosalicylic acid colorimetry (units: mg g−1 d−1), alkaline phosphatase activity (ALP) via disodium phenyl phosphate colorimetry (units: mg g−1 d−1), and catalase activity (CAT) by potassium permanganate titration (units: mL g−1 h−1) [25]. Matrix interferences were minimized by using appropriate blanks and standards.

2.4. Soil DNA Extraction, PCR Amplification and Illumina MiSeq Sequencing

Soil sampling was conducted in late October 2024 using a soil auger to collect samples from the root zone (0–60 cm depth) of each treatment. Bacterial communities were assessed through amplification of the V3-V4 hypervariable regions of 16S rRNA genes using primer pairs 338F (5′-ACTCCTACGGGAGGCAGCA-3′) and 806R (5′-GGA CTACHVGGGTWTCTAAT-3′) with diluted genomic DNA as template. Fungal analysis targeted the ITS1 region using primers ITS1F (5′-CTTGGTCATTTAGAGGAAGTAA-3′) and ITS2 (5′-GCTGCGTTCTTCATCGATGC-3′) [26]. High-throughput sequencing was performed on the Illumina MiSeq PE250 platform (Illumina, San Diego, CA, USA) by Personalbio Technology Co., Ltd. (Shanghai, China). Raw sequencing data underwent quality filtering and demultiplexing based on index and barcode information, followed by barcode removal. Amplicon sequence variant (ASVs) denoising and clustering were performed using the QIIME2 dada2 pipeline to characterize taxonomic composition across different classification levels for each sample. We ensured a minimum read length of 200 bp and applied a filtering threshold of 20% for sequence similarity in ASV clustering. The sequencing depth and rarefaction depth/coverage percentage were determined for each sample to ensure adequate sampling of the microbial diversity. The sequences were deposited in the Sequence Read Archive (SRA) under the Submission ID: SUB15588384 and BioProject ID: PRJNA1314444. The taxonomic classification was performed using the Silva (for bacteria) and UNITE (for fungi) databases, version 132.02. (Tables S2 and S3).

2.5. Fruit Sampling and Quality Assessment

In September 2024, when the jujube fruits were fully red, 30 uniformly sized and disease-free fruits were randomly collected from each treatment in each experimental field. The harvested fruits were immediately placed in pre-labeled sampling bags, stored in sampling containers, and transported to the laboratory for analysis. After removing the seeds, the flesh and peel were separated, and the fruit flesh tissue was chopped and homogenized for subsequent quality analysis. During the crisp-ripe stage of Junzao jujube fruits in September 2024, thirty uniformly sized, disease- and pest-free fruits were collected from each experimental treatment. The harvested fruits were immediately placed in pre-labeled sampling bags, stored in sampling containers, and transported to the laboratory for analysis. Following de-pitting, the flesh was separated from the peel, and the fruit tissues were chopped and homogenized for subsequent quality analyses. Vitamin C (VC)content was quantified using the molybdenum blue colorimetric method [27], while soluble sugar (SS) content was measured via the anthrone–sulfuric acid method [28]. The number of fruits per plant (PY) was counted at the ripening stage, yield per plant was determined using a JJ5000 electronic balance with a precision of 0.01 kg [29].

2.6. Data Analysis

Data were analyzed using R software (version 4.2.2). To reflect the factorial nature of our study, a two-way ANOVA was conducted with biochar and nitrogen as fixed factors. Assumptions of normality (Shapiro–Wilk test) and homogeneity of variances (Levene’s test) were checked prior to analysis. Post hoc tests were conducted using Holm’s method to control for multiple comparisons. Effect sizes (partial eta-squared) and 95% confidence intervals were calculated to quantify the magnitude of treatment effects. Data visualization and statistical analyses were conducted using R, SPSS 26.0, Origin 2021, and the Genescloud online analytical platform (https://www.genescloud.cn (accessed on 3 September 2025)). Supplementary Table S4 provides the ANOVA results, including effect sizes and 95% confidence intervals. Supplementary Table S5 presents the Holm-adjusted pairwise comparisons when the biochar × nitrogen interaction was significant. To explore the hypothesized causal pathways from biochar–N amendment to soil chemistry, enzyme activity, microbial diversity, and ultimately fruit performance (yield, vitamin C, and soluble solids), a piecewise structural equation model (piecewise SEM) was fitted using the piecewiseSEM package in R. Non-significant paths (p > 0.05) were sequentially removed to retain only significant relationships. The global goodness-of-fit was assessed using Fisher’s C statistic and AICc values. The standardized coefficients (β) were reported to compare the relative strength of the paths. The model explained 95% of the variance in yield, 94% in vitamin C, and 74% in soluble solids. The high predictive power (R2) and the consistency of the retained paths with ecological theory support the robustness of the inferred causal network. Supplementary Table S6 provides the detailed results of the piecewise SEM analysis, including all significant and non-significant paths.

3. Results

3.1. Effects of Biochar–N Co-Application Treatments on Soil Physicochemical Properties

3.1.1. Effects of Biochar–N Co-Application Treatments on Soil Total Nutrient Content

The combined application of biochar–N significantly influenced TC (Figure 1A). TC in the BC1 treatment group was significantly higher than that in the BC2 and CK groups, with increases of 12.4% and 4.7%, respectively (p < 0.01). Under BC1 conditions, the UI-N treatment exhibited the most significant TC increase, surpassing the N1 treatment by 8.30%. The BC1+N2 treatment achieved the highest TC, exceeding other biochar–N combinations by 2.04% to 6.53%. Notably, TC under N1, N2, UI-N, and NI-N treatments initially increased then decreased with increasing biochar application rates, with all peaks occurring at the BC1 level, indicating that moderate biochar application (BC1) represents a critical threshold for optimizing carbon sequestration.
TN followed the order BC1 > BC2 > CK, with BC1 and BC2 groups showing increases of 21.42% and 6.41%, respectively, compared to the control (p < 0.01) (Figure 1B). The BC1 + N2 treatment yielded the highest TN, surpassing other treatments by 18.47% to 34.51%. Similarly to TC patterns, TN under N1, N2, UI-N, and NI-N treatments exhibited an initial increase followed by a decline with increasing biochar rates, with peak values at the BC1 level. Among equivalent N treatments, BC1+N1 showed the most significant increase in TN, exceeding the UI-N and NI-N treatments by 6.45% to 7.65%.
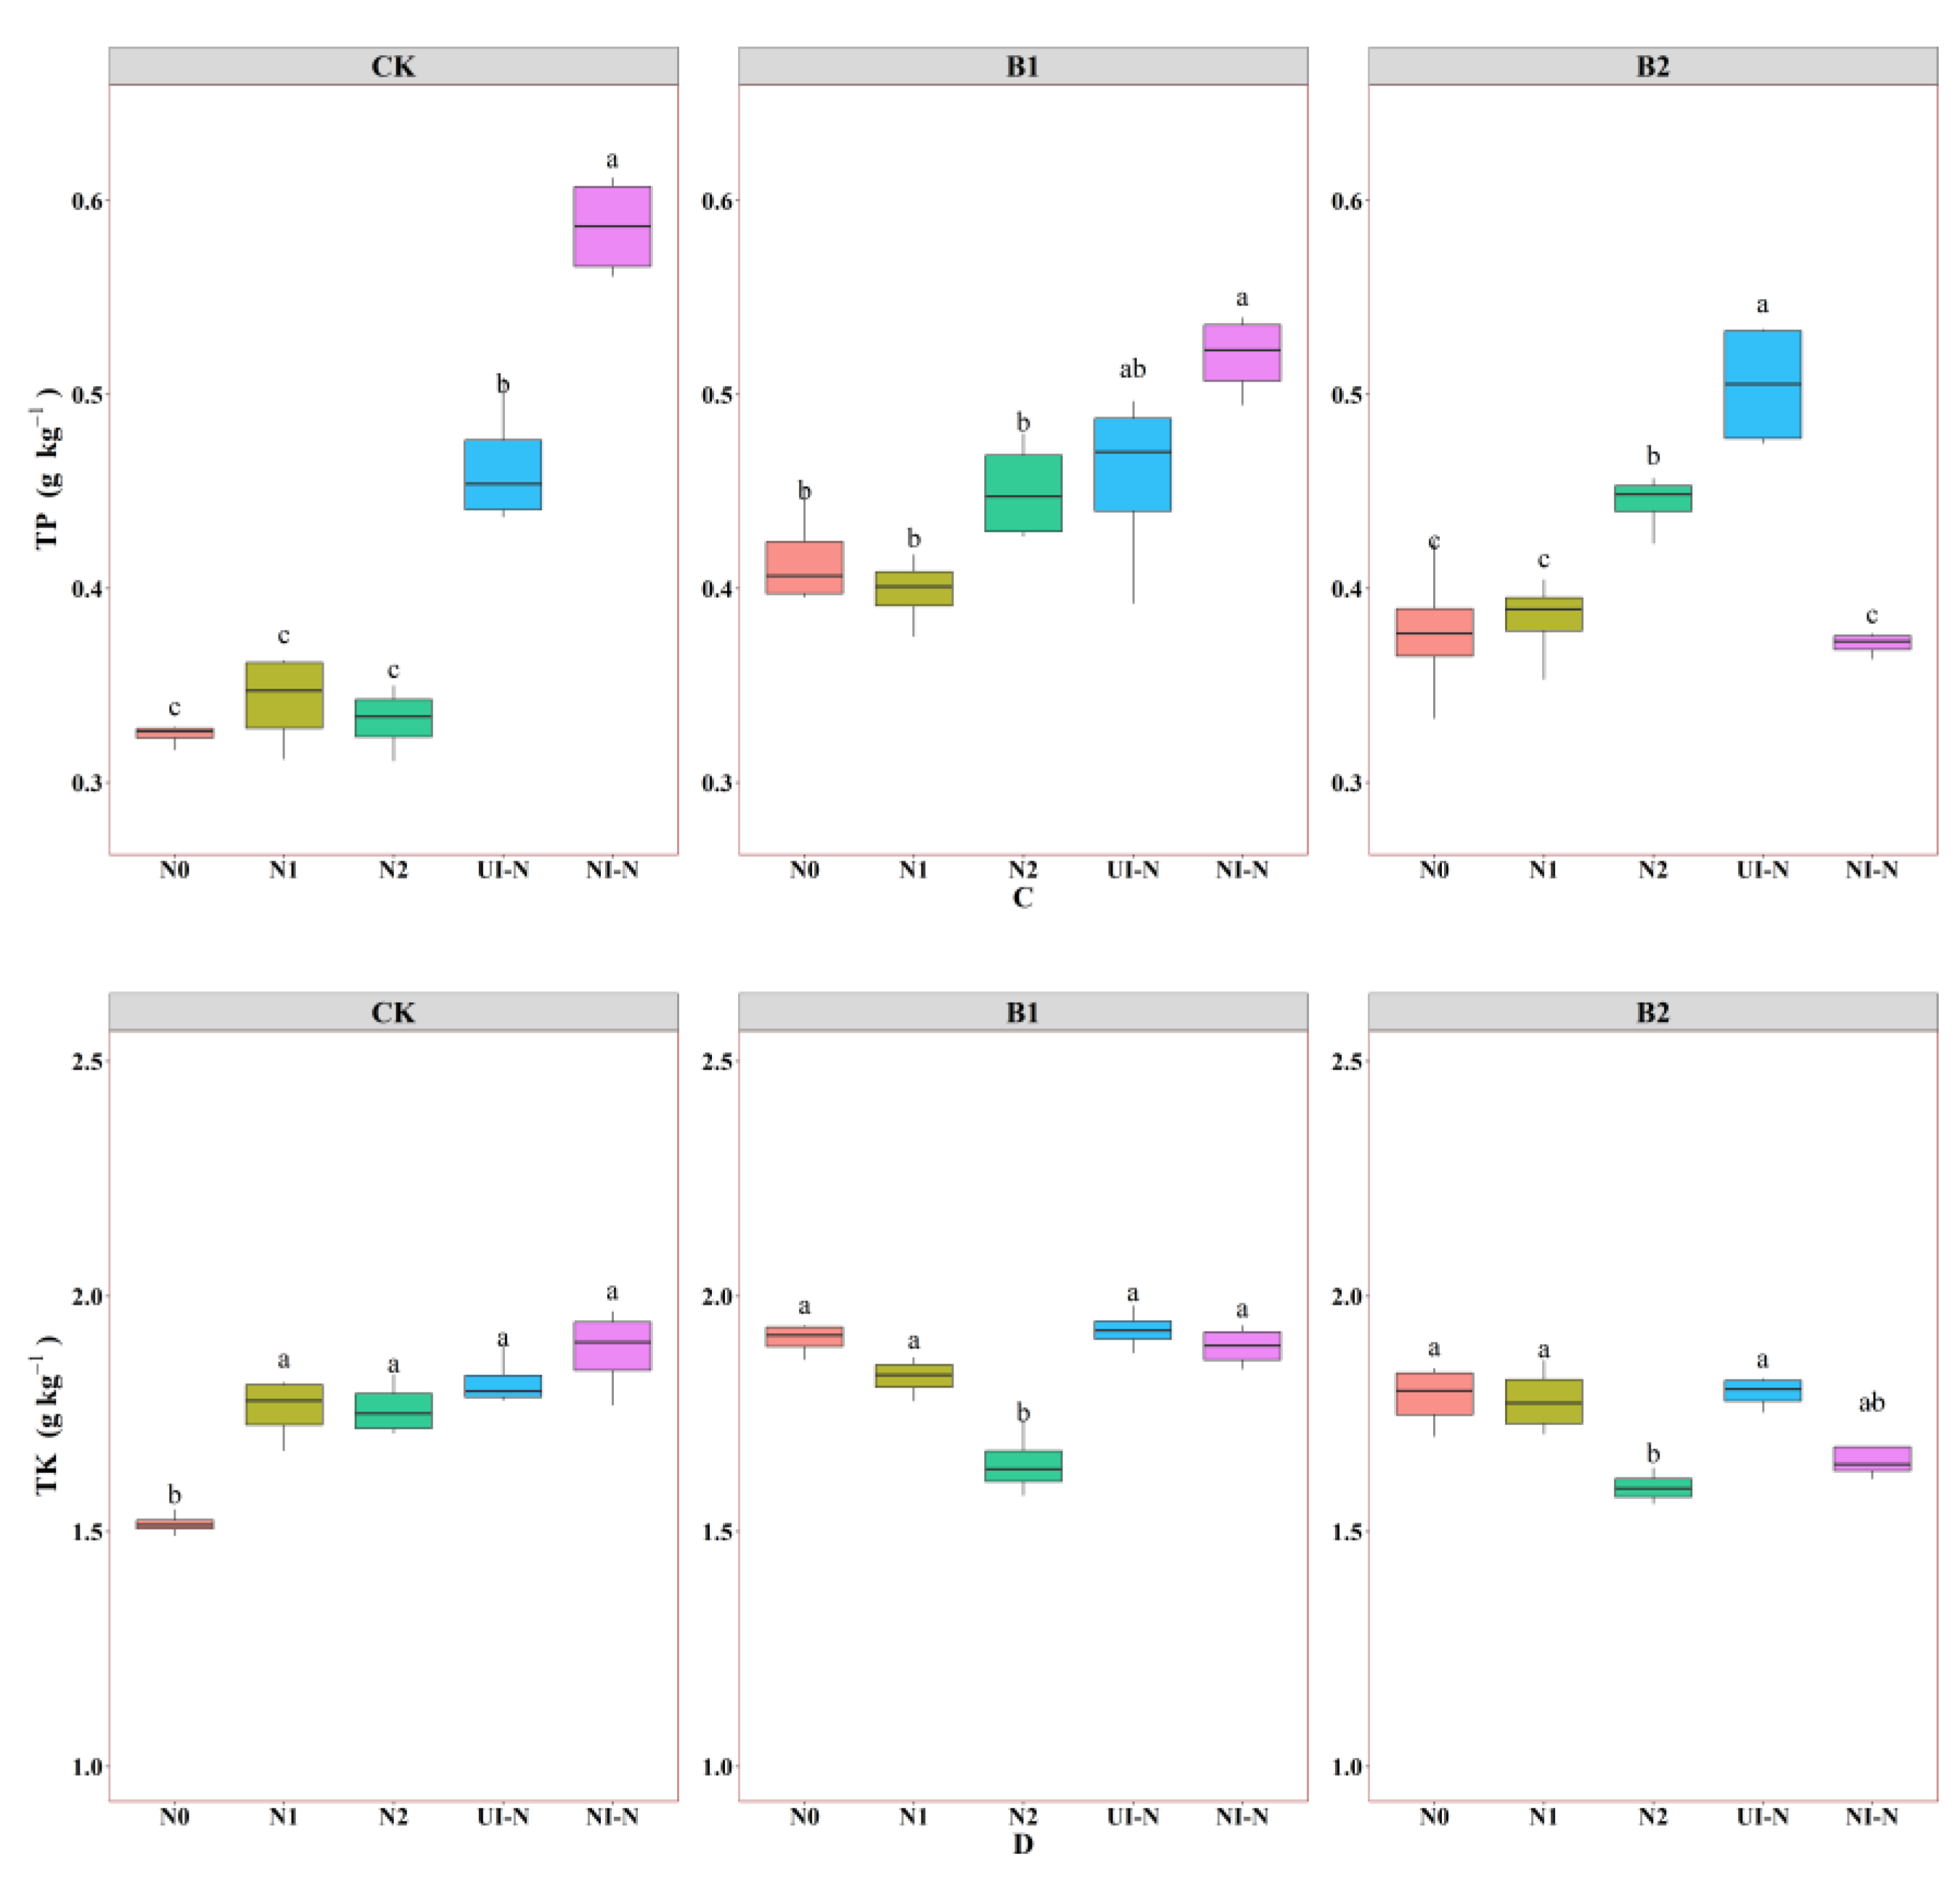
TP (Figure 1C) and TK (Figure 1D) were similarly affected by biochar–N co-application. TP followed the order BC1 > BC2 > CK, with BC1 showing increases of 8.70% and 10.29% over BC2 and CK groups, respectively. The BC1+NI-N treatment achieved the highest TP among the biochar–N co-application treatments, exceeding other BC1 treatments by 13.04–30.00% (p < 0.05). TK followed the pattern BC1 > CK > BC2, with BC1 showing increases of 6.64% and 12.26% over CK and BC2 groups, respectively. The BC1+N1 treatment produced the highest TK, surpassing other treatments by 2.81% to 15.09%. Collectively, these results demonstrate that biochar application at the BC1 level effectively enhances the total nutrient content of the soil.

3.1.2. Effects of Biochar–N Co-Application Treatments on Soil Available Nutrient Content

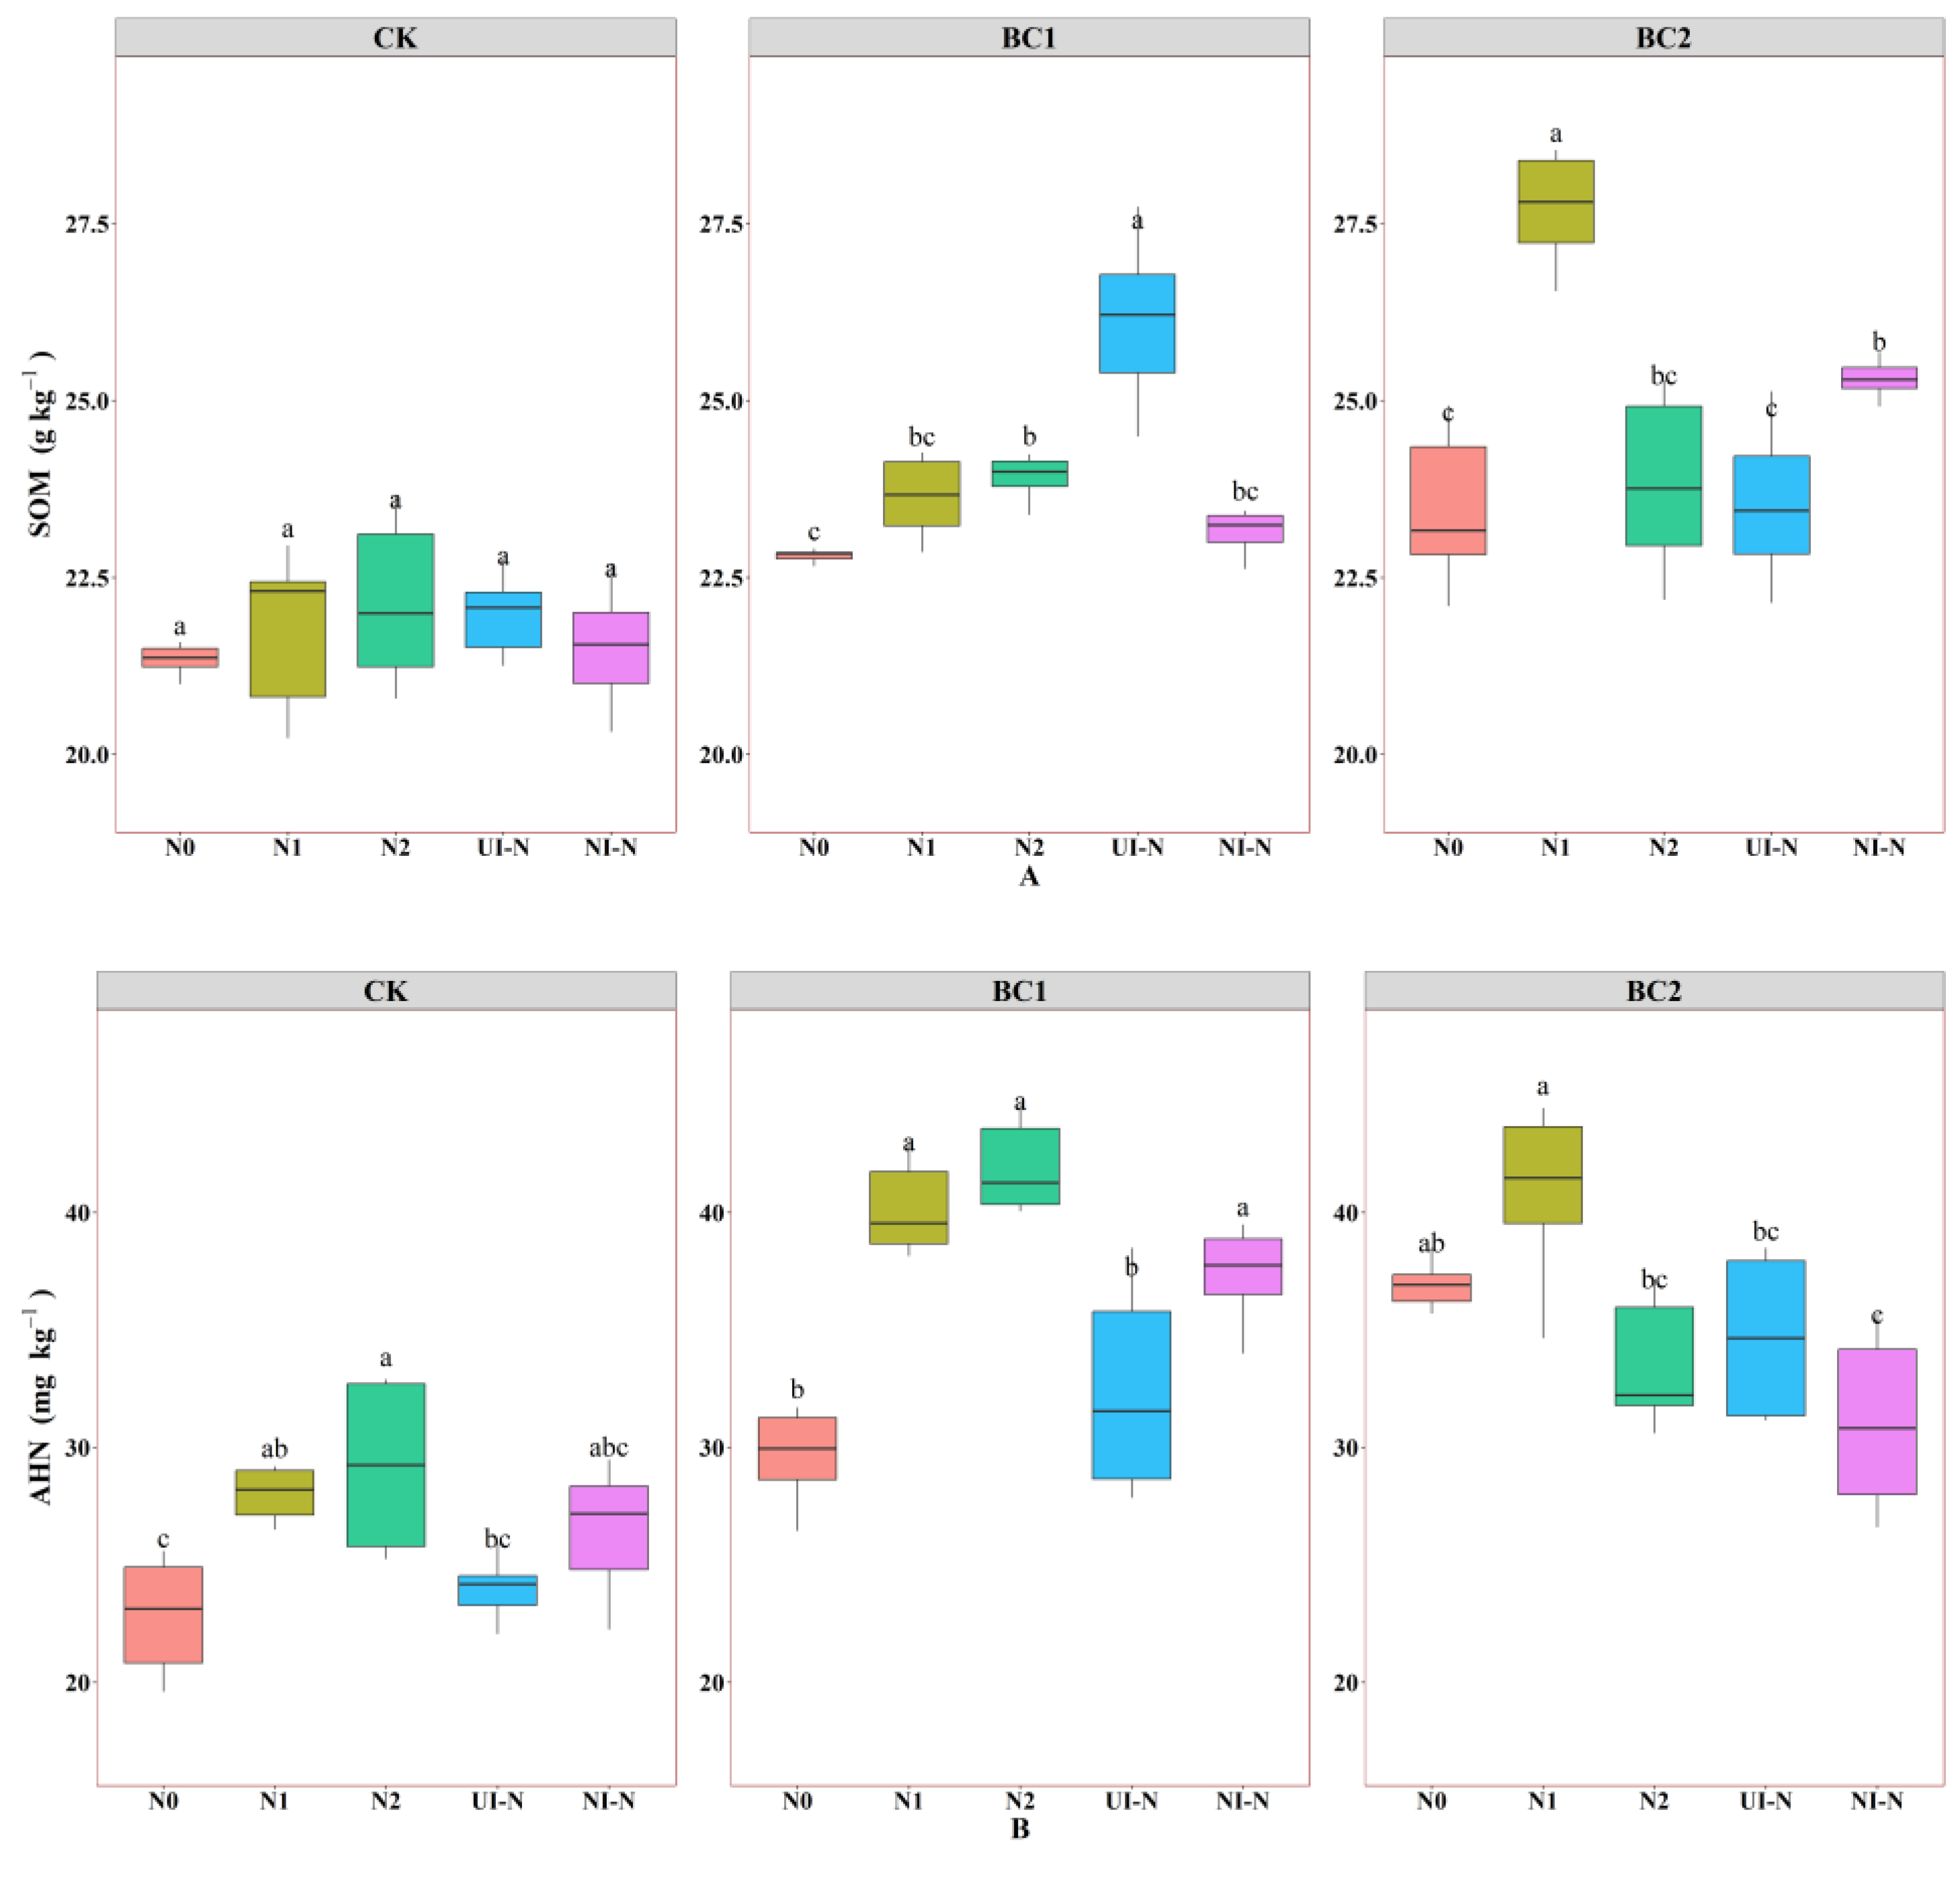
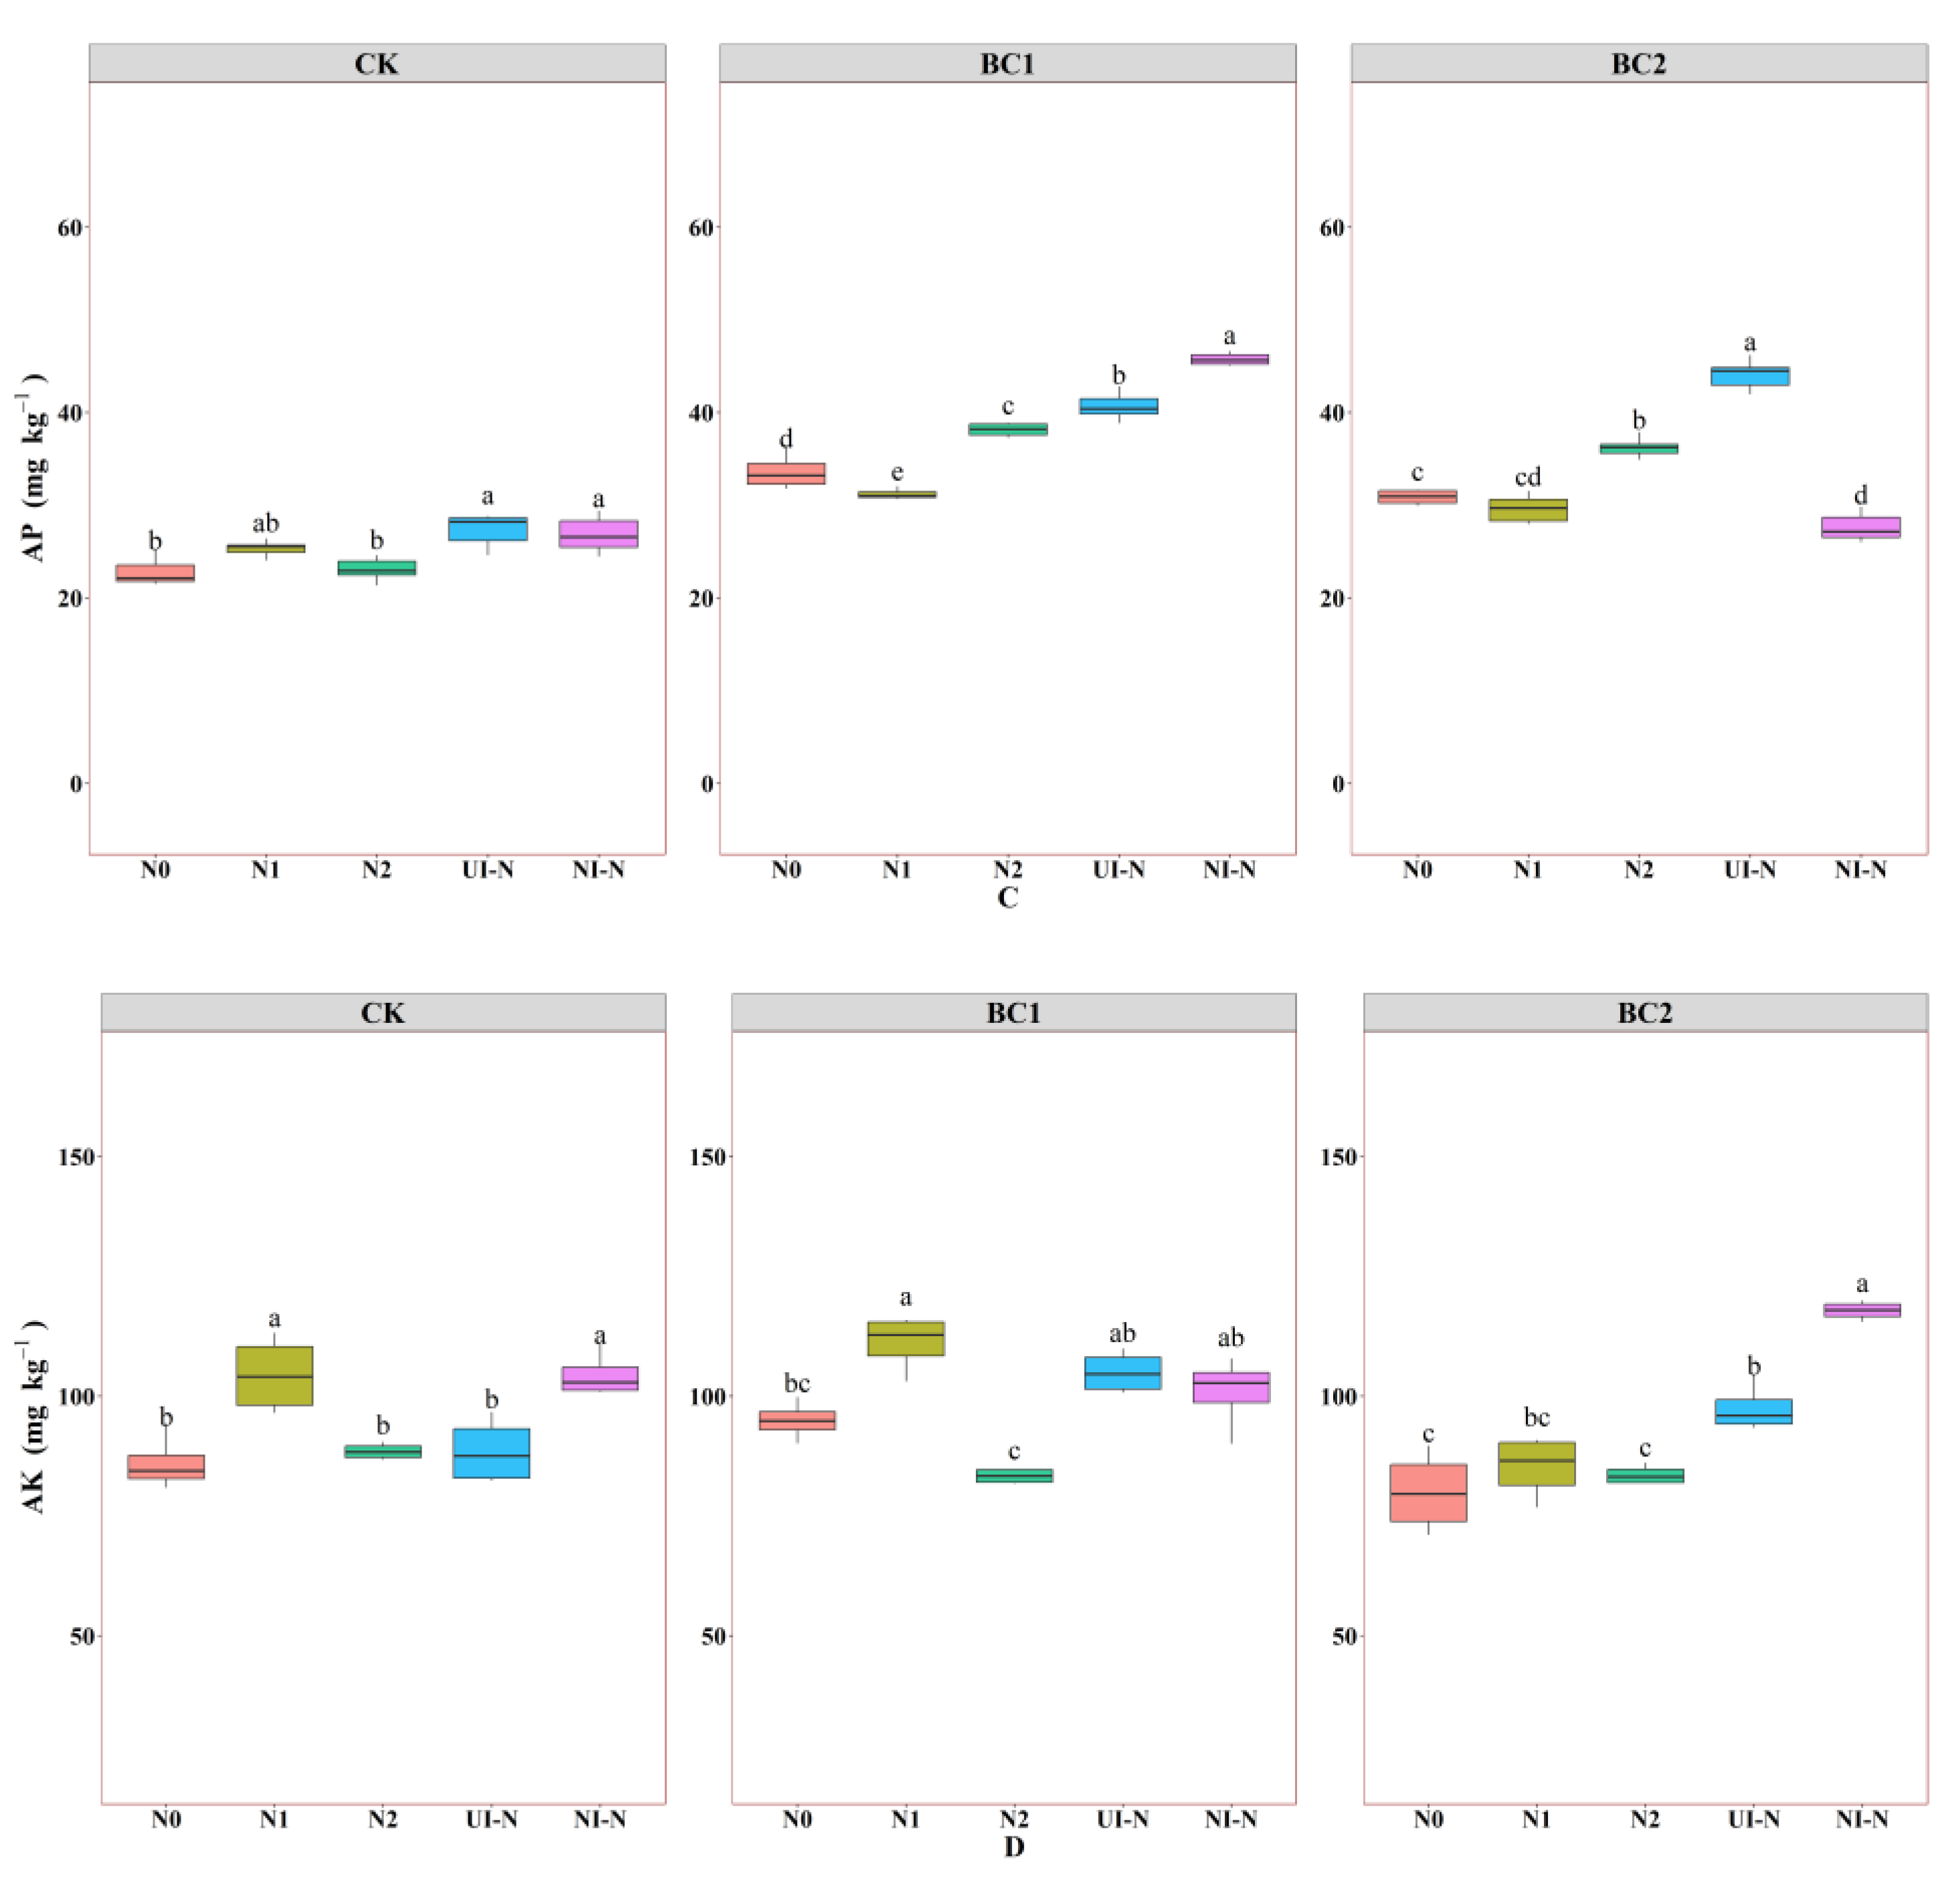
SOM followed the order BC2 > BC1 > CK, with BC2 showing increases of 3.53% and 13.88% over BC1 and CK groups, respectively (Figure 2A). The BC1 + UI-N treatment achieved the highest SOM within the BC1 group, exceeding the other treatments in the same group by 9.20% to 14.51% (p < 0.05). Among all biochar–N combinations, BC2 + N1 yielded the highest SOM, surpassing other treatments by 15.89–17.26%. AHN decreased in the order BC1 > BC2 > CK, with BC1 and BC2 groups showing increases of 35.69% and 39.11% over the control, respectively (Figure 2B). The BC1 + N2 treatment produced the highest AHN, exceeding that of other treatments by 2.57% to 25.16%. Both individual applications of nitrogen fertilizer or biochar promoted AHN accumulation, with combined biochar–N applications at an appropriate biochar dosage demonstrating superior efficacy compared to single applications. AP showed differential responses to the co-application of biochar–N (Figure 2C). Under N0, N1, N2, and NI-N treatments, AP content initially increased then decreased with increasing biochar rates, whereas UI-N treatment showed a continuous upward trend. Treatment efficacy followed the order UI-N > N2 > NI-N > N1. The BC1 + NI-N treatment achieved the highest AP, significantly exceeding BC1 + N1 and BC1 + N2 treatments by 46.63% and 19.89%, respectively (p < 0.05). AK exhibited varied responses among treatments (Figure 2D). Under N0, N1 and UI-N treatments, AK showed an initial increase followed by a decline with increasing biochar rates, while N2 treatment displayed an opposite trend. The AK under biochar–N combinations followed the order NI-N > UI-N > N1 > N2. The BC2 + NI-N treatment achieved the highest AK, surpassing BC1 + N1 by 6.06%. Overall, biochar–N co-application significantly enhanced soil available nutrient content.

3.1.3. Effects of Biochar–N Co-Application on Soil Micronutrients and Trace Elements

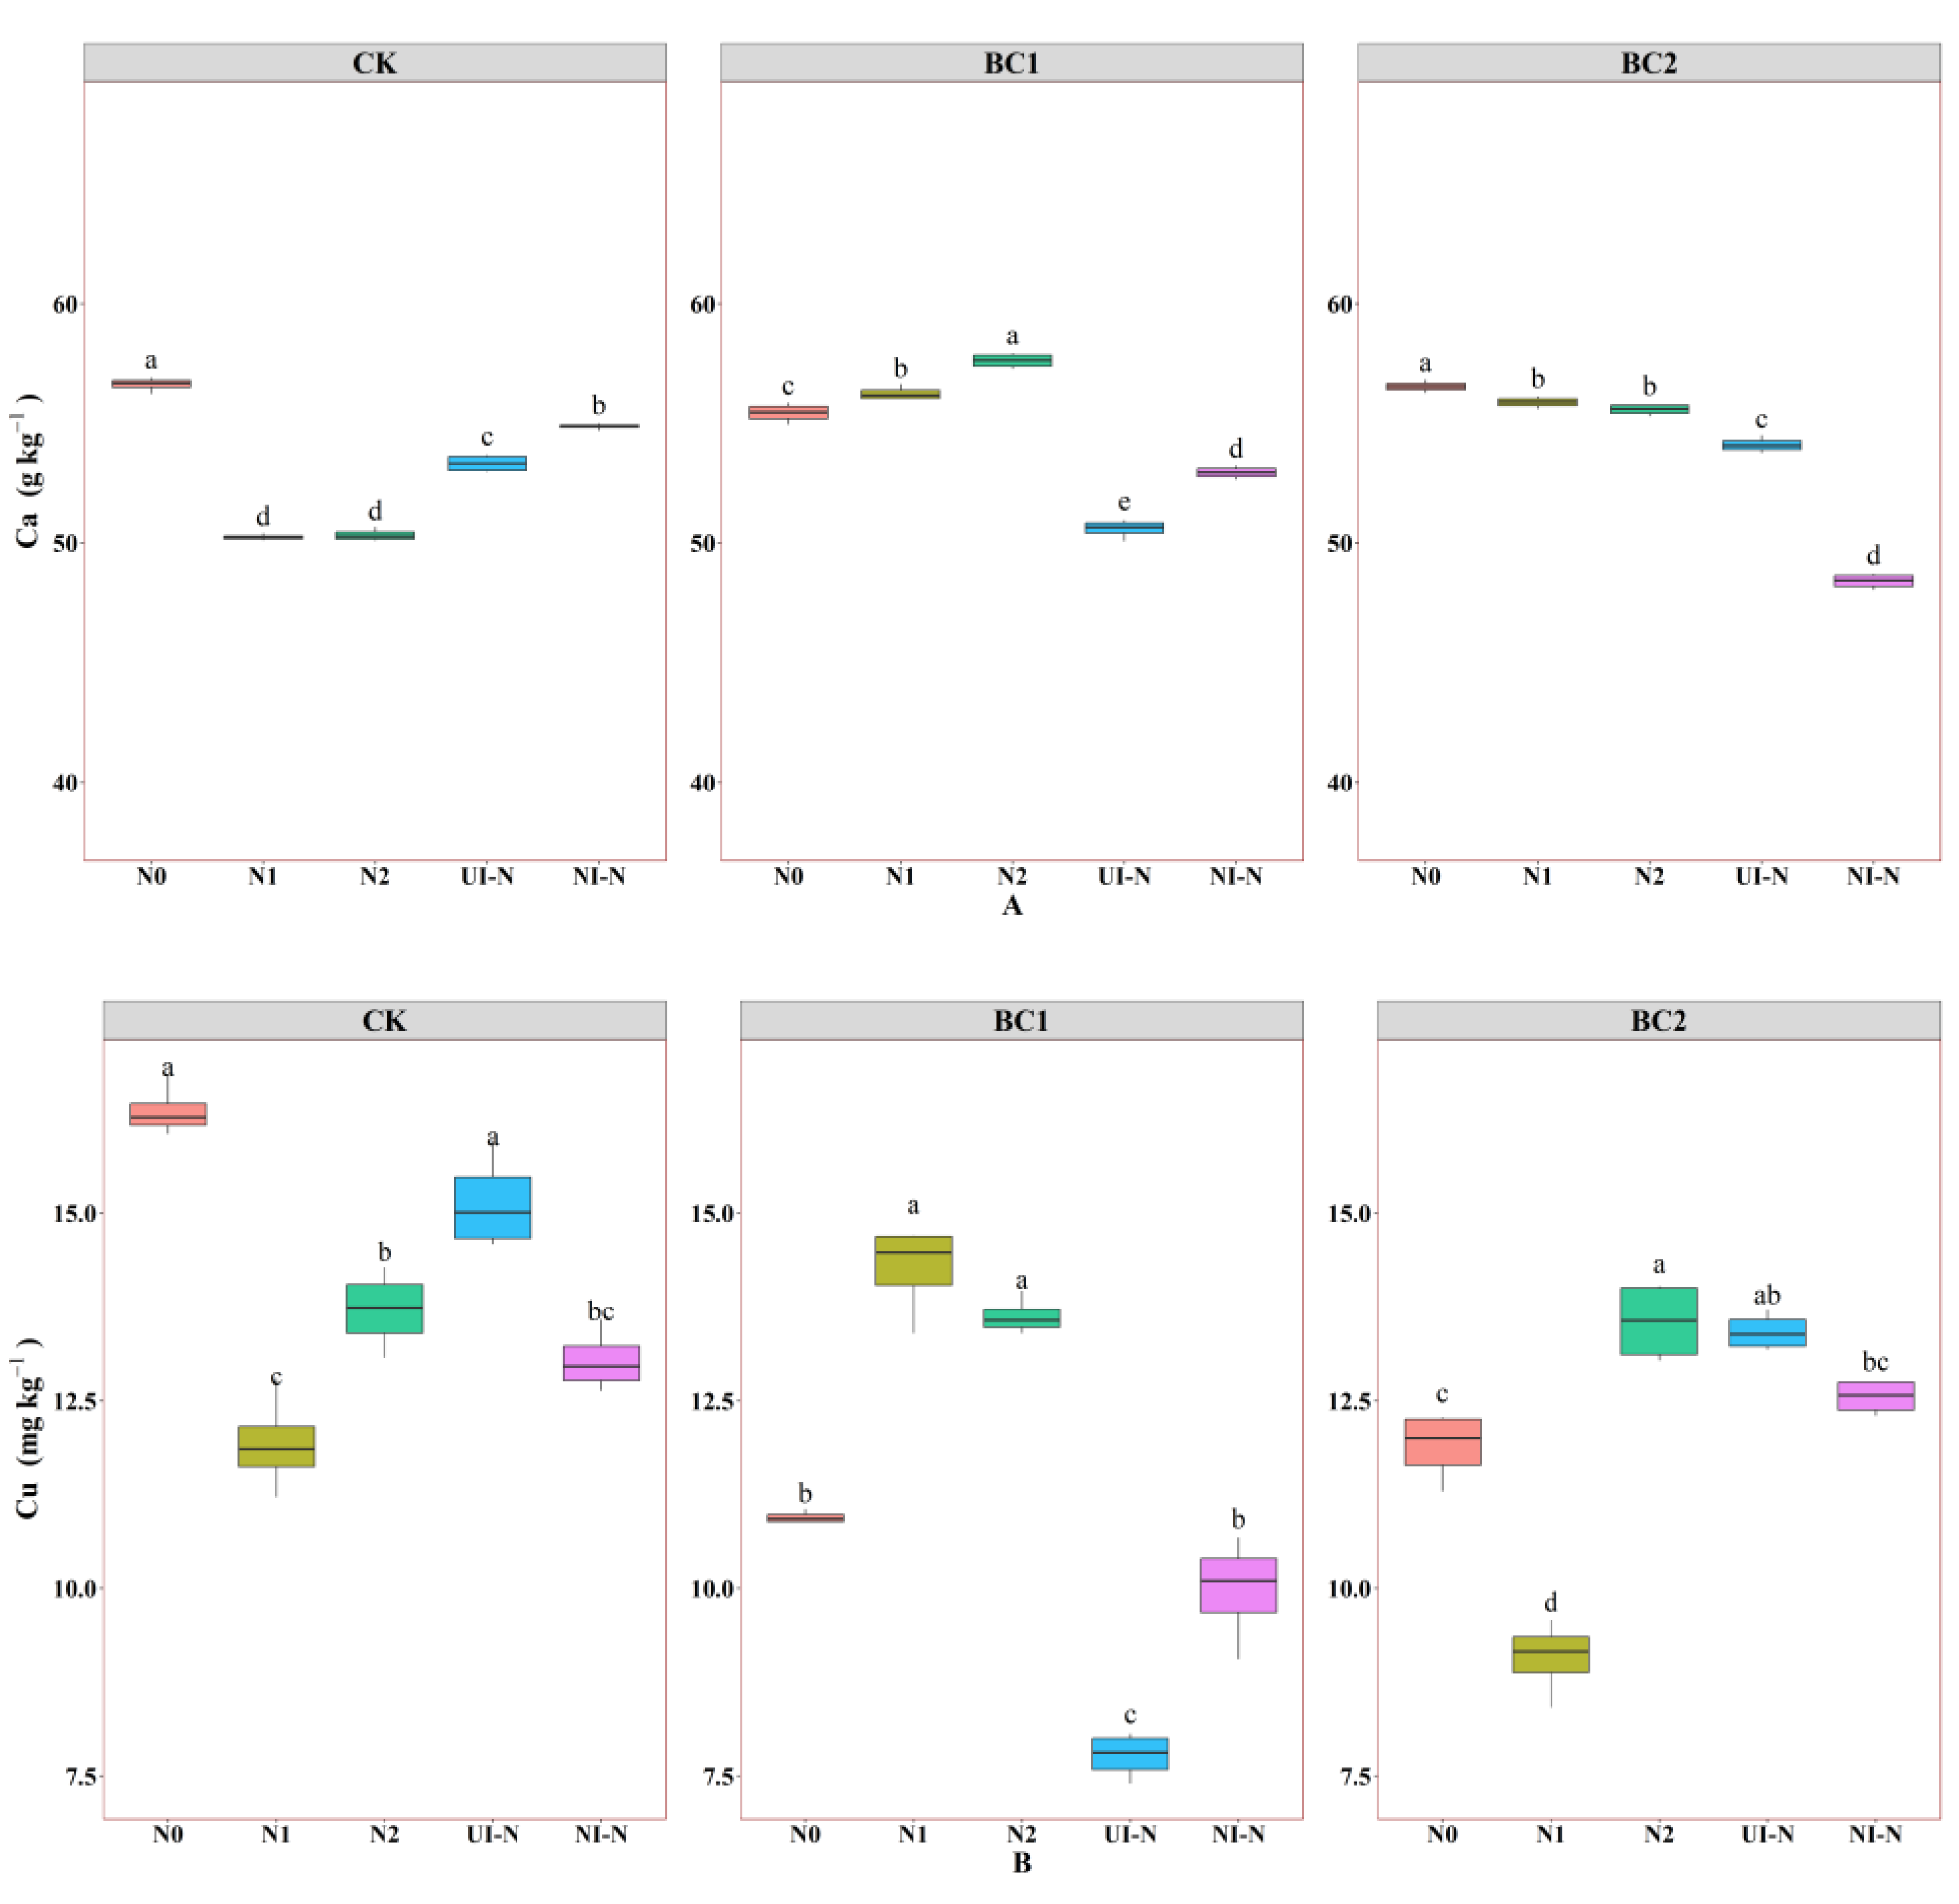
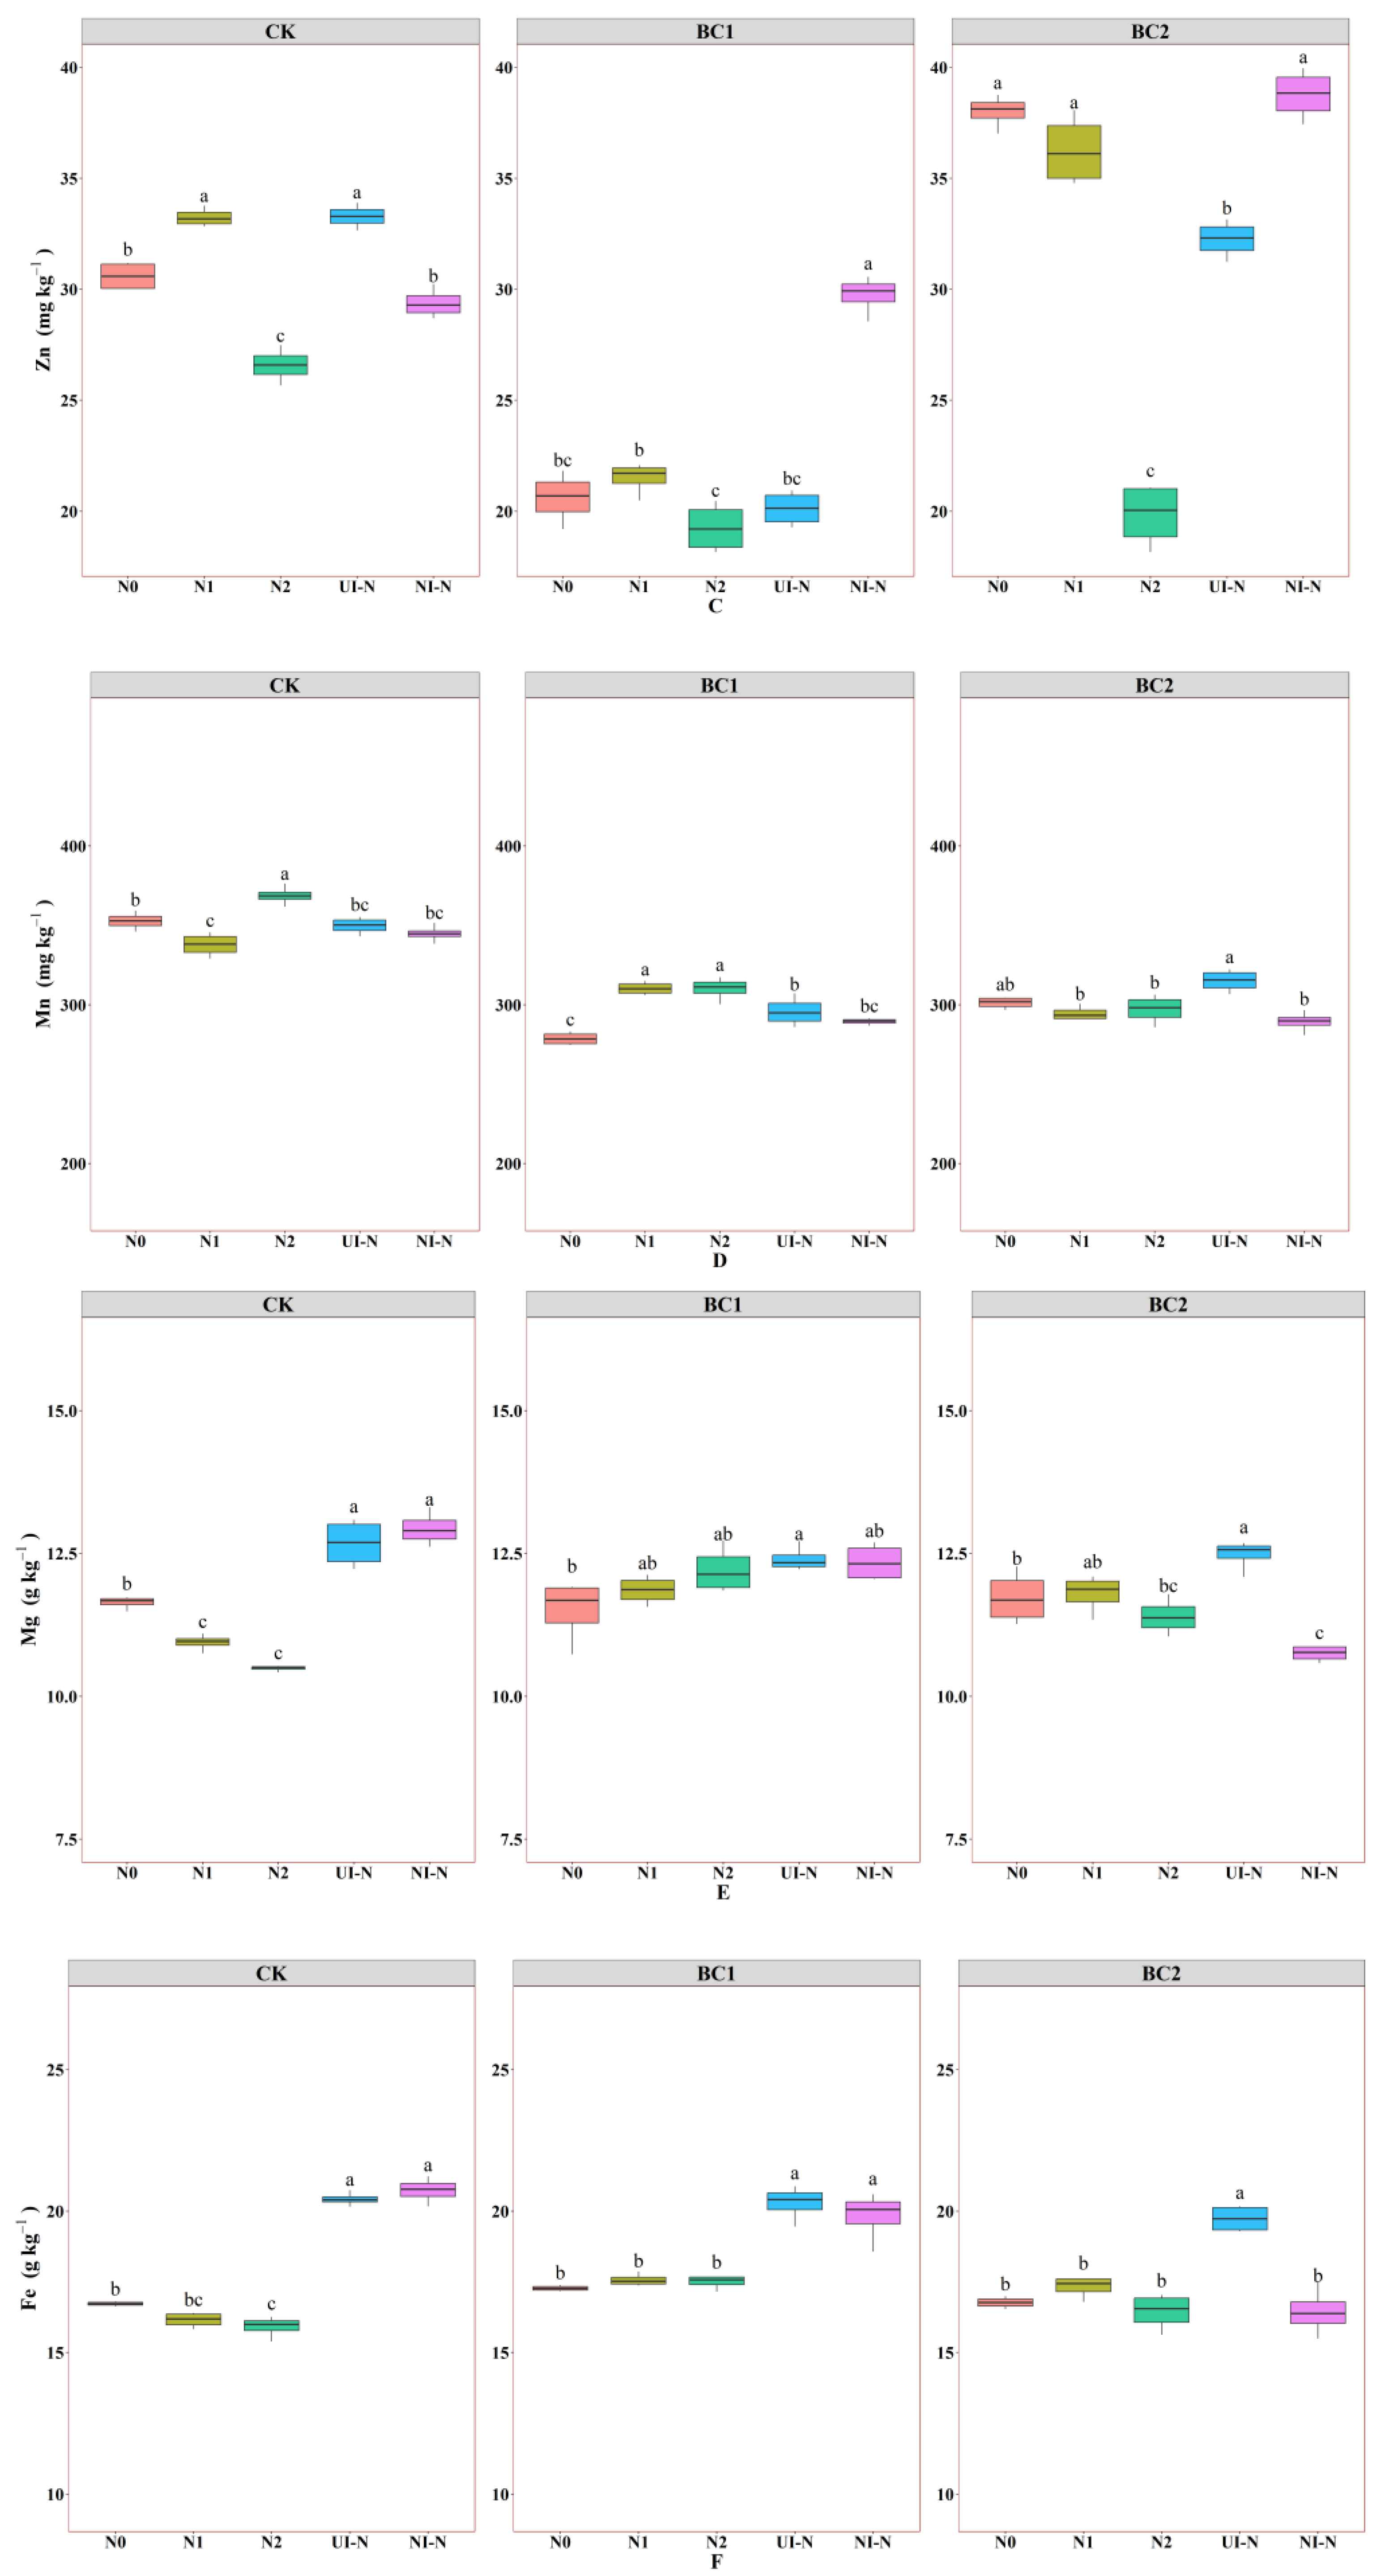
Fertilizer application significantly affects the content of macro and trace elements in the soil (Figure 3). In the control group, N treatments reduced Ca and Cu, with N1 treatment showing the most significant decreases of 11.30% and 27.08%, respectively (p < 0.05). Zn increased by 8.66% and 8.79% under N1 and UI-N treatments, respectively. Mn decreased under mst N treatments, except for N2, which increased it by 4.55%. UI-N and NI-N treatments significantly enhanced Mg and Fe, with NI-N producing the most significant increases of 11.18% and 23.98%, respectively. In the BC1 group, N1 and N2 treatments increased Ca and Cu by 3.95% and 30.35%, respectively, relative to N0, whereas UI-N and NI-N treatments showed decreasing trends. Biochar–N co-application generally enhanced Mn, Mg, and Fe, with the N1 treatment producing the most significant Mn increase (11.35%) and the UI-N treatment yielding the highest increases in Mg (7.83%) and Fe (17.77%). The BC2 group exhibited similar patterns, with N2 treatment increasing Cu by 13.96% and UI-N treatment showing the most pronounced effects on Mn, Mg, and Fe, with increases of 4.61%, 6.39%, and 17.72%, respectively. Fe decreased with increasing biochar rates under UI-N and NI-N treatments but showed an initial increase followed by a decline under N0, N1, and N2 treatments. Zn exhibited a similar biphasic response pattern under N0, N1, N2, and UI-N treatments, with BC2 + N1 showing the maximum increase. Overall, biochar–N co-application suppressed soil levels of Ca, Cu, and Mn, while enhancing those of Mg and Fe; Zn responses varied depending on the specific treatment combinations.

3.1.4. Effects of Biochar–N Co-Application on pH and EC

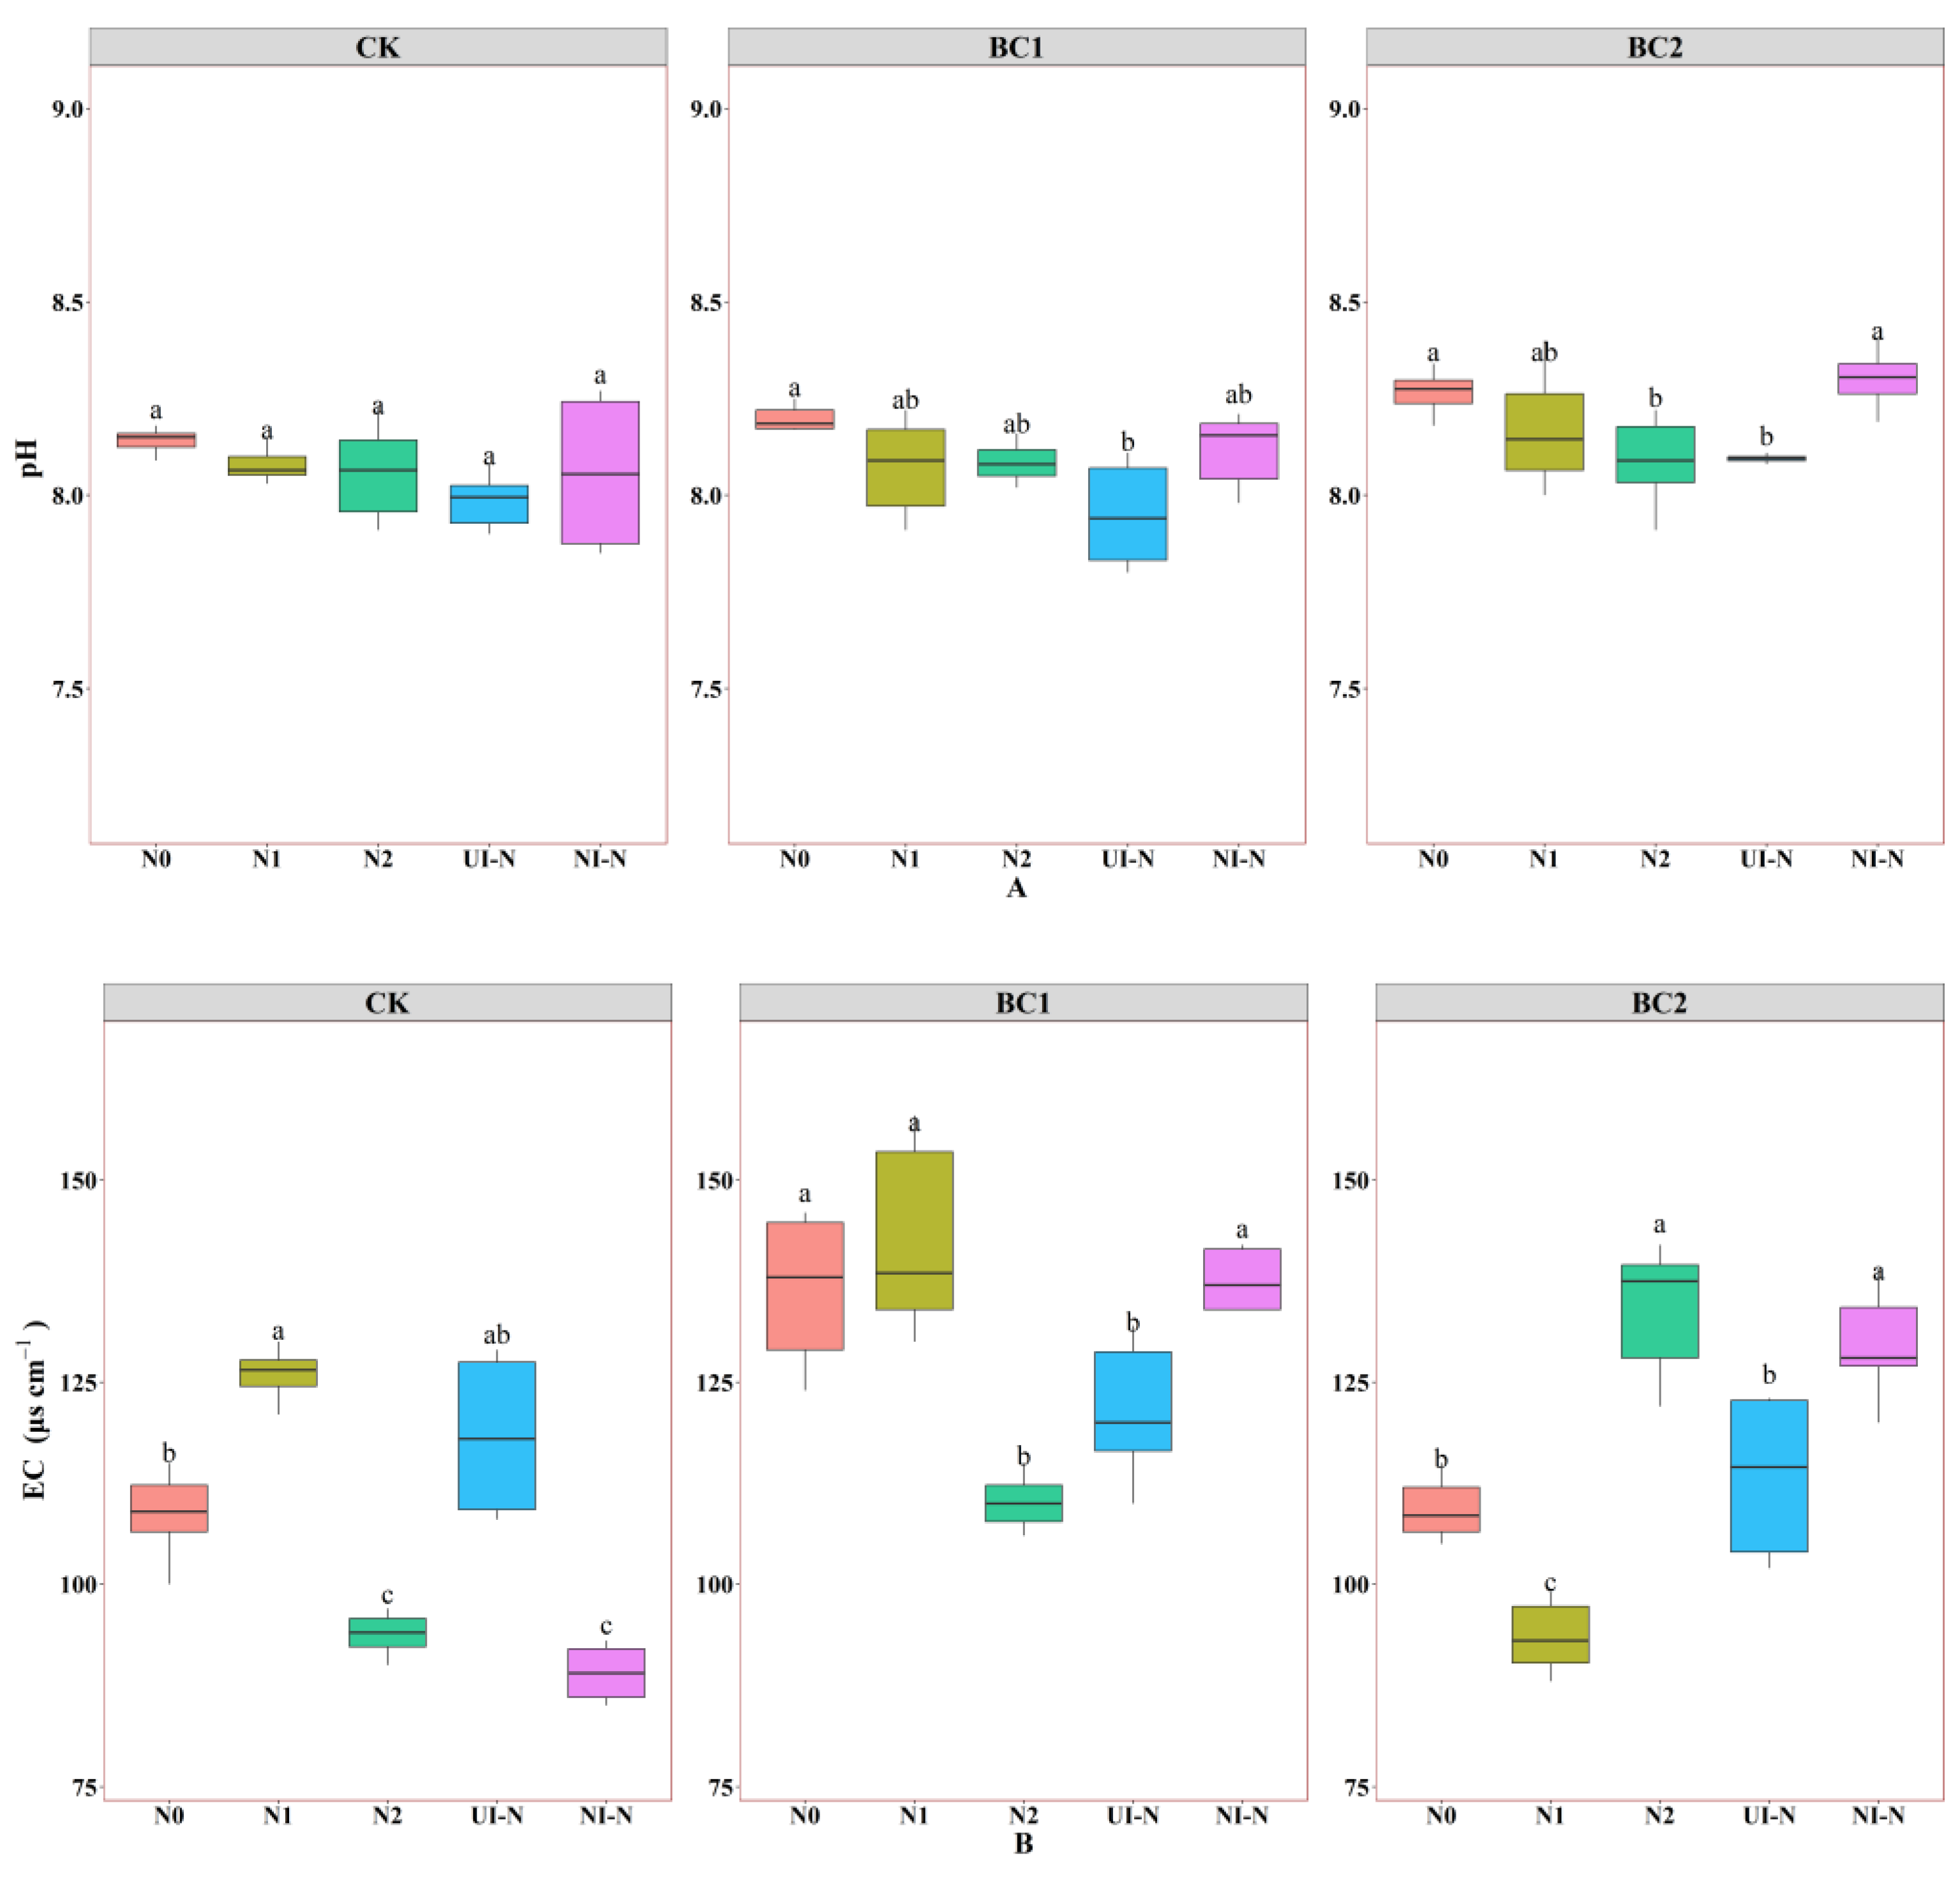
Soil pH following N fertilizer application (Figure 4A) showed that in the control group, UI-N treatment decreased pH by 1.84% compared to N0 (p < 0.05). In the BC1 group, N treatments reduced pH by 0.98% to 3.05% relative to biochar alone, with UI-N exhibiting the most significant reduction. The BC2 group showed the lowest pH under N2 treatment, with a 2.18% decrease compared to the N0 group. The effects of different N fertilizer types on pH followed the order: UI-N < N2 < N1 < NI-N. Notably, UI-N combined with biochar significantly decreased soil pH, whereas NI-N showed an increasing effect. The BC1 + UI-N treatment resulted in the maximum pH reduction, decreasing by 1.49% to 2.69% compared to conventional N fertilizer-biochar combinations. EC exhibited a parallel pattern (Figure 4B). In the control, N2 and NI-N lowered EC by 13.7% (95% CI 11.9–15.5%) and 18.7% (95% CI 16.9–20.6%), respectively. Biochar reversed the NI-N effect, increasing EC, while BC2 + N1 achieved the greatest net reduction (ΔEC= −14.9%, 95% CI −16.8% to −13.1%). Overall, co-application of biochar and urease-inhibitor N fertiliser reduced both pH and EC relative to either amendment alone (ΔEC range −13.7% to −5.3%, 95% CI −15.6% to −3.5%).

3.2. Effects of Biochar–N Co-Application on Soil Enzyme Activity

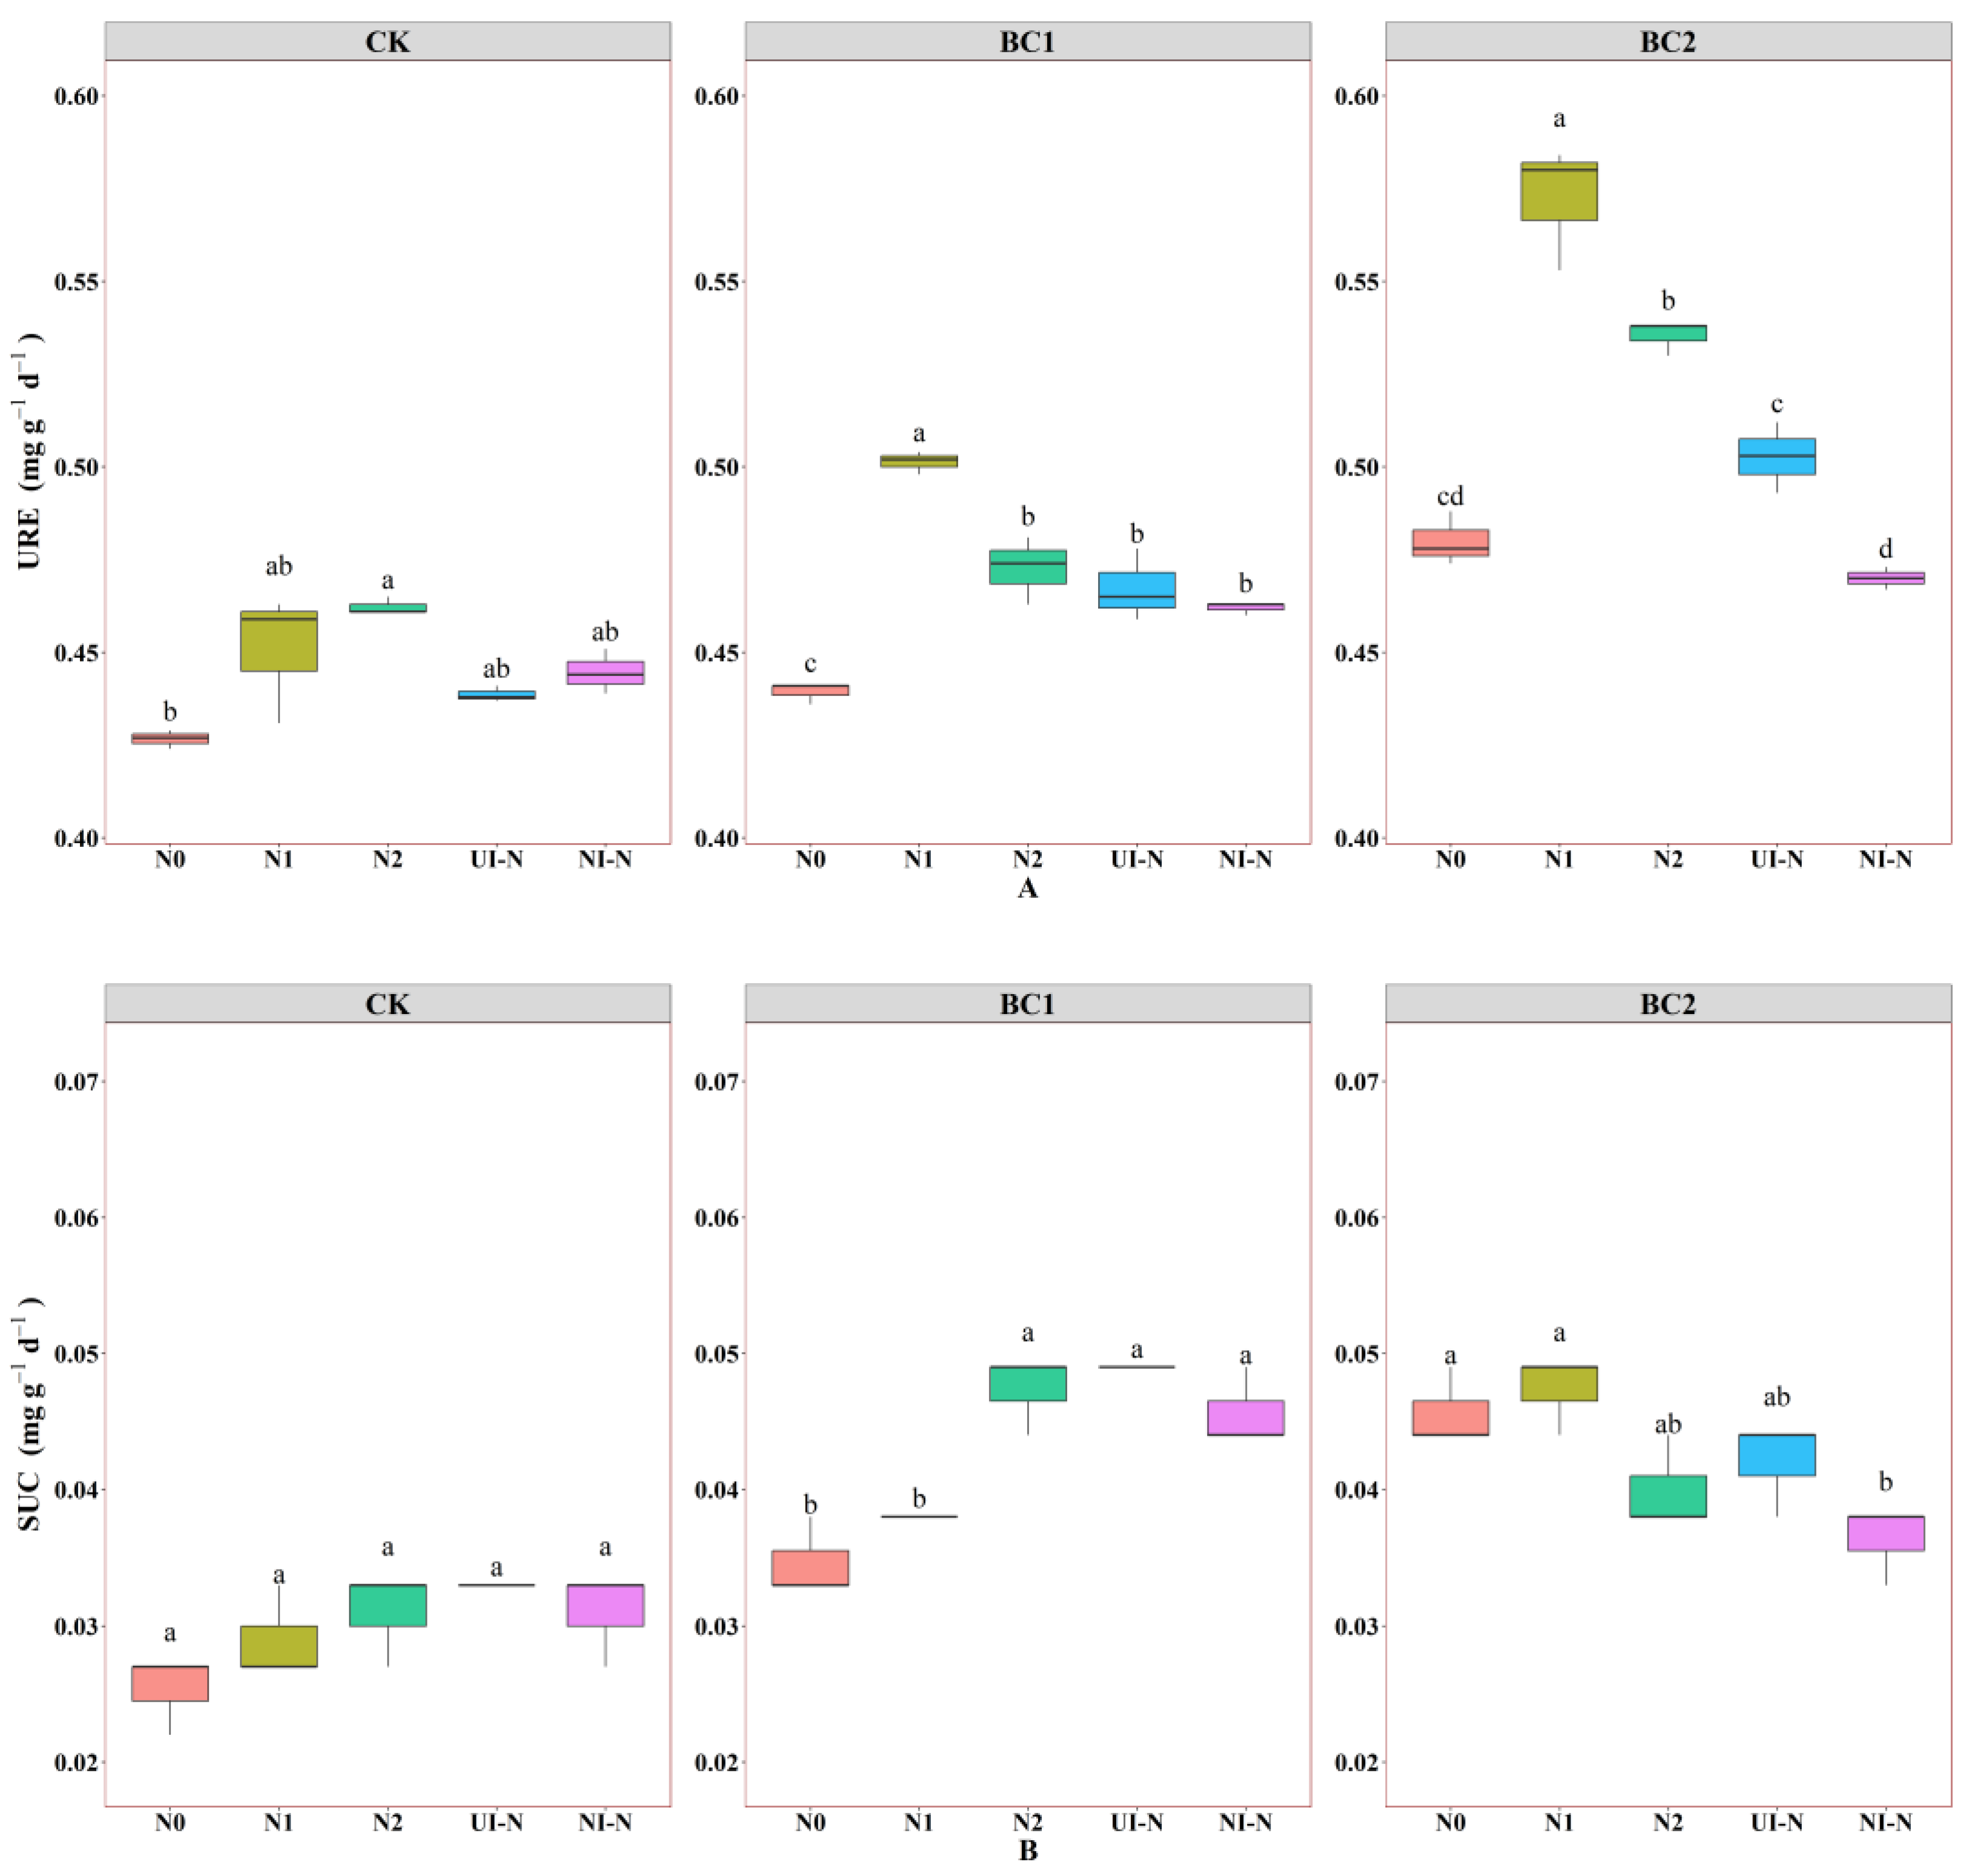
URE exhibited highly significant differences among biochar–N co-application treatments (p < 0.01) (Figure 5A). N fertilizer application universally enhanced URE, with increases of 4.22–8.20%, 5.24–14.12%, and 4.79–19.17% in CK, BC1, and BC2 groups, respectively, compared to N0 treatments. URE increased progressively with the biochar application rate, with the BC2 + N1 treatment achieving the maximum values, exceeding those of BC2 + UI-N and BC2 + NI-N by 13.72% and 21.70%, respectively. The efficacy of different N fertilizer types followed the order: N1 > N2 > UI-N > NI-N. Inhibitor-enhanced N fertilizers, combined with biochar, suppressed URE, with CK + UI-N and BC1 + NI-N showing reductions of 2.66% to 23.25% and 2.33% to 19.23%, respectively, compared to conventional N fertilizer treatments.
SUC demonstrated differential response patterns (Figure 5B). N treatments significantly enhanced SUC in the CK and BC1 groups, with increases of 19.23–26.92% and 37.14–40.00% relative to N0, respectively. In contrast, N2 and NI-N treatments in the BC2 group reduced activity by 13.04% and 19.57%, respectively. Under N0 and N1 treatments, SUC increased continuously with biochar application, while N2, UI-N, and NI-N treatments exhibited an initial increase followed by a decline. Treatment efficacy followed the order: UI-N > N2 > N1 > NI-N, with BC1 + UI-N increasing activity by 2.08% to 68.97% compared to conventional N-biochar combinations.
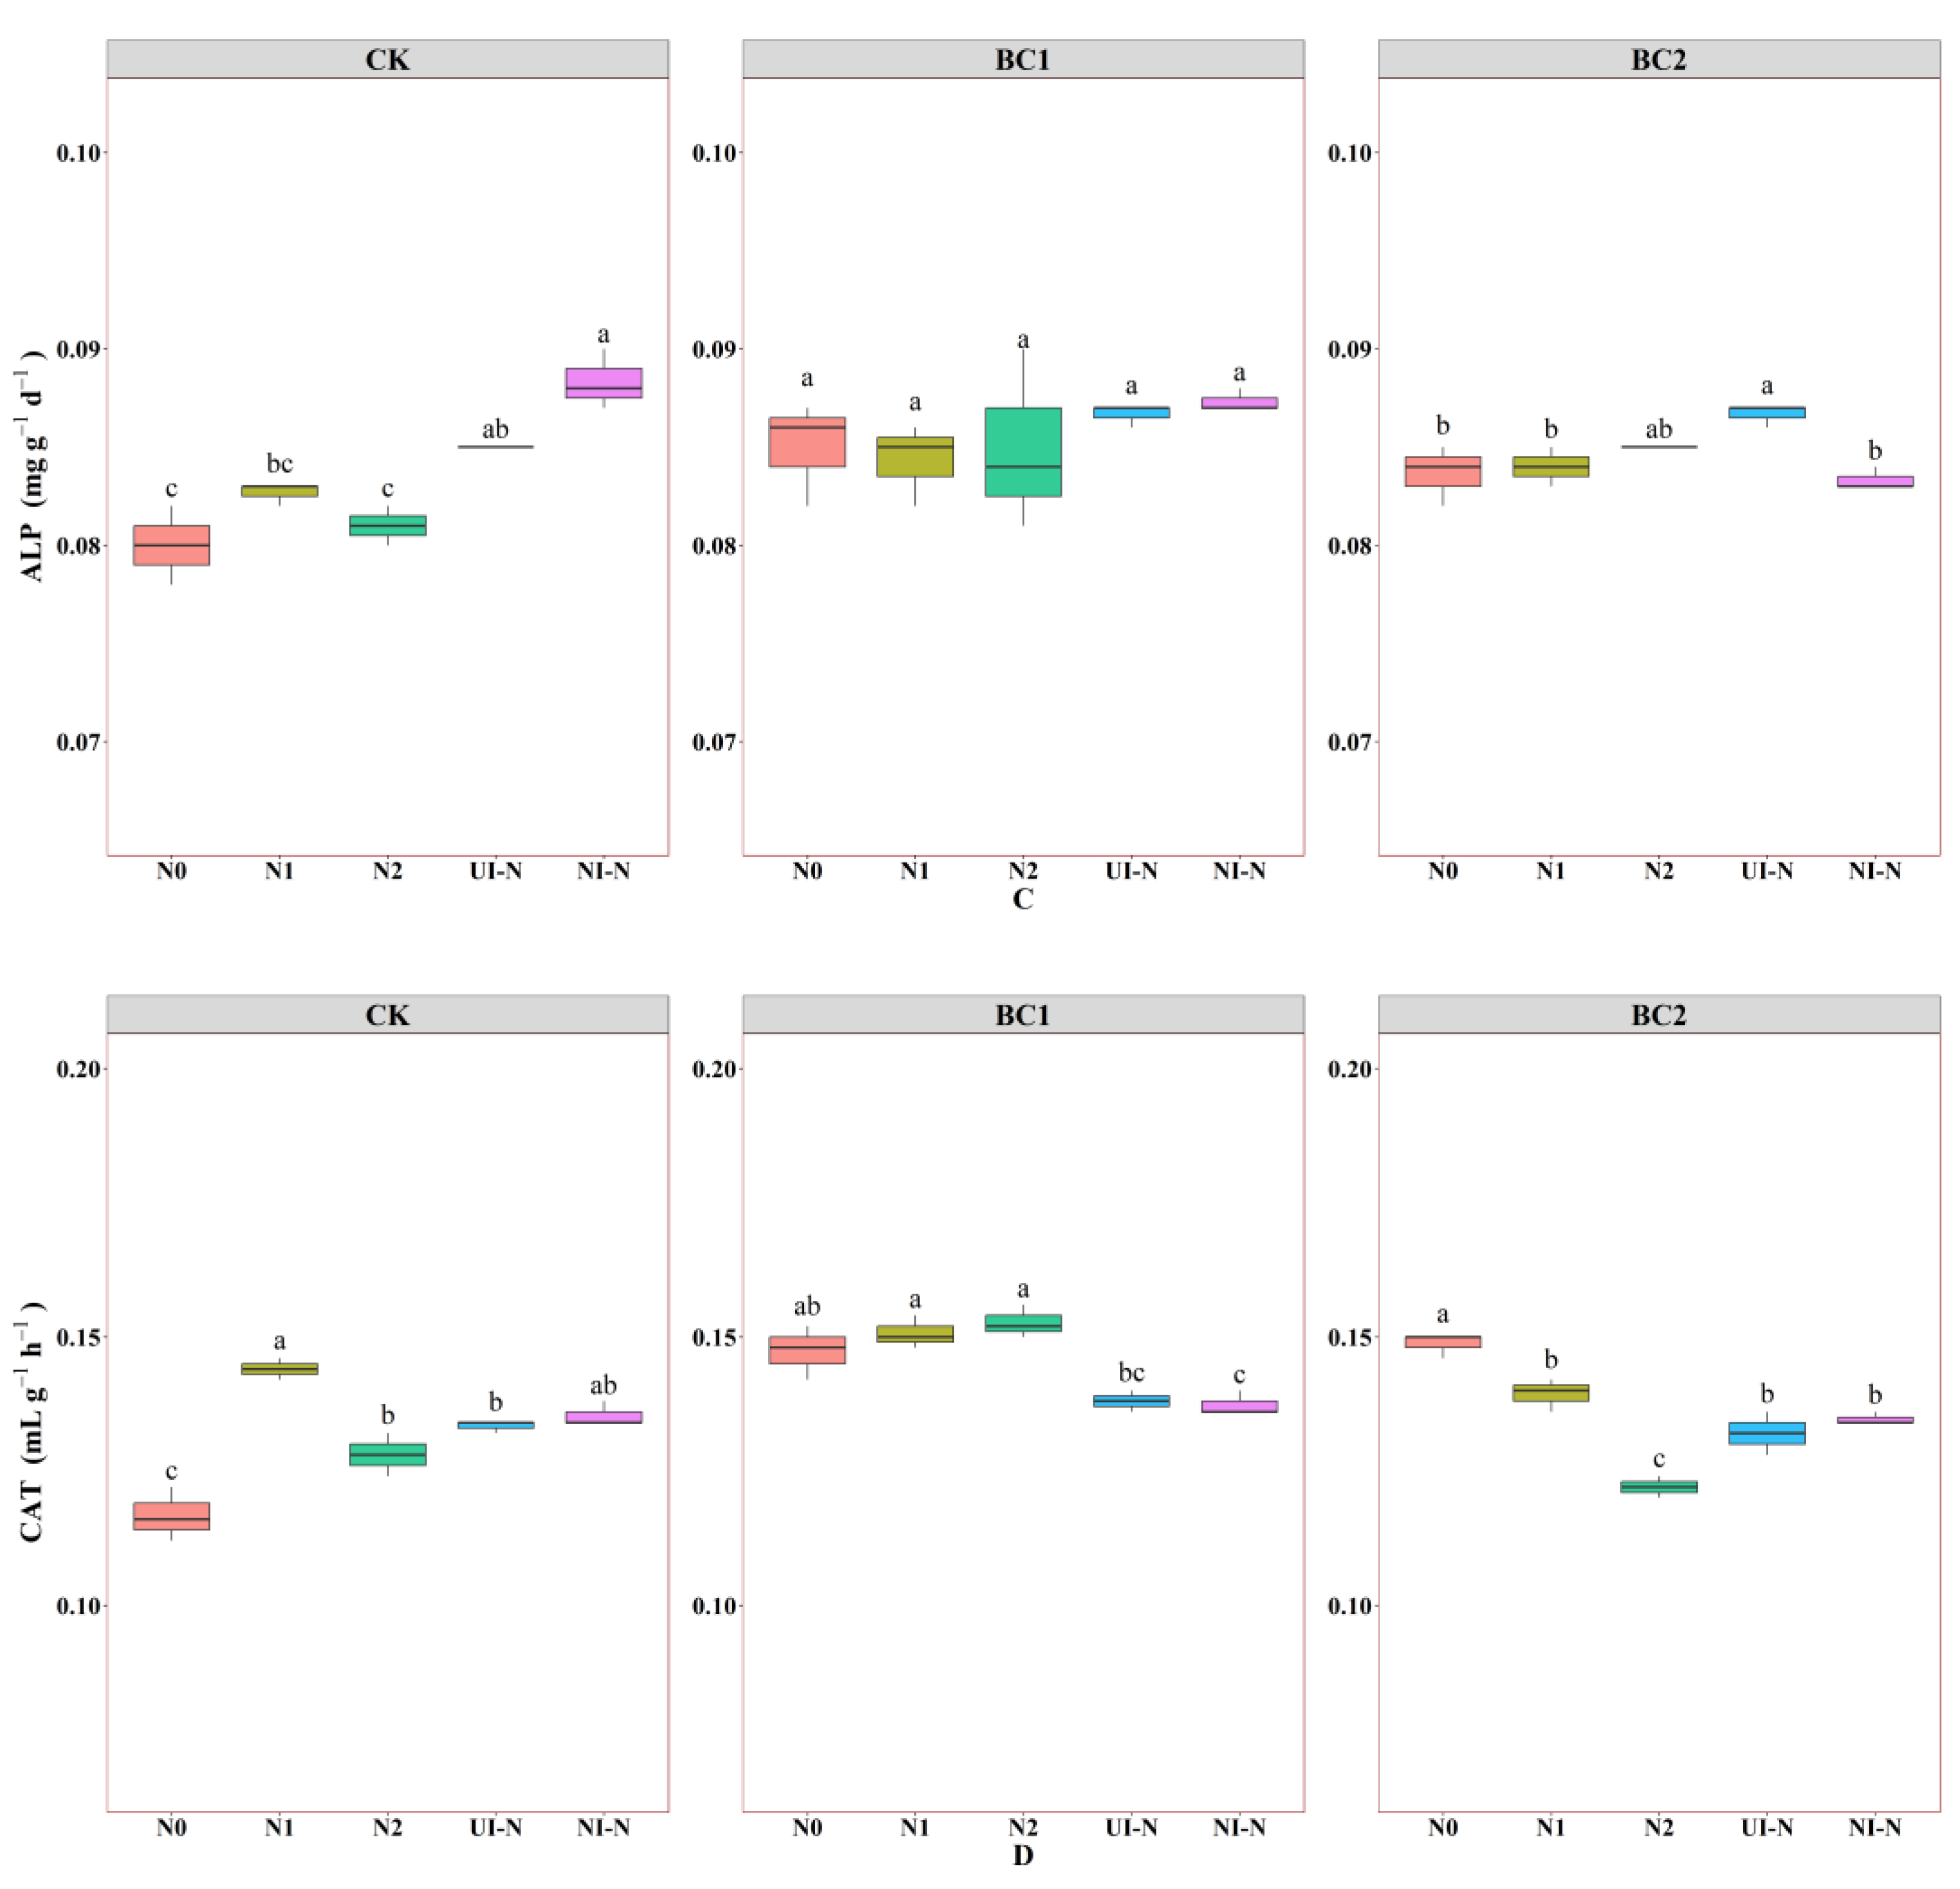
ALP and CAT displayed contrasting responses (Figure 5C,D). ALP was enhanced under UI-N and NI-N treatments, with increases of 6.25% to 10.00% in the CK group. The activity hierarchy among nitrogen treatments was as follows: UI-N > NI-N > N2 > N1. CAT increased by 9.40–23.08% under N treatments in the CK group, but decreased by 6.12–6.80% and 6.71–18.12% under UI-N and NI-N treatments in BC1 and BC2 groups, respectively. The BC1 + N2 treatment produced maximum CAT, exceeding BC1 + UI-N and BC1 + NI-N by 9.42% and 10.22%, respectively.

3.3. Effects of Biochar–N Co-Application on Soil Microbial Community Architecture

3.3.1. Effects of Biochar–N Co-Application on the Abundance of Soil Bacterial and Fungal Microbial Communities

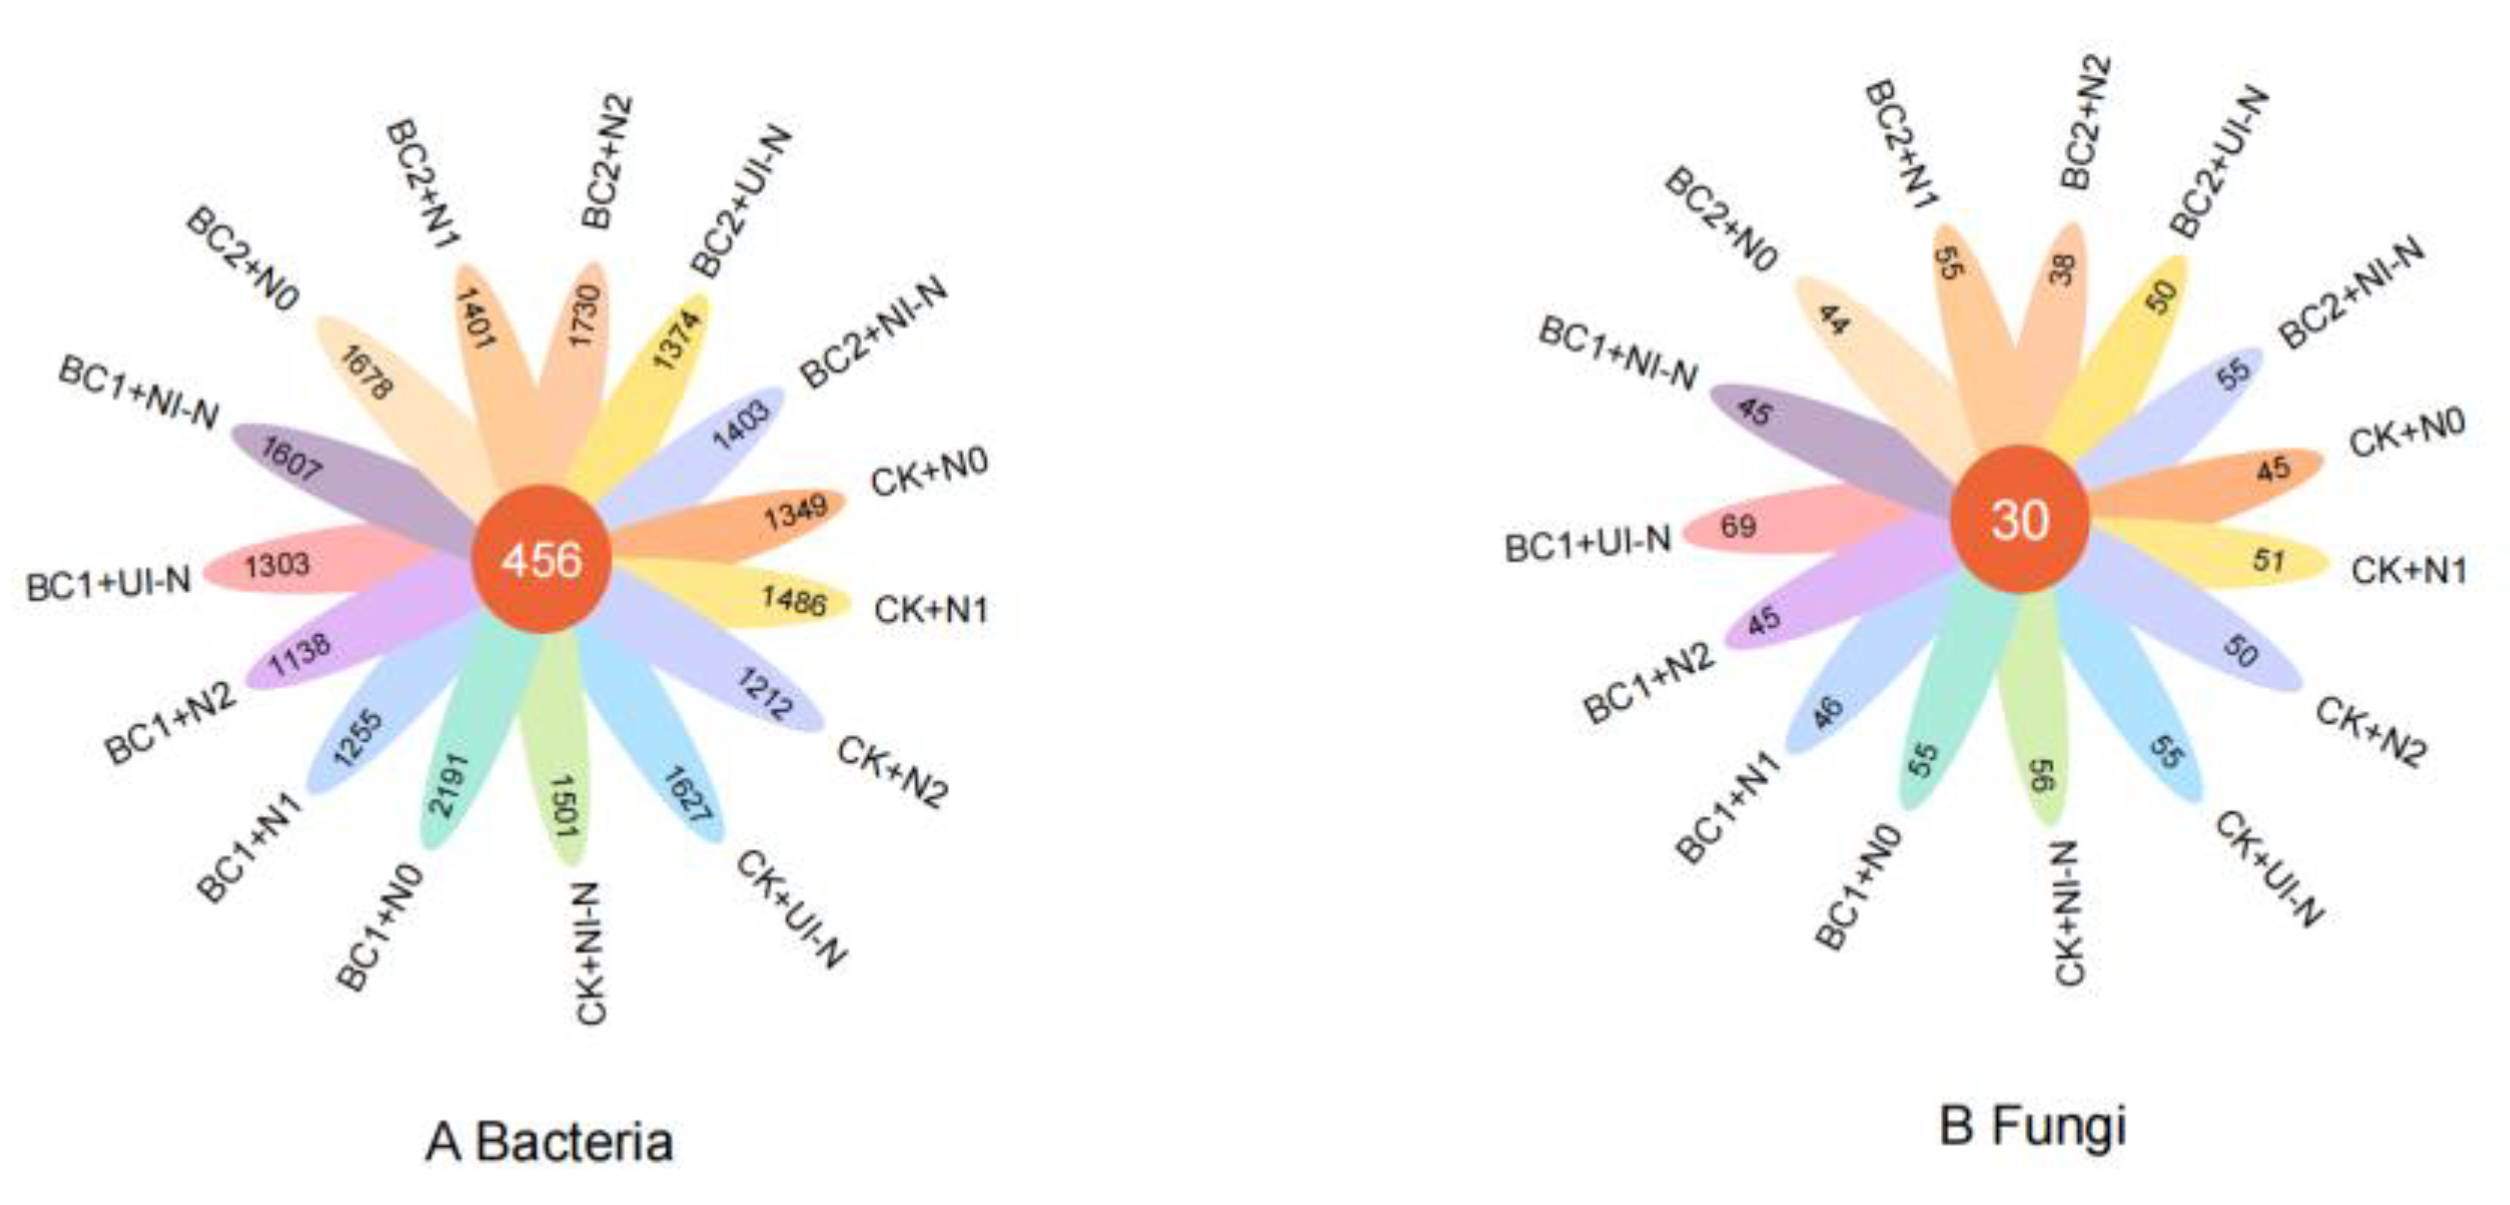
Figure 6A shows that among the 456 shared ASVs across treatments, the control group with low N applications outperformed N0, with N1, UI-N, and NI-N treatments increasing the dominant bacterial populations by 7.59% to 15.40%. In contrast, N fertilization in the BC1 group decreased the dominant bacterial populations by 22.06% to 39.79% compared to biochar alone. The BC2 group showed similar declining trends except for N2 treatment, which yielded 2186 ASVs. Under combined biochar–N co-applications, UI-N and NI-N treatments at the BC1 level demonstrated the most significant enhancement, increasing by 2.81% to 20.57% compared to N1. Notably, bacterial community abundance under N0 treatment exhibited a unimodal response to increasing biochar rates, peaking at the BC1 level, indicating that moderate biochar application (BC1) optimally promotes bacterial community diversification.
Figure 6B demonstrates that among the 30 shared fungal taxa, N fertilization in the control group universally enhanced fungal populations by 6.67–14.67% compared to CK + N0. In the BC1 group, only UI-N treatment exceeded N0 levels (16.47% increase), while other treatments decreased by 10.59–11.76%. The BC2 group showed increases of 8.11–14.86% under N1, UI-N, and NI-N treatments relative to N0. Fungal diversity consistently declined with increasing conventional nitrogen rates across all biochar levels, suggesting that moderate urea application promotes fungal communities while excessive application inhibits them. Under biochar–N co-application, fungal diversity increased with biochar rates for N1 and UI-N treatments but decreased for N2 and NI-N, with treatment efficacy following the order: UI-N > NI-N > N1 > N2. The BC1 + UI-N treatment exhibited the most pronounced fungal community response, reflecting the unique synergistic effect of urease inhibitor-enhanced N fertilizer combined with biochar on promoting the fungal community.

3.3.2. Effects of Different Biochar–N Co-Application on Soil Microbial α-Diversity Indices

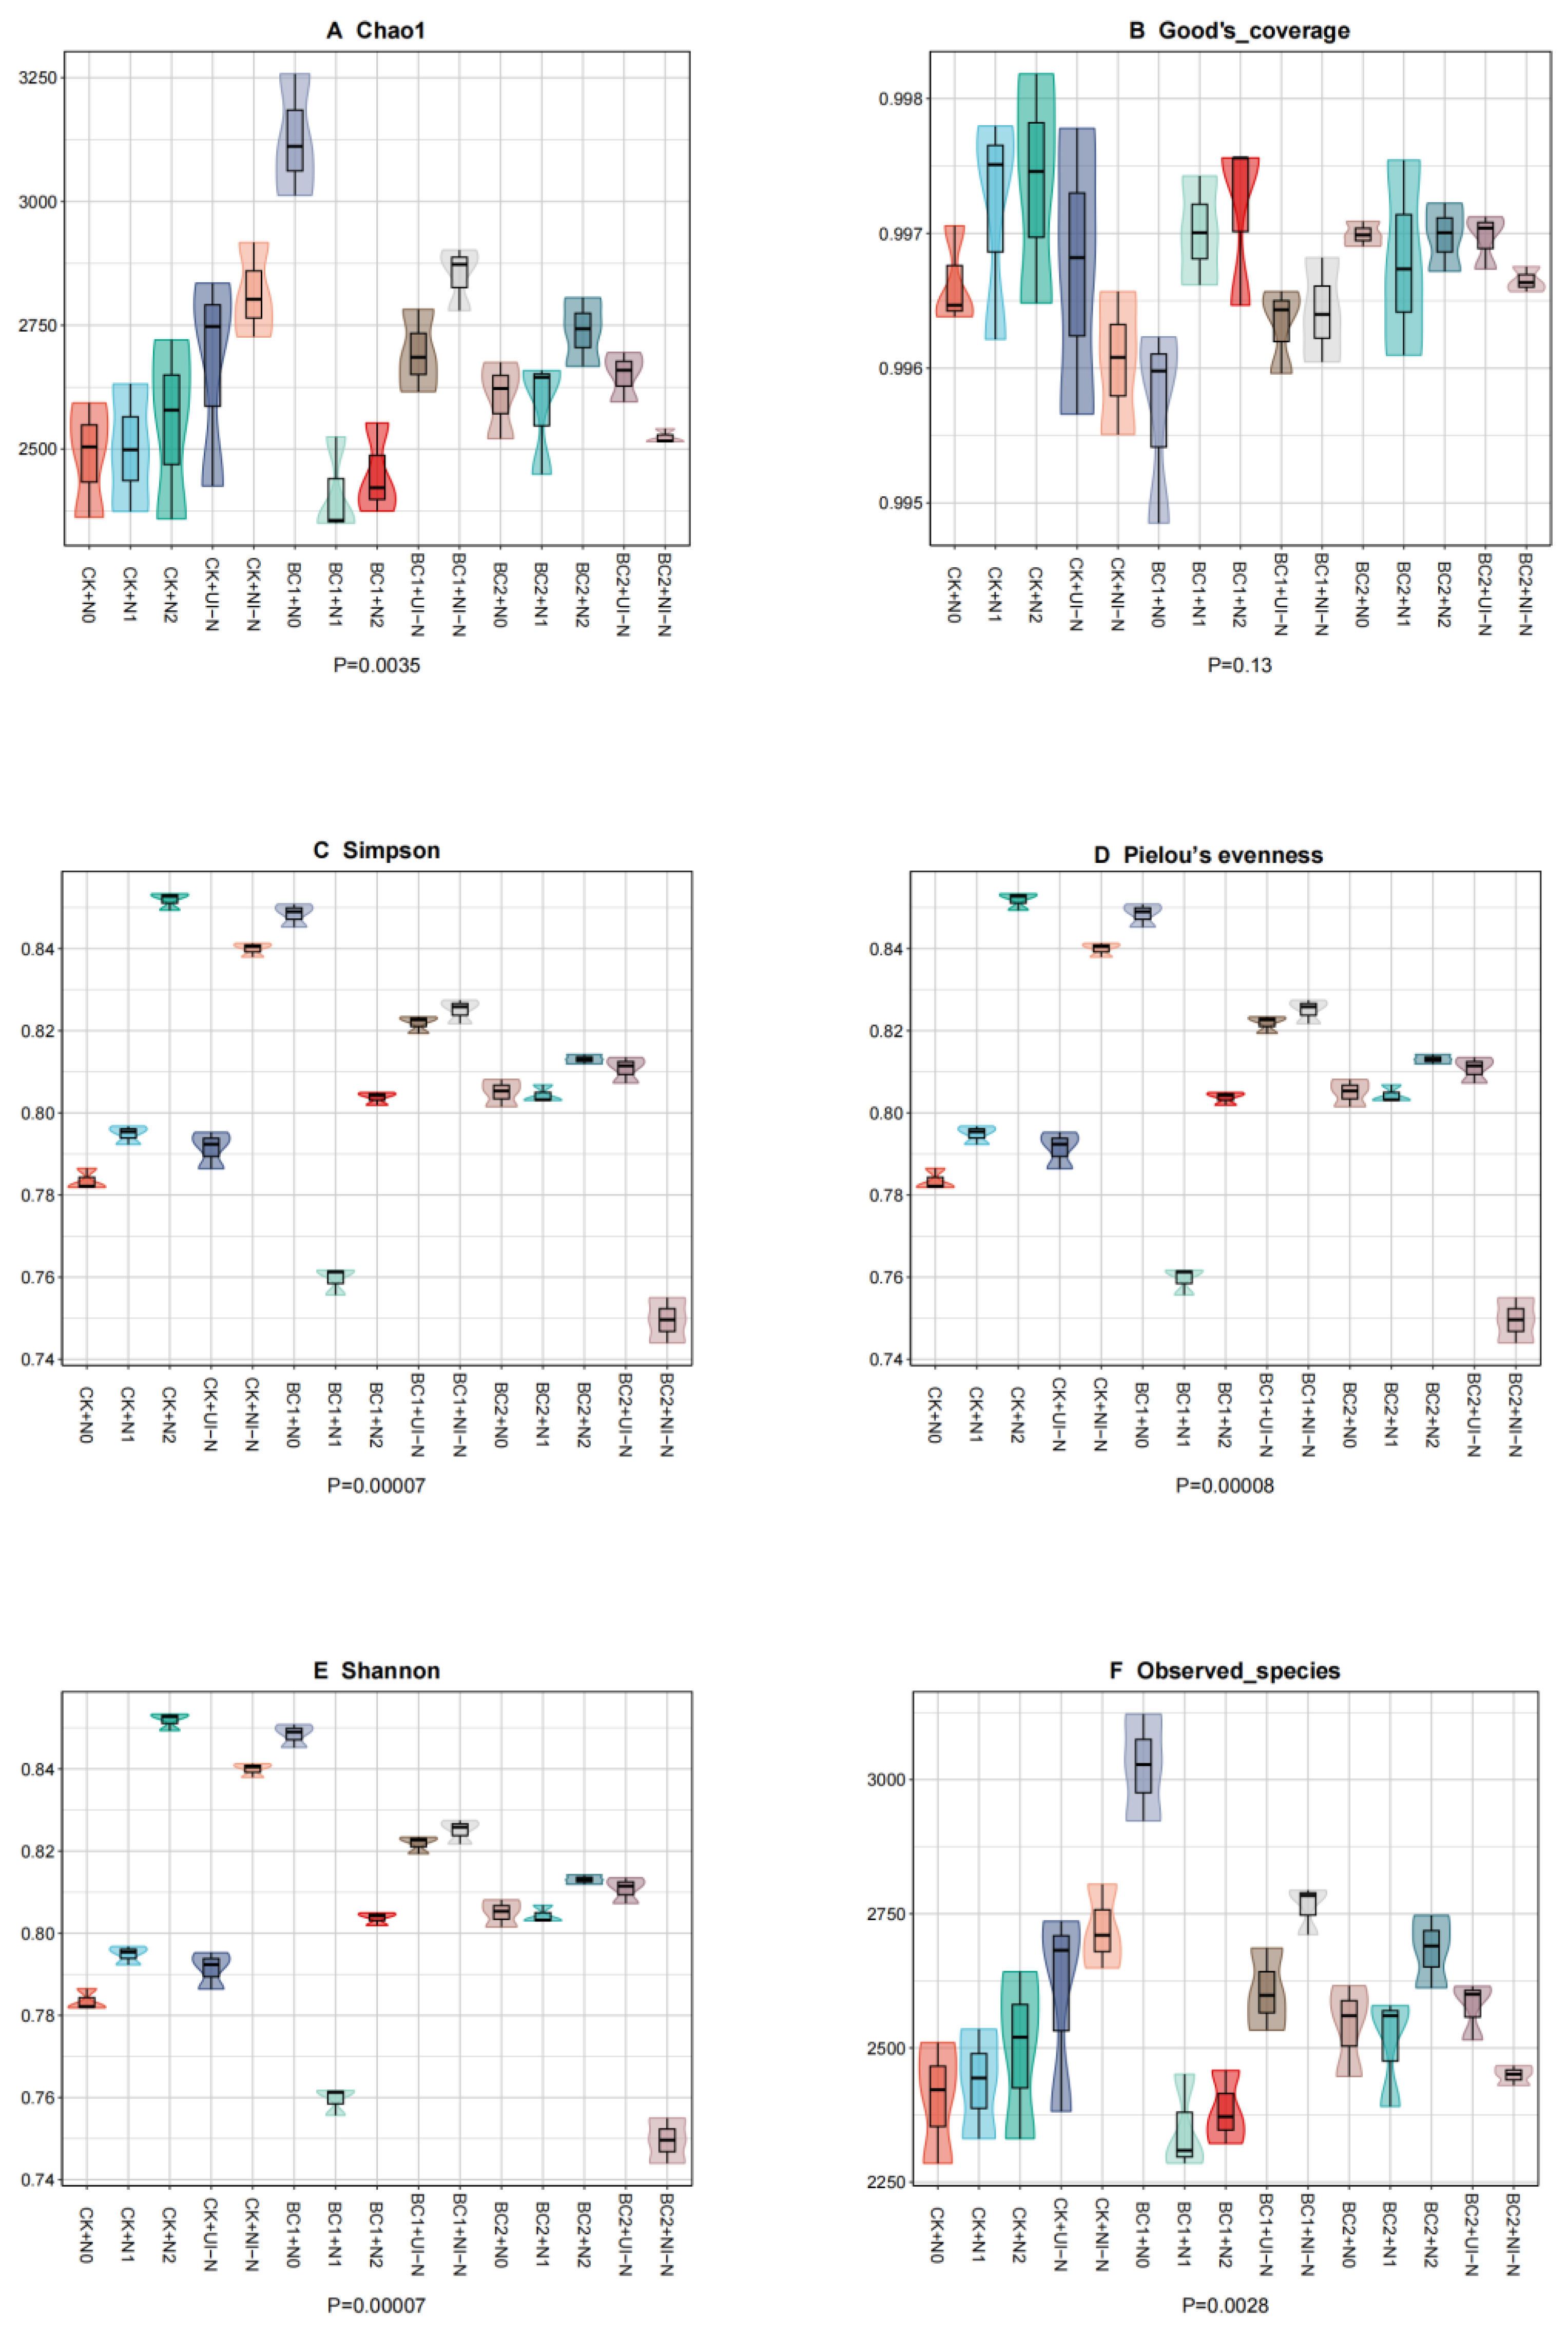
The combined biochar–N co-application significantly influenced soil bacterial α-diversity (Figure 7 and Figure 8). The BC1 + NI-N treatment demonstrated superior performance across all diversity indices (Chao1, Simpson, Pielou’s evenness, Shannon, and Observed_species). In the control group (CK), UI-N treatment significantly enhanced Chao1 and Observed_species indices by 13.22% and 13.12%, respectively (p < 0.05), while Pielou’s evenness and Shannon indices increased by 1.00–8.72% and 1.62–9.24%, respectively, under N fertilization. Conversely, the N addition in the BC1 group exhibited adverse effects, with reductions in diversity indices as follows: Chao1 (8.81% to 22.92%), Simpson (0.49% to 1.45%), Pielou’s evenness (2.75% to 10.47%), Shannon (3.84% to 13.29%), and Observed_species (8.64% to 22.35%). In the BC2 group, N2 treatment significantly increased Simpson, Pielou’s evenness, and Shannon indices by 0.54%, 1.00%, and 1.71%, respectively, compared to N0.
Regarding fungal diversity, N1, N2, and NI-N treatments in the CK group significantly reduced Chao1 and Observed_species indices (12.81–14.95% reduction), whereas N2 and UI-N enhanced Simpson and Shannon indices (1.25–11.30% increase). In the BC2 group, N addition significantly elevated Simpson and Shannon indices (3.13–13.10% increase), with UI-N treatment increasing Chao1 and Observed_species indices by 13.72% and 11.70%, respectively. Under combined biochar–N application, the BC2 + NI-N treatment achieved the highest Chao1 (136.33) and Observed_species (133.67) values. The BC1 + UI-N treatment yielded the maximum Pielou’s evenness (0.82) and Shannon (5.13) indices, while the BC1 + NI-N treatment produced the highest Simpson index (0.95).

3.3.3. Effects of Biochar–N Co-Application on Soil Microbial Community Structure at the Phylum Level

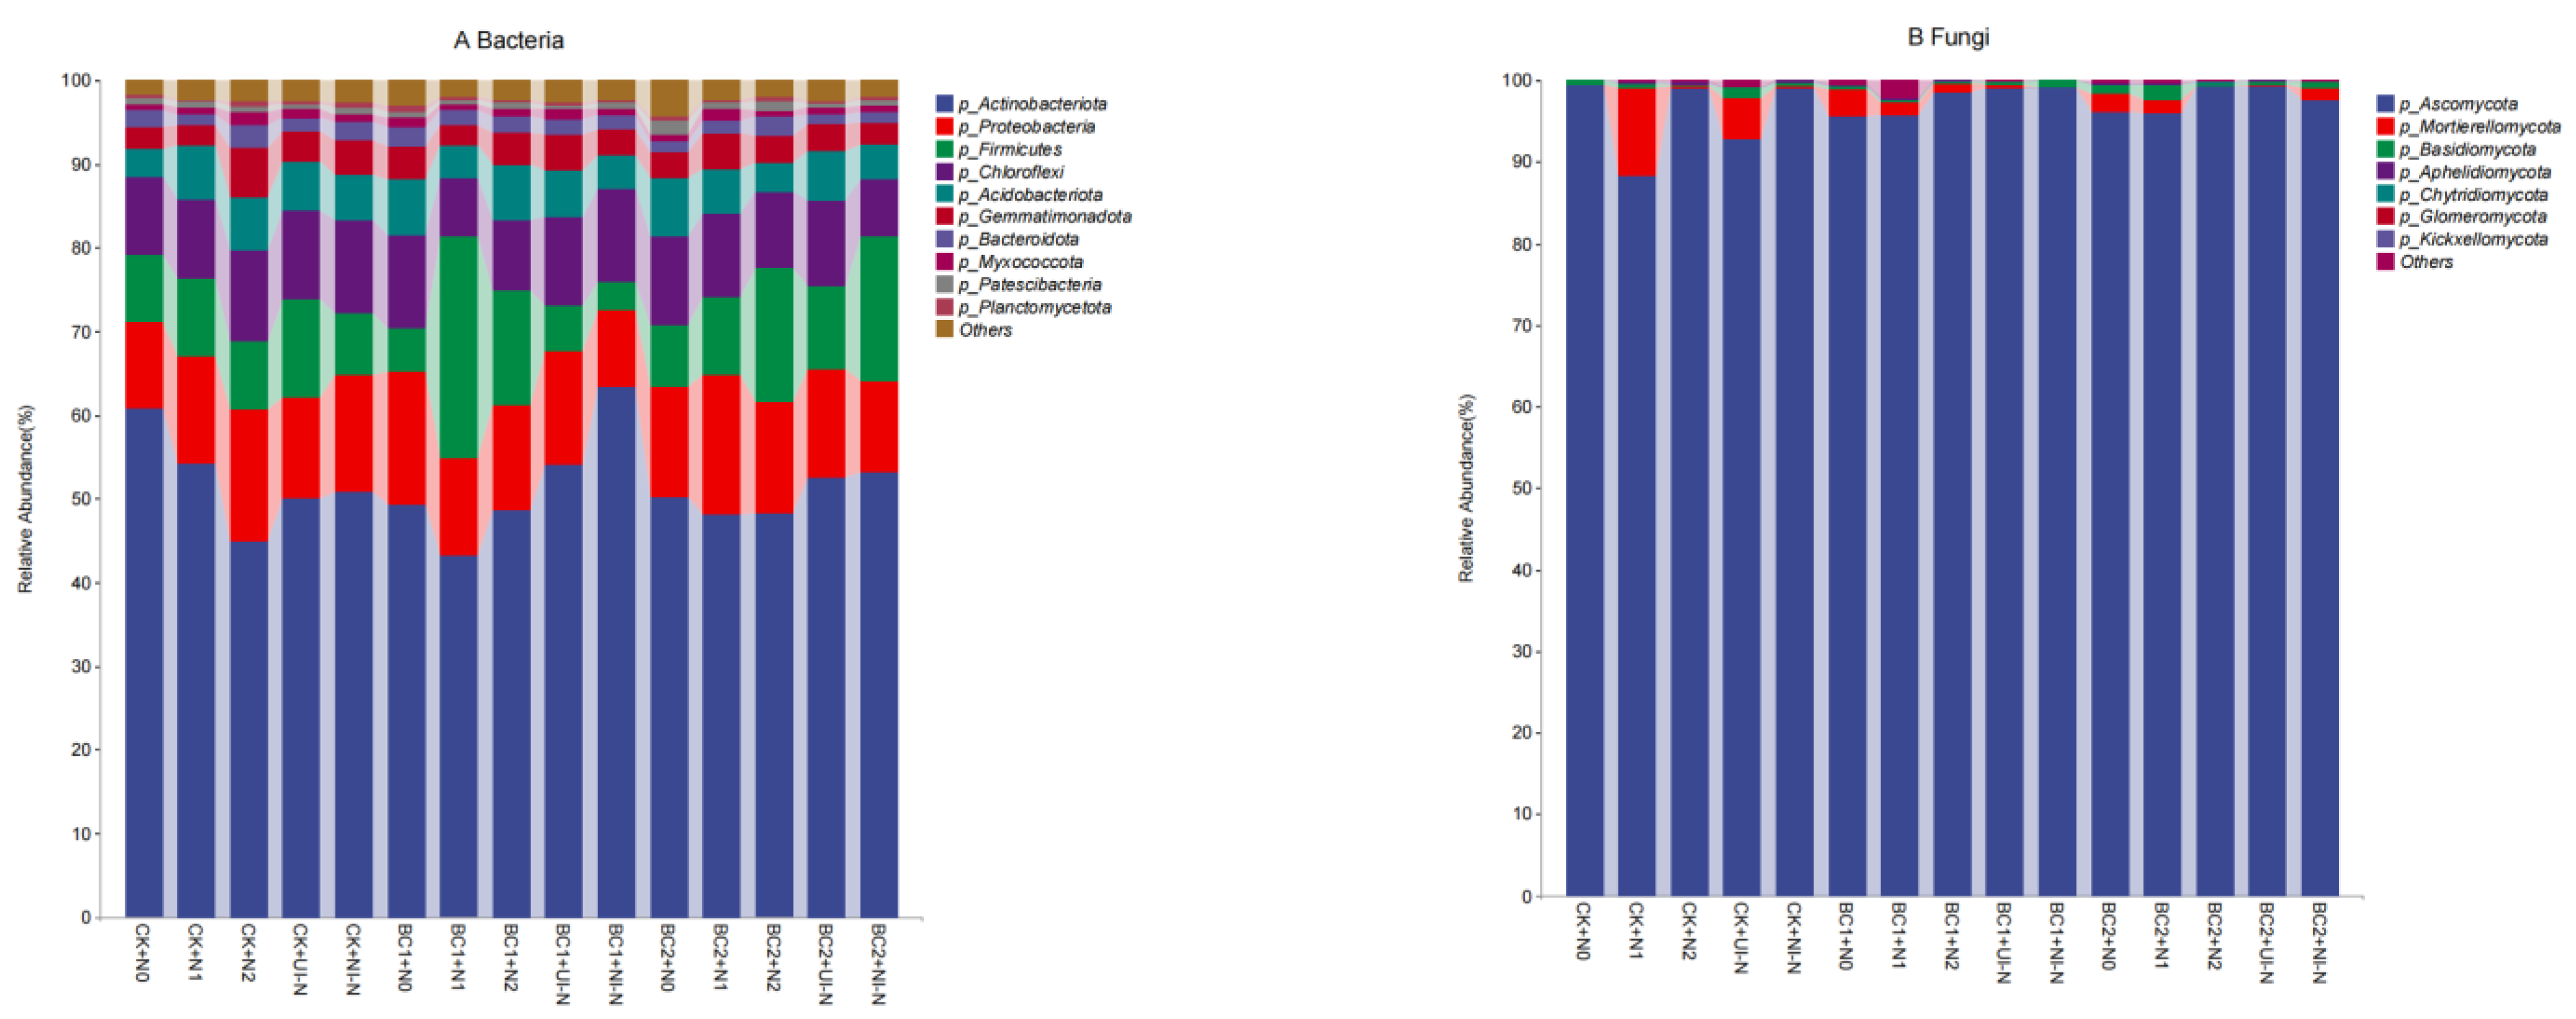
In bacterial communities (Figure 9A), the phyla Actinobacteria, Proteobacteria, Firmicutes, and Chloroflexi emerged as the dominant groups. In the CK, N fertilization reduced Actinobacteriota abundance by 11.07% to 26.40%, while enhancing Chloroflexi abundance by 3.87% to 20.68%. Conversely, UI-N and NI-N treatments in the BC1 group increased Actinobacteriota abundance to 54.01% and 63.32%, respectively, representing increases of 9.59% and 28.47% compared to the N0 treatment. This contrasting response pattern indicates that while inhibitor-based N fertilizer application alone decreased Actinobacteriota abundance, its combination with biochar significantly enhanced abundance, with the most substantial effect observed at the BC1 level. Acidobacteriota abundance exhibited a decreasing trend followed by an increasing trend with increasing biochar application. In contrast, Proteobacteria, Firmicutes, and Chloroflexi showed an increasing-then-decreasing pattern under UI-N treatment and continuous decline under NI-N treatment.
In fungal communities, Ascomycota dominated overwhelmingly (>88%), although response patterns varied among treatments (Figure 9B). N fertilization in the CK group reduced Ascomycota abundance by 0.25% to 11.30%, whereas the BC1 and BC2 groups showed increases of 0.10% to 3.65% and 1.67% to 3.36%, respectively. Under N1 and UI-N treatments, Ascomycota abundance increased with the biochar application rate, whereas the NI-N treatment produced the opposite effect.

3.3.4. Effects of Different Biochar–N Co-Application on Soil Microbial β-Diversity Indices

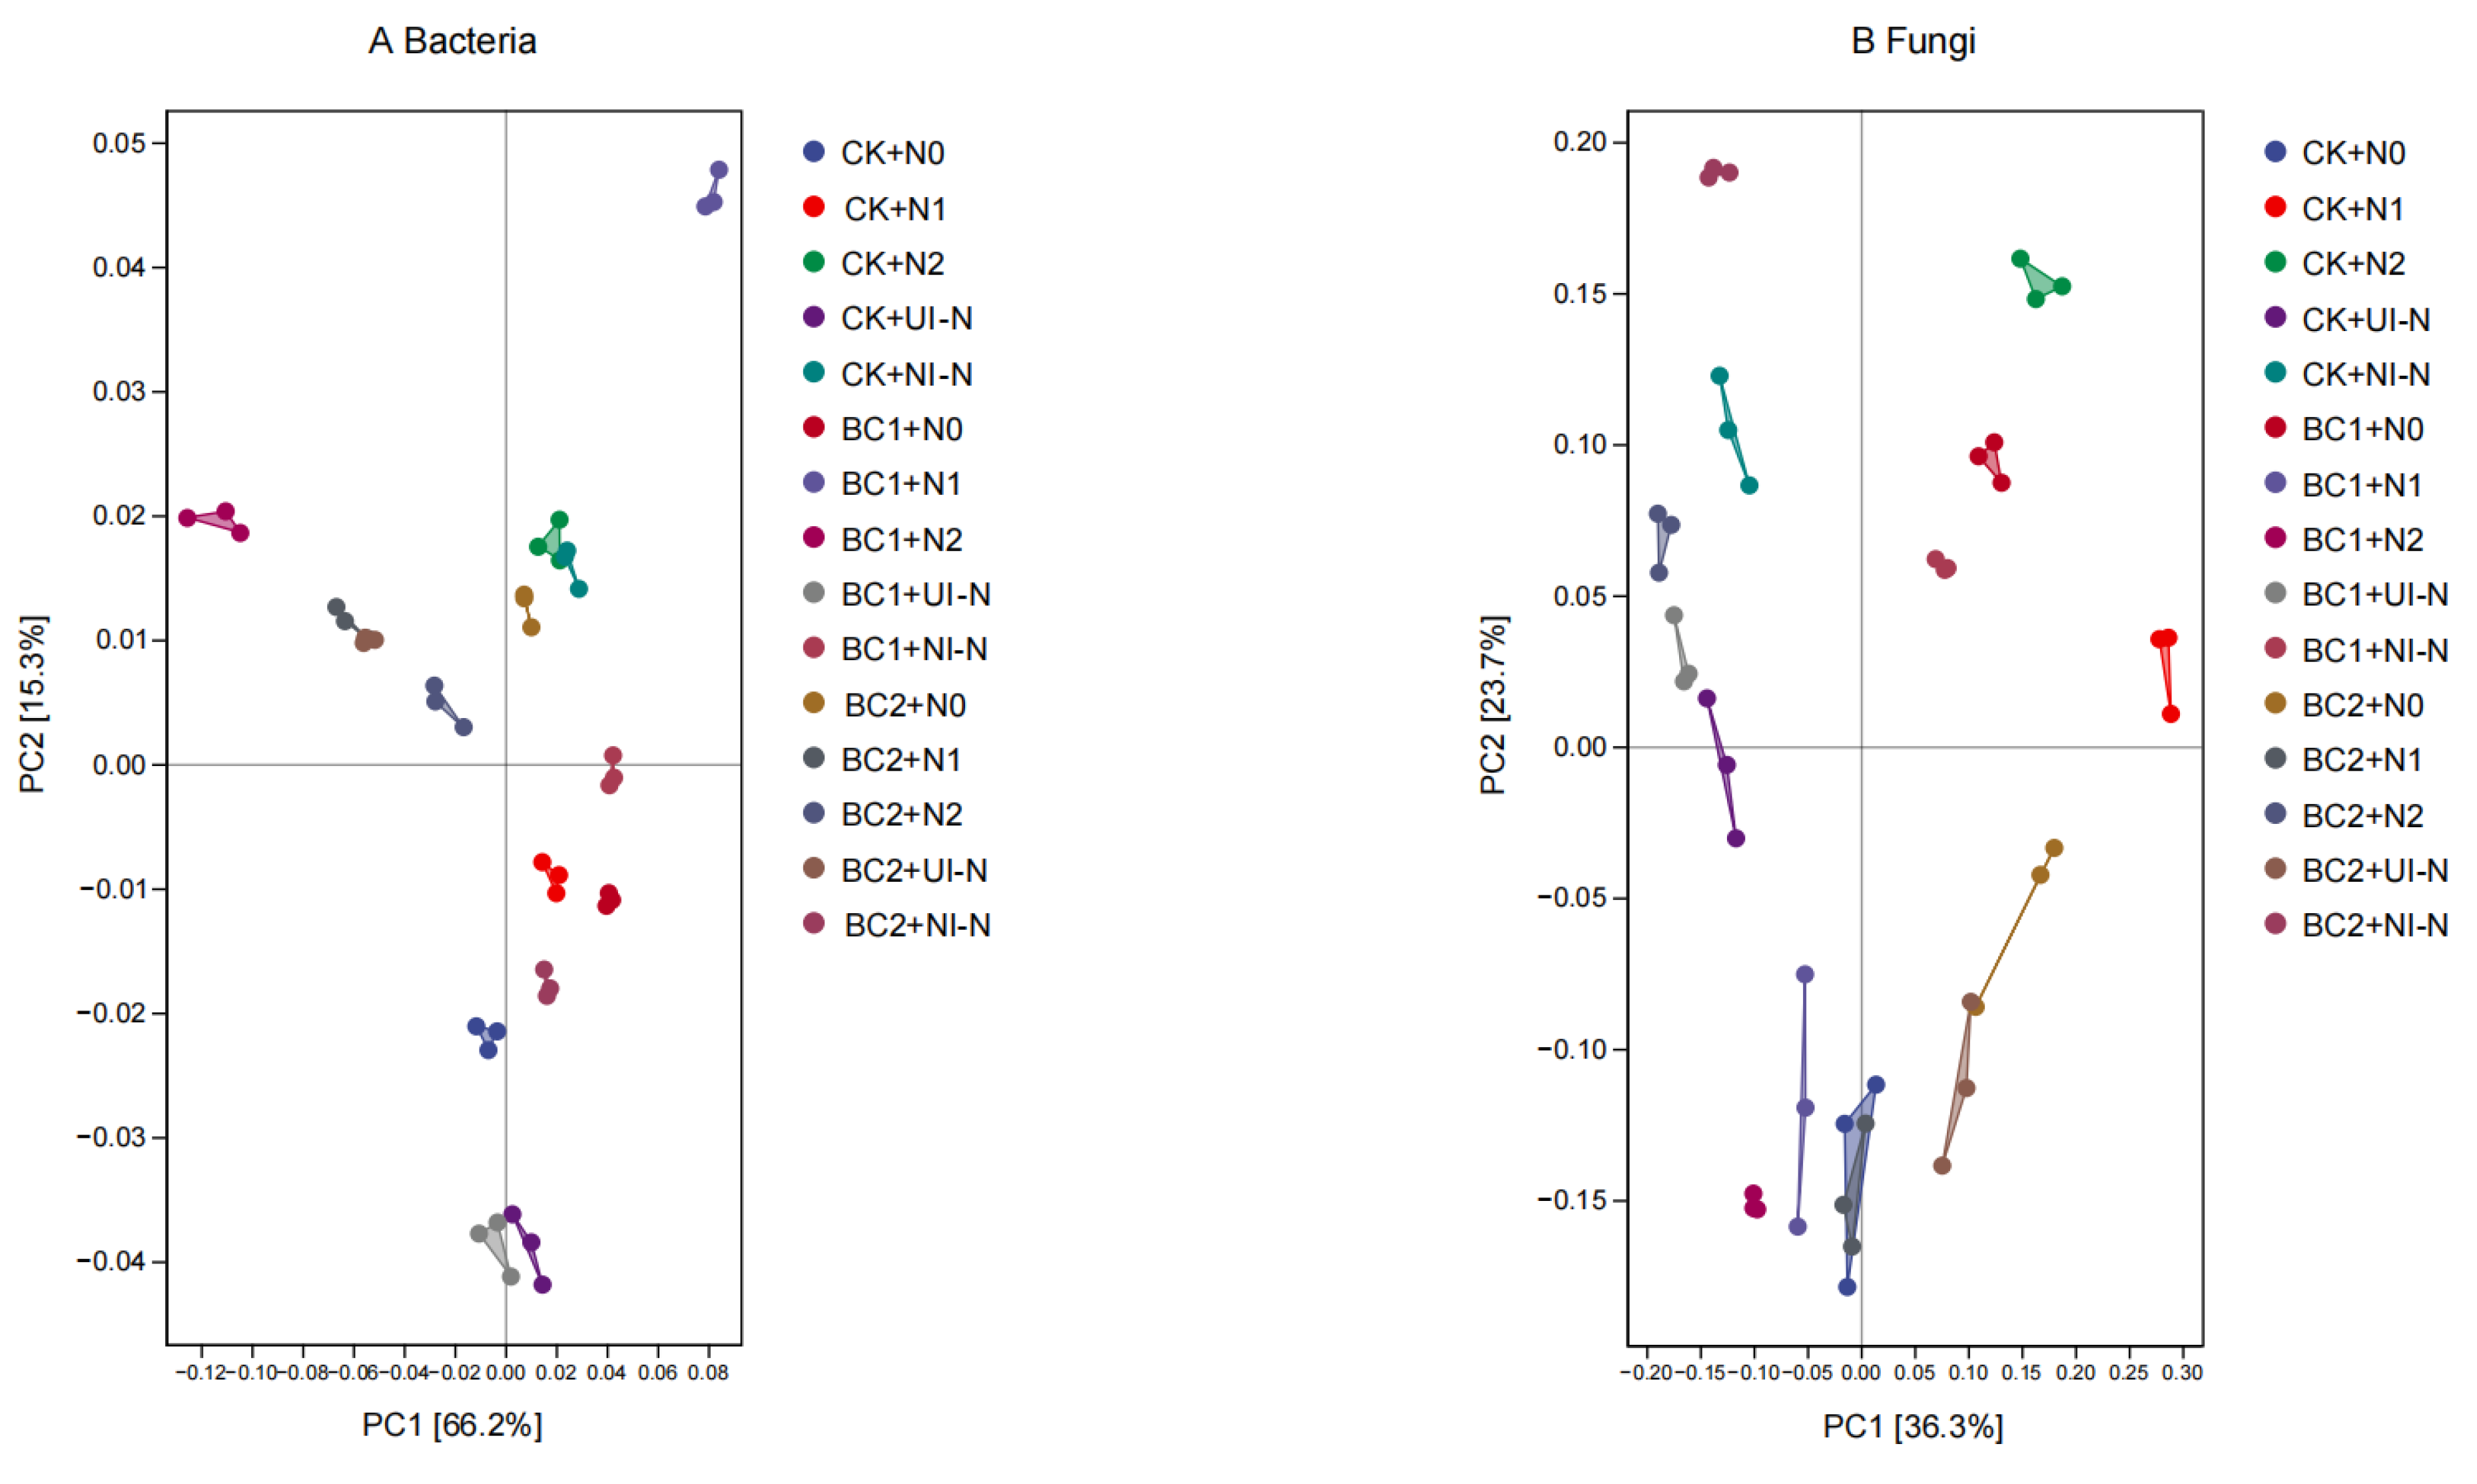
Principal coordinate analysis (PCoA) based on the weighted Bray–Curtis distance matrix revealed that different biochar and nitrogen treatments significantly shaped the structure of microbial communities. As shown in Figure 10A, the first two principal coordinates (PC1 and PC2) accounted for 66.2% and 15.3% of the total variation, respectively. The relatively large spatial distances among treatments indicate distinct bacterial community structures across the different treatment groups. A similar pattern was observed for fungal communities (Figure 10B), where PC1 and PC2 explained 36.6% and 23.7% of the variation, respectively. The evident separation among treatments suggests that the biochar–nitrogen combinations also exerted distinct influences on fungal community composition.

3.4. Effects of Different Biochar–N Co-Application on the Yield and Fruit Quality of Jujube

The combined application of biochar–N fertilizer significantly influenced jujube PY (p < 0.01, Figure 11A). PY performance across treatment groups followed the order: BC1 > BC2 > CK. In the CK group, N2 and UI-N treatments increased PY by 3.32% and 15.44%, respectively, compared to the N0 treatment. Within the BC1 group, all N treatments significantly enhanced PY with increases ranging from 11.63% to 17.00%, with UI-N demonstrating optimal performance. In the BC2 group, only the NI-N treatment resulted in a significant reduction in PY of 4.54%. The BC1 + UI-N treatment achieved the highest PY, representing a 24.23% increase over CK + N0 and surpassing other biochar–N combinations by 0.38% to 8.06%.
VC exhibited highly significant differences among treatments (p < 0.01, Figure 11B), following the pattern BC1 > BC2 > CK. N fertilization in the CK group enhanced VC by 2.78–11.95%. The BC1 group showed increases of 2.99% to 10.70%, with UI-N achieving the maximum enhancement. In the BC2 group, N1, N2, and NI-N treatments increased VC by 12.10%, 8.28%, and 9.84%, respectively. The BC1 + NI-N treatment increased VC by 16.47% compared to CK + N0 and surpassed other biochar–N combinations by 1.50% to 14.77%.
SS similarly demonstrated highly significant variation (p < 0.01, Figure 11C). In the CK group, N1 and NI-N treatments increased SS by 41.24% and 40.71%, respectively. The BC1 group showed increases of 12.98% to 15.47% for N1 and N2, while UI-N and NI-N decreased by 9.40% to 14.46%. In the BC2 group, N1 and N2 treatments decreased SS by 21.35% and 9.27%, respectively. The BC2 + NI-N treatment enhanced SS by 5.23–27.98% compared to other biochar–N combinations. Overall, the integrated biochar–N application modulated both yield and quality parameters, with BC1 + UI-N emerging as the optimal treatment combination.

3.5. Correlation Analysis Between Soil Nutrients, Enzyme Activities, Microbial Communities, and the Yield and Quality Traits of Jujube Fruits

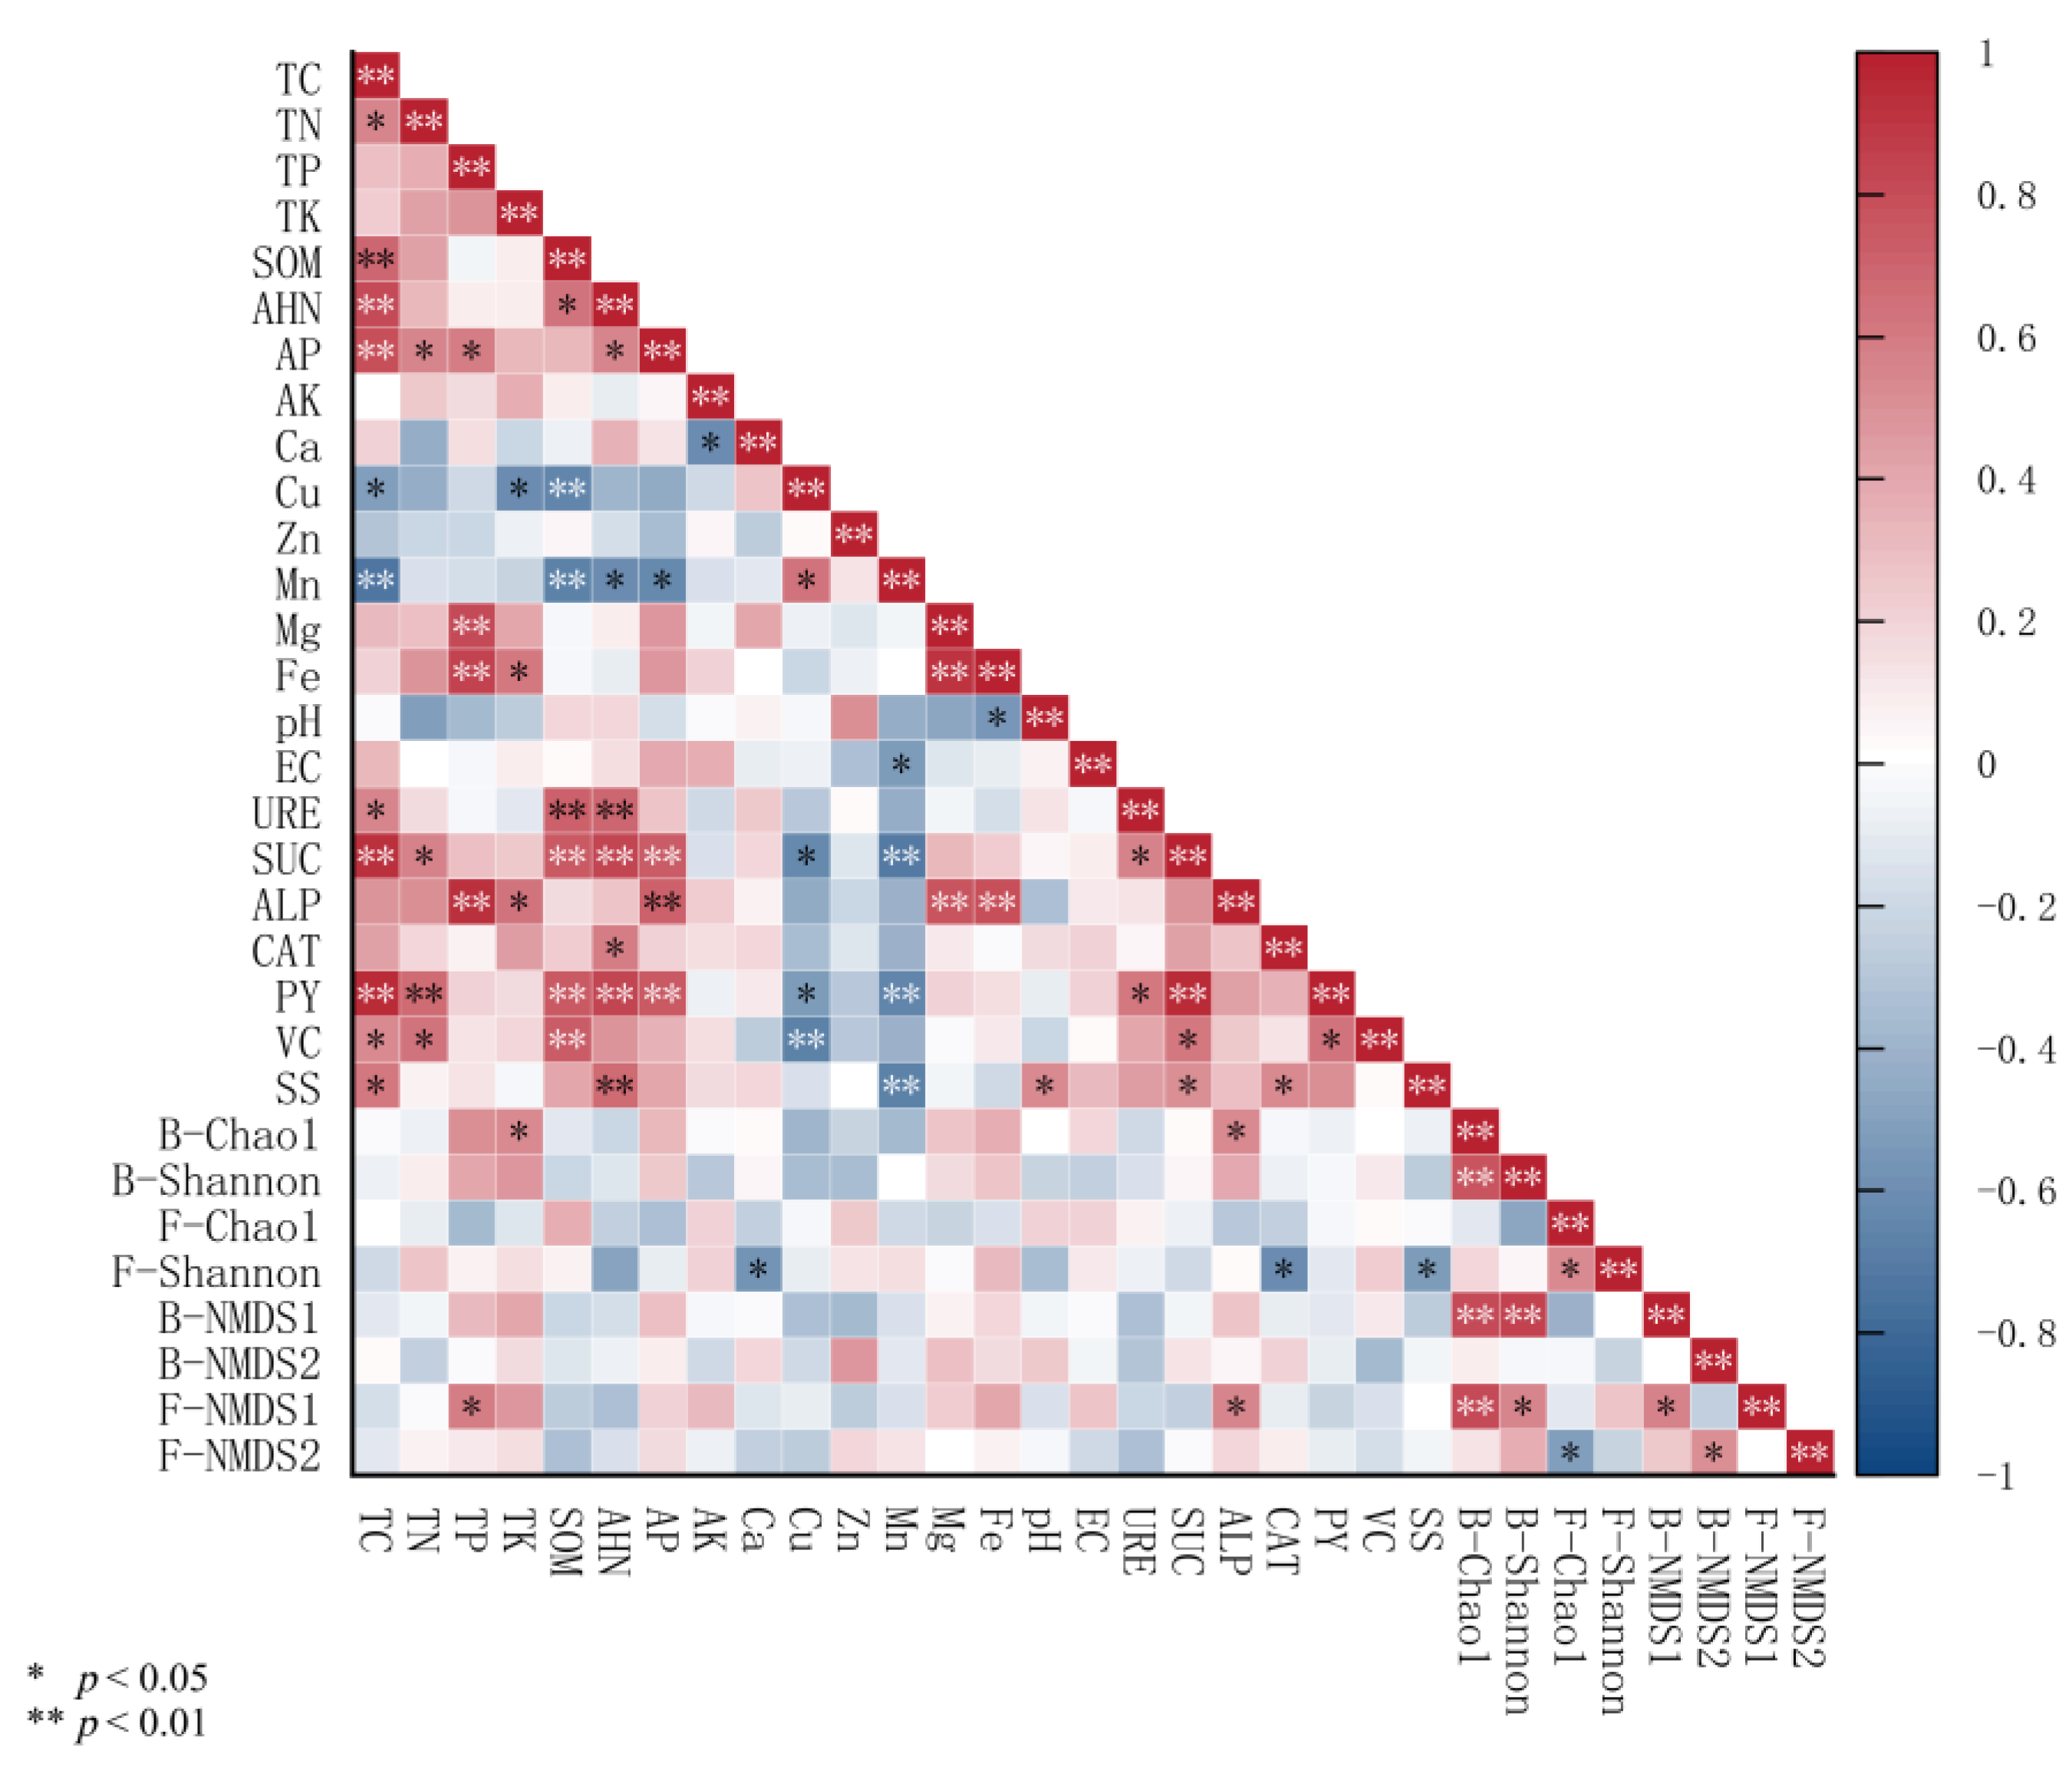
As illustrated in Figure 12, jujube PY exhibited positive correlations with TC, TN, SOM, AHN, AP, URE, and SUC (p < 0.05). VC was positively correlated with TC, TN, SOM, and SUC (p < 0.05). Both PY and VC showed negative correlations with Cu (p < 0.05), while PY and SS were negatively correlated with Mn (p < 0.05). Bacterial Chao1 index demonstrated positive correlations with bacterial Shannon index, TK, and ALP (p < 0.05). Fungal Shannon index was negatively correlated with fungal Chao1 index, Ca, CAT, and SS (p < 0.05). Bacterial NMDS1 showed significant positive correlations with bacterial Chao1 and Shannon indices (p < 0.01), whereas fungal NMDS1 exhibited significant positive correlations with bacterial Chao1, TP, ALP, bacterial Shannon index, and bacterial NMDS1 (p < 0.05).

3.6. Causal Pathways Revealed by Piecewise Structural Equation Modeling

A piecewise structural equation model (piecewise SEM) was fitted to test the hypothesized cascade: Biochar–N amendment → soil chemistry → enzyme activity → microbial diversity → fruit performance (yield, vitamin C, and soluble solids). Non-significant paths (p > 0.05) were sequentially removed, and the following significant (p < 0.05) relationships were retained (Table S6): Biochar rate positively influenced soil organic matter (SOM) (β = 0.65, p < 0.001), which in turn increased alkaline-hydrolysable nitrogen (AHN) (β = 0.37, p = 0.023). Urease activity (URE) was not significantly driven by any soil-chemical variable (all p > 0.10), but URE positively affected bacterial Shannon diversity (β = 0.51, p = 0.005). Both SOM (β = 0.36, p < 0.001) and AHN (β = 0.73, p < 0.001) directly improved per-tree yield. SOM (β = 1.12, p < 0.001) and AHN (β = 0.11, p = 0.101, marginally significant) significantly influenced fruit vitamin C content. Soluble solids (SS) were positively driven by AHN (β = 0.55, p < 0.001) and SOM (β = 0.51, p = 0.004). Overall, the model explained 95% of the variance in yield, 94% in vitamin C, and 74% in soluble solids. The global goodness-of-fit test indicated a significant deviation (Fisher’s C = 12.47, p = 0.19, AICc = 48.3), suggesting that additional latent or reciprocal processes may exist.

4. Discussion

4.1. Impacts of Biochar–N Co-Application on Soil Physicochemical Properties and Enzyme Activities

Biochar’s effectiveness in improving saline–alkaline soils operates through multiple synergistic mechanisms that explain the observed enhancements in TC, TN, and other soil nutrients. The porous structure of biochar, with surface areas ranging from 8–132 m2g−1 under typical pyrolysis conditions (potentially reaching 491–3263 m2 g−1 with activation), creates a hierarchical pore system of micropores (<2 nm), mesopores (2–50 nm), and macropores (>50 nm) that differentially contribute to nutrient retention [30]. This multi-scale porosity enables physical entrapment of nutrients while simultaneously providing protected microsites for microbial colonization. The cation exchange capacity (CEC) enhancement of 21–906% reported across multiple studies results from negatively charged functional groups (-COOH, -OH, phenolic groups) on biochar surfaces, which directly explains the increased retention of cationic nutrients and the observed increases in TC and TN with BC1 + N2 treatment [31,32]. Recent field evidence strongly supports the superiority of moderate application rates. Jin et al. [33] demonstrated in a 6-year field study that 1.5–3.0% biochar applications (equivalent to approximately 5000 kg ha−1) provided an optimal balance between soil improvement and crop yield in saline–alkali paddy soils. This result corroborates the BC1 response observed in this study. Moreover, relative to acidic systems, the pronounced alkalinity of biochar, combined with OH released during urea hydrolysis, can further elevate the pH (>8) in the alkaline soils of southern Xinjiang, thereby intensifying the chemisorption of carbonate on organic carbon [34]. This mechanism plausibly accounts for the greater relative increase in total carbon recorded in the present study (4.7–12.4%).
When combined with urease inhibitor-based N fertilizer (UI-N) and nitrification inhibitor-based N fertilizer (NI-N), biochar exhibited distinct effects on soil enzyme activities, reflecting its dual roles in creating a favorable microenvironment and the inhibitory effects of the respective additives [35,36]. The observed increase in urease activity following biochar application can be attributed to its porous structure, which enhances the surface area for microbial immobilization. At the same time, macropores (>200 nm) provide moisture-stable niches for urease-producing microorganisms. Additionally, functional groups on the biochar surface enhance organic nitrogen retention, thereby improving substrate availability [37]. The enhancement of catalase activity may be linked to the reductive surface properties of biochar, which potentially lower oxidative stress in the soil matrix, thereby reducing hydrogen peroxide generation and the subsequent demand for catalase [38]. However, the BC1 + N1 treatment showed the highest catalase activity, exceeding that of BC1 + UI-N and BC1 + NI-N by 9.42% and 10.22%, respectively. This result suggests that the combination of conventional urea with a moderate biochar application may stimulate aerobic microbial activity, leading to increased reactive oxygen species production and, consequently, elevated catalase expression [39], which aligns well with the results observed under the BC1 biochar level in the present study. The increase in alkaline phosphatase activity can be attributed to biochar’s capacity to provide additional adsorption sites and improve the soil microenvironment, thereby promoting the expression and activity of phosphatase enzymes [40]. It has been reported that biochar application can elevate alkaline phosphatase activity by 28.2–64.8% [41]. Furthermore, the use of inhibitor-based N fertilizers, which maintains a more stable ammonium concentration and mitigates pH fluctuations caused by rapid nitrification, may create a more favorable microhabitat for alkaline phosphatase activity [42].

4.2. Impacts of Biochar–N Co-Application on Soil Microbial Community Structure

Our investigation revealed that the BC1 + NI-N treatment exhibited superior efficacy in enhancing bacterial diversity, whereas the BC1 + UI-N treatment elicited maximal fungal community responses in saline–alkaline jujube orchards [43]. Under N-deficient conditions (N0), bacterial community abundance demonstrated a unimodal response to increasing biochar application rates, peaking at the BC1 level, which reflects the intricate trade-offs between biochar’s physicochemical properties and microbial habitat requirements. This phenomenon likely arises from moderate biochar application (BC1) creating optimal microhabitat heterogeneity without imposing excessive environmental stress [44]. The BC1 + NI-N treatment significantly enhanced bacterial diversity across all α-diversity indices, suggesting that the synergistic interaction between nitrification inhibitors and moderate biochar application generates favorable microenvironmental conditions by maintaining steady NH4 + -N availability while mitigating rapid nitrification-induced pH fluctuations [45]. The contrasting responses of bacterial and fungal communities to N-biochar combinations illuminate fundamental differences in their ecological strategies and nutrient acquisition mechanisms. Within the BC1 group, N fertilization decreased bacterial diversity (Chao1 index reduction: 8.81–22.92%), whereas fungal diversity increased under UI-N treatment (16.47% enhancement). This dichotomy reflects bacteria’s rapid exploitation of readily available nitrogen, potentially leading to the competitive exclusion of less efficient species, while fungi leverage their extensive enzymatic repertoire and hyphal networks to more effectively utilize complex carbon compounds within biochar matrices under N-Enriched conditions [46,47].
The substantial increase in Actinobacteriota relative abundance under BC1 + UI-N (54.01%) and BC1 + NI-N (63.32%) treatments, contrasting sharply with decreased abundance following inhibitor application alone, demonstrates a pronounced synergistic effect between biochar and N inhibitors. This enhancement can be attributed to Actinobacteriota’s specialized metabolic capabilities for degrading recalcitrant organic compounds, which are abundant in biochar matrices [48]. The elevated Actinobacteriota populations likely facilitate improved organic matter decomposition and nutrient cycling, processes typically suppressed in saline–alkaline soils [49]. Within fungal communities, Ascomycota maintained overwhelming dominance (>90%) with treatment- specific responses. The progressive increase in Ascomycota abundance with escalating biochar application rates under N1 and UI-N treatments indicates preferential colonization of biochar pore spaces, where extensive hyphal networks establish protected niches against environmental stressors [50]. Conversely, the declining trend observed under NI-N treatment suggests potential shifts in N metabolic pathways that differentially favor distinct fungal functional groups.

4.3. Impacts of Biochar–N Co-Application on Fruit Yield and Quality Attributes in Jujube

This study identified BC1 + UI-N (moderate biochar plus urease-inhibitor-based N fertilizer) as the optimal fertilisation strategy, which achieved a 24.23% increase in fruit yield per plant; BC1 + NI-N achieved a 16.47% increase in vitamin C content. In contrast, the application of nitrification inhibitor with a high biochar dosage (BC2 + NI-N) significantly promoted soluble sugar accumulation, indicating that specific combinations of N inhibitors and biochar can selectively regulate fruit yield and quality formation [51]. The urease inhibitor delays urea hydrolysis, thereby maintaining a steady supply of soil NH4 +-N. When combined with biochar’s high cation exchange capacity, this strategy significantly enhances N availability and utilization efficiency [52]. Furthermore, moderate biochar application (B1) improved the physicochemical properties of saline–alkali soil, including reduced bulk density, increased porosity, and enhanced water retention, thereby creating a favorable environment for root development and improving nutrient uptake capacity [53]. Additionally, the porous structure of biochar provides niches for beneficial microorganisms, promoting rhizosphere microbial activity and enhancing nutrient transformation and supply [44]. However, the combination of high biochar dosage with nitrification inhibitor (B2 + NI-N) resulted in a 4.54% yield reduction, highlighting potential nutrient fixation issues associated with excessive biochar application. Under high biochar loading, its large specific surface area and strong adsorption capacity may excessively immobilize available soil N, particularly when nitrification inhibitors delay the conversion of NH4+ to NO3, further reducing nitrogen bioavailability [54]. The 16.47% increase in vitamin C content under the BC1 + NI-N treatment involves complex physiological and biochemical mechanisms. Plants utilize NH4+ and NO3 through distinct uptake pathways, and emerging evidence indicates that NH4+ promotes the synthesis of amino acids, proteins, and antioxidant compounds such as VC. In contrast, excessive NO3 uptake may trigger oxidative stress, which can inhibit the biosynthesis of VC. Meanwhile, the improved soil moisture conditions resulting from biochar application alleviated water stress, reduced reactive oxygen species accumulation, and consequently decreased the consumption of vitamin C as an antioxidant [55]. Moreover, biochar-released soluble organic carbon and mineral elements, particularly potassium and calcium, may directly participate in signaling pathways associated with fruit quality formation [56]. The superior performance of soluble sugar accumulation under the BC2 + NI-N treatment (5.23–27.98% increase) suggests a distinct regulatory mechanism. By maintaining a higher NH4 + /NO3 ratio in the soil, the nitrification inhibitor may influence the balance between carbon and nitrogen metabolism, promoting the allocation of photosynthetic products toward sugar synthesis [57]. Nevertheless, this sugar increase came at the expense of yield, reflecting a reallocation of source-sink relationships. The observed yield increase of 24.23% in this study falls squarely within the range (10–30%) reported for biochar applications in previous meta-analyses [58]. This result may be attributed to the more pronounced ameliorative effects of biochar under saline–alkali stress [59]. As a salt-tolerant fruit tree, jujube may respond more sensitively to soil improvement. Compared with Zhang et al. (2020), who studied rice, the greater yield response observed in this woody perennial crop may be related to its deeper root system and stronger cumulative response to long-term soil improvements [40].

4.4. Synergistic Mechanisms Linking Soil Nutrients, Enzyme Activities, and Microbial Communities to Fruit Yield and Quality in Jujube

The results of correlation analysis revealed that as a critical nutrient reservoir, SOM continuously releases plant-available N and phosphorus through mineralization processes, while the direct bioavailability of AHN and AP ensures a sufficient supply of essential nutrients during key developmental stages of jujube [60,61]. The positive relationships between urease and sucrase activities with fruit yield further highlight the pivotal role of soil enzyme activities in regulating nutrient transformation efficiency. Urease catalyzes the hydrolysis of urea into ammonium nitrogen, whereas sucrase participates in the decomposition of carbohydrates. The synergistic action of these enzymes enhances the overall efficiency of nutrient cycling in soil [62]. The positive correlations between VC content and TC, TN, SOM, and sucrase activity indicate that adequate carbon and N nutrition provides essential metabolic precursors and energy support for ascorbic acid biosynthesis. Enhanced sucrase activity accelerates soil carbon cycling, which may indirectly influence plant sugar metabolism pathways and thereby regulate the biosynthetic process of VC [63]. Notably, the negative correlations between individual fruit yield and VC content with soil copper content suggest that excessive copper ions may suppress root viability and interfere with antioxidant enzyme systems [64]. Similarly, the negative relationships between yield and soluble sugar content, as well as soil manganese content, imply that elevated manganese concentrations may disrupt sugar metabolism and photosynthetic efficiency [65]. Correlation analyses of microbial community diversity indices reveal complex regulatory mechanisms of soil biological activity. The positive associations between bacterial Chao1 and Shannon indices with TP, alkali phosphatase activity, and other soil properties indicate that potassium nutrition and phosphatase activity jointly contribute to the maintenance of bacterial community diversity and stability [66]. In contrast, the negative correlations between fungal Shannon index and multiple soil variables may reflect an adaptive simplification of fungal communities under specific environmental conditions. This shift in community structure could enhance resource-use efficiency, suggesting a functional reorganization in response to altered soil environments [67].

5. Conclusions

This study focused on the interactive effects of biochar–N co-application on soil fertility, microbial community structure, and fruit yield and quality in arid regions. The results indicated that fruit yield and quality exhibited a clear dependency on biochar and N inputs, with low biochar application rates coupled with low N levels being more favorable for soil carbon and N accumulation. EENFs showed distinct functional differentiation in regulating fruit productivity and quality. Specifically, the combination of low-dose biochar with urease inhibitor-amended nitrogen significantly increased per-plant yield of jujube, exceeding the control by 24.23%, respectively. In contrast, high-dose biochar combined with nitrification inhibitor-amended N achieved the highest soluble sugar content, representing a 27.98% increase over the control. Microbial community analysis revealed enhanced responsiveness under combined biochar and N treatments. Under arid conditions, environmental factors explain a markedly greater proportion of the variation in microbial community structure, yet the cumulative effects of sustained biochar application and optimised N fertilisation remain to be elucidated. Future research should therefore establish long-term, multi-site field trials in southern Xinjiang jujube orchards that: (i) extend monitoring to 60–100 cm depth and quantify ECe, SAR and ESP, and (ii) systematically evaluate the long-term impacts of biochar–N co-management on soil ecosystem services in saline–alkali systems.

Supplementary Materials

The following supporting information can be downloaded at: https://www.mdpi.com/article/10.3390/agronomy15092205/s1, Table S1: Complete physicochemical characterization of the tested biochar; Table S2: Summary of sequencing parameters and quality control metrics for bacterial communities. Table S3: Summary of sequencing parameters and quality control metrics for fungal communities. Table S4: Comparisons were performed only when the Biochar × Nitrogen interaction was significant (p < 0.05). Table S5: Pairwise comparisons among biochar levels within each nitrogen treatment when the Biochar × Nitrogen interaction was significant (p < 0.05). Table S6: Piecewise structural equation model results showing standardized and unstandardized path coefficients, standard errors, and significance levels for the causal chain from fertilisation management to soil properties and fruit quality indices of jujube in saline−alkali orchards. Table S7: PERMANOVA results for soil bacterial community differences. Table S8: PERMANOVA results for soil fungal community differences.

Author Contributions

Conceptualization, Y.Z. and C.W.; methodology, H.L. and Y.W.; software, H.L.; validation, H.L. and Y.M.; formal analysis, H.L. and Y.M.; investigation, H.L. and Y.W.; resources, Y.Z.; data curation, H.L. and Y.M.; writing—original draft preparation, H.L. and Y.M.; writing—review and editing, Y.Z. and C.W.; supervision, Y.Z. and C.W.; funding acquisition, Y.Z. and C.W. All authors have read and agreed to the published version of the manuscript.

Funding

This research was financially supported by the Key areas of science and technology research plan (2023AB004-04) to Y.Y.Z; Science and Technology Bureau General Research Project (2025DA034) to Y.Y.Z.; Tarim University-Nanjing Agricultural University Joint Fund project (NNLH202407) to Y.Z. and the 2024 Xinjiang Production and Construction Corps Graduate Education Innovation Program (The response mechanisms of different nitrification inhibition pathways on the active phosphorus fixation and nitrogen fixation by soil as well as greenhouse gas emissions in jujube orchards) to Y.M.

Data Availability Statement

The data presented in this study are available on request from the corresponding author.

Conflicts of Interest

The authors declare that the research was conducted in the absence of any commercial or financial relationships that could be construed as a potential conflict of interest.

References

  1. Suman, J.; Rakshit, A.; Patra, A.; Dutta, A.; Tripathi, V.K.; Mohapatra, K.K.; Tiwari, R.; Krishnamoorthi, S. Enhanced Efficiency N Fertilizers: An Effective Strategy to Improve Use Efficiency and Ecological Sustainability. J. Soil Sci. Plant Nutr. 2023, 23, 1472–1488. [Google Scholar] [CrossRef]
  2. Asghar, W.; Craven, K.D.; Swenson, J.R.; Kataoka, R.; Mahmood, A.; Farias, J.G. Enhancing the Resilience of Agroecosystems Through Improved Rhizosphere Processes: A Strategic Review. Int. J. Mol. Sci. 2024, 26, 109. [Google Scholar] [CrossRef]
  3. Han, Y.; Ma, Z.; Chen, R.; Wen, Y.; Liang, Y.; Zhang, J.; Javed, T.; Li, W.; Wang, Z. Partial organic fertilizer replacing synthetic fertilizer reduces soil salinity, improves photosynthesis, and enhances the water-nitrogen use efficiency of maize (Zea maysl.) in arid regions. Agric. Water Manag. 2025, 317, 109673. [Google Scholar] [CrossRef]
  4. Fuxing, L. The current situation of cultivated land degradation in the western regions of our country and its prevention and control measures. J. Soil Water Conserv. 2002, 16, 1. [Google Scholar] [CrossRef]
  5. Meng, X.; Guo, Z.; Yang, X.; Su, W.; Li, Z.; Wu, X.; Ahmad, I.; Cai, T.; Han, Q. Straw incorporation helps inhibit nitrogen leaching in maize season to increase yield and efficiency in the Loess Plateau of China. Soil Tillage Res. 2021, 211, 105006. [Google Scholar] [CrossRef]
  6. Huang, K.; Li, M.; Li, R.; Rasul, F.; Shahzad, S.; Wu, C.; Shao, J.; Huang, G.; Li, R.; Almari, S.; et al. Soil acidification and salinity: The importance of biochar application to agricultural soils. Front. Plant Sci. 2023, 14, 1206820. [Google Scholar] [CrossRef]
  7. Gao, Z.-W.; Ding, J.; Ali, B.; Nawaz, M.; Hassan, M.U.; Ali, A.; Rasheed, A.; Khan, M.N.; Ozdemir, F.A.; Iqbal, R.; et al. Putting Biochar in Action: A Black Gold for Efficient Mitigation of Salinity Stress in Plants. Review and Future Directions. ACS Omega 2024, 9, 31237–31253. [Google Scholar] [CrossRef]
  8. Sun, X.; Zhong, T.; Zhang, L.; Zhang, K.; Wu, W. Reducing ammonia volatilization from paddy field with rice straw derived biochar. Sci. Total Environ. 2018, 660, 512–518. [Google Scholar] [CrossRef]
  9. Meng, F.; Yang, H.; Fan, X.; Gao, X.; Tai, J.; Sa, R.; Ge, X.; Yang, X.; Liu, Q. A microbial ecosystem enhanced by regulating soil carbon and nitrogen balance using biochar and nitrogen fertiliser five years after application. Sci. Rep. 2023, 13, 22233. [Google Scholar] [CrossRef] [PubMed]
  10. Sun, J.; Lu, X.; Wang, S.; Tian, C.; Chen, G.; Luo, N.; Zhang, Q.; Li, X. Biochar Blended with Nitrogen Fertilizer Promotes Maize Yield by Altering Soil Enzyme Activities and Organic Carbon Content in Black Soil. Int. J. Environ. Res. Public Health 2023, 20, 4939. [Google Scholar] [CrossRef]
  11. Li, C.; Zhao, C.; Zhao, X.; Wang, Y.; Lv, X.; Zhu, X.; Song, X. Beneficial Effects of Biochar Application with Nitrogen Fertilizer on Soil Nitrogen Retention, Absorption and Utilization in Maize Production. Agronomy 2023, 13, 113. [Google Scholar]
  12. Atav, V.; Gürbüz, M.A.; Kayalı, E.; Yalınkılıç, E.; Avcı, G.G.; Aydın, B.; Öztürk, O.; Özer, S.; Kıvrak, C.; Başaran, M. Efficient nitrogen use: Deep fertilizer, urease and nitrification inhibitors. Nutr. Cycl. Agroecosyst. 2024, 130, 269–280. [Google Scholar] [CrossRef]
  13. Rose, T.J.; Wood, R.H.; Rose, M.T.; Van Zwieten, L. A re-evaluation of the agronomic effectiveness of the nitrification inhibitors DCD and DMPP and the urease inhibitor NBPT. Agric. Ecosyst. Environ. 2018, 252, 69–73. [Google Scholar] [CrossRef]
  14. Khan, Z.; Nauman Khan, M.; Luo, T.; Zhang, K.; Zhu, K.; Rana, M.S.; Hu, L.; Jiang, Y. Compensation of high nitrogen toxicity and nitrogen deficiency with biochar amendment through enhancement of soil fertility and nitrogen use efficiency promoted rice growth and yield. Glob. Chang. Biol. Bioenergy 2021, 13, 1765–1784. [Google Scholar] [CrossRef]
  15. Abbas, H.M.M.; Rais, U.; Sultan, H.; Tahir, A.; Bahadur, S.; Shah, A.; Iqbal, A.; Li, Y.; Khan, M.N.; Nie, L. Residual Effect of Microbial-Inoculated Biochar with Nitrogen on Rice Growth and Salinity Reduction in Paddy Soil. Plants 2024, 13, 2804. [Google Scholar] [CrossRef] [PubMed]
  16. Tian, X.; Li, Z.; Wang, L.; Wang, Y.; Li, B.; Duan, M.; Liu, B. Effects of Biochar Combined with Nitrogen Fertilizer Reduction on Rapeseed Yield and Soil Aggregate Stability in Upland of Purple Soils. Int. J. Environ. Res. Public Health 2019, 17, 279. [Google Scholar] [CrossRef]
  17. Ibrahim, M.M.; Chang, Z.; Li, Z.; Joseph, J.; Yusuf, A.A.; Luo, X.; Hou, E. Biochar rate-dependent regulation of extended nitrogen supply by modifying stable aggregates-N and microbial responses. Carbon Res. 2023, 2, 22. [Google Scholar] [CrossRef]
  18. Clough, T.; Condron, L.; Kammann, C.; Müller, C. A Review of Biochar and Soil Nitrogen Dynamics. Agronomy 2013, 3, 275–293. [Google Scholar] [CrossRef]
  19. Chamberlain, S.D.; Hemes, K.S.; Eichelmann, E.; Szutu, D.J.; Verfaillie, J.G.; Baldocchi, D.D. Effect of Drought-Induced Salinization on Wetland Methane Emissions, Gross Ecosystem Productivity, and Their Interactions. Ecosystems 2019, 23, 675–688. [Google Scholar] [CrossRef]
  20. He, M.; Li, D.; Peng, S.; Wang, Y.; Ding, Q.; Wang, Y.; Zhang, J. Reduced soil ecosystem multifunctionality is associated with altered complexity of the bacterial-fungal interkingdom network under salinization pressure. Environ. Res. 2025, 269, 120863. [Google Scholar] [CrossRef]
  21. Algethami, J.S.; Ibrahim, M.; Javed, W.; Alosaimi, E.H.; Irshad, M.K. Efficacy of Fe-BC in enhancing growth, photosynthesis, nutrition, and alleviating the toxicity of Cd and Cr in rapeseed (Brassica napus L.): A tool for managing the environment and attaining sustainable agriculture. Environ. Technol. Innov. 2024, 36, 103789. [Google Scholar] [CrossRef]
  22. Sahasakul, Y.; Aursalung, A.; Thangsiri, S.; Temviriyanukul, P.; Inthachat, W.; Pongwichian, P.; Sasithorn, K.; Suttisansanee, U. Nutritional Compositions, Phenolic Contents and Antioxidant Activities of Rainfed Rice Grown in Different Degrees of Soil Salinity. Foods 2023, 12, 2870. [Google Scholar] [CrossRef] [PubMed]
  23. Huang, Q.; Heuvelink, G.B.M.; He, P.; Leenaars, J.G.B.; Schut, A.G.T. Combining production ecology principles with random forest to model potato yield in China. Field Crops Res. 2024, 319, 109619. [Google Scholar] [CrossRef]
  24. Yuan, Z.; Zhou, X.; Zhang, Y.; Wang, Y.; Yan, H.; Sun, W.; Yan, M.; Wu, C. Stage-Dependent Mineral Element Dynamics in ‘Junzao’Jujube: Ionic Homeostasis and Selective Transport Under Graduated Saline-Alkali Stress. Horticulturae 2025, 11, 726. [Google Scholar] [CrossRef]
  25. Wei, X.; Fu, T.; He, G.; Zhong, Z.; Yang, M.; Lou, F.; He, T. Characteristics of rhizosphere and bulk soil microbial community of Chinese cabbage (Brassica campestris) grown in Karst area. Front. Microbiol. 2023, 14, 1241436. [Google Scholar] [CrossRef]
  26. Qin, M.; Fu, Y.; Li, N.; Zhao, Y.; Yang, B.; Wang, L.; Ouyang, S. Effects of Wheat Tempering with Slightly Acidic Electrolyzed Water on the Microbiota and Flour Characteristics. Foods 2022, 11, 3990. [Google Scholar] [CrossRef]
  27. Wang, T.; Li, L.; Qin, Y.; Lu, B.; Xu, D.; Zhuang, W.; Shu, X.; Zhang, F.; Wang, N.; Wang, Z. Effects of seasonal changes on chlorophyll fluorescence and physiological characteristics in the two Taxus species. Plants 2023, 12, 2636. [Google Scholar] [CrossRef]
  28. Zhang, Y.; Hussain, A.; Arif, M.; Alkahtani, J.; AlMunqedhi, B.M.; Song, C. Genetic variability for salinity tolerance of tomato (Solanum lycopersicon MILL.) genotypes determined by stress tolerance indices. J. King Saud Univ.-Sci. 2024, 36, 103386. [Google Scholar] [CrossRef]
  29. Sun, G.; Chen, S.; Zhang, S.; Chen, S.; Liu, J.; He, Q.; Hu, T.; Zhang, F. Responses of leaf nitrogen status and leaf area index to water and nitrogen application and their relationship with apple orchard productivity. Agric. Water Manag. 2024, 296, 108810. [Google Scholar] [CrossRef]
  30. Yang, Y.; Ahmed, W.; Ye, C.; Yang, L.; Wu, L.; Dai, Z.; Khan, K.A.; Hu, X.; Zhu, X.; Zhao, Z. Exploring the effect of different application rates of biochar on the accumulation of nutrients and growth of flue-cured tobacco (Nicotiana tabacum). Front. Plant Sci. 2024, 15, 1225031. [Google Scholar] [CrossRef]
  31. Yang, X.; Xie, Z.; Hu, Z.; Wen, G.; Li, S.; Ke, X.; Sun, X.; Tao, M.; Jiang, X. Effects of 3-year biochar application on carbon sequestration, nitrogen retention and nitrate leaching of fluvo-aquic soil profiles in vegetable rotation fields. Agric. Ecosyst. Environ. 2024, 367, 108989. [Google Scholar] [CrossRef]
  32. Wang, W.; Lu, S. Influence of Green Manure Rapes Returning and Biochar Application on Soil Carbon and Nitrogen Statuts of Newly Built Green Houses. J. Soil Sci. Plant Nutr. 2024, 24, 2035–2047. [Google Scholar] [CrossRef]
  33. Jin, F.; Piao, J.; Miao, S.; Che, W.; Li, X.; Li, X.; Shiraiwa, T.; Tanaka, T.; Taniyoshi, K.; Hua, S.; et al. Long-term effects of biochar one-off application on soil physicochemical properties, salt concentration, nutrient availability, enzyme activity, and rice yield of highly saline-alkali paddy soils: Based on a 6-year field experiment. Biochar 2024, 6, 40. [Google Scholar] [CrossRef]
  34. An, X.; Liu, Q.; Pan, F.; Yao, Y.; Luo, X.; Chen, C.; Liu, T.; Zou, L.; Wang, W.; Wang, J.; et al. Research Advances in the Impacts of Biochar on the Physicochemical Properties and Microbial Communities of Saline Soils. Sustainability 2023, 15, 14439. [Google Scholar] [CrossRef]
  35. Qi, Z.; Wang, M.; Dong, Y.; He, M.; Dai, X. Effect of Coated Urease/Nitrification Inhibitor Synergistic Urea on Maize Growth and Nitrogen Use Efficiency. J. Soil Sci. Plant Nutr. 2022, 22, 5207–5216. [Google Scholar] [CrossRef]
  36. Huang, J.-J.; He, L.-L.; Liu, Y.-X.; Lyu, H.-H.; Wang, Y.-Y.; Chen, Z.-M.; Chen, J.-Y.; Yang, S.-M. Effects of biochar combined with nitrification/urease inhibitors on soil active nitrogen emissions from subtropical paddy soils. Ying Yong Sheng Tai Xue Bao J. Appl. Ecol. 2022, 33, 1027–1036. [Google Scholar] [CrossRef]
  37. Dawar, K.; Fahad, S.; Jahangir, M.M.R.; Munir, I.; Alam, S.S.; Khan, S.A.; Mian, I.A.; Datta, R.; Saud, S.; Banout, J.; et al. Biochar and urease inhibitor mitigate NH3 and N2O emissions and improve wheat yield in a urea fertilized alkaline soil. Sci. Rep. 2021, 11, 17413. [Google Scholar] [CrossRef]
  38. Yao, Q.; Liu, J.; Yu, Z.; Li, Y.; Jin, J.; Liu, X.; Wang, G. Changes of bacterial community compositions after three years of biochar application in a black soil of northeast China. Appl. Soil Ecol. 2017, 113, 11–21. [Google Scholar] [CrossRef]
  39. Dawar, K.; Khan, A.; Sardar, K.; Fahad, S.; Saud, S.; Datta, R.; Danish, S. Effects of the nitrification inhibitor nitrapyrin and mulch on N2O emission and fertilizer use efficiency using 15N tracing techniques. Sci. Total Environ. 2020, 757, 143739. [Google Scholar] [CrossRef]
  40. Jin, Y.; Liang, X.; He, M.; Liu, Y.; Tian, G.; Shi, J. Manure biochar influence upon soil properties, phosphorus distribution and phosphatase activities: A microcosm incubation study. Chemosphere 2015, 142, 128–135. [Google Scholar] [CrossRef]
  41. Zhang, S.; Wang, L.; Gao, J.; Zhou, B.; Hao, W.; Feng, D.; Sun, X. Effect of biochar on biochemical properties of saline soil and growth of rice. Heliyon 2023, 10, e23859. [Google Scholar] [CrossRef]
  42. Frick, H.; Efosa, N.; Oberson, A.; Krause, H.M.; Nägele, H.J.; Frossard, E.; Bünemann, E.K. Nitrogen dynamics after slurry application as affected by anaerobic digestion, biochar and a nitrification inhibitor. Soil Use Manag. 2023, 40, e12953. [Google Scholar] [CrossRef]
  43. Chen, W.; Li, P.; Li, F.; Xi, J.; Han, Y. Effects of tillage and biochar on soil physiochemical and microbial properties and its linkage with crop yield. Front. Microbiol. 2022, 13, 929725. [Google Scholar] [CrossRef] [PubMed]
  44. Zhang, Y.; Wang, J.; Feng, Y. The effects of biochar addition on soil physicochemical properties: A review. Catena 2021, 202, 105284. [Google Scholar] [CrossRef]
  45. Zhang, M.; Riaz, M.; Zhang, L.; El-desouki, Z.; Jiang, C. Biochar Induces Changes to Basic Soil Properties and Bacterial Communities of Different Soils to Varying Degrees at 25 mm Rainfall: More Effective on Acidic Soils. Front. Microbiol. 2019, 10, 1321. [Google Scholar] [CrossRef] [PubMed]
  46. Rousk, J.; Bååth, E. Growth of saprotrophic fungi and bacteria in soil. FEMS Microbiol. Ecol. 2011, 78, 17–30. [Google Scholar] [CrossRef] [PubMed]
  47. Muhammad, N.; Dai, Z.; Xiao, K.; Meng, J.; Brookes, P.C.; Liu, X.; Wang, H.; Wu, J.; Xu, J. Changes in microbial community structure due to biochars generated from different feedstocks and their relationships with soil chemical properties. Geoderma 2014, 226–227, 270–278. [Google Scholar] [CrossRef]
  48. Kielak, A.M.; Barreto, C.C.; Kowalchuk, G.A.; van Veen, J.A.; Kuramae, E.E. The Ecology of Acidobacteria: Moving beyond Genes and Genomes. Front. Microbiol. 2016, 7, 744. [Google Scholar] [CrossRef]
  49. Wang, Y.; Xu, J.; Shen, J.; Luo, Y.; Scheu, S.; Ke, X. Tillage, residue burning and crop rotation alter soil fungal community and water-stable aggregation in arable fields. Soil Tillage Res. 2010, 107, 71–79. [Google Scholar] [CrossRef]
  50. Jaafar, N.M.; Clode, P.L.; Abbott, L.K. Microscopy Observations of Habitable Space in Biochar for Colonization by Fungal Hyphae From Soil. J. Integr. Agric. 2014, 13, 483–490. [Google Scholar] [CrossRef]
  51. Wei, Z.; Han, X.; Wang, Y.; Zhang, L.; Gong, P.; Shi, Y. Effects of biochar, dual inhibitor, and straw return on maize yield, soil physicochemical properties, and microbial system under fertilization conditions. Front. Microbiol. 2025, 16, 1570237. [Google Scholar] [CrossRef] [PubMed]
  52. Wu, C.; Sun, Q.; Ren, Z.; Xia, N.; Wang, Z.; Sun, H.; Wang, W. Combined effects of nitrogen fertilizer and biochar on the growth, yield, and quality of pepper. Open Life Sci. 2024, 19, 20220882. [Google Scholar] [CrossRef] [PubMed]
  53. Agegnehu, G.; Srivastava, A.K.; Bird, M.I. The role of biochar and biochar-compost in improving soil quality and crop performance: A review. Appl. Soil Ecol. 2017, 119, 156–170. [Google Scholar] [CrossRef]
  54. Nguyen, T.T.N.; Xu, C.-Y.; Tahmasbian, I.; Che, R.; Xu, Z.; Zhou, X.; Wallace, H.M.; Bai, S.H. Effects of biochar on soil available inorganic nitrogen: A review and meta-analysis. Geoderma 2017, 288, 79–96. [Google Scholar] [CrossRef]
  55. Akram, N.A.; Shafiq, F.; Ashraf, M. Ascorbic Acid-A Potential Oxidant Scavenger and Its Role in Plant Development and Abiotic Stress Tolerance. Front. Plant Sci. 2017, 8, 613–630. [Google Scholar] [CrossRef]
  56. Ibrahim, M.M.; Tong, C.; Hu, K.; Zhou, B.; Xing, S.; Mao, Y. Biochar-fertilizer interaction modifies N-sorption, enzyme activities and microbial functional abundance regulating nitrogen retention in rhizosphere soil. Sci. Total Environ. 2020, 739, 140065. [Google Scholar] [CrossRef]
  57. Wang, J.; Xiong, Z.; Kuzyakov, Y. Biochar stability in soil: Meta-analysis of decomposition and priming effects. Glob. Chang. Biol. Bioenergy 2015, 8, 512–523. [Google Scholar] [CrossRef]
  58. Liu, S.; Zhang, Y.; Zong, Y.; Hu, Z.; Wu, S.; Zhou, J.; Jin, Y.; Zou, J. Response of soil carbon dioxide fluxes, soil organic carbon and microbial biomass carbon to biochar amendment: A meta-analysis. Glob. Chang. Biol. Bioenergy 2015, 8, 392–406. [Google Scholar] [CrossRef]
  59. Mohammed, Y.A.; Chen, C.; Jensen, T. Urease and Nitrification Inhibitors Impact on Winter Wheat Fertilizer Timing, Yield, and Protein Content. Agron. J. 2016, 108, 905–912. [Google Scholar] [CrossRef]
  60. Zhang, M.; Liu, Y.; Wei, Q.; Gou, J. Biochar enhances the retention capacity of nitrogen fertilizer and affects the diversity of nitrifying functional microbial communities in karst soil of southwest China. Ecotoxicol. Environ. Saf. 2021, 226, 112819. [Google Scholar] [CrossRef]
  61. Paterson, E.; Thornton, B.; Midwood, A.J.; Osborne, S.M.; Sim, A.; Millard, P. Atmospheric CO2 enrichment and nutrient additions to planted soil increase mineralisation of soil organic matter, but do not alter microbial utilisation of plant- and soil C-sources. Soil Biol. Biochem. 2008, 40, 2434–2440. [Google Scholar] [CrossRef]
  62. Welutung, P.; Pengthamkeerati, P.; Tawornpruek, S.; Kachenchart, B. Fertilizer Rate and Urease and Nitrification Inhibitors Effects on Soil Inorganic Nitrogen and Sugarcane Yields in Central Thailand. Sugar Tech 2023, 25, 1070–1081. [Google Scholar] [CrossRef]
  63. Xing, Y.; Zhang, T.; Jiang, W.; Li, P.; Shi, P.; Xu, G.; Cheng, S.; Cheng, Y.; Fan, Z.; Wang, X. Effects of irrigation and fertilization on different potato varieties growth, yield and resources use efficiency in the Northwest China. Agric. Water Manag. 2021, 261, 107351. [Google Scholar] [CrossRef]
  64. Priyanka, K.P.; Harikumar, V.S.; Balakrishna, K.M.; Varghese, T. Inhibitory effect of TiO2 NPs on symbiotic arbuscular mycorrhizal fungi in plant roots. IET Nanobiotechnol. 2017, 11, 66–70. [Google Scholar] [CrossRef] [PubMed]
  65. Tighe-Neira, R.; Carmora, E.; Recio, G.; Nunes-Nesi, A.; Reyes-Diaz, M.; Alberdi, M.; Rengel, Z.; Inostroza-Blancheteau, C. Metallic nanoparticles influence the structure and function of the photosynthetic apparatus in plants. Plant Physiol. Biochem. 2018, 130, 408–417. [Google Scholar] [CrossRef] [PubMed]
  66. Guan, Y.; Wu, M.; Che, S.; Yuan, S.; Yang, X.; Li, S.; Tian, P.; Wu, L.; Yang, M.; Wu, Z. Effects of Continuous Straw Returning on Soil Functional Microorganisms and Microbial Communities. J. Microbiol. 2023, 61, 49–62. [Google Scholar] [CrossRef] [PubMed]
  67. Robin-Soriano, A.; Vincent, B.; Maurice, K.; Battesti, V.; Boukcim, H.; Ducousso, M.; Gros-Balthazard, M. Digging deeper into the impacts of different soil water systems on the date palm root architecture and associated fungal communities. Symbiosis 2025, 95, 81–98. [Google Scholar] [CrossRef]
Figure 1. Effects of biochar and N fertilizer applications on soil total nutrient content. (A) Total carbon (TC) (g kg−1); (B) Total nitrogen (TN) (g kg−1); (C) Total phosphorus (TP) (g kg−1); (D) Total potassium (TK) (g kg−1). Different lowercase letters denote significant differences among N-fertilizer treatments within the same biochar level (p < 0.05, Tukey’s HSD). Box plots show median (centre line), interquartile range (box), 1.5 × IQR (whiskers) and outliers (points); n = 6 per treatment. Treatment codes: CK + N0 = control without N and without biochar; CK + N1 = control + low urea; CK + N2 = control + high urea; CK + UI-N = control + urease-inhibitor N; CK + NI-N = control + nitrification-inhibitor N; BC1 + N0 = low biochar without N; BC1 + N1 = low biochar + low urea; BC1 + N2 = low biochar + high urea; BC1 + UI-N = low biochar + urease-inhibitor N; BC1 + NI-N = low biochar + nitrification-inhibitor N; BC2 + N0 = high biochar without N; BC2 + N1 = high biochar + low urea; BC2 + N2 = high biochar + high urea; BC2 + UI-N = high biochar + urease-inhibitor N; BC2 + NI-N = high biochar + nitrification-inhibitor N.
Agronomy 15 02205 g001aAgronomy 15 02205 g001b
Figure 2. Soil available nutrient dynamics under different biochar and N fertilizer combinations. (A) Soil organic matter (SOM) (g kg−1); (B) Alkali-hydrolyzable nitrogen (AHN) (mg kg−1); (C) Available phosphorus (AP) (mg kg−1); (D) Available potassium (AK) (mg kg−1). Different lowercase letters denote significant differences among N-fertilizer treatments within the same biochar level (p < 0.05, Tukey’s HSD). Box plots show median (centre line), interquartile range (box), 1.5 × IQR (whiskers) and outliers (points); n = 6 per treatment. Treatment codes: CK + N0 = control without N and without biochar; CK + N1 = control + low urea; CK + N2 = control + high urea; CK + UI-N = control + urease-inhibitor N; CK + NI-N = control + nitrification-inhibitor N; BC1 + N0 = low biochar without N; BC1 + N1 = low biochar + low urea; BC1 + N2 = low biochar + high urea; BC1 + UI-N = low biochar + urease-inhibitor N; BC1 + NI-N = low biochar + nitrification-inhibitor N; BC2 + N0 = high biochar without N; BC2 + N1 = high biochar + low urea; BC2 + N2 = high biochar + high urea; BC2 + UI-N = high biochar + urease-inhibitor N; BC2 + NI-N = high biochar + nitrification-inhibitor N.
Agronomy 15 02205 g002aAgronomy 15 02205 g002b
Figure 3. Effects of biochar and N fertilization on soil trace element dynamics. (A) Ca (g kg−1); (B) Cu (mg kg−1); (C) Zn (mg kg−1); (D) Mn (mg kg−1); (E) Mg (g kg−1); (F) Fe (g kg−1). Different lowercase letters denote significant differences among N-fertilizer treatments within the same biochar level (p < 0.05, Tukey’s HSD). Box plots show median (centre line), interquartile range (box), 1.5 × IQR (whiskers) and outliers (points); n = 6 per treatment. Treatment codes: CK + N0 = control without N and without biochar; CK + N1 = control + low urea; CK + N2 = control + high urea; CK + UI-N = control + urease-inhibitor N; CK + NI-N = control + nitrification-inhibitor N; BC1 + N0 = low biochar without N; BC1 + N1 = low biochar + low urea; BC1 + N2 = low biochar + high urea; BC1 + UI-N = low biochar + urease-inhibitor N; BC1 + NI-N = low biochar + nitrification-inhibitor N; BC2 + N0 = high biochar without N; BC2 + N1 = high biochar + low urea; BC2 + N2 = high biochar + high urea; BC2 + UI-N = high biochar + urease-inhibitor N; BC2 + NI-N = high biochar + nitrification-inhibitor N.
Agronomy 15 02205 g003aAgronomy 15 02205 g003b
Figure 4. Effects of biochar–N co-application on soil pH (A) and EC (µs cm−1) (B). Different lowercase letters denote significant differences among N-fertilizer treatments within the same biochar level (p < 0.05, Tukey’s HSD). Box plots show median (centre line), interquartile range (box), 1.5 × IQR (whiskers) and outliers (points); n = 6 per treatment. Treatment codes: CK + N0 = control without N and without biochar; CK + N1 = control + low urea; CK + N2 = control + high urea; CK + UI-N = control + urease-inhibitor N; CK + NI-N = control + nitrification-inhibitor N; BC1 + N0 = low biochar without N; BC1 + N1 = low biochar + low urea; BC1 + N2 = low biochar + high urea; BC1 + UI-N = low biochar + urease-inhibitor N; BC1 + NI-N = low biochar + nitrification-inhibitor N; BC2 + N0 = high biochar without N; BC2 + N1 = high biochar + low urea; BC2 + N2 = high biochar + high urea; BC2 + UI-N = high biochar + urease-inhibitor N; BC2 + NI-N = high biochar + nitrification-inhibitor N.
Agronomy 15 02205 g004
Figure 5. Effects of biochar–N co-application on soil enzyme activity. (A) Urease activity (mg g−1 d−1) (URE); (B) Sucrase activity (mg g−1 d−1) (SUC); (C) Alkaline phosphatase activity (mg g−1 d−1) (ALP); (D) Catalase activity (mL g−1 h−1) (CAT). Different lowercase letters denote significant differences among N-fertilizer treatments within the same biochar level (p < 0.05, Tukey’s HSD). Box plots show median (centre line), interquartile range (box), 1.5 × IQR (whiskers) and outliers (points); n = 6 per treatment. Treatment codes: CK + N0 = control without N and without biochar; CK + N1 = control + low urea; CK + N2 = control + high urea; CK + UI-N = control + urease-inhibitor N; CK + NI-N = control + nitrification-inhibitor N; BC1 + N0 = low biochar without N; BC1 + N1 = low biochar + low urea; BC1 + N2 = low biochar + high urea; BC1 + UI-N = low biochar + urease-inhibitor N; BC1 + NI-N = low biochar + nitrification-inhibitor N; BC2 + N0 = high biochar without N; BC2 + N1 = high biochar + low urea; BC2 + N2 = high biochar + high urea; BC2 + UI-N = high biochar + urease-inhibitor N; BC2 + NI-N = high biochar + nitrification-inhibitor N.
Agronomy 15 02205 g005aAgronomy 15 02205 g005b
Figure 6. Effects of biochar–N co-application on the abundance of bacterial and fungal microbial communities. Venn diagrams illustrate the unique and shared ASVs across various treatments. The numbers within each segment represent the count of unique ASVs for each treatment, while the connecting numbers indicate the shared ASVs among different treatments. Treatment codes: CK + N0 = control without N and without biochar; CK + N1 = control + low urea; CK + N2 = control + high urea; CK + UI-N = control + urease-inhibitor N; CK + NI-N = control + nitrification-inhibitor N; BC1 + N0 = low biochar without N; BC1 + N1 = low biochar + low urea; BC1 + N2 = low biochar + high urea; BC1 + UI-N = low biochar + urease-inhibitor N; BC1 + NI-N = low biochar + nitrification-inhibitor N; BC2 + N0 = high biochar without N; BC2 + N1 = high biochar + low urea; BC2 + N2 = high biochar + high urea; BC2 + UI-N = high biochar + urease-inhibitor N; BC2 + NI-N = high biochar + nitrification-inhibitor N.
Agronomy 15 02205 g006
Figure 7. Soil bacterial alpha-diversity indices under different biochar–N co-application strategies. Box plots show median (centre line), interquartile range (box), 1.5 × IQR (whiskers) and outliers (points). Sample size: n = 3 per treatment. Boxes sharing the same lowercase letter are not significantly different (p ≥ 0.05, Tukey’s HSD). Treatment codes: CK + N0 = control without N and without biochar; CK + N1 = control + low urea; CK + N2 = control + high urea; CK + UI-N = control + urease-inhibitor N; CK + NI-N = control + nitrification-inhibitor N; BC1 + N0 = low biochar without N; BC1 + N1 = low biochar + low urea; BC1 + N2 = low biochar + high urea; BC1 + UI-N = low biochar + urease-inhibitor N; BC1 + NI-N = low biochar + nitrification-inhibitor N; BC2 + N0 = high biochar without N; BC2 + N1 = high biochar + low urea; BC2 + N2 = high biochar + high urea; BC2 + UI-N = high biochar + urease-inhibitor N; BC2 + NI-N = high biochar + nitrification-inhibitor N.
Agronomy 15 02205 g007
Figure 8. Soil fungal alpha-diversity indices under different biochar–N co-application strategies. Box plots show median (centre line), interquartile range (box), 1.5 × IQR (whiskers) and outliers (points). Sample size: n = 3 per treatment. Boxes sharing the same lowercase letter are not significantly different (p ≥ 0.05, Tukey’s HSD). Treatment codes: CK + N0 = control without N and without biochar; CK + N1 = control + low urea; CK + N2 = control + high urea; CK + UI-N = control + urease-inhibitor N; CK + NI-N = control + nitrification-inhibitor N; BC1 + N0 = low biochar without N; BC1 + N1 = low biochar + low urea; BC1 + N2 = low biochar + high urea; BC1 + UI-N = low biochar + urease-inhibitor N; BC1 + NI-N = low biochar + nitrification-inhibitor N; BC2 + N0 = high biochar without N; BC2 + N1 = high biochar + low urea; BC2 + N2 = high biochar + high urea; BC2 + UI-N = high biochar + urease-inhibitor N; BC2 + NI-N = high biochar + nitrification-inhibitor N.
Agronomy 15 02205 g008
Figure 9. Phylum-level distribution of soil bacterial and fungal communities under different biochar–N co-application treatments. Stacked bar charts illustrate the relative abundance (in percentage) of the ten dominant bacterial phyla and seven dominant fungal phyla in the rhizosphere across various treatments. Phylum names are listed on the right. Treatment codes: CK + N0 = control without N and without biochar; CK + N1 = control + low urea; CK + N2 = control + high urea; CK + UI-N = control + urease-inhibitor N; CK + NI-N = control + nitrification-inhibitor N; BC1 + N0 = low biochar without N; BC1 + N1 = low biochar + low urea; BC1 + N2 = low biochar + high urea; BC1 + UI-N = low biochar + urease-inhibitor N; BC1 + NI-N = low biochar + nitrification-inhibitor N; BC2 + N0 = high biochar without N; BC2 + N1 = high biochar + low urea; BC2 + N2 = high biochar + high urea; BC2 + UI-N = high biochar + urease-inhibitor N; BC2 + NI-N = high biochar + nitrification-inhibitor N.
Agronomy 15 02205 g009
Figure 10. Principal Coordinates Analysis (PCoA) of soil bacterial and fungal communities under different biochar and nitrogen fertilizer regimes. Each point or shaded polygon in the plot represents the two-dimensional projection of the Bray–Curtis distance matrix of rhizosphere microbial communities under each fertilizer treatment. Each dot indicates the position of an individual replicate sample in the PC1–PC2 space; the closer the samples are in the plot, the more similar their community structures. The light-shaded areas represent convex hulls or ellipses (95%CI), which enclose all replicates within the same treatment to facilitate visual discrimination between treatments. Smaller enclosed areas indicate greater within-treatment consistency in community structure, whereas larger or more overlapping areas suggest higher intra-treatment heterogeneity or greater similarity with other treatments. Treatment codes: CK + N0 = control without N and without biochar; CK + N1 = control + low urea; CK + N2 = control + high urea; CK + UI-N = control + urease-inhibitor N; CK + NI-N = control + nitrification-inhibitor N; BC1 + N0 = low biochar without N; BC1 + N1 = low biochar + low urea; BC1 + N2 = low biochar + high urea; BC1 + UI-N = low biochar + urease-inhibitor N; BC1 + NI-N = low biochar + nitrification-inhibitor N; BC2 + N0 = high biochar without N; BC2 + N1 = high biochar + low urea; BC2 + N2 = high biochar + high urea; BC2 + UI-N = high biochar + urease-inhibitor N; BC2 + NI-N = high biochar + nitrification-inhibitor N.
Agronomy 15 02205 g010
Figure 11. Effects of different biochar–N co-application strategies on the yield and fruit quality of Jun Jujube. Different lowercase letters indicate significant differences between treatments during the same period (p < 0.05); n = 6 per treatment. Treatment codes: CK + N0 = control without N and without biochar; CK + N1 = control + low urea; CK + N2 = control + high urea; CK + UI-N = control + urease-inhibitor N; CK + NI-N = control + nitrification-inhibitor N; BC1 + N0 = low biochar without N; BC1 + N1 = low biochar + low urea; BC1 + N2 = low biochar + high urea; BC1 + UI-N = low biochar + urease-inhibitor N; BC1 + NI-N = low biochar + nitrification-inhibitor N; BC2 + N0 = high biochar without N; BC2 + N1 = high biochar + low urea; BC2 + N2 = high biochar + high urea; BC2 + UI-N = high biochar + urease-inhibitor N; BC2 + NI-N = high biochar + nitrification-inhibitor N.
Agronomy 15 02205 g011
Figure 12. Heat map of Pearson correlation coefficients among soil chemical properties, enzyme activities, microbial community structure, fruit yield, and quality. Color intensity indicates the strength of the correlation between the following parameters: TC, TN, TP, TK, SOM, AN, AP, AK, Ca, Cu, Zn, Mn, Mg, Fe, pH, EC, URE, SUC, ALP, CAT, bacterial Chao1 index (B−Chao1), bacterial Shannon diversity (B−Shannon), bacterial NMDS axes (B−NMDS1, B−NMDS2), fungal Chao1 index (F−Chao1), fungal Shannon diversity (F−Shannon), fungal NMDS axes (F−NMDS1, F−NMDS2), PY, VC, and SS. Asterisks below the figure panel denote the significance level.
Agronomy 15 02205 g012
Table 1. Biochar–N co-application rates for the field treatments.
TreatmentBiocharUreaUrease-Inhibited N Fertilizer (45%N)Nitrification-
Inhibited N Fertilizer (45%N)
SuperphosphatePotassium Sulfate
CKN000 150150
N10250 150150
N20450 150150
UI-N0 250 150150
NI-N0 250150150
BC1N050000 150150
N15000250 150150
N25000450 150150
UI-N5000 250 150150
NI-N5000 250150150
BC2N015,0000 150150
N115,000250 150150
N215,000450 150150
UI-N15,000 250 150150
NI-N15,000 250150150
Note: CK, BC1, and BC2 represent biochar application rates of 0, 5000, and 15,000 kg ha−1, respectively; N0, N1, N2, UI-N, and NI-N represent no N fertilizer, urea at 250 kg N ha−1, urea at 450 kg N ha−1, urease inhibitor-treated N fertilizer at 250 kg N ha−1, and nitrification inhibitor-treated N fertilizer at 250 kg N ha−1, respectively. Treatment codes combine biochar and nitrogen designations (e.g., CK + N0 indicates no biochar and no N application). Treatments are grouped by N type (N0, N1, N2, UI-N, and NI-N groups, each containing three biochar rates) or by biochar rate (CK, BC1, and BC2 groups, each containing five nitrogen treatments). The same nomenclature applies throughout.
Disclaimer/Publisher’s Note: The statements, opinions and data contained in all publications are solely those of the individual author(s) and contributor(s) and not of MDPI and/or the editor(s). MDPI and/or the editor(s) disclaim responsibility for any injury to people or property resulting from any ideas, methods, instructions or products referred to in the content.