1. Introduction
Haploid breeding can significantly shorten the breeding cycle and accelerate the development of new varieties, serving as a crucial technological platform in modern commercial breeding [
1]. The microspore culture technique serves as a pivotal tool in plant biotechnology, facilitating the development of doubled haploid (DH) plants that accelerate breeding cycles and enhance genetic research capabilities. It involves isolating and culturing free microspores in vitro to regenerate haploid or doubled haploid plants. This method has been widely applied in dicotyledonous plants like rapeseed and monocotyledonous plants like barley [
2]. However, adoption of the microspore culture technique in rice (
Oryza sativa L.) breeding remains limited due to challenges such as low microspore culture efficiency and genotype-dependent barriers. Consequently, anther culture, where microspores are cultured within the anther, remains the predominant method for obtaining DH plants in rice. Recently, significant progress has been made in refining anther culture protocols, particularly through improved sampling methods and optimized culture media formulations, leading to substantially enhanced callus induction, green plant regeneration rates [
3], and overall DH plantlet production [
4]. A persistent and major technological barrier, however, is the pronounced genotypic disparity:
indica rice exhibits significantly lower microspore culture efficiency (e.g., callus induction) compared to
japonica subspecies [
5]. This limitation extends to isolated microspore culture. Understanding the underlying molecular basis for this divergent efficiency, particularly through transcriptomic profiles, is therefore crucial for overcoming this bottleneck and enhancing breeding strategies.
In microspore embryogenesis, a clear distinction is made between several key phases. The process begins with the acquisition of embryogenic competence, which represents the latent potential of a microspore to switch its developmental fate [
6]. This is frequently achieved through an induction process, most commonly triggered by stress pre-treatments which confer this competence, although alternative pathways exist [
7]. Finally, the initiation phase constitutes the realization of this acquired competence, marked by active cell division and morphological changes that lead to callus formation.
Recent studies have focused on optimizing microspore culture protocols to enhance plantlet regeneration and transformation efficiency in rice. For instance, integrated transcriptomic and metabolomic studies revealed that cold stress pre-treatment profoundly reprograms rice microspores over a critical period (e.g., 10 days for
japonica rice Zhonghua 11), inducing significant shifts in gene expression and metabolic pathways-particularly in amino acid and carbohydrate metabolism-essential for inducing microspore totipotency and initiating embryogenesis [
8]. Abd Rahman et al. recognized the challenges in regenerating the Malaysian
indica rice MR219 via microspore culture and developed a protocol to improve callus initiation and microspore viability, highlighting the importance of environmental conditions and growth regulators in transformation efficiency [
9]. Similarly, an efficient protocol for
japonica rice microspore culture has been established, demonstrating high-frequency androgenesis and providing valuable insights into genetic research and breeding applications [
10].
The transcriptomic profiling of rice microspores and pollen has also been explored, revealing distinct gene expression patterns between
japonica and
indica varieties. Nguyen et al. identified genes preferentially expressed in early pollen development stages [
11], which are critical for understanding the regulatory mechanisms underlying microspore development. These findings are corroborated by Mishra and Rao (2016), who emphasized the role of doubled haploids in genetic transformation programs, further elucidating the genetic basis of rice microspore culture [
12].
Finally, the role of maturity indicators in enhancing the in vitro anther response of
indica rice has been demonstrated by Mayakaduwa and Silva, providing a cytological marker for assessing microspore maturity, which is crucial for improving callus induction response [
13]. These studies collectively contribute to our understanding of the genetic and physiological differences between
japonica and
indica rice, paving the way for more efficient breeding strategies.
Here, to elucidate the molecular mechanisms underlying the stark contrast in callus induction efficiency observed between japonica rice Chongxiangjing (CXJ) and indica rice 9311 during microspore culture, we conducted a comparative time-course transcriptome analysis. Genome-wide RNA-seq profiling was performed on isolated microspores sampled at three critical stages: culture initiation (0 days), the pivotal early response phase (5 days), and visible callus formation (10 days). This study systematically analyzed the dynamic transcriptome landscapes, identified stage-specific and genotype-dependent differentially expressed genes (DEGs), and performed functional enrichment analyses. Also, transcription factor analysis revealed CXJ-specific upregulation of pivotal regulators. Based on the pronounced transcriptional differences uncovered at this key juncture, we further prioritized and characterized candidate genes and pathways associated with embryogenic competence acquisition. Our work is paving the way for identifying master regulators of embryogenic competence and offering crucial insights for enhancing indica rice microspore culture technology in breeding applications.
2. Materials and Methods
2.1. Plant Materials
The
japonica rice variety Chongxiangjing (CXJ) and the
indica rice variety 9311 were grown at the Shanghai Academy of Agricultural Sciences farm in the summer season of 2024 (sown in May and sampled in August). There was no significant difference in the panicle collection time between the two rice varieties used in the study. At the booting stage, identified by swelling of the flag leaf sheath, panicles were collected between 9:00 and 10:00 a.m. to avoid the high temperatures and intense sunlight of midday, which can induce heat stress and alter microspore physiology, thereby ensuring developmental consistency and high initial viability. A slightly modified 4′,6-diamidino-2-phenylindole (DAPI) staining method, as previously described in our prior work [
10], was used to determine the developmental stage of microspores. Briefly, microspores were fixed in Carnoy’s Fluid (ethanol:acetic acid = 3:1) for 10 min. After removing the supernatant, 10 µL of double-distilled water and 10 µL of 0.1 mg/mL DAPI staining solution were added, mixed thoroughly, and incubated at 25 °C in the dark for 10 min. The samples were then observed under a fluorescence microscope. Panicles containing microspores at the late uninucleate stage were selected for subsequent experiments.
2.2. Low-Temperature Pre-Treatment of Rice Panicles
The collected rice panicles, after leaf removal, were wrapped in moist gauze, placed in a plastic bag, and refrigerated at 4 °C. In accordance with established protocols derived from previous studies [
8], which demonstrated that a 10-day cold treatment is required to initiate microspore embryogenesis, a 12-day pretreatment at 4 °C was applied to both genotypes in this study to ensure reliable induction of embryogenic competence.
2.3. Microspore Isolation and Culture
The experiments involving low-temperature pre-treatment and subsequent microscope culture were conducted in August and September 2024. Microspores were isolated and cultured following a described method [
10]. After the cold pre-treatment, rice panicles were subjected to surface sterilization by immersion in a 10% (
v/
v) sodium hypochlorite (NaOCl) solution for 10 min. This was followed by five thorough rinses with sterile distilled water to completely eliminate any residual sterilant that could be toxic to the microspores. Then the anthers were collected. The anthers were homogenized in an extraction solution, and the resulting suspension was filtered. The microspores were then purified using a 21% maltose solution to remove dead ones. The isolation and culture medium consisted of NB basic medium (comprising N6 macronutrients and B5 micronutrients and vitamins), supplemented with 75 g/L maltose as the carbon source, 0.75 g/L glutamine, 2 mg/L 2,4-D, 0.5 mg/L KT (Kinetin), and 0.976 g/L MES (2-(N-morpholino)ethanesulfonic acid). The pH was adjusted to 5.8. As this is a liquid culture system, no gelling agent was used. The medium was filter-sterilized using a 0.22 μm PES (Polyethersulfone) membrane (Merck Millipore, Darmstadt, Germany). The surviving microspores were adjusted to a density of 1.0 × 10
5 microspores/mL, inoculated in Petri dishes, and incubated in the dark at 25 °C for 23 days until callus formation, with 3 replicates for each sample.
2.4. Quantification of Microspore Viability and Callus Formation Rate
Microspore viability and callus formation were assessed at different developmental stages across multiple culture dishes. Images were captured using an Invitrogen EVOS FL Auto 2 microscope (software v2.0.883.0), with five randomly selected fields of view photographed per dish. Using ImageJ software (v1.53c; Java 1.8.0_172, 64-bit), live microspores, dead microspores, and microspore-derived calli were visually identified and counted within each field of view.
The microspore survival rate was calculated as:
The callus formation rate was calculated as:
Statistical analysis, including determination of significant differences, and graphical representation of the data were performed using GraphPad Prism software (version 10.1.2).
2.5. RNA Extraction and Enrichment in Rice Microspore
Total RNA was isolated from samples using the TransZol Up reagent (TransGen Biotech, Beijing, China) following the manufacturer’s protocol. RNA integrity was assessed by 1.5% agarose gel electrophoresis, while concentration and purity were determined using a Nanodrop spectrophotometer. Polyadenylated mRNA was subsequently enriched from total RNA with oligo(dT) magnetic beads.
2.6. Transcriptome Library Construction, Quantification, and Illumina Sequencing
Strand-specific transcriptome libraries were prepared from enriched mRNA using the VAHTS Universal V8 RNA-seq Library Prep Kit for Illumina (Vazyme Biotech, Nanjing, Jiangsu, China). Library concentrations were quantified with a Qubit 4.0 fluorometer (Thermo Fisher Scientific, Waltham, MA, USA). Paired-end sequencing (150 bp) was performed on a NovaSeq 6000 platform (Illumina, San Diego, CA, USA).
2.7. Quality Control and Read Mapping
The analysis was performed on a genome-wide scale, encompassing all genes in the reference genome annotation. No pre-selection of genes was performed prior to sequencing. Raw data containing adapters and low-quality reads were filtered using fastp (version 0.22.0) to obtain high-quality clean data for downstream analysis. The reference genome and corresponding gene annotation file were retrieved from the relevant genome database. Clean reads were aligned to the reference genome using HISAT2 (version 2.1.0). Gene expression levels were quantified as raw read counts using HTSeq (version 0.9.1) based on alignments (
Table S1).
2.8. Differential Expression Analysis
The expression levels of genes were quantified as FPKM (Fragments Per Kilobase per Million mapped reads) values for visualization and comparative purposes. However, for the identification of differentially expressed genes (DEGs), the raw read counts were used as input for the DESeq2 package (version 1.38.3) with significance thresholds of |log2FoldChange| > 1 and p-value < 0.05.
2.9. DEG Hierarchical Clustering Analysis
Hierarchical clustering of all DEGs across samples was performed using the ComplexHeatmap package (version 2.16.0). Distance was calculated using the Euclidean method, and clustering used the Complete Linkage method.
2.10. Functional Enrichment Analysis
DEGs (all, upregulated, downregulated) were mapped to the GO (Gene Ontology) database. Enrichment analysis was conducted using ClusterProfiler (version 4.6.0) employing the hypergeometric test. Terms with p-value < 0.05 were considered significantly enriched. KEGG (Kyoto Encyclopedia of Genes and Genomes) pathway enrichment analysis for DEGs was performed using ClusterProfiler (version 4.6.0), focusing on pathways significantly enriched (p-value < 0.05). GSEA on all genes ranked by expression change was conducted using ClusterProfiler (version 4.6.0). Enrichment plots were generated.
2.11. Transcription Factor Analysis
Transcription factors and their corresponding family classifications were predicted by comparing the gene set against the PlantTFDB (Plant Transcription Factor Database), followed by statistical analysis of the differentially expressed genes (DEGs) identified as transcription factors.
3. Results
3.1. Phenotypic Divergence in Microspore Survival and Callus Induction
We quantitatively assessed microspore survival and callus induction rates in the
japonica cultivar CXJ and the
indica cultivar 9311 at 0, 5, and 10 days post-culture initiation (dpi) (
Figure 1a). In this system, several distinct cellular states were observed: Undeveloped microspore (UM) refers to microspores that either remained at the initial state or had survived by 5 or 10 dpi without further development; these are spherical with visible germ pores. Multicellular structure (MS) denotes cell clusters that had successfully initiated embryogenic divisions by 5 dpi, appearing as opaque black structures similar in size or slightly larger than UMs. Callus (C) developed from MS by 10 dpi, forming aggregated clumps. Apoptotic cell (AC) represents microspores that underwent cell death during culture, exhibiting plasmolysis and a notably smaller size compared to living microspores. At day 0, immediately following purification, both CXJ and 9311 exhibited high and comparable microspore survival rates, with no significant difference observed between them. Crucially, no callus formation was detected in either cultivar at this initial time point. By day 5, microspore survival had significantly declined in both CXJ and 9311 compared to day 0. However, no significant difference in survival rate was yet apparent between the two cultivars at this stage. Notably, microscopic examination revealed that a subset of CXJ microspores had initiated the transition towards callus formation, while 9311 microspores showed no such developmental progression. At day 10, a stark phenotypic divergence emerged: microspores of 9311 were almost entirely non-viable, with survival nearing zero. In contrast, CXJ retained a population of viable microspores, among which a substantial proportion had developed into visible calli (
Figure 1b,c).
3.2. Transcriptome Profiling Reveals Divergent Temporal Dynamics of Gene Expression
RNA sequencing was performed on microspores of both cultivars harvested at 0, 5, and 10 dpi, and each sample group (genotype × time point) included three biological replicates (
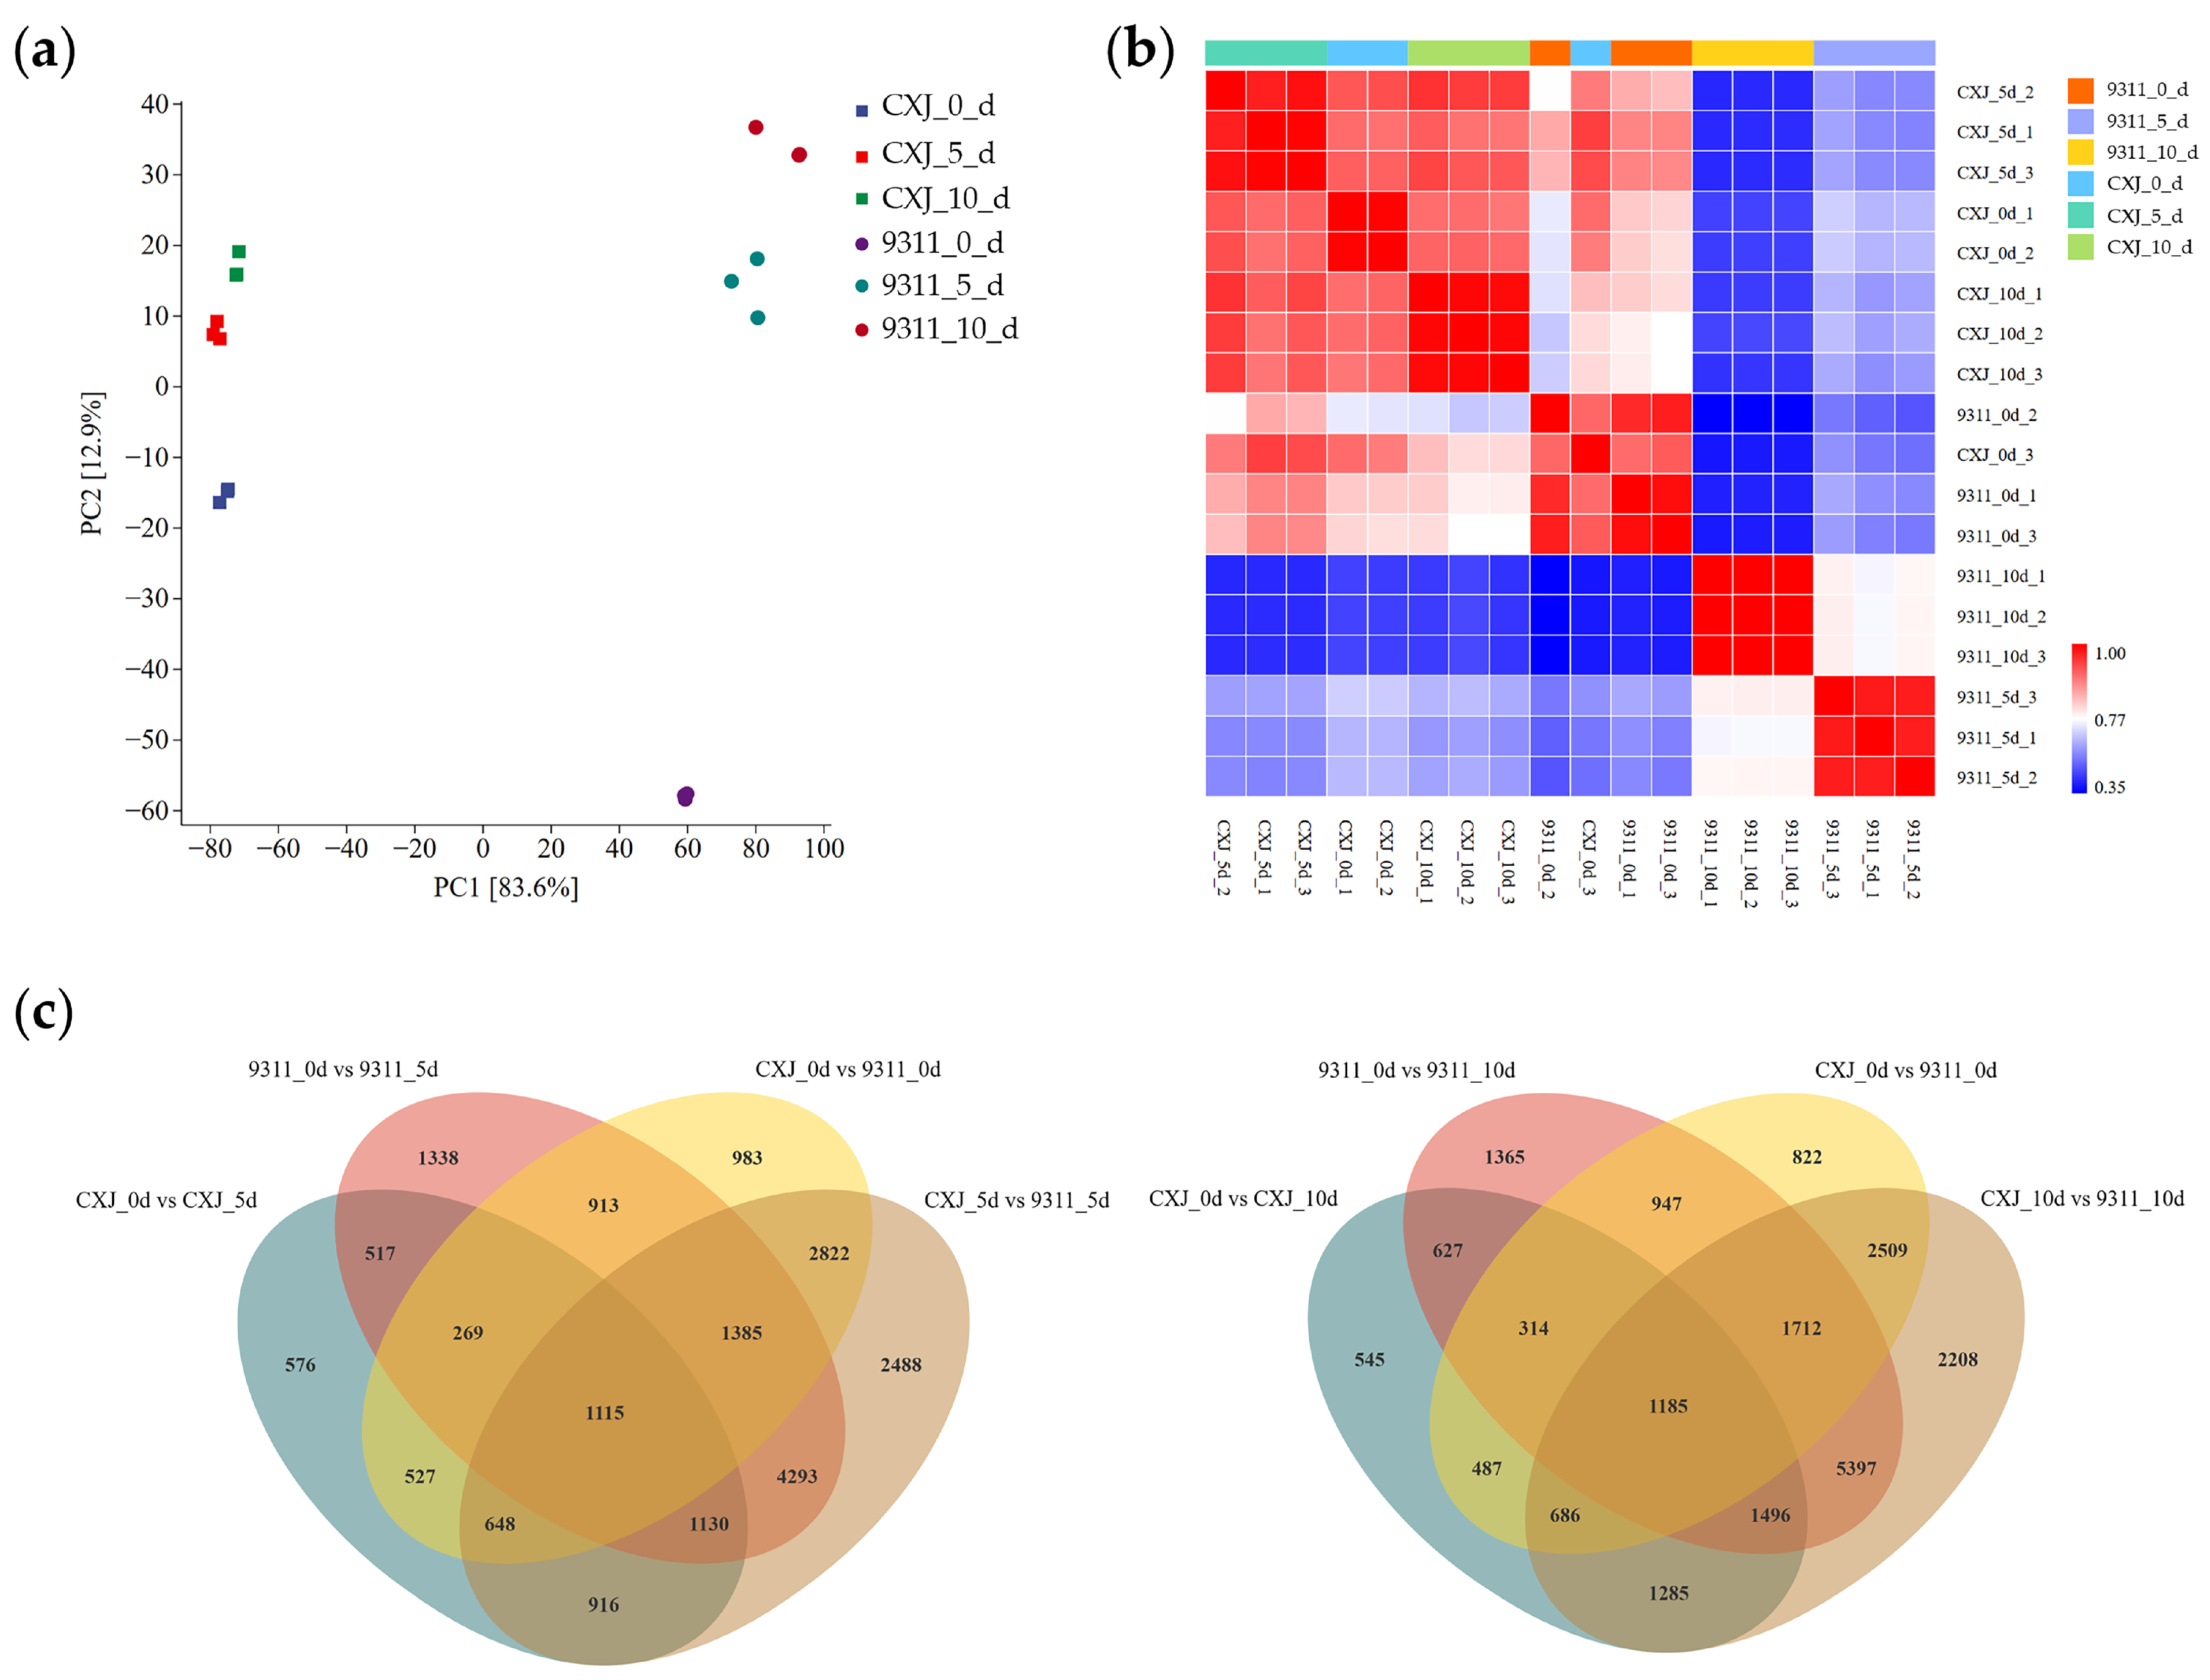
Table S1). Principal component analysis (PCA) of global gene expression patterns demonstrated clear separation along two primary dimensions: principal component 1 (PC1) predominantly captured the inherent varietal distinction between CXJ and 9311, while principal component 2 (PC2) primarily reflected temporal progression through the culture period (
Figure 2a). Notably, CXJ exhibited significantly less transcriptomic divergence between its day-0 state and later time points (5d/10d) compared to 9311, which underwent substantial transcriptome reorganization over the same period (
Figure 2a).
This temporal divergence was further corroborated by intersample correlation analysis (
Figure 2b). Transcriptional profiles of CXJ at all timepoints maintained high similarity to 9311 at day 0, suggesting conserved baseline programming. In striking contrast, 9311 samples from days 5 and 10 displayed markedly reduced correlation not only with CXJ counterparts but crucially with their own day-0 state and other sample groups.
Differential gene expression analysis quantified these patterns: Minimal DEGs (differentially expressed genes) were identified between cultivars at day 0. However, robust transcriptional divergence emerged at days 5 and 10, with significantly increased DEG numbers between CXJ and 9311. When examining temporal shifts within cultivars, CXJ showed relatively limited transcriptome alterations between day 0 and days 5/10. Conversely, 9311 exhibited extensive transcriptomic reprogramming, with substantially more DEGs between its day-0 state and later time points (
Figure 2c). To further dissect the composition of these DEGs, we enumerated the number of genes that were up-regulated in CXJ (and consequently down-regulated in 9311) versus those down-regulated in CXJ (up-regulated in 9311) at each stage (
Table 1). A complete list of all these DEGs, including their log2FoldChange, adjusted
p-values, and functional annotations, is provided in
Supplementary Table S2.
3.3. K-Means Clustering Unveils Distinct Temporal Expression Trajectories
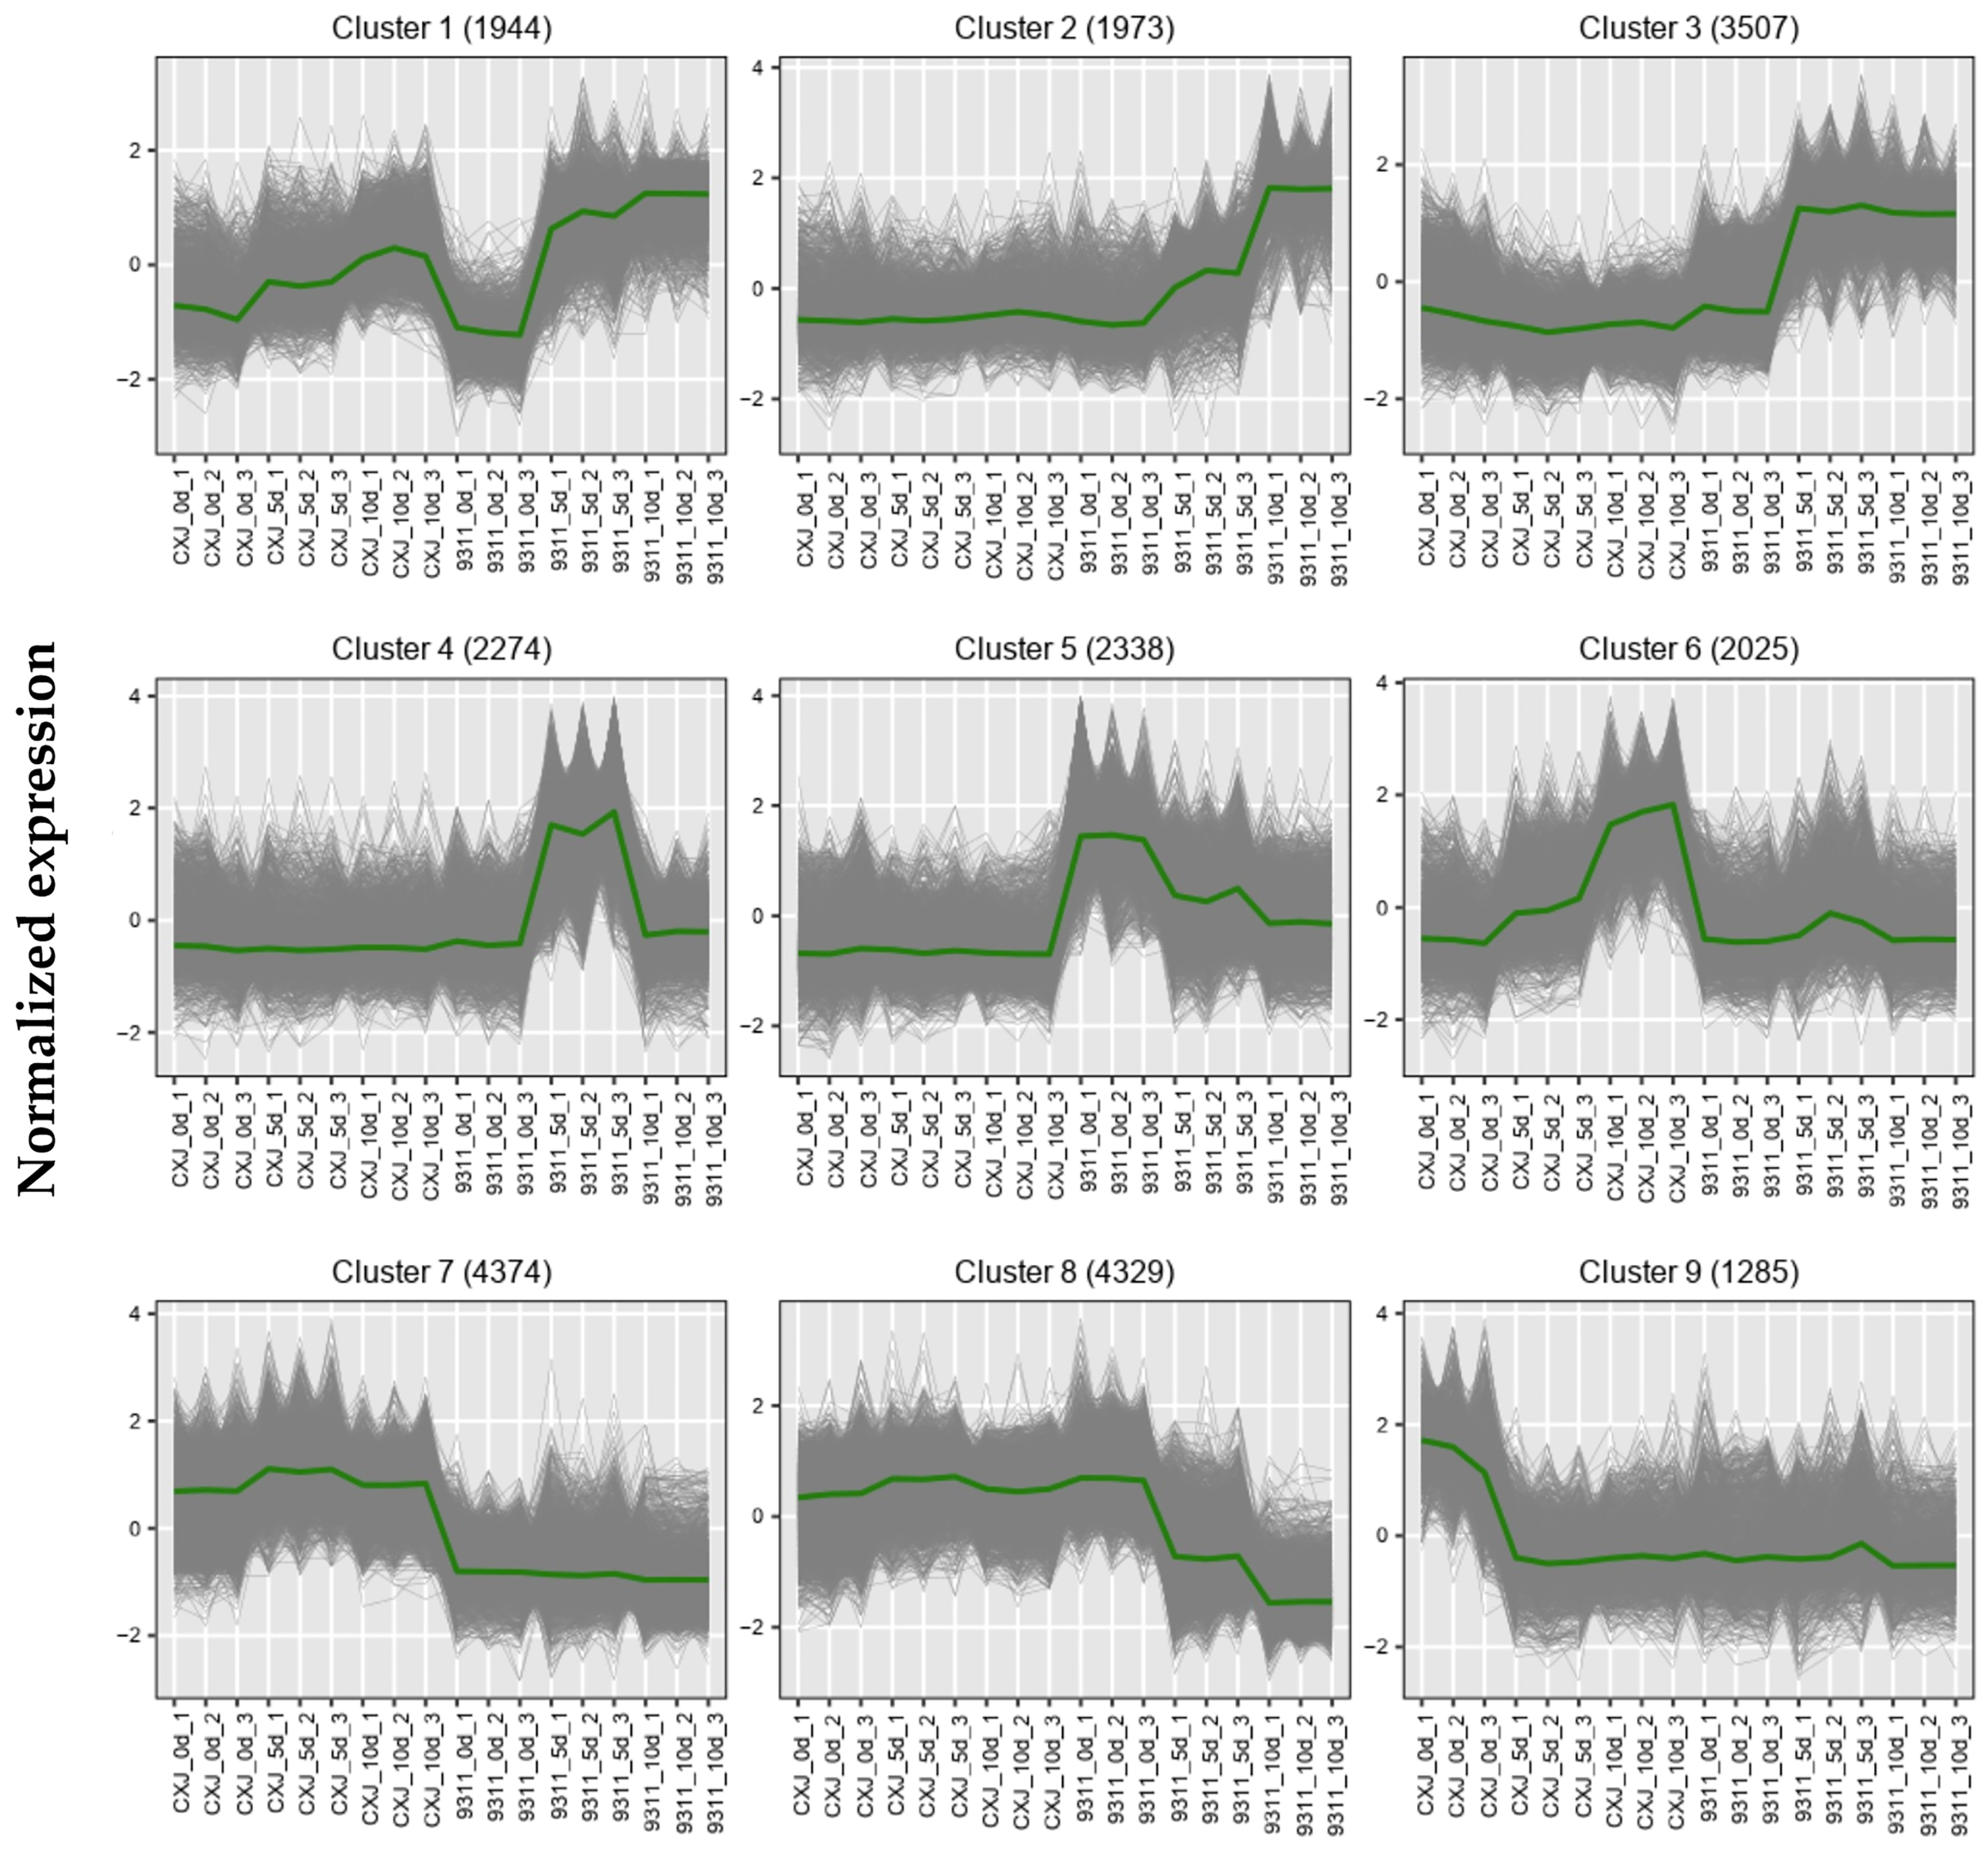
Nine K-means clustering of transcriptome data delineated cultivar-specific temporal expression trajectories (
Figure 3). The full list of genes assigned to each cluster, along with their Z-score normalized expression values across all samples, can be found in
Supplementary Table S3. Cluster 1 exhibited low basal expression in both cultivars at 0d, followed by progressive upregulation throughout the culture period. Cluster 2 maintained low expression in CXJ across all timepoints and in 9311 at 0d, but showed marked induction in 9311 at 5d with further elevation at 10d. Similarly low under baseline conditions (CXJ all stages; 9311-0d), Cluster 3 was induced in 9311 at 5d yet plateaued without further change at 10d. Cluster 4 demonstrated exclusive transient induction, peaking solely in 9311 at 5d while remaining suppressed elsewhere. Cluster 5 displayed constitutive suppression in CXJ but high expression in 9311 at 0d, undergoing progressive downregulation at 5d and 10d. Cluster 6 revealed gradual upregulation during CXJ culture while remaining persistently suppressed in 9311. Cluster 7 maintained constitutively high expression in CXJ throughout all stages but remained uniformly low in 9311. Cluster 8 showed sustained high expression in CXJ (all timepoints) and 9311-0d, followed by stepwise downregulation in 9311 at 5d and 10d. Finally, Cluster 9 featured acute transient expression restricted to CXJ at 0d, with suppression thereafter in both cultivars.
3.4. GO and KEGG Pathway Enrichment Reveals Functional Divergence Across Expression Clusters
Gene Ontology (GO) and Kyoto Encyclopedia of Genes and Genomes (KEGG) enrichment analyses were performed to elucidate the biological functions associated with each expression cluster (
Figure 4). The functional interpretation of clusters is based on the gene lists provided in
Supplementary Table S3 and the detailed annotations available in
Supplementary Table S2. Cluster 1 showed dual specialization: GO terms implicated strong involvement in transcriptional regulation (DNA-binding transcription factor activity, transcription regulator activity, DNA binding) alongside oxygen binding, while KEGG pathways revealed primary roles in metabolic processing (Fatty acid degradation, Tyrosine metabolism, Cysteine and methionine metabolism). Cluster 2 exhibited complementary stress/regulatory signatures: GO enrichment centered on stimulus response (response to endogenous stimulus, response to stimulus) and transcriptional control, while KEGG pathways converged on signaling cascades (plant hormone signal transduction, MAPK signaling pathway-plant) and redox homeostasis (Glutathione metabolism). Cluster 3 presented distinct compartmental and metabolic functions: GO terms highlighted vesicle trafficking (endosome, cytoplasmic vesicle, vesicle, intracellular vesicle), whereas KEGG enrichment indicated involvement in protein degradation (Proteasome), membrane dynamics (Endocytosis), and energy metabolism (Oxidative phosphorylation). Cluster 4 displayed divergent specializations: GO enrichment pertained to structural components (external encapsulating structure, cell wall, membrane), while KEGG pathways involved photosynthetic machinery (Photosynthesis) and photosynthate metabolism (Starch and sucrose metabolism, Carotenoid biosynthesis). Cluster 5 combined regulatory and stress functions: GO terms covered molecular regulation (enzyme regulator activity, molecular function regulator activity), hydrolytic activity, and extracellular localization, while KEGG pathways spanned protein maturation (Protein processing in endoplasmic reticulum), central carbon metabolism (Glycolysis/Gluconeogenesis), and defense responses (Plant-pathogen interaction). Cluster 6 showed strong coherence between development-related GO terms (developmental programming: anatomical structure development, developmental process, anatomical structure morphogenesis, multicellular organism development) and KEGG pathways supporting cell proliferation (DNA replication, Fatty acid elongation) and developmental signaling (Plant hormone signal transduction). Cluster 7 integrated nucleotide metabolism with core cellular functions: GO enrichment featured nucleotide/nucleoside binding and kinase activity, while KEGG pathways included genetic fidelity maintenance (Homologous recombination), isoprenoid metabolism (Carotenoid biosynthesis), and translation machinery (Ribosome). Cluster 8 exhibited broad functional associations: GO terms covered macromolecule metabolic processes (cellular macromolecule metabolic process) and organellar localization (cytoplasm, plastid, organelle), while KEGG pathways reflected translation machinery (Ribosome, Aminoacyl-tRNA biosynthesis) and genome stability maintenance (Homologous recombination). Cluster 9 combined stress-responsive processes (GO: response to stress, response to abiotic stimulus, response to stimulus) and structural integrity functions (cell wall) with KEGG enrichment in carbohydrate metabolism (Amino sugar and nucleotide sugar metabolism), protein maturation (Protein processing in endoplasmic reticulum), and energy conversion (Glycolysis/Gluconeogenesis).
3.5. Temporal Shifts in Functional Enrichment of Differential Expression
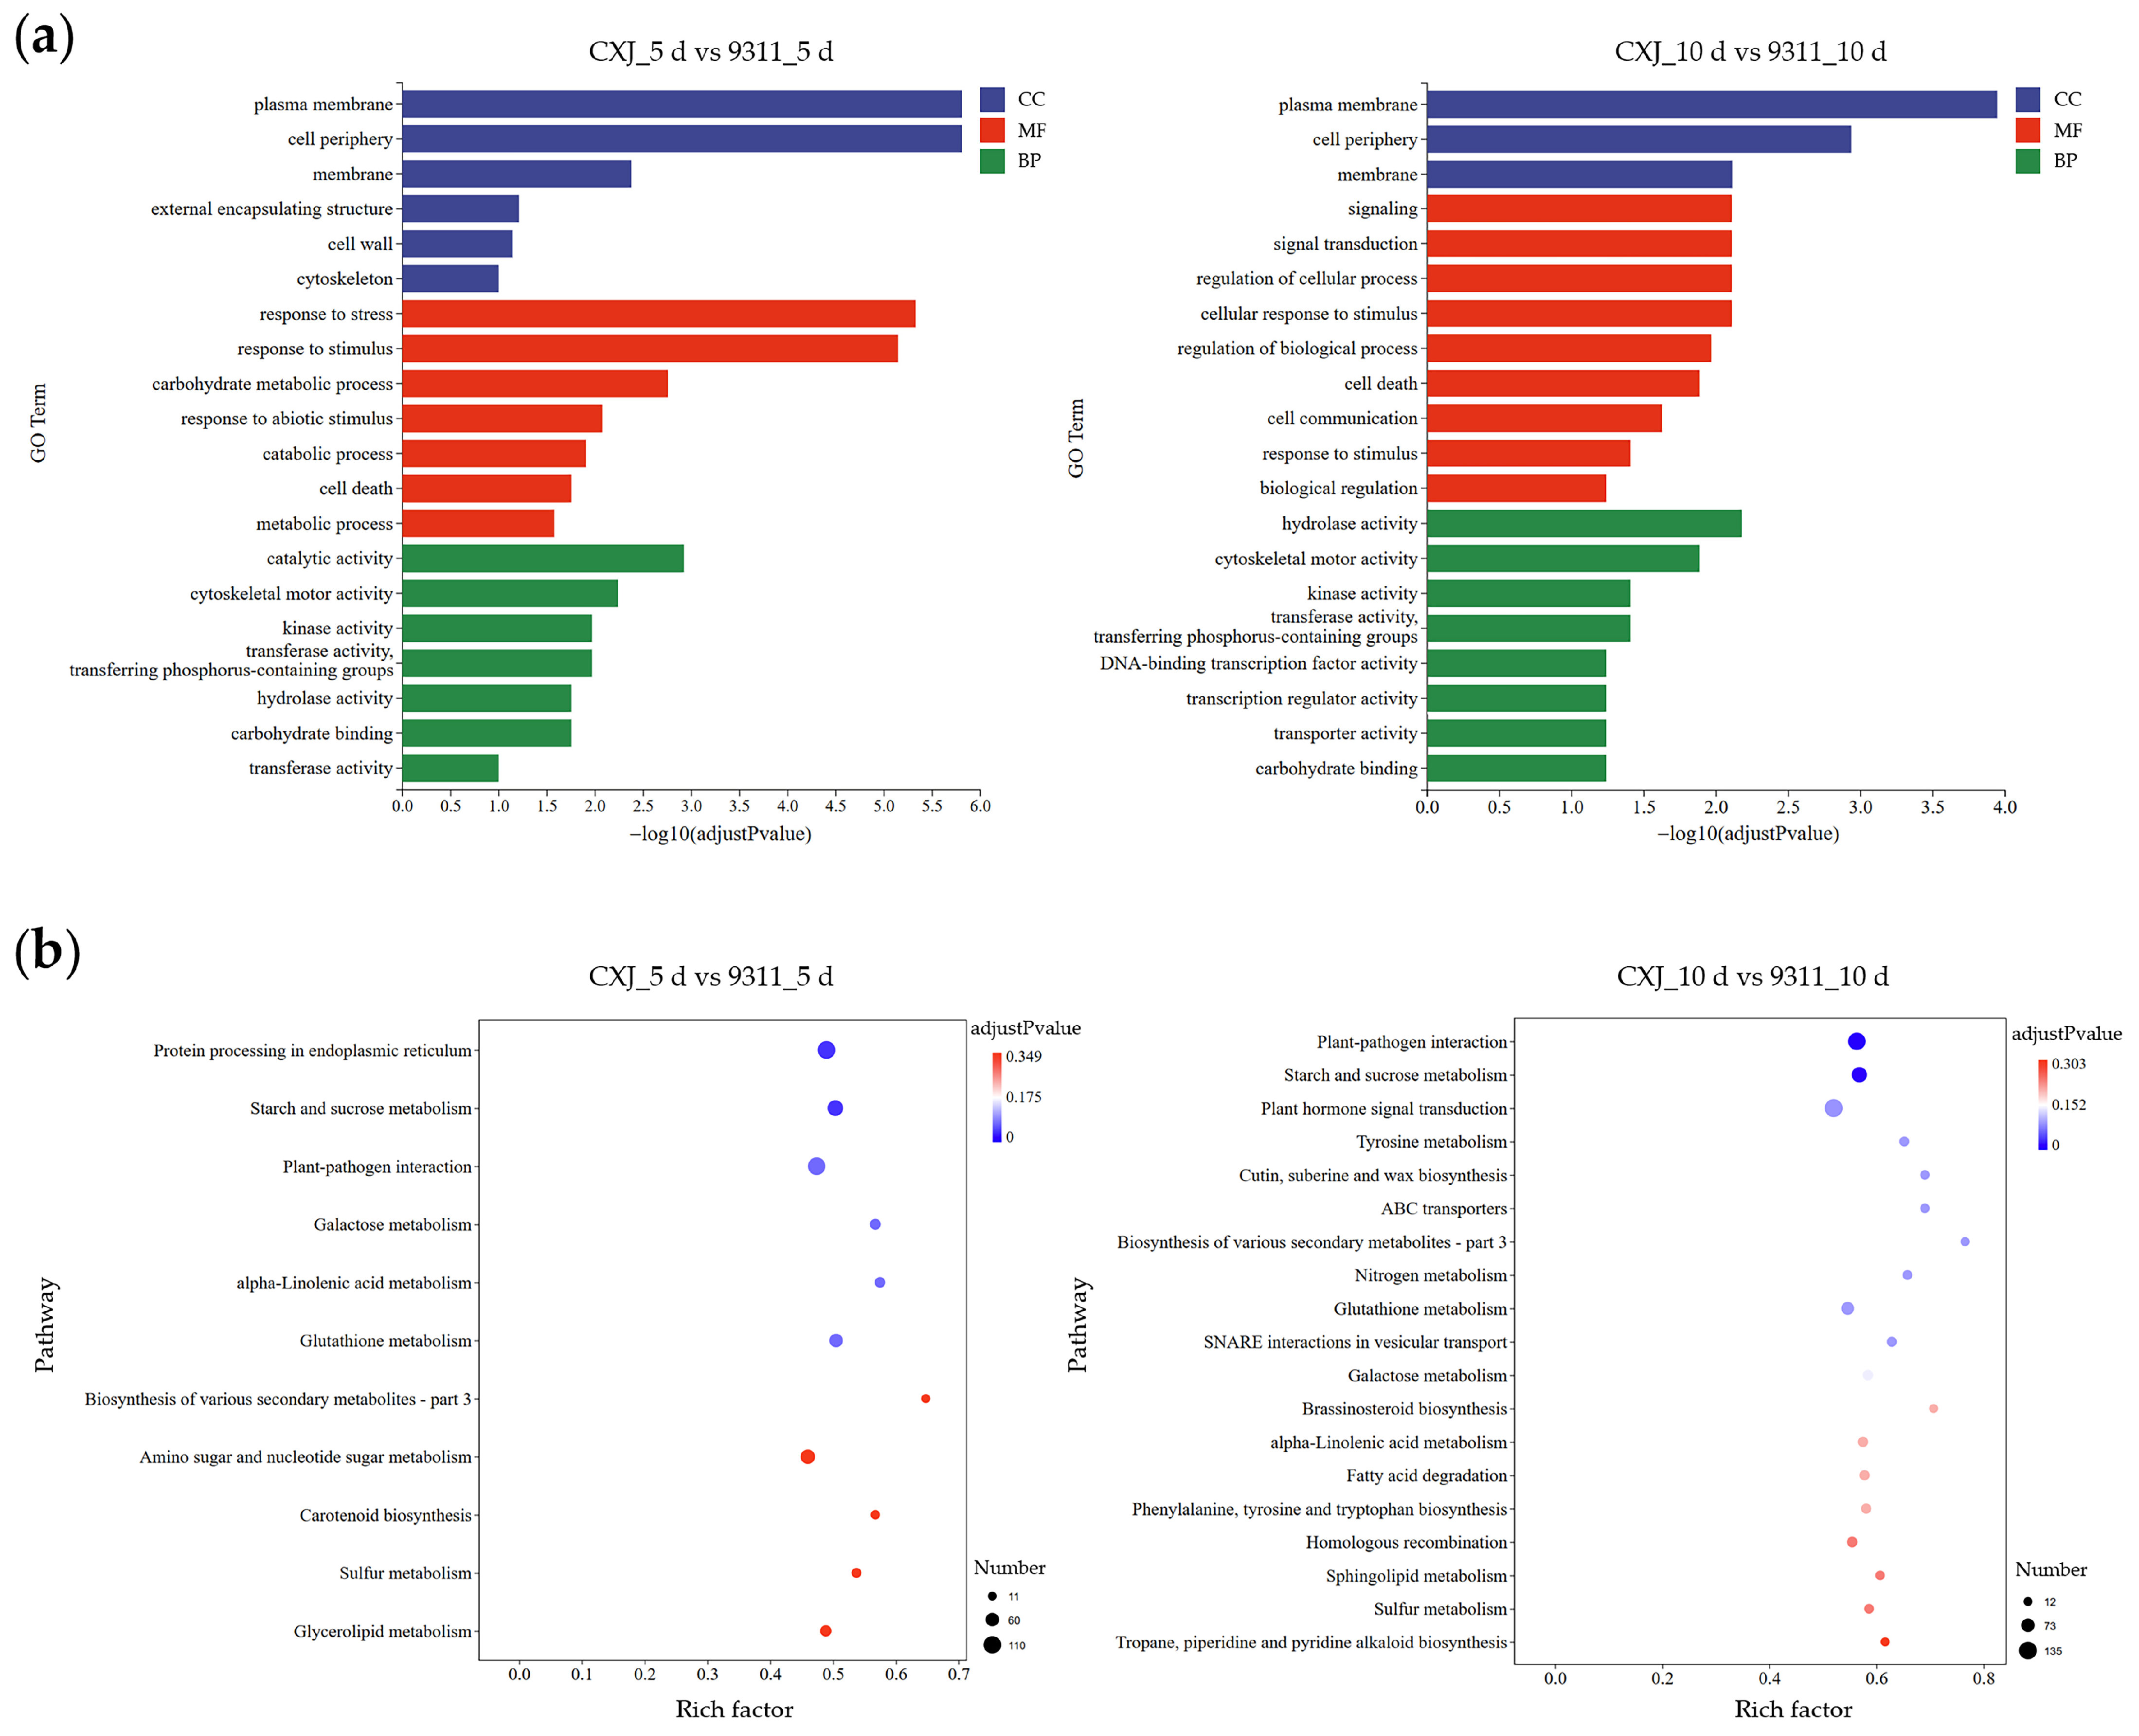
Functional enrichment analysis of DEGs between CXJ and 9311 revealed dynamic, stage-specific adaptations that underscore the divergent strategies employed by the two varieties (
Figure 5). For all subsequent descriptions, ‘up-regulated’ refers to higher expression in CXJ relative to 9311 at the given time point, and ‘down-regulated’ refers to lower expression in CXJ.
At 5 dpi, cellular components were predominantly localized to membrane systems, with significant enrichment in plasma membrane (768 up- vs. 535 down-regulated), cell periphery (938 up- vs. 650 down-), and membrane (1391 up- vs. 964 down-), indicating substantial membrane reorganization. Molecular functions centered on catalytic activities (2216 up- vs. 1607 down-), though cytoskeletal motor activity showed more downregulation (8 up- vs. 40 down-). Kinase activity was also enriched (434 up- vs. 387 down-). Biological processes involved stress adaptation, with response to stress (867 up- vs. 625 down-) and response to stimulus (1369 up- vs. 982 down-) showing strong enrichment, alongside carbohydrate metabolic process (229 up- vs. 192 down-).
KEGG pathway analysis at 5 dpi confirmed this stress-prone state. Protein processing in the endoplasmic reticulum (83 up- vs. 27 down-), plant–pathogen interaction (79 up- vs. 27 down-), and α-linolenic acid metabolism (23 up- vs. 8 down-) all showed marked enrichment. Starch and sucrose metabolism was also enriched but with more balanced regulation (41 up- vs. 45 down-). Additional pathways, including biosynthesis of other secondary metabolites (8 up- vs. 3 down-) and galactose metabolism (22 up- vs. 12 down-), further demonstrated metabolic dysregulation of 9311.
By 10 dpi, membrane localization persisted, with plasma membrane (822 up- vs. 657 down-), cell periphery (978 up- vs. 812 down-), and membrane (1575 up- vs. 1146 down-) maintaining enrichment. Molecular functions shifted toward signaling mechanisms, showing enrichment in signal transduction (373 up- vs. 326 down-), regulation of cellular processes (373 up- vs. 326 down-), and cellular response to stimulus (373 up- vs. 326 down-). Enzymatic regulation was evident through hydrolase activity (746 up- vs. 664 down-), kinase activity (470 up- vs. 466 down-), and transferase activity (905 up- vs. 825 down-).
KEGG analysis at 10 dpi revealed plant-pathogen interaction (90 up- vs. 36 down-) and glutathione metabolism (50 up- vs. 16 down-) as top pathways with strong enrichment. Starch and sucrose metabolism continued to be enriched (38 up- vs. 59 down-), now showing a downregulation trend. Plant hormone signal transduction was significantly enriched (89 up- vs. 46 down-), alongside brassinosteroid biosynthesis (4 up- vs. 8 down-) and nitrogen metabolism (16 up- vs. 7 down-).
This comprehensive analysis demonstrates distinct genotypic responses across time points, with 9311 showing persistent activation of stress-response pathways. Complete statistical details for all enriched terms, including gene ratios,
p-values, and full gene lists, are available in
Supplementary Table S4.
3.6. Differential Regulation of Transcription Factor Families During Culture
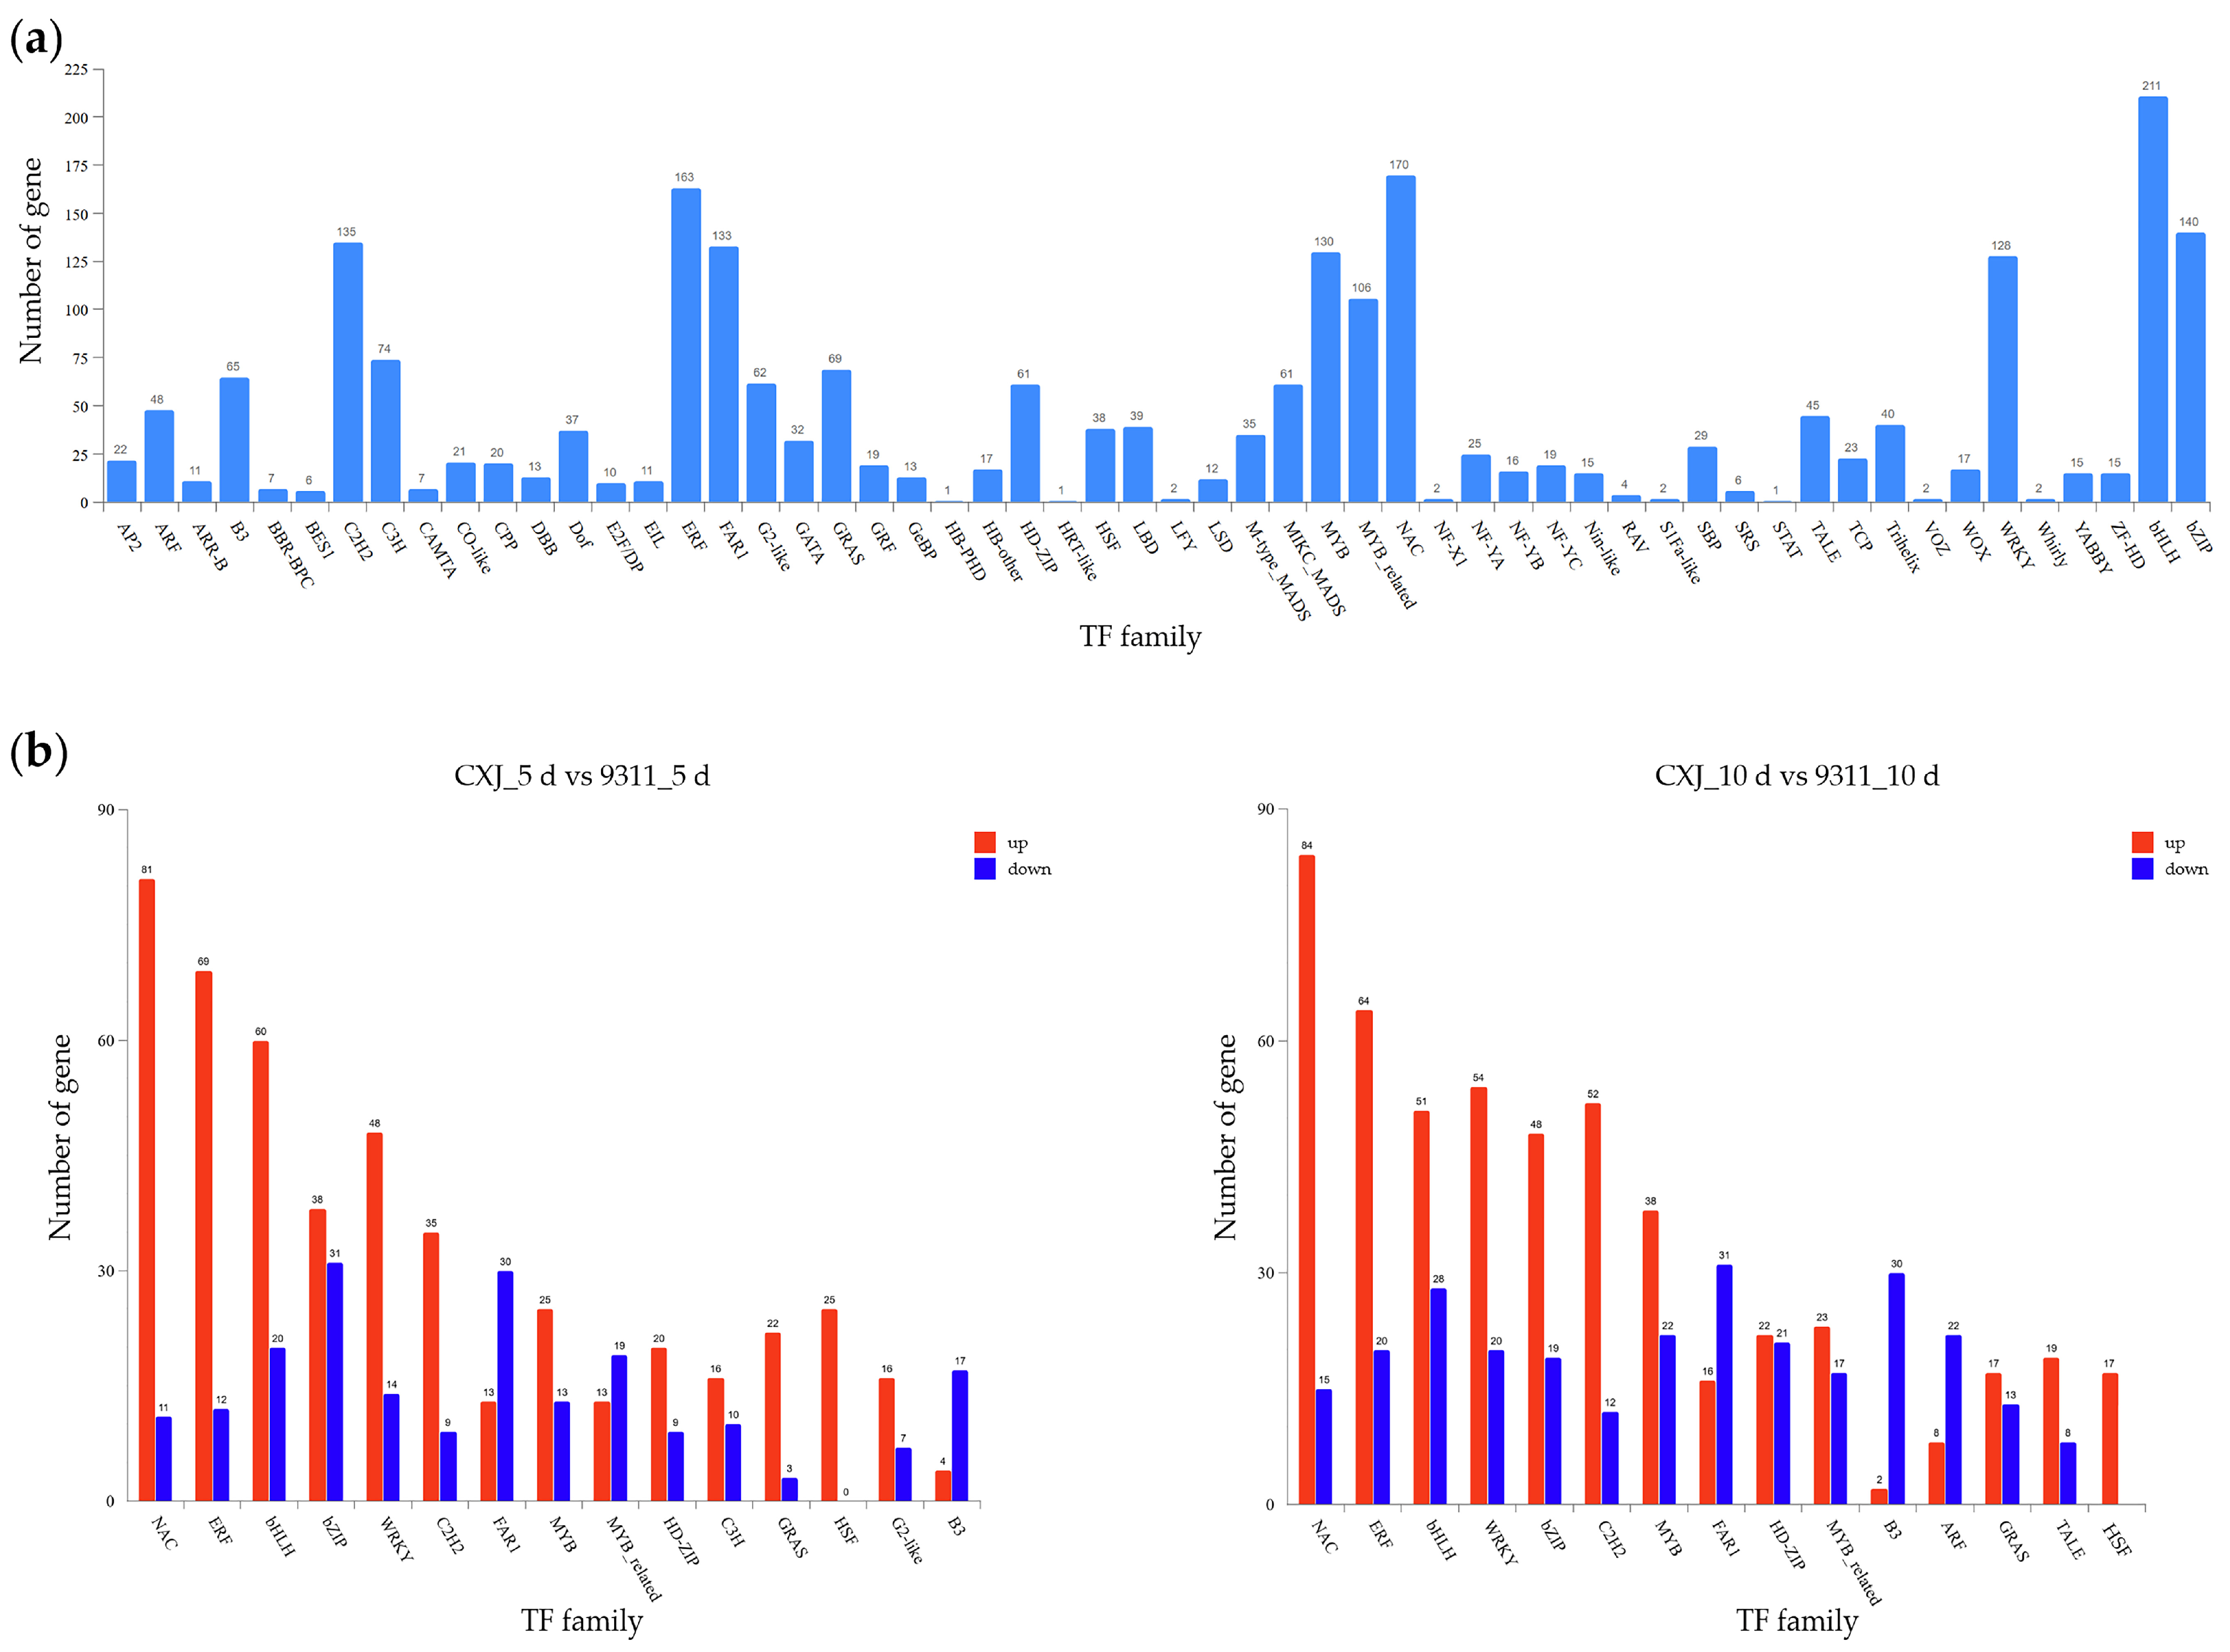
Transcriptional regulators were systematically annotated using the PlantTFDB database, identifying 56 transcription factor (TF) families across the transcriptome. The most substantially represented families included bHLH (211 genes), NAC (170 genes), and ERF (163 genes)(
Figure 6a). A compendium of all predicted TFs and their family classifications is provided in
Supplementary Table S5.
Comparative analysis of differential TF expression between CXJ and 9311 revealed distinct temporal regulatory patterns at 5 dpi and 10 dpi (
Figure 6b). All subsequent references to up- or down-regulation specifically indicate expression changes in CXJ relative to 9311. The NAC, ERF, bHLH, WRKY, C2H2, and MYB families exhibited significantly more upregulated than downregulated TFs at both time points. The bZIP family showed balanced up/down-regulation at 5 dpi but pronounced upregulation bias at 10 dpi. Conversely, GRAS TFs demonstrated strong upregulation bias at 5 dpi that equilibrated by 10 dpi. The FAR1 and B3 families consistently displayed more downregulated than upregulated members across both stages. Most notably, all differentially expressed HSF transcription factors were exclusively upregulated at both 5 dpi and 10 dpi, with no downregulated representatives observed. The list of differentially expressed TFs, along with their statistics and family information, is available in
Supplementary Table S6.
4. Discussion
This study dissects the molecular basis underlying the stark contrast in microspore embryogenic initiation between
japonica CXJ and
indica 9311. This genotypic disparity is well-recognized, with indica rice consistently exhibiting significantly lower microspore culture efficiency and being more recalcitrant to in vitro culture compared to
japonica subspecies, despite incremental improvements in haploid yield [
5]. Our integrated phenotypic and transcriptomic analyses reveal that the divergence arises not from initial cellular viability but from genotype-specific transcriptional reprogramming during the critical 5–10 dpi window, where CXJ stabilizes developmental trajectories while 9311 succumbs to stress-induced dysregulation (
Figure 1 and
Figure 2).
4.1. Temporal Transcriptome Dynamics Dictate Embryogenic Fate
The PCA and correlation analyses demonstrate that 9311 undergoes extensive transcriptome reorganization by 5 dpi, deviating sharply from its baseline state and CXJ’s trajectory (
Figure 2a,b). This aligns with its collapse in viability and absence of callus formation (
Figure 1b,c). Conversely, CXJ’s transcriptional stability (limited DEGs between 0d vs. 5d/10d;
Figure 2c) suggests robust maintenance of cellular homeostasis. The K-means clusters (C1–C9,
Figure 3;
Table S3) further delineate this dichotomy: Clusters 6–7 (constitutively active in CXJ) are enriched for developmental processes (DNA replication, anatomical structure morphogenesis) and hormone signaling (
Figure 4), whereas Clusters 2–4 (induced in 9311) engage stress responses (glutathione metabolism, MAPK signaling) and structural degradation (cell wall modification, vesicle trafficking) (
Figure 3 and
Figure 4). Notably, the transient induction of Cluster 4 (photosynthesis, starch metabolism) in 9311 at 5 dpi implies futile metabolic reactivation in isolated microspores, potentially accelerating energy depletion.
4.2. Genotype-Specific Functional Signatures Underlie Divergent Outcomes
The stage-specific functional enrichment of DEGs provides a clear, quantitative view of this divergence (
Supplementary Table S4). At 5 dpi, the enrichment of stress-response pathways in 9311 was unmistakable. For instance, the ‘plant-pathogen interaction’ pathway was overwhelmingly driven by genes up-regulated in 9311 (79 genes,
Figure 5,
Table S4), reflecting a misperception of culture conditions as a biotic threat. Similarly, ‘protein processing in endoplasmic reticulum’ (83 genes up in 9311) indicated severe ER stress induction. By 10 dpi, this stress response intensified rather than attenuated, with pathways like ‘glutathione metabolism’ (50 genes up in 9311) and ‘plant-pathogen interaction’ (90 genes up in 9311) becoming more prominent, culminating in near-total cell death. In contrast, CXJ’s functional signature was characterized by a sustained engagement of developmental and proliferative programs, such as ‘plant hormone signal transduction’, securing its embryogenic trajectory.
4.3. Temporal Shifts in Differential Gene Expression Determine Embryogenic Fate
Stage-specific DEG functional enrichment (
Figure 5) further exposed critical divergences in molecular responses. At 5 dpi, 9311’s DEGs overwhelmingly favored stress pathways: significant enrichment in plant-pathogen interaction (KEGG) and response to stimulus (GO) reflected misperception of culture conditions as biotic threats, while dominant protein processing in endoplasmic reticulum and starch/sucrose metabolism indicated ER stress induction and metabolic dysregulation. This outcome aligns with known mechanisms of environmental stress-induced microspore cell death [
14]. Conversely, CXJ’s DEGs at 5 dpi emphasized catalytic activities and carbohydrate metabolism—transient metabolic adjustments supporting callus initiation without persistent stress activation. By 10 dpi, 9311’s transcriptome intensified stress signaling (brassinosteroid biosynthesis, glutathione metabolism) while suppressing growth regulators (downregulated hydrolase/kinase activities), diverting resources toward survival at the expense of proliferation. This aligned with near-total cell death (
Figure 1b). In contrast, CXJ fortified developmental pathways: sustained enrichment in plant hormone signal transduction and DNA replication (KEGG), coupled with upregulated signaling receptor activity (GO), consolidated its proliferative trajectory. The temporal dynamics of DEGs thus reveal 9311’s early, irreversible commitment to stress defense (5–10 dpi), while CXJ’s coordinated activation of metabolic and developmental networks secures embryogenic progression.
4.4. Transcription Factor Networks Orchestrate Embryogenic Competence Divergence
The genotype-divergent transcription factor (TF) dynamics uncovered here establish a hierarchical control network governing embryogenic competence. CXJ exhibited strategic upregulation of development-stress integrators: sustained induction of NAC TFs (modulating developmental-stress crosstalk [
15]), ERF factors (attenuating culture-induced abiotic stress [
16]), and the exclusively upregulated HSF family (orchestrating proteostasis via protein-interaction networks [
17]) created a coordinated defense against in vitro stressors. Early-phase (5 dpi) dominance of GRAS TFs-functioning as co-activators of microspore totipotency genes [
18]-may operate concurrently with NAC/ERF induction to prime embryogenic programming. By 10 dpi, intensified bZIP upregulation in CXJ suggested reinforced metabolic governance [
19] without deleterious diversion into secondary metabolism.
Conversely, 9311 suffered catastrophic erosion of regulatory control due to sustained upregulation of FAR1 (accelerating oxidative stress-induced apoptosis [
20]) and B3 TFs (which trigger premature germination-like metabolism [
21]), depleting energy reserves essential for dedifferentiation. This was compounded by bZIP dysregulation: while balanced at 5 dpi, its disproportionate downregulation in 9311 at 10 dpi functionally impaired the synthesis of protective secondary metabolites, further eroding stress resilience.
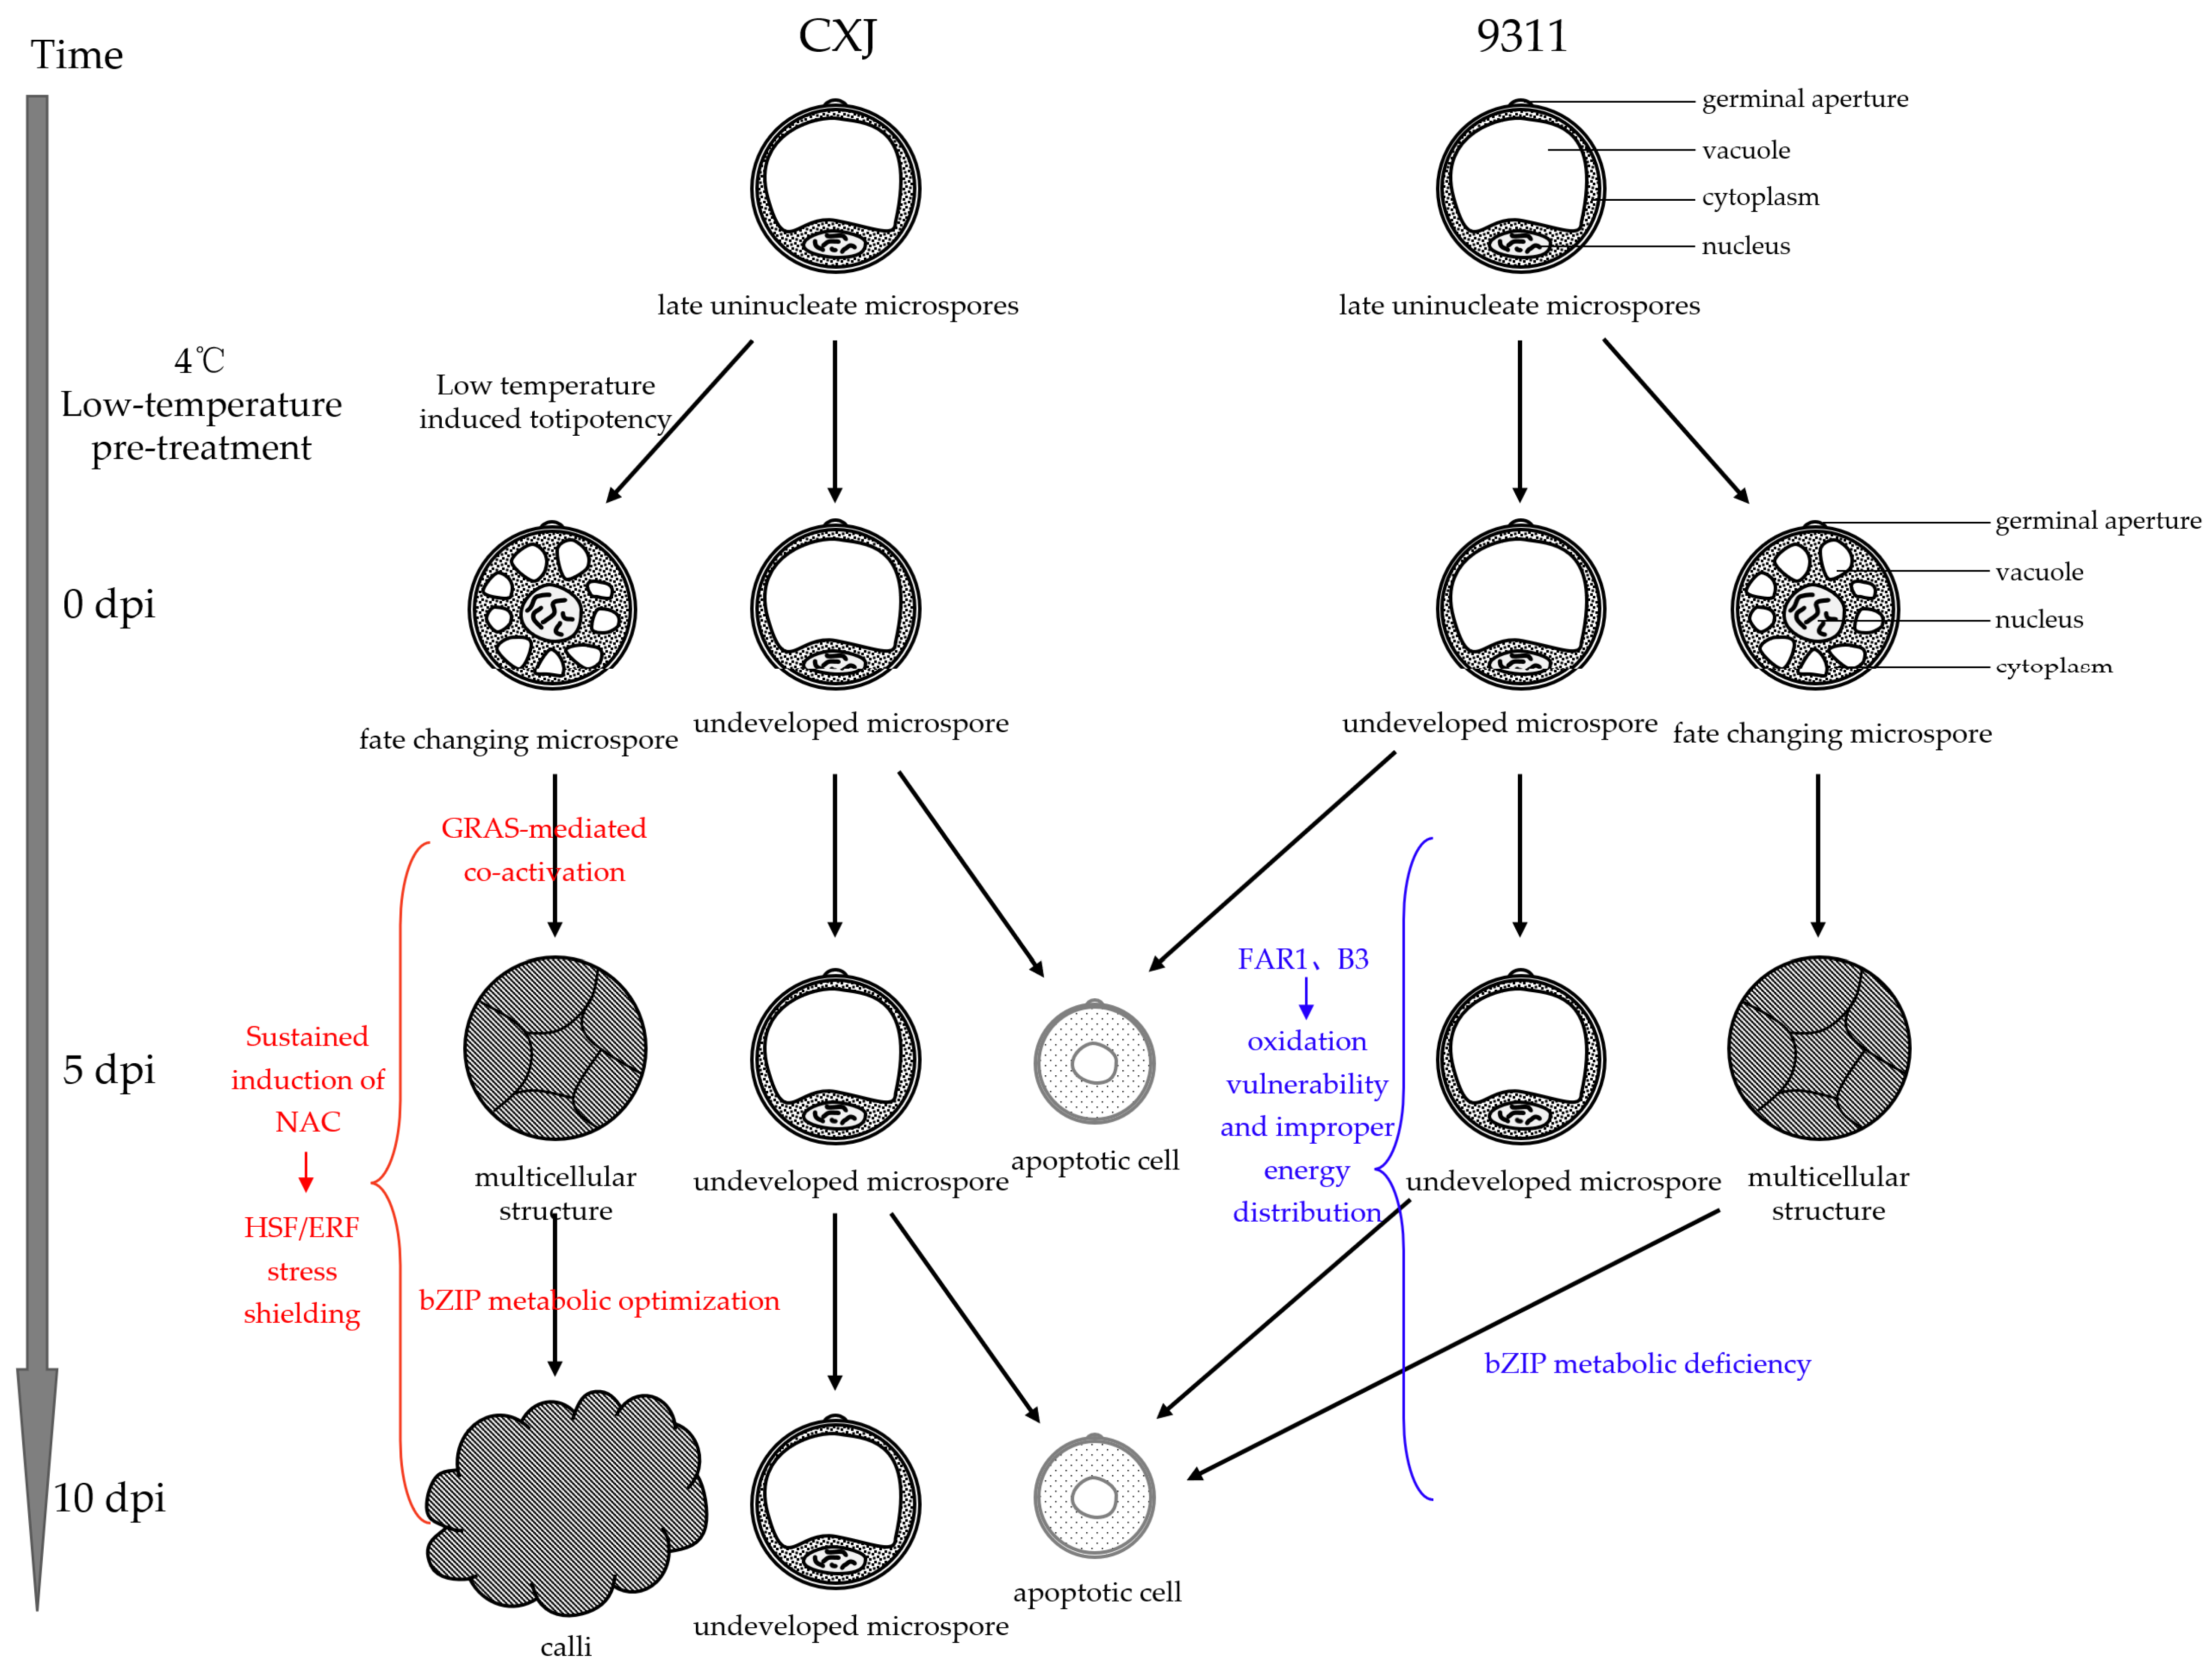
This TF imbalance initiated terminal cascades (
Figure 7):
CXJ achieved temporal synergy: GRAS-mediated co-activation (5 dpi) → HSF/ERF stress shielding (5–10 dpi) → bZIP metabolic optimization (10 dpi).
9311 entered a failure cascade: FAR1/B3 suppression → oxidative vulnerability + energy misallocation → bZIP deficiency (10 dpi) → collapse of metabolite-mediated stress protection → irrevocable apoptosis.
4.5. Future Perspectives
While this study focused on the molecular events during the critical initiation phase, a key future direction will be to test the regeneration potential of CXJ-derived calli into fertile plants, thus fully validating their embryogenic competence. Furthermore, functional validation of the candidate genes and TFs identified here, through overexpression or gene editing in 9311, will be crucial to confirm their roles as master regulators of embryogenic initiation.
5. Conclusions
Our comparative transcriptome analysis demonstrates that the divergent embryogenic initiation outcomes between japonica CXJ and indica 9311 arise from starkly contrasting transcriptional programs during early culture. CXJ succeeds by maintaining transcriptional stability and activating developmental processes (e.g., hormone signaling, DNA replication) alongside resilience-conferring transcription factors (NAC, ERF, HSF). In contrast, 9311 fails due to a maladaptive overdrive of stress-response pathways (e.g., plant-pathogen interaction, ER stress) and futile metabolism, culminating in cell death. These findings provide both a diagnostic toolkit for assessing microspore potential and actionable targets, such as key TFs or stress pathways, for biotechnological strategies to overcome genotype-dependent barriers in rice doubled haploid breeding.

