Article

Optimization of Irrigation Leaching Regime During the Cotton Growth Period Based on Multi-Model Integration and Fuzzy Borda Validation

1
Jiangxi Provincial Key Laboratory of Subtropical Forest Resources Cultivation, College of Forestry, Jiangxi Agricultural University, Nanchang 330045, China
2
Key Laboratory of Agricultural Resources and Ecology in Poyang Lake Watershed of Ministry of Agriculture and Rural Affairs in China, Jiangxi Agricultural University, Nanchang 330045, China
3
Department of Agronomy, Hetao College, Bayannur 015000, China
*
Authors to whom correspondence should be addressed.
Agronomy 2025, 15(9), 2113; https://doi.org/10.3390/agronomy15092113
Submission received: 10 July 2025 / Revised: 27 August 2025 / Accepted: 30 August 2025 / Published: 2 September 2025
(This article belongs to the Section Water Use and Irrigation)

Abstract

Efficient water management and soil salinity are major constraints on cotton (Gossypium hirsutum L.) production in southern Xinjiang. This study evaluated the impacts of three irrigation leaching regimes (W1: 75 mm + 80% ETc, W2: 150 mm + 80% crop evapotranspiration (ETc), W3: 240 mm + 80% ETc) applied at different stages (seeding, budding, flowering), compared with a control of 450 mm spring irrigation (CK), on cotton growth, yield, quality, and water-use efficiency (WUE). The optimal leaching amount was found to range between 155–240 mm, with the W2C and W3C treatments performing the best. To integrate eight fiber indices, five growth parameters, yield, and WUE, comprehensive assessment models were established Four integrated evaluation models (Broda, Copeland, fuzzy Borda, and overall difference-based evaluation) exhibited strong consistency (Spearman coefficient > 0.98). Results from the fuzzy Borda model indicated optimal performance under treatments W2C and W3C. Additionally, a regression model suggested that cotton production was optimized when cumulative irrigation and rainfall reached approximately 326.3 mm, with leaching amounts applied during seeding, budding, and flowering stages. These findings provide practical guidelines for effective leaching practices to reduce soil salinity and to sustainably enhance cotton productivity in southern Xinjiang.

1. Introduction

Water shortages, environmental contamination, soil salinization, rapid population growth, and ongoing loss of arable land collectively threaten global agricultural sustainability [1,2]. Among these, salinization is particularly damaging. It severely reduces land productivity and degrades crop yield and quality, even in regions where cultivation continues [3]. Currently, approximately 20% of global croplands and one-third of irrigated lands are negatively affected by soil salinity, causing nearly USD 300 billion in annual economic losses [4]. This challenge is particularly acute in China’s Tarim Basin, the largest inland cotton-producing region, where cotton cultivation contributes to more than half of agricultural income [5]. To mitigate salinity impacts, farmers typically increase irrigation throughout the growing season and employ large-scale salt-leaching irrigation during winter and spring. This method uses 6000 to 10,000 m3 hm−2 of reservoir water [6,7]. However, this inefficient practice results in excessive water consumption, reservoir depletion, reduced irrigation efficiency, elevated groundwater tables, and secondary soil salinization [8,9]. In recent years, simultaneously improving multiple indicators has become a primary goal in water-saving agriculture during cotton cultivation [10]. Therefore, optimizing irrigation timing and leaching amount is crucial for balancing multiple benefits, maintaining safe soil water and salinity levels, and achieving water-saving agriculture objectives during cotton cultivation.
Reclamation of saline–alkali soil requires a comprehensive approach that addresses key factors such as irrigation water quality, soil properties, groundwater dynamics, crop salt tolerance, and soil hydraulic behavior [11,12,13]. Several methods, including precision land leveling, chemical amendments, biochar applications, and optimized irrigation scheduling, have been developed to tackle these challenges. Among these, freshwater leaching is the most widely used technique for desalinization. However, conventional methods like high-amount continuous or intermittent irrigation and sprinklers consume excessive water and may remove critical nutrients from the root zone, limiting plant uptake [14]. Recent studies showed that controlled leaching under unsaturated flow preserves desalination efficacy while markedly enhancing WUE. It also reduces the spatial unevenness of salt removal caused by irregular topography [15,16]. Balancing the effects of mildly saline leaching water on cotton growth, yield, and fiber quality remains a critical challenge for broader adoption of this practice.
Multi-objective evaluation and optimization commonly utilize comprehensive evaluation methods, including the Analytic Hierarchy Process (AHP), the Entropy Weight Method, the Ideal Point Method (IPM), Grey Relational Degree Analysis (GRDA), and Membership Function Analysis (MFA) [17,18,19,20]. However, these individual methods are susceptible to subjective influences or differ in their evaluation perspectives, leading to inconsistent outcomes [21,22,23]. Thus, researchers have integrated multiple single-method results through optimized algorithms to combine qualitative and quantitative data, improving evaluation accuracy and comprehensiveness [24]. Notable composite evaluation methods include the Borda Composite Evaluation Model, the Copeland Composite Evaluation Model, the Fuzzy Borda (FBorda) Composite Evaluation Model, and the Composite Evaluation Model based on Overall Difference [25,26]. The Borda method aggregates rankings by assigning positional scores, while the Copeland method emphasizes pairwise comparisons of alternatives; both are ranking-based approaches with simple calculations and strong practicality [27,28]. The FBorda method extends the Borda framework by incorporating fuzzy set theory, which allows better handling of uncertainty in expert judgments and improves accuracy [29]. The Overall Difference Composite Approach (ODCA) integrates evaluation values to maximize the use of single-method results and introduces sensitivity to the ranking order by weighting the positions. Composite evaluation methods are increasingly used in management science for optimization [30,31], but their application in agriculture, especially in the comprehensive evaluation of cotton indicators, remains limited.
To address this research gap, this study investigated the applicability of composite evaluation methods to assess cotton growth, yield, and fiber quality under different irrigation leaching scenarios in southern Xinjiang. The innovation of this study lies in integrating multiple single-method evaluations into composite models to assess the impacts of varying irrigation leaching amounts and timings on cotton performance. Eight fiber-quality parameters, including average upper-half mean length, length uniformity, breaking strength, elongation at break, micronaire value, short fiber content, maturity index, and spinning consistency index, as well as seed cotton yield and various growth indicators were selected. By reasonably combining the algorithms, we comprehensively analyzed the results of a single model and selected the best treatment based on the evaluation values. This study aimed to optimize irrigation leaching regimes for cotton in southern Xinjiang by integrating multiple single-method evaluations into composite models. We hypothesized that the irrigation leaching amount and timing significantly affect cotton growth, yield, and fiber quality, and that composite evaluation methods provide more robust and reliable results than single-method approaches.

2. Materials and Methods

2.1. Data and Experiment Site Description

The experimental data included eight cotton fiber quality indicators (average length of the upper half, length regularity, breaking strength, breaking elongation, micronaire value, short fiber index, maturity index, and spinning consistency index), seed cotton yield, and cotton growth parameters. Data were collected from an irrigation and leaching experiment conducted from April to October 2019 in a typical saline–alkali cotton field located in Weili County, Korla City, Xinjiang, China (40°53′03″ N, 86°56′58″ E). The site is characterized by a continental desert climate, with long-term averages of annual precipitation (135.4 mm), potential evapotranspiration (2417 mm), and mean annual temperature (10.9 °C). The soil at the study site was primarily sandy loam, consisting of 1.03% clay, 20.45% silt, and 78.52% sand. Initial soil properties included nitrate nitrogen at 17.54 mg kg−1, ammonium nitrogen at 17.96 mg kg−1, available phosphorus at 7.09 mg kg−1, and available potassium at 658.39 mg kg−1. The soil exhibited an average bulk density of 1.48 g cm−3 and an average salinity level of 4.2 g kg−1, categorizing it as moderately saline. In addition, the soil pH was 8.3, the organic matter content was 7.6 g kg−1, and the field capacity was 23.4%.

2.2. Experiment Design

The cotton cultivar used in this experiment was “Xinlu Zhong 67”. Following the cotton harvest of 2018, the experimental field did not undergo conventional winter–spring irrigation. Instead, a pre-sowing leaching irrigation of 450 mm and an 80% ETc irrigation schedule during the growth period served as the control treatment (CK). Nine additional treatments were established, combining three leaching amounts, including W1 (75 mm + 80% ETc), W2 (150 mm + 80% ETc), and W3 (240 mm + 80% ETc), with three different leaching timings: seedling stage only (A), seedling plus budding stage (B), and seedling, budding, plus flowering and boll stage (C), resulting in a total of ten treatments, including the control (CK) (Table 1). The experiment followed a split-plot design with three replications. Each plot measured 7 m × 5 m, with 2 m buffer strips between plots to reduce border effects. Fertilization throughout the experiment adhered to local agricultural practices, supplying nutrients at rates of N–P2O5–K2O (300–90–45 kg hm−2). All other field management practices, including pest control, planting density, and weed management, conformed to standard local procedures employed in high-yield cotton fields.

2.3. Measurements and Data Collection

2.3.1. Growth Parameter Measurement

At each critical growth stage of cotton (seeding, budding, flowering, and boll-opening), three plants were randomly selected from each plot for growth parameter assessments. Plant height was measured with a standard tape measure, and stem diameter was determined using a digital caliper. After measurements, sampled plants were carefully cut at the stem base, separated into aboveground parts (leaves, stems, and reproductive organs), and immediately placed in an oven to deactivate enzymes by heating at 105 °C for 30 min. Subsequently, samples were oven-dried at 70 °C to a constant weight, and dry biomass was measured using an electronic scale. Leaf area index (LAI) was quantified by a standard punching method, based on the ratio of leaf area to ground surface area. At each growth stage, soil samples were collected using a soil auger at depths of 10, 20, 30, 40, 60, 80, and 100 cm. Sampling was performed at four representative positions within each plot: the middle of the wide row, the drip line, the narrow row, and the non-mulched inter-row area. Soil water content (SWC) was determined by the standard oven-drying method at 105 °C to constant weight.
At the cotton boll-opening stage, three representative sample plots measuring 1 m × 1.52 m were selected randomly from each treatment to estimate yield parameters. Within each sampling plot, cotton bolls were harvested from the upper, middle, and lower canopy layers, with respective counts of 30, 40, and 30 bolls per layer. These collected bolls were used to measure boll weight, boll number per plant, and effective boll number. Seed cotton yield per plot was calculated from these parameters and subsequently extrapolated to yield per hectare. Fiber quality parameters, including fiber length, strength, uniformity, elongation, micronaire value, short fiber index, maturity index, and spinning consistency index, were measured according to standard cotton fiber testing methods using the High Volume Instrument (HVI) system.

2.3.2. Calculation of WUE

Crop water consumption was calculated using the following Equation (1) [32]:
E T = P + U + I D R Δ W
where E T denotes crop water consumption (mm), P is the rainfall (mm), U is the groundwater recharge (mm), I is the irrigation amount (mm), R is the runoff (mm), D is the deep percolation (mm), Δ W is the change in soil moisture (mm). Deep percolation was calculated as follows:
D P i = M 1 + h i M
where D P i represents the deep seepage amount at the ith point (mm), M 1 represents the initial moisture content (mm), h i represents the irrigation depth at the ith point (mm), M represents the initial moisture content (mm). Given the flat terrain and minimal precipitation at the experimental site. Thus, Equation (1) can be simplified as follows:
E T = P + I D Δ W
Water use efficiency was calculated using Equation (4):
W U E = Y / E T
where Y is the seed cotton yield (kg hm−2).

2.3.3. Cotton Quality

Cotton quality indicators were measured by the Quality Standards Institute of the Xinjiang Academy of Agricultural Sciences (Quality Supervision and Testing Center for Cotton, Ministry of Agriculture and Rural Affairs, Urumqi) using the HVI1000M700 (Uster Technologies AG, Uster, Switzerland) cotton fiber quality testing instrument. Measurements were conducted under controlled environmental conditions: temperature between 18.0 °C and 22.0 °C and relative humidity between 62.0% and 68.0%.
Significant differences in growth performance, quality parameters, and yield were observed among the ten treatments, as determined by analysis of variance (ANOVA) and multiple comparisons. Variations in irrigation leaching patterns led to differential effects on plant performance, with some treatments achieving optimal growth, yield, or fiber quality. Therefore, a comprehensive evaluation considering both yield and quality was performed to identify the optimal leaching pattern under multi-objective conditions.

2.4. Model Building Method

The evaluation framework employed in this study consists of the following steps.
Cotton growth parameters, yield, and fiber quality traits were selected as evaluation indicators. A comprehensive evaluation was conducted using four individual methods: Principal Component Analysis (PCA), Technique for Order Preference by Similarity to Ideal Solution (TOPSIS), GRDA, and MFA (detailed methodologies are provided in the Supplementary Materials). Indicators such as plant height, stem diameter, leaf area index, number of flower buds, WUE, dry matter accumulation, yield, upper half mean length, length uniformity, breaking strength, and spinning consistency index were considered as “the larger, the better” indicators. In contrast, for indicators such as breaking elongation (when exceeding 7%), micronaire value (when exceeding 4.2), short fiber index, and maturity index, lower values indicate better quality [33]. For these negatively oriented indicators, normalization was performed using a reverse transformation method by subtracting the actual value from the maximum value [34], thereby converting them into positively oriented indicators.
To assess the consistency of the four evaluation methods in ranking the ten treatments, Kendall’s coefficient of concordance (W) was employed. This test served as a preliminary analysis to determine whether a unified evaluation result could be used for further comprehensive assessment.
Upon meeting the consistency criteria, integrated ranking was performed using four composite evaluation methods: the Borda count method, the Copeland method, the FBorda, and the ODCA.
The Borda method is a minority obeying the majority approach. If more evaluations consider X i better than X j as the opposite, denote it as X i S X j , defining the Borda matrix:
B = b i j m × n ,   b i j = 1 X i S X j 0 o t h e r
This forms the Borda matrix. The score of each scheme is then recalculated based on the number of times it is rated as “excellent” across the individual methods. Finally, the schemes are ranked in descending order according to their scores. In the case of tied scores, the scheme with the lower variance is prioritized.
Compared with the Borda method, the Copeland method is considered more robust, as it accounts for both “advantageous” and “disadvantageous” pairwise comparisons. The Copeland score is calculated as Equation (6):
c i j = 1 X i S X j 0 o t h e r 1 X j S X j
The final Copeland score of each scheme Xi was then determined by summing across all pairwise comparisons. The schemes were ranked in descending order based on their scores. In case of a tie, the scheme with the smaller variance was considered superior.
The FBorda method integrates both the rank order and the score difference within each evaluation method. The specific steps are as follows. First, compute the membership degree for each evaluation method:
μ i j = X i j min X i j max X i j min X i j × 0 . 9 + 0 . 1
where X i j is the score of X i under method k, and to which scheme i belongs to the “excellent” category under method k. Next, we compute the fuzzy timing:
W h i = f h i R i
f h i = k = 1 M δ i h μ i k
where δ i h = 1 X i   r a n k s   h t h   a m o n g   t h e   h   e v a l u a t i o n   t a r g e t s 0 O t h e r w i s e , R i = h f h i and W h i reflect the factors of score differences. Then, we converted the ranking of evaluation objects into scores to widen the gap and define Q h :
Q h = 0 . 5 × n h n h + 1
where Q h represents X i , scored in the hth position in the priority order. Finally, we calculated the FBorda number using Equation (11):
F B i = h W h i Q h i
Schemes are ranked according to of F B i , with larger values indicating better comprehensive cotton performance.
A comprehensive evaluation was also performed using the ODCA. The evaluation values from the four individual methods formed the following matrix:
A = y i j n × m = y 11 y m1 y n1 y nm
To eliminate the impact of the magnitude of evaluation values, standardization was calculated using Equation (13):
y i j * = y i j y ¯ j S j ,   i = 1 , 2 , , n ,   j = 1 , 2 , , m
where y i j * is the normalized value, y ¯ j and S j are the mean and standard deviation of evaluation method j, respectively. The normalized matrix Y is then used to construct a real symmetric matrix H = Y T Y , from which the largest eigenvalue and its corresponding normalized eigenvector are obtained. The component values of this eigenvector represent the weight coefficients for each method:
y i = λ i y i 1 + λ i y i 2 + + λ i y i m ,   i = 1 , 2 , , n
The process was ranked based on the value of y i , with higher values indicating better overall cotton performance.
Using the Spearman rank correlation test, a post hoc test was conducted on four evaluation combinations to determine the validity and rationality of the combined evaluation model, thus constructing the statistic t as follows:
t k = d k n 2 1 d k 2 , k = 1 , 2 , , m
where dk represents the average Spearman rank coefficient between the integrated method and each individual method. A larger T-value indicates a stronger alignment of the integrated model with the individual methods, validating the composite evaluation approach.

2.5. Statistical Analysis

SPSS 26.0 was used for dimensionality reduction via PCA on 14 evaluation indicators (8 fiber quality, 5 growth parameters, 1 yield). Raw data was standardized through “Descriptive Statistics” to remove dimensional differences, and PCA was performed with “Varimax” rotation. Spearman correlation analysis was conducted to assess the consistency between single and composite models.
MATLAB 2020a was used to calculate weights and comprehensive scores for three single evaluation methods (TOPSIS, GRDA, MFA) and four composite models (Borda, Copeland, FBorda, ODCA). Custom scripts were developed for each method, ensuring reproducibility.
Excel was used for data entry, verification, and basic statistics, while Mathematica 11.0 handled complex formulas and data format conversion. Origin 2024 was utilized for generating core result graphs, including the “seed cotton yield bar chart” with error bars and significance annotations.

3. Results

3.1. Seed Cotton Yield and Fiber Quality Responses to Leaching Amount and Timing Interactions

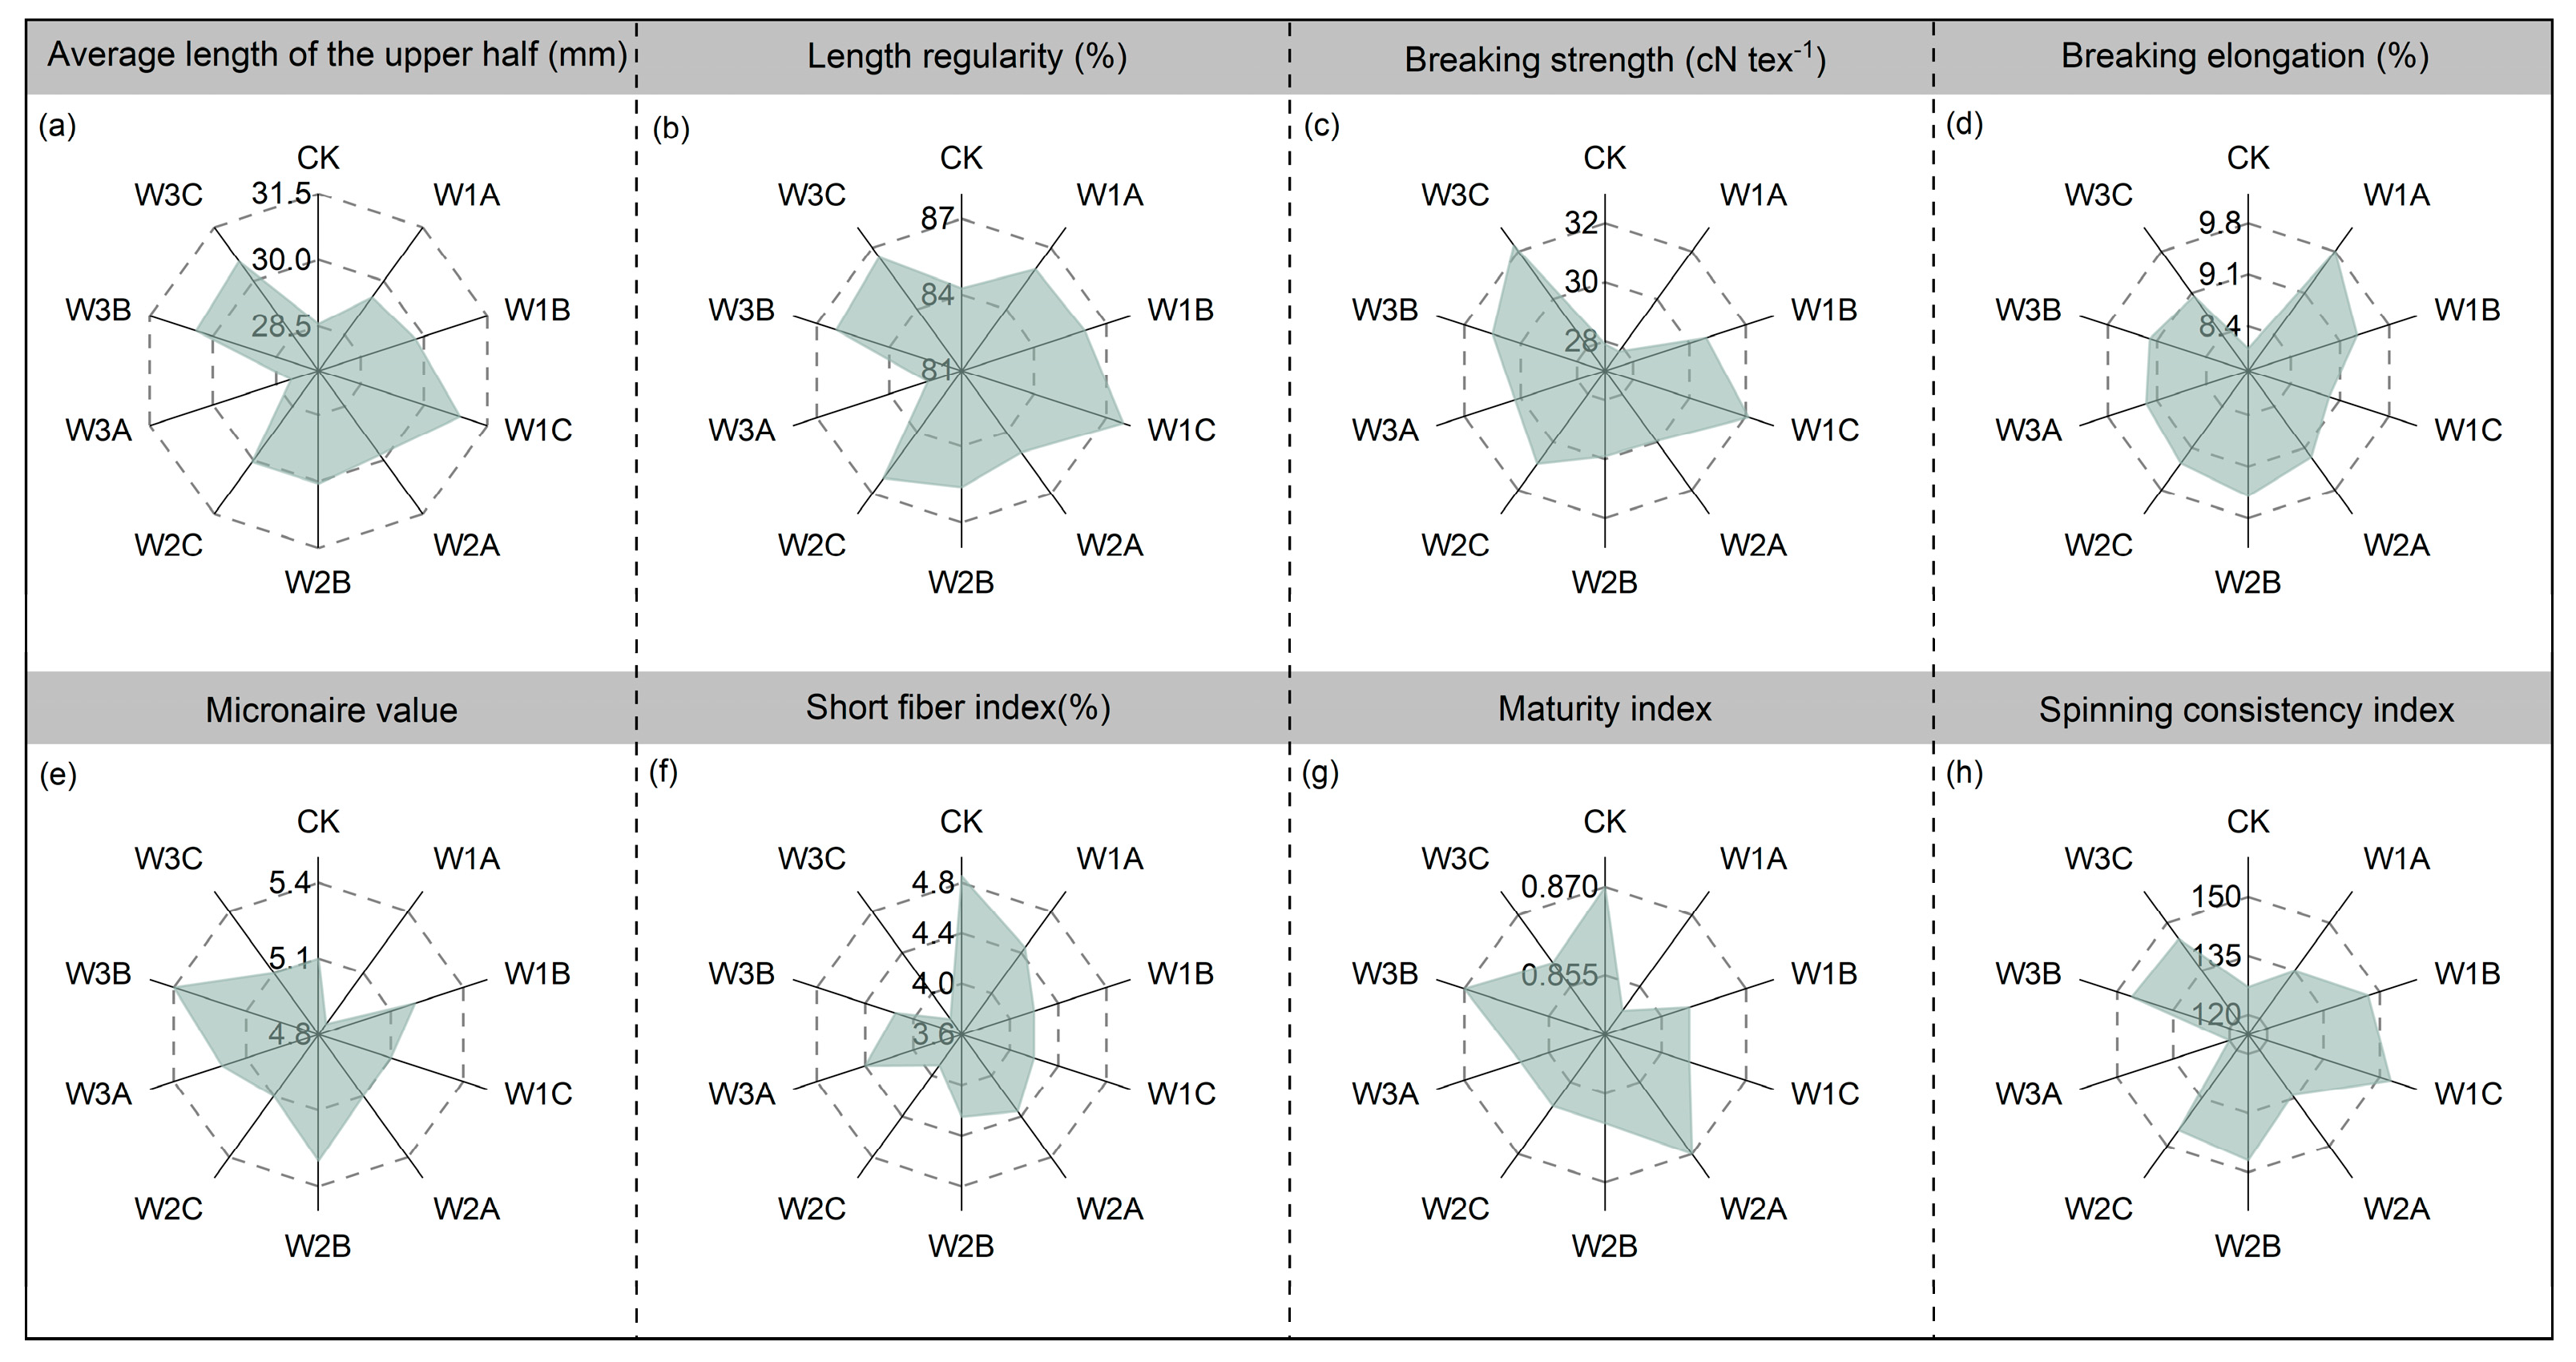
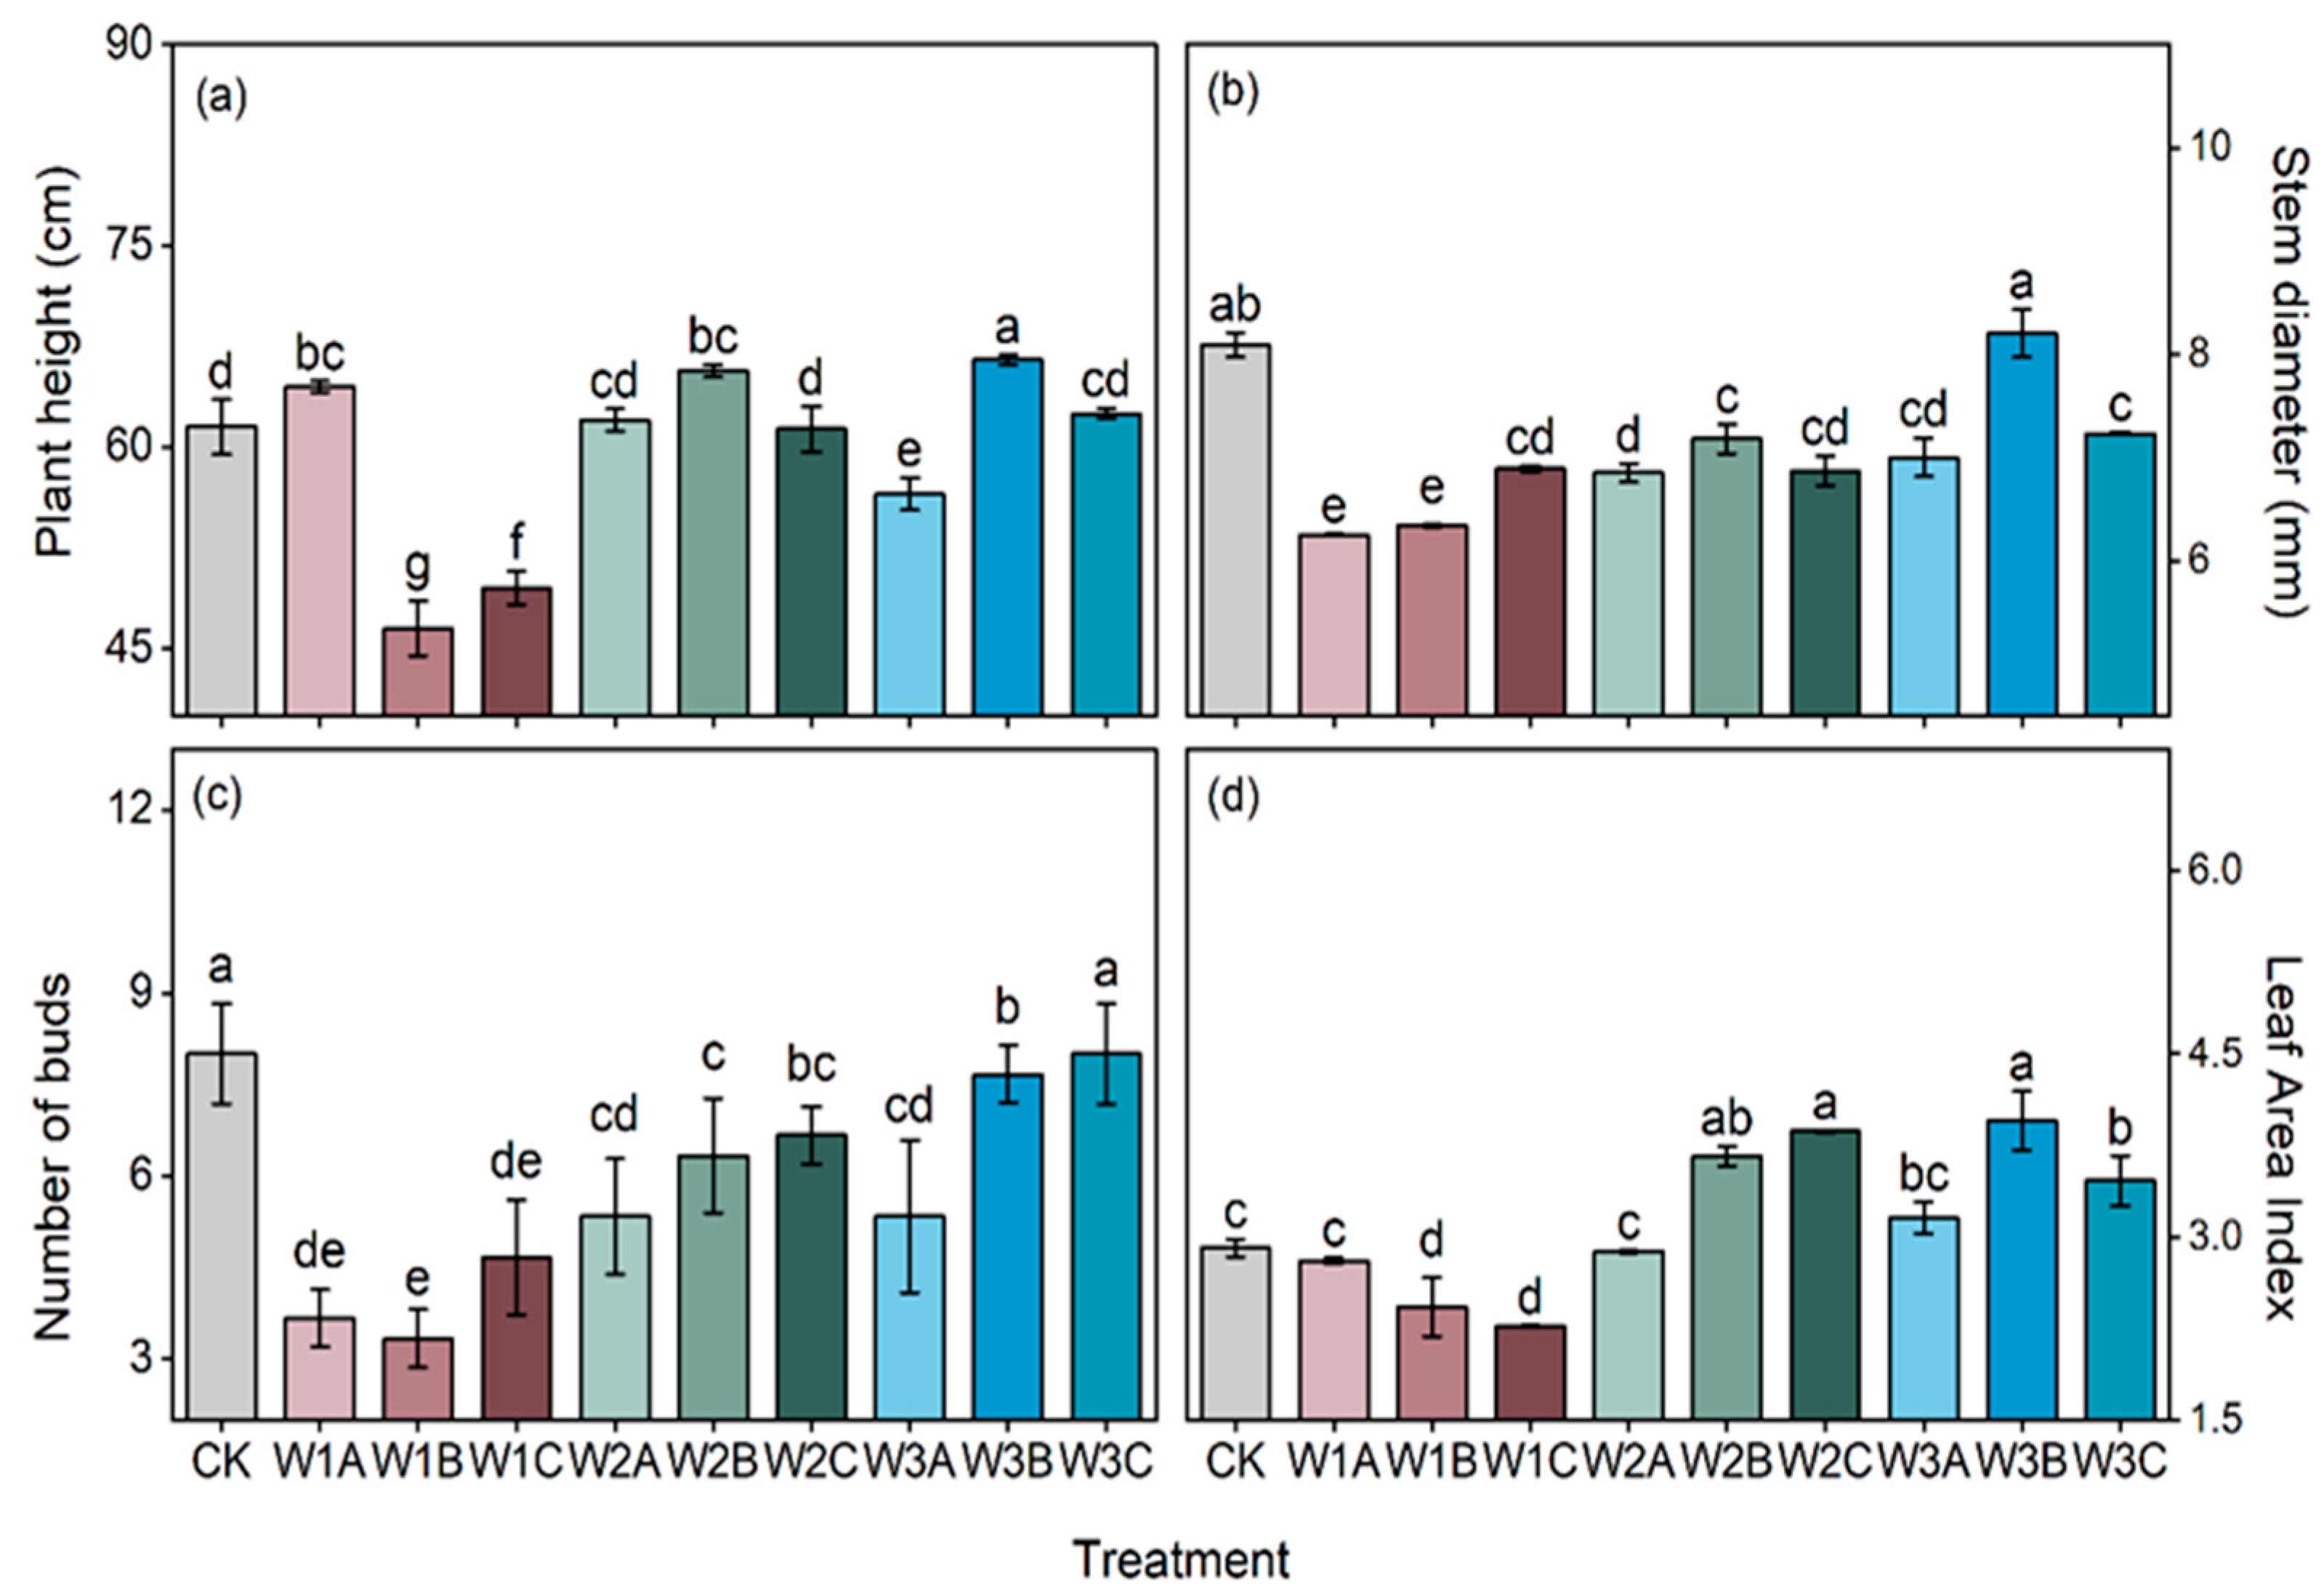
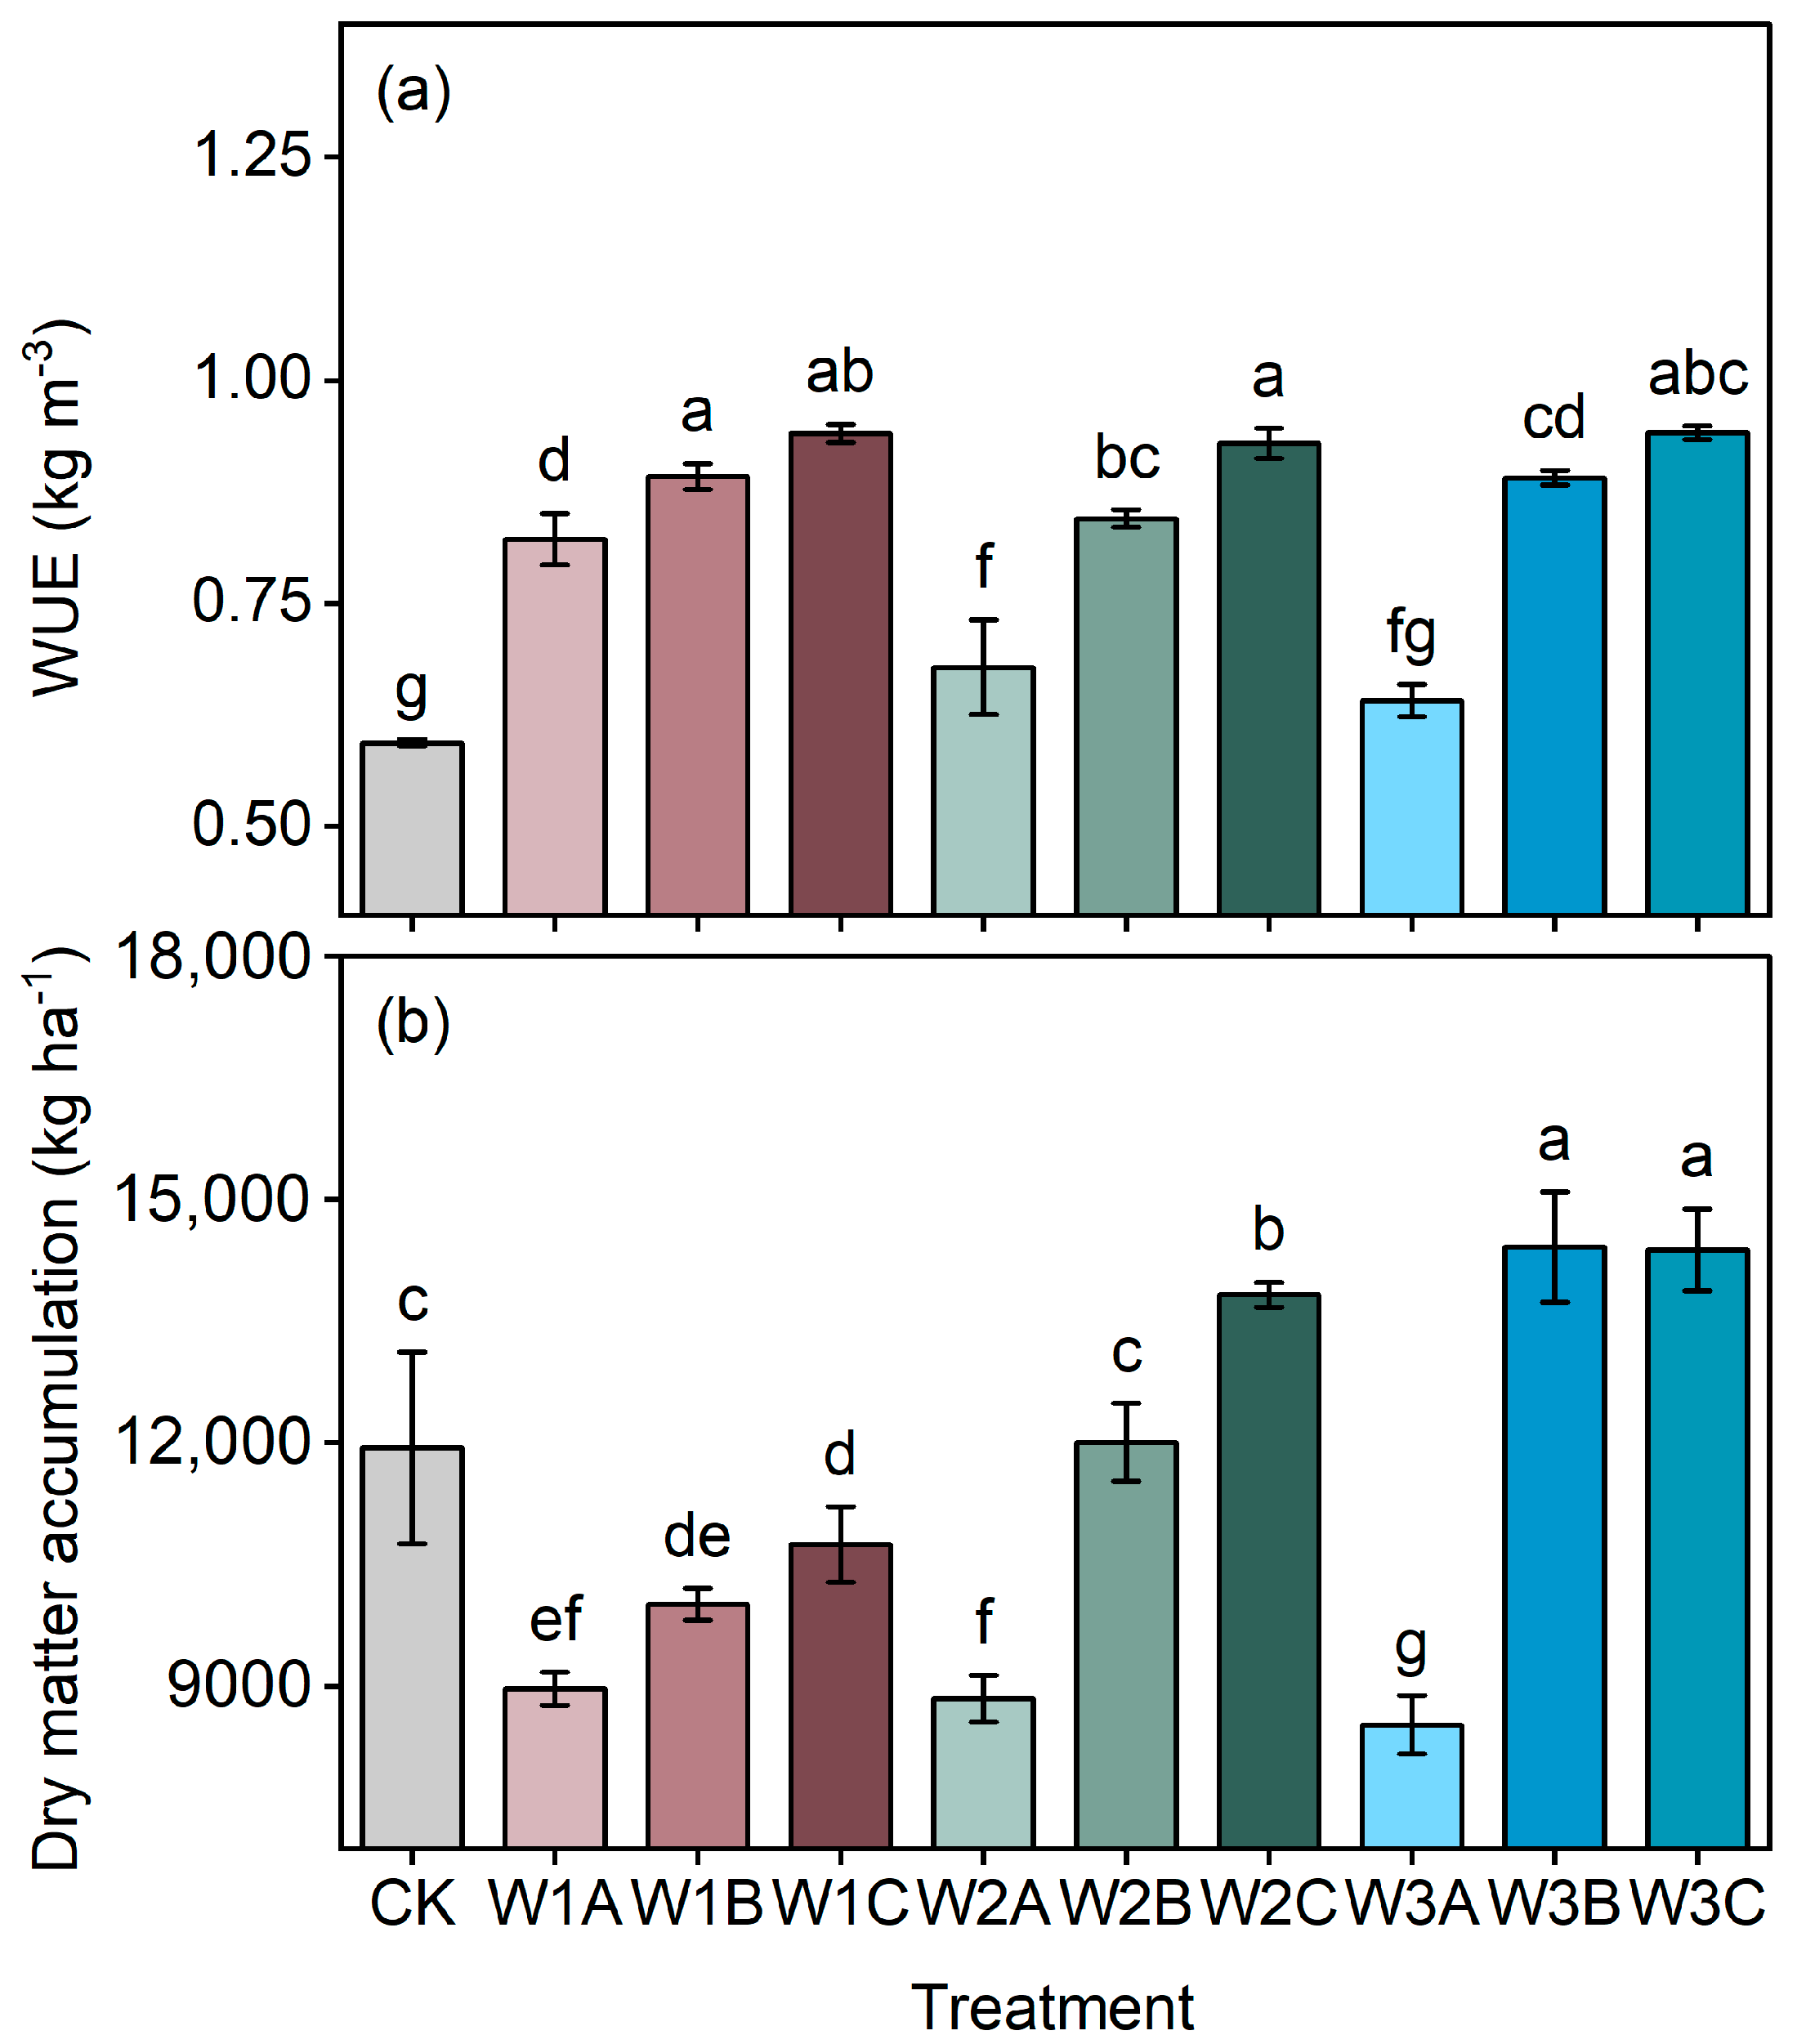
Across all leaching timing treatments, the seed cotton yield of the W3 treatment was 18.2–23.5% higher than that of the W1 treatment. For the same leaching amount, the yield increased with an increasing number of leaching events: within the W3 treatment, the W3C (3-stage leaching) achieved the highest yield, which was significantly 12.7% higher than that of W3A (1-stage leaching) and 8.5% higher than that of W3B (2-stage leaching) (Figure 1). Under single-stage high-dose leaching at the seedling stage (W3A), both the average length of the upper half and the length regularity reached their maximum values. This is because sufficient leaching at the seedling stage provides favorable conditions for fiber elongation during the boll development period. Breaking strength increased significantly with an increasing number of leaching events, showing the trend of W3C > W3B > W3A. Longer leaching intervals ensured stable soil moisture during the fiber thickening stage, promoting cellulose accumulation. For micronaire value and maturity index, both indicators exhibited a “first increase then decrease” trend with increasing leaching amount, peaking at the W2 treatment. The W2C treatment had a micronaire value of 4.2 (within the high-quality cotton range of 3.7–4.5) and a maturity index of 0.89. In contrast, the W3C treatment had a micronaire value of 4.7 (exceeding the optimal range) due to nitrogen leaching loss caused by an excessive leaching amount (Figure 2). Improving the leaching intervals and increasing the leaching amount significantly enhanced the biomass indicators (plant height, stem diameter, number of buds) and WUE. The plant height of the W3C treatment was 21.3% higher than that of the W1A treatment, and the number of fruit branches per plant was 32.1% higher than that of the W1A treatment (Figure 3). The WUE of the W3C treatment was 28.7% higher than that of the W1A treatment, and the dry matter accumulation was 25.5% higher than that of the W1A treatment. These differences originated from the synergistic improvement of the soil water–salt conditions under the W3C treatment, which further enhanced the photosynthetic efficiency (Figure 4). Leaching timing (LT) significantly affected multiple fiber quality traits, including breaking elongation, length regularity, breaking strength, micronaire value, short fiber index, and spinning consistency index (Table S1). In contrast, the leaching amount (LA) only influenced breaking elongation and length regularity. Significant LA × LT interactions were also detected for breaking elongation, length regularity, and breaking strength, whereas other traits showed no significant response. Both LA and LT exerted highly significant effects on the cotton yield (p < 0.001), and their interaction (LA × LT) was also significant (Table S2).

3.2. Evaluation of Comprehensive Cotton Indices Based on a Single Method and Pre-Testing of the Single Evaluation Method

Using four individual evaluation methods (PCA, TOPSIS, GRDA, and MFA) for comprehensive evaluation, the standard deviation of rankings across the four methods ranged from 0 to 2.63 (Table 2). Treatments CK, W1A, and W3B exhibited rankings greater than 1, reflecting discrepancies among the methods. Therefore, Kendall’s correlation analysis was conducted among the individual evaluation results (Table 3). The correlation coefficients between each method and the other three ranged from 0.84 to 0.93, indicating strong overall correlation, though GRDA showed relatively weaker correlations compared to MFA, TOPSIS, and PCA.
Further, Kendall’s W concordance coefficient test yielded W = 0.971 and χ2 = 34.96, exceeding the critical value (16.919), suggesting compatibility among the four methods and supporting their combination into a unified evaluation model.

3.3. Construction and Validation of a Comprehensive Cotton Index Evaluation Model

A composite evaluation model was constructed using the Borda, Copeland, FBorda, and ODCA methods. The standard deviations for treatment rankings across these methods were as shown in Table 3, signifying strong consistency among the models. Spearman correlation analysis revealed correlation coefficients above 0.98 between the composite model rankings and those from individual models (Table 4). However, tie situations were encountered with treatments W2C and W3C using Borda and Copeland methods. Applying Equation (15) to calculate statistic t yielded a t-value of 13.92 for all four composite methods, surpassing the critical value of 2.90, confirming the rationality and reliability of the composite evaluation.

3.4. Constructing a Comprehensive Index Evaluation Model for Cotton and Post-Validation

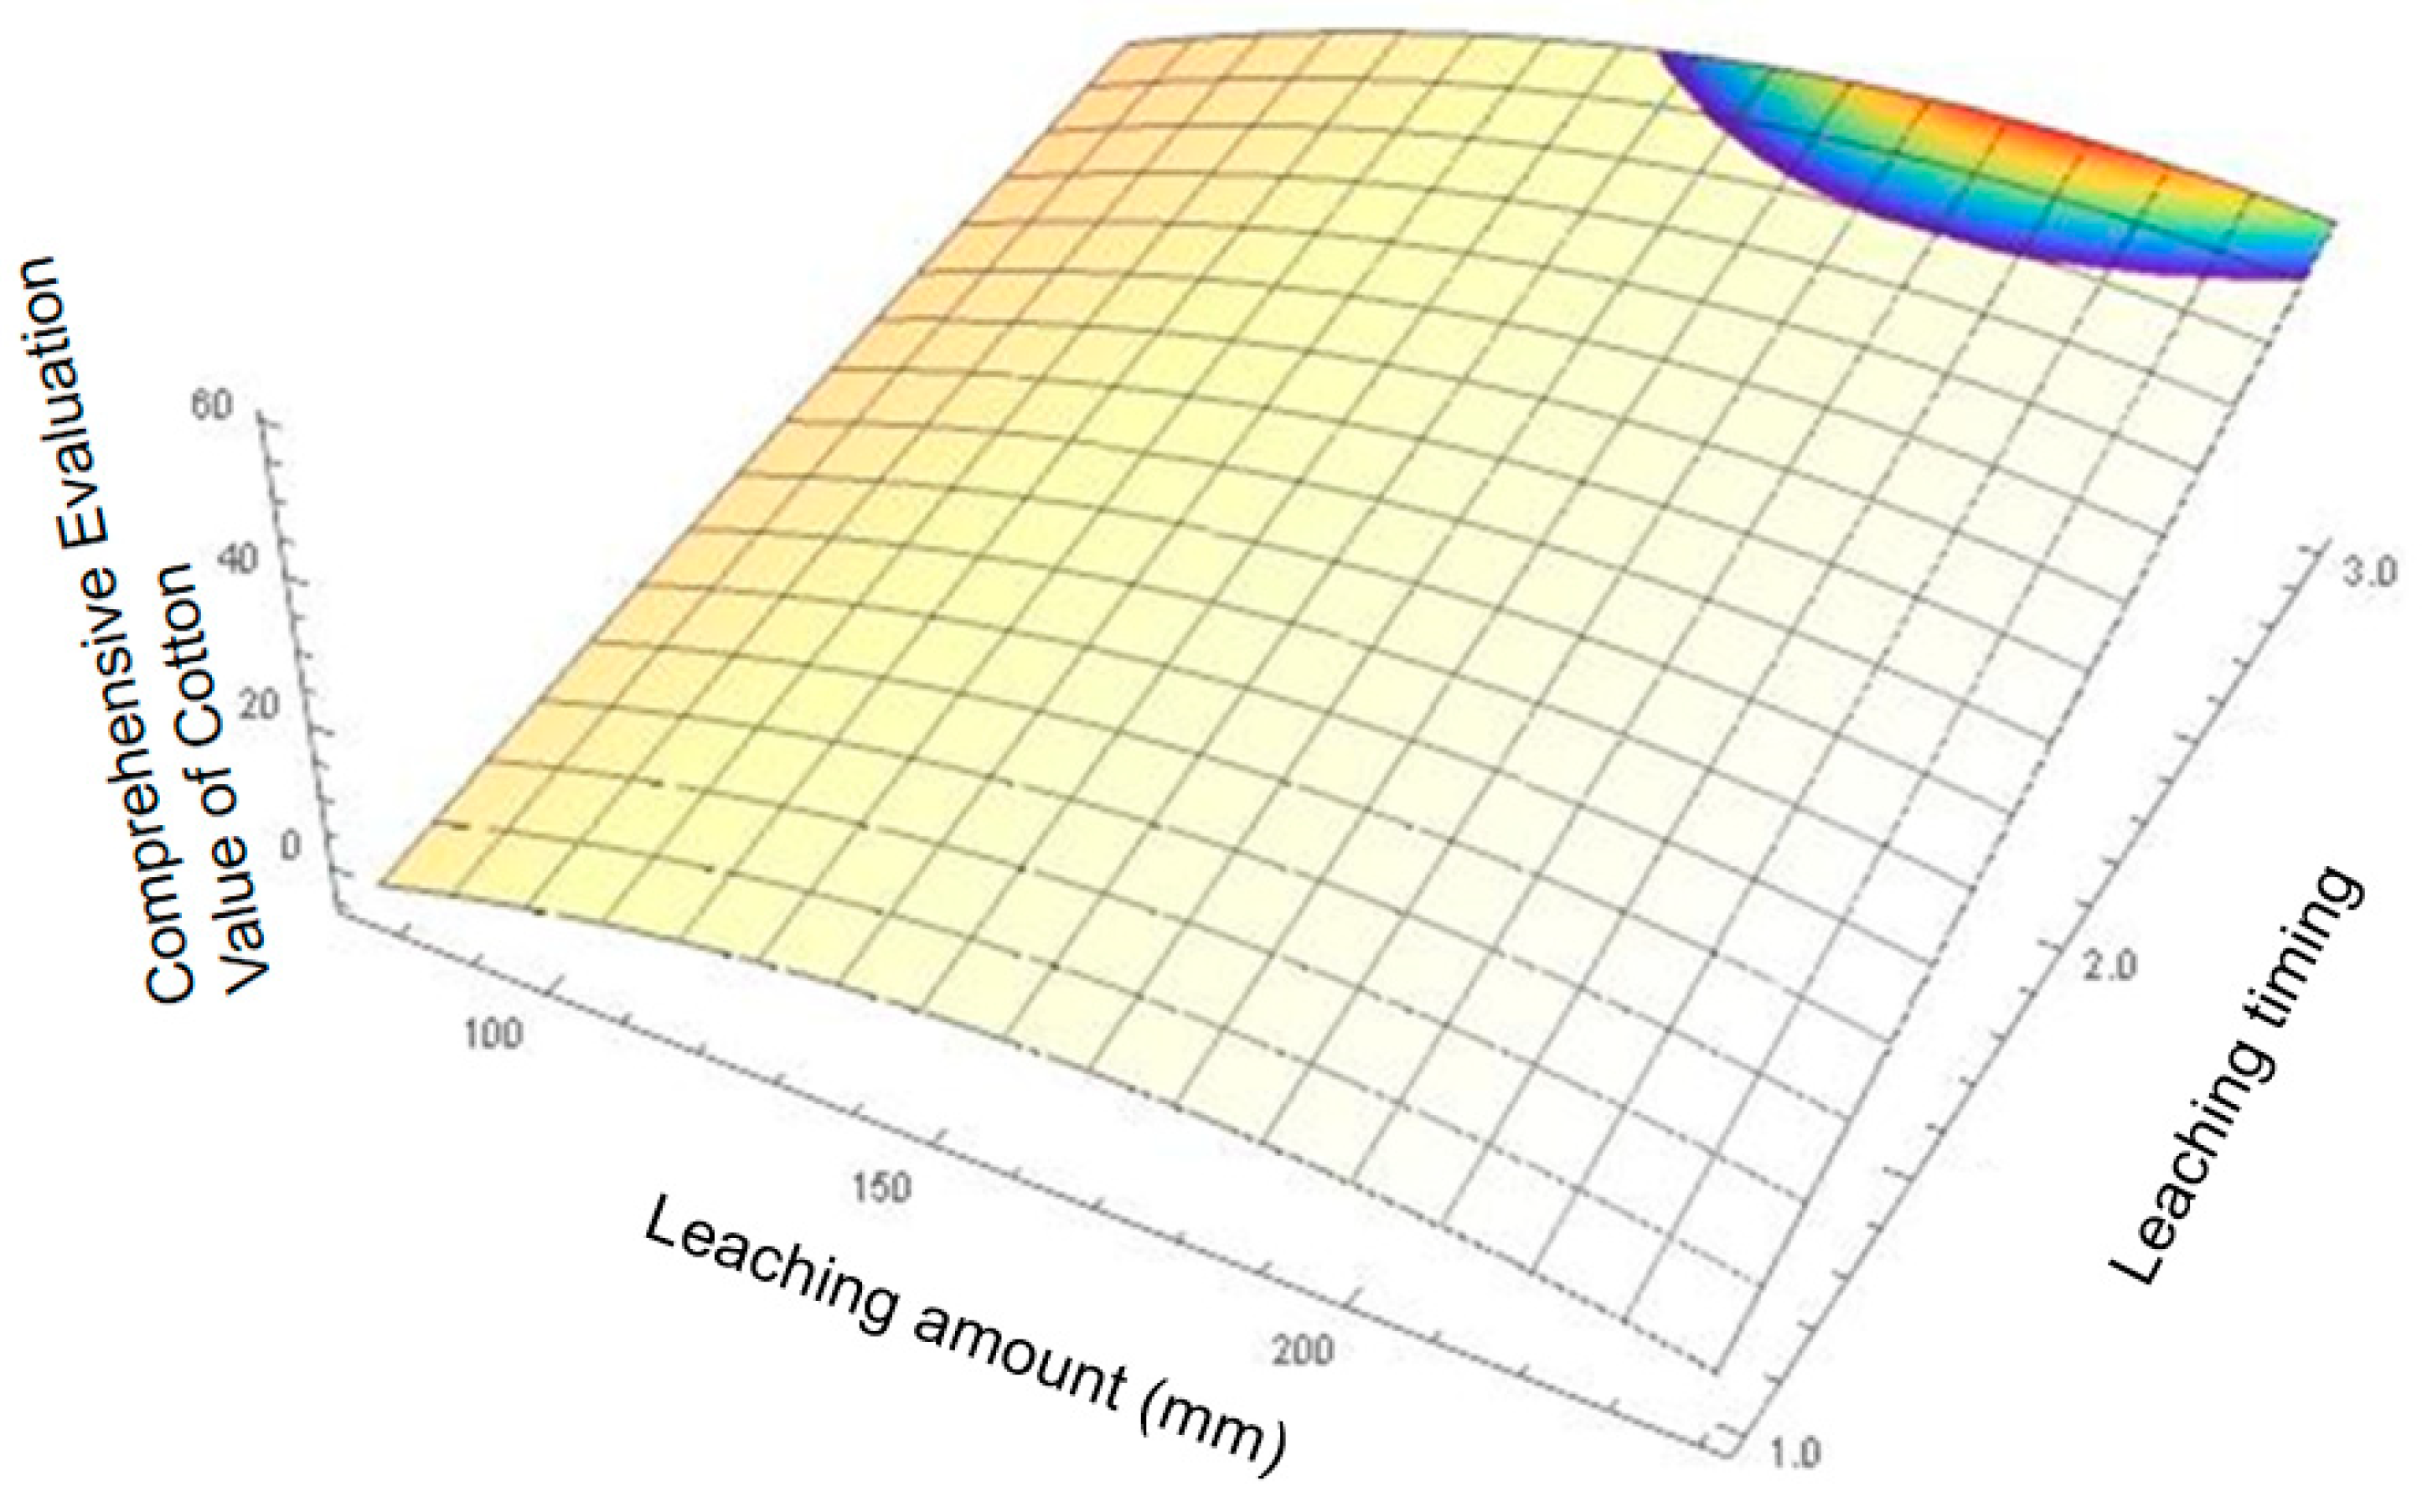
Considering the strong performance of all four composite models, the FBorda model was chosen due to its ability to incorporate both evaluation scores and rankings, thus ensuring higher reliability. A quadratic polynomial regression based on the FBorda model values was performed to assess the combined effects of leaching amount and timing on cotton growth, yield, and quality (Equation (16)):
Z = 42.53 + 0.45 x 0.0015 x 2 + 10.17 y + 0.057 x y 1.01 y 2
where x represents the leaching amount (mm), and y represents the leaching timing.
The response surface analysis indicated that the comprehensive evaluation value initially increased and subsequently decreased with rising leaching amounts (Figure 5). Likewise, the evaluation value improved with increasing leaching timing. An optimal solution existed within a leaching range of 155–240 mm, achieving 90% of the maximum cotton growth–yield–quality indicator. Specifically, the optimal comprehensive indicator (evaluation value = 42.15) occurred at a leaching amount of 204 mm and a timing of three times during the growth season.

4. Discussion

The formation of cotton fiber quality is subject to integrated regulation by multiple factors, and domestic and international scholars have conducted systematic studies from various perspectives. However, most of these studies have focused on individual indicators and have failed to provide a comprehensive evaluation of fiber quality. In reality, fiber quality is the result of the synergistic effects of eight indicators: length, strength, uniformity, fineness, elongation, short fiber index, maturity, and spinning parameters. These indicators are interrelated and mutually constrained. Therefore, this study innovatively adopted a vector normalization method for indicator standardization and overcame the limitations of traditional methods through multi-model coupling evaluation. Although different evaluation methods showed ranking differences, they were significantly correlated. Among the treatments, the W2C and W3C treatment showed the best comprehensive performance, whereas the W3A treatment yielded the poorest results. Irrigation timing and amount were found to significantly impact cotton fiber quality. The study revealed that cotton requires differing water supply levels at various growth stages, and rational irrigation control can significantly improve fiber quality indicators. It should be emphasized that irrigation timing and amount significantly influenced fiber quality under the studied conditions. Yet, their effects cannot be generalized across all contexts due to the potential variability among cultivars and edaphoclimatic conditions.
Drip irrigation has a significant impact on cotton fiber quality. Water deficit generally reduces fiber length, strength, and micronaire value [35]. Reports indicate that under adequate water supply, the micronaire value is markedly lower than under severe water stress [36]. Drought stress disrupts fiber development by reducing leaf water potential, cell turgor, and carbohydrate metabolism, thereby decreasing fiber length, uniformity, and strength in developing upland cotton fibers, ultimately reducing fiber quality [37]. Conversely, excessive irrigation suppresses fiber elongation by reducing the rate of fiber extension, which also adversely affects fiber quality [38]. The study further found that adopting a “small-amount, high-timing” irrigation model (40–60 mm per irrigation, at 7–10 day intervals) is more conducive to maintaining stable soil moisture conditions than traditional flood irrigation. This approach improved the fiber length by 3.5–8.2% and the strength by 5.1–9.7% [39,40]. Additionally, controlling the total irrigation amount within the range of 450–550 mm and focusing on water supply during the flowering stage (accounting for 40–50% of total irrigation amount) yielded optimal comprehensive fiber quality performance. This precision irrigation regime, based on water demand characteristics during cotton growth stages, not only prevents water stress but also avoids the deterioration of fiber quality caused by over-irrigation.
With the improvement of people’s living standards, the enhancement of overall quality has become the main goal pursued in modern water-saving agriculture. Evaluation and analysis methods are being increasingly applied to assess the quality, yield, and morphological assessment of crops such as tomatoes, cucumbers, potatoes, and cotton [41,42,43]. This study constructs a comprehensive growth–yield–quality evaluation model for cotton through four single evaluation methods, providing scientific evidence to improve crop yield, enhance quality, and promote cotton growth, thereby elevating the level of agricultural production management [44]. The results of this study indicate that among the comprehensive evaluations of nine indicators using PCA, IPM, GRDA, and MFA, there was one treatment with significant differences, exhibiting a standard deviation above 1.0. This could be due to the differing analytical perspectives and focuses of each method. Moreover, of the four methods, GRDA showed the weakest correlation with the other methods, while the MFA demonstrated the strongest correlation and was the easiest to calculate, making it the recommended method. Furthermore, as a dimensionality reduction approach, PCA also showed limitations and is not recommended. The correlation and the practicality of combining independent models need further investigation and study [45]. The discussion on the correlation and applicability of the aforementioned methods all serves the core objective of this study—optimizing the irrigation leaching regime. By identifying suitable evaluation tools, this discussion verifies the robustness of the comprehensive evaluation results and ensures that the finally recommended leaching treatments can truly reflect the optimal production requirements of cotton fields.
Based on the results of four individual evaluation calculations, the Kendall correlation coefficient between the models was high, passing the preliminary test. Consequently, the Borda Evaluation Method, Copeland Evaluation Method, FBorda, and Combination Evaluation Method based on ODCA were employed to combine and comprehensively evaluate the four individual evaluation models. The results indicate that the correlation between the four combination methods and the individual evaluation methods was relatively high. Both the Copeland and the Borda method only considered ranking values, leading to insufficient utilization of the original evaluation data and limited information acquisition. These methods could not determine the optimal solution between W2C and W3C treatments, which is consistent with previous studies [44]. The FBorda method and ODCA method did not achieve better results than the Borda method, possibly due to the fewer treatments and lower information complexity in this study. However, the FBorda method not only considered ranking values but also included evaluation values, making it more reliable. Therefore, this study adopted the FBorda combination evaluation model to transform the growth, yield, and quality indices of cotton into comprehensive indices that reflect the overall characteristics of cotton. This approach resolves the inconsistencies in the conclusions from various evaluation methods. The evaluation results can support decision-making for cotton irrigation and leaching strategies. According to the FBorda model, the W2C treatment had the highest evaluation value, making it the optimal treatment in this study.
A further analysis of the response of the comprehensive evaluation value of cotton to irrigation leaching modes and the establishment of a regression model revealed that when the timing of irrigation leaching is low, the evaluation value decreases as the water amount increases. Conversely, when the irrigation timing is high, the evaluation value first increases and then decreases as the water amount rises. When the irrigation leaching water amount is constant, the evaluation value increases with the timing of the irrigation leaching. Irrigation timing has a greater impact on the comprehensive evaluation value of cotton, followed by the effect of water amount, which aligns with the response of single models to irrigation leaching models. Existing research has shown that soil drought adversely affects cotton growth and fiber formation [46,47,48], while moderate salt levels in soils with low salinity (<2 g kg−1) can provide nutrients to cotton, promote growth, increase yield, and improve fiber quality. However, when soil salinity exceeds 3 g kg−1, excessive salt inhibits cotton growth and boll development, leading to reduced biomass, yield, and quality [49]. This study dynamically regulated soil water and salinity during the growth period through different irrigation leaching modes, optimizing soil water–salt conditions in the main root zone, thereby influencing cotton growth and development. Regarding the impact on the comprehensive evaluation value of cotton, there is a synergistic effect between the irrigation leaching water amount and the timing. Increasing the timing of the irrigation leaching enhances the improvement effects of the irrigation leaching water amount on various cotton indicators. Therefore, achieving higher comprehensive benefits requires increasing the timing of the irrigation leaching, while ensuring that the irrigation leaching-water amount is not too low. To optimize the outcomes of irrigation leaching modes, further analysis of the relationship between the comprehensive evaluation index of cotton and the irrigation leaching amount and timing indicated that when the irrigation leaching amount was 204 mm and conducted in three sessions, the evaluation value was maximized. This regime may serve as a potentially suitable irrigation leaching system for the studied region. However, these findings should not be generalized without caution, as they were derived from a single-year trial under specific local conditions. Long-term, multi-year experiments across different environments and cultivars are required to validate the robustness and broader applicability of these results.

5. Conclusions

This study evaluated the effects of irrigation leaching patterns on cotton growth, yield, and fiber quality using four individual evaluation methods and integrated approaches. Although discrepancies were observed among the four individual models, their correlations were strong (0.84–0.93), and integrated methods such as FBorda further improved consistency and reliability. Post hoc comparisons showed that the FBorda method outperformed other composite models, providing a more robust framework for synthesizing multidimensional crop performance indicators. A synergistic interaction between the irrigation leaching amount and the timing was identified, with moderate irrigation amounts (155–240 mm) and three leaching events per season producing the most favorable outcomes for cotton yield and fiber quality. The maximum comprehensive score was achieved at 204 mm. Based on these findings, a leaching irrigation regime involving three irrigation events per growing season, with amounts maintained within 155–240 mm, may be recommended as a potentially suitable strategy for mitigating soil salinity and enhancing cotton performance under the conditions of southern Xinjiang. However, the conclusions should be interpreted cautiously, as the study was conducted at a single site and within a single growing season. The broader applicability of the proposed regime and the FBorda evaluation model requires validation across multiple years, regions, soil types, and cultivars. Future research should also test the potential of the FBorda framework in other crops and cropping systems, to assess its value as a general decision-support tool for irrigation and leaching management.

Supplementary Materials

The following supporting information can be downloaded at: https://www.mdpi.com/article/10.3390/agronomy15092113/s1, Table S1: Two-way ANOVA evaluating the effects of experimental factors and their interaction on cotton fiber quality parameters; Table S2: Analysis of variance showing the main and interaction effects of leaching amount and leaching timing on yield, morphological, and physiological parameters of cotton.

Author Contributions

Conceptualization, H.H., X.X. and C.X.; Methodology, X.L. and C.X.; Software, X.L. and W.N.; Formal analysis, Y.H. and S.C.; Investigation, Y.J., X.L., W.N. and Y.H.; Data curation, H.H. and Y.H.; Writing—original draft, H.H.; Writing—Review and Editing, X.X. and C.X.; Visualization, H.H. and Y.J.; Supervision, Y.Y., S.C. and X.X.; Project administration, C.X.; Funding acquisition, Y.Y. and S.C. All authors have read and agreed to the published version of the manuscript.

Funding

This work was jointly supported by the Natural Science Foundation of Inner Mongolia Autonomous Region of China (2020MS04001) and the National Natural Science Foundation of China (32460381).

Data Availability Statement

The original contributions presented in the study are included in the article/Supplementary Material, further inquiries can be directed to the corresponding authors.

Conflicts of Interest

The authors declare no competing financial interests or conflicts of interest.

References

  1. Lei, S.; Jia, X.; Zhao, C.; Shao, M. A review of saline-alkali soil improvements in China: Efforts and their impacts on soil properties. Agric. Water Manag. 2025, 317, 109617. [Google Scholar] [CrossRef]
  2. Song, Y.; Sun, J.; Li, Z. Intercropping increases land use efficiency and reduces soil salinity in salt-affected soils, but has minimal effect on pH. Field Crops Res. 2025, 332, 110028. [Google Scholar] [CrossRef]
  3. Zhao, X.; Grossart, H.-P. Enhancing crop yield and microbial diversity in saline-affected paddy soil through biochar amendment under aquaculture wastewater irrigation. Eur. J. Soil Biol. 2024, 123, 103681. [Google Scholar] [CrossRef]
  4. Egamberdieva, D.; Wirth, S.; Bellingrath-Kimura, S.D.; Mishra, J.; Arora, N.K. Salt-tolerant plant growth promoting rhizobacteria for enhancing crop productivity of saline soils. Front. Microbiol. 2019, 10, 2791. [Google Scholar] [CrossRef] [PubMed]
  5. Yuan, R.; Wang, K.; Ren, D.; Chen, Z.; Guo, B.; Zhang, H.; Li, D.; Zhao, C.; Han, S.; Li, H. An Analysis of Uncertainties in Evaluating Future Climate Change Impacts on Cotton Production and Water Use in China. Agronomy 2025, 15, 1209. [Google Scholar] [CrossRef]
  6. Li, W.; Wang, Z.; Zhang, J.; Zong, R. Soil salinity variations and cotton growth under long-term mulched drip irrigation in saline-alkali land of arid oasis. Irrig. Sci. 2022, 40, 103–113. [Google Scholar] [CrossRef]
  7. Ning, S.; Zhou, B.; Shi, J.; Wang, Q. Soil water/salt balance and water productivity of typical irrigation schedules for cotton under film mulched drip irrigation in northern Xinjiang. Agric. Water Manag. 2021, 245, 106651. [Google Scholar] [CrossRef]
  8. Chen, W.; Jin, M.; Ferré, T.P.A.; Liu, Y.; Xian, Y.; Shan, T.; Ping, X. Spatial distribution of soil moisture, soil salinity, and root density beneath a cotton field under mulched drip irrigation with brackish and fresh water. Field Crops Res. 2018, 215, 207–221. [Google Scholar] [CrossRef]
  9. Wang, H.; Cao, H.; Jiang, F.; Wang, X.; Gao, Y. Analysis of soil moisture, temperature, and salinity in cotton field under non-mulched drip irrigation in South Xinjiang. Agriculture 2022, 12, 1589. [Google Scholar] [CrossRef]
  10. Li, L.; Liu, H.; He, X.; Lin, E.; Yang, G. Winter irrigation effects on soil moisture, temperature and salinity, and on cotton growth in salinized fields in northern Xinjiang, China. Sustainability 2020, 12, 7573. [Google Scholar] [CrossRef]
  11. Feng, D.; Cui, Y.; Tang, G.; Cao, G.; Chen, J.; Ding, Y.; Wang, J.; Ge, C.; Xu, W. Effects of salt water irrigation at the ripening stage on yield and quality of grown-in-substrate mini-watermelon (Citrullus lanatus) within an arched shed. Agric. Water Manag. 2025, 317, 109631. [Google Scholar] [CrossRef]
  12. Li, W.; Zhang, C.; Zou, M.; Lai, H.; Javed, T.; Wang, Z. Optimizing irrigation salinity for cotton production through cotton yield and fiber quality and water use efficiency in arid regions. Ind. Crops Prod. 2025, 233, 121375. [Google Scholar] [CrossRef]
  13. Lou, B.; Hu, Y.; Li, T.; Liu, Q.; Wang, J.; Dong, X.; Tian, L.; Zhang, X.; Bian, W.; Liu, T.; et al. Assessment of saline water irrigation on biomass and quality of alfalfa: A sustainable agriculture perspective. Agric. Water Manag. 2025, 314, 109504. [Google Scholar] [CrossRef]
  14. Karimzadeh, S.; Hartman, S.; Chiarelli, D.D.; Rulli, M.C.; D’Odorico, P. The tradeoff between water savings and salinization prevention in dryland irrigation. Adv. Water Resour. 2024, 183, 104604. [Google Scholar] [CrossRef]
  15. Hu, Q.; Cao, H.; He, Z.; Shi, H.; Ren, Z.; Qi, C. Effects of leaching amounts and drip irrigation types on water-salt distribution and seed cotton yield in northern Xinjiang, China. Field Crops Res. 2025, 328, 109947. [Google Scholar] [CrossRef]
  16. He, Z.; Cao, H.; Hu, Q.; Qi, C.; Li, Z. Salt leaching with alternate surface and subsurface drip irrigation enhance cotton yield, water use efficiency, desalination rate, desalination efficiency and economic benefit. Field Crops Res. 2025, 325, 109804. [Google Scholar] [CrossRef]
  17. Du, Z.; Hu, Y.; Buttar, N.A. Analysis of mechanical properties for tea stem using grey relational analysis coupled with multiple linear regression. Sci. Hortic. 2020, 260, 108886. [Google Scholar] [CrossRef]
  18. Fang, Y.; Zheng, X.; Peng, H.; Wang, H.; Xin, J. A new method of the relative membership degree calculation in variable fuzzy sets for water quality assessment. Ecol. Indic. 2019, 98, 515–522. [Google Scholar] [CrossRef]
  19. Ramamurthy, V.; Reddy, G.P.O.; Kumar, N. Assessment of land suitability for maize (Zea mays L) in semi-arid ecosystem of southern India using integrated AHP and GIS approach. Comput. Electron. Agric. 2020, 179, 105806. [Google Scholar] [CrossRef]
  20. Wang, Y.; Wen, Z.; Li, H. Symbiotic technology assessment in iron and steel industry based on entropy TOPSIS method. J. Clean. Prod. 2020, 260, 120900. [Google Scholar] [CrossRef]
  21. He, Z.; Li, M.; Cai, Z.; Zhao, R.; Hong, T.; Yang, Z.; Zhang, Z. Optimal irrigation and fertilizer amounts based on multi-level fuzzy comprehensive evaluation of yield, growth and fruit quality on cherry tomato. Agric. Water Manag. 2021, 243, 106360. [Google Scholar] [CrossRef]
  22. Wang, F.; Kang, S.; Du, T.; Li, F.; Qiu, R. Determination of comprehensive quality index for tomato and its response to different irrigation treatments. Agric. Water Manag. 2011, 98, 1228–1238. [Google Scholar] [CrossRef]
  23. Zhong, F.; Hou, M.; He, B.; Chen, I. Assessment on the coupling effects of drip irrigation and organic fertilization based on entropy weight coefficient model. PeerJ 2017, 5, e3855. [Google Scholar] [CrossRef]
  24. Jung, K.-C.; Chang, S.-H. Advanced deep learning model-based impact characterization method for composite laminates. Compos. Sci. Technol. 2021, 207, 108713. [Google Scholar] [CrossRef]
  25. Firouzi, S.; Allahyari, M.S.; Isazadeh, M.; Nikkhah, A.; Van Haute, S. Hybrid multi-criteria decision-making approach to select appropriate biomass resources for biofuel production. Sci. Total Environ. 2021, 770, 144449. [Google Scholar] [CrossRef] [PubMed]
  26. Mohebali, S.; Maghsoudy, S.; Doulati Ardejani, F.; Shafaei, F. Developing a coupled environmental impact assessment (C-EIA) method with sustainable development approach for environmental analysis in coal industries. Environ. Dev. Sustain. 2020, 22, 6799–6830. [Google Scholar] [CrossRef]
  27. Kilgour, D.M.; Grégoire, J.-C.; Foley, A.M. Weighted scoring elections: Is Borda best? Soc. Choice Welf. 2022, 58, 365–391. [Google Scholar] [CrossRef]
  28. Terzopoulou, Z.; Endriss, U. The Borda class: An axiomatic study of the Borda rule on top-truncated preferences. J. Math. Econ. 2021, 92, 31–40. [Google Scholar] [CrossRef]
  29. Li, X.; Ma, J.; Zheng, L.; Chen, J.; Sun, X.; Guo, X. Optimization of the regulated deficit irrigation strategy for greenhouse tomato based on the fuzzy borda model. Agriculture 2022, 12, 324. [Google Scholar] [CrossRef]
  30. Yao, X.; Deng, H.; Zhang, T.; Qin, Y. Multistage fuzzy comprehensive evaluation of landslide hazards based on a cloud model. PLoS ONE 2019, 14, e0224312. [Google Scholar] [CrossRef]
  31. Zhou, G.-Y.; Wu, E.; Tu, S.-T. Optimum selection of compact heat exchangers using non-structural fuzzy decision method. Appl. Energy 2014, 113, 1801–1809. [Google Scholar] [CrossRef]
  32. Kang, S.; Gu, B.; Du, T.; Zhang, J. Crop coefficient and ratio of transpiration to evapotranspiration of winter wheat and maize in a semi-humid region. Agric. Water Manag. 2003, 59, 239–254. [Google Scholar] [CrossRef]
  33. Luo, Q.; Bange, M.; Johnston, D. Environment and cotton fibre quality. Clim. Change 2016, 138, 207–221. [Google Scholar] [CrossRef]
  34. Weng, S.; Fan, Z.; Gou, J. A fast DBSCAN algorithm using a bi-directional HNSW index structure for big data. Int. J. Mach. Learn. Cybern. 2024, 15, 3471–3494. [Google Scholar] [CrossRef]
  35. Bai, Z.; Bai, W.; Xie, C.; Yu, J.; Dai, Y.; Pei, S.; Zhang, F.; Li, Y.; Fan, J.; Yin, F. Irrigation depth and nitrogen rate effects on seed cotton yield, fiber quality and water-nitrogen utilization efficiency in southern Xinjiang, China. Agric. Water Manag. 2023, 290, 108583. [Google Scholar] [CrossRef]
  36. Liu, X.; Li, M.; Xue, D.; He, S.; Fan, J.; Zhang, F.; Yin, F. Optimal drip irrigation leaching amount and timing enhanced cotton fiber yield, quality and nitrogen uptake by regulating soil salinity and nitrate nitrogen in saline-alkaline fields. J. Integr. Agric. 2025, 24, 2389–2409. [Google Scholar] [CrossRef]
  37. Ul-Allah, S.; Rehman, A.; Hussain, M.; Farooq, M. Fiber yield and quality in cotton under drought: Effects and management. Agric. Water Manag. 2021, 255, 106994. [Google Scholar] [CrossRef]
  38. Zhu, H.; Li, Y.; Wang, Z.; Zou, J.; He, J.; Wang, Y.; Wang, S.; Zhou, Z.; Zhao, W.; Hu, W. Waterlogging restricted cotton fiber elongation by reducing osmolyte accumulation and cell wall biosynthesis. Environ. Exp. Bot. 2023, 216, 105547. [Google Scholar] [CrossRef]
  39. Jiang, Z.; Wang, Q.; Ning, S.; Hu, X.; Song, Z. Enhancing cotton (Gossypium hirsutum L.) productivity and quality with magnetized ionized water and Bacillus subtilis intervention under film-mulched drip irrigation in saline soil in Xinjiang. Field Crops Res. 2024, 311, 109377. [Google Scholar] [CrossRef]
  40. Shi, X.; Hao, X.; Yang, Y.; Li, N.; Shi, F.; Tian, Y.; Zhang, H.; Li, H.; Liu, P.; Wang, J. Enhancing cotton yield and fiber quality via the optimization of within-boll yield components with potassium application under limited drip irrigation in arid regions. Ind. Crops Prod. 2024, 222, 119957. [Google Scholar] [CrossRef]
  41. Liu, H.; Li, H.; Ning, H.; Zhang, X.; Li, S.; Pang, J.; Wang, G.; Sun, J. Optimizing irrigation frequency and amount to balance yield, fruit quality and water use efficiency of greenhouse tomato. Agric. Water Manag. 2019, 226, 105787. [Google Scholar] [CrossRef]
  42. Wang, F.-X.; Kang, Y.; Liu, S.-P. Effects of drip irrigation frequency on soil wetting pattern and potato growth in North China Plain. Agric. Water Manag. 2006, 79, 248–264. [Google Scholar] [CrossRef]
  43. Wang, H.; Wang, X.; Bi, L.; Wang, Y.; Fan, J.; Zhang, F.; Hou, X.; Cheng, M.; Hu, W.; Wu, L. Multi-objective optimization of water and fertilizer management for potato production in sandy areas of northern China based on TOPSIS. Field Crops Res. 2019, 240, 55–68. [Google Scholar] [CrossRef]
  44. Xue, R.; Zhang, C.; Yan, H.; Lakhiar, I.A.; Disasa, K.N.; Zhou, Y.; Li, J.; Wang, X.; Zhou, R.; Wang, B. Evaluating effect of micro-spray on tomatoes for resisting summer heat stress using a Fuzzy Borda combination evaluation model. Environ. Exp. Bot. 2024, 218, 105605. [Google Scholar] [CrossRef]
  45. Herva, M.; Roca, E. Review of combined approaches and multi-criteria analysis for corporate environmental evaluation. J. Clean. Prod. 2013, 39, 355–371. [Google Scholar] [CrossRef]
  46. Lokhande, S.; Reddy, K.R. Reproductive and fiber quality responses of upland cotton to moisture deficiency. Agron. J. 2014, 106, 1060–1069. [Google Scholar] [CrossRef]
  47. Wang, R.; Gao, M.; Ji, S.; Wang, S.; Meng, Y.; Zhou, Z. Carbon allocation, osmotic adjustment, antioxidant capacity and growth in cotton under long-term soil drought during flowering and boll-forming period. Plant Physiol. Biochem. 2016, 107, 137–146. [Google Scholar] [CrossRef]
  48. Zhang, L.; Chen, B.; Zhang, G.; Li, J.; Wang, Y.; Meng, Y.; Zhou, Z. Effect of soil salinity, soil drought, and their combined action on the biochemical characteristics of cotton roots. Acta Physiol. Plant. 2013, 35, 3167–3179. [Google Scholar] [CrossRef]
  49. Sharif, I.; Aleem, S.; Farooq, J.; Rizwan, M.; Younas, A.; Sarwar, G.; Chohan, S.M. Salinity stress in cotton: Effects, mechanism of tolerance and its management strategies. Physiol. Mol. Biol. Plants 2019, 25, 807–820. [Google Scholar] [CrossRef]
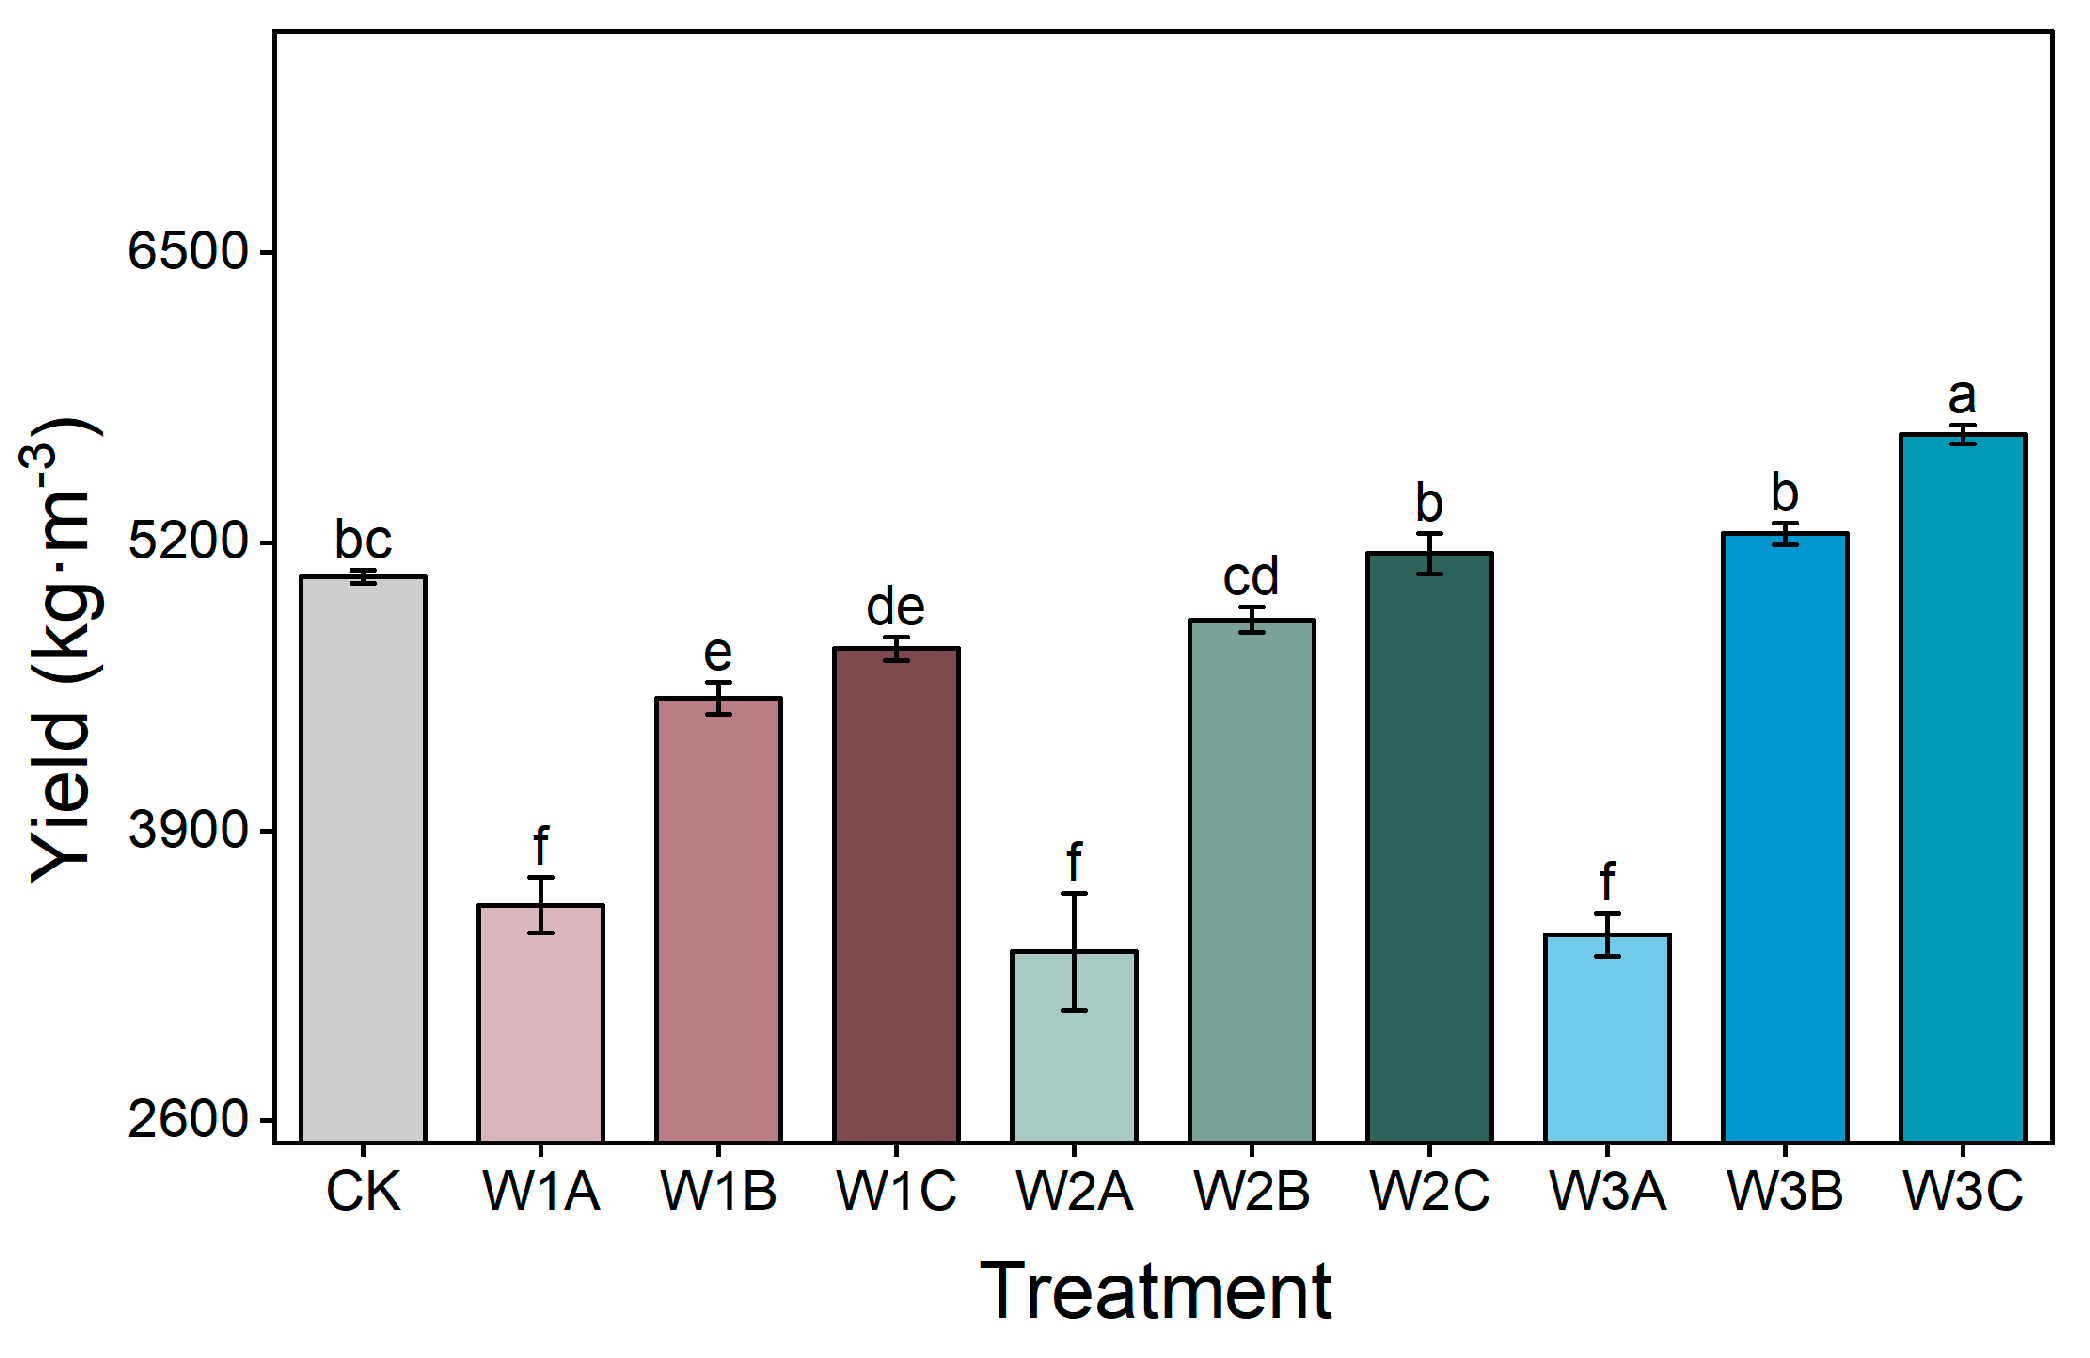
Figure 1. Yield of cotton under different leaching timings and leaching amounts. Bars indicate the standard deviation (mean ± SD, n = 3). Different lowercase letters above the bars indicate significant differences among different inhibitor amendments at the same site at level of p < 0.05.
Agronomy 15 02113 g001
Figure 2. Effects of different leaching timings and leaching amounts on (a) average length of the upper half, (b) length regularity, (c) breaking strength, (d) breaking elongation, (e) micronaire value, (f) short fiber index, (g) maturity index, and (h) spinning consistency index of cotton.
Agronomy 15 02113 g002
Figure 3. Values of plant height (a), stem diameter (b), number of buds (c), leaf area index (d) of cotton under different leaching timings and leaching amounts. Bars indicate the standard deviation (mean ± SD, n = 3). Different lowercase letters above the bars indicate significant differences among different inhibitor amendments at the same site at level of p < 0.05.
Agronomy 15 02113 g003
Figure 4. Values of WUE (a), dry matter accumulation (b), of cotton under different leaching timings and leaching amounts. Bars indicate the standard deviation (mean ± SD, n = 3). Different lowercase letters above the bars indicate significant differences among different inhibitor amendments at the same site at level of p < 0.05.
Agronomy 15 02113 g004
Figure 5. Coupling effect of irrigation and times on comprehensive cotton growth, yield, and quality.
Agronomy 15 02113 g005
Table 1. The treatment design of field test.
Irrigation TreatmentNon-Reproductive Period Flushing Amount (mm)Irrigation Amount During the Reproductive PeriodTotal Irrigation Amount
(mm)
Seedling StageBudding StageFlower Bell
Stage
Spinning Stage
CK45080%ETc80%ETc80%ETc-776.3
W1A 75 mm + 80%ETc80%ETc80%ETc-401.3
W1B 37.5 mm + 80%ETc37.5 mm + 80%ETc80%ETc-401.3
W1C 25 mm + 80%ETc25 mm + 80%ETc25 mm + 80%ETc-401.3
W2A 150 mm + 80%ETc80%ETc80%ETc-476.3
W2B 75 mm + 80%ETc75 mm + 80%ETc80%ETc-476.3
W2C 50 mm + 80%ETc50 mm + 80%ETc50 mm + 80%ETc-476.3
W3A 240 mm + 80%ETc80%ETc80%ETc-566.3
W3B 120 mm + 80%ETc120 mm + 80%ETc80%ETc-566.3
Table 2. Results of different evaluation models.
TreatmentPCATOPSISGRDAMFARanking Standard Deviation
Evaluation
Value
RankingEvaluation ValueRankingEvaluation
Value
RankingEvaluation
Value
Ranking
CK−0.88 60.46 60.99 544.38 60.50
W1A−3.48 90.38 90.86 1033.74 90.50
W1B−1.81 70.45 70.92 842.09 70.50
W1C−0.09 50.55 51.02 455.43 50.50
W2A−2.43 80.43 80.94 740.12 80.50
W2B2.33 40.60 40.98 663.39 41.00
W2C4.43 10.69 21.11 276.98 10.58
W3A−4.37 100.31 100.89 927.53 100.50
W3B3.10 30.63 31.05 370.46 30.00
W3C3.21 20.70 11.23 176.00 20.58
Table 3. Kendall correlation coefficient of every evaluation model sequence values.
PCATOPSISGRDAMFAMean
PCA1.00 0.96 0.78 1.00 0.93
TOPSIS0.96 1.00 0.82 0.96 0.93
GRDA0.78 0.82 1.00 0.78 0.84
MFA1.00 0.96 0.78 1.00 0.93
Table 4. Evaluation results of cotton growth–quality–yield combination.
TreatmentBordaCopelandFBordaODCARanking
Standard
Deviation
Evaluation
Value
RankingEvaluation
Value
RankingEvaluation
Value
RankingEvaluation
Value
Ranking
CK4.006−1.00611.216−0.1160.00
W1A1.009−7.0090.879−1.4690.00
W1B3.007−3.0075.477−0.5970.00
W1C5.0051.00516.2950.3250.00
W2A2.008−5.0083.688−0.9080.00
W2B6.0043.00419.4041.5540.00
W2C8.0017.00140.8812.6610.00
W3A0.0010−9.00100.3710−1.92100.00
W3B7.0035.00328.0031.9630.00
W3C8.0017.00140.6722.0720.58
Disclaimer/Publisher’s Note: The statements, opinions and data contained in all publications are solely those of the individual author(s) and contributor(s) and not of MDPI and/or the editor(s). MDPI and/or the editor(s) disclaim responsibility for any injury to people or property resulting from any ideas, methods, instructions or products referred to in the content.