Three-Dimensional Convolutional Neural Networks (3D-CNN) in the Classification of Varieties and Quality Assessment of Soybean Seeds (Glycine max L. Merrill)
Abstract
1. Introduction
2. Materials and Methods
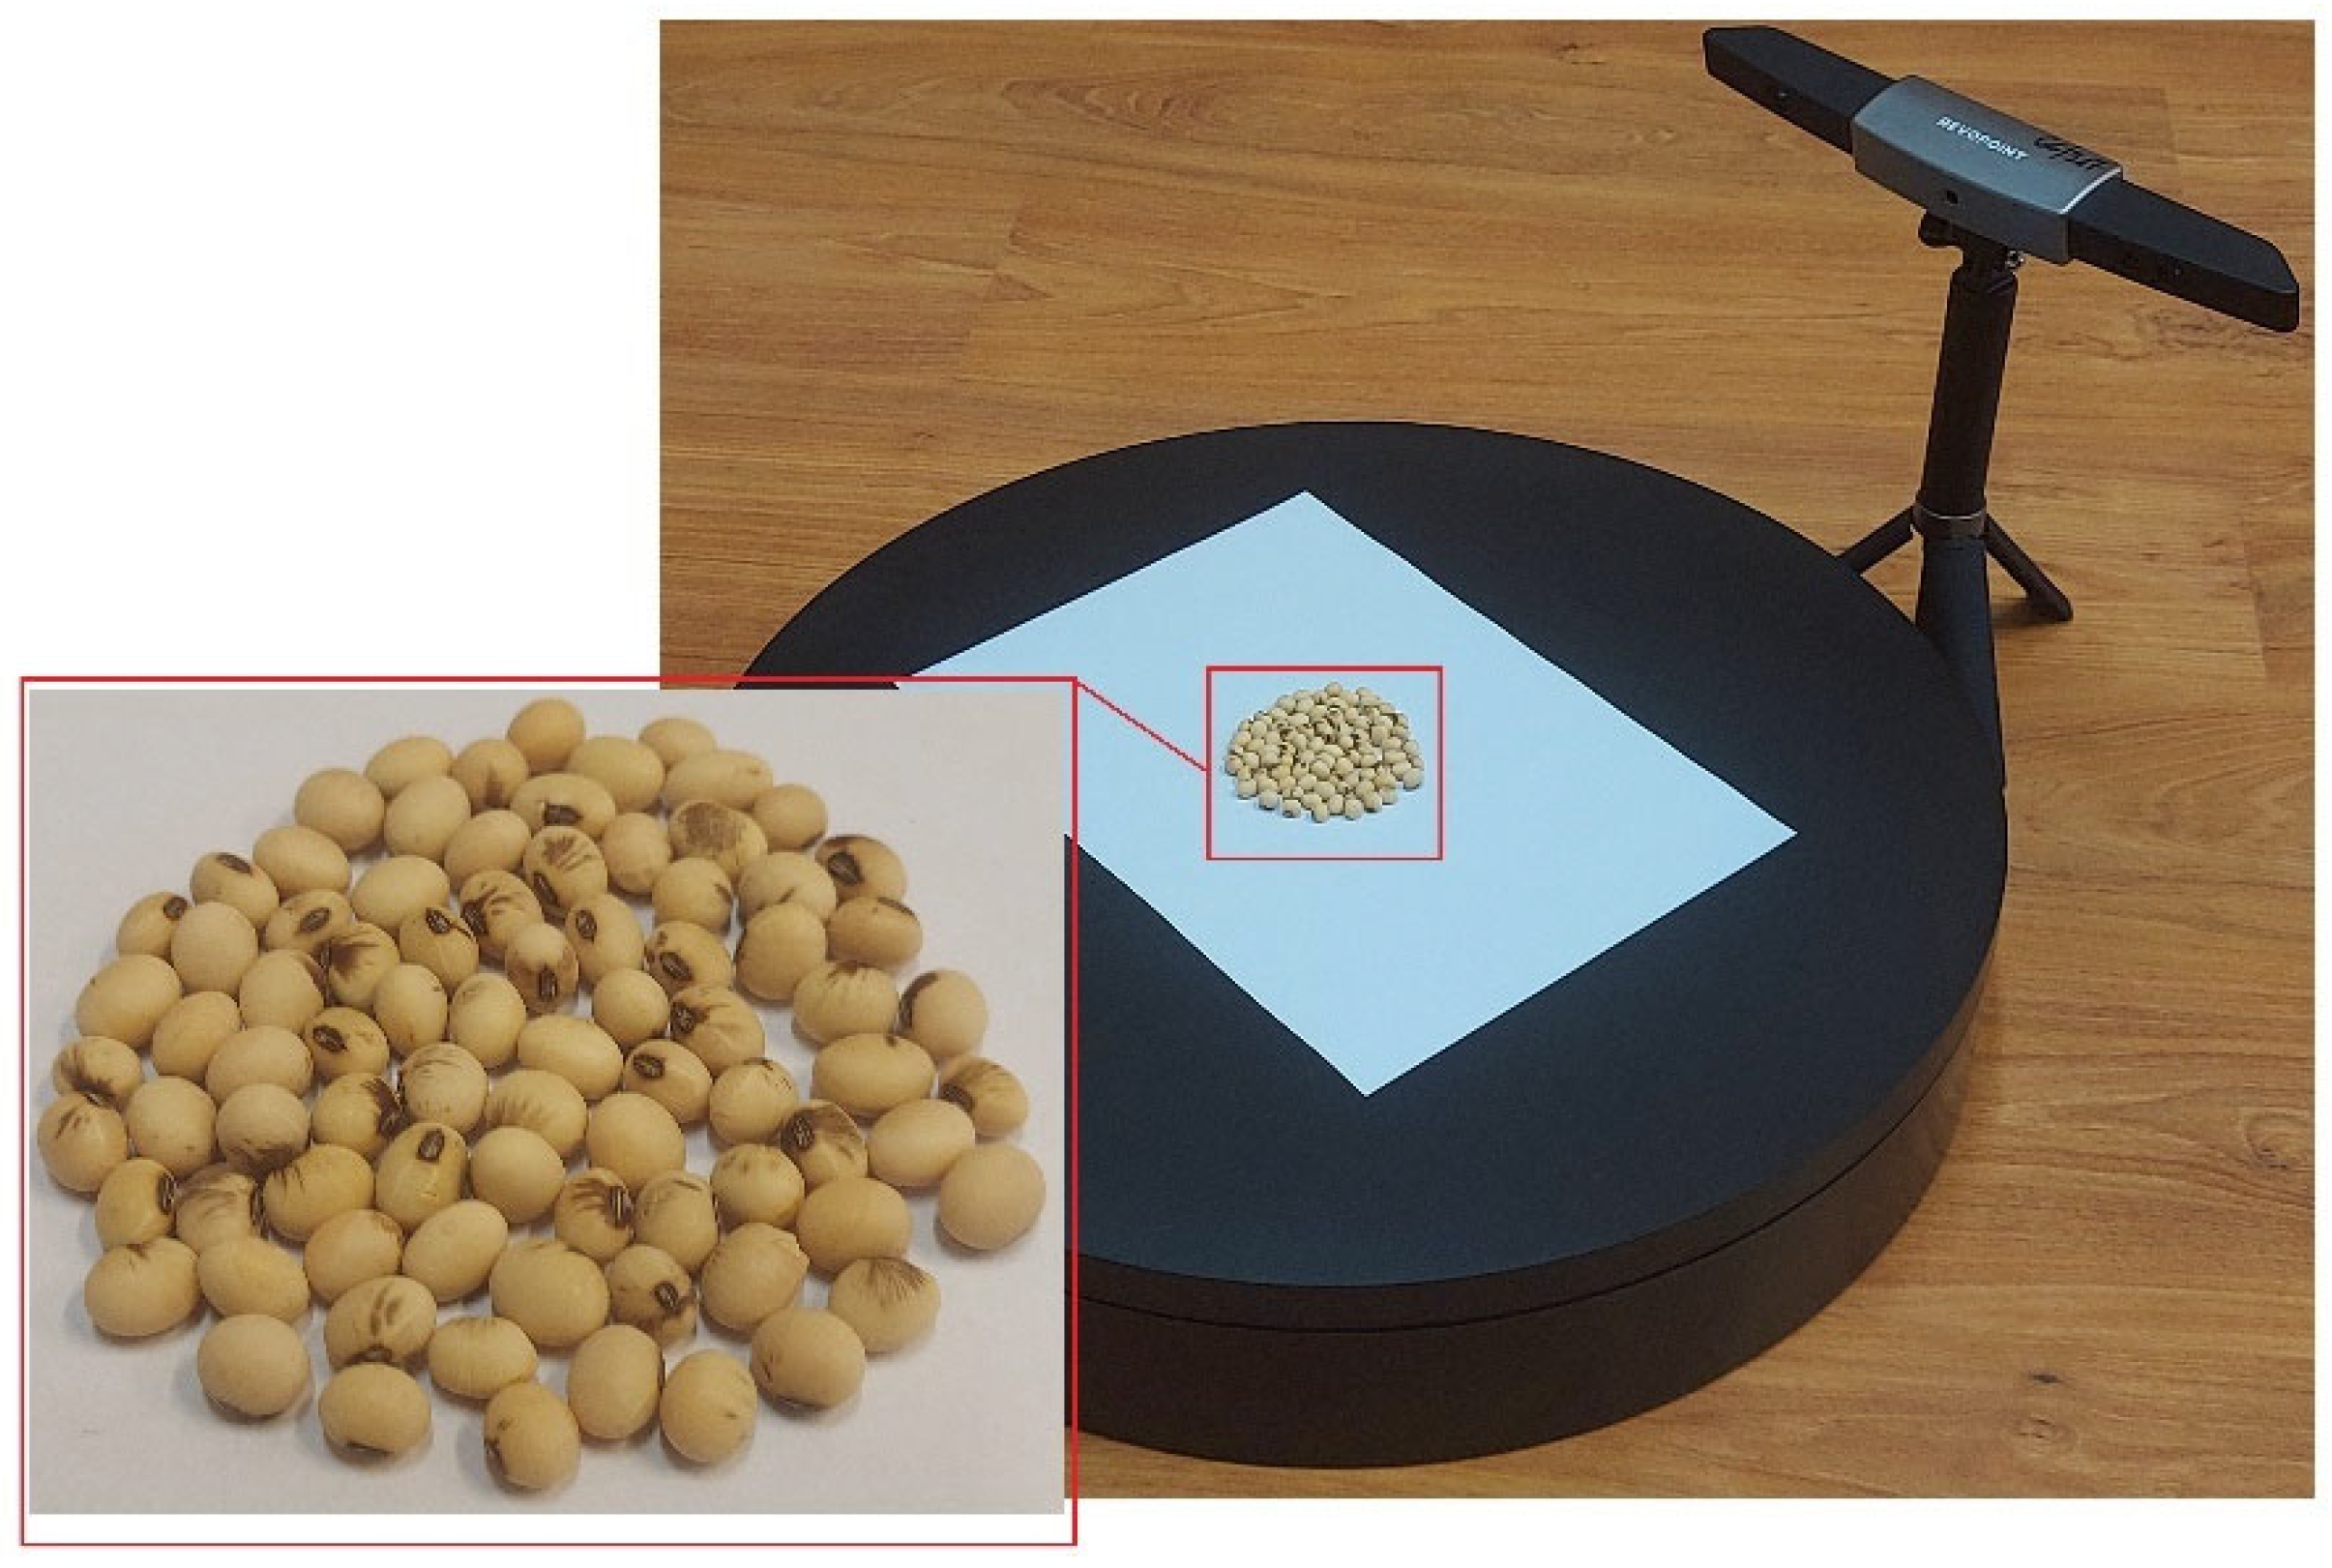
2.1. Data Set Preparation
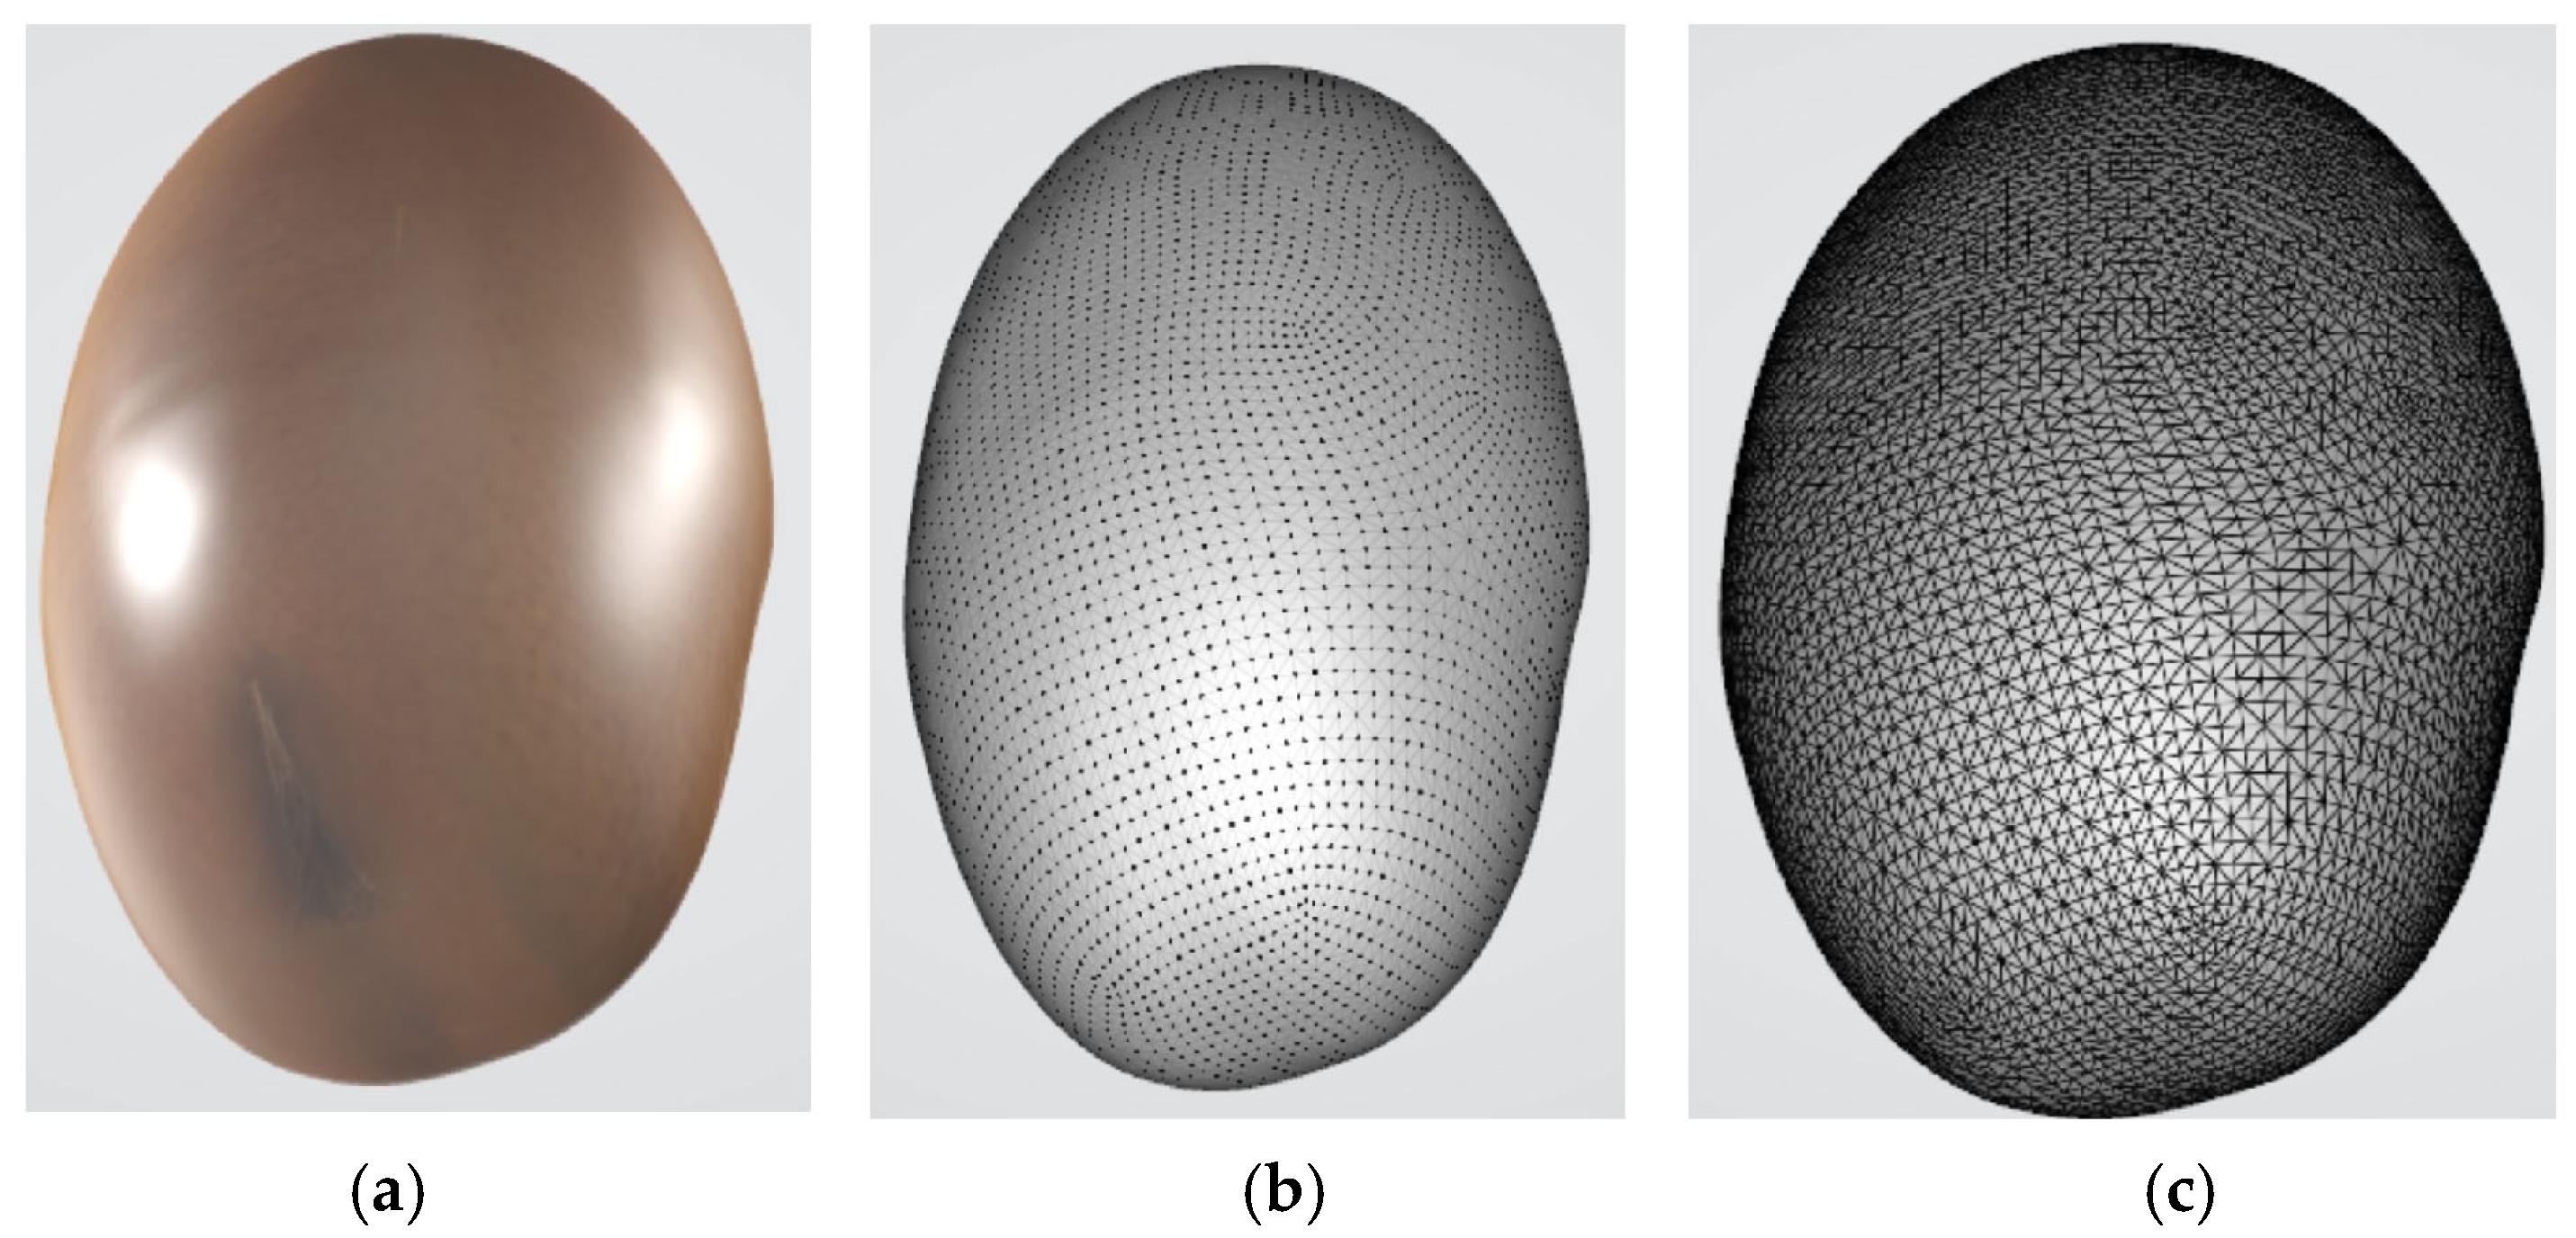
2.2. 3D Model Preprocessing
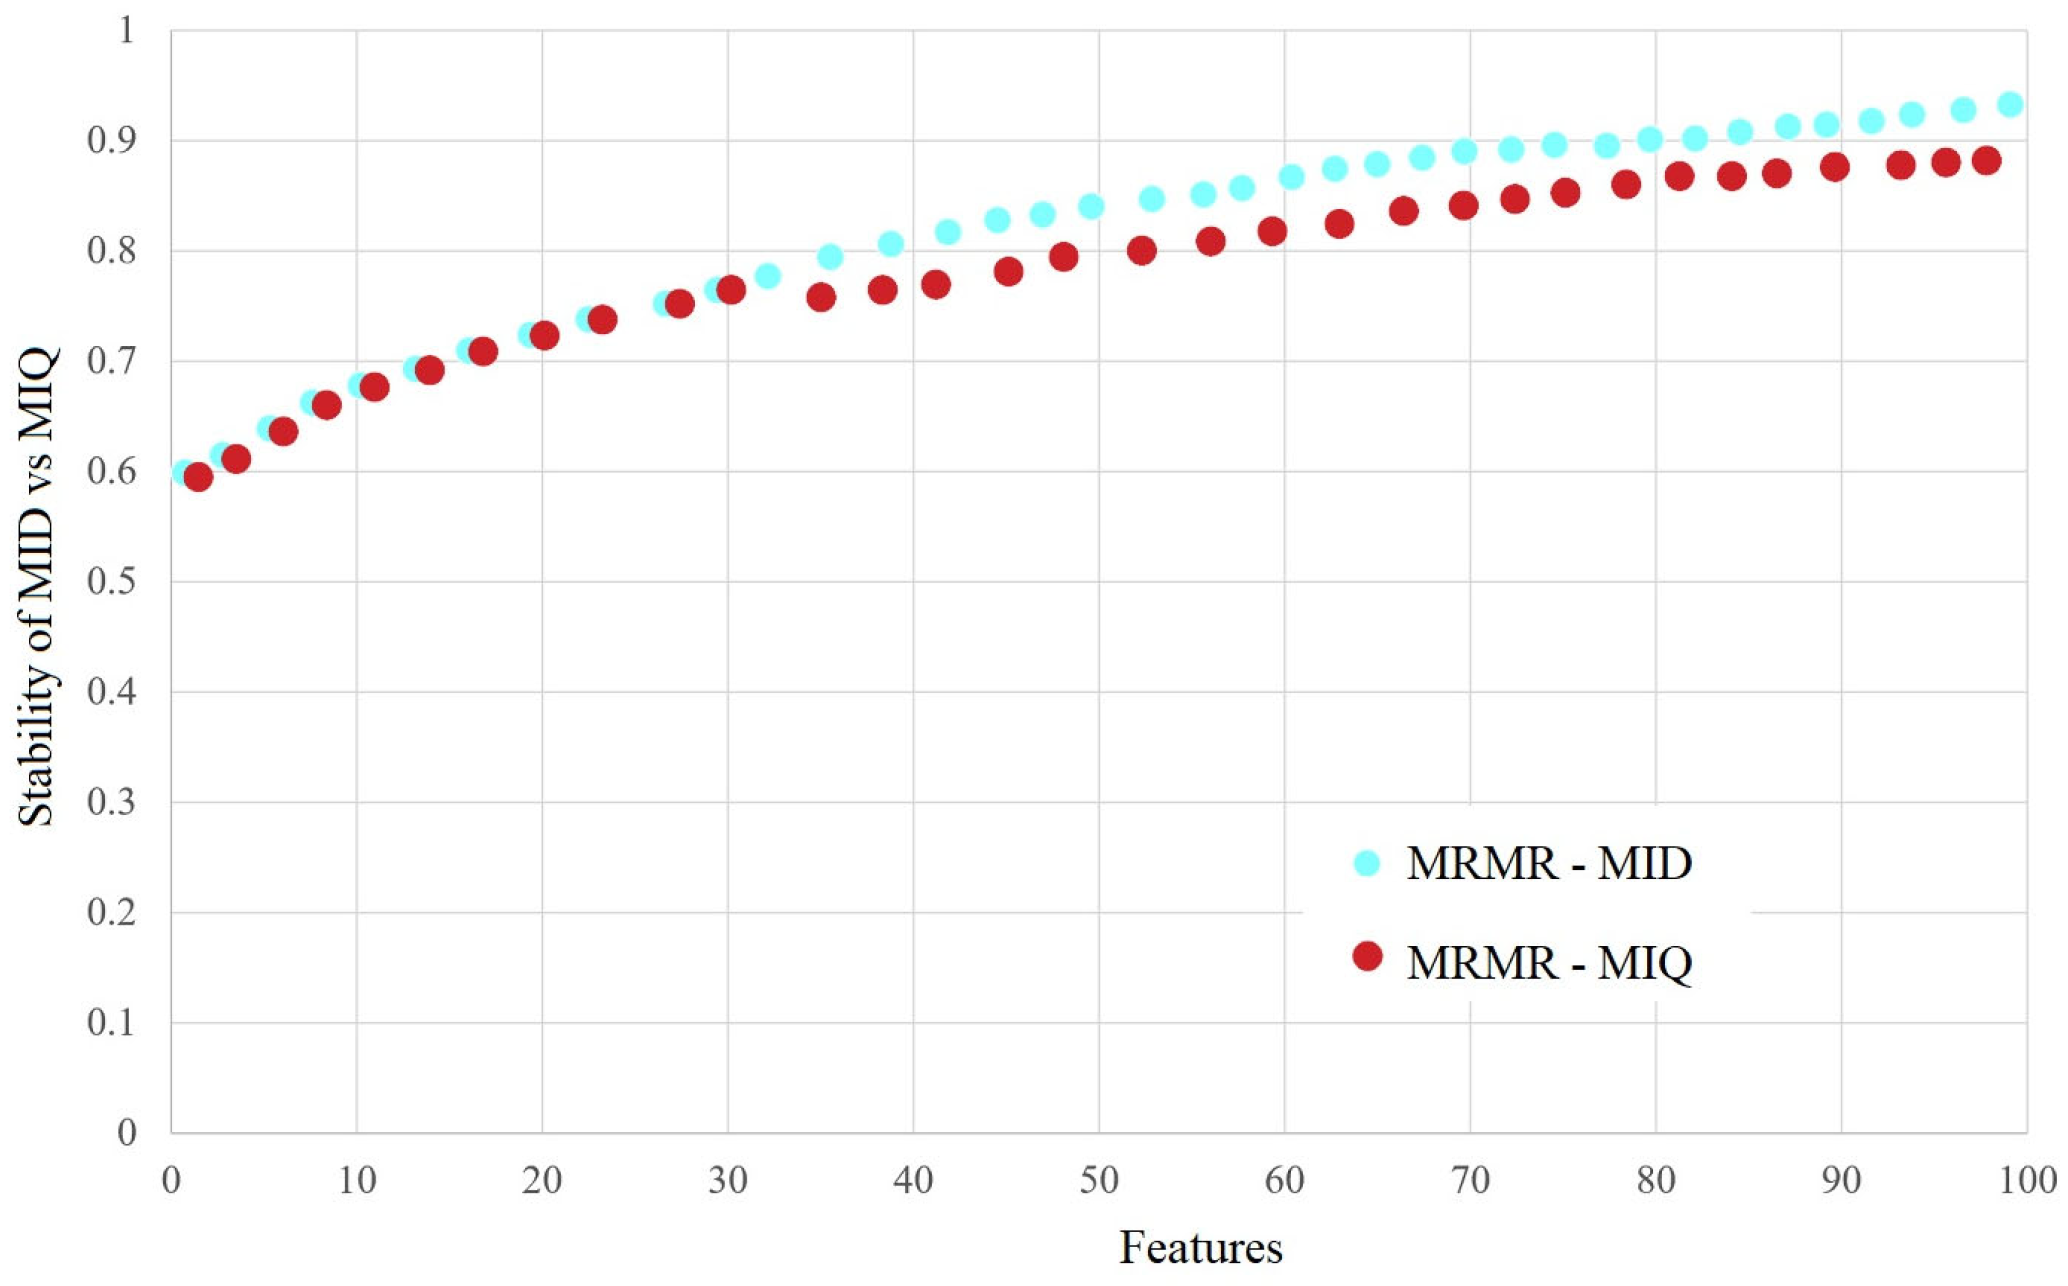
2.3. Defining Soybean Seed Classification Criteria
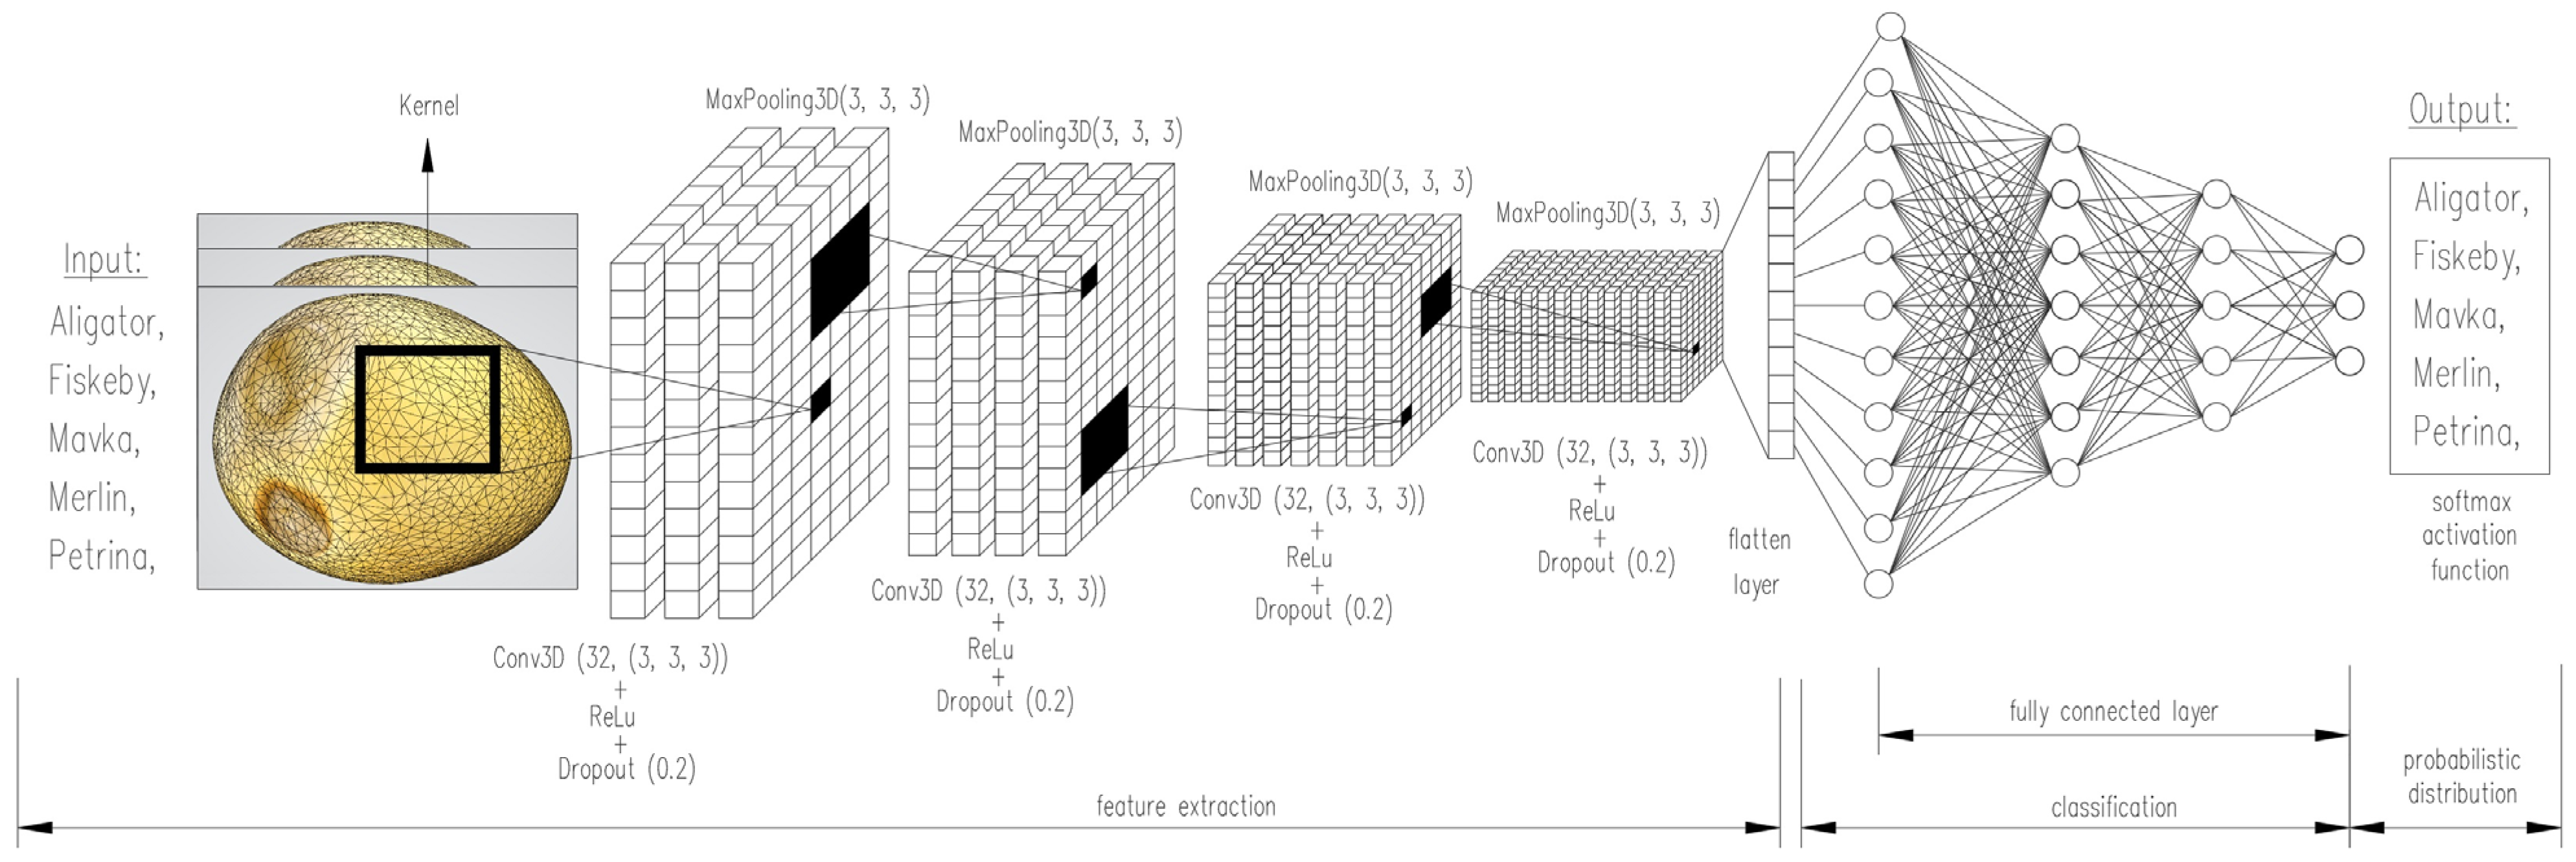
2.4. Architecture of the Multilayer 3D-CNN Network
- -
- Standard deviation:
- -
- Mean error:
- -
- Absolute mean error:
- -
- Normalized standard deviation:
- -
- Error variance:
3. Results
4. Discussion
5. Conclusions
Supplementary Materials
Author Contributions
Funding
Data Availability Statement
Conflicts of Interest
References
- Sun, H.; Hua, Z.; Yin, C.; Li, F.; Shi, Y. Geographical traceability of soybean: An electronic nose coupled with an effective deep learning method. Food Chem. 2024, 440, 138207. [Google Scholar] [CrossRef] [PubMed]
- Barboza Martignone, G.M.; Papadas, D.; Behrendt, K.; Ghosh, B. The rise of Soybean in international commodity markets: A quantile investigation. Heliyon 2024, 10, e34669. [Google Scholar] [CrossRef] [PubMed]
- Messina, M.; Duncan, A.; Messina, V.; Lynch, H.; Kilonia, J.; Erdman, J.W., Jr. The health effects of soy: A reference guide for health professionals. Front. Nutr. 2022, 9, 970364. [Google Scholar] [CrossRef] [PubMed]
- Abdelghany, A.M.; Zhang, S.; Azam, M.; Shaibu, A.S.; Feng, Y. Profiling of seed fatty acid composition in 1025 Chinese soybean accessions from diverse ecoregions. Crop J. 2020, 8, 635–644. [Google Scholar] [CrossRef]
- Fabrizzi, K.P.; Fernández, F.G.; Venterea, R.T.; Naeve, S.L. Nitrous oxide emissions from soybean in response to drained and undrained soils and previous corn nitrogen management. J. Environ. Qual. 2024, 53, 407–417. [Google Scholar] [CrossRef]
- Zhu, D.Z.; Li, Y.F.; Wang, D.C.; Wu, Q.; Zhang, D.Y.; Wang, C. The Identification of Single Soybean Seed Variety by Laser Light Backscattering Imaging. Sens. Leterst 2012, 10, 399–404. [Google Scholar] [CrossRef]
- Sharma, N.; Bajwa, J.S.; Gautam, N.; Attri, S. Preparation of health beneficial probiotic soya ice-cream and evaluation of quality attributes. J. Microbiol. Biotechnol. Food Sci. 2024, 13, e5309. [Google Scholar] [CrossRef]
- Serson, W.R.; Gishini, M.F.S.; Stupar, R.M.; Stec, A.O.; Armstrong, P.R.; Hildebrand, D. Identification and Candidate Gene Evaluation of a Large Fast Neutron-Induced Deletion Associated with a High-Oil Phenotype in Soybean Seeds. Genes 2024, 15, 892. [Google Scholar] [CrossRef]
- Carpentieri-Pipolo, V.; Barreto, T.P.; Silva, D.A.; da Abdelnoor, R.V.; Marin, S.R.; Degrassi, G. Soybean Improvement for Lipoxygenase-free by Simple Sequence Repeat (SSR) Markers Selection. J. Bot. Res. 2021, 3, 23–31. [Google Scholar] [CrossRef]
- Bayramli, O. Delineating genetic diversity in soybean (Glycine max L.) genotypes: Insights from a-page analysis of globulin reserve proteins. Adv. Biol. Earth Sci. 2024, 9, 259–266. [Google Scholar] [CrossRef]
- Megha, P.S.; Ramnath, V.; Karthiayini, K.; Beena, V.; Vishnudas, K.V.; Sapna, P.P. Free Isoflavone (Daidzein and Genistein) Content in Soybeans, Soybean Meal and Dried Soy Hypocotyl Sprout Using High Performance Liquid Chromatography (HPLC). J. Sci. Res. Rep. 2024, 30, 803–812. [Google Scholar] [CrossRef]
- Santana, D.C.; de Oliveira, I.C.; Cavalheiro, S.B.; das Chagas, P.H.M.; Teixeira Filho, M.C.M.; Della-Silva, J.L.; Teodoro, L.P.R.; Campos, C.N.S.; Baio, F.H.R.; da Silva Junior, C.A.; et al. Classification of Soybean Genotypes as to Calcium, Magnesium, and Sulfur Content Using Machine Learning Models and UAV–Multispectral Sensor. AgriEngineering 2024, 6, 1581–1593. [Google Scholar] [CrossRef]
- Sarkar, S.; Sagan, V.; Bhadra, S.; Fritschi, F.B. Spectral enhancement of PlanetScope using Sentinel-2 images to estimate soybean yield and seed composition. Sci. Rep. 2024, 14, 15063. [Google Scholar] [CrossRef] [PubMed]
- de Oliveira, S.S.C.; Ribeiro, L.K.M.; Cruz, S.J.S.; Zuchi, J.; Ponciano, V.d.F.G.; Maia, A.J.; Valichesky, R.R.; Grande, G.G. Analysis of seedling images to evaluate the physiological potential of soybean seeds. Obs. Econ. Latinoam. 2024, 22, e3633. [Google Scholar] [CrossRef]
- Duc, N.T.; Ramlal, A.; Rajendran, A.; Raju, D.; Lal, S.K.; Kumar, S.; Sahoo, R.N.; Chinnusamy, V. Image-based phenotyping of seed architectural traits and prediction of seed weight using machine learning models in soybean. Front. Plant Sci. 2023, 14, 1206357. [Google Scholar] [CrossRef]
- Kim, J.; Lee, C.; Park, J.; Kim, N.; Kim, S.-L.; Baek, J.; Chung, Y.-S.; Kim, K. Comparison of Various Drought Resistance Traits in Soybean (Glycine max L.) Based on Image Analysis for Precision Agriculture. Plants 2023, 12, 2331. [Google Scholar] [CrossRef]
- Singh, P.; Kansal, M.; Singh, R.; Kumar, S.; Sen, C. A Hybrid Approach based on Haar Cascade, Softmax, and CNN for Human Face Recognition. J. Sci. Ind. Res. 2024, 83, 414–423. [Google Scholar] [CrossRef]
- Yo, M.; Chong, S.; Chong, L. Sparse CNN: Leveraging deep learning and sparse representation for masked face recognition. Int. J. Inf. Technol. 2025, 22, accessed January 31. [Google Scholar] [CrossRef]
- Bhanbhro, J.; Memon, A.A.; Lal, B.; Talpur, S.; Memon, M. Speech Emotion Recognition: Comparative Analysis of CNN-LSTM and Attention-Enhanced CNN-LSTM Models. Signals 2025, 6, 22. [Google Scholar] [CrossRef]
- Raja’a, M.M.; Suhad, M.K. Automatic Translation from Iraqi Sign Language to Arabic Text or Speech Using CNN. Iraqi J. Comput. Commun. Control Syst. Eng. 2023, 23, 112–124. [Google Scholar] [CrossRef]
- Al Ahmadi, S.; Muhammad, F.; Al Dawsari, H. Enhancing Arabic Sign Language Interpretation: Leveraging Convolutional Neural Networks and Transfer Learning. Mathematics 2024, 12, 823. [Google Scholar] [CrossRef]
- Mishra, J.; Sharma, R.K. Optimized FPGA Architecture for CNN-Driven VoiceDisorder Detection. Circuits Syst. Signal Process. 2025, 44, 4455–4467. [Google Scholar] [CrossRef]
- Li, H.; Gu, Y.; Han, J.; Sun, Y.; Lei, H.; Li, C.; Xu, N. Faster R-CNN-MobileNetV3 Based Micro Expression Detection for Autism Spectrum Disorder. AI Med. 2025, 2, 2. [Google Scholar] [CrossRef]
- Billa, G.B.; Rao, V. An Automated Identification of Muscular Atrophy and Muscular Dystrophy Disease in Fetus using Deep Learning Approach. J. Inf. Syst. Eng. Manag. 2025, 10, 551–559. [Google Scholar] [CrossRef]
- Çetiner, İ. SkinCNN: Classification of Skin Cancer Lesions with A Novel CNN Model. Bitlis Eren Üniv. Fen Bilim. Derg. 2023, 12, 1105–1116. [Google Scholar] [CrossRef]
- Britto, J.G.M.; Mulugu, N.; Bharathi, K.S. A hybrid deep learning approach for breast cancer detection using cnn and rnn. Bioscan 2024, 19, 272–286. [Google Scholar] [CrossRef]
- Afify, H.; Mohammed, K.; Hassanien, A. Leveraging hybrid 1D-CNN and RNN approach for classification of brain cancer gene expression. Complex Intell. Syst. 2024, 10, 7605–7617. [Google Scholar] [CrossRef]
- Lei, J.; Ni, Z.; Peng, Z.; Hu, H.; Hong, J.; Fang, X.; Yi, C.; Ren, C.; Wasaye, M.A. An intelligent network framework for driver distraction monitoring based on RES-SE-CNN. Sci. Rep. 2025, 15, 6916. [Google Scholar] [CrossRef]
- Peng, Y.; Cai, Z.; Zhang, L.; Wang, X. BCAMP: A Behavior-Controllable Motion Control Method Based on Adversarial Motion Priors for Quadruped Robot. Appl. Sci. 2025, 15, 3356. [Google Scholar] [CrossRef]
- Yiping, Z.; Wilker, K. Visual-and-Language Multimodal Fusion for Sweeping Robot Navigation Based on CNN and GRU. J. Organ. End User Comput. 2024, 36, 21. [Google Scholar] [CrossRef]
- Alraba’nah, Y.; Hiari, M. Improved convolutional neural networks for aircraft type classification in remote sensing images. IAES Int. J. Artif. Intell. 2025, 14, 1540–1547. [Google Scholar] [CrossRef]
- Nawaz, S.M.; Maharajan, K.; Jose, N.N.; Praveen, R.V.S. GreenGuard CNN-Enhanced Paddy Leaf Detection for Crop Health Monitoring. Int. J. Comput. Exp. Sci. Eng. 2025, 11. [Google Scholar] [CrossRef]
- Chinchorkar, S. Utilizing satellite data and machine learning to monitor agricultural vulnerabilities to climate change. Int. J. Geogr. Geol. Environ. 2025, 7, 1–9. [Google Scholar] [CrossRef]
- Rendón-Vargas, A.; Luna-Álvarez, A.; Mújica-Vargas, D.; Castro-Bello, M.; Marianito-Cuahuitic, I. Application of Convolutional Neural Networks for the Classification and Evaluation of Fruit Ripeness. Commun. Comput. Inf. Sci. 2024, 2249, 150–163. [Google Scholar] [CrossRef]
- Rybacki, P.; Przygodziński, P.; Osuch, A.; Osuch, E.; Kowalik, I. Artificial Neural Network Model for Predicting Carrot Root Yield Loss in Relation to Mechanical Heading. Agriculture 2024, 14, 1755. [Google Scholar] [CrossRef]
- Garibaldi-Márquez, F.; Flores, G.; Valentín-Coronado, L.M. Leveraging deep semantic segmentation for assisted weed detection. J. Agric. Eng. 2025, 36, 1741. [Google Scholar] [CrossRef]
- Gómez, A.; Moreno, H.; Andújar, D. Intelligent Inter- and Intra-Row Early Weed Detection in Commercial Maize Crops. Plants 2025, 14, 881. [Google Scholar] [CrossRef]
- Mishra, A.M.; Singh, M.P.; Singh, P.; Djwakar, M.; Gupta, I.; Bijalwan, A. Hybrid deep learning model for density and growth rate estimation on weed image dataset. Sci. Rep. 2025, 15, 11330. [Google Scholar] [CrossRef] [PubMed]
- Anggraini, N.; Kusuma, B.; Subarkah, P.; Utomo, F.; Hermanto, N. Classification of Rice Plant Disease Image Using Convolutional Neural Network (CNN) Algorithm based on Amazon Web Service (AWS). Build. Inform. Technol. Sci. 2024, 6, 1293–1300. [Google Scholar] [CrossRef]
- Gangadevi, E.; Soufiane, B.O.; Balusamy, B.; Khan, F.; Getahun, M. A novel hybrid fruit fly and simulated annealing optimized faster R-CNN for detection and classification of tomato plant leaf diseases. Sci. Rep. 2025, 15, 16571. [Google Scholar] [CrossRef]
- Ray, S.K.; Hossain, A.; Islam, N.; Hasan, M.R. Enhanced plant health monitoring with dual head CNN for leaf classification and disease identification. J. Agric. Food Res. 2025, 21, 101930. [Google Scholar] [CrossRef]
- Hadianti, S.; Aziz, F.; Nur Sulistyowati, D.; Riana, D.; Saputra, R. Kurniawantoro, Identification of Potato Plant Pests Using the Convolutional Neural Network VGG16 Method. J. Med Inform. Technol. 2024, 2, 39–44. [Google Scholar] [CrossRef]
- Meshram, A.; Meshram, K.; Vanalkar, A.; Badar, A.; Mehta, G.; Kaushik, V. Deep Learning for Cotton Pest Detection: Comparative Analysis of CNN Architectures. Indian J. Ѐntomol. 2025, 1–4. [Google Scholar] [CrossRef]
- Soekarno, G.W.; Suhendar, A. Implementation of the Convolutional Neural Network (CNN) Algorithm for Pest Detection in Green Mustard Plants. G-Tech J. Teknol. Terap. 2025, 9, 202–210. [Google Scholar] [CrossRef]
- Tu, K.-L.; Li, L.-J.; Yang, L.-M.; Wang, J.-H.; Sun, Q. Selection for high quality pepper seeds by machine vision and classifiers. J. Integr. Agric. 2018, 17, 1999–2006. [Google Scholar] [CrossRef]
- Kong, Y.; Fang, S.; Wu, X.; Gong, Y.; Zhu, R.; Liu, J.; Peng, Y. Novel and Automatic Rice Thickness Extraction Based on Photogrammetry Using Rice Edge Features. Sensors 2019, 19, 5561. [Google Scholar] [CrossRef]
- Li, Y.; Jia, J.; Zhang, L.; Khattak, A.; Mateen, S.; Shi, G.; Wanlin, W. Soybean seed counting based on pod image using twocolumn convolution neural network. IEEE Access 2019, 7, 64177–64185. [Google Scholar] [CrossRef]
- Rybacki, P.; Niemann, J.; Bahcevandziev, K.; Durczak, K. Convolutional Neural Network Model for Variety Classification and Seed Quality Assessment of Winter Rapeseed. Sensors 2023, 23, 2486. [Google Scholar] [CrossRef] [PubMed]
- Kurtulmus, F.; Ünal, H. Discriminating rapeseed varieties using computer vision and machine learning. Expert Syst. Appl. 2015, 42, 1880–1891. [Google Scholar] [CrossRef]
- Oussama, A.; Kherfi, M.L. A new method for automatic date fruit classification. Int. J. Comput. Vis. Robot. 2017, 7, 692–711. [Google Scholar] [CrossRef]
- Hossain, M.S.; Muhammad, G.; Amin, S.U. Improving consumer satisfaction in smart cities using edge computing and caching: A case study of date fruits classification. Future Gener. Comput. Syst. 2018, 88, 333–341. [Google Scholar] [CrossRef]
- Lin, P.; Li, X.L.; Chen, Y.M.; He, Y. A deep convolutional neural network architecture for boosting image discrimination accuracy of rice species. Food Bioprocess Technol. 2018, 11, 765–773. [Google Scholar] [CrossRef]
- Ni, C.; Wang, D.; Vinson, R.; Holmes, M.; Tao, Y. Automatic inspection machine for maize kernels based on deep convolutional neural networks. Biosyst. Eng. 2019, 178, 131–144, ISSN 1537-5110. [Google Scholar] [CrossRef]
- Jung, M.; Song, J.S.; Hong, S.; Kim, S.; Go, S.; Lim, Y.P.; Park, J.; Park, S.G.; Kim, Y.M. Deep Learning Algorithms Correctly Classify Brassica rapa Varieties Using Digital Images. Front. Plant Sci. 2021, 12, 738685. [Google Scholar] [CrossRef]
- Albarrak, K.; Gulzar, Y.; Hamid, Y.; Mehmood, A.; Soomro, A.B. A Deep Learning-Based Model for Date Fruit Classification. Sustainability 2022, 14, 6339. [Google Scholar] [CrossRef]
- Hamid, Y.; Wani, S.; Soomro, A.B.; Alwan, A.A.; Gulzar, Y. Smart Seed Classification System based on MobileNetV2 Architecture. In Proceedings of the 2nd International Conference on Computing and Information Technology (ICCIT), Tabuk, Saudi Arabia, 25–27 January 2022; pp. 217–222. [Google Scholar]
- Jintasuttisak, T.; Edirisinghe, E.; Elbattay, A. Deep neural network based date palm tree detection in drone imagery. Comput. Electron. Agric. 2022, 192, 106560. [Google Scholar] [CrossRef]
- Sun, Z.; Guo, X.; Xu, Y.; Zhang, S.; Cheng, X.; Hu, Q.; Wang, W.; Xue, X. Image Recognition of Male Oilseed Rape (Brassica napus) Plants Based on Convolutional Neural Network for UAAS Navigation Applications on Supplementary Pollination and Aerial Spraying. Agriculture 2022, 12, 62. [Google Scholar] [CrossRef]
- Zhang, L.; Shi, S.; Zain, M.; Sun, B.; Han, D.; Sun, C. Evaluation of Rapeseed Leave Segmentation Accuracy Using Binocular Stereo Vision 3D Point Clouds. Agronomy 2025, 15, 245. [Google Scholar] [CrossRef]
- Yin, Y.; Guo, L.; Chen, K.; Guo, Z.; Chao, H.; Wang, B.; Li, M. 3D Reconstruction of Lipid Droplets in the Seed of Brassica napus. Sci. Rep. 2018, 8, 6560. [Google Scholar] [CrossRef]
- Liu, Y.; Yuan, H.; Zhao, X.; Fan, C.; Cheng, M. Fast reconstruction method of three-dimension model based on dual RGB-D cameras for peanut plant. Plant Methods 2023, 19, 17. [Google Scholar] [CrossRef]
- Wang, D.; Song, Z.; Miao, T.; Zhu, C.; Yang, X.; Yang, T.; Zhou, Y.; Den, H.; Xu, T. DFSP: A fast and automatic distance field-based stem-leaf segmentation pipeline for point cloud of maize shoot. Front. Plant Sci. 2023, 14, 1109314. [Google Scholar] [CrossRef]
- Bao, Y.; Tang, L.; Breitzman, M.W.; Salas Fernandez, M.G.; Schnable, P.S. Field-based robotic phenotyping of sorghum plant architecture using stereo vision. J. Field Robot. 2019, 36, 397–415. [Google Scholar] [CrossRef]
- Ma, X.; Zhu, K.; Guan, H.; Feng, J.; Yu, S.; Liu, G. Calculation Method for Phenotypic Traits Based on the 3D Reconstruction of Maize Canopies. Sensors 2019, 19, 1201. [Google Scholar] [CrossRef] [PubMed]
- Li, Y.; Liu, J.; Zhang, B.; Wang, Y.; Yao, J.; Zhang, X.; Fan, B.; Li, X.; Hai, Y.; Fan, X. Three-dimensional reconstruction and phenotype measurement of maize seedlings based on multi-view image sequences. Front. Plant Sci. 2022, 13, 974339. [Google Scholar] [CrossRef] [PubMed]
- Wei, B.; Ma, X.; Guan, H.; Yu, M.; Yang, C.; He, H.; Wang, F.; Shen, P. Dynamic simulation of leaf area index for the soybean canopy based on 3D reconstruction. Ecol. Inform. 2023, 75, 102070. [Google Scholar] [CrossRef]
- Nguyen, A.; Le, B. 3D point cloud segmentation: A survey. In Proceedings of the 2013 6th IEEE Conference on Robotics, Automation and Mechatronics (RAM), Manila, Philippines, 12–15 November 2013; pp. 225–230. [Google Scholar]
- Wang, W.; Zhang, Y.; Ge, G.; Jiang, Q.; Wang, Y.; Hu, L. Indoor Point Cloud Segmentation Using a Modified Region Growing Algorithm and Accurate Normal Estimation. IEEE Access 2023, 11, 42510–42520. [Google Scholar] [CrossRef]
- Fu, Y.; Niu, Y.; Wang, L.; Li, W. Individual-Tree Segmentation from UAV–LiDAR Data Using a Region-Growing Segmentation and Supervoxel-Weighted Fuzzy Clustering Approach. Remote Sens. 2024, 16, 608. [Google Scholar] [CrossRef]
- Yang, X.; Huang, Y.; Zhang, Q. Automatic Stockpile Extraction and Measurement Using 3D Point Cloud and Multi-Scale Directional Curvature. Remote Sens. 2020, 12, 960. [Google Scholar] [CrossRef]
- Zhu, B.; Zhang, Y.; Sun, Y.; Shi, Y.; Ma, Y.; Guo, Y. Quantitative estimation of organ-scale phenotypic parameters of field crops through 3D modeling using extremely low altitude UAV images. Comput. Electron. Agric. 2023, 210, 107910. [Google Scholar] [CrossRef]
- Ghahremani, M.; Williams, K.; Corke, F.; Tiddeman, B.; Liu, Y.; Wang, X.; Doonan, J.H. Direct and accurate feature extraction from 3D point clouds of plants using RANSAC. Comput. Electron. Agric. 2021, 87, 106240. [Google Scholar] [CrossRef]
- Fugacci, U.; Romanengo, C.; Falcidieno, B.; Biasotti, S. Reconstruction and Preservation of Feature Curves in 3D Point Cloud Processing. Comput. Aided Des. 2024, 167, 103649. [Google Scholar] [CrossRef]
- Miao, Y.; Li, S.; Wang, L.; Li, H.; Qiu, R.; Zhang, M. A single plant segmentation method of maize point cloud based on Euclidean clustering and K-means clustering. Comput. Electron. Agric. 2023, 210, 107951. [Google Scholar] [CrossRef]
- Zou, R.; Zhang, Y.; Chen, J.; Li, J.; Dai, W.; Mu, S. Density estimation method of mature wheat based on point cloud segmentation and clustering. Comput. Electron. Agric. 2023, 205, 107626. [Google Scholar] [CrossRef]
- Du, R.; Ma, Z.; Xie, P.; He, Y.; Cen, H. PST: Plant segmentation transformer for 3D point clouds of rapeseed plants at the podding stage. ISPRS J. Photogramm. Remote Sens. 2023, 195, 380–392. [Google Scholar] [CrossRef]
- Yan, J.; Tan, F.; Li, C.; Jin, S.; Zhang, C.; Gao, P.; Xu, W. Stem–Leaf segmentation and phenotypic trait extraction of individual plant using a precise and efficient point cloud segmentation network. Comput. Electron. Agric. 2024, 220, 108839. [Google Scholar] [CrossRef]
- Zhang, W.; Wu, S.; Wen, W.; Lu, X.; Wang, C.; Gou, W.; Li, Y.; Guo, X.; Zhao, C. Three-dimensional branch segmentation and phenotype extraction of maize tassel based on deep learning. Plant Methods 2023, 19, 76. [Google Scholar] [CrossRef]
- Dönmez, E. Enhancing classification capacity of CNN models with deep feature selection and fusion: A case study on maize seed classification. Data Knowl. Eng. 2022, 141, 102075. [Google Scholar] [CrossRef]
- Hu, X.; Xia, T.; Yang, L.; Wu, K.; Ying, W.; Tian, Y. 3D modeling and volume measurement of bulk grains stored in large warehouses using bi-temporal multi-site terrestrial laser scanning data. J. Agric. Eng. 2024, 55, 1055. [Google Scholar] [CrossRef]
- Huang, Z.; Wang, R.; Cao, Y.; Zheng, S.; Teng, Y.; Wang, F.; Wang, L.; Du, J. Deep learning based soybean seed classification. Comput. Electron. Agric. 2022, 202, 107393. [Google Scholar] [CrossRef]
- Yang, S.; Zheng, L.; Yang, H.; Zhang, M.; Wu, T.; Sun, S.; Tomasetto, F.; Wang, M. A synthetic datasets based instance segmentation network for High-throughput soybean pods phenotype investigation. Expert Syst. Appl. 2022, 192, 116403. [Google Scholar] [CrossRef]
- Brandani, E.B.; Souza, N.O.S.; Mattioni, N.M.; de Jesus Souza, F.F.; Vilela, M.S.; Marques, É.A.; de Souza Ferreira, W.F. Image analysis for the evaluation of soybean seeds vigor. Acta Agronómica 2022, 70, 1–14. [Google Scholar] [CrossRef]
- Fan, Y.; An, T.; Wang, Q.; Yang, G.; Huang, W.; Wang, Z.; Zhao, C.; Tian, X. Non-destructive detection of single-seed viabilityin maize using hyperspectral imaging technology and multi-scale 3D convolutional neural network. Front. Plant Sci. 2023, 14, 1248598. [Google Scholar] [CrossRef] [PubMed]
- Sable, A.; Singh, P.; Kaur, A.; Driss, M.; Boulila, W. Quantifying Soybean Defects: A Computational Approach to Seed Classification Using Deep Learning Techniques. Agronomy 2024, 14, 1098. [Google Scholar] [CrossRef]
- Saito, Y.; Miyakawa, R.; Murai, T.; Itakura, K. Classification of external defects on soybean seeds using multi-input convolutional neural networks with color and UV-induced fluorescence images input, Intelligence. Inform. Infrastruct. 2024, 5, 135–140. [Google Scholar] [CrossRef]
- Lin, W.; Shu, L.; Zhong, W.; Lu, W.; Ma, D.; Meng, Y. Online classification of soybean seeds based on deep learning. Eng. Appl. Artif. Intell. 2023, 123, 106434. [Google Scholar] [CrossRef]
- Baek, J.; Lee, E.; Kim, N.; Kim, S.L.; Choi, I.; Ji, H.; Chung, Y.S.; Choi, M.-S.; Moon, J.-K.; Kim, K.-H. High Throughput Phenotyping for Various Traits on Soybean Seeds Using Image Analysis. Sensors 2020, 20, 248. [Google Scholar] [CrossRef]
- Vollmann, J.; Walter, H.; Sato, T.; Schweiger, P. Digital image analysis and chlorophyll metering for phenotyping the effects of nodulation in soybean. Comput. Electron. Agric. 2011, 75, 190–195. [Google Scholar] [CrossRef]



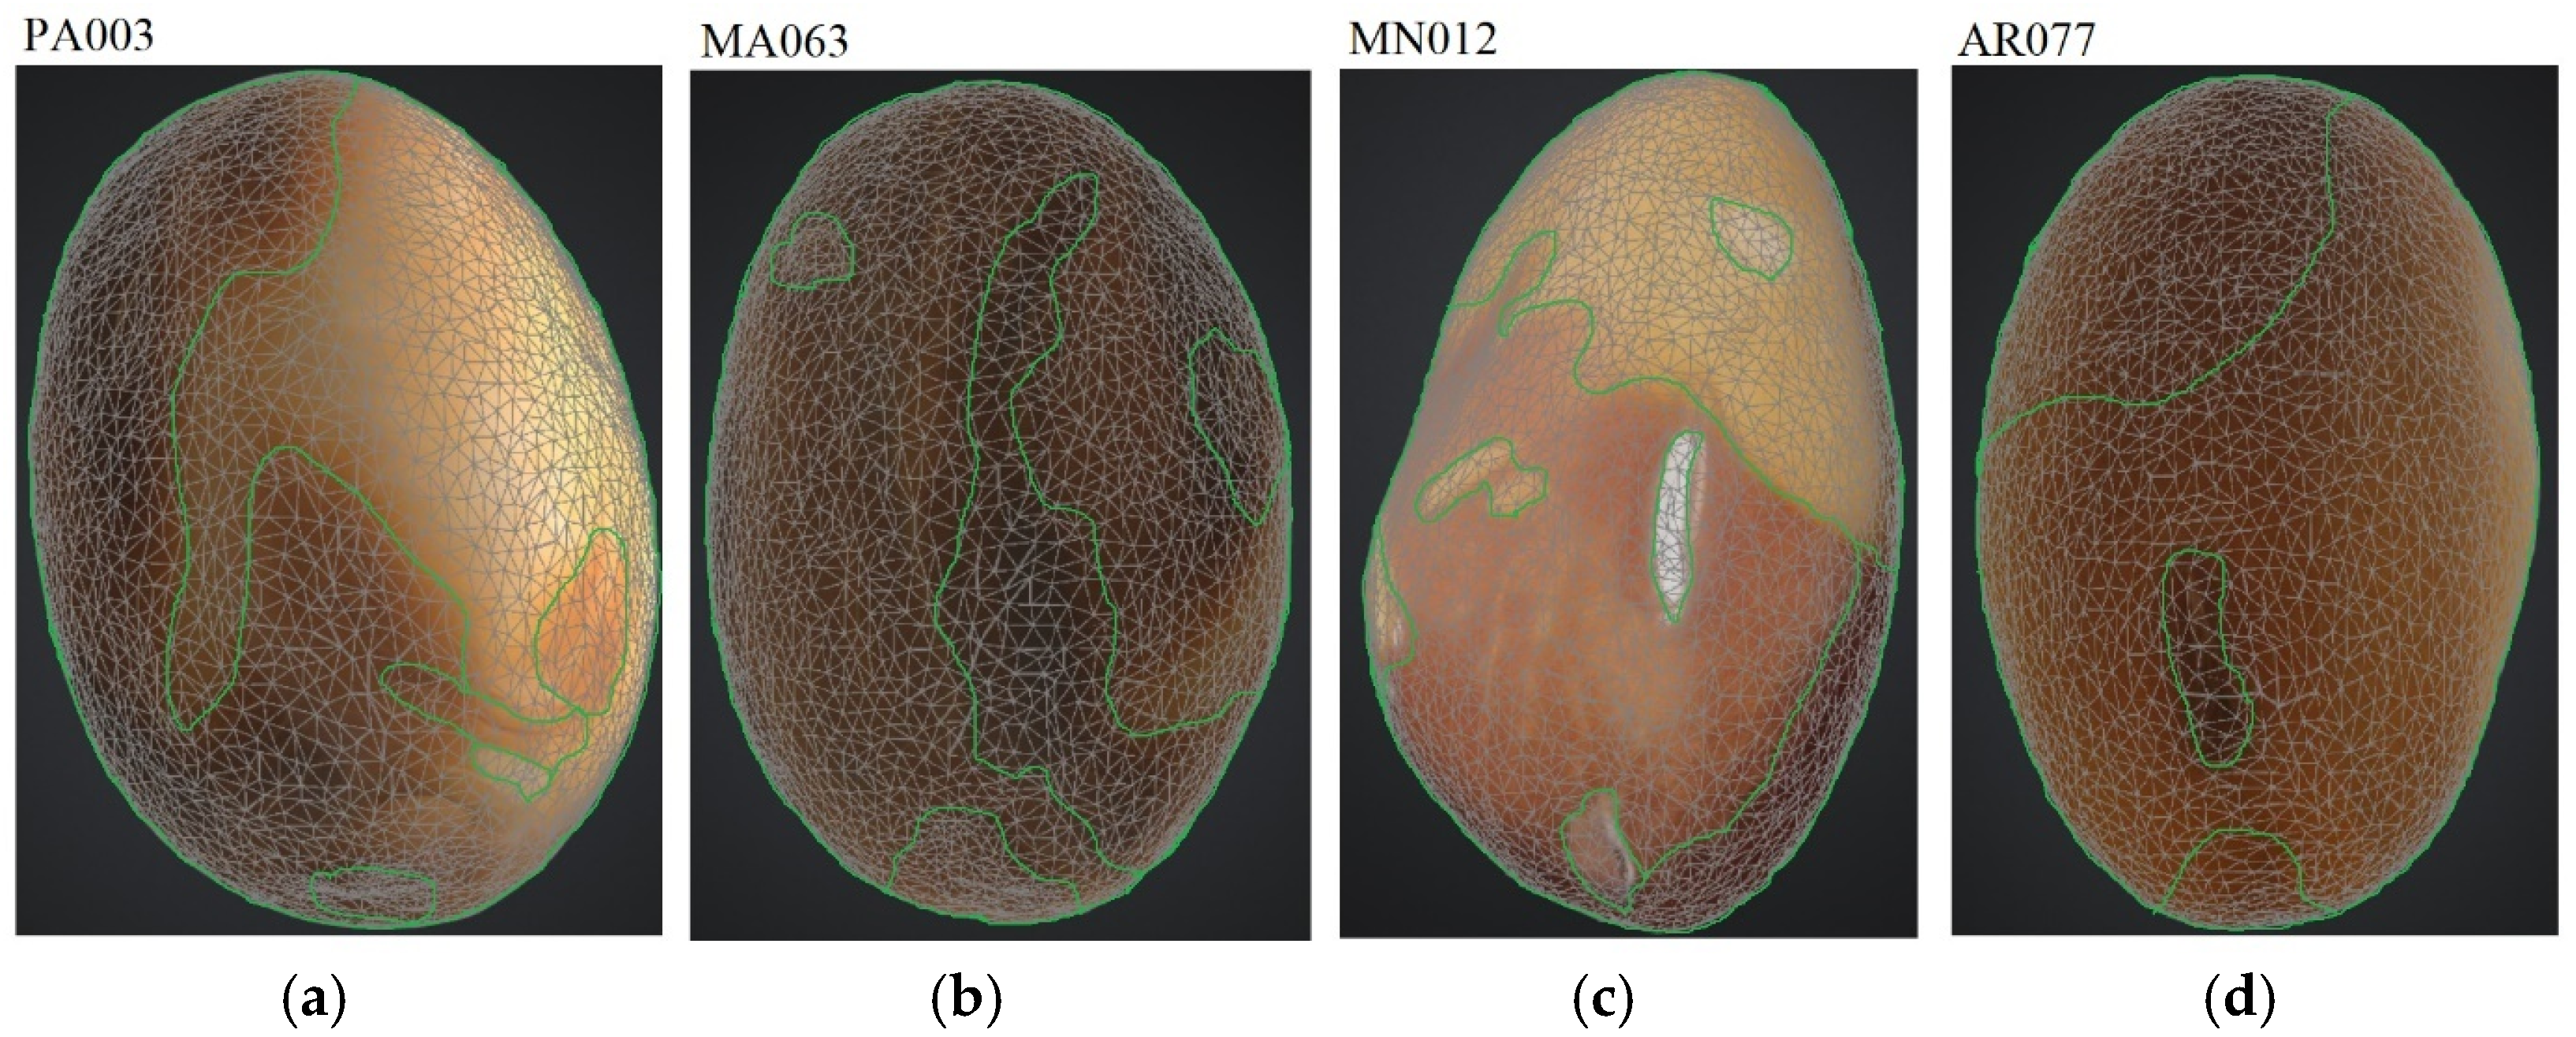
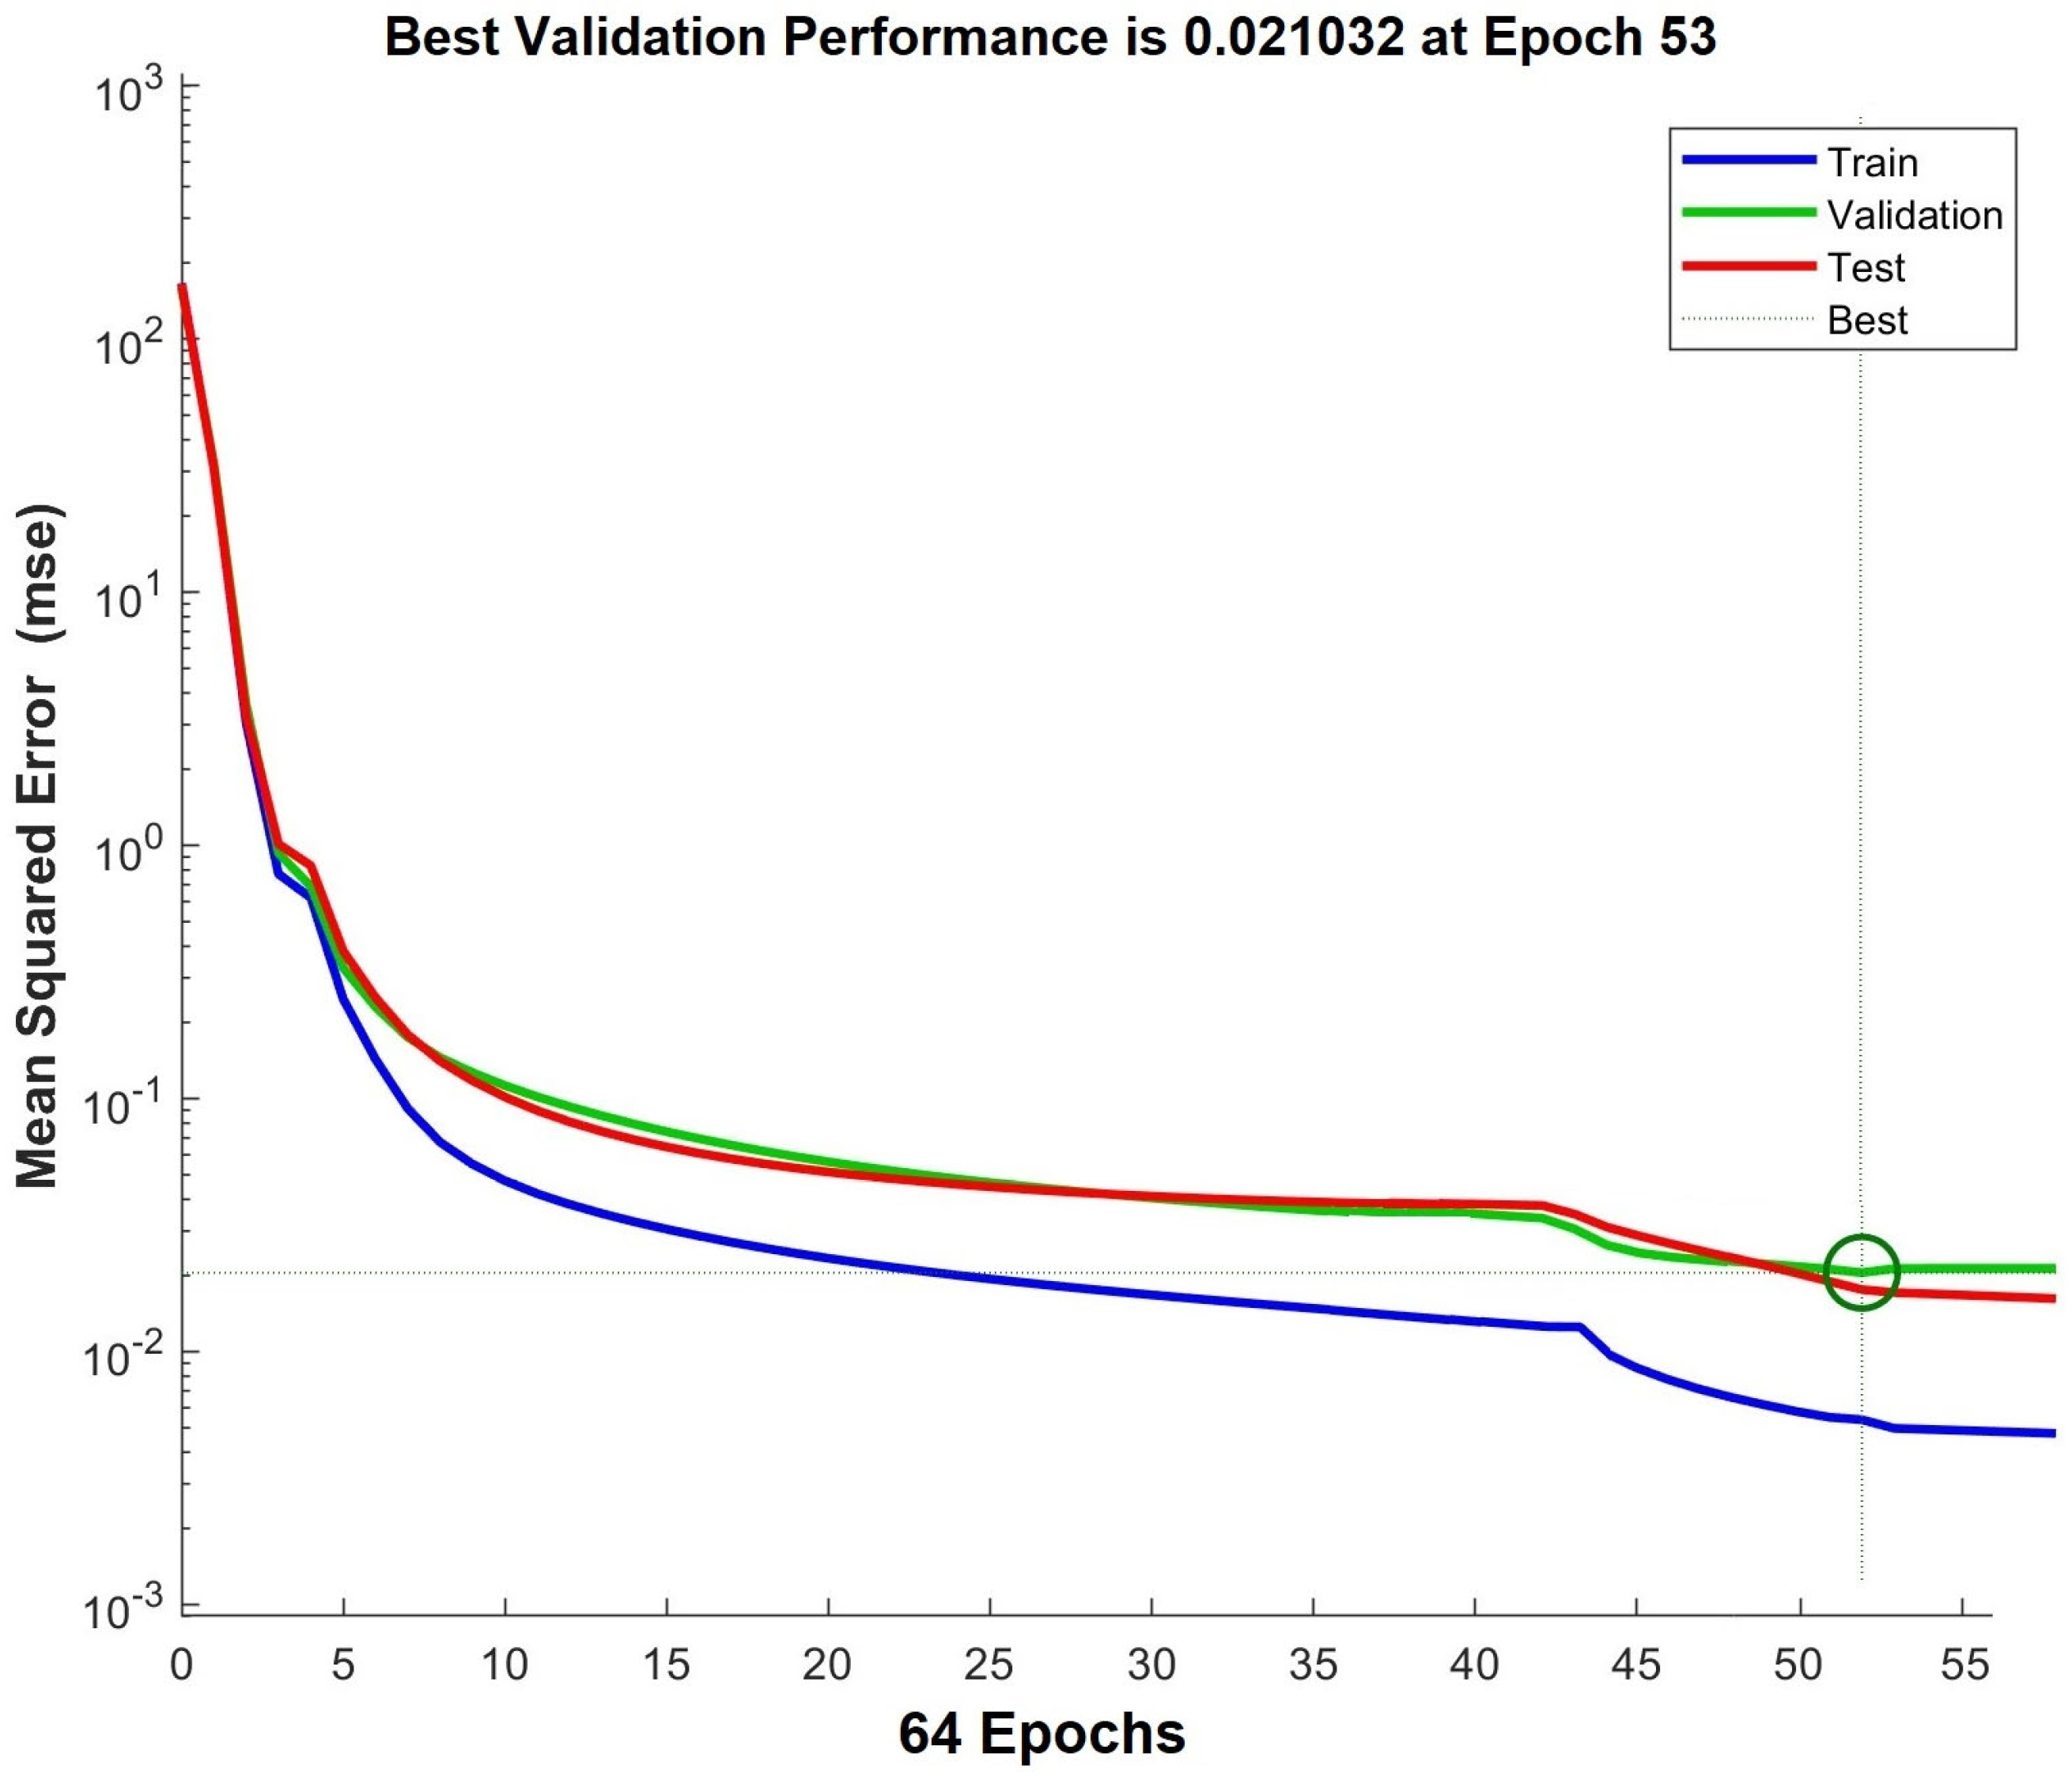
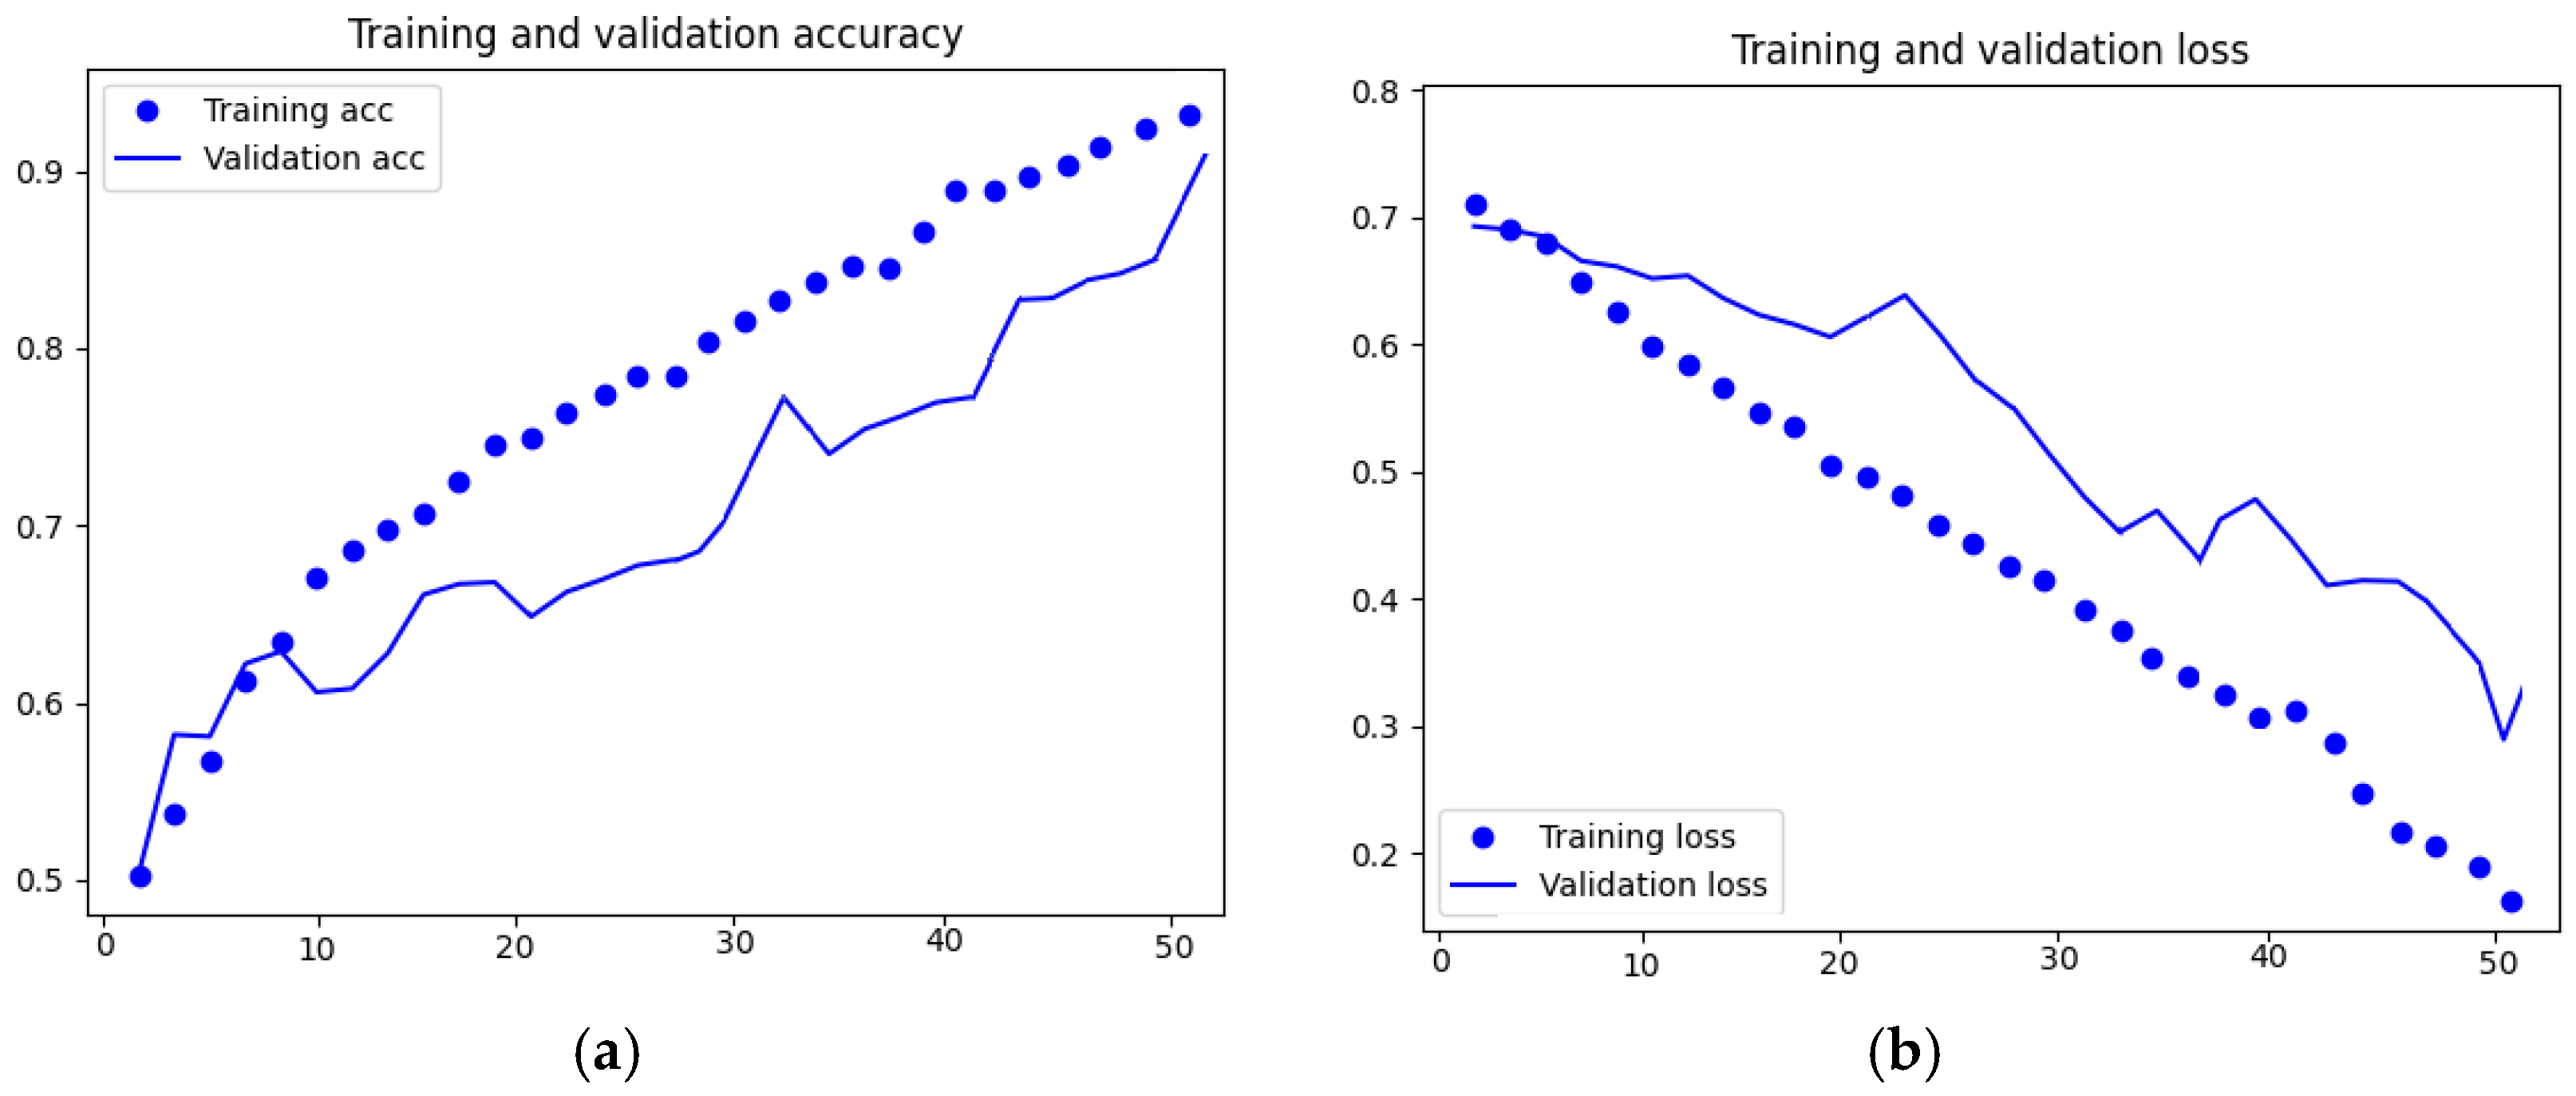

| No. | Variety | Seed Maturity | Plant Height | Height of the First Pod | Color of Seed Coat | Type of Seed Coat Coloration | Marker Color/ Shape | Total Protein | TSW |
|---|---|---|---|---|---|---|---|---|---|
| Days | cm | cm | - | - | - | % s. m. | g | ||
| 1 | Aligator | 130–140 | 60.0–81.7 | 10.7–12.3 | dark cream | uniform | brown/ oblong | 33.8 | 180.0 |
| 2 | Fiskeby | 121–137 | 33.5–37.7 | 9.3–10.6 | dark cream | spotted | brown/ irregular | 41.0 | 171.0 |
| 3 | Mavka | 120–132 | 80.0–110.0 | 15.2–21.2 | light cream | spotted | light yellow/ narrow regular | 32.9 | 182.3 |
| 4 | Merlin | 130–137 | 80.0–95.0 | 9.0–11.4 | dark cream | spotted | brown/ irregular | 32.2 | 165.0 |
| 5 | Petrina | 265–280 | 110.5–126.0 | 14.3–18.0 | cream | spotted | brown/ oblong | 25.9 | 155.4 |
| Code | Variety | Length | Width | Thickness | Length of Marker | Width of Marker | Seed Mass | Discoloration of Seeds |
|---|---|---|---|---|---|---|---|---|
| mm | mm | mm | mm | mm | g | - | ||
| AR001 | Aligator | 7.25 | 5.38 | 3.59 | 2.03 | 1.52 | 0.1570 | none |
| AR002 | 7.07 | 5.58 | 2.74 | 2.55 | 1.02 | 0.1898 | none | |
| … | … | … | … | … | … | … | … | |
| AR099 | 5.99 | 3.87 | 3.03 | 1.18 | 1.79 | 0.2366 | none | |
| AR100 | 8.01 | 5.60 | 3.45 | 1.61 | 1.51 | 0.1504 | none | |
| FY001 | Fiskeby | 6.94 | 5.39 | 3.92 | 3.91 | 1.27 | 0.2197 | none |
| FY002 | 8.32 | 4.03 | 4.04 | 1.59 | 2.21 | 0.2236 | none | |
| … | … | … | … | … | … | … | … | |
| FY099 | 7.97 | 5.82 | 4.02 | 1.55 | 1.66 | 0.1576 | none | |
| FY100 | 8.43 | 6.05 | 3.47 | 4.27 | 2.38 | 0.1860 | none | |
| MA001 | Mavka | 7.09 | 4.21 | 3.69 | 1.97 | 1.15 | 0.1734 | light brown |
| MA002 | 5.74 | 3.71 | 3.10 | 1.36 | 2.07 | 0.2220 | light brown | |
| … | … | … | … | … | … | … | … | |
| MA099 | 7.23 | 3.82 | 4.10 | 1.18 | 1.79 | 0.2320 | light brown | |
| MA100 | 5.35 | 5.41 | 2.65 | 1.61 | 1.51 | 0.1664 | light brown | |
| MN001 | Merlin | 6.32 | 3.91 | 3.45 | 3.91 | 1.27 | 0.1570 | dark brown |
| MN002 | 6.15 | 4.48 | 2.79 | 1.59 | 2.21 | 0.1898 | dark brown | |
| … | … | … | … | … | … | … | … | |
| MN099 | 7.30 | 4.40 | 2.73 | 1.55 | 1.66 | 0.2366 | dark brown | |
| MN100 | 7.39 | 4.77 | 3.24 | 4.27 | 2.38 | 0.1504 | dark brown | |
| PA001 | Petrina | 8.07 | 4.98 | 3.35 | 1.97 | 1.15 | 0.2197 | dark brown |
| PA002 | 6.11 | 4.05 | 3.41 | 1.36 | 2.07 | 0.2236 | none | |
| … | … | … | … | … | … | … | … | |
| PA099 | 6.88 | 4.52 | 3.05 | 1.18 | 1.79 | 0.1576 | dark brown | |
| PA100 | 5.74 | 4.88 | 2.70 | 1.61 | 1.51 | 0.1860 | light brown |
| No. | Symbol | Description | Unit |
|---|---|---|---|
| 1 | A* | seed surface area determined using 3D scanner | mm2 |
| 2 | Ag | seed surface area calculated based on Equation (1) | mm2 |
| 3 | A | seed surface area calculated using Equation (2) | mm2 |
| 4 | Dg* | equivalent diameter calculated based on measurements from the 3D model replacement diameter calculated based on measurements of the 3D model | mm |
| 5 | Dg | equivalent diameter | mm |
| 6 | L | seed length | mm |
| 7 | L* | seed length determined based on the 3D model | mm |
| 8 | Lm | half the sum of the width and length of the seed | mm |
| 9 | m | seed mass | g |
| 10 | m* | mass of 3D model seeds | g |
| 11 | N | sample size | No. |
| 12 | Ra* | shape coefficient calculated based on measurements of the 3D model | % |
| 13 | Ra | shape coefficient | % |
| 14 | T | thickness of seed | mm |
| 15 | T* | seed thickness determined based on the 3D model | mm |
| 16 | U | seed length-dependent coefficient factor dependent on the length of soybean seeds | - |
| 17 | W | seed width | mm |
| 18 | W* | seed width determined based on a 3D model | mm |
| 19 | V* | seed volume determined using a 3D scanner | mm3 |
| 20 | Vg | seed volume calculated using the formula | mm3 |
| 21 | φ | seed sphericity coefficient | % |
| 22 | φ* | seed sphericity coefficient calculated based on 3D model measurements | % |
| Variable | L | L* | W | W* | T | T* | Dg | Dg* | Ra | Ra* | φ | φ* | A | Ag | A* | Vg | V* | m |
|---|---|---|---|---|---|---|---|---|---|---|---|---|---|---|---|---|---|---|
| mm | mm | mm | mm | mm | mm | mm | mm | - | - | - | - | mm2 | mm2 | mm2 | mm3 | mm3 | g | |
| Aligator | ||||||||||||||||||
| Min. | 5.26 | 5.14 | 3.60 | 3.71 | 2.59 | 2.67 | 3.66 | 3.71 | 0.68 | 0.66 | 0.70 | 0.69 | 42.4 | 42.1 | 43.1 | 25.7 | 26.6 | 0.1493 |
| Max. | 8.04 | 8.27 | 5.79 | 5.96 | 4.17 | 4.30 | 5.79 | 5.96 | 0.72 | 0.73 | 0.72 | 0.72 | 106.1 | 105.3 | 111.6 | 101.7 | 110.9 | 0.2685 |
| Average | 6.47 | 6.60 | 4.62 | 4.76 | 3.33 | 3.43 | 4.64 | 4.76 | 0.71 | 0.70 | 0.71 | 0.70 | 68.4 | 67.5 | 71.1 | 52.1 | 56.4 | 0.2207 |
| Standard deviation | 0.91 | 1.04 | 0.73 | 0.75 | 0.53 | 0.54 | 0.74 | 0.73 | 0.72 | 0.71 | 0.72 | 0.71 | 0.71 | 0.72 | 0.71 | 0.72 | 0.71 | 0.0325 |
| Variation coefficient | 14.09 | 15.78 | 15.66 | 15.82 | 15.78 | 14.44 | 15.66 | 15.71 | 15.33 | 15.26 | 15.13 | 15.21 | 15.23 | 15.11 | 15.22 | 15.11 | 15.22 | 14.720 |
| Fiskeby | ||||||||||||||||||
| Min. | 5.77 | 5.65 | 3.96 | 4.07 | 2.85 | 2.94 | 4.02 | 4.07 | 0.67 | 0.68 | 0.71 | 0.69 | 50.1 | 50.8 | 52.1 | 34.1 | 35.4 | 0.2186 |
| Max. | 8.55 | 8.78 | 6.15 | 6.33 | 4.43 | 4.56 | 6.15 | 6.33 | 0.71 | 0.73 | 0.73 | 0.73 | 111.4 | 118.8 | 125.8 | 121.9 | 132.8 | 0.2950 |
| Average | 6.98 | 7.11 | 4.98 | 5.13 | 3.59 | 3.70 | 5.00 | 5.13 | 0.70 | 0.71 | 0.71 | 0.71 | 77.2 | 78.4 | 82.5 | 65.3 | 70.5 | 0.2602 |
| Standard deviation | 0.91 | 1.05 | 0.73 | 0.75 | 0.52 | 0.55 | 0.71 | 0.72 | 0.70 | 0.72 | 0.71 | 0.72 | 0.71 | 0.72 | 0.71 | 0.72 | 0.71 | 0.0216 |
| Variation coefficient | 13.06 | 14.45 | 14.71 | 14.44 | 14.66 | 14.87 | 14.72 | 14.52 | 9.21 | 9.21 | 15.32 | 15.21 | 10.26 | 10.11 | 8.21 | 9.11 | 8.89 | 8.2980 |
| Mavka | ||||||||||||||||||
| Min. | 5.27 | 5.15 | 3.61 | 3.71 | 2.60 | 2.68 | 3.67 | 3.71 | 0.69 | 0.68 | 0.69 | 0.70 | 43.1 | 42.3 | 43.3 | 25.8 | 26.8 | 0.1900 |
| Max. | 8.05 | 8.28 | 5.80 | 5.97 | 4.18 | 4.30 | 5.80 | 5.97 | 0.75 | 0.76 | 0.72 | 0.74 | 110.5 | 105.6 | 111.9 | 102.0 | 111.3 | 0.2663 |
| Average | 6.48 | 6.61 | 4.63 | 4.77 | 3.34 | 3.44 | 4.64 | 4.77 | 0.73 | 0.73 | 0.71 | 0.72 | 69.3 | 67.7 | 71.3 | 52.4 | 56.6 | 0.2284 |
| Standard deviation | 0.91 | 1.06 | 0.74 | 0.75 | 0.54 | 0.53 | 0.75 | 0.76 | 0.72 | 0.71 | 0.72 | 0.71 | 0.71 | 0.72 | 0.71 | 0.72 | 0.71 | 0.0244 |
| Variation coefficient | 14.06 | 15.76 | 14.56 | 15.99 | 15.76 | 15.54 | 14.57 | 14.55 | 15.33 | 15.26 | 15.11 | 14.99 | 15.21 | 15.44 | 15.24 | 10.14 | 10.21 | 10.679 |
| Merlin | ||||||||||||||||||
| Min. | 5.01 | 5.10 | 3.57 | 3.68 | 2.57 | 2.65 | 3.58 | 3.68 | 0.65 | 0.66 | 0.68 | 0.70 | 41.2 | 40.3 | 42.5 | 24.1 | 26.0 | 0.1454 |
| Max. | 8.01 | 7.77 | 5.44 | 5.60 | 3.92 | 3.93 | 5.55 | 5.60 | 0.70 | 0.73 | 0.72 | 0.73 | 96.1 | 96.7 | 98,5 | 89.4 | 92.0 | 0.2184 |
| Average | 6.55 | 6.50 | 4.55 | 4.69 | 3.28 | 3.38 | 4.61 | 4.69 | 0.69 | 0.70 | 0.70 | 0.71 | 67.2 | 66.7 | 69.0 | 51.3 | 54.0 | 0.1850 |
| Standard deviation | 0.99 | 0.85 | 0.60 | 0.62 | 0.43 | 0.44 | 0.61 | 0.63 | 0.70 | 0.7 | 0.72 | 0.71 | 0.71 | 0.72 | 0.71 | 0.72 | 0.71 | 0.0224 |
| Variation coefficient | 12.18 | 13.12 | 13.13 | 13.22 | 13.17 | 13.24 | 13.15 | 13.34 | 13.11 | 14.21 | 12.12 | 13.21 | 12.09 | 12.05 | 12.25 | 12.15 | 12.15 | 12.095 |
| Petrina | ||||||||||||||||||
| Min. | 5.04 | 5.11 | 3.58 | 3.38 | 2.58 | 2.66 | 3.59 | 3.67 | 0.68 | 0.67 | 0.68 | 0.67 | 42.1 | 40.5 | 42.6 | 24.2 | 26.2 | 0.1219 |
| Max. | 8.20 | 7.78 | 5.45 | 5.61 | 3.93 | 4.04 | 5.56 | 5.61 | 0.74 | 0.73 | 0.72 | 0.70 | 97.2 | 96.9 | 98.8 | 89.8 | 92.4 | 0.2326 |
| Average | 6.56 | 6.51 | 4.56 | 4.70 | 3.29 | 3.39 | 4.62 | 4.70 | 0.71 | 0.71 | 0.71 | 0.69 | 67.2 | 66.9 | 69.3 | 51.5 | 54.2 | 0.1810 |
| Standard deviation | 0.99 | 0.86 | 0.60 | 0.61 | 0.43 | 0.44 | 0.60 | 0.61 | 0.69 | 0.71 | 0.72 | 0.70 | 0.71 | 0.72 | 0.71 | 0.72 | 0.71 | 0.0322 |
| Variation coefficient | 15.16 | 15.11 | 17.11 | 17.63 | 13.21 | 13.12 | 16.12 | 13.15 | 16.21 | 16.11 | 16.03 | 16.01 | 16.24 | 16.14 | 15.89 | 16.24 | 15.29 | 17.772 |
| Layer (Type) | Output Shape | Param. |
|---|---|---|
| conv3d (Conv3D) | (None, 1, 1, 198, 198, 32) | 8900 |
| max_pooling3d (MaxPooling3D) | (None, 1, 1, 179, 179, 32) | 0 |
| dropout (Dropout) | (None, 1, 1, 179, 179, 32) | 0 |
| conv3d_1 (Conv3D) | (None, 1, 1, 117, 117, 32) | 184,060 |
| max_pooling3d_1 (MaxPooling3D) | (None, 1, 1, 98, 98, 32) | 0 |
| dropout_1 (Dropout) | (None, 1, 1, 98, 98, 32) | 0 |
| conv3d_2 (Conv3D) | (None, 1, 1, 66, 66, 64) | 1,030,560 |
| max_pooling3d_2 (MaxPooling3D) | (None, 1, 1, 43, 43, 64) | 0 |
| dropout_2 (Dropout) | (None, 1, 1, 43, 43, 64) | 0 |
| conv3d_3 (Conv3D) | (None, 1, 1, 41, 41, 64) | 6,075,040 |
| max_pooling2d_3 (MaxPooling3D) | (None, 1, 1, 30, 30, 64) | 0 |
| dropout_3 (Dropout) | (None, 1, 1, 30, 30, 64) | 0 |
| conv3d_4 (Conv3D) | (None, 1, 1, 24, 24, 128) | 10,102,620 |
| max_pooling2d_4 (MaxPooling3D) | (None, 1, 1, 17, 17, 128) | 0 |
| dropout_4 (Dropout) | (None, 1, 1, 17, 17, 128) | 0 |
| conv3d_5 (Conv3D) | (None, 1, 1, 21, 21, 128) | 60,068,620 |
| max_pooling2d_5 (MaxPooling3D) | (None, 1, 1, 10, 10, 128) | 0 |
| dropout_5 (Dropout) | (None, 1, 1, 10, 10, 128) | 0 |
| conv2d_6 (Conv3D) | (None, 1, 1, 19, 19, 128) | 80,840,010 |
| max_pooling3d_6 (MaxPooling3D) | (None, 1, 1, 7, 7, 128) | 0 |
| dropout_6 (Dropout) | (None, 1, 1, 7, 7, 128) | 0 |
| flatten (Flatten) | (None, 1, 1, 12,800) | 0 |
| dense (Dense) | (None, 1, 1, 512) | 90,561,020 |
| Code | Length | Length Precision | Width | Width Precision | Thickness | Thickness Precision | Length of Marker | Precision of Marker Length | Width of Marker | Precision of Marker Width |
|---|---|---|---|---|---|---|---|---|---|---|
| mm | % | mm | % | mm | % | mm | % | mm | % | |
| AR001 | 7.53 | 96.28 | 5.23 | 97.21 | 3.73 | 96.25 | 2.80 | 72.50 | 1.60 | 95.02 |
| AR002 | 7.78 | 90.87 | 5.41 | 96.95 | 2.94 | 93.20 | 3.09 | 82.52 | 1.32 | 77.27 |
| … | … | … | … | … | … | … | … | … | … | … |
| AR099 | 5.61 | 93.66 | 5.38 | 71.93 | 3.82 | 79.32 | 1.50 | 78.67 | 2.03 | 88.18 |
| AR100 | 7.70 | 96.13 | 4.59 | 81.96 | 2.72 | 78.84 | 2.01 | 80.50 | 1.72 | 87.79 |
| FY001 | 7.53 | 92.16 | 4.7 | 87.20 | 4.06 | 96.55 | 4.58 | 85.37 | 1.72 | 73.84 |
| FY002 | 6.04 | 72.60 | 4.17 | 96.64 | 3.45 | 85.40 | 2.82 | 56.38 | 2.66 | 83.08 |
| … | … | … | … | … | … | … | … | … | … | … |
| FY099 | 6.54 | 82.06 | 4.29 | 73.71 | 4.47 | 89.93 | 2.34 | 66.24 | 1.81 | 91.71 |
| FY100 | 7.29 | 86.48 | 5.95 | 98.35 | 2.99 | 86.17 | 4.38 | 97.49 | 2.45 | 97.14 |
| MA001 | 7.93 | 89.41 | 4.70 | 89.57 | 2.98 | 80.76 | 2.31 | 85.28 | 1.32 | 87.12 |
| MA002 | 7.95 | 72.20 | 4.57 | 81.18 | 3.47 | 89.34 | 1.42 | 95.77 | 2.10 | 98.57 |
| … | … | … | … | … | … | … | … | … | … | … |
| MA099 | 5.71 | 78.98 | 5.44 | 70.22 | 3.40 | 82.93 | 1.23 | 95.93 | 1.86 | 96.24 |
| MA100 | 7.97 | 67.13 | 5.50 | 98.36 | 3.72 | 71.24 | 1.79 | 89.94 | 1.66 | 90.96 |
| MN001 | 7.88 | 80.20 | 5.04 | 77.58 | 3.56 | 96.91 | 4.21 | 92.87 | 1.54 | 82.47 |
| MN002 | 6.47 | 95.05 | 5.12 | 87.50 | 2.88 | 96.88 | 1.99 | 79.90 | 2.66 | 83.08 |
| … | … | … | … | … | … | … | … | … | … | … |
| MN099 | 7.41 | 98.52 | 4.21 | 95.68 | 2.82 | 96.81 | 1.80 | 86.11 | 1.68 | 98.81 |
| MN100 | 5.44 | 73.61 | 4.98 | 95.78 | 3.34 | 97.01 | 4.30 | 99.30 | 3.38 | 70.41 |
| PA001 | 6.37 | 78.93 | 5.52 | 90.22 | 3.69 | 90.79 | 2.62 | 75.19 | 1.48 | 77.70 |
| PA002 | 7.93 | 77.05 | 4.13 | 98.06 | 3.01 | 88.27 | 1.85 | 73.51 | 2.30 | 90.00 |
| … | … | … | … | … | … | … | … | … | … | … |
| PA099 | 7.54 | 91.25 | 4.68 | 96.58 | 3.35 | 91.04 | 1.55 | 76.13 | 1.97 | 90.86 |
| PA100 | 6.05 | 94.88 | 3.87 | 79.30 | 3.62 | 74.59 | 2.02 | 79.70 | 1.60 | 94.38 |
| Average | 85.37 | --- | 88.20 | --- | 88.11 | --- | 82.47 | --- | 87.73 | |
| Metrics | Training Set | Test Set | Validation Set |
|---|---|---|---|
| SS | 0.1332 | 1.4355 | 1.3778 |
| MAE | 0.0022 | 0.0185 | 0.0399 |
| MSE | 0.0017 | 0.0181 | 0.0365 |
| RMS | 0.0677 | 0.1421 | 0.1466 |
| R2 | 0.9410 | 0.9599 | 0.9997 |
| SDR | 0.0053 | 0.0277 | 0.0497 |
| GE | 0.0992 |
| Classification Type | ACC | PPV | TPR | fscore | Average Classification Time GPU* |
|---|---|---|---|---|---|
| % | % | % | % | ms/Model | |
| Geometric parameters of seeds | 89.33 | 89.79 | 88.74 | 91.87 | 7.32 |
| Discoloration of seeds | 91.31 | 90.87 | 90.76 | 92.54 | 5.54 |
| Discoloration and geometric parameters of seeds | 91.78 | 92.67 | 93.87 | 94.78 | 8.78 |
| Studies | Utilized Method | Utilized Equipment | Dataset | Overall Accuracy |
|---|---|---|---|---|
| [53] | point cloud method | UAV-based RGB imaging system | 70.922 plant images | 71.20–96.00% |
| [54] | AI-based classification models | Tesla V100 GPU with 32 GB video random access memory (VRAM) | 2.138 images | 58.34% |
| [56] | deep learning convolutional neural networks (DCNNs) | RGB image | 14 classes of seeds | 95.00% |
| [57] | YOLO-V5 | UAV-based RGB imaging system | 125 images | 92.34%. |
| [58] | least-squares method (LSM) and Hough transform | digital imaging technology DJI Phantom 4 | 180 RGB plant images | 93.54% |
| [88] | high-throughput analysis method | RGB image | 39,065 seed images | 97.00% |
| [89] | regression analysis | RGB image | 1000 seed images | 93.70% |
Disclaimer/Publisher’s Note: The statements, opinions and data contained in all publications are solely those of the individual author(s) and contributor(s) and not of MDPI and/or the editor(s). MDPI and/or the editor(s) disclaim responsibility for any injury to people or property resulting from any ideas, methods, instructions or products referred to in the content. |
© 2025 by the authors. Licensee MDPI, Basel, Switzerland. This article is an open access article distributed under the terms and conditions of the Creative Commons Attribution (CC BY) license (https://creativecommons.org/licenses/by/4.0/).
Share and Cite
Rybacki, P.; Bahcevandziev, K.; Jarquin, D.; Kowalik, I.; Osuch, A.; Osuch, E.; Niemann, J. Three-Dimensional Convolutional Neural Networks (3D-CNN) in the Classification of Varieties and Quality Assessment of Soybean Seeds (Glycine max L. Merrill). Agronomy 2025, 15, 2074. https://doi.org/10.3390/agronomy15092074
Rybacki P, Bahcevandziev K, Jarquin D, Kowalik I, Osuch A, Osuch E, Niemann J. Three-Dimensional Convolutional Neural Networks (3D-CNN) in the Classification of Varieties and Quality Assessment of Soybean Seeds (Glycine max L. Merrill). Agronomy. 2025; 15(9):2074. https://doi.org/10.3390/agronomy15092074
Chicago/Turabian StyleRybacki, Piotr, Kiril Bahcevandziev, Diego Jarquin, Ireneusz Kowalik, Andrzej Osuch, Ewa Osuch, and Janetta Niemann. 2025. "Three-Dimensional Convolutional Neural Networks (3D-CNN) in the Classification of Varieties and Quality Assessment of Soybean Seeds (Glycine max L. Merrill)" Agronomy 15, no. 9: 2074. https://doi.org/10.3390/agronomy15092074
APA StyleRybacki, P., Bahcevandziev, K., Jarquin, D., Kowalik, I., Osuch, A., Osuch, E., & Niemann, J. (2025). Three-Dimensional Convolutional Neural Networks (3D-CNN) in the Classification of Varieties and Quality Assessment of Soybean Seeds (Glycine max L. Merrill). Agronomy, 15(9), 2074. https://doi.org/10.3390/agronomy15092074


