Article

Crop Health Assessment from Predicted AGB and NPK Derived from UAV Spectral Indices and Machine Learning Techniques

Department of Civil Engineering, National Institute of Technology, Warangal 506004, India
*
Author to whom correspondence should be addressed.
Agronomy 2025, 15(9), 2059; https://doi.org/10.3390/agronomy15092059
Submission received: 15 June 2025 / Revised: 24 July 2025 / Accepted: 18 August 2025 / Published: 27 August 2025

Abstract

Crop health assessment is essential for the early detection of nutrient deficiencies, diseases, and pests, allowing for timely interventions that optimize yield, reduce losses, and support sustainable agricultural practices. While traditional methods and satellite-based remote sensing offer broad scale monitoring, they often suffer from coarse spatial resolution, and insufficient precision at the plant level. These limitations hinder accurate and dynamic assessment of crop health, particularly for high-resolution applications such as nutrient diagnosis during different crop growth stages. This study addresses these gaps by leveraging high-resolution UAV (Unmanned Aerial Vehicle) imagery to monitor the health of paddy crops across multiple temporal stages. A novel methodology was implemented to assess the crop health condition from the predicted Above-Ground Biomass (AGB) and essential macro-nutrients (N, P, K) using vegetation indices derived from UAV imagery. Four machine learning models were used to predict these parameters based on field observed data, with Random Forest (RF) and XGBoost outperforming other algorithms, achieving high regression scores (AGB > 0.92, N > 0.96, P > 0.92, K > 0.97) and low prediction errors (AGB < 80 gm/m2, N < 0.11%, P < 0.007%, K < 0.08%). A significant contribution of this study lies in the development of decision-making rules based on threshold values of AGB and specific nutrient critical, optimum, and toxic levels for the paddy crop. These rules were used to derive crop health maps from the predicted AGB and NPK values. The resulting spatial health maps, generated using RF and XGBoost models with high classification accuracy (Kappa coefficient > 0.64), visualize intra-field variability, allowing for site-specific interventions. This research contributes significantly to precision agriculture by offering a robust, plant-level monitoring approach that supports timely, site-specific nutrient management and enhances sustainable crop production practices.

1. Introduction

Crop health refers to the overall condition and vitality of a plant, and its assessment is critical for ensuring agricultural productivity and sustainability. Timely evaluation of crop health allows for early detection of issues such as nutrient deficiencies, pest infestations, diseases, and environmental stress. Such early identification enables precise, targeted interventions that prevent yield losses and ensure efficient use of resources like water, fertilizers, and pesticides [1,2]. Essential indicators of crop health include chlorophyll content, leaf area index, Above-Ground Biomass (AGB), and nutrient contents. These indicators collectively reflect the plant’s growth, physiological status, and nutritional sufficiency [3,4]. AGB indicates the total vegetative growth and is strongly correlated with crop health and yield potential [5]. Nitrogen (N) is essential for chlorophyll production and protein synthesis, influencing photosynthesis and leaf development [4]. Phosphorus (P) helps in root development, energy transfer, and flowering, making it vital for the plant to have phosphorous during early growth and reproductive stages, and potassium (K) plays a key role in water balance, enhances enzyme activity, and improves plant resistance to stress and disease [6]. Monitoring these parameters helps in identifying nutrient deficiencies or toxicities, guiding timely interventions, and enabling precision agriculture practices to optimize crop productivity and sustainability [7].
Traditionally, crop health has been assessed through field inspections, soil and tissue testing, and the use of handheld devices. However, these methods are often labor-intensive and limited in spatial and temporal resolution. In recent years, remote sensing technologies, particularly where an Unmanned Aerial Vehicle (UAV) is equipped with multispectral or hyperspectral sensors, have revolutionized crop health monitoring. Compared to satellite imagery, UAVs offer higher resolution, greater flexibility in data acquisition, and plant level monitoring capabilities [8,9,10]. By capturing detailed spectral and structural information, UAVs enable the estimation of crop biophysical characteristics like AGB and nutrient status with high accuracy.
The integration of UAV imagery, vegetation indices (VIs), and machine learning (ML) models has proven effective in monitoring crop health, particularly in estimating AGB and nutrient concentrations across various growth stages of crops [11]. Recent studies have demonstrated that combining multisource remotely sensed data enhances estimation accuracy [12,13,14]. For instance, spectral parameters from UAV imagery have demonstrated stronger correlations with rice AGB than texture-based parameters, and models built using spectral features tend to outperform those using texture features alone [5]. In rice cultivation, the use of UAV-derived VIs and canopy height data has also led to the development of the Photosynthetic Accumulation Model and its simplified version, which improve AGB estimation accuracy. Yang et al.’s [15] findings highlighted that canopy height consistently shows a stronger correlation with AGB than VIs across multiple seasons.
ML plays a crucial role in enhancing the predictive accuracy of crop health assessments. These models can handle large and complex datasets and uncover non-linear relationships between observable characteristics and physiological parameters [16,17,18,19]. ML algorithms include Random Forest (RF), Support Vector Regression (SVR), Partial Least Squares Regression (PLSR), Multiple Linear Regression (MLR), Extreme Gradient Boosting (XGBoost), and Extreme Learning Machine, all of which have been widely used to predict the various crop parameters [8,14,20,21].
In practical applications, ML models have been used to estimate both AGB and panicle biomass in rice. Cen et al. [20] demonstrated that combining UAV-based RGB and multispectral imagery in ML models significantly enhances estimation performance. Similarly, Asawapaisankul et al. [22] evaluated the relationship between UAV-derived VIs and rice yield across irrigated and non-irrigated fields. The Normalized Difference Red Edge index showed the strongest correlation with grain yield, especially in non-irrigated systems, while the Normalized Difference Vegetation Index had a moderate association with biomass [22]. By integrating these models with remotely sensed data, farmers and agronomists can generate spatial maps of AGB and NPK status, enabling early detection of nutrient deficiencies, guiding precise fertilization, and improving overall crop management [7,19].
These collective findings highlight the effectiveness of UAV-based imagery, spectral indices, and ML models in accurately predicting key crop health indicators such as AGB and nutrient concentrations. Although these tools provide valuable insights, a comprehensive model that integrates crop parameters with real-time environmental stress factors for assessing crop health is still lacking. Developing such an integrated model would further enhance decision making by providing holistic, real-time assessments of crop health [2].
The main aim of this study is to assess the health condition of a paddy crop across various growth stages of the crop from predicted AGB and NPK. Four ML algorithms were used to predict AGB and NPK using UAV spectral indices and field-sampled nutrient and AGB data. A decision framework was developed to categorize the crop health condition into eight classes based on the threshold values of AGB and recommended optimum, critical, and toxic values of NPK of the paddy crop at various growth stages. The novelty of the study is that it assessed the health condition from the crop parameters and developed decision-making rules. This will be helpful for identifying the location of the crop affected by nutrient deficiencies, imbalances, and toxicities, which is also helpful in health diagnosis in precision agriculture applications. This method enhances site-specific nutrient management practices, improves resource efficiency, and supports sustainable agricultural productivity.

2. Study Area and Methodology

2.1. Study Area

The study area of the paddy crop is located in Dharmasagar village, the Hanamkonda district of Telangana, India (Figure 1). This region sees predominantly rice-based agriculture, supported by canal irrigation from the Dharmasagar reservoir, which allows for uniform crop stages across fields, enhancing the effectiveness of UAV imagery. Additionally, the accessibility of fields and minimal tree canopy interference support efficient UAV flight operations, enabling high-resolution temporal monitoring of paddy health using vegetation indices. In this area, paddy crop transplanting started from the 10 January 2024 onwards.

2.2. Methodology

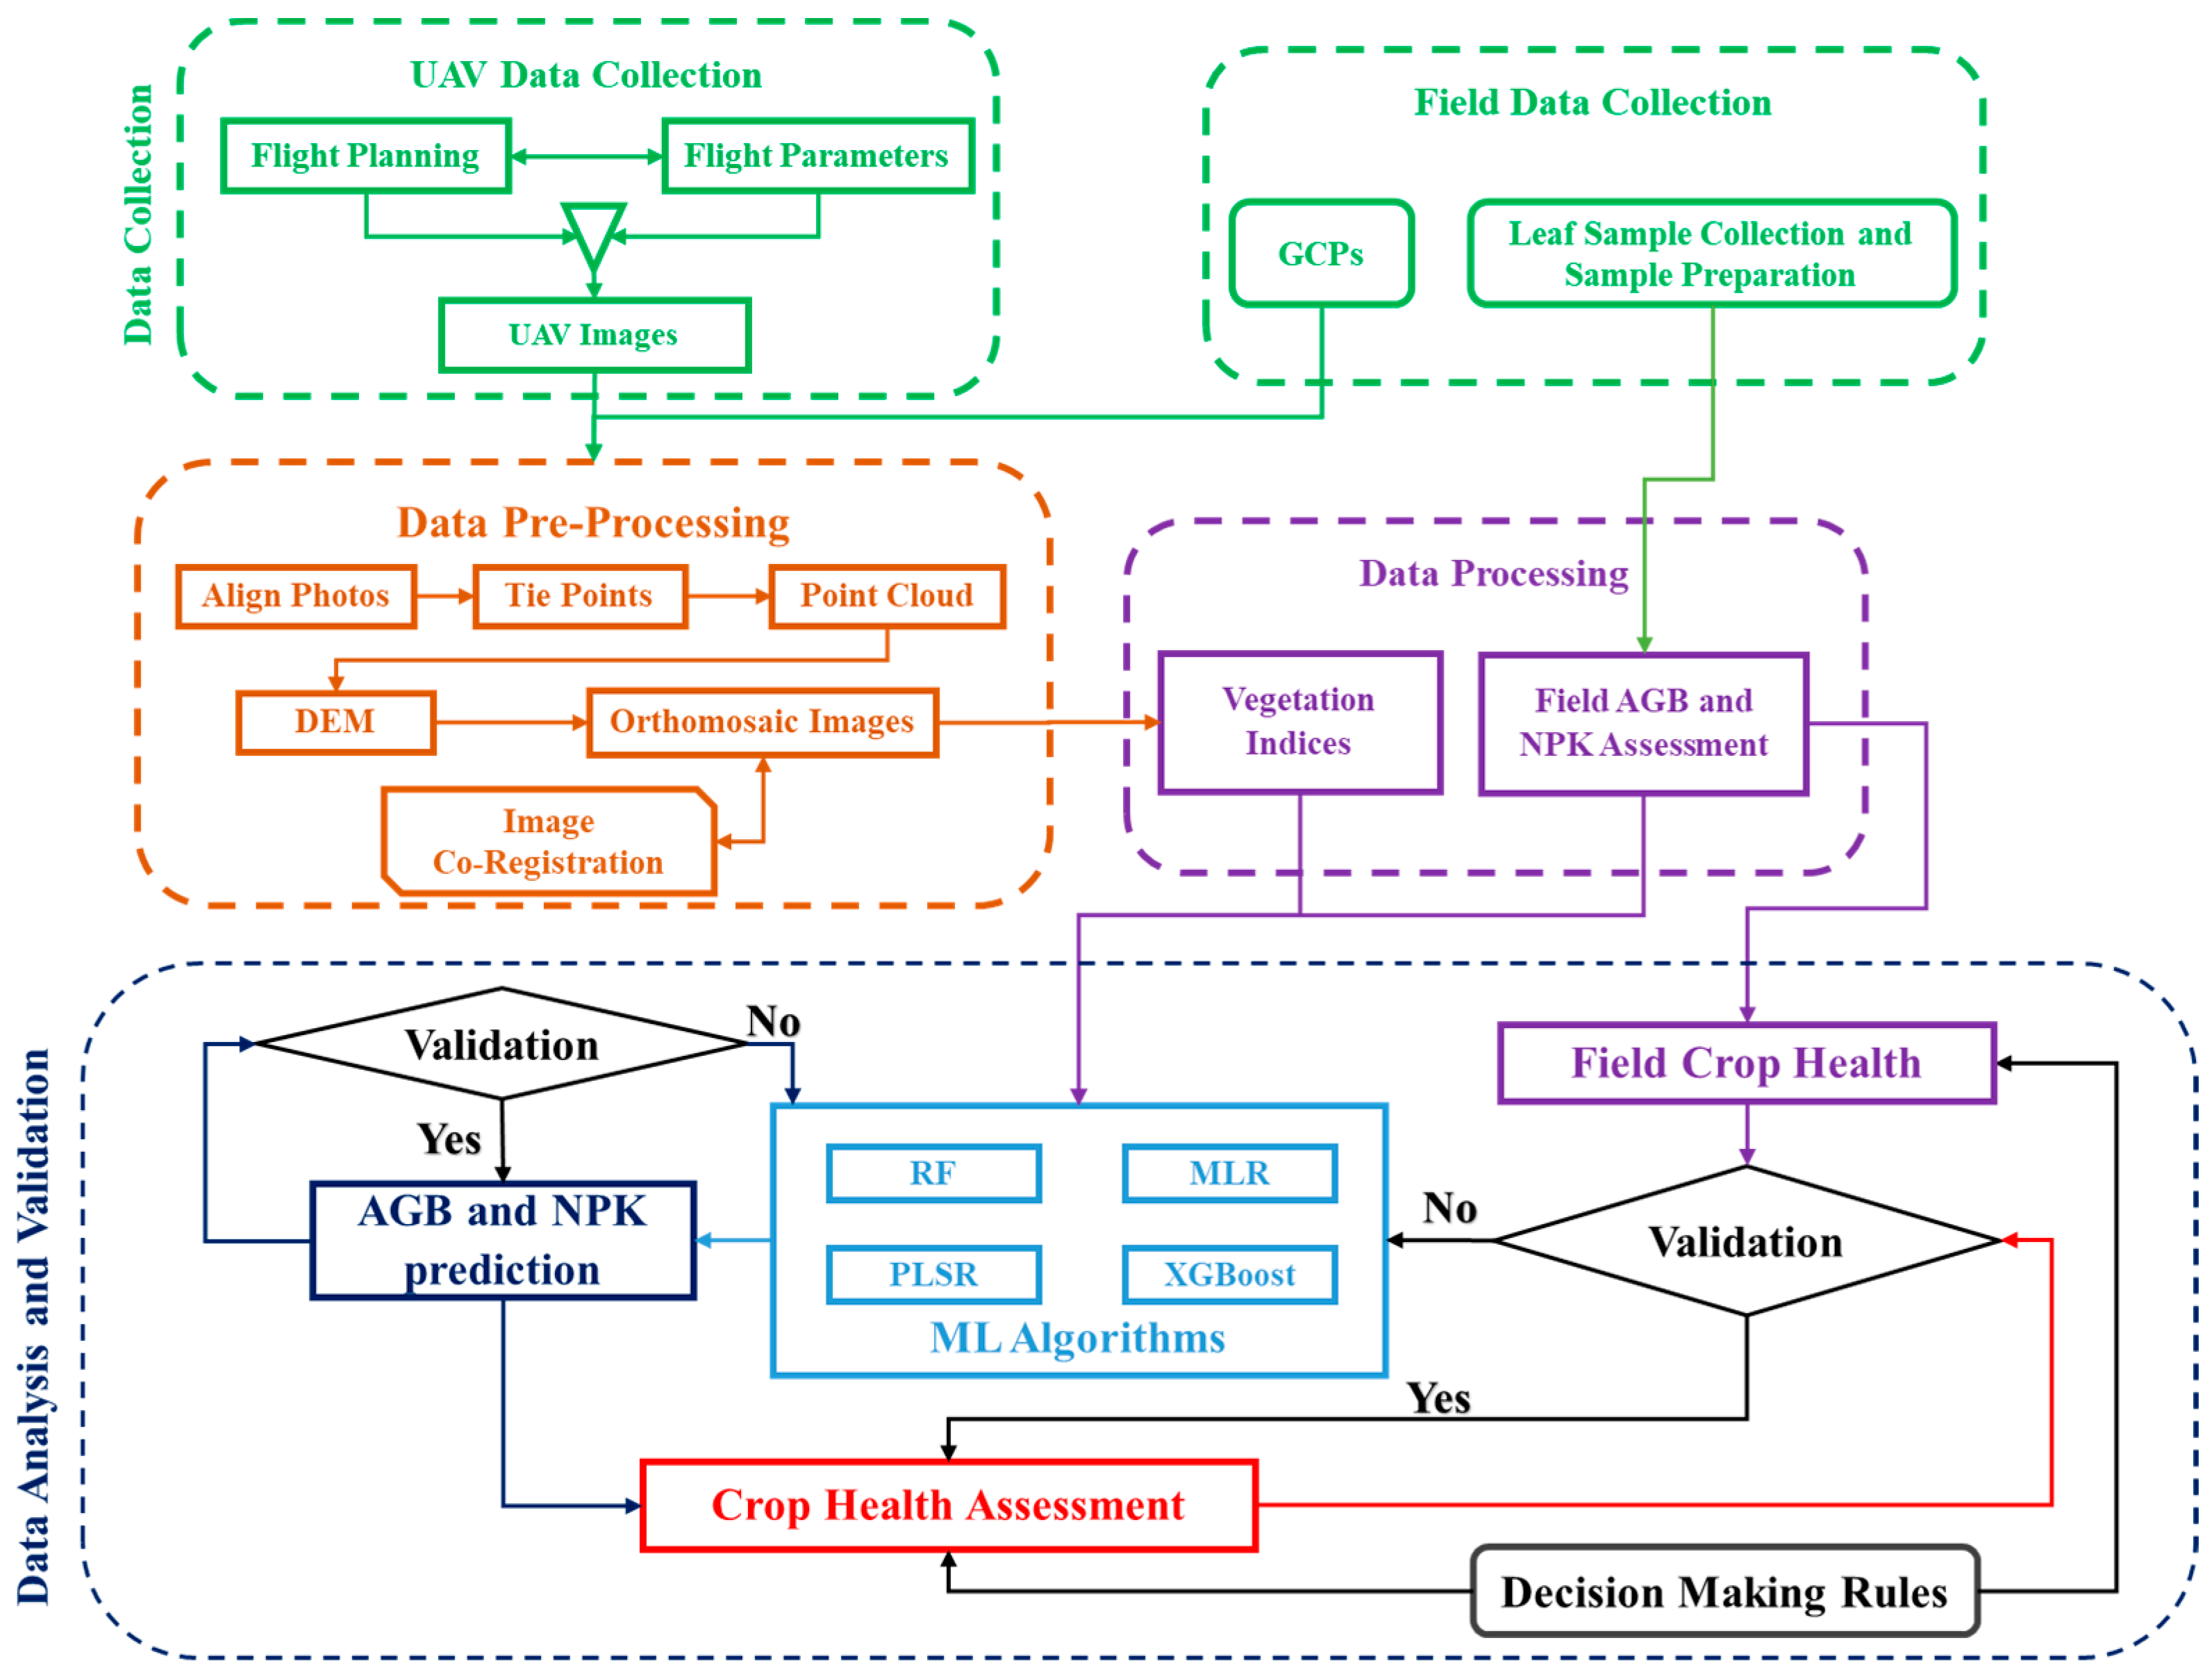
The methodological flowchart for the prediction of AGB and NPK and assessment of crop health from UAV-derived spectral indices is presented in Figure 2.

2.2.1. Data Collection

UAV Data Collection
UAV flights were conducted in the study area using the Q4i quadcopter [23] equipped with a multispectral sensor [24] to collect the data at multiple temporal dates between 10 March 2024 and 27 April 2024 at 5-day intervals. The UAV was flown at an altitude of 60 m with both the end lap and side lap set at 80%, ensuring adequate image overlap for precise mosaicking and spatial analysis. The cruise speed was maintained at 7 m/s to optimize image sharpness and coverage. Flight planning was managed using the BlueFire Touch platform, enabling efficient and accurate mission execution. A Parrot Sequoia multispectral sensor captured the data across multiple spectral bands (Green (550 ± 40 nm), Red (660 ± 40 nm), Red-Edge (735 ± 10 nm), and Near-Infrared (790 ± 40 nm)), along with standard RGB (Red, Green, Blue) imagery. This configuration facilitated the acquisition of high-quality spatial and spectral data critical for vegetation analysis and crop monitoring in the study area. The growth stage of the paddy crop at the time of data collection and the number of images captured on each band are presented in Table 1.
Field Data Collection
GCPs: Ground Control Points (GCPs) are identifiable target points placed strategically on the ground to improve the spatial accuracy of aerial imagery. In this study, four GCP points were established using Stonex S900+ DGPS (Differential Global Positioning System) equipment (STONEX, Viale dell’Industria, Italy) [25]. These GCPs can be used as reference points during the orthorectification process of UAV-acquired images, correcting geometric distortions caused by terrain variation, sensor angle, and camera perspective.
Leaf Sample Collection and Preparation: For nutrient analysis, flag leaves (the uppermost part of the expanded leaves) were collected from 20 different georeferenced locations across the study area on the same day of UAV data acquisition, ensuring temporal consistency between ground-truth data and remote sensing observations. The flag leaf is often used for nutrient analysis because it is physiologically active and reflects the plant’s nutritional status during critical growth stages.
After collection, the leaf samples were first washed gently with tap water, followed by distilled water, to eliminate dust and other surface contaminants. Subsequently, the cleaned samples were oven-dried at a temperature of 65–70 °C until a constant weight was attained, ensuring the complete removal of moisture. These processed samples were used to assess crop parameters such as AGB and NPK. These parameters were used for training and validating the nutrient status predicted from UAV-based models, to monitor actual physiological conditions of the crop.

2.2.2. Data Pre-Processing

The collected UAV images obtained details of camera position and altitude (latitude, longitude, elevation, omega, phi, and kappa) from Global Positioning System (GPS) and Inertial Measurement Unit (IMU) sensors. These camera positions were used to determine the coordinates of the imagery location including the quadcopter’s roll, yaw, and pitch movements. The images were then aligned based on inertial measurements using GCPs established using GPS. Once the images were aligned, tie points were generated from the common points between the images, which were used to orient the images. A dense point cloud was constructed by reconstructing the model using the tie points of the images and it was used to generate a Digital Surface Model, which is helpful when generating orthomosaic images of RGB and MS images. These temporal UAV orthomosaic images were resampled to a spatial resolution of 2 cm/pixel and these images were co-registered with others using the GCPs from the DGPS equipment to maintain the consistency between the images.

2.2.3. Data Processing

Vegetation Indices
Vegetation indices play a crucial role in monitoring plant condition, nutrient status, and stress conditions throughout the crop growth cycle [22]. In this study, nine indices were considered, each providing distinct insights into various aspects of agricultural applications, as presented in Table 2. Analyzing the temporal variation in these indices allows for the detection of patterns related to crop development, nutrient deficiencies, water stress, or disease, enabling informed decisions for timely interventions and precision nutrient management [2].
AGB and NPK Estimation
Above-Ground Biomass: After oven drying, weigh the biomass using a precision balance to determine the dry weight (in grams) of the above-ground plant material [8]. The biomass was then calculated using Equation (1):
A G B g m m 2 = D r y   W e i g h t g m S a m p l e   A r e a m 2
NPK Estimation: The dried leaves were then finely ground using a stainless steel grinder to obtain a homogeneous powder, which was stored in airtight containers to prevent contamination and moisture absorption. For chemical analysis, 0.5 g of the powdered leaf sample was digested using a di-acid mixture of sulphuric acid (H2SO4) and perchloric acid (HClO4) in a 9:1 ratio on a digestion block. The digestion was continued until a clear solution was obtained, which was then filtered and diluted to a known volume with distilled water, making it ready for further nutrient estimation.
The estimation of nitrogen in paddy leaf samples was carried out using a Kelplus distillation unit (Figure 3a), based on the Kjeldahl method [4,29]. The prepared digestive sample was transferred to the distillation unit. An excess of sodium hydroxide (NaOH) was then added to alkalize the medium and convert ammonium ions into ammonia gas. The ammonia was then distilled and captured in a flask containing a boric acid solution mixed with a suitable indicator (typically methyl red and bromocresol green), forming an ammonium–borate complex. The distillate was then titrated with standardized hydrochloric acid (HCl) to determine the amount of nitrogen present in the sample. The nitrogen content was calculated based on the volume of acid consumed during titration and expressed as a percentage of nitrogen in the leaf tissue as shown in Equation (2).
N i t r o g e n   %   o f   d r y   w e i g h t = V o l u m e   o f   a c i d × N o r m a l i t y   o f   a c i d × 1.4 W e i g h t   o f   s a m p l e   g m
A Digital Photo Colorimeter (Figure 3b) was used in this study to estimate phosphorous (P) content in the digested paddy leaf sample. To this aliquot sample, ammonium molybdate and ascorbic acid were added under acidic conditions, leading to the formation of a blue-colored phosphomolybdenum complex. The intensity of the blue color, which is directly proportional to phosphorus concentration, was measured at a wavelength of 660 nm using the Digital Photo Colorimeter. A standard curve was prepared using known concentrations of phosphorus to quantify the amount present in the leaf sample. The final phosphorus content was calculated and expressed as a percentage of phosphorus (% P) in the plant tissue [29,30].
The potassium content of the digested sample of the paddy leaf samples was measured using a Flame Photometer (Figure 3c), which operates on the principle of flame emission spectrophotometry. An aliquot of the digested solution was then aspirated into the flame photometer. In the flame, potassium ions emit light at their characteristic wavelength of 766.5 nm. The intensity of the emitted light is directly proportional to the potassium concentration in the sample. Prior to sample analysis, the instrument was calibrated using standard potassium solutions of known concentrations to establish a standard curve. The potassium content in the leaf sample was determined by comparing emission intensity with the standard curve and expressed as a percentage of potassium (% K) in the dry plant tissue [29,30].

2.2.4. Data Analysis and Validation

AGB and NPK Prediction Using ML Algorithms
Four ML algorithms RF, MLR, PLSR, and XGBoost were used in this study to predict the AGB and NPK of crop from UAV vegetation indices at various growth stages of the crop. These models used 70% of the data of crop parameters (AGB and NPK), which was extracted from the leaf samples (i.e., 20 samples) on every temporal date, for training purposes, while the remaining 30% was used for validation, which was then used for prediction.
RF: The Random Forest ML algorithm is a widely used ensemble learning method for both classification and regression tasks and it works by constructing a large number of decision trees during training and outputs the average prediction of individual trees, which enhances model accuracy and reduces the risk of overfitting. One of the key advantages of Random Forest is its ability to handle non-linear relationships and interactions among variables without requiring any assumptions about data distribution [14,18]. It also provides measures of feature importance, helping to identify which indices or variables contribute most significantly to AGB and NPK prediction.
MLR: It is a widely used ML algorithm for predictive modelling, particularly suitable for predicting the dependent variable (AGB and NPK) of paddy crops using multiple independent variables such as vegetation indices using Equation (3). MLR is especially useful when the relationships between variables are approximately linear, and it allows for easy interpretation of how each input variable affects output [8]. This method helps quantify the contribution of each vegetation index to biomass accumulation, enabling insight into which spectral indicators are most informative.
A G B o r   N o r   P o r   K = β 0 + β 1 X 1 + β 2 X 2 + + β n X n +
where β 0 is the intercept, β 1 , β 2 , …, β n are coefficients for each predictor of X 1 , X 2 , …, X n , and is the error term.
Although MLR is less flexible compared to more complex algorithms like Random Forest or neural networks, it offers advantages such as simplicity, transparency, and ease of implementation.
PLSR: It is a robust multivariate statistical method that is particularly effective for predicting outcomes (AGB and NPK) when there are many correlated predictor variables (VIs). The strength of PLSR lies in its ability to reduce the dimensionality of input data by extracting latent components that capture maximum covariance between predictors and the response variable, thereby improving prediction accuracy while minimizing the risk of overfitting [14,18]. This makes it particularly suitable for remote sensing applications, as multicollinearity among vegetation indices is a common issue in such contexts [14].
XGBoost: It is a robust, scalable, and efficient ML algorithm widely used for regression and classification tasks, and it has proven to be highly effective in predicting AGB and NPK in agricultural studies. XGBoost operates by building an ensemble of decision trees sequentially, with each new tree aiming to correct the errors made by the previous ones. This gradient boosting approach enables the model to learn complex, non-linear relationships in the data with high accuracy [31,32]. The advantages of XGBoost are its ability to handle missing data, multicollinearity, and overfitting through regularization techniques. It also offers high computational efficiency and provides measures of feature importance, helping to identify which vegetation indices most significantly influence AGB predictions [14].
Validation Metrics for Prediction Models
In machine learning, validation metrics are essential for evaluating the performance and accuracy of the prediction models. Among the most commonly used metrics in regression methods, Coefficient of Determination (R2) and Root Mean Square Error (RMSE) provide complementary insights about the model performance. R2 measures the proportion of variance in the dependent variable that is predictable from independent variables using Equation (4). It ranges from 0 to 1, with values closer to 1 indicating that the model explains a greater proportion of variability in the target variable [4,15]. RMSE quantifies the average magnitude of prediction errors using Equation (5). It calculates the square root of the average of squared differences between predicted and observed values. Lower RMSE values indicate better model performance, as they reflect smaller differences between actual and predicted values [4,28].
R 2 = i = 1 n ( y i y ^ i ) 2 i = 1 n ( y i y ¯ ) 2
R M S E = i = 1 n ( y i y ^ i ) 2 n
where y i , y ^ i , and y ¯ represent the measured, predicted, and mean values of the sample, respectively, and n is the number of samples.
Crop Health Assessment
Crop health assessment can be performed by analyzing the predicted AGB and NPK values obtained through UAV-based spectral data and ML models. The predicted parameters serve as key indicators of the crop’s physiological status and nutrient sufficiency. AGB reflects the overall health and productivity of the crop canopy, while nutrient levels indicate the adequacy of essential elements required for growth and development. By evaluating these parameters across different zones of a field, areas of optimal growth or stress can be identified, even before visual symptoms appear.
Decision-making rules are then applied to interpret the predicted values, allowing for systematic classification of crop health. From the recommendation of IRRI, crop nutrient levels are categorized into critical, optimum, and toxic based on the growth stage of the crop by relative comparisons [6,33,34]. Based on the categorized levels, 27 combinations (3 × 3 × 3) were developed from nutrient values. For AGB, if there is no specific value or range recommendation for a particular stage, the threshold (mean of AGB—1 × Standard Deviation) value is considered for every growth stage to cover approximately 70% of AGB values and the values are categorized into 2 levels (i.e., one is above threshold and one is below threshold). A total of 54 combinations were developed from AGB and NPK values and each combination represents the health condition of the crop. From 54 combinations, crop health was represented in 8 categories based on the common nature of health and these are presented in Table 3. The decision-making rules listed in Table 3 were used in the present study to assess crop health based on AGB and nutrient parameters in various growth stages of the paddy crop. The decision-making rules provided valuable insights which can be used to make site-specific decisions, such as applying fertilizers only in areas where they are needed, thereby ultimately improving resource use efficiency and crop yield.
Likewise, the same decision-making rules were applied to field AGB and NPK values to assess crop health condition at a particular location. The field crop health information is used in this study to validate crop health from the predicted AGB and NPK.
Validation Metrics for Crop Health Assessment
Validation metrics like precision (Equation (6)), recall (Equation (7)), F1 score (Equation (8)), and Kappa Coefficient (Kc) (Equation (9)) assess the performance of crop health assessment and offer complementary insights into the model’s reliability and effectiveness. Precision quantifies the accuracy of positive predictions by measuring the proportion of true positive identifications out of all instances predicted as positive. Recall, also known as sensitivity, assesses the proportion of actual positive cases correctly detected by the model, indicating how well the model captures all unhealthy crops for timely intervention. The F1 score combines precision and recall into a single metric by calculating their harmonic mean, offering a balanced measure that is particularly useful when class distribution is uneven. Kc evaluates the agreement between predicted crop health and field crop health while adjusting for the possibility of random agreement, providing a robust measure of overall model performance beyond simple accuracy.
P r e c i s i o n = T r u e   P o s i t i v e T r u e   P o s i t i v e + F a l s e   P o s i t i v e
R e c a l l = T r u e   P o s i t i v e T r u e   P o s i t i v e + F a l s e   N e g a t i v e
F 1   S c o r e = 2 × P r e c i s i o n × R e c a l l P r e c i s i o n + R e c a l l
K c = P o P e 1 P e
where P o = observed agreement, and P e = expected agreement by chance

3. Results

3.1. UAV Vegetation Indices

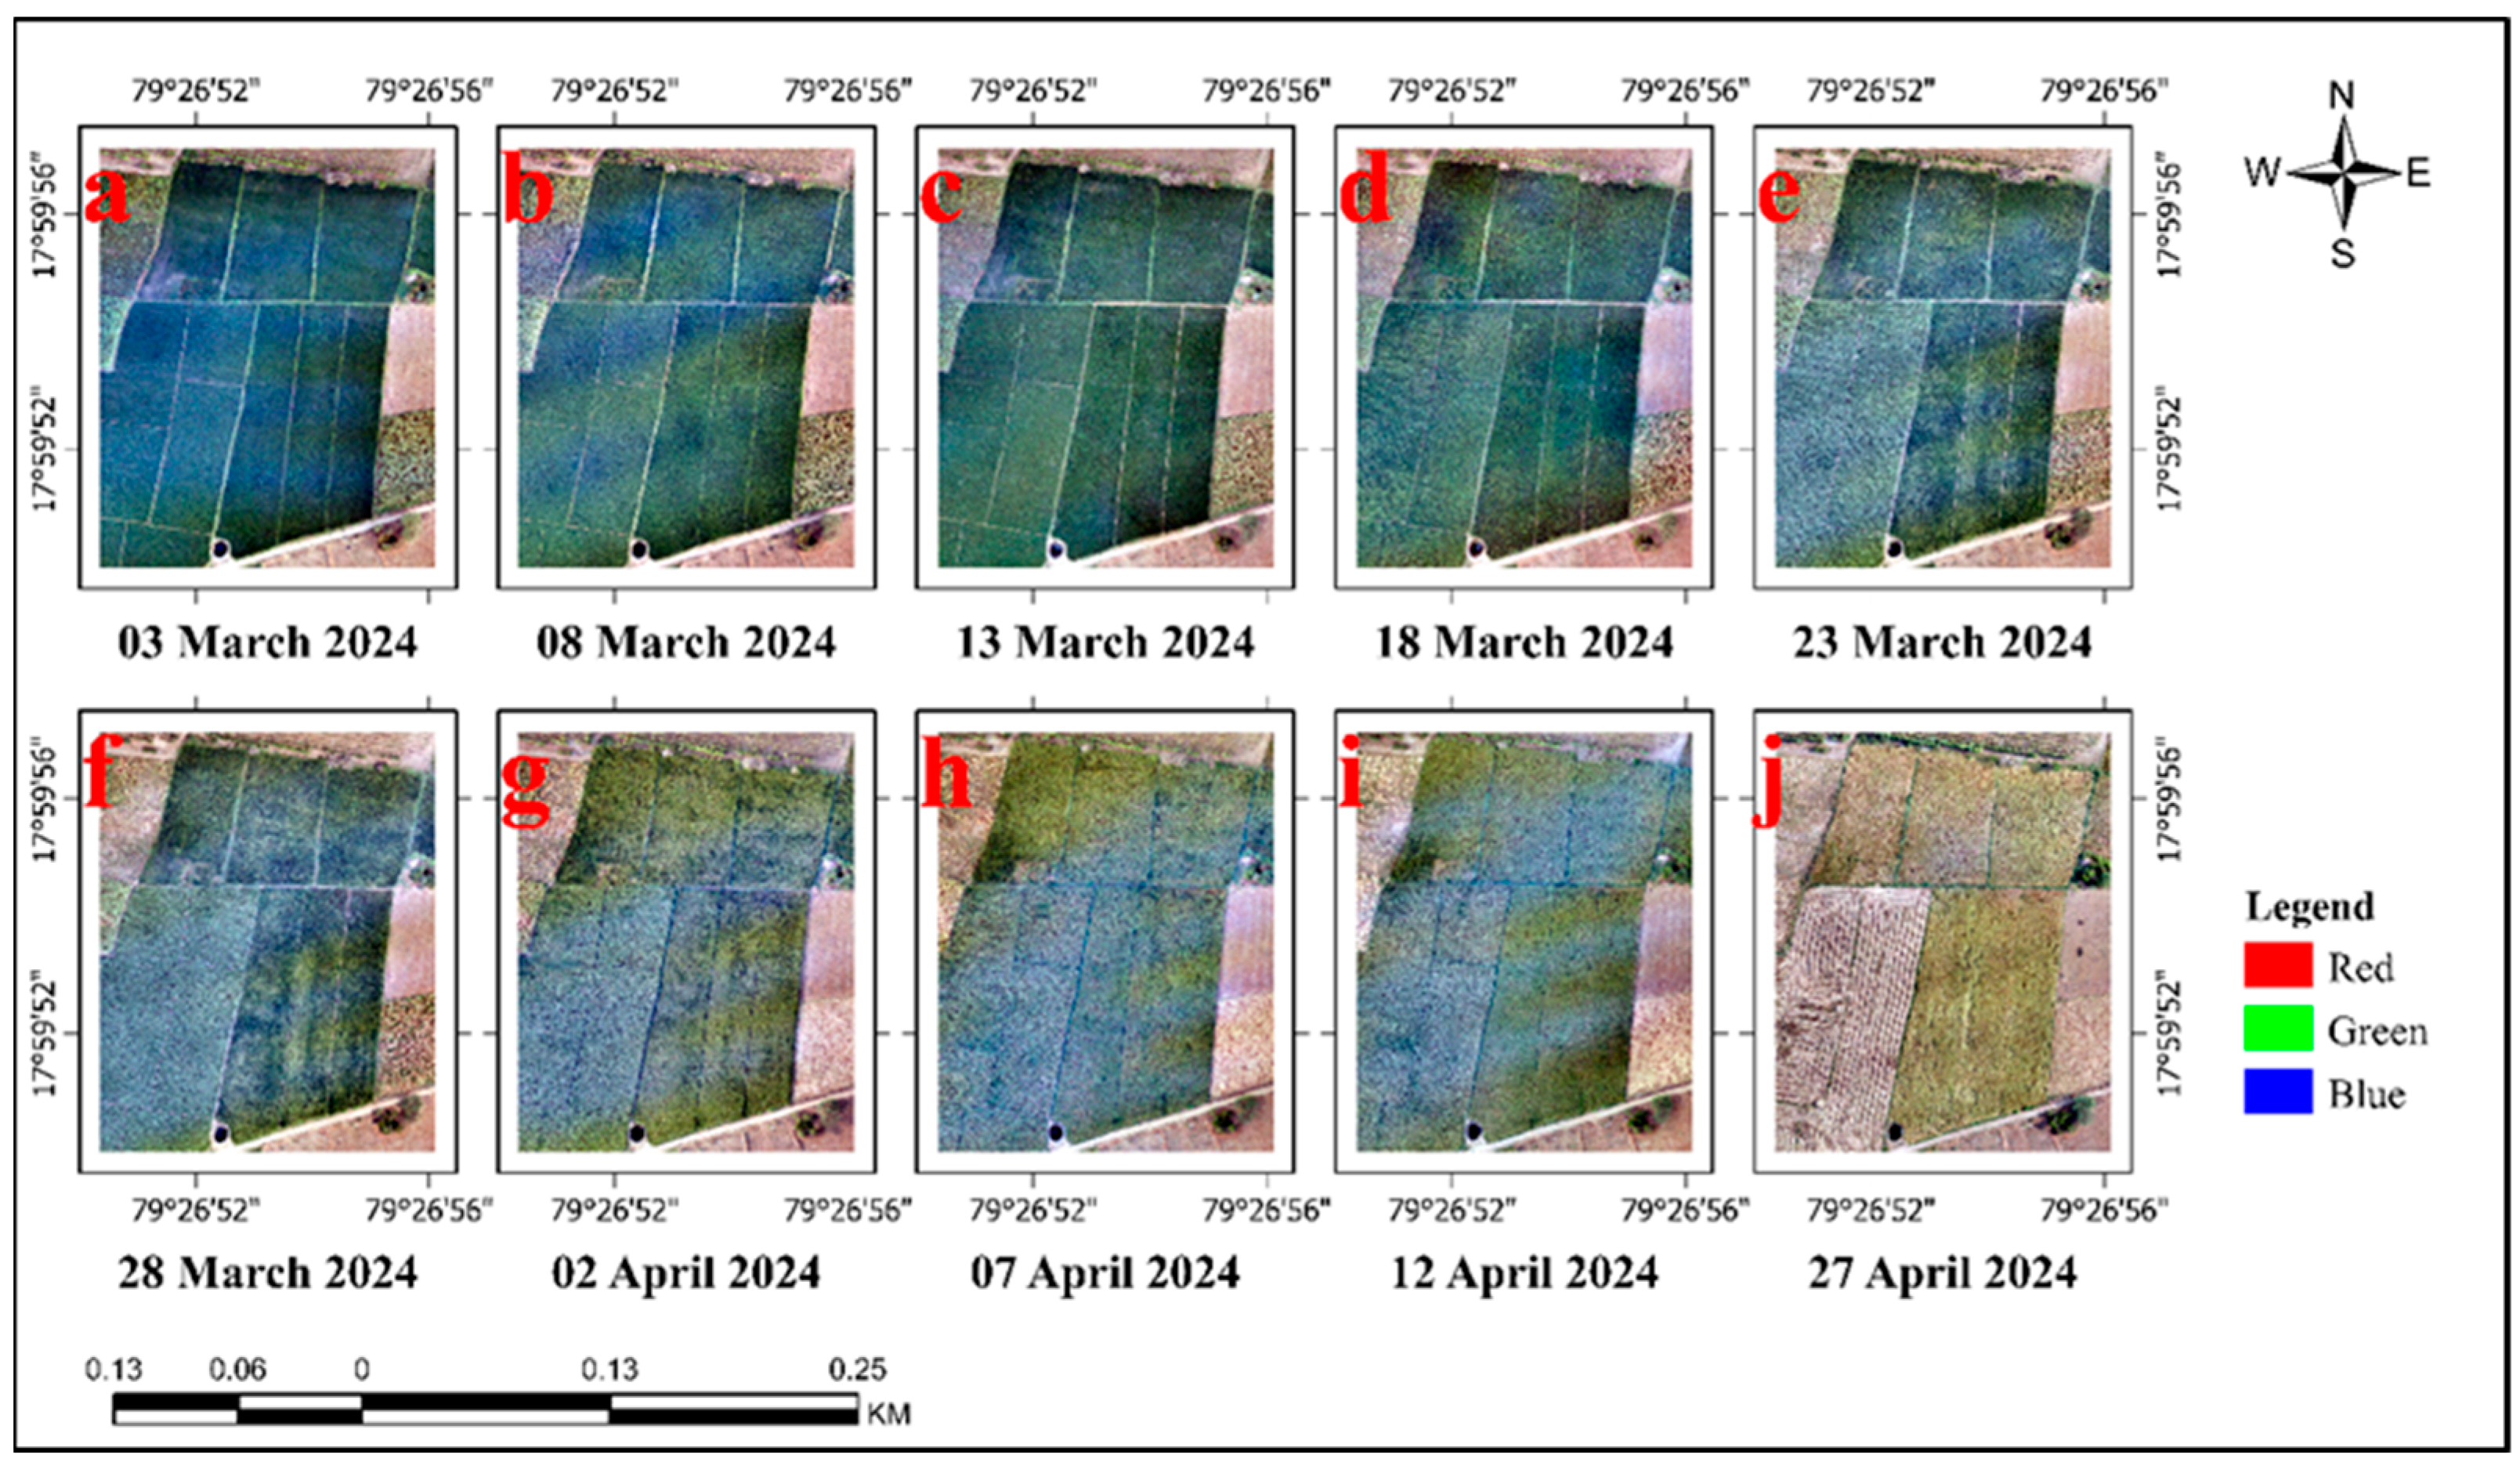
The orthorectified temporal UAV images from 3 March 2024 to 27 April 2024 are presented in Figure 4. These temporal images were used to generate vegetation indices which would be helpful for the prediction of AGB and NPK.
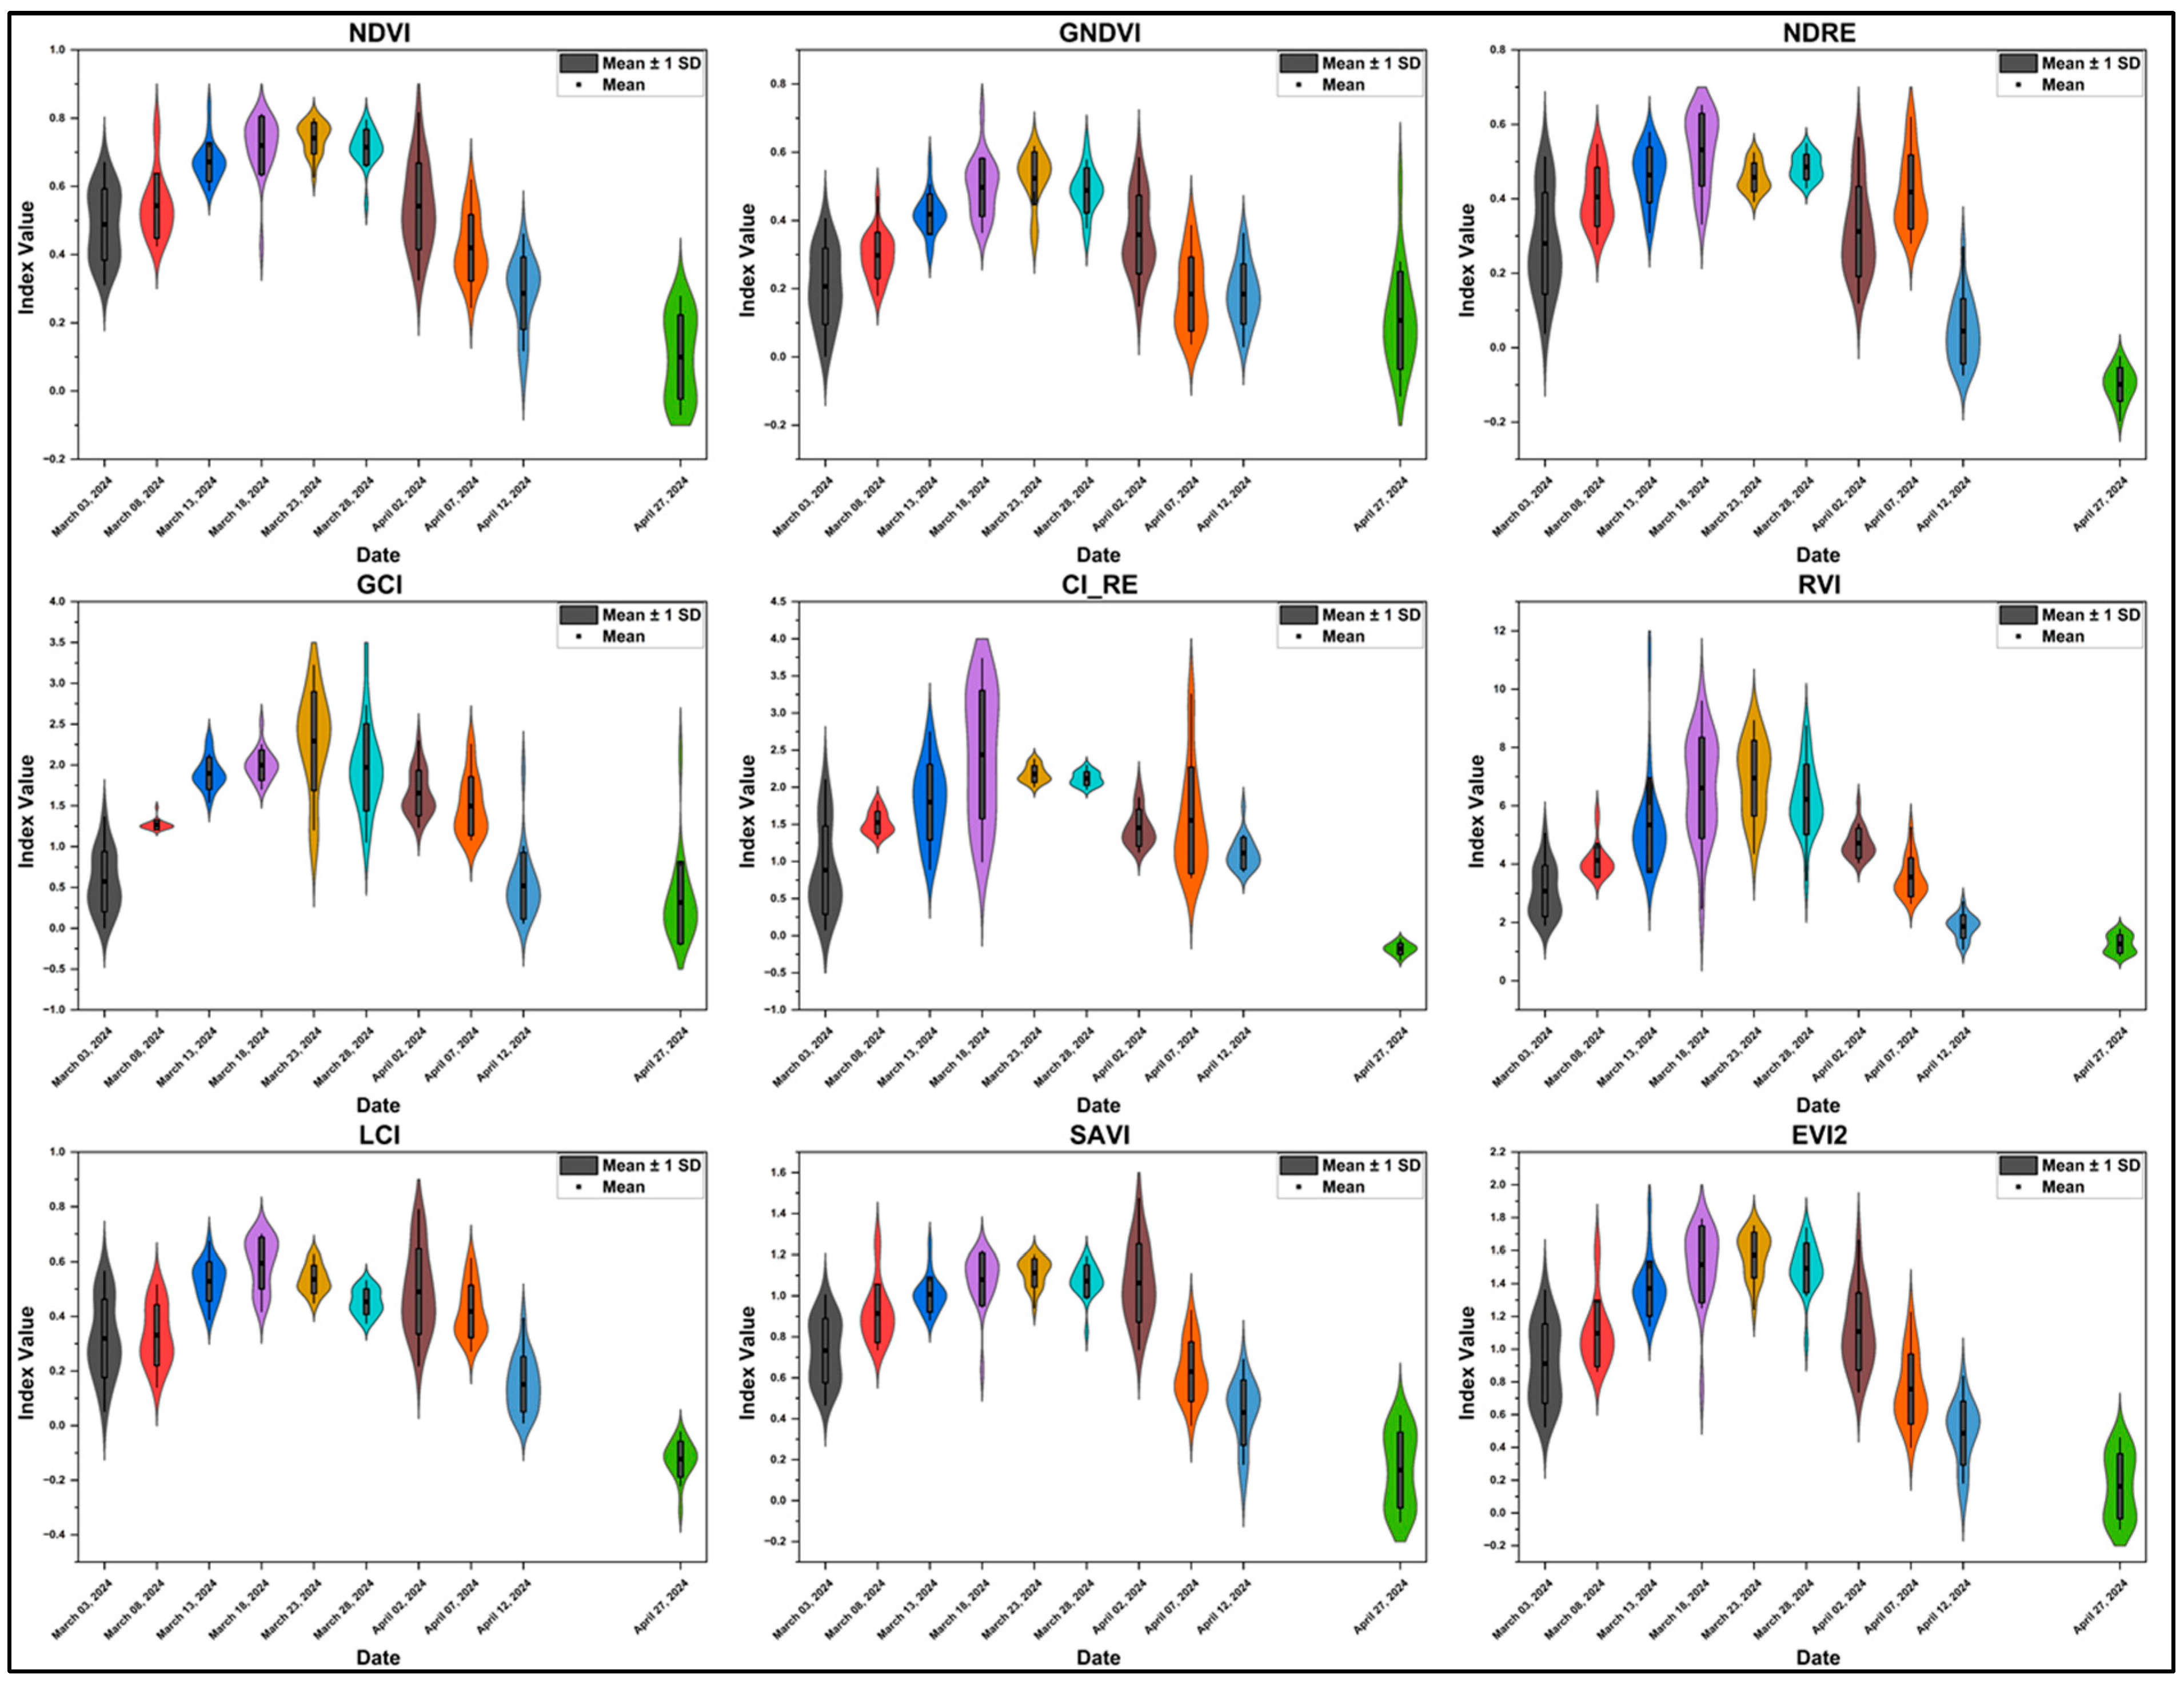
The temporal statistical analysis of various vegetation indices across the paddy crop season from panicle initiation to harvesting offers vital insights into the crop’s physiological status and health. The vegetation indices values were extracted from 20 sample locations and their statistical results (Mean, Maximum, Minimum, and Standard Deviation (SD)) of the indices on various temporal dates are represented in the violin plot (Figure 5). In the initial stages (3 March 2024), indices like NDVI and GNDVI showed moderate mean values (0.49 and 0.21, respectively), indicating early crop health, while high values of RVI (mean 3.08) and CI_RE (mean 0.88) suggested strong biomass and chlorophyll activity. By 8 March 2024, a noticeable decline in the mean values of NDVI (0.34), NDRE (−0.04), and GCI (−0.93) was observed, potentially due to early stress or nutrient imbalance, particularly with CI_RE turning slightly negative.
A significant improvement in crop condition occurred by 13 March 2024 as seen in the sharp rise in NDVI (0.67), GNDVI (0.42), and NDRE (0.46), along with high chlorophyll-related indices like CI_RE (1.80) and RVI (5.34). This pattern continued to strengthen by 18 March 2024, when all mean values of indices such as NDVI increased and reached a mean of 0.72 with CI_RE of 2.44, reflecting healthy, photosynthetically active vegetation. High maximum values of indices like RVI (up to 9.59) and GCI (3.42) during this period confirmed vegetation canopy development and strong nutrient content. By 23 March 2024, the crop reached its peak vegetative stage, evident in maximum NDVI values around 0.74, and strong spectral signatures in RVI (6.95), CI_RE (0.38), and EVI2 (1.57). Notably, the minimum values in this period remained positive, indicating overall healthy biomass across the field.
However, from 28 March 2024 onwards, a declining trend in most indices was noted. A sudden drop in NDVI (0.24) was noted and some indices such as NDRE (−0.04) even showed negative mean values on 2 April 2024. This decline corresponds to the senescence and maturity stages of the crop, during which chlorophyll content and photosynthetic activity naturally decrease. From 12 April 2024 onwards, the decline was more pronounced, with most indices including NDVI (0.29) and NDRE (0.04) showing decreased values, signaling crop maturity or degradation.
Mean values of the vegetation indices on 27 April 2024 revealed the minimal vegetation signal (NDVI at 0.10), low reflectance in NIR-sensitive indices, and increasing noise (higher SD in some cases) indicating significant loss of green cover and nutrient activity as the crop approached harvest. These statistical results of the temporal vegetation indices from the panicle initiation to harvesting stage, demonstrated how vegetation indices can effectively track crop health, nutrient status, and biomass dynamics in agricultural applications.

3.2. Temporal Variation in Measured Crop Parameters

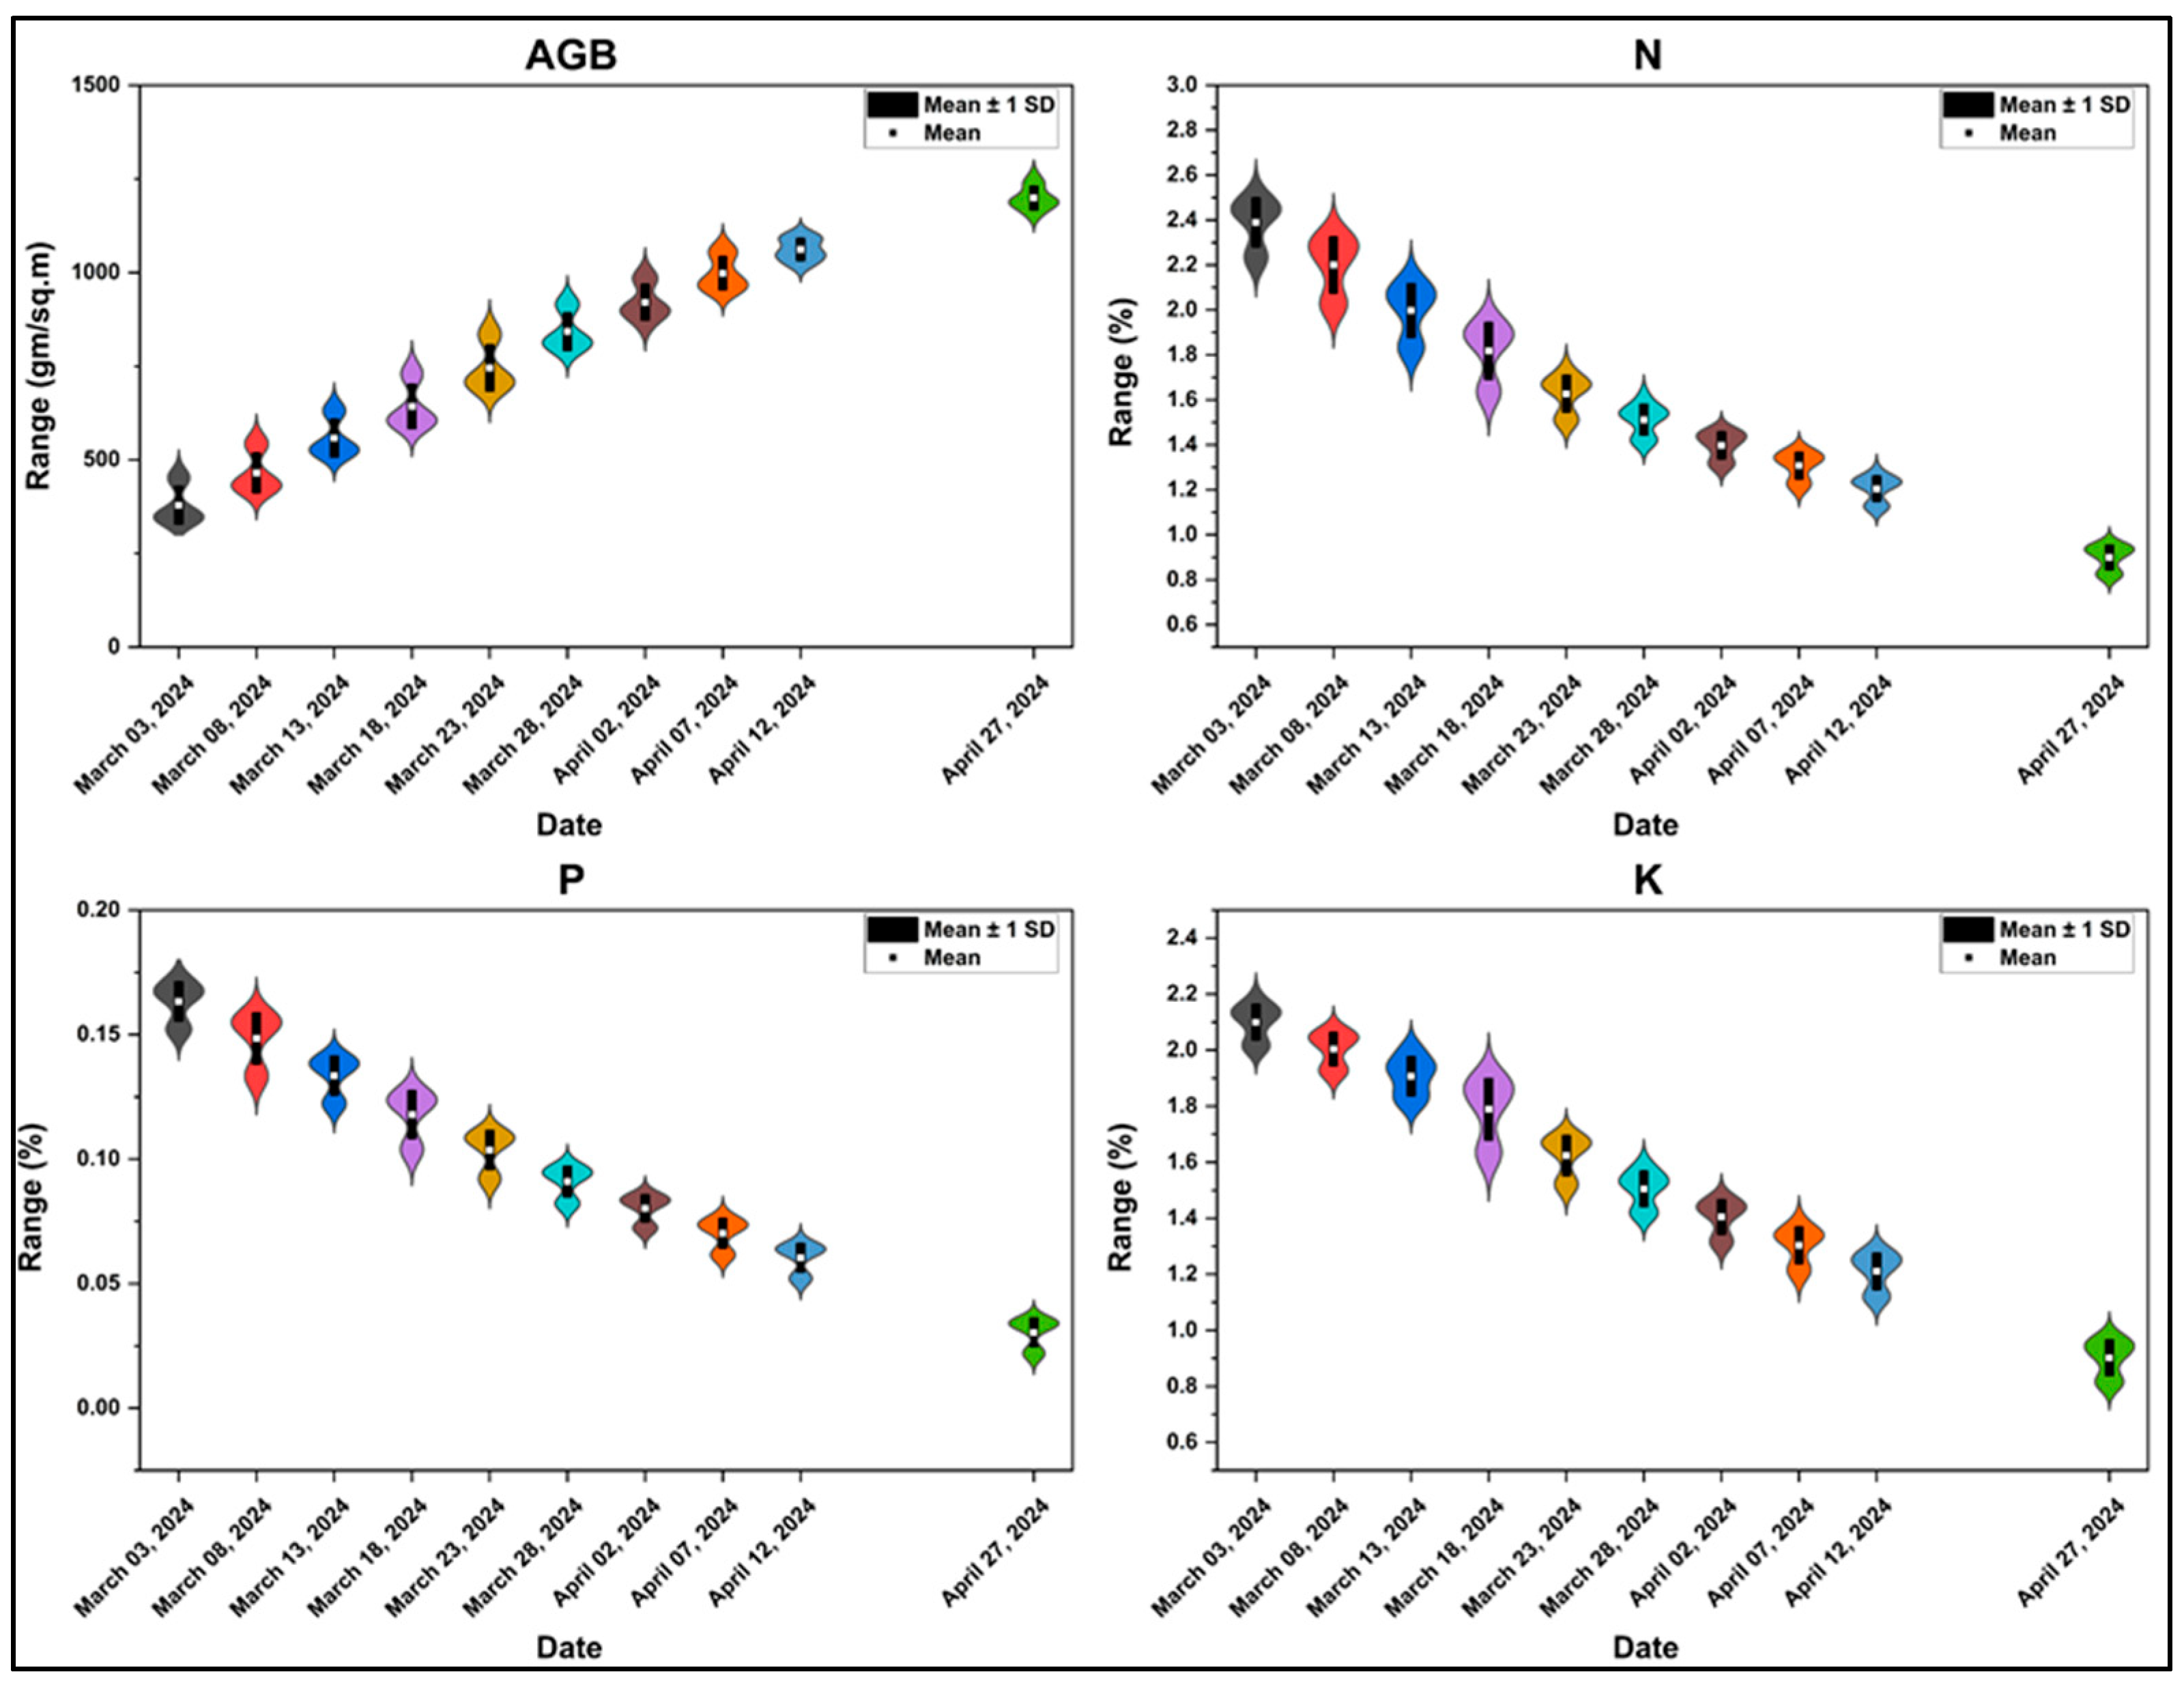
The temporal variation in the AGB of the paddy crop (Figure 6) showed a consistent increasing trend from growth stages to the reproductive phase, followed by a notable decline towards the end of the crop cycle. On 3 March 2024 the mean AGB was recorded at 379 gm/m2 with a maximum of 459 gm/m2; over the next few weeks, the biomass increased steadily and reached its maximum value on 24 April 2024. The increasing biomass values reflect active vegetative and reproductive growth phases. However, by 27 April 2024, a sharp decline was observed, with minimum AGB values dropping to 319 gm/m2, likely due to cultivation activities in part of the study area.
The nitrogen content (Figure 6) in paddy leaf samples from panicle initiation till harvesting reveals a steady decline in nitrogen concentration as the crop progressed through its growth stages. This downward trend was prolonged through the reproductive stages, with mean nitrogen values reducing to 1.63% on 23 March 2024, 1.51% on 28 March 2024, and 1.4% by 2 April 2024. As the crop approached maturity, the nitrogen content further declined to 1.31% on 7 April 2024 and 1.2% on 12 April 2024, indicating a shift in nutrient allocation from vegetative parts to grain development during the reproductive and ripening phases [20].
The phosphorus content (Figure 6) in paddy leaf samples exhibited a gradual and consistent decline from the early vegetative stage to the harvest stage. The initial high phosphorus content reflects its essential role during early growth phases, supporting root development and energy transfer. The downward trend continued as the crop transitioned through its reproductive stages, with mean phosphorus values recorded at 0.11% on 23 March 2024, 0.09% on 28 March 2024, and 0.08% on 2 April 2024. As the crop neared maturity, phosphorus levels declined further to 0.07% on 7 April 2024 and 0.06% on 12 April 2024, and reached their lowest point of 0.03% on 27 April 2024, with a standard deviation of 0.006. This steady decline is typical, as phosphorus is a mobile nutrient that is gradually translocated from vegetative tissues to developing grains. The decreasing trend also indicates reduced uptake from soil in later stages, due to both physiological changes in the plant and the potential depletion of available phosphorus in the root zone [6].
The potassium content (Figure 6) from the paddy leaf samples showed a gradual decline over time, reflecting its uptake and redistribution throughout the crop’s growth stages, but the mobility of the nutrient was comparatively lower than N and P. The decline persisted further into the grain-filling stage, as potassium concentrations dropped to 1.3% on 7 April 2024 and 1.21% on 12 April 2024. By the time the crop approached the harvest stage on 27 April 2024, the mean potassium content had declined significantly to 0.9%, with a narrow standard deviation of 0.061, suggesting a consistent reduction across samples. The continuous decrease in potassium levels is highly mobile within the plant and is translocated from leaves to developing grains during the reproductive phase. Additionally, root activity and nutrient uptake decline during the late stages contributed to reduced potassium levels in the foliage [33,34].

3.3. Correlation Analysis Between Vegetation Indices, AGB, and NPK

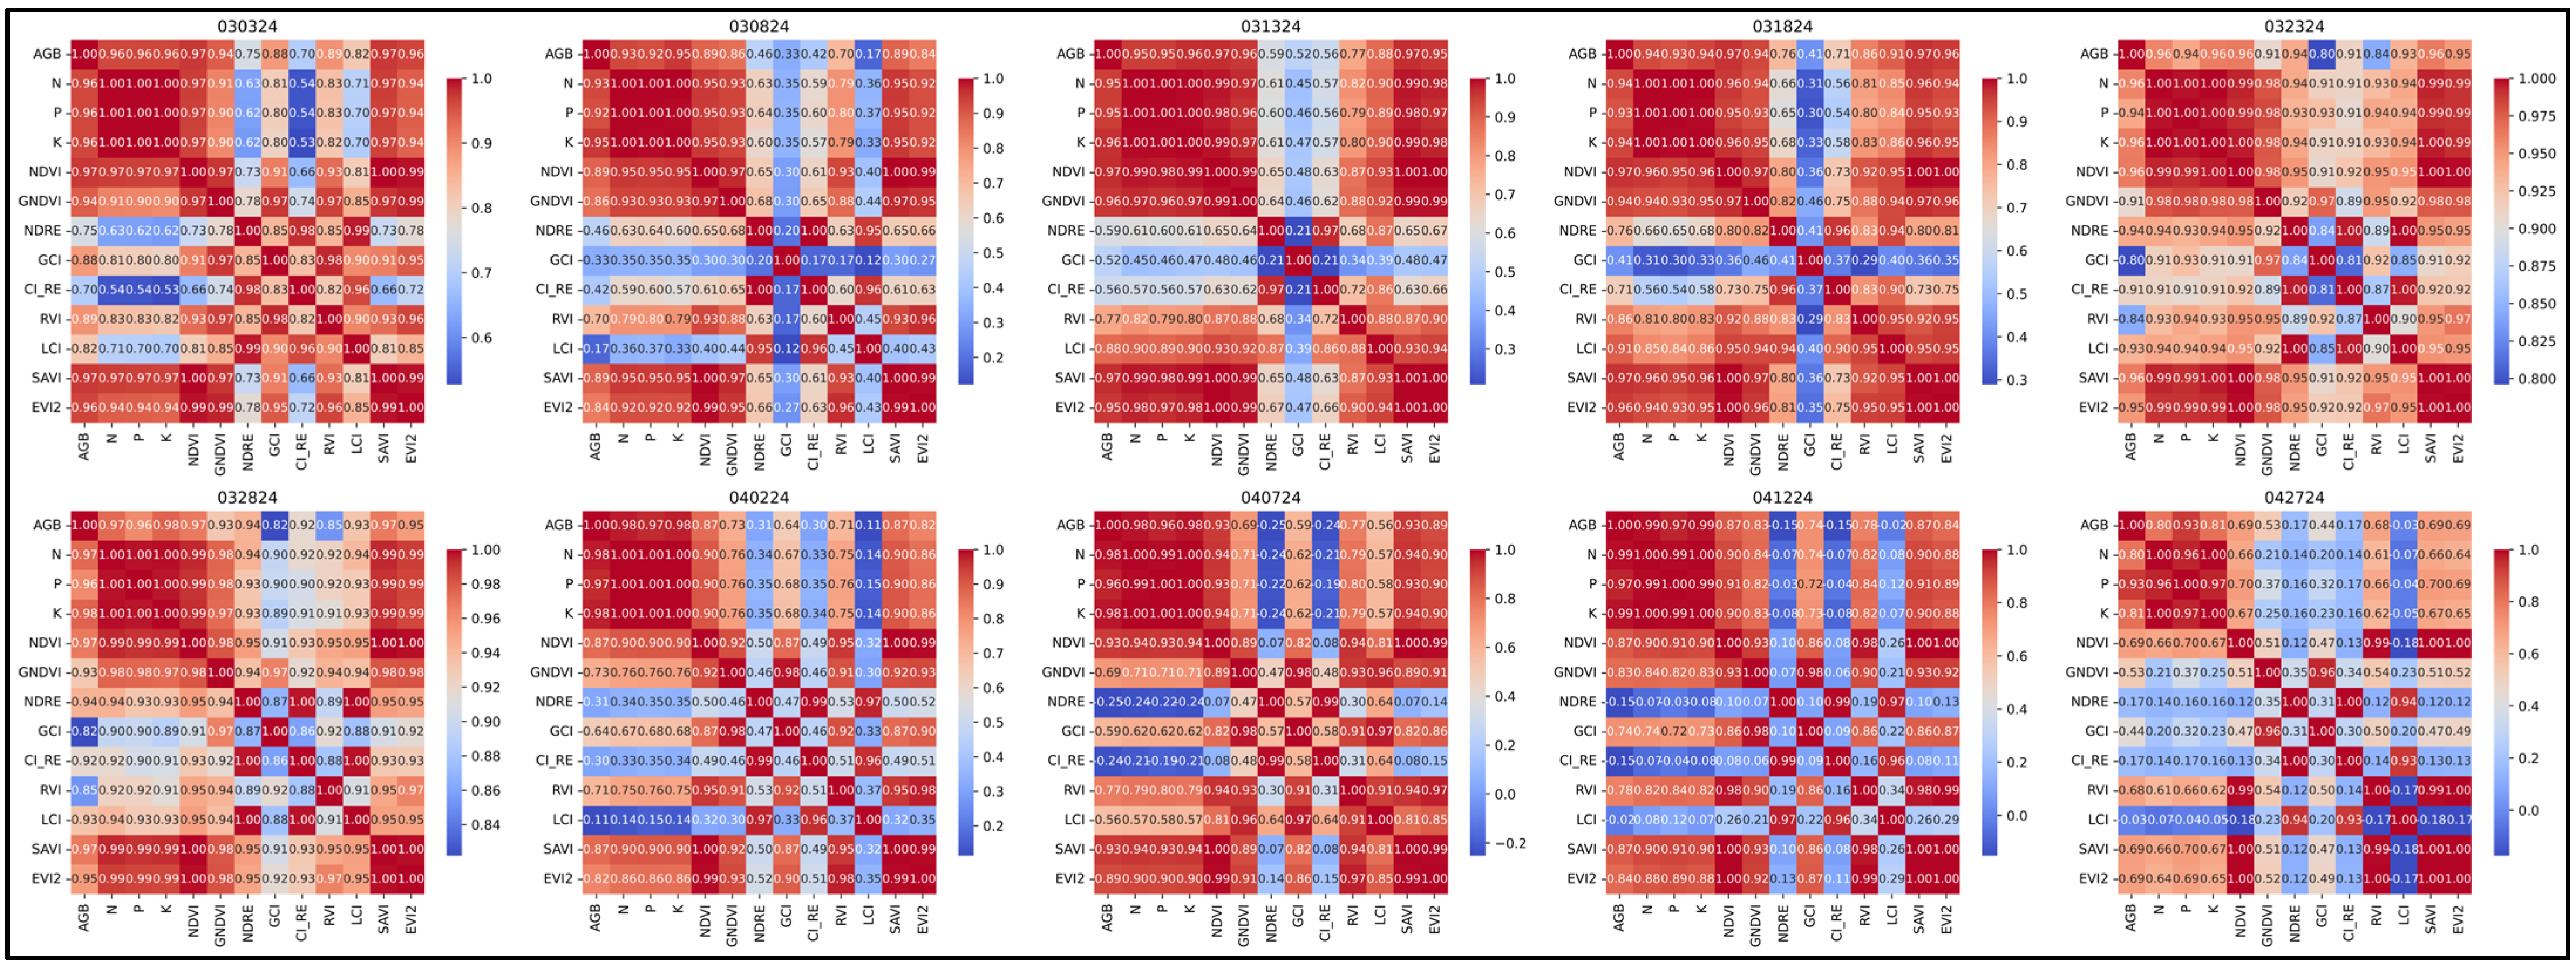
The correlation values between AGB, NPK, and various vegetation indices were derived from UAV images on multiple temporal dates in March and April 2024, and were analyzed to understand the dynamic relationships between these parameters. The results, illustrated in Figure 7, reveal strong positive correlations between AGB and nutrient content (NPK), with correlation values consistently exceeding 0.80. Additionally, nutrient contents (N, P, K) show very high intercorrelations (r > 0.90), indicating a strong and statistically significant association across all dates except on 27 April 2024, likely due to partial harvesting in the study area. Similarly, indices such as NDVI, GNDVI, SAVI, and EVI2 exhibit strong and statistically significant correlations with AGB and NPK (r > 0.85), confirming their predictive strength for crop health assessment. Conversely, NDRE and CI_RE demonstrate weaker and more variable correlations with AGB and nutrients (r < 0.60), suggesting these indices have limited sensitivity during early growth stages.
As the crop transitioned from late vegetative to reproductive stages (late March to early April), the performance of certain indices changed. For instance, NDRE’s correlation with nitrogen content improved significantly from 0.39 (8 March 2024) to 0.88 (23 March 2024), indicating increased sensitivity to nitrogen-related chlorophyll dynamics during active canopy development. However, during the reproductive stage (from 2 April 2024 and 12 April 2024), the predictive strength of most indices, particularly LCI and NDRE, declined drastically in relation to AGB and nutrients (below 0.5). This could indicate a saturation effect or variability in canopy structure, limiting spectral responsiveness during reproductive stages.
Overall, the data suggest that UAV-based vegetation indices such as NDVI, GNDVI, SAVI, and EVI2 are reliable indicators for estimating AGB and nutrient contents during early to peak growth stages, with statistically strong correlations (r > 0.85). In contrast, indices like NDRE and CI_RE, although potentially useful during mid-growth phases, show less consistent predictive capability and are more sensitive to crop phenological changes. The observed temporal variation in correlation strength emphasizes the importance of selecting appropriate indices and acquisition timings to optimize UAV-based crop health monitoring.

3.4. Prediction of AGB and NPK Using ML

UAV-derived VIs played a crucial role in estimating AGB and nutrient levels using ML algorithms. Among the evaluated indices, NDVI, GNDVI, GCI, RVI, LCI, SAVI, and EVI2 consistently demonstrated higher feature importance scores in predicting AGB and nutrient parameters compared to NDRE and CI_RE. These findings indicate that indices sensitive to chlorophyll concentration and canopy structure are more effective in capturing biophysical and biochemical crop attributes. The predictive performance of each VI varied across different crop growth stages. NDVI and SAVI were particularly strong predictors during peak vegetative phases due to their responsiveness to canopy density and vigor. GNDVI and GCI exhibited better performance in estimating nitrogen content, given their sensitivity to green reflectance, which correlates with chlorophyll concentration. Meanwhile, indices like RVI and EVI2 provided more stable estimates across all stages due to their enhanced dynamic range and reduced soil background effects.
The differential contributions of and temporal variability in VI importance for predicting AGB and NPK are illustrated in Figure S1, highlighting the evolving relevance of specific indices in relation to crop phenology. This suggests that optimal index selection for accurate biophysical estimation should be stage specific, leveraging the strengths of each index in accordance with the physiological changes occurring in the crop lifecycle.
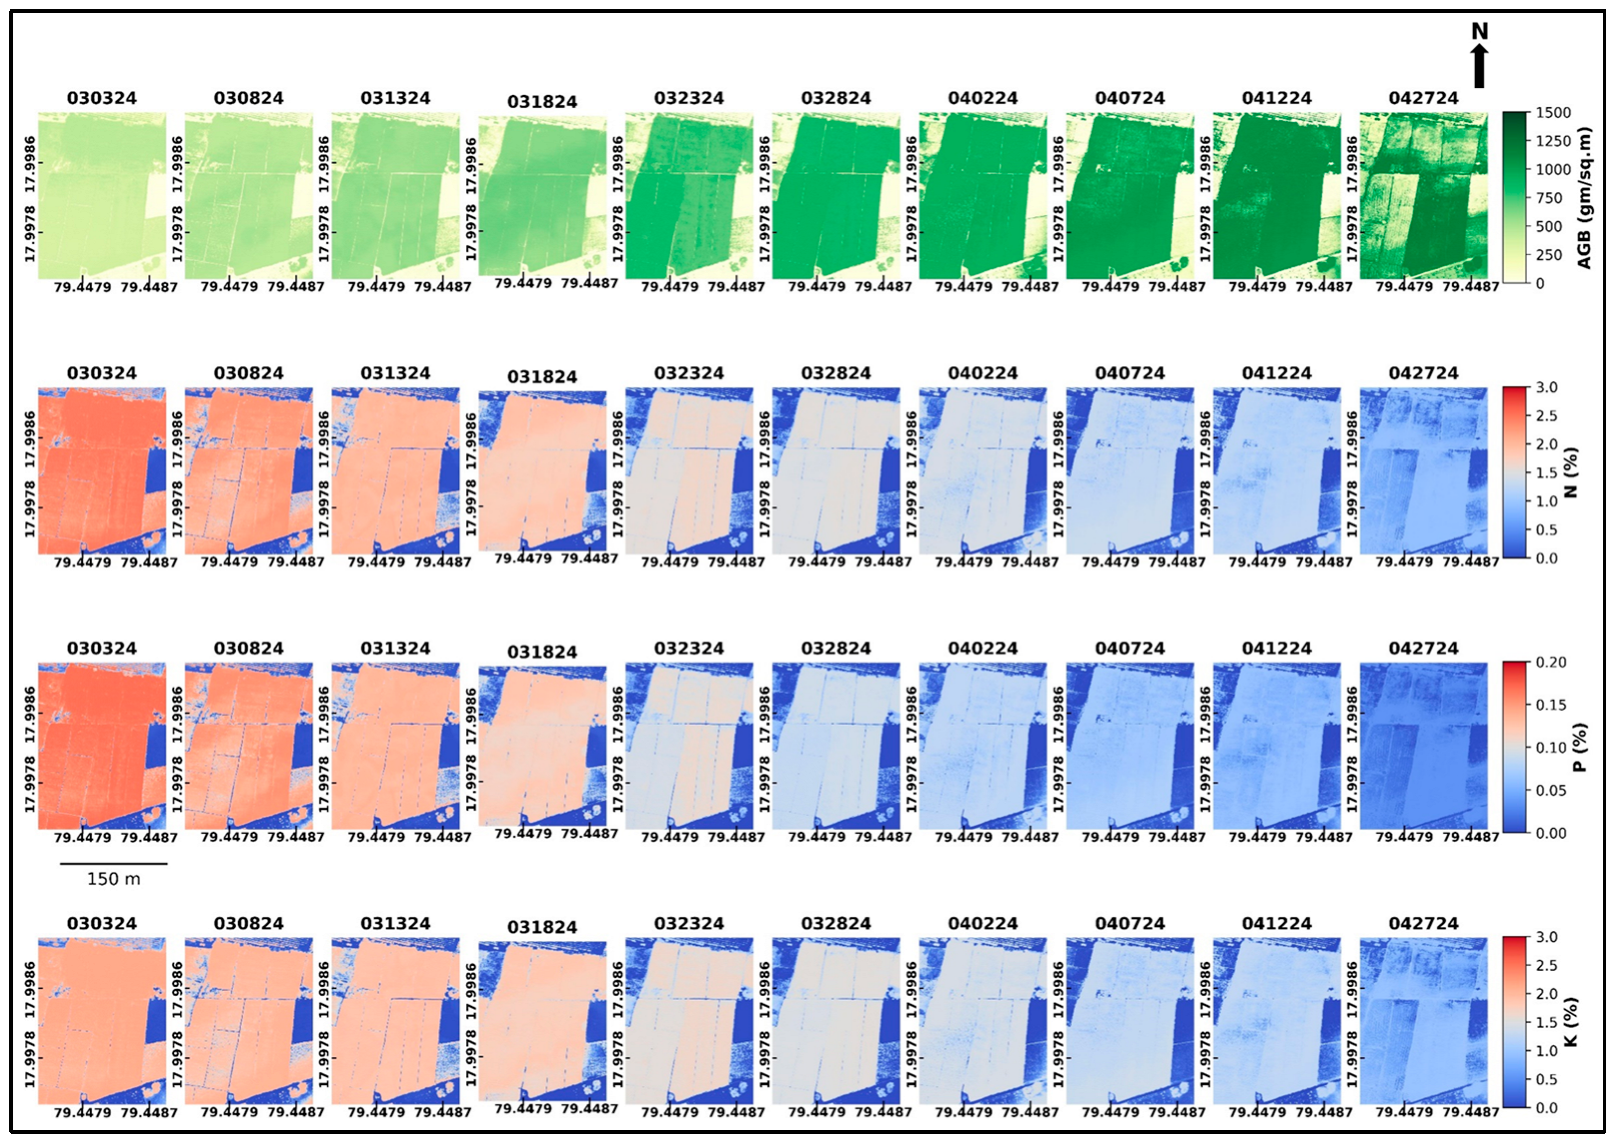
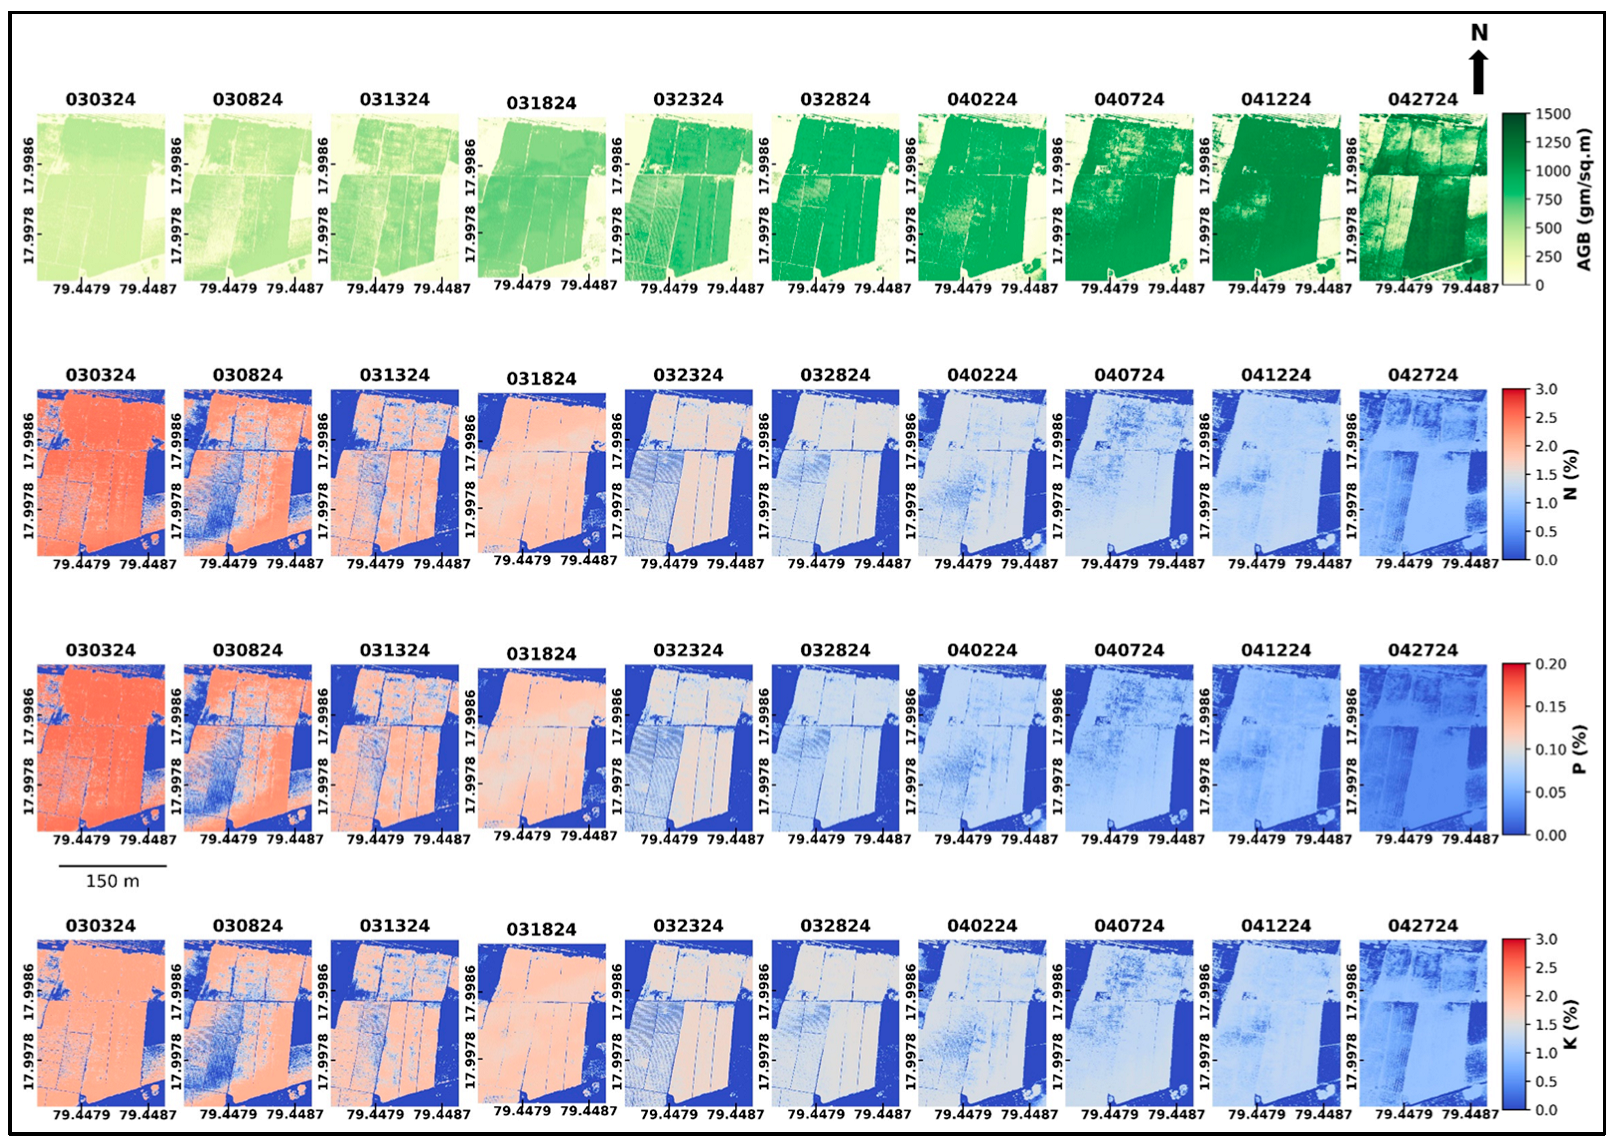
The temporal variation in predicted AGB and NPK images using the RF algorithm are presented in Figure 8. Continuous monitoring of crop parameters from 3 March 2024 to 27 April 2024 revealed a steady increase in AGB alongside a gradual decline in nutrient concentrations. On 3 March 2024 the mean AGB value was 309 gm/m2, which consistently increased to 858 gm/m2 on 12 April 2024, but there was a sudden decline in the mean value to 758 gm/m2 on 27 April 2024, even though the maximum value was 1193 gm/m2. This pattern indicates that biomass was accumulating till 7 April 2024 and their cultivation, which happened between 12 April 2024 and 27 April 2024. In contrast, the mean N content declined from 1.91% on 3 March 2024 to 0.71% by 27 April 2024. A similar trend was observed in P, which fell from 0.13% to 0.02%, and K, which dropped from 1.67% to 0.71% over the same period.
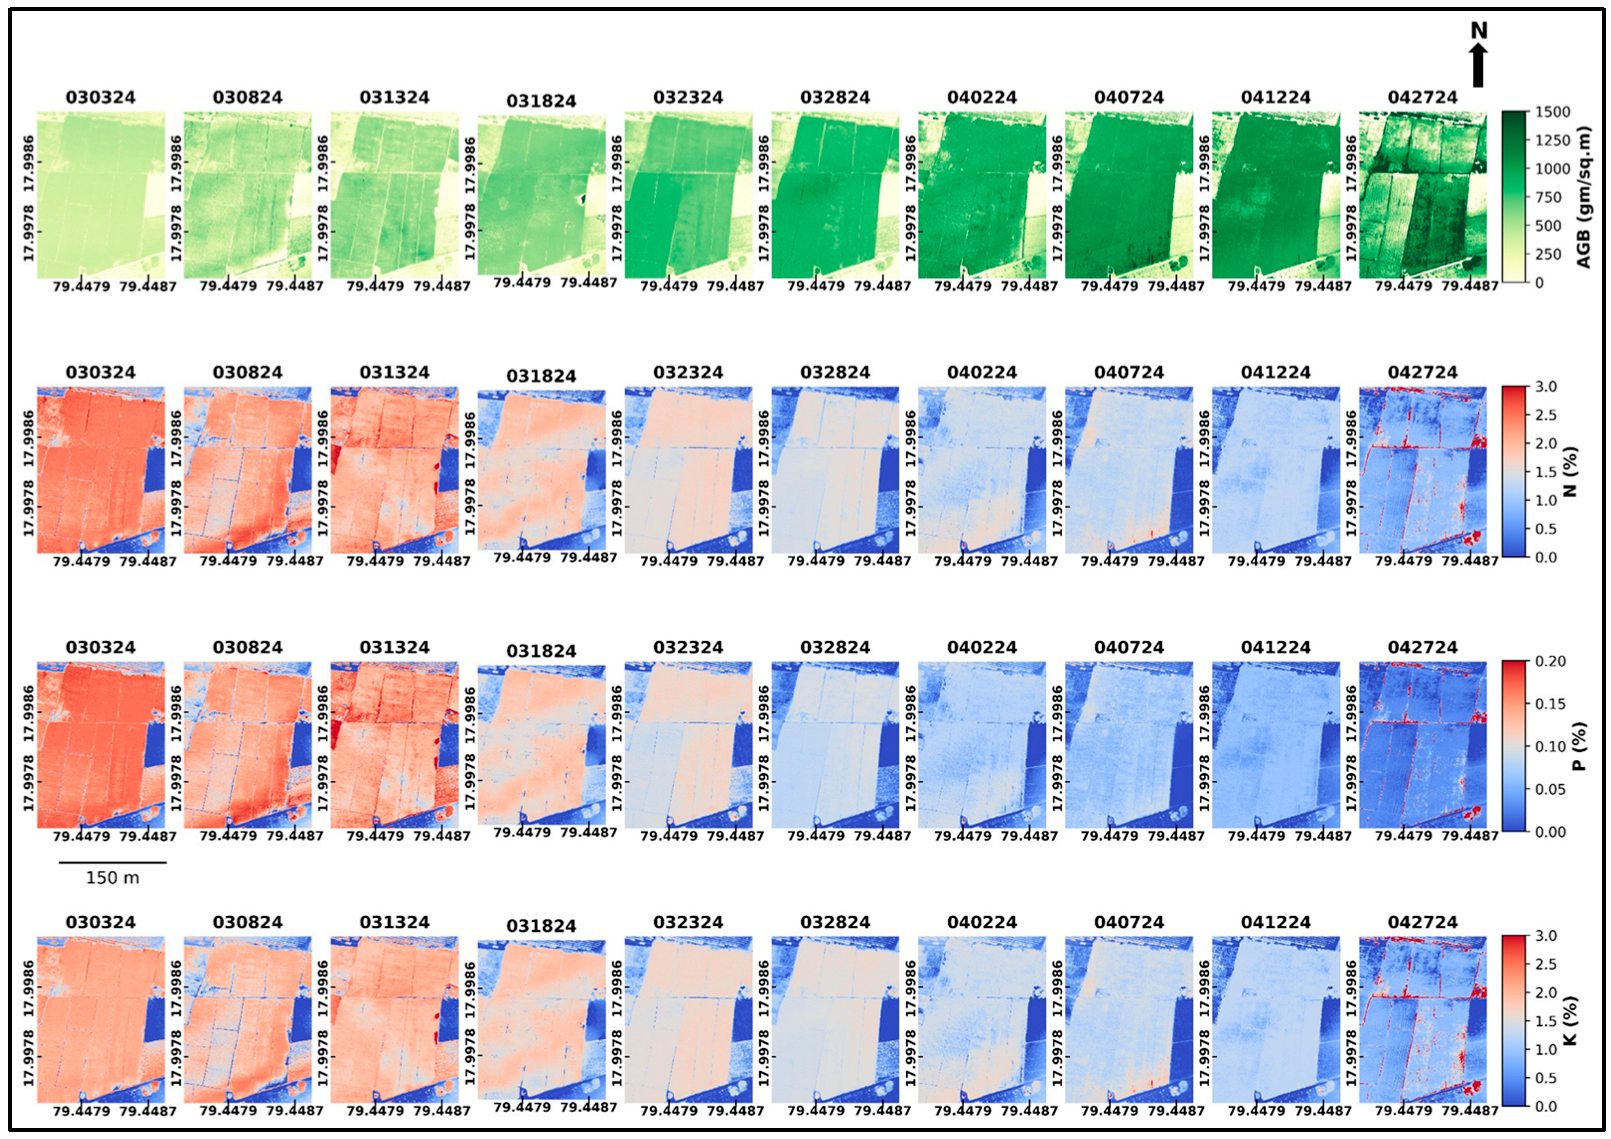
The temporal variation in predicted AGB and NPK levels over the period using the MLR algorithm reveals notable trends, and these are presented in Figure 9. Between 3 March 2024 and 27 April 2024, AGB and NPK showed progressive changes, though some values included anomalies such as negative predictions. On 3 March 2024 the AGB had a mean of 308 gm/m2 with a maximum value of 474 gm/m2, and it continuously increased to a mean value of 865 gm/m2 with a maximum value of 1210.36 gm/m2 on 12 April 2024, but there was a sudden drop in mean value to 722 gm/m2 even though there was a maximum value of 1318 gm/m2 on 27 April 2024. This pattern is also similar to the RF prediction results, but the mean and maximum values increased, and the minimum values stretched to negative values.
Nutrient values were recorded as mean values, which were 1.88% (N), 0.13% (P), and 1.79% (K) on 8 March 2024, and the values consistently decreased to mean values of 0.74% (N), 0.02% (P), and 0.74% (K) on 27 April 2024. This pattern of a consistent increase in biomass and gradual depletion of nutrient levels suggests the absorbance of nutrients by the plant leaf and grain development in the crop.
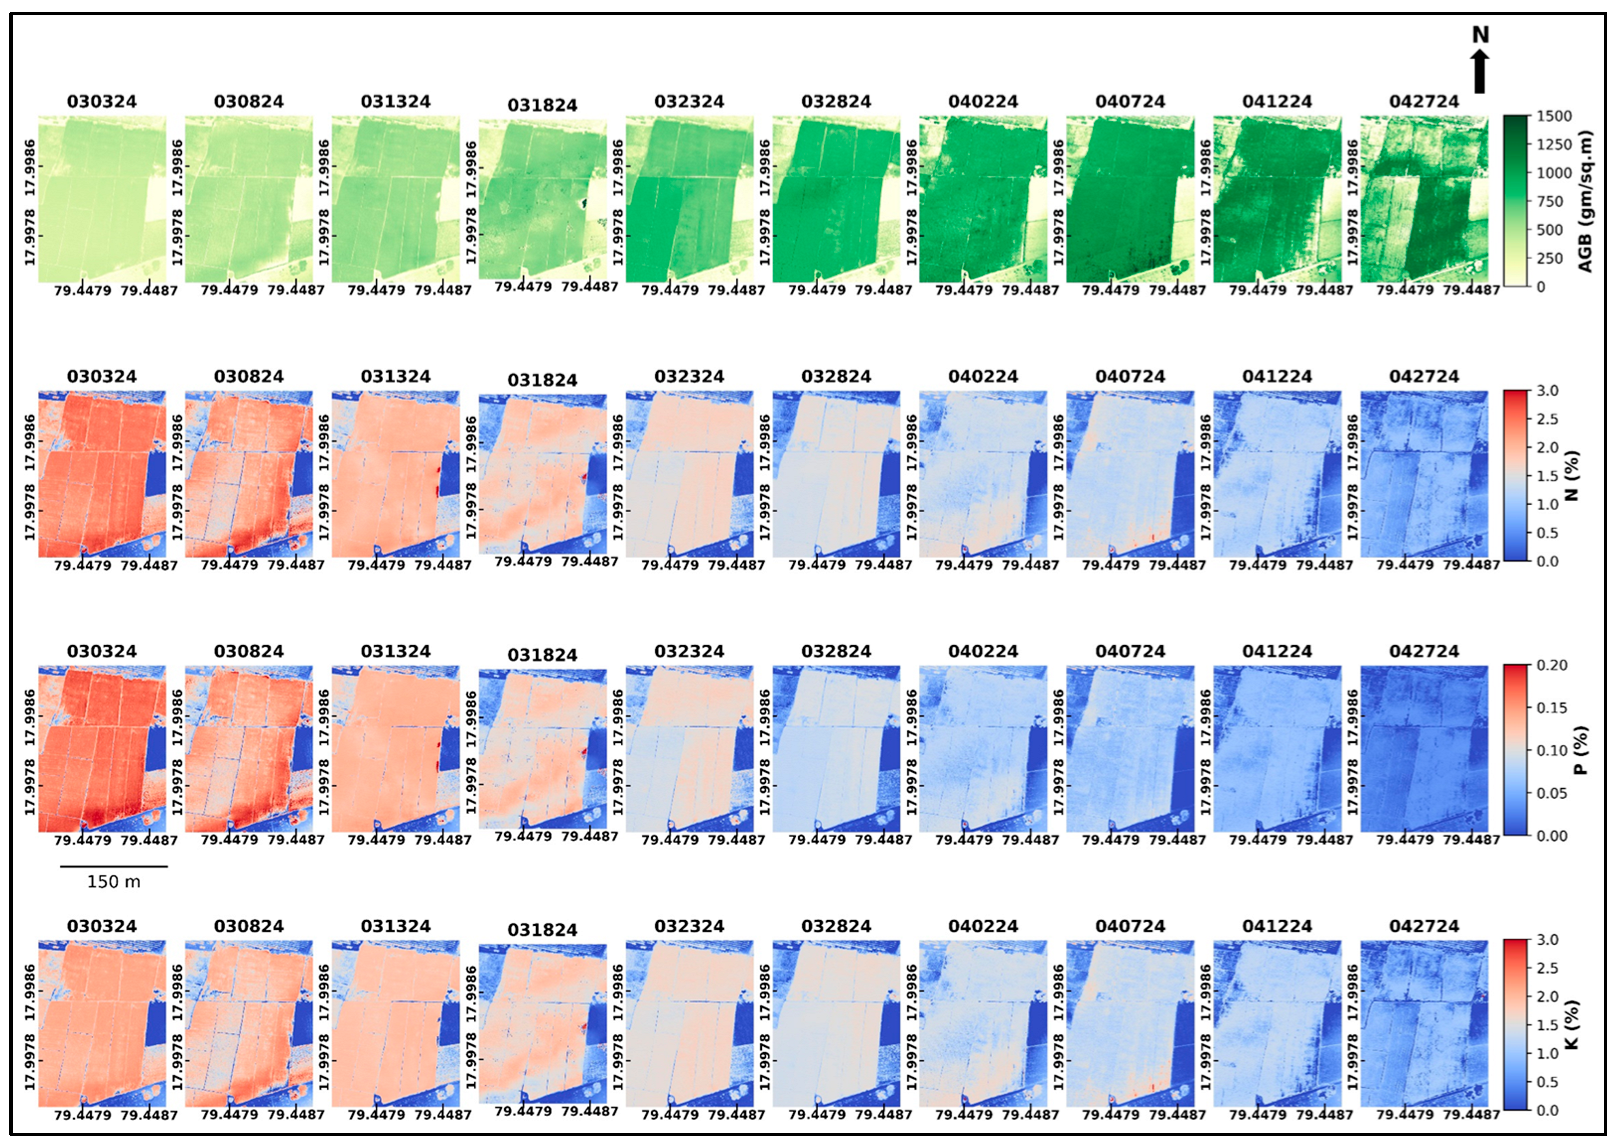
The temporal variation in the predicted AGB and NPK from 3 March 2024 to 27 April 2024 using the PLSR algorithm demonstrates a clear trend in crop growth and nutrient dynamics, and it is presented in Figure 10. On 3 March 2024 the mean AGB was 308 gm/m2 with a wide range from −14 to 473 gm/m2, while nutrient levels showed means of 1.90% for N, 0.13% for P, and 1.67% for K. As the season progressed, AGB reached a high of 846 gm/m2 on 12 April 2024 though the minimum dropped sharply to −101 gm/m2, suggesting model prediction variance. Later, AGB slightly declined to 705 gm/m2, with corresponding nutrient values of 0.71% for N, 0.02% for P, and 0.74% for K on 27 April 2024. Overall, this pattern illustrates a strong upward trend in biomass accumulation during the crop growth cycle, paired with a consistent decline in available nutrients, which is characteristic of progressive plant development and nutrient uptake from the soil.
The temporal variation in predicted AGB and NPK from 3 March 2024 to 27 April 2024 highlights progressive crop development and corresponding nutrient uptake, and the results are illustrated in Figure 11. On 3 March 2024 the mean AGB was 306 gm/m2, with N, P, and K concentrations averaging 1.91%, 0.13%, and 1.68%, respectively. As the crop grew, there was a steady increase in AGB, which peaked at 857 gm/m2 on 12 April 2024. Meanwhile, nutrient levels declined together, with N dropping from 1.31% on 3 March 2024 to 0.95% by 12 April 2024, P reducing from 0.08% to 0.05%, and K from 1.30% to 0.96%, indicating active nutrient uptake by the crop. On 27 April 2024, AGB slightly declined to 731 g/m2, and nutrient concentrations further dropped to 0.71% for N, 0.02% for P, and 0.71% for K.

3.5. Validation Metrics of Predicted AGB and NPK

The validation metrics for predicting AGB using different ML models revealed notable variations in performance, and these statistical metrics are presented in Figure 12. In terms of R2, both RF and XGBoost consistently demonstrated high predictive accuracy across all dates. RF showed R2 values peaking at 0.99 on 23 March 2024, while XGBoost maintained similarly high values, reaching up to 0.96 on 12 April 2024. MLR and PLSR demonstrated more variability, with R2 dropping to 0.69 and 0.65, respectively, on 12 April 2024, and PLSR reaching a low of 0.48 on 27 April 2024, indicating reduced accuracy during certain periods.
RMSE values further highlight the predictive efficiency of the models. The RF model had the lowest RMSE on certain dates, such as 18.29 gm/m2 on 23 March 2024 and 24.81 gm/m2 on 3 March 2024, showcasing its high precision. The XGBoost prediction model also maintained relatively low RMSE values, reinforcing its strong R2 results, though it increased to 276.97 gm/m2 on 27 April 2024, suggesting potential model degradation or inconsistent data. In contrast, MLR and PLSR recorded significantly higher RMSEs, particularly in April; both models showed extreme errors of 241.67 gm/m2 on 12 April 2024 and 271.79 gm/m2 on 27 April 2024.
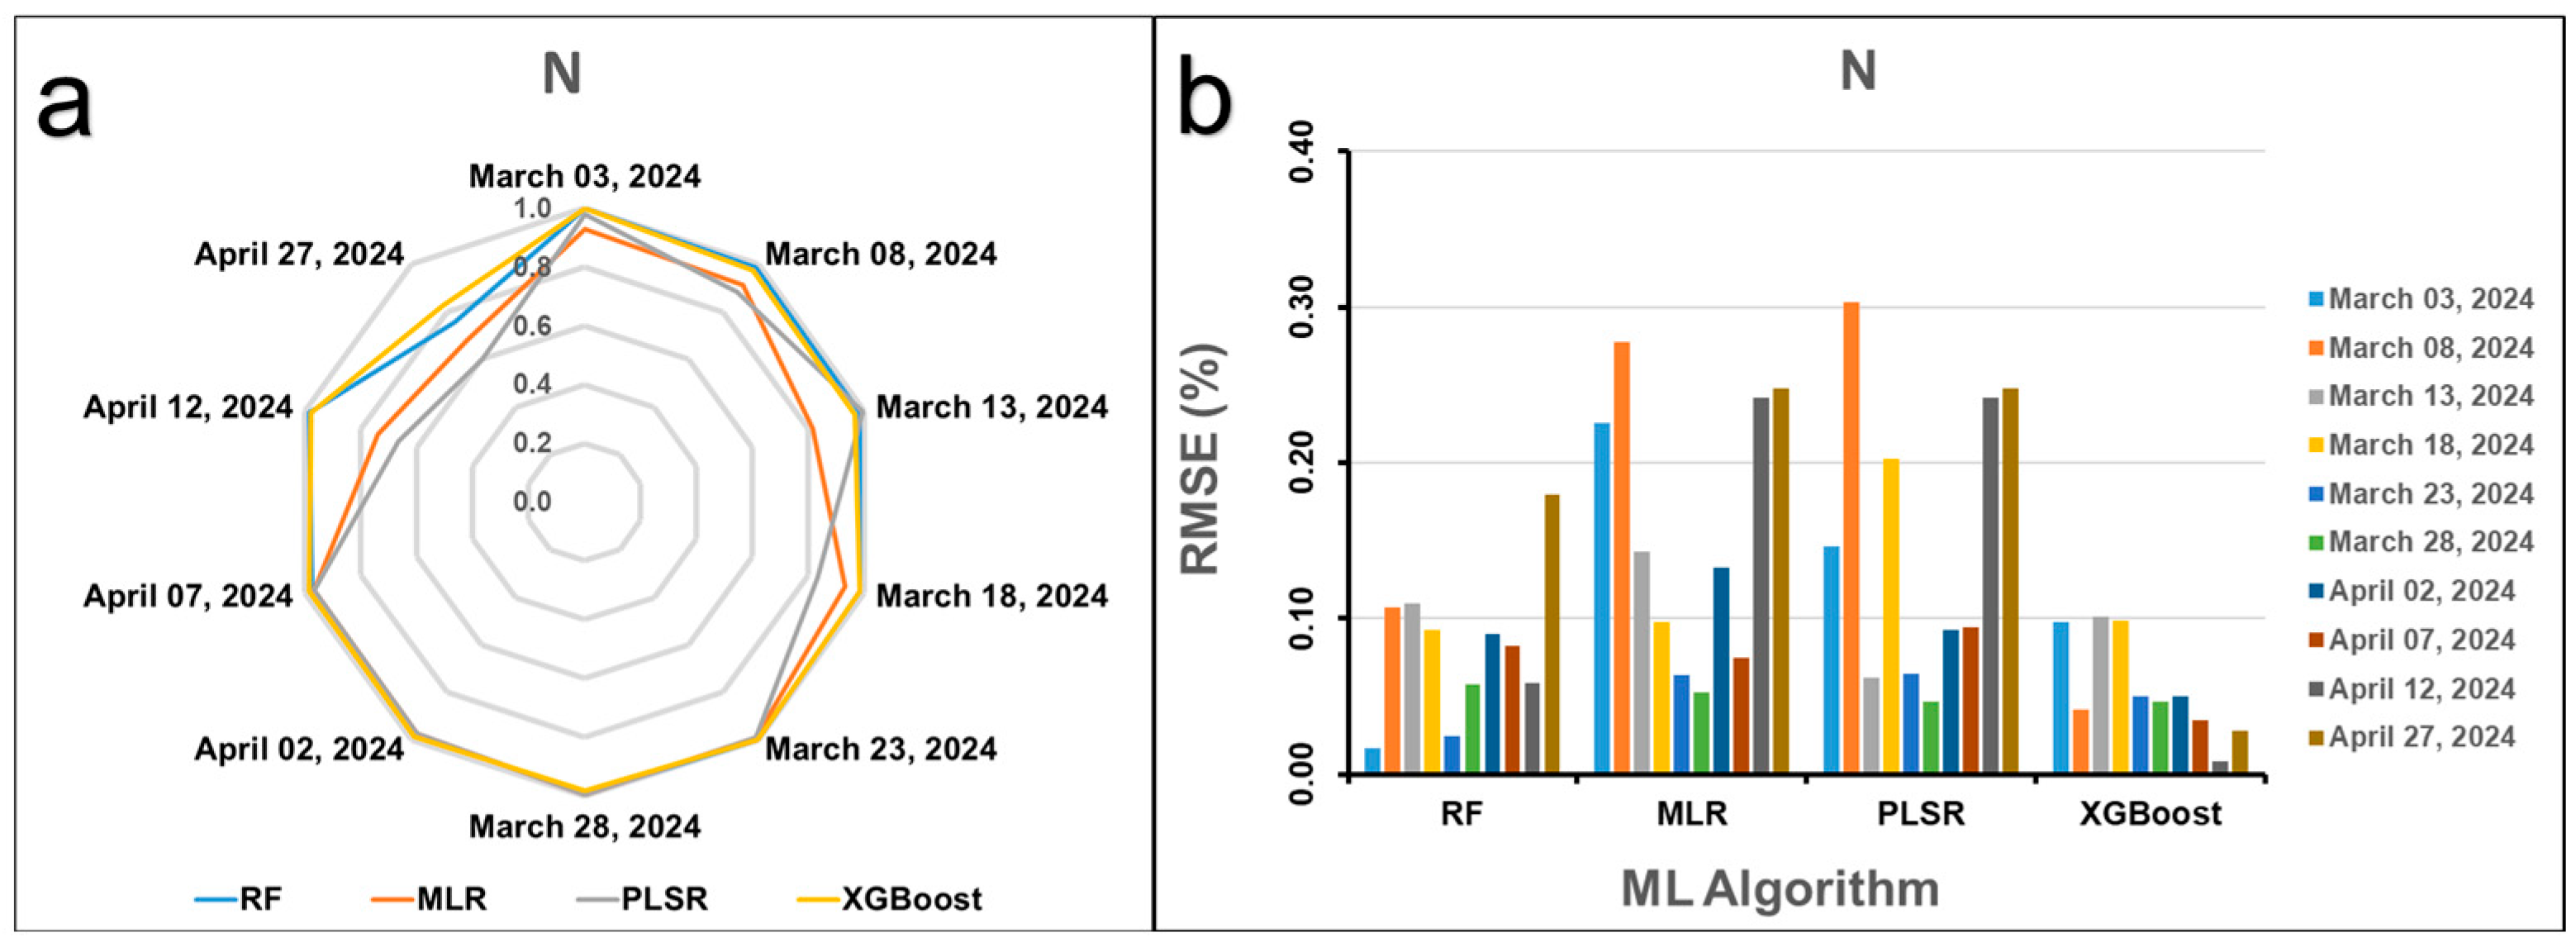
The performance of different ML models was evaluated for predicting nitrogen content using R2 and RMSE across various dates in March and April 2024; these results are presented in Figure 13. Based on R2 values, RF and XGBoost consistently delivered strong predictive capabilities, with both achieving perfect R2 scores (1.0) on 3 March 2024 and 23 March 2024. Throughout the study period, RF maintained R2 values above 0.97 on most dates, except for a notable decline to 0.75 on 27 April 2024. XGBoost showed similarly high R2 values, staying above 0.97 on most dates and slightly dropping to 0.82 on 27 April 2024. MLR and PLSR, while showing acceptable performance early in the period, displayed reduced accuracy in later dates, with both models dropping below 0.70 on 12 April 2024 and 27 April 2024.
RMSE values support these findings, further highlighting the performance of XGBoost and RF. XGBoost consistently achieved the lowest RMSE across nearly all dates, with values as low as 0.01% on 12 April 2024 and 0.03% on 27 April 2024, indicating very minimal error in its predictions. RF also demonstrated strong accuracy with RMSE values typically under 0.1%, though it rose to 0.18% on 27 April 2024. MLR and PLSR recorded higher and more variable RMSEs, with particularly poor results on 12 April 2024 and 27 April 2024, when both models reached 0.24% and 0.25%, respectively.
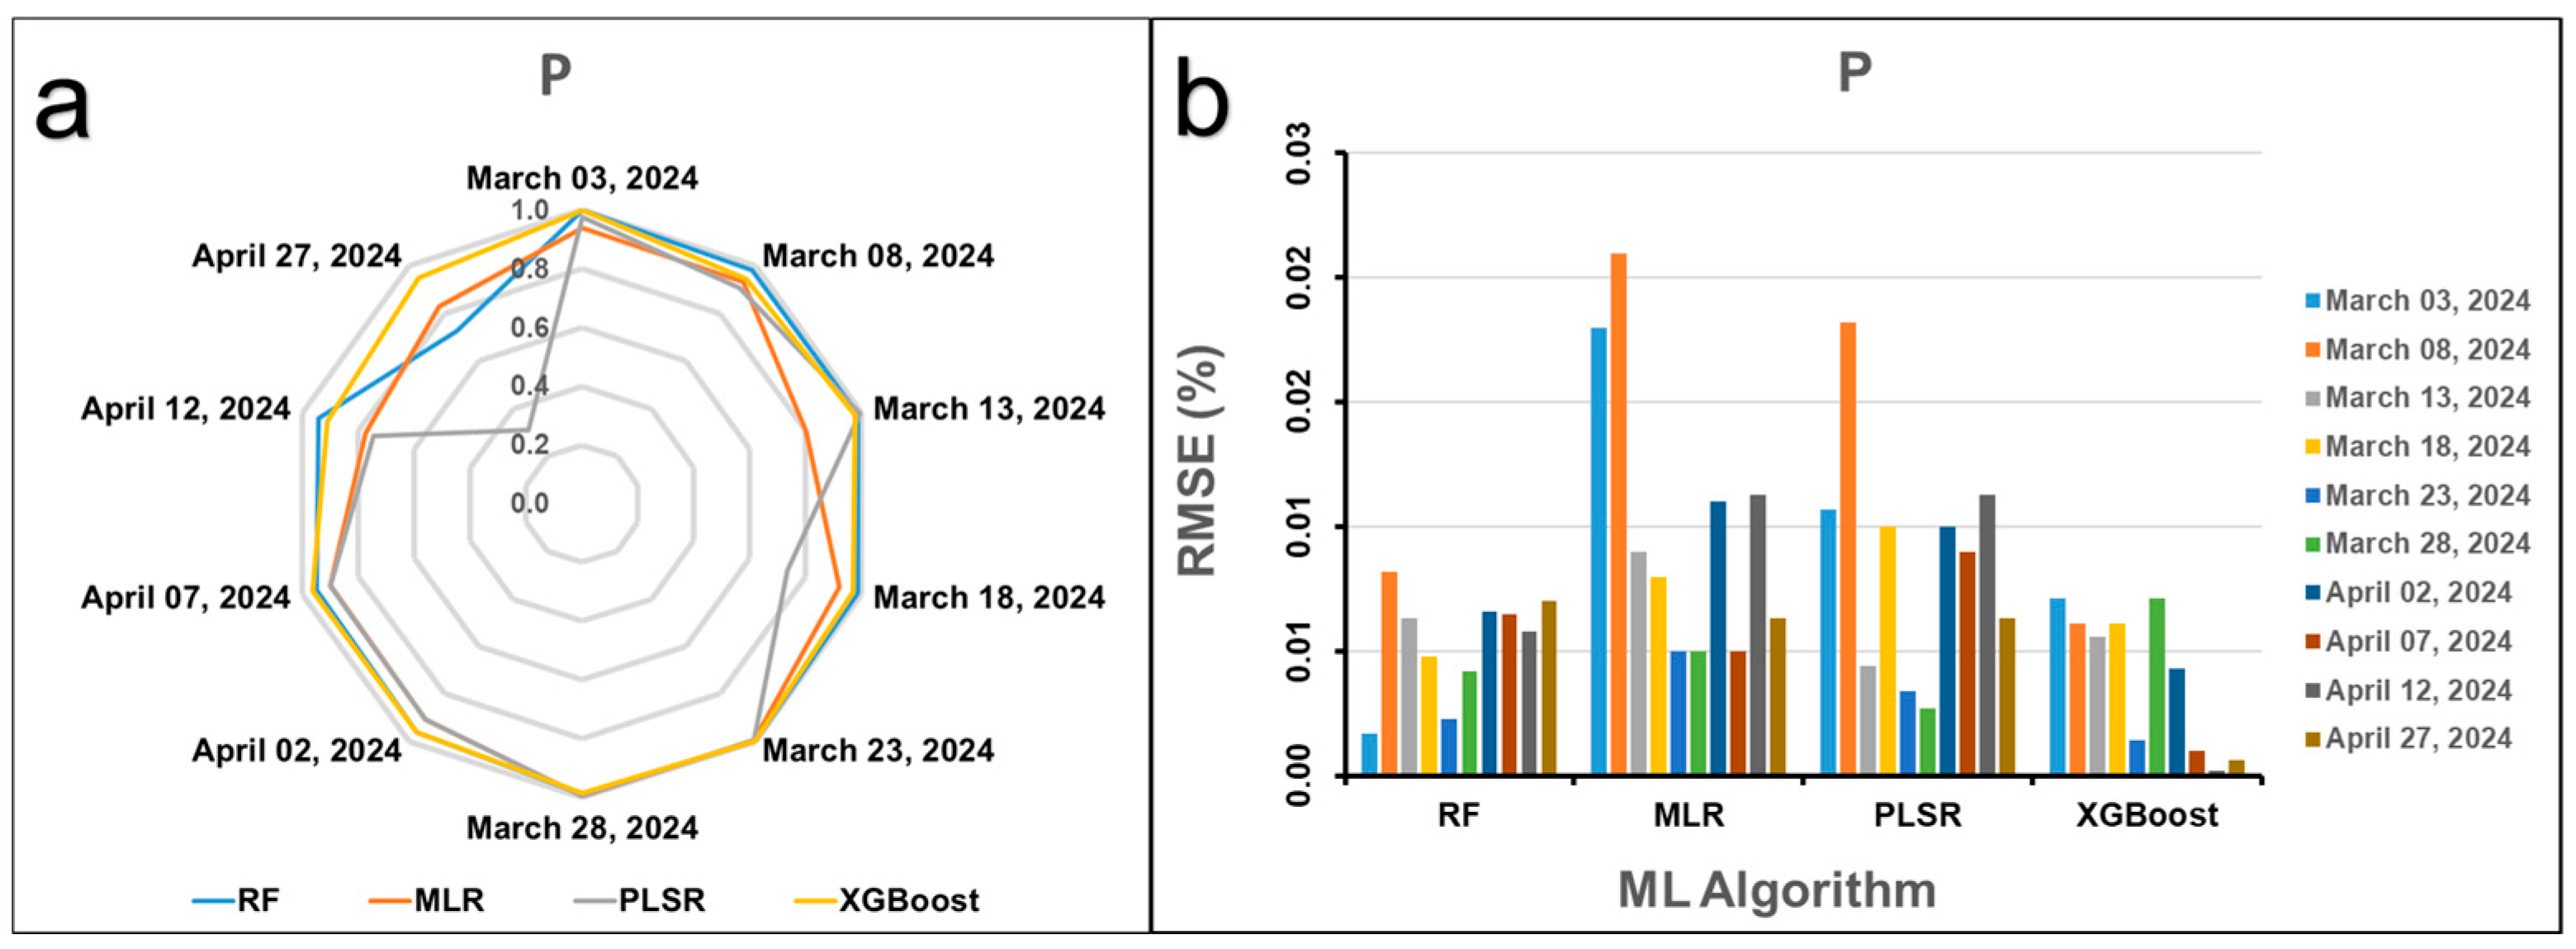
The validation results for phosphorus content prediction using various ML models are presented in Figure 14, showing consistently strong model performance, especially by the RF and XGBoost models. Both RF and XGBoost achieved perfect or near-perfect R2 values on multiple dates, with high R2 (1.0) on 3 March 2024 and 23 March 2024 for both models, and high values sustained throughout the study period. XGBoost maintained particularly strong performance with R2 values consistently above 0.90, including a high of 0.95 on 27 April 2024. RF followed closely but showed a notable drop to 0.73 on the same date. MLR and PLSR also performed well on many dates but were less consistent. For instance, MLR had high R2 scores on 28 March 2024, but dropped to 0.78 on 12 April 2024. PLSR showed a steep decline to 0.31 on 27 April 2024, indicating model instability under certain conditions.
RMSE values further highlight the predictive strength of RF and XGBoost. Both models frequently achieved very low to zero error, with RF recording an RMSE of 0.0% on several dates including March 3, 18, 23, and 28, and XGBoost matching that performance on multiple occasions including 23 March 2024 and throughout April. MLR and PLSR also had low RMSE values generally around 0.01% or lower, but were slightly less consistent, with minor variations across dates. Despite some fluctuations, all models performed reasonably well in predicting P, though XGBoost emerged as the most stable and accurate, particularly evident in its ability to maintain high R2 and minimal RMSE even when other models showed signs of degradation, such as on 27 April 2024.
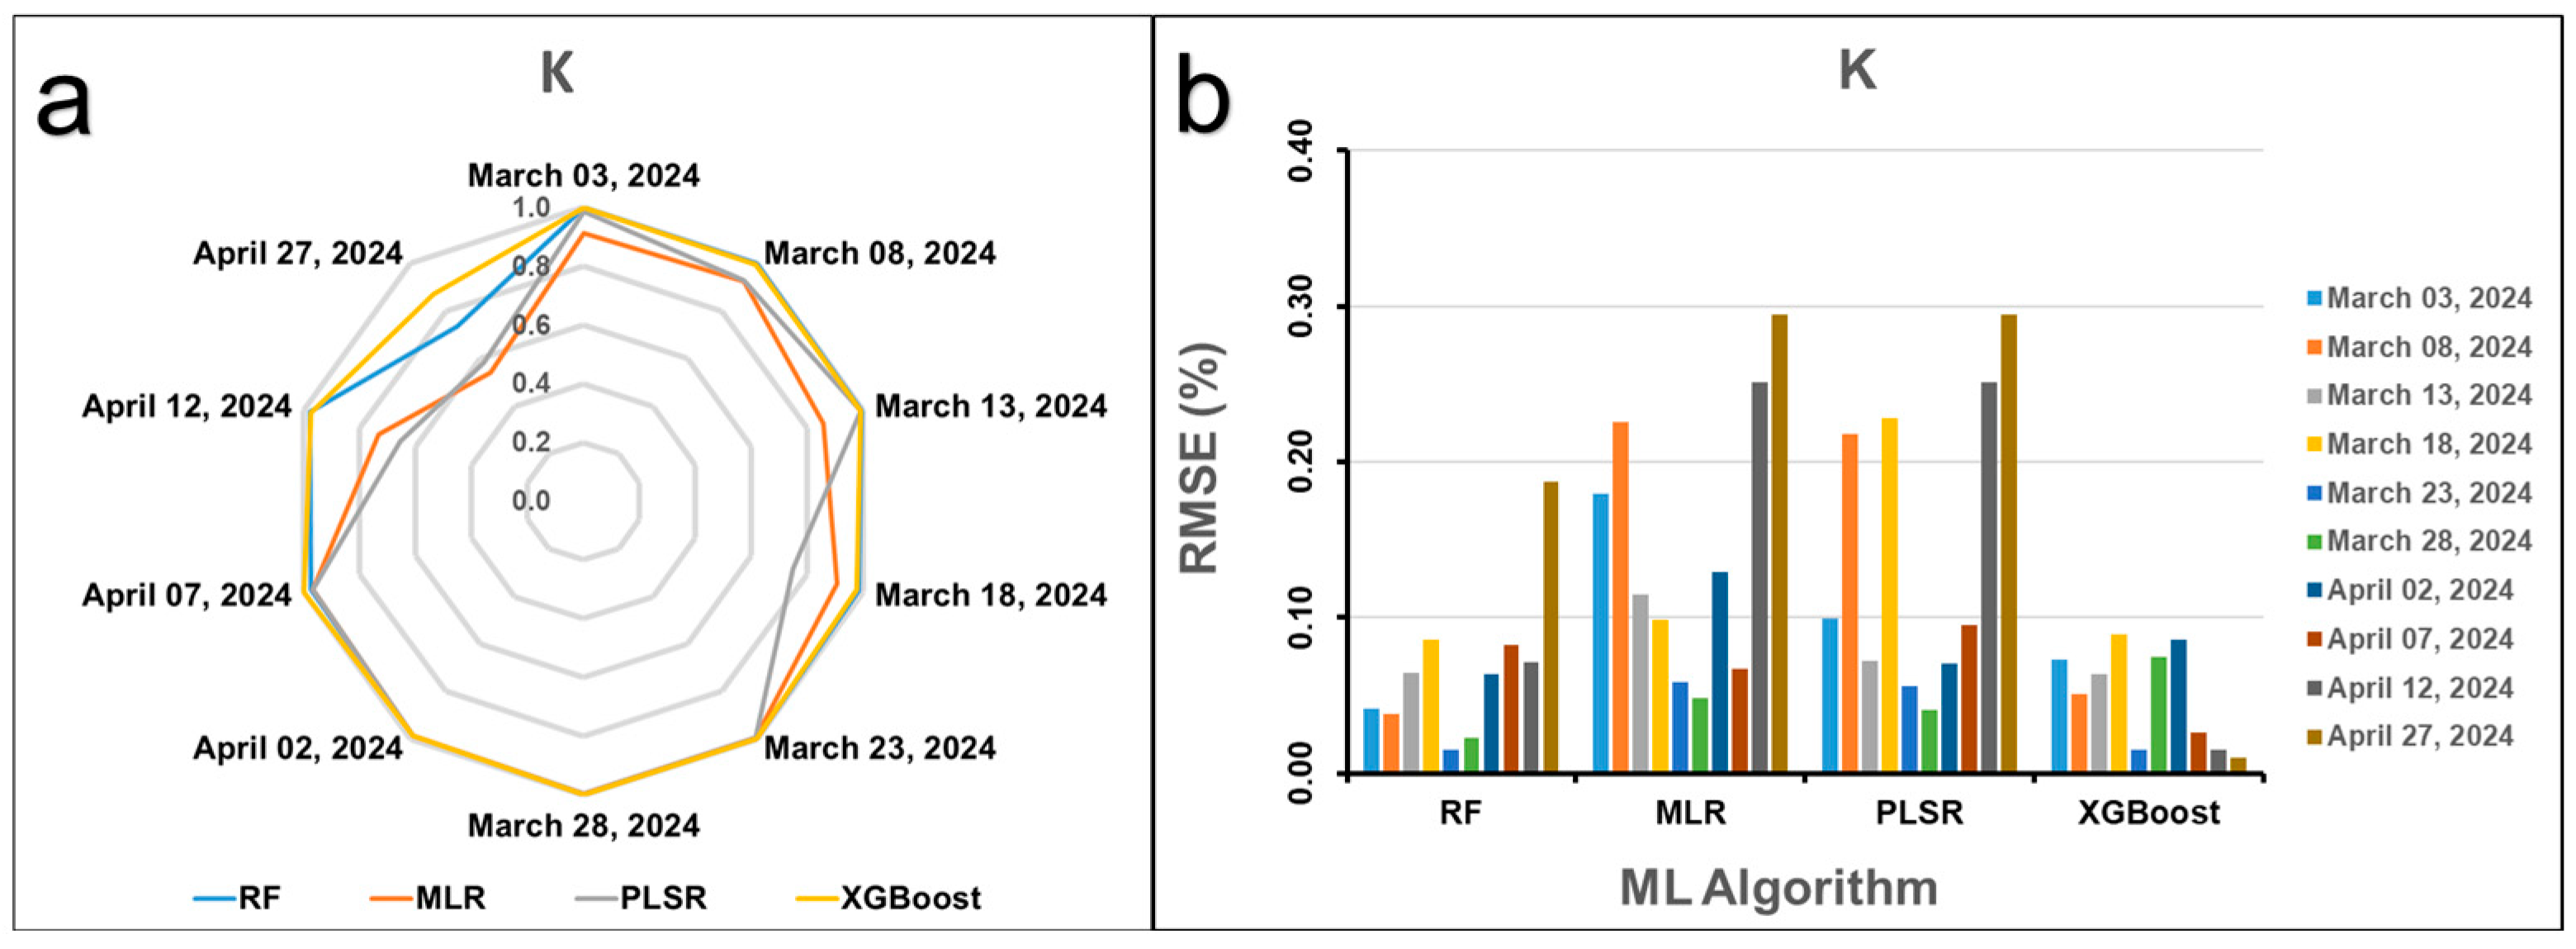
The validation metrics for potassium content prediction using the four ML models are presented in Figure 15; these demonstrated a strong overall performance, particularly for RF and XGBoost. Throughout the period, both RF and XGBoost achieved near-perfect R2 values on most dates, including perfect scores (1.0) on March 3, 23, and 28. XGBoost maintained R2 values above 0.98 even on challenging dates, with a slight dip to 0.870 on 27 April 2024. RF similarly showed high accuracy, although its R2 dropped to 0.730 on the same date. In contrast, MLR and PLSR displayed more variability, with R2 values dropping below 0.60 on 27 April 2024, indicating a decline in their predictive reliability during more complex or variable conditions.
RMSE values further affirm the superior predictive capabilities of RF and XGBoost. XGBoost consistently achieved the lowest RMSE across the dataset, ranging from as low as 0.01% on April 23, 12, and 27 to 0.09 on 18 March 2024. RF also maintained low RMSE values, often under 0.060, with a notable increase to 0.190 on 27 April 2024. In contrast, the MLR and PLSR models showed significantly higher RMSEs on several dates, particularly in April, with values peaking at 0.290, which highlights their reduced stability and accuracy.

3.6. Crop Health Assessment

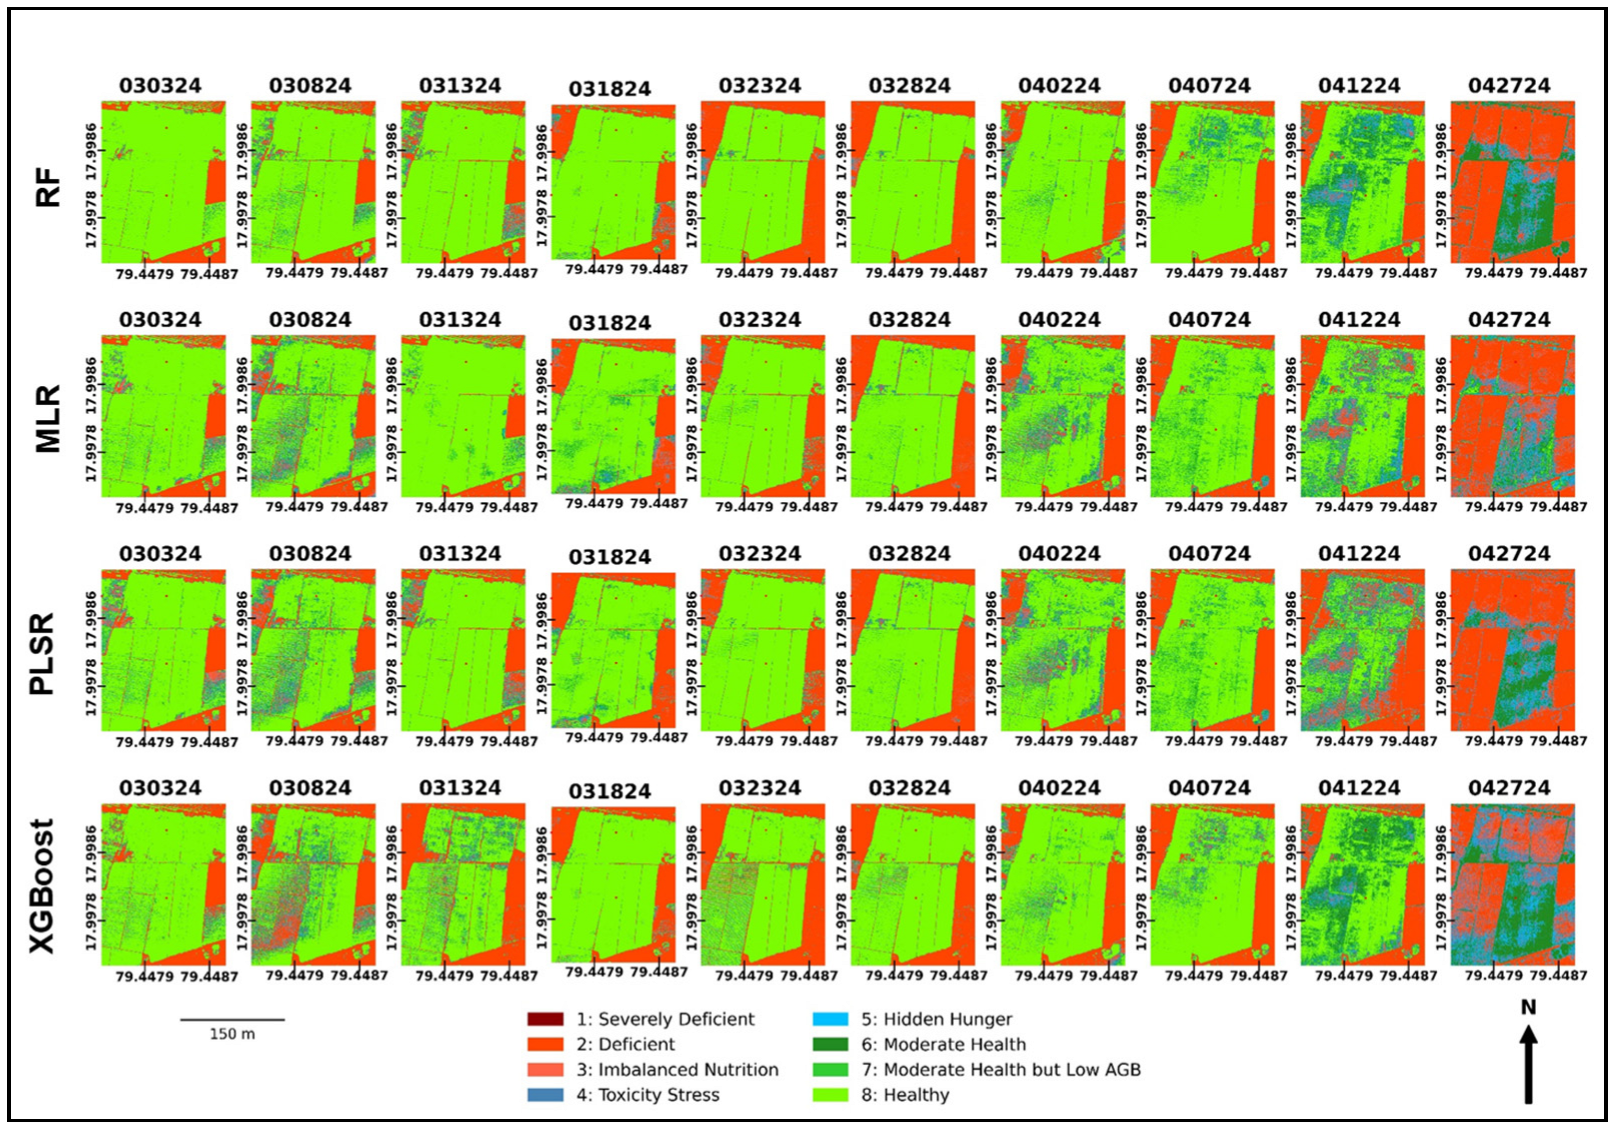
The temporal variation in crop health conditions is derived from the predicted values of AGB and NPK, which are estimated using various ML models. Based on these predictions, a decision-making rule is applied to categorize the crop’s health status into conditions such as severely deficient, deficient, imbalanced nutrition, toxicity stress, hidden hunger, moderate health, moderate health but low AGB, and healthy. The resulting crop health maps (Figure 16) not only reflect the spatial distribution of health conditions but also reveal their temporal dynamics across different stages of the crop growth cycle. This information is particularly useful for identifying areas in which the paddy crop may be suffering from nutrient deficiencies or stress due to over-fertilization, toxicity, or other agronomic constraints.
The validation metrics of predicted crop health conditions from the predicted AGB and NPK using four ML models across various temporal dates ranging from 3 March 2024 to 27 April 2024 are presented in Table 4. Accuracy metrics were evaluated to quantify the agreement between predicted health conditions and actual observations. Overall, RF and XGBoost consistently outperformed other models, maintaining a high F1 score of 1.00 and Kc of 1.00 during early prediction dates. However, as the season progressed, XGBoost model performance slightly declined, with F1 score and Kappa dropping to 0.42 and 0.29, respectively, by 27 April 2024, though still outperforming others. The RF model showed strong predictive performance, particularly in the early season, with F1 scores ranging from 0.98 to 1.00 and Kc values from 0.89 to 1.00 during early dates, though it too saw degradation in accuracy in later stages (F1 score of 0.36, Kc of 0.22 by 27 April 2024). The MLR and PLSR models exhibited relatively lower accuracy with observed data, especially in later stages of the crop cycle. MLR’s performance dropped significantly in April, with F1 scores falling to 0.33 and Kc to 0.18, while PLSR showed similar trends, with the lowest Kc of 0.15 by 12 April 2024.

4. Discussion

4.1. Prediction of AGB and NPK

The prediction of AGB and NPK across multiple temporal observations using various ML models provided insightful trends regarding crop growth and nutrient dynamics throughout the paddy growing season. Across all models, AGB increased progressively, followed by a slight decline towards late April due to harvesting in some areas, while NPK concentrations exhibited a continuous downward trend, signifying active nutrient uptake during biomass accumulation and reproductive stages of the crop. This trend aligns biologically with crop development stages, during which nutrient translocation occurs from vegetative tissues to reproductive organs, especially throughout grain filling [30].
Among the models, RF demonstrated strong performance in capturing the AGB dynamics, achieving low prediction errors (RMSE of 18.29 gm/m2 on 23 March 2024), indicating its reliability and accuracy in predicting biomass. However, performance slightly degraded in the later growth stages (27 April 2024), potentially due to changes in crop phenology or changes in canopy structure [5,15]. RF can be computationally intensive and less interpretable due to its ensemble nature [13,35,36].
The XGBoost model, another advanced ensemble learning technique, also demonstrated excellent performance, frequently matching or exceeding RF, particularly for nutrient predictions (RMSE as low as 0.01% for N and P). XGBoost maintained stability even under data variability and was more resilient on dates such as 27 April 2024, when RF showed slight performance drops. Its regularization capability helps avoid overfitting and maintains model performance across different crop stages. However, XGBoost’s complexity may pose challenges in parameter tuning and model transparency for domain specialists [9,31,32].
In contrast, traditional regression-based models such as MLR and PLSR exhibited greater prediction variability and were less capable of modeling complex relationships. For instance, PLSR produced negative AGB predictions, especially on later dates, indicating sensitivity to data noise and limitations in capturing complex, non-linear relationships [10,37,38]. The lower R2 values (0.48 for AGB on 27 April 2024) and higher RMSE values (up to 271.79 gm/m2) in both MLR and PLSR underscore their limited applicability in dynamic crop growth modeling using UAV-derived indices.
The nutrient prediction performance showed similar patterns. RF and XGBoost achieved near perfect R2 values and minimal RMSEs for N, P, and K, while MLR and PLSR produced fluctuating and sometimes biologically implausible outputs. This further confirms that non-linear ensemble models are better suited for high-dimensional remote sensing data, as they can effectively model complex interactions between spectral indices and crop attributes [39,40,41].
Overall, the findings underscore the superior performance of ensemble ML models, especially RF and XGBoost, in capturing temporal changes in AGB and NPK with high consistency and precision. The slight drop in accuracy in the harvesting stage may indicate model sensitivity to changing canopy structure or saturation of spectral responses, suggesting the need for model recalibration or the incorporation of additional variables (environmental conditions or phenological indicators) for improved late-stage predictions.

4.2. Crop Health Assessment

The integration of predicted AGB and nutrient parameters with decision-making rules proved effective in evaluating the spatial and temporal dynamics of crop health conditions. The results highlight that ML models, particularly RF and XGBoost, delivered superior performance in early to mid-season stages, achieving high F1 scores (up to 1.00) and Kc (up to 1.00), indicating strong agreement with observed health conditions. These models showed robustness in handling complex relationships between vegetation indices and crop parameters, especially in high-biomass and nutrient-deficient scenarios [31,42]. However, a gradual decline in predictive accuracy was observed across all models as the season progressed. By late April, both RF and XGBoost exhibited noticeable drops in performance, with XGBoost’s F1 score and Kc falling to 0.42 and 0.29, respectively, and RF’s to 0.36 and 0.22. This degradation is likely due to phenological complexity, and non-linear nutrient interactions in later stages of the crop cycle that are harder to capture with static model training [6,43]. Moreover, the reduced performance of linear models like MLR and PLSR, especially in later stages (Kc < 0.2), underscores their limited capacity to model complex and dynamic crop systems.
Despite these challenges, the proposed approach demonstrates a significant advancement in early season crop health monitoring. By using UAV-derived imagery and predictive modeling, early interventions can be designed more effectively, which is particularly crucial in managing nutrient stress and optimizing input application.
In summary, while model performance declines with crop maturity due to increasing system complexity, the early season predictive accuracy is sufficiently high to inform proactive and targeted crop management. Future research should explore dynamic model updating across crop stages and multi-source data fusion to further improve the accuracy and resilience of predictions under variable field conditions.

5. Conclusions

In this study, UAV multispectral data were captured at 5-day intervals from 3 March 2024 to 27 April 2024, to monitor the growth and nutrient dynamics of paddy crops across multiple stages. VIs derived from UAV imagery were used to predict AGB and NPK using four ML models. The predicted values were then utilized in a decision-making framework to generate spatial crop health maps, enabling early detection of nutrient stress and variability. This integrative approach provides a scalable and data-driven solution for precision agriculture.
The key findings of the study are as follows:
  • UAV-derived VIs effectively captured spatial and temporal variability in crop health and nutrient status across multiple growth stages.
  • RF and XGBoost outperformed other models by achieving higher R2 values and lower RMSE for the prediction of AGB and NPK.
  • A comprehensive decision-making framework was developed to classify the crop’s health condition into eight categories using 54 AGB and NPK combinations.
  • The generated crop health maps, based on predicted AGB and NPK values, demonstrated high classification accuracy when validated against field observations using the same decision framework.
  • The proposed integration of UAV imagery, machine learning, and rule-based decision making presents a robust, scalable, and innovative approach to crop health monitoring, supporting timely, site-specific interventions and promoting sustainable agriculture.
This research demonstrates the potential of remote sensing and ML algorithms to transform agricultural management by enabling proactive decision making, improving resource use efficiency, and contributing to food security in an environmentally responsible manner.

Supplementary Materials

The following supporting information can be downloaded at: https://www.mdpi.com/article/10.3390/agronomy15092059/s1, Figure S1: Feature importance of vegetation indices for predicting the AGB, N, P and K.

Author Contributions

Conceptualization, A.R.A.; methodology, A.R.A.; software, A.R.A.; data collection, A.R.A.; processing, A.R.A.; analysis, A.R.A.; validation, A.R.A.; writing—original draft, A.R.A.; writing—review and editing, S.M.; funding acquisition, S.M. All authors have read and agreed to the published version of the manuscript.

Funding

This work was supported by the Science and Engineering Research Board, Department of Science & Technology, Government of India [Grant No. CRG/2022/008231].

Data Availability Statement

The data used to support this study are available from the corresponding author upon request.

Acknowledgments

I would like to express my sincere gratitude to Ch. Ramulu, at the Regional Agricultural Research Station, Warangal, for his invaluable support, timely feedback, and generous sharing of knowledge that greatly contributed to the successful completion of the leaf nutrient assessments, which are a critical part of this research. I also extend my heartfelt gratitude to M. Raja Vishwanathan, in the Department of Humanities and Social Sciences at the National Institute of Technology, Warangal, for his meticulous review and insightful English corrections of my work.

Conflicts of Interest

The authors declare no conflicts of interest.

Abbreviations

The following abbreviations are used in this manuscript:
UAVUnmanned Aerial vehicle
AGBAbove-Ground Biomass
NNitrogen
PPhosphorous
KPotassium
MLMachine Learning
RFRandom Forest
MLRMultiple Linear Regression
PLSRPartial Least Square Regression
XGBoostExtreme Gradient Boosting
RMSERoot Mean Square Error
R2Coefficient of Determination
GCPGround Control Points
GPSGlobal Positioning System
IMUInertial Measurement System
DGPSDifferential Global Positioning System
NIRNear Infra-Red Band
RRed Band
GGreen Band
BBlue Band
RERed Edge Band
RGBRed Green Blue
LSoil Adjustment Factor
MSMultispectral
VIVegetation Indices
NDVINormalized Difference Vegetation Index
GNDVIGreen Normalized Difference Vegetation Index
NDRENormalized Difference Red Edge Index
GCIGreen Chlorophyll Index
CI_RERed Edge Chlorophyll Index
RVIRatio Vegetation Index
LCILeaf Chlorophyll Index
SAVISoil Adjusted Vegetation Index
EVI2Enhanced Vegetation Index 2
SDStandard Deviation
H2So4Sulphuric Acid
HClO4Perchloric Acid
NaOHSodium Hydroxide
HClHydrochloric Acid
IRRIInternational Rice Research Institute
KcKappa Coefficient

References

  1. Adhav, V.; Das, S.; Patkar, V. Crop Health Monitoring Using Geospatial Technologies for Nashik District, Maharashtra. Int. J. Mod. Agric. 2021, 10, 1395–1409. [Google Scholar]
  2. Na, I.S.; Lee, S.; Alamri, A.M.; AlQahtani, S.A. Remote Sensing and AI-Based Monitoring of Legume Crop Health and Growth. Legume Res. Int. J. 2024, 47, 1179–1184. [Google Scholar] [CrossRef]
  3. Lu, N.; Wang, W.; Zhang, Q.; Li, D.; Yao, X.; Tian, Y.; Zhu, Y.; Cao, W.; Baret, F.; Liu, S.; et al. Estimation of Nitrogen Nutrition Status in Winter Wheat From Unmanned Aerial Vehicle Based Multi-Angular Multispectral Imagery. Front. Plant Sci. 2019, 10, 1601. [Google Scholar] [CrossRef]
  4. Yu, F.; Bai, J.; Jin, Z.; Zhang, H.; Yang, J.; Xu, T. Estimating the Rice Nitrogen Nutrition Index Based on Hyperspectral Transform Technology. Front. Plant Sci. 2023, 14, 1118098. [Google Scholar] [CrossRef] [PubMed]
  5. Wang, Z.; Ma, Y.; Chen, P.; Yang, Y.; Fu, H.; Yang, F.; Raza, M.A.; Guo, C.; Shu, C.; Sun, Y.; et al. Estimation of Rice Aboveground Biomass by Combining Canopy Spectral Reflectance and Unmanned Aerial Vehicle-Based Red Green Blue Imagery Data. Front. Plant Sci. 2022, 13, 903643. [Google Scholar] [CrossRef] [PubMed]
  6. Dobermann, A.; Fairhurst, T. Rice: Nutrient Disorders & Nutrient Management, 1st ed.; Potash & Phosphate Institute [u.a.]: Singapore, 2000; ISBN 978-981-04-2742-9. [Google Scholar]
  7. Karmakar, P.; Teng, S.W.; Murshed, M.; Pang, S.; Li, Y.; Lin, H. Crop Monitoring by Multimodal Remote Sensing: A Review. Remote Sens. Appl. Soc. Environ. 2024, 33, 101093. [Google Scholar] [CrossRef]
  8. Biswal, S.; Pathak, N.; Chatterjee, C.; Mailapalli, D.R. Estimation of Aboveground Biomass from Spectral and Textural Characteristics of Paddy Crop Using UAV-Multispectral Images and Machine Learning Techniques. Geocarto Int. 2024, 39, 2364725. [Google Scholar] [CrossRef]
  9. Nduku, L.; Munghemezulu, C.; Mashaba-Munghemezulu, Z.; Masiza, W.; Ratshiedana, P.E.; Kalumba, A.M.; Chirima, J.G. Field-Scale Winter Wheat Growth Prediction Applying Machine Learning Methods with Unmanned Aerial Vehicle Imagery and Soil Properties. Land 2024, 13, 299. [Google Scholar] [CrossRef]
  10. Yang, B.; Wang, M.; Sha, Z.; Wang, B.; Chen, J.; Yao, X.; Cheng, T.; Cao, W.; Zhu, Y. Evaluation of Aboveground Nitrogen Content of Winter Wheat Using Digital Imagery of Unmanned Aerial Vehicles. Sensors 2019, 19, 4416. [Google Scholar] [CrossRef] [PubMed]
  11. Zhu, Y.; Myint, S.W.; Liu, K.; Liu, L.; Cao, J. Integration of UAV LiDAR and WorldView-2 Images for Modeling Mangrove Aboveground Biomass with GA-ANN Wrapper. Ecol. Process. 2024, 13, 85. [Google Scholar] [CrossRef]
  12. Singhal, G.; Bansod, B.; Mathew, L.; Goswami, J.; Choudhury, B.U.; Raju, P.L.N. Estimation of Leaf Chlorophyll Concentration in Turmeric (Curcuma longa) Using High-Resolution Unmanned Aerial Vehicle Imagery Based on Kernel Ridge Regression. J. Indian Soc. Remote Sens. 2019, 47, 1111–1122. [Google Scholar] [CrossRef]
  13. Astaoui, G.; Dadaiss, J.E.; Sebari, I.; Benmansour, S.; Mohamed, E. Mapping Wheat Dry Matter and Nitrogen Content Dynamics and Estimation of Wheat Yield Using UAV Multispectral Imagery Machine Learning and a Variety-Based Approach: Case Study of Morocco. AgriEngineering 2021, 3, 29–49. [Google Scholar] [CrossRef]
  14. Smith, D.T.L.; Chen, Q.; Massey-Reed, S.R.; Potgieter, A.B.; Chapman, S.C. Prediction Accuracy and Repeatability of UAV Based Biomass Estimation in Wheat Variety Trials as Affected by Variable Type, Modelling Strategy and Sampling Location. Plant Methods 2024, 20, 129. [Google Scholar] [CrossRef] [PubMed]
  15. Yang, K.; Mo, J.; Luo, S.; Peng, Y.; Fang, S.; Wu, X.; Zhu, R.; Li, Y.; Yuan, N.; Zhou, C.; et al. Estimation of Rice Aboveground Biomass by UAV Imagery with Photosynthetic Accumulation Models. Plant Phenomics 2023, 5, 56. [Google Scholar] [CrossRef]
  16. Costa, L.; Kunwar, S.; Ampatzidis, Y.; Albrecht, U. Determining Leaf Nutrient Concentrations in Citrus Trees Using UAV Imagery and Machine Learning. Precis. Agric. 2022, 23, 854–875. [Google Scholar] [CrossRef]
  17. Liu, K.; Wang, Y.; Peng, Z.; Xu, X.; Liu, J.; Song, Y.; Di, H.; Hua, D. Monitoring Soil Nutrients Using Machine Learning Based on UAV Hyperspectral Remote Sensing. Int. J. Remote Sens. 2024, 45, 4897–4921. [Google Scholar] [CrossRef]
  18. Khose, S.B.; Mailapalli, D.R. UAV-Based Multispectral Image Analytics and Machine Learning for Predicting Crop Nitrogen in Rice. Geocarto Int. 2024, 39, 2373867. [Google Scholar] [CrossRef]
  19. Shafi, U.; Mumtaz, R.; Iqbal, N.; Zaidi, S.M.H.; Zaidi, S.A.R.; Hussain, I.; Mahmood, Z. A Multi-Modal Approach for Crop Health Mapping Using Low Altitude Remote Sensing, Internet of Things (IoT) and Machine Learning. IEEE Access 2020, 8, 112708–112724. [Google Scholar] [CrossRef]
  20. Cen, H.; Wan, L.; Zhu, J.; Li, Y.; Li, X.; Zhu, Y.; Weng, H.; Wu, W.; Yin, W.; Xu, C.; et al. Dynamic Monitoring of Biomass of Rice under Different Nitrogen Treatments Using a Lightweight UAV with Dual Image-Frame Snapshot Cameras. Plant Methods 2019, 15, 32. [Google Scholar] [CrossRef]
  21. Adar, S.; Sternberg, M.; Paz-Kagan, T.; Henkin, Z.; Dovrat, G.; Zaady, E.; Argaman, E. Estimation of Aboveground Biomass Production Using an Unmanned Aerial Vehicle (UAV) and VENμS Satellite Imagery in Mediterranean and Semiarid Rangelands. Remote Sens. Appl. Soc. Environ. 2022, 26, 100753. [Google Scholar] [CrossRef]
  22. Asawapaisankul, R.; Rattanapichai, W.; Sajjaphan, K.; Pitakdantham, R.; Sermsak, R.; Lukas, V.; Klem, K.; Tubana, B. Correlation of Yield and Vegetation Indices from Unmanned Aerial Vehicle Multispectral Imagery in Thailand Rice Production Systems. Agrosystems Geosci. Environ. 2025, 8, e70107. [Google Scholar] [CrossRef]
  23. IdeaForge Q4i. Available online: https://ideaforgetech.com/ (accessed on 6 June 2025).
  24. Parrot Sequoia Documentation. Available online: https://www.parrot.com/en/support/documentation/sequoia (accessed on 6 June 2025).
  25. Stonex S900+ GNSS Receiver. Available online: https://www.stonex.it/product/s900-plus-gnss-receiver/ (accessed on 6 June 2025).
  26. Wang, J.; Meyer, S.T.; Xu, X.; Weisser, W.W.; Yu, K. Drone Multispectral Imaging Captures the Effects of Soil Mineral Nitrogen on Canopy Structure and Nitrogen Use Efficiency in Wheat. Comput. Electron. Agric. 2025, 235, 110342. [Google Scholar] [CrossRef]
  27. Tanaka, T.S.T.; Gislum, R. Prediction of Winter Wheat Nitrogen Status Using UAV Imagery, Weather Data, and Machine Learning. Eur. J. Agron. 2025, 164, 127534. [Google Scholar] [CrossRef]
  28. Yu, J.; Wang, J.; Leblon, B.; Song, Y. Nitrogen Estimation for Wheat Using UAV-Based and Satellite Multispectral Imagery, Topographic Metrics, Leaf Area Index, Plant Height, Soil Moisture, and Machine Learning Methods. Nitrogen 2021, 3, 1–25. [Google Scholar] [CrossRef]
  29. Peng, X.; Chen, D.; Zhou, Z.; Zhang, Z.; Xu, C.; Zha, Q.; Wang, F.; Hu, X. Prediction of the Nitrogen, Phosphorus and Potassium Contents in Grape Leaves at Different Growth Stages Based on UAV Multispectral Remote Sensing. Remote Sens. 2022, 14, 2659. [Google Scholar] [CrossRef]
  30. Liu, Y.; Ding, W.; He, P.; Xu, X.; Zhou, W. Estimating Thresholds of Nitrogen, Phosphorus and Potassium Fertilizer Rates for Rice Cropping Systems in China. Front. Plant Sci. 2024, 15, 1470774. [Google Scholar] [CrossRef]
  31. Li, Y.; Li, C.; Cheng, Q.; Chen, L.; Li, Z.; Zhai, W.; Mao, B.; Chen, Z. Precision Estimation of Winter Wheat Crop Height and Above-Ground Biomass Using Unmanned Aerial Vehicle Imagery and Oblique Photoghraphy Point Cloud Data. Front. Plant Sci. 2024, 15, 1437350. [Google Scholar] [CrossRef]
  32. Zhang, C.; Zhu, X.; Li, M.; Xue, Y.; Qin, A.; Gao, G.; Wang, M.; Jiang, Y. Utilization of the Fusion of Ground-Space Remote Sensing Data for Canopy Nitrogen Content Inversion in Apple Orchards. Horticulturae 2023, 9, 1085. [Google Scholar] [CrossRef]
  33. Surajit, K.; Datta, D. Principles and Practices of Rice Production; John Wiley & Sons: New York, NY, USA, 1981. [Google Scholar]
  34. Brady, N.C. Fundamentals of Rice Crop Science; International Rice Research Institute: Los Baños, Philippines, 1981. [Google Scholar]
  35. Chiu, M.S.; Wang, J. Evaluation of Machine Learning Regression Techniques for Estimating Winter Wheat Biomass Using Biophysical, Biochemical, and UAV Multispectral Data. Drones 2024, 8, 287. [Google Scholar] [CrossRef]
  36. Tunca, E.; Köksal, E.S.; Akay, H.; Öztürk, E.; Taner, S.Ç. Novel Machine Learning Framework for High-Resolution Sorghum Biomass Estimation Using Multi-Temporal UAV Imagery. Int. J. Environ. Sci. Technol. 2025, 22, 1–16. [Google Scholar] [CrossRef]
  37. Khan, M.S.; Yadav, P.; Semwal, M.; Prasad, N.; Verma, R.K.; Kumar, D. Predicting Canopy Chlorophyll Concentration in Citronella Crop Using Machine Learning Algorithms and Spectral Vegetation Indices Derived from UAV Multispectral Imagery. Ind. Crops Prod. 2024, 219, 119147. [Google Scholar] [CrossRef]
  38. Liu, Y.; Feng, H.; Yue, J.; Jin, X.; Fan, Y.; Chen, R.; Bian, M.; Ma, Y.; Song, X.; Yang, G. Improved Potato AGB Estimates Based on UAV RGB and Hyperspectral Images. Comput. Electron. Agric. 2023, 214, 108260. [Google Scholar] [CrossRef]
  39. Ndlovu, H.S.; Odindi, J.; Sibanda, M.; Mutanga, O.; Clulow, A.; Chimonyo, V.G.P.; Mabhaudhi, T. A Comparative Estimation of Maize Leaf Water Content Using Machine Learning Techniques and Unmanned Aerial Vehicle (UAV)-Based Proximal and Remotely Sensed Data. Remote Sens. 2021, 13, 4091. [Google Scholar] [CrossRef]
  40. Hu, J.; Feng, H.; Wang, Q.; Shen, J.; Wang, J.; Liu, Y.; Feng, H.; Yang, H.; Guo, W.; Qiao, H.; et al. Pretrained Deep Learning Networks and Multispectral Imagery Enhance Maize LCC, FVC, and Maturity Estimation. Remote Sens. 2024, 16, 784. [Google Scholar] [CrossRef]
  41. Hossen, M.A.; Diwakar, P.K.; Ragi, S. Total Nitrogen Estimation in Agricultural Soils via Aerial Multispectral Imaging and LIBS. Sci. Rep. 2021, 11, 12693. [Google Scholar] [CrossRef] [PubMed]
  42. Nidamanuri, R.R.; Jayakumari, R.; Ramiya, A.M.; Astor, T.; Wachendorf, M.; Buerkert, A. High-Resolution Multispectral Imagery and LiDAR Point Cloud Fusion for the Discrimination and Biophysical Characterisation of Vegetable Crops at Different Levels of Nitrogen. Biosyst. Eng. 2022, 222, 177–195. [Google Scholar] [CrossRef]
  43. Dai, Y.; Yu, S.; Ma, T.; Ding, J.; Chen, K.; Zeng, G.; Xie, A.; He, P.; Peng, S.; Zhang, M. Improving the Estimation of Rice Above-Ground Biomass Based on Spatio-Temporal UAV Imagery and Phenological Stages. Front. Plant Sci. 2024, 15, 1328834. [Google Scholar] [CrossRef]
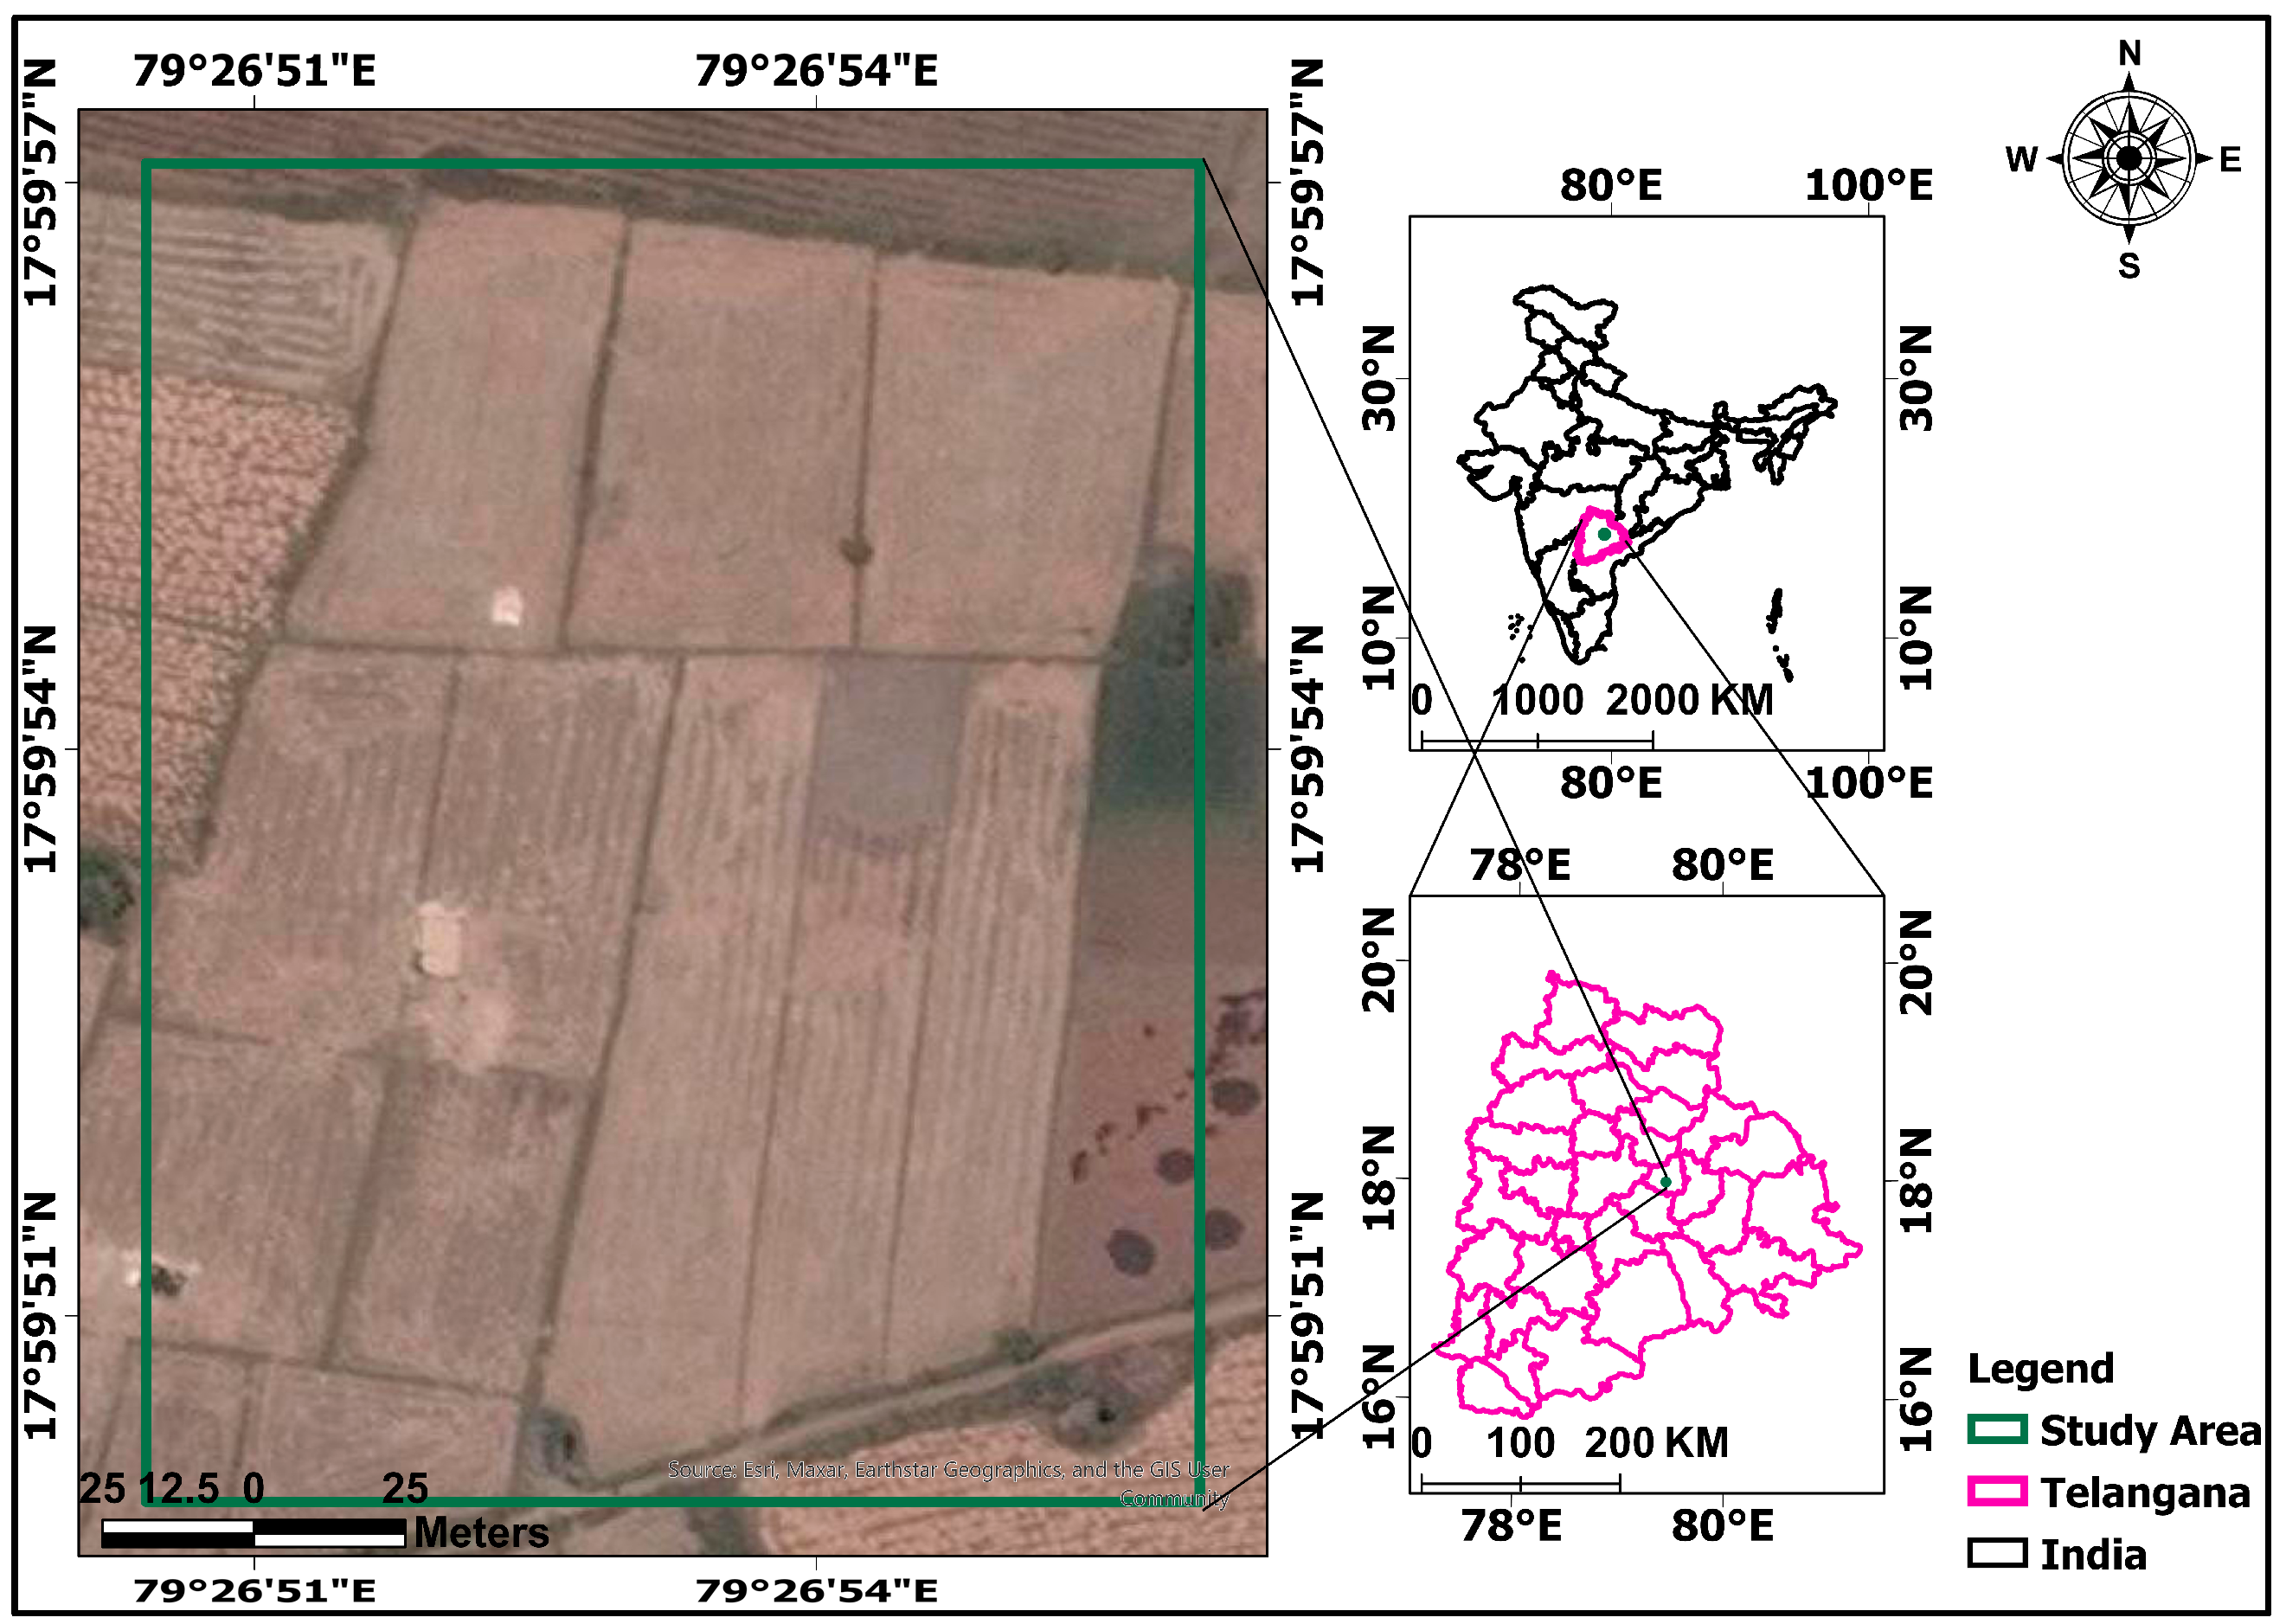
Figure 1. Geographical location of the study area.
Agronomy 15 02059 g001
Figure 2. Methodology of crop health assessment.
Agronomy 15 02059 g002
Figure 3. Nutrient testing equipment.
Agronomy 15 02059 g003
Figure 4. Orthorectified UAV RGB images of various temporal dates (a) 3 March 2024, (b) 8 March 2024, (c) 13 March 2024, (d) 18 March 2024, (e) 23 March 2024, (f) 28 March 2024, (g) 2 April 2024, (h) 7 April 2024, (i) 12 April 2024 and (j) 27 April 2024.
Agronomy 15 02059 g004
Figure 5. Representation of statistical values of the UAV-derived indices.
Agronomy 15 02059 g005
Figure 6. Statistical representation of measured crop parameters of paddy leaf samples.
Agronomy 15 02059 g006
Figure 7. Heat map representation of correlation between the vegetation indices, AGB, and NPK.
Agronomy 15 02059 g007
Figure 8. Predicted AGB and NPK of the study area using the RF algorithm.
Agronomy 15 02059 g008
Figure 9. Predicted AGB and NPK of the study area using the MLR algorithm.
Agronomy 15 02059 g009
Figure 10. Predicted AGB and NPK of the study area using the PLSR algorithm.
Agronomy 15 02059 g010
Figure 11. Predicted AGB and NPK of the study area using the XGBoost algorithm.
Agronomy 15 02059 g011
Figure 12. Validation metric between the predicted AGB and observed AGB (a) R2, (b) RMSE.
Agronomy 15 02059 g012
Figure 13. Validation metric between the predicted N and observed N (a) R2, (b) RMSE.
Agronomy 15 02059 g013
Figure 14. Validation metric between the predicted P and observed P (a) R2, (b) RMSE.
Agronomy 15 02059 g014
Figure 15. Validation metric between the predicted K and observed K (a) R2, (b) RMSE.
Agronomy 15 02059 g015
Figure 16. Crop health map from the predicted AGB and NPK.
Agronomy 15 02059 g016
Table 1. Information about the UAV data collection growth stage of the paddy crop and number of images captured on each band.
Date of UAV Data CollectionDays After Sowing (DAS)Crop Growth StageNo. of Images Captured in Each Band
3 March 2024 (030324)53Panicle Initiation573
8 March 2024 (030824)58Panicle Initiation571
13 March 2024 (031324)63Booting546
18 March 2024 (031824)68Booting543
23 March 2024 (032324)73Flowering591
28 March 2024 (032824)78Flowering583
2 April 2024 (040224)83Grain Filling583
7 April 2024 (040724)88Grain Filling604
12 April 2024 (041224)93Maturity601
27 April 2024 (042724)108Maturity477
Table 2. Vegetation indices used in agricultural applications.
IndexFormulaValue RangeApplication in AgricultureReferences
Normalized Difference Vegetation Index (NDVI) N I R R e d N I R + R e d −1 to +1Assessing vegetation health, detecting drought stress, and monitoring crop growth.[5]
Green Normalized Difference Vegetation Index (GNDVI) N I R G N I R + G −1 to +1Similar to NDVI but focused on green wavelengths. It is useful for identifying early crop stress before visible symptoms appear.[26]
Normalized Difference Red Edge Index (NDRE) N I R R E N I R + R E −1 to +1NDRE is used for monitoring chlorophyll content and plant stress, especially in later growth stages.[27]
Green Chlorophyll Index (GCI) N I R G 1 −1 to +5Used to quantify chlorophyll content in plants, which is essential for assessing crop health.[18]
Red Edge Chlorophyll Index (CI_RE) N I R R E 1 −1 to +4Useful in determining chlorophyll content, especially in crops with dense canopies.[28]
Ratio Vegetation Index (RVI) N I R R 0 to 12Used for monitoring vegetation biomass and health.[29]
Leaf Chlorophyll Index (LCI) N I R R E N I R + R −1 to +1Used to estimate chlorophyll content in leaves.[18]
Soil Adjusted Vegetation Index (SAVI) N I R R N I R + R + L ( 1 + L ) −1 to +1Used to minimize soil background effects when vegetation is sparse.[26]
Enhanced Vegetation Index 2 (EVI2) 2.5 × ( N I R R ) N I R + 2.4 × R + 1 −1 to +2An improved index for assessing vegetation, particularly in areas with dense vegetation.[15]
Where L is the soil adjustment factor (typically 0.5), NIR—Near Infra-Red Band, R—Red Band, G—Green Band, B—Blue Band, RE—Red Edge Band.
Table 3. Decision-making rules for crop health assessment.
Mask ValueCategoryDescription
1Severely DeficientTwo or more nutrients are in critical state when AGB is lower than threshold
2DeficientOnly one nutrient is in critical condition when AGB is lower than threshold
3Imbalanced NutritionMixed levels of one or more nutrients in critical state and one nutrient in toxic state
4Toxicity StressMore than one nutrients are in toxic condition
5Hidden HungerTwo or more nutrients are in critical state when the AGB is above the threshold
6Moderate HealthOnly one nutrient either is in critical or toxic condition when AGB is above the threshold
7Moderate Health but Low AGBAll Nutrients are in optimum range but the AGB is lower than threshold
8HealthyAll nutrients are in optimum range when AGB is above the threshold
Table 4. Accuracy statistics between the observed and predicted health of the paddy crop.
Prediction ModelStatistical Parameter030324030824031324031824032324032824040224040724041224042724
RFPrecision1.000.921.001.000.920.920.840.700.630.30
Recall0.960.961.000.880.960.960.840.760.520.44
F1 Score0.980.941.000.940.940.940.840.730.560.36
Kappa0.890.891.000.710.890.890.640.520.280.22
MLRPrecision1.000.911.001.000.920.960.840.790.580.27
Recall0.920.760.920.880.880.880.760.720.400.44
F1 Score0.960.830.960.940.900.920.790.750.430.33
Kappa0.790.520.790.710.710.730.540.530.210.18
PLSRPrecision1.000.921.000.970.920.960.840.790.510.27
Recall0.880.961.000.840.880.880.760.720.360.44
F1 Score0.940.941.000.890.900.920.790.750.350.33
Kappa0.710.891.000.640.710.730.540.530.150.18
XGBoostPrecision1.000.921.001.000.960.920.920.800.770.40
Recall1.000.961.001.000.960.960.840.800.520.44
F1 Score1.000.941.001.000.960.940.880.800.610.42
Kappa1.000.891.001.000.900.890.680.640.340.29
Disclaimer/Publisher’s Note: The statements, opinions and data contained in all publications are solely those of the individual author(s) and contributor(s) and not of MDPI and/or the editor(s). MDPI and/or the editor(s) disclaim responsibility for any injury to people or property resulting from any ideas, methods, instructions or products referred to in the content.