Article

Identification and Analysis of Differentially Expressed Genes in Sugarcane Roots Under Different Potassium Application Levels

1
National Key Laboratory of Tropical Crop Biological Breeding, Yunnan Academy of Agricultural Sciences, Kunming 650205, China
2
Sugarcane Research Institute, Yunnan Academy of Agricultural Sciences, Kaiyuan 661699, China
*
Author to whom correspondence should be addressed.
Agronomy 2025, 15(9), 2060; https://doi.org/10.3390/agronomy15092060
Submission received: 17 July 2025 / Revised: 15 August 2025 / Accepted: 21 August 2025 / Published: 27 August 2025
(This article belongs to the Section Crop Breeding and Genetics)

Abstract

Potassium (K) is a critical macronutrient for sugarcane (Saccharum spp.), playing a vital role in metabolic processes, sucrose accumulation, and yield formation. Herein, this study systematically evaluated the effects of potassium oxide (K2O) application on sugarcane (cultivar YZ1696) growth at the seedling and tillering stages. Hydroponic experiments demonstrated that 6 mmol/L K2O optimally promoted seedling growth, whereas field trials revealed that 150 kg/ha K2O maximized growth rate, yield, and sucrose content. Sugarcane growth exhibited a biphasic response—stimulation followed by inhibition—with increasing K2O dosage at both developmental stages. Transcriptomic profiling of sugarcane roots under low-potassium (K-deficient), optimal potassium, and high-potassium conditions identified 10,266 differentially expressed genes (DEGs), with the most pronounced transcriptional shifts occurring under K deficiency. Functional enrichment analysis identified DEGs associated with potassium transport, calcium signaling, and carbohydrate metabolism. Notably, potassium uptake was mediated by distinct mechanisms: Shaker family channels (AKT1, AKT2, SPIKE) and the TPK family member KCO1 were induced under optimal K supply, whereas HAK/KUP/KT transporters (HAK1/5/10/21/25) exhibited broad activation across K concentrations, underscoring their key role in K homeostasis. Furthermore, calcium signaling genes (e.g., CIPK23) displayed K-dependent expression patterns. Weighted gene co-expression network analysis identified key gene modules that correlated strongly with agronomic traits, including plant height, yield, and sucrose content. Optimal K conditions favored the expression of yield- and sucrose-associated genes, suggesting a molecular basis for K-mediated productivity enhancement. Our findings revealed the genetic and physiological mechanisms underlying K-dependent sugarcane improvement, providing actionable insights for precise potassium fertilization to maximize the yield and sugar content.

1. Introduction

Sugarcane (Saccharum spp.), a C4 crop characterized by high photosynthetic efficiency, accounts for approximately 70% of global sugar production and serves as a key feedstock for biomass and ethanol-based biofuel production [1]. Recent decades have witnessed significant improvements in sugarcane yield and sucrose content, largely attributable to increased fertilizer application rates [2,3,4]. To meet the crop’s substantial nutritional demands, intensive mineral fertilization has become essential to maintain optimal productivity and economic viability throughout the sugarcane growth cycle [5,6]. Nutrient requirement studies demonstrated that sugarcane production requires 1.5–2 kg nitrogen (N), 1–1.5 kg phosphorus (P), and 2–2.5 kg potassium (K) per ton of cane produced [7]. Notably, as a K-intensive crop, sugarcane assimilates 2.0–3.3 kg potassium oxide (K2O) per ton of stalk biomass from soil reserves. Potassium deficiency manifests as distinct physiological symptoms, including midrib reddening, photosynthetic inhibition, and reduced invertase activity, ultimately leading to decreased tillering, weakened plant vigor, and diminished sucrose accumulation [8]. Field studies confirmed that K fertilization enhances sugarcane yield while improving stress tolerance and reducing smut disease incidence [9]. Moreover, optimal K application improves juice quality parameters, including sucrose concentration, total sugar content, and gravity purity [10]. Given the widespread K deficiency in Chinese sugarcane-growing regions, where N and P supplies are generally adequate, strategic increases in K fertilization might represent the one promising approach to further enhance both the yield and sucrose content in sugarcane production systems.
Sugarcane quality, primarily determined by the yield and sucrose content, is significantly influenced by fertilization practices during critical growth stages. The seedling and tillering phases are particularly crucial, because they establish fundamental growth parameters, including plant height and the growth rate, which directly determine subsequent yield potential and sucrose accumulation [11]. In Chinese sugarcane production systems, fertilization typically occurs twice: A basal application at planting and topdressing during tillering through inter-tillage management. Physiological studies revealed that approximately 86.8% of total K uptake occurs between the tillering and stem elongation stages, with peak absorption rates (2180 g·day·hm−2) observed during the late tillering to early elongation phases [12]. However, K application demonstrates a non-linear dose–response relationship. Huang et al. reported optimal yield and K use efficiency at 450 kg K2O/ha [13], while maximum agronomic efficiency and input-output ratio occurred at 225 kg K2O/ha. Similarly, Xie et al. (2019) identified 300 kg K2O/ha as the optimal rate to maximize yield, sucrose accumulation, and stress resistance [9].
The tillering stage represents a critical determinant of the final yield via its regulation of productive tiller number [14,15], coinciding with peak K use efficiency. Despite these insights, key knowledge gaps remain regarding (1) K demand characteristics of sugarcane in K-deficient southwestern China; (2) root gene expression profiles under varying K stress conditions; and (3) a mechanistic understanding of K-mediated regulation of key genes and signaling pathways in sugarcane roots.
Extensive research has established K as an essential macronutrient that plays a pivotal role in plant growth and development through its regulation of numerous physiological processes, including photosynthesis, enzymatic activity, nutrient translocation, and stomatal dynamics [16]. As the second most abundant plant nutrient, K serves as a critical activator for approximately 60 enzymatic systems, while significantly influencing key physiological functions, such as stomatal regulation, photosynthetic efficiency, and water relations. Optimal K nutrition enhances photosynthate translocation from source leaves to sink organs, while improving nitrogen use efficiency through various mechanisms. These include modulation of photosynthetic parameters, regulation of carbon/nitrogen metabolic enzymes, and activation of nitrate assimilation genes and transporters [17]. Recent studies further demonstrated that K fertilization regulates the expression of genes involved in both sugar metabolism and K ion homeostasis, thereby promoting sugar accumulation while reducing organic acid content in fruit [18].
Potassium remains an underappreciated essential nutrient in agricultural systems, despite its critical importance in plant physiology. Contrary to the common assumption of soil K sufficiency, agricultural practices in many developing regions have led to significant K depletion in rhizosphere soils because of insufficient fertilizer application. This depletion not only directly affects crop productivity, but also compromises the efficient utilization of N and P fertilizers [19]. Global assessments revealed that approximately 313 million hectares (22.5%) of arable land experiences significant mineral nutrient stress, with K deficiency accounting for nearly 40% of these cases [20]. As a key determinant of both crop yield and quality, K nutrition has emerged as a major research focus in plant physiology and nutrition [21,22]. The molecular mechanisms of K acquisition involve selective activation of specific ion transporters and channel proteins within root nutrient absorption systems [23]. Notably, transcriptional regulation of high-affinity potassium (HAK) transporters represents a fundamental adaptation strategy to low-K conditions [24]. Under K deficiency stress, plants activate a sophisticated calcium signaling network, mediated by calcineurin B-like proteins (CBLs) and their interacting protein kinases (CIPKs), which plays a pivotal role in K stress response [25]. The suboptimal utilization efficiency of K fertilizers represents a critical limiting factor for sugarcane productivity and quality enhancement. Deciphering the molecular mechanisms underlying K absorption, translocation, and assimilation is therefore essential to improve K use efficiency in sugarcane cultivation. This study employs a comprehensive transcriptomic approach to investigate root system responses under varying K fertilizer regimes. Through systematic identification and functional analysis of differentially expressed genes (DEGs), this study elucidates the molecular adaptation strategies of sugarcane roots to K stress. We hypothesize that different potassium application levels not only affect sugarcane growth and sucrose accumulation but also regulate the expression of key genes involved in potassium transport and related signaling pathways. To test this hypothesis, we combined hydroponic and field experiments: hydroponic experiments allow for precise control of potassium levels to uncover molecular responses at the seedling stage, while field experiments validate these findings under practical agricultural conditions. This integrated approach provides both mechanistic insights into potassium regulation and a scientific basis for practical potassium management in sugarcane production.

2. Materials and Methods

2.1. Experimental Materials

This study used the new sugarcane variety YZ1696 (YT 93159×ZZ 41), developed by the Sugarcane Research Institute of Yunnan Academy of Agricultural Sciences (Kunming, China), which is characterized by high yield, high sugar content, and strong stress resistance (drought resistance), and is currently a major recommended new sugarcane variety in the hilly and mountainous sugarcane-growing areas in China. Currently, there are approximately 100,000 acres in production, mainly used for breeding materials.

2.2. Experimental Methods

This research simultaneously carried out field experiments and indoor hydroponic experiments. The field experiments mainly focused on applying different levels of K fertilizer during the mid-tillage management stage of the sugarcane tillering period to observe the patterns of sugarcane growth rate, yield, and sucrose content. The indoor hydroponic experiments mainly investigated the demand patterns of sugarcane seedlings for different levels of K application.

2.3. Field Experiments

2.3.1. Overview of the Experimental Site

The field experiments were conducted at the Experimental Station of the Sugarcane Research Institute, Yunnan Academy of Agricultural Sciences (23.70° N, 103.25° E; elevation 1051.8 m asl) in Yunnan Province, China. This region has a subtropical plateau monsoon climate and abundant sunlight, with an annual sunshine duration of 2035.8 h, an average temperature of 20.5 °C, a maximum temperature of 38.2 °C, a minimum temperature of 20.1 °C, an annual average rainfall of 758.2 mm, and a frost-free period of 331 days (the above data were derived from the Yunnan Field Scientific Observation and Research Station). The soil type at the experimental site is clay, with an organic matter content of 15.6–17.2 g/kg, a pH value of 6.5–6.8, available P of 65.3–65.8 mg/kg, available K of 55.5–56.7 mg/kg, and alkali-hydrolyzable N of 66.2–67.3 mg/kg.

2.3.2. Field Experimental Methods

A continuous three-year field location experiment was carried out. During the tillering period of sugarcane, mid-tillage management was conducted, and different levels of K fertilizer were applied as a topdressing. The average growth rate of sugarcane was determined two months later, and the sugarcane yield and sucrose content were determined at the later growth stage.

2.3.3. Sugarcane Planting and Fertilization Management

Sugarcane was planted in January 2021. Before sugarcane planting, artificial trenching was carried out separately, with a row spacing of 1.1 m. The seeding rate was 120,000 buds·hm−2. When seeding, 1200 kg·hm−2 of special compound fertilizer for sugarcane (N-P2O5-K2O: 20-8-7) was applied as a base fertilizer, and the whole field was covered with plastic film. In April, when sugarcane entered the tillering stage, the film was removed, topdressing was applied, and mid-tillage management and soil hilling were carried out. The topdressing dosage was as follows: urea (N content 46.4%) and calcium magnesium phosphate fertilizer (P2O5 content 16%) were each applied at 600 kg·hm−2; potassium sulfate (K2O content 50%), with five fertilization treatments set up, equivalent to K2O application rates of: KF1 (0 kg·hm−2), KF2 (75 kg·hm−2), KF3 (150 kg·hm−2), KF4 (225 kg·hm−2), and KF5 (300 kg·hm−2). The experiment adopted a randomized block design, with four replicates for each treatment, each replicate using 0.02 hm2 of land, giving a total experimental area of 0.4 hm2. In January 2022, the sugarcane was harvested as per the requirements for leaving the ratoon, the first and second-year ratoons were retained, and the ratoon experiments were the same as those for the newly planted crops.

2.3.4. Determination of Sugarcane Growth Indicators

Determination of sugarcane growth rate: two months after K application, starting from 11 June 2021, the plant height of 10 sugarcane plants in each treatment and replicate was fixed for measurement, and records were made every 7 days. Two months of observation was conducted until the measurement ended on 11 August (among them, no measurement was made on 17 June due to continuous rainfall), and the average growth rate of sugarcane under different K fertilizer treatments was calculated.
Determination of sugarcane yield: during the maturity stage (January) of newly planted, first-year ratoon, and second-year ratoon sugarcane, yield measurement was conducted, with three replicates measured for each K application treatment. Specifically, the sugarcane in a 10 m × 11 m planting area was selected for the actual yield measurement, and the yield per hectare was calculated.
Determination of the sugar content in sugarcane: newly planted sugarcane was selected in November; the first-year ratoon sugarcane was selected in December; and the second-year ratoon sugarcane was selected in January. Sugar content detection was carried out using the one-time rotation light method [26].

2.3.5. Indoor Hydroponic Experiments

Sugarcane buds were raised in a nursery. When the sugarcane seedlings had 3–5 leaves at the seedling stage, seedlings with the same growth vigor were transplanted into the prepared hydroponic devices. The materials were planted in the greenhouse of the Sugarcane Research Institute of Yunnan Academy of Agricultural Sciences. The cultivation temperature was 22–36 °C, with natural light. The hydroponic device is indicated in Figure 1, and each bucket could hold at least 2 L of water. The dosage of K treatment and the nutrient solution formula for this experiment were based on the modified Hoagland nutrient solution (Table 1), with adjustments made according to the results of field experiments conducted in our laboratory. Five treatments were established, namely KH1 to KH5 (including K deficiency, appropriate K, and high K). KH1 = 0 mmol/L K2O, KH2 = 3 mmol/L K2O, KH3 = 6 mmol/L K2O, KH4 = 9 mmol/L K2O, and KH5 = 9 mmol/L K2O. Four representative plants were planted, and each treatment was repeated three times. The K sources were KNO3 and KH2PO4. The nutrient solution was changed every 3 days, with 2 L changed each time. The plants were harvested after 2–3 weeks of cultivation.

2.4. Transcriptome Sequencing Analysis of Sugarcane Roots

2.4.1. Collection and Processing of Root Transcriptome Samples in Field Experiments

The principal method was as follows: One month after topdressing of the newly planted sugarcane (approximately in mid-May), the root systems of sugarcane under different fertilization treatment conditions were sampled. For each treatment, a total of four samples were collected, with each sample prepared by pooling three representative plants after collection and thorough homogenization. In this experiment, a total of 20 samples were collected. After cleaning, they were placed in 10 mL centrifuge tubes and immediately stored in liquid nitrogen at −80 °C. The samples were sent to Wuhan Zhenyue Biological Technology Co., Ltd. (Wuhan, China) for RNA extraction and sequencing analysis.

2.4.2. RNA Extraction and cDNA Library Construction and Sequencing

Based on the growth of sugarcane in hydroponics and fields under five distinct fertilization gradients, RNA was extracted from the root systems of sugarcane under three different application levels of KF1 (Low K2O, LK), KF3 (Normal K2O, NK), and KF5 (High K2O, HK) to construct cDNA libraries, with three biological replicates for each sample. The sample libraries of KF1 were named LK1, LK2, and LK3; those of KF3 were named NK1, NK2, and NK3; and those of KF5 were named HK1, HK2, and HK3. RNA extraction, cDNA library construction, and sequencing were accomplished by Wuhan Zhenyue Biological Technology Co., Ltd., Wuhan, China. After RNA extraction, purification, and library construction, these libraries were sequenced using second-generation sequencing technology (Next-Generation Sequencing, NGS), based on the Illumina sequencing platform, with paired-end (Paired-end, PE) sequencing (Illumina Inc., San Diego, CA, USA).

2.4.3. Alignment of Sequencing Data with the Reference Genome Sequence

The raw data produced by sequencing underwent a series of quality control processes to obtain high-quality clean reads. The software fastp (version 0.23.2) was employed for data quality control and filtering. HISAT2 was utilized to conduct rapid and precise alignment of clean reads with the reference genome to acquire the positional information of reads and assess the alignment status. The reference genome used was derived from Saccharum_hybrid, with the genome version ZZ1.v20231221, which was downloaded from the Sugarcane Genome Database (https://sugarcane.gxu.edu.cn/scdb/download, accessed on 16 July 2025).

2.4.4. Gene Functional Annotation and Differentially Expressed Genes

Regarding the differential expression analysis, we employed the DESeq software (DESeq2 version 1.48.1) for this purpose. Differentially expressed genes (DEGs, Differentially Expressed Genes) were identified based on the criterion of |log2(FoldChange (FC))| > 1.0 and an adjusted p-value (padj) ≤ 0.05. The fold change (FC) represents the ratio of the expression in the test group relative to the control group. Additionally, GO (Gene Ontology) functional enrichment analysis and KEGG (Kyoto Encyclopedia of Genes and Genomes) pathway enrichment analysis were conducted using the clusterProfiler software (version 4.16.0), with a significance threshold of p < 0.05.

2.4.5. Mining of Differentially Expressed Genes

The top 20 KEGG metabolic pathways enriched among the selected three distinct potassium K application levels (LK, NK, and HK) were classified and sorted to determine the several pathways with the highest enrichment. Based on the DEGs between the ideal K application level (NK) and the other two K application levels (LK and HK), the top three genes where the same DEG participates in the number of metabolic pathways were screened out as the significant genes influencing K absorption.

2.4.6. Statistical Analyses

The raw data were analyzed using Microsoft Excel 2029 (Microsoft Corp., Redmond, WA, USA). Least significant difference (LSD) comparison analyses were conducted using DPSv14.10 (a data analysis software, Zhejiang University, Hangzhou, China). Related data plotting including the Weighted Gene Co-expression Network Analysis (WGCNA) was performed using the R software (4.1.0). GO functional enrichment analysis and KEGG pathway enrichment analysis of the DEGs were carried out using clusterProfiler software.

3. Results

3.1. The Growth of Sugarcane Seedlings and Tillers Under Varying Application Rates of Potassium Fertilizer

Hydroponic cultivation of sugarcane seedlings under differential K application regimes (Figure 1a) revealed distinct growth response patterns after two months of observation, with KH3-treated plants demonstrating optimal growth performance, while KH1 and KH5 treatments resulted in significantly impaired growth, with the KH2/KH4 treatments exhibiting intermediate phenotypes (Figure 1b). Quantitative analysis of culm height demonstrated significantly enhanced vertical growth in KH3 plants compared with that in the other treatment groups (p < 0.05, according to analysis of variance (ANOVA)), with a pronounced negative growth gradient observed from KH3 to KH5 (Figure 1c). Field-grown sugarcane during the tillering phase displayed similar dose-dependent responses, in which KF3 treatment consistently achieved superior monthly absolute growth rates across four of five observation periods, with the exception of June 11 to July 11, in which KF1 showed a transient growth advantage. These findings collectively demonstrated the existence of (i) an optimal K fertilization window, (ii) measurable low-K stress effects, and (iii) detectable high-K inhibitory effects across both seedling (hydroponic) and tillering (field) developmental stages in sugarcane.

3.2. Yield and Sucrose Content of Sugarcane in the Field Under Different K Application Levels

Potassium-dependent growth patterns in sugarcane were observed, in which KF3 treatment (150 kg K2O ha−1) application during the tillering stage significantly maximized yield the plant cane stage (37.9% higher than KF1 and 40.8% higher than KF5; p < 0.05) (Figure 2a), with similar trends observed in the first-ratoon (KF3 yield 6.4–14.05% greater than other treatments, except for the statistically comparable KF4) (Figure 2b) and second-ratoon crops (KF3 and KF4 forming a homogeneous subset while outperforming the treatments by 17.5–28.3%) (Figure 2c). Sucrose accumulation paralleled the yield patterns, with KF3 achieving peak values in the plant cane (November, 12.99 ± 0.4%), first--ratoon (December, 15.17 ± 0.5%, and second-ratoon (January, 16.65 ± 0.3%) stages, while both K-deficient (KF1) and K-excessive (KF5) treatments consistently showed an 11.1–20.7% reduction in the sucrose content (Figure 2d–f). These results established a clear K response curve, demonstrating that optimal K nutrition at 150 kg K2O ha−1 simultaneously enhanced both biomass production and sucrose accumulation, whereas either deficiency (KF1) or excess (KF5) significantly impaired these key commercial parameters in sugarcane cultivation systems.

3.3. Analysis of the Sequencing Data

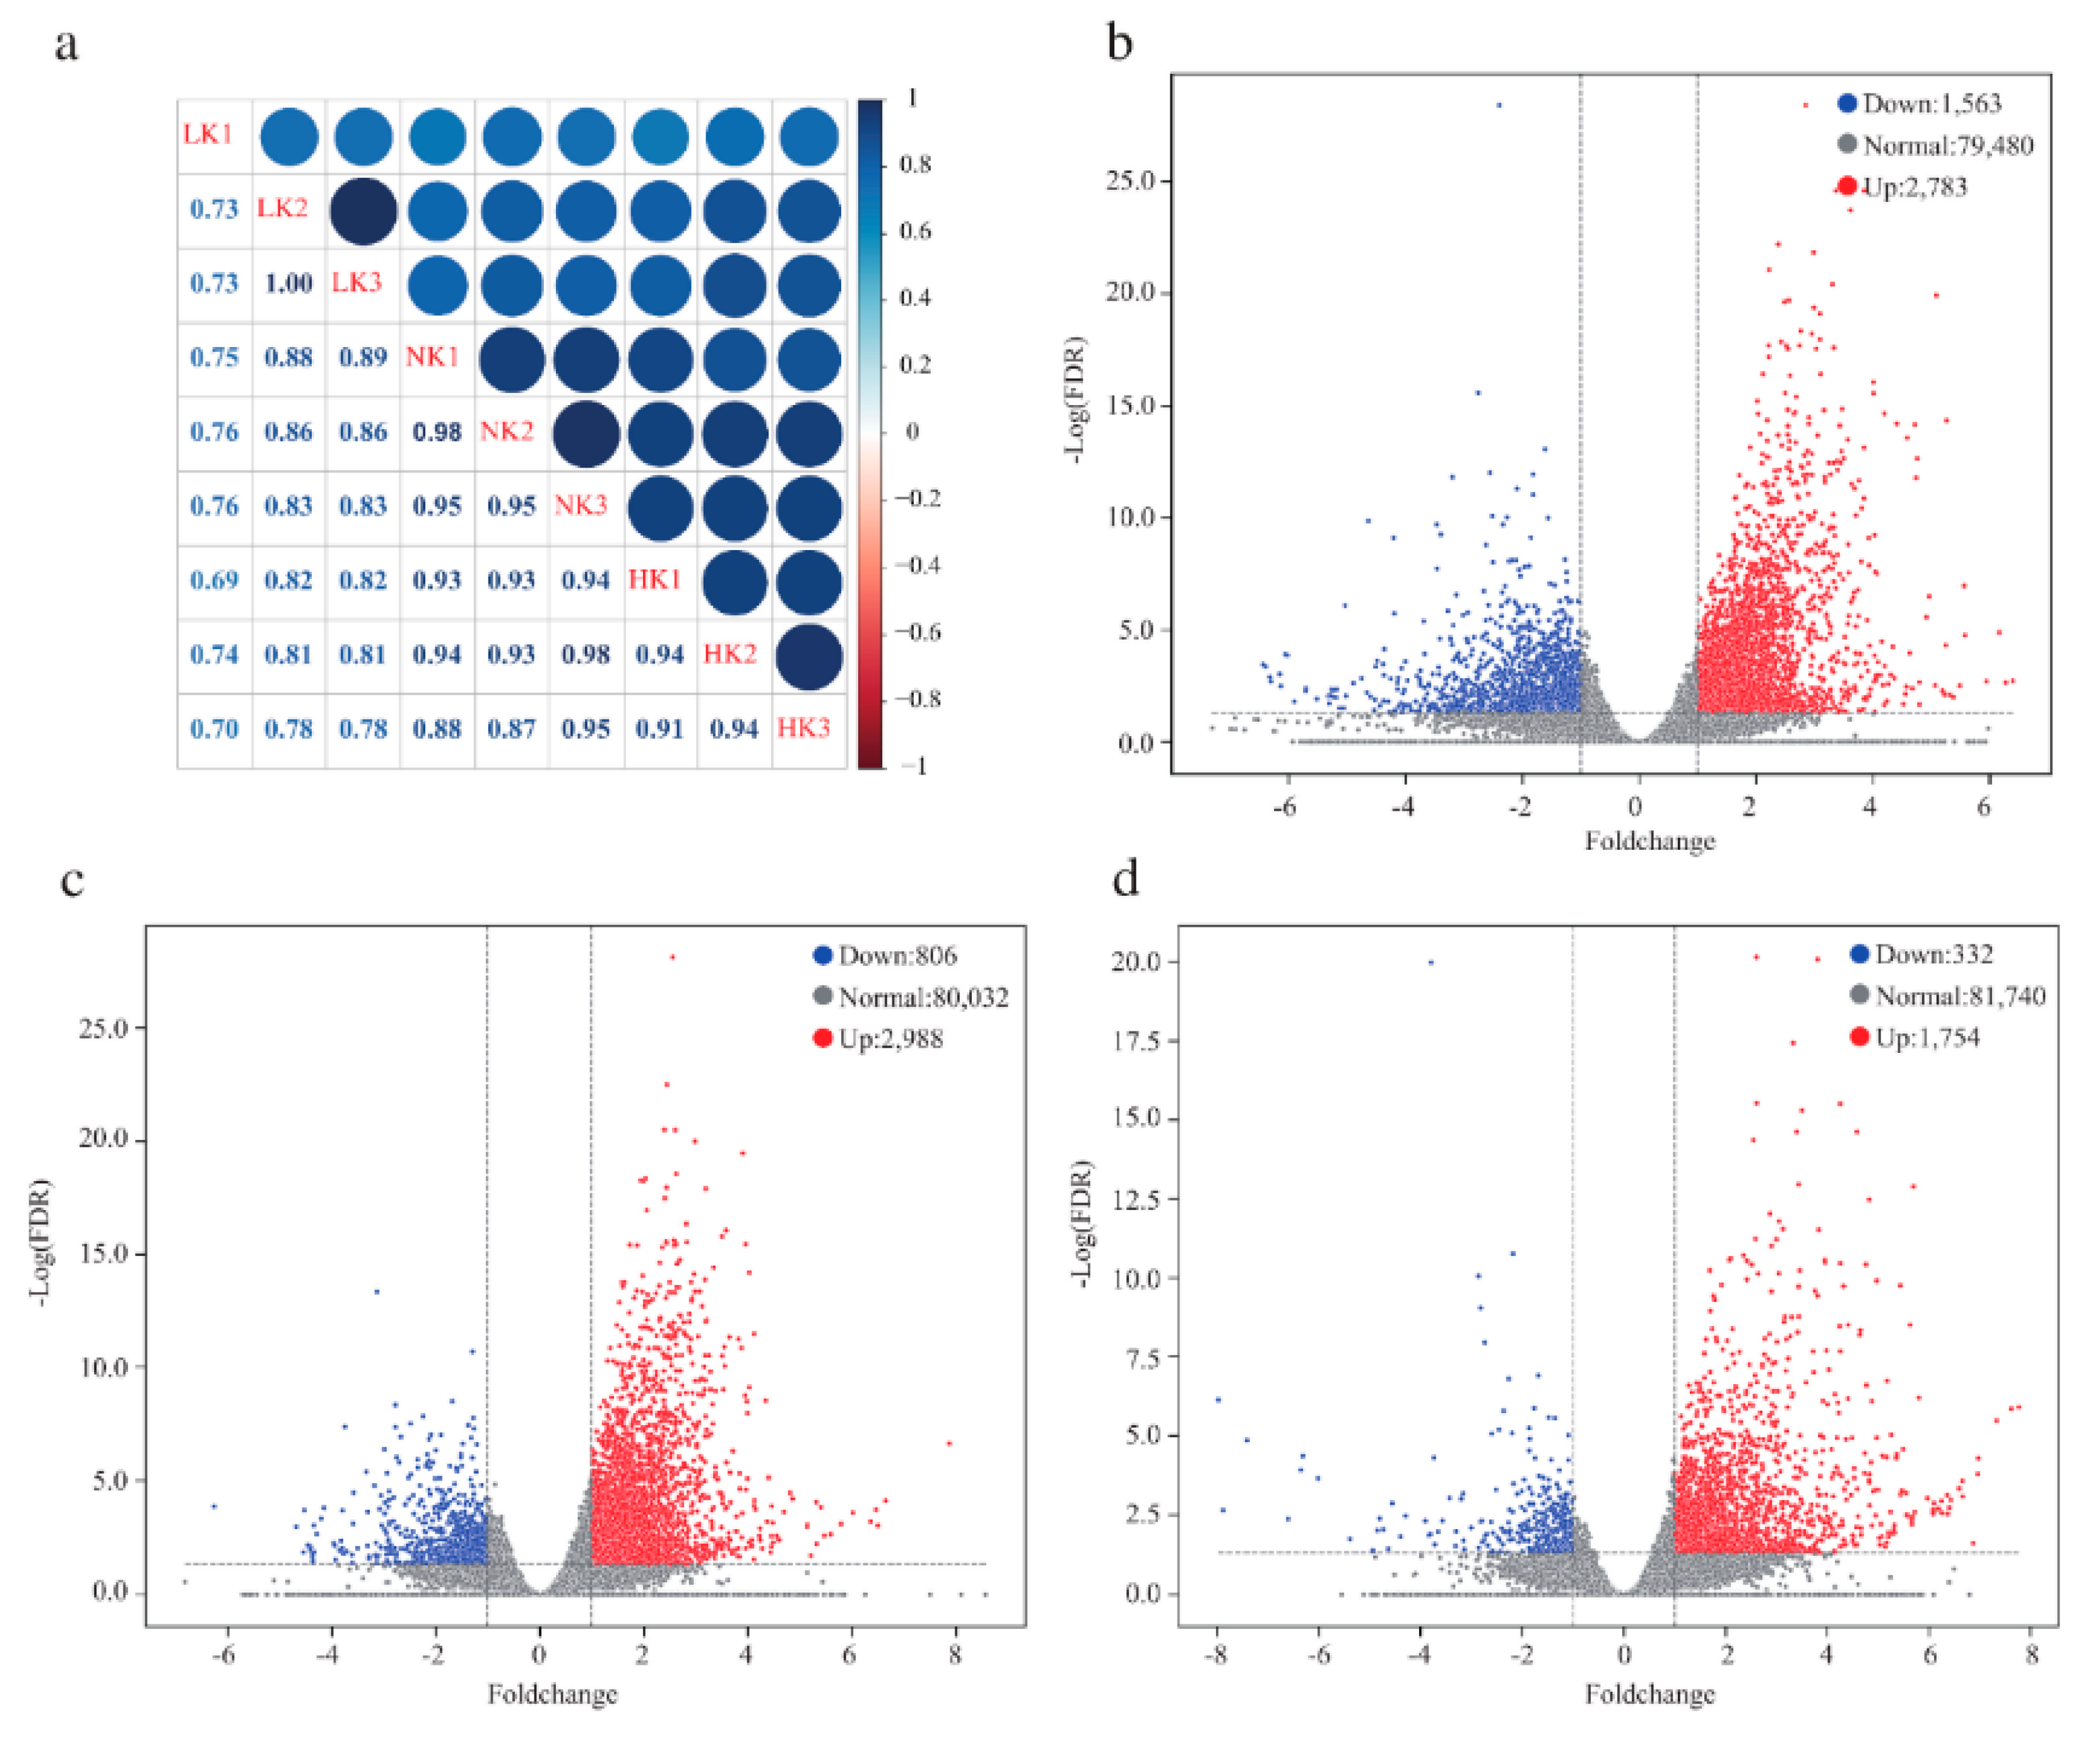
To investigate the transcriptomic responses of sugarcane to varying K regimes, high-throughput RNA sequencing was conducted on root tissues subjected to three distinct K treatments: low K stress (KF1/LK), normal K supply (KF3/NK), and high K stress (KF5/HK). The raw sequencing data generated 6.36–8.83 Gb per sample, yielding 42,398,626 to 58,878,858 clean reads (6.34–8.82 Gb effective bases) after quality control, with an aggregate of 64.12 Gb of high-quality data exhibiting 52.43% average GC content. Sequence quality metrics demonstrated Q20 and Q30 values exceeding 96.76% and 89.79% (false discovery rate (FDR) ≤ 0.1%), respectively (Table 2). Inter-sample correlation analysis using Pearson’s method revealed strong reproducibility among the biological replicates (r > 0.69, Figure 3a), confirming the robustness of the transcriptomic dataset for subsequent differential expression analyses.

3.4. The Transcriptomic Responses of Sugarcane Root Systems Under Different K Treatments

To investigate the phenotypic consequences of K-mediated transcriptional reprogramming in sugarcane root systems, this study performed comparative transcriptomic analyses across three treatment pairs (LK_NK, LK_HK, and NK_HK), identifying 10,226 differentially expressed genes (DEGs; FDR < 0.01, |log2FC| > 1). Specifically, 5941 DEGs (3895 upregulated, 2045 downregulated) were detected in LK_NK, 5015 DEGs (3905 upregulated, 1110 downregulated) were detected in LK_HK, and 2833 DEGs (2313 upregulated, 520 downregulated) were detected in NK_HK (Figure 3b–d). Subsequent Gene Ontology GO annotation and enrichment analyses were conducted to determine the functional categorization of these DEGs and discern treatment-specific alterations in biological processes.

3.5. GO Enrichment Analysis of Differentially Expressed Genes

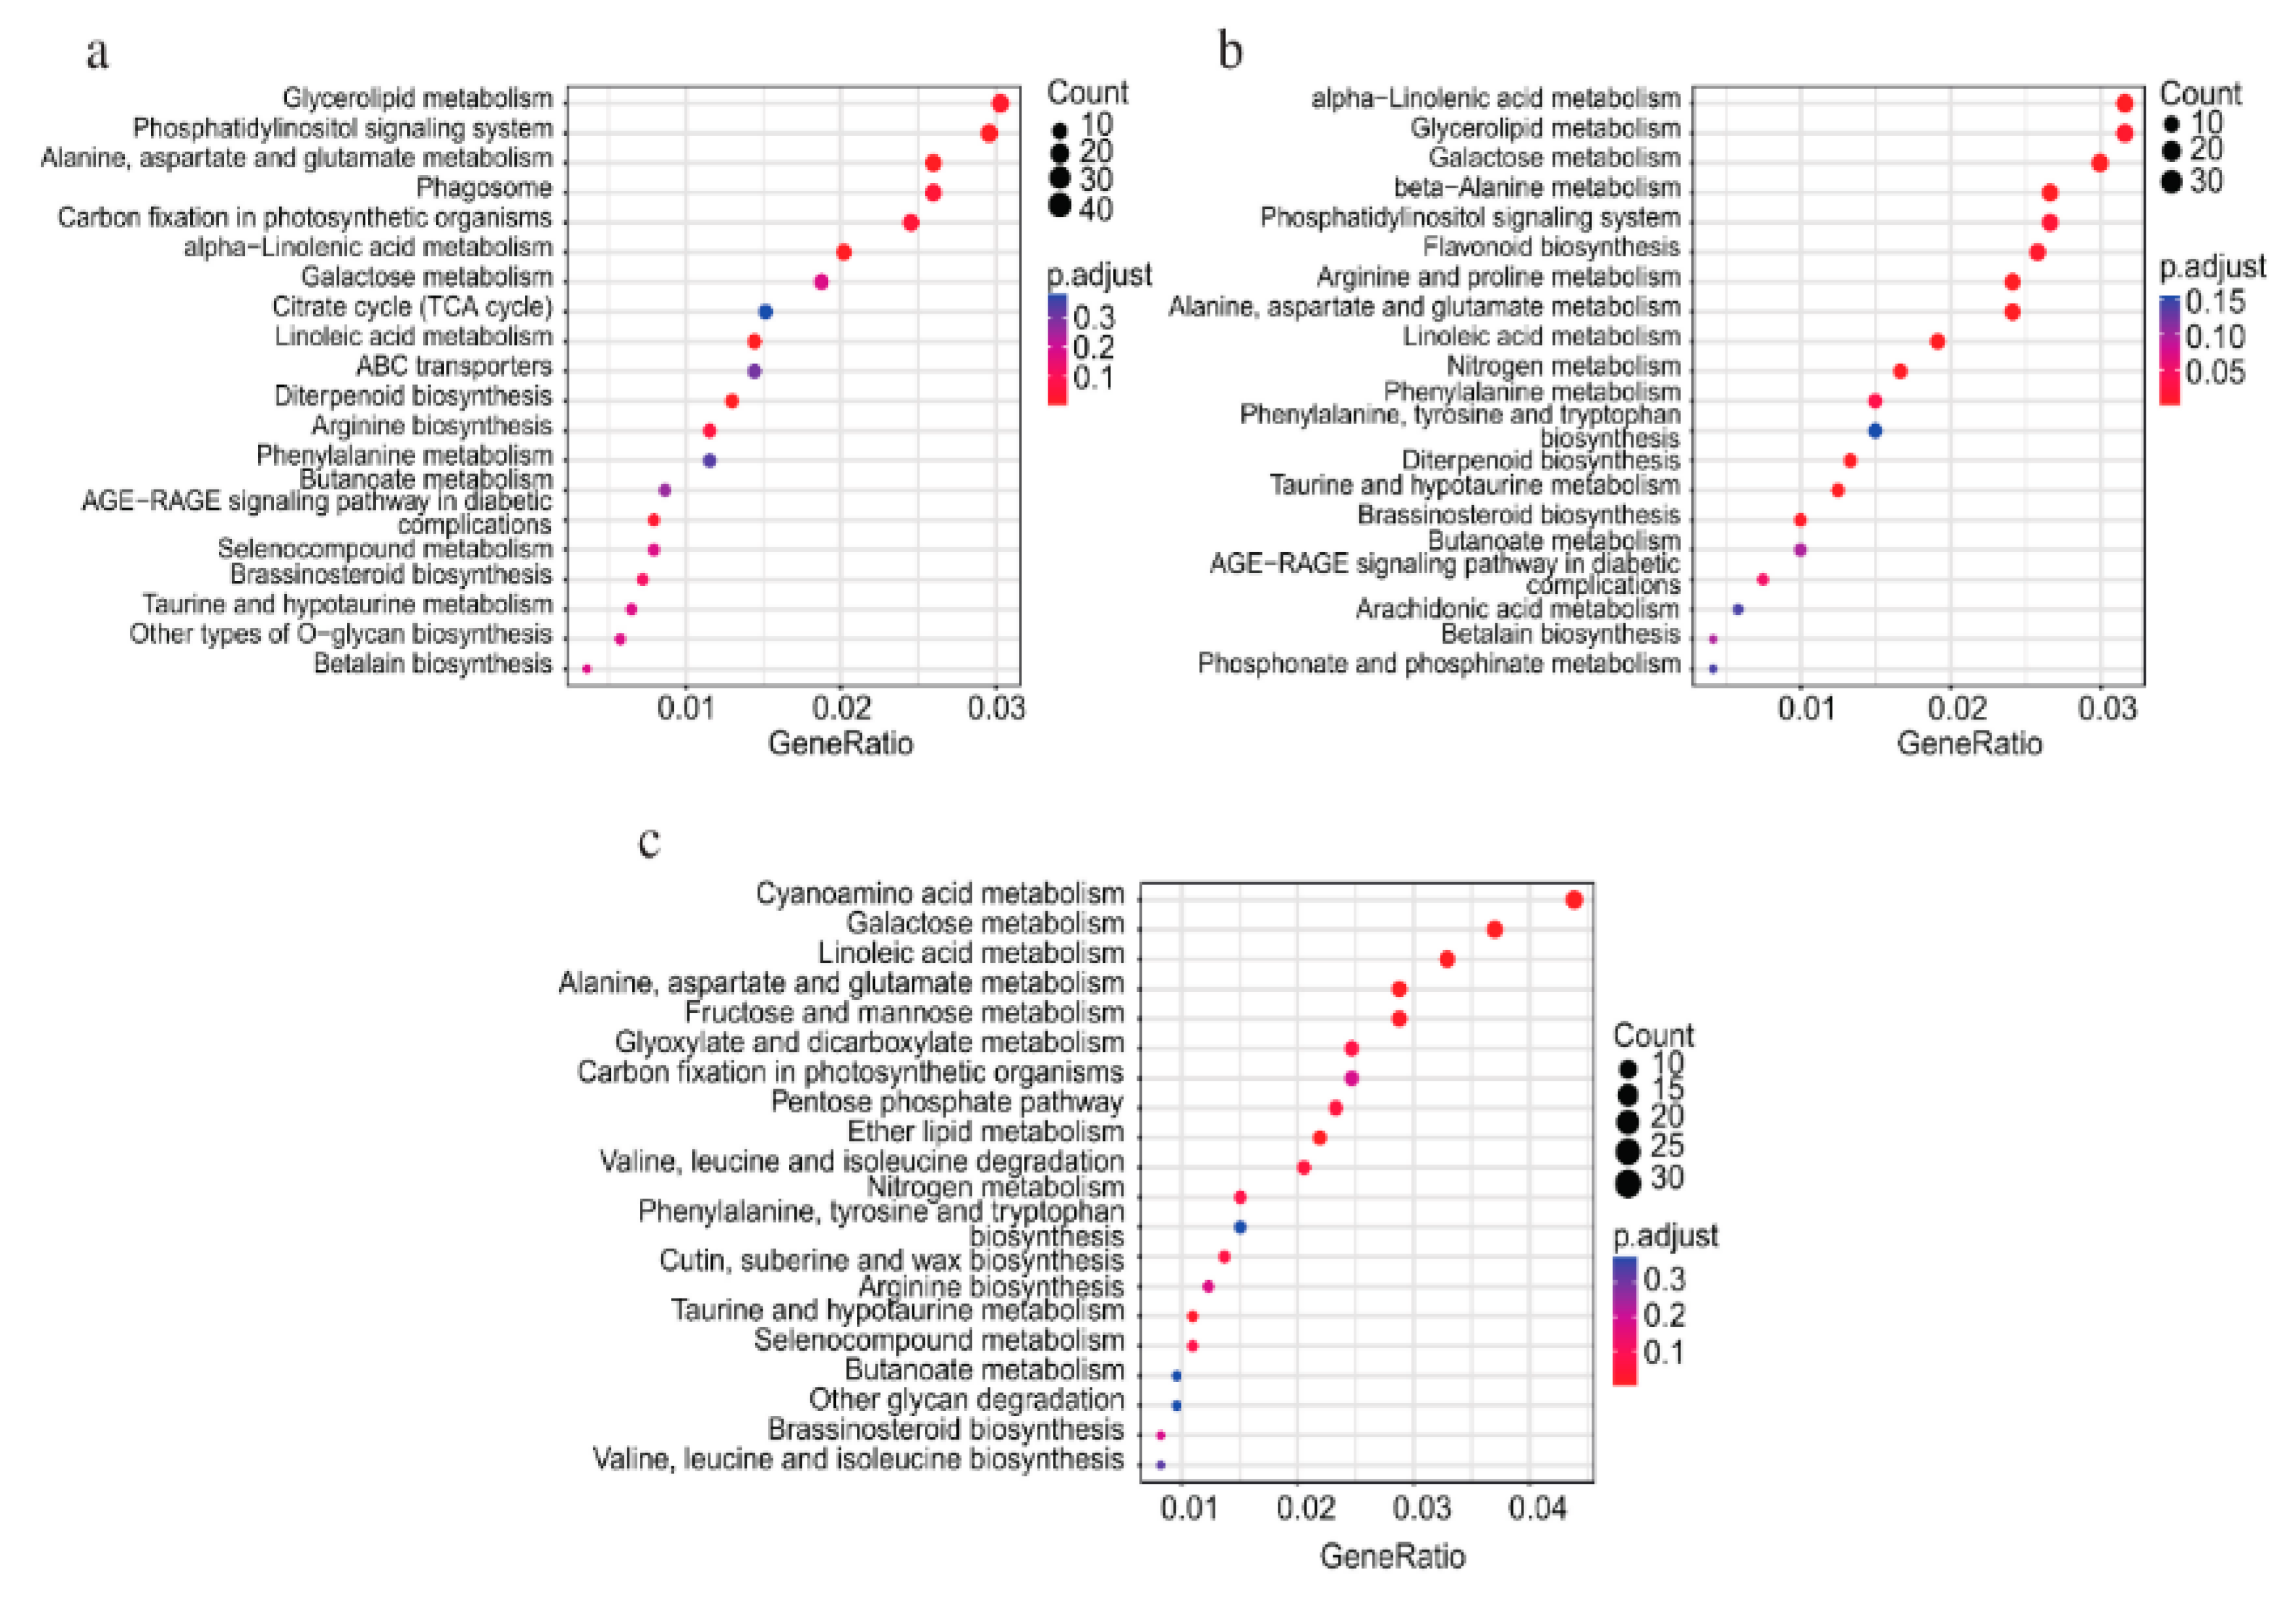
To determine the metabolic mechanisms underlying sugarcane’s response to K availability, KEGG pathway enrichment analysis was performed to characterize the impact of K-related DEGs on biochemical pathways. The LK vs. NK comparison revealed (Figure 4a) that 266 annotated DEGs (145 upregulated, 121 downregulated) were significantly enriched in 9 metabolic pathways, primarily involving glycerolipid metabolism, the phosphatidylinositol signaling system, and alanine/aspartate/glutamate metabolism. Comparative analysis of LK vs. HK identified 369 annotated (Figure 4b) DEGs (311 upregulated, 58 downregulated) that were distributed across 14 pathways, with predominant enrichment in α-linolenic acid metabolism, glycerolipid metabolism, and galactose metabolism. The NK vs. HK contrast showed (Figure 4c) that 149 annotated DEGs (140 upregulated, 9 downregulated) were enriched in 7 pathways, notably cyanoamino acid metabolism, galactose metabolism, and linoleic acid metabolism, demonstrating distinct K-dependent metabolic reprogramming in sugarcane.

3.6. KEGG Enrichment Analysis of Differentially Expressed Genes

To determine the metabolic mechanisms underlying sugarcane’s response to K availability, KEGG pathway enrichment analysis was performed to characterize the impact of K-related DEGs on biochemical pathways. The LK vs. NK (Figure 5a) comparison revealed that 266 annotated DEGs (145 upregulated, 121 downregulated) were significantly enriched in 9 metabolic pathways, primarily involving glycerolipid metabolism, the phosphatidylinositol signaling system, and alanine/aspartate/glutamate metabolism. Comparative analysis of LK vs. HK (Figure 5b) identified 369 annotated DEGs (311 upregulated, 58 downregulated) that were distributed across 14 pathways, with predominant enrichment in α-linolenic acid metabolism, glycerolipid metabolism, and galactose metabolism. The NK vs. HK (Figure 5c) contrast showed that 149 annotated DEGs (140 upregulated, 9 downregulated) were enriched in 7 pathways, notably cyanoamino acid metabolism, galactose metabolism, and linoleic acid metabolism, demonstrating distinct K-dependent metabolic reprogramming in sugarcane.
Upregulated genes in the LK-to-NK transition reflect metabolic adaptations during recovery from potassium deficiency, whereas NK-to-HK upregulated genes characterize molecular responses to potassium toxicity. Conversely, downregulated genes in LK-NK represent defense mechanisms against potassium deprivation, while NK-HK downregulation illustrates metabolic rebalancing during toxicity recovery. TCA, tricarboxylic acid cycle; ABC, ATP-binding cassette; AGE, advanced glycation endproduct; RAGE, AGE receptor.

3.7. The Potassium Transport Elements in Sugarcane Roots Under Different External Potassium Concentrations

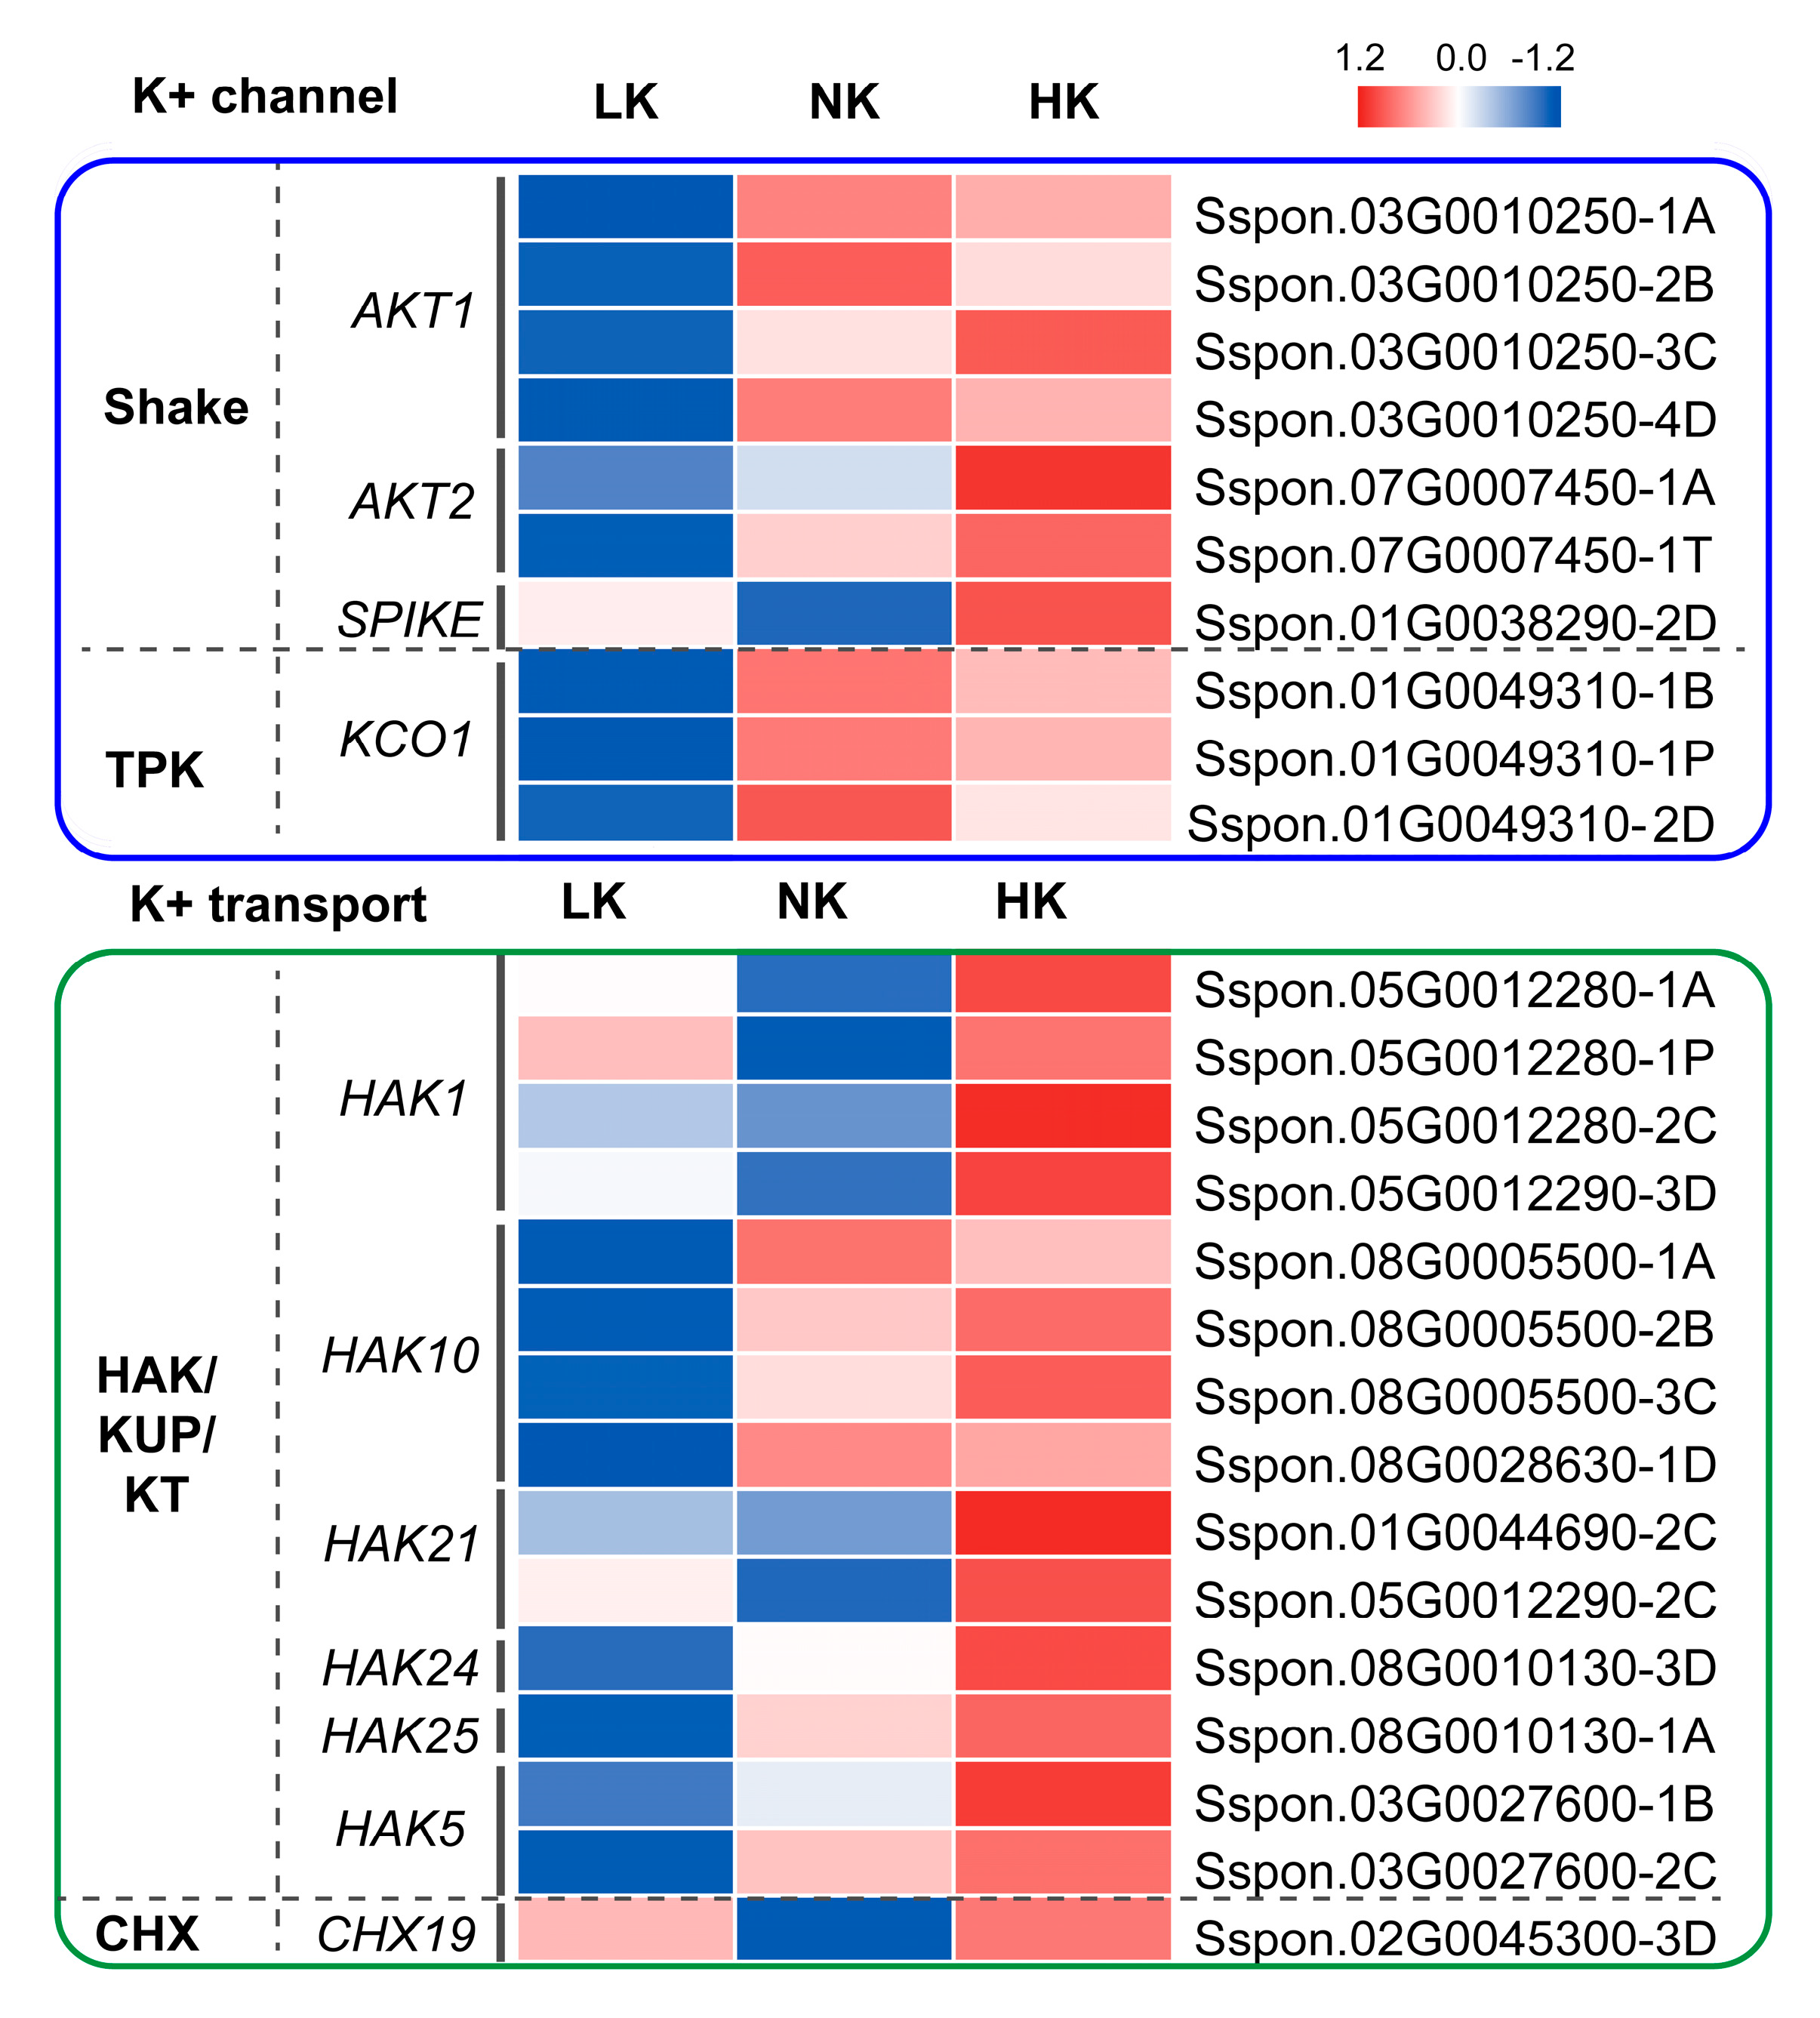
Plant roots mediate K+ ion acquisition from soil and subsequent translocation through coordinated activity of plasma membrane-localized K+ channels and transporters. Under low soil K+ concentrations (<0.2 mmol/L), high-affinity K+ uptake is predominantly facilitated by K+ transporters, whereas low-affinity absorption (>0.3 mmol/L) is primarily mediated by K+ channels. Transcriptomic analysis of sugarcane roots under differential K+ regimes (LK, NK, HK) identified 24 DEGs encoding K+ transport elements, comprising 10 channel proteins and 14 transporters (Figure 6). K+ channels, classified into Shaker, tandem-pore K+ channel (TPK), and K inward rectifier channel (Kir) families based on structural and functional characteristics, constitute the principal components of the low-affinity uptake system. Notably, seven Shaker family members exhibited differential expression, including four AKT1 homologs (encoding protein kinase B1) (Sspon.03G0010250-1A/4D showing > 2-fold induction from LK to NK), two AKT2 isoforms, and one SPIKE ortholog—consistent with Arabidopsis AKT1/AtKC1’s established role in root K+ influx. The TPK-type channel KCO1 gene (encoding CA2+ activated outward rectifying K+ channel 1, represented by sugarcane homologs Sspon.01G0049310-1B/1P/2D) demonstrated 2–4 fold upregulation from LK to NK, followed by downregulation under HK conditions, mirroring AtTPK1/KCO1′s expression pattern in Arabidopsis root tissues. The 14 identified K+ transporters genes all belonged to the HAK/KUP/KT family (High-affinity K+ transporters/K+ uptake permeases/K+ transporters, including HAK1, 5, 10, 21, and 25), exhibiting progressive upregulation with increasing soil K+ availability, as exemplified by the AtHAK5 ortholog Sspon.03G0027600-2C (1.8-fold induced from LK to NK). These findings demonstrated that sugarcane roots dynamically regulate K+ acquisition through: (1) Shaker (AKT1/AKT2/SPIKE) and TPK (KCO1) channels that are induced at optimal K+ levels. but suppressed under excess; and (2) HAK/KUP/KT transporters that maintain activity across broader K+ concentrations, facilitating both uptake and long-distance translocation.

3.8. Ca2+ Signaling and Activation of Potassium Channels

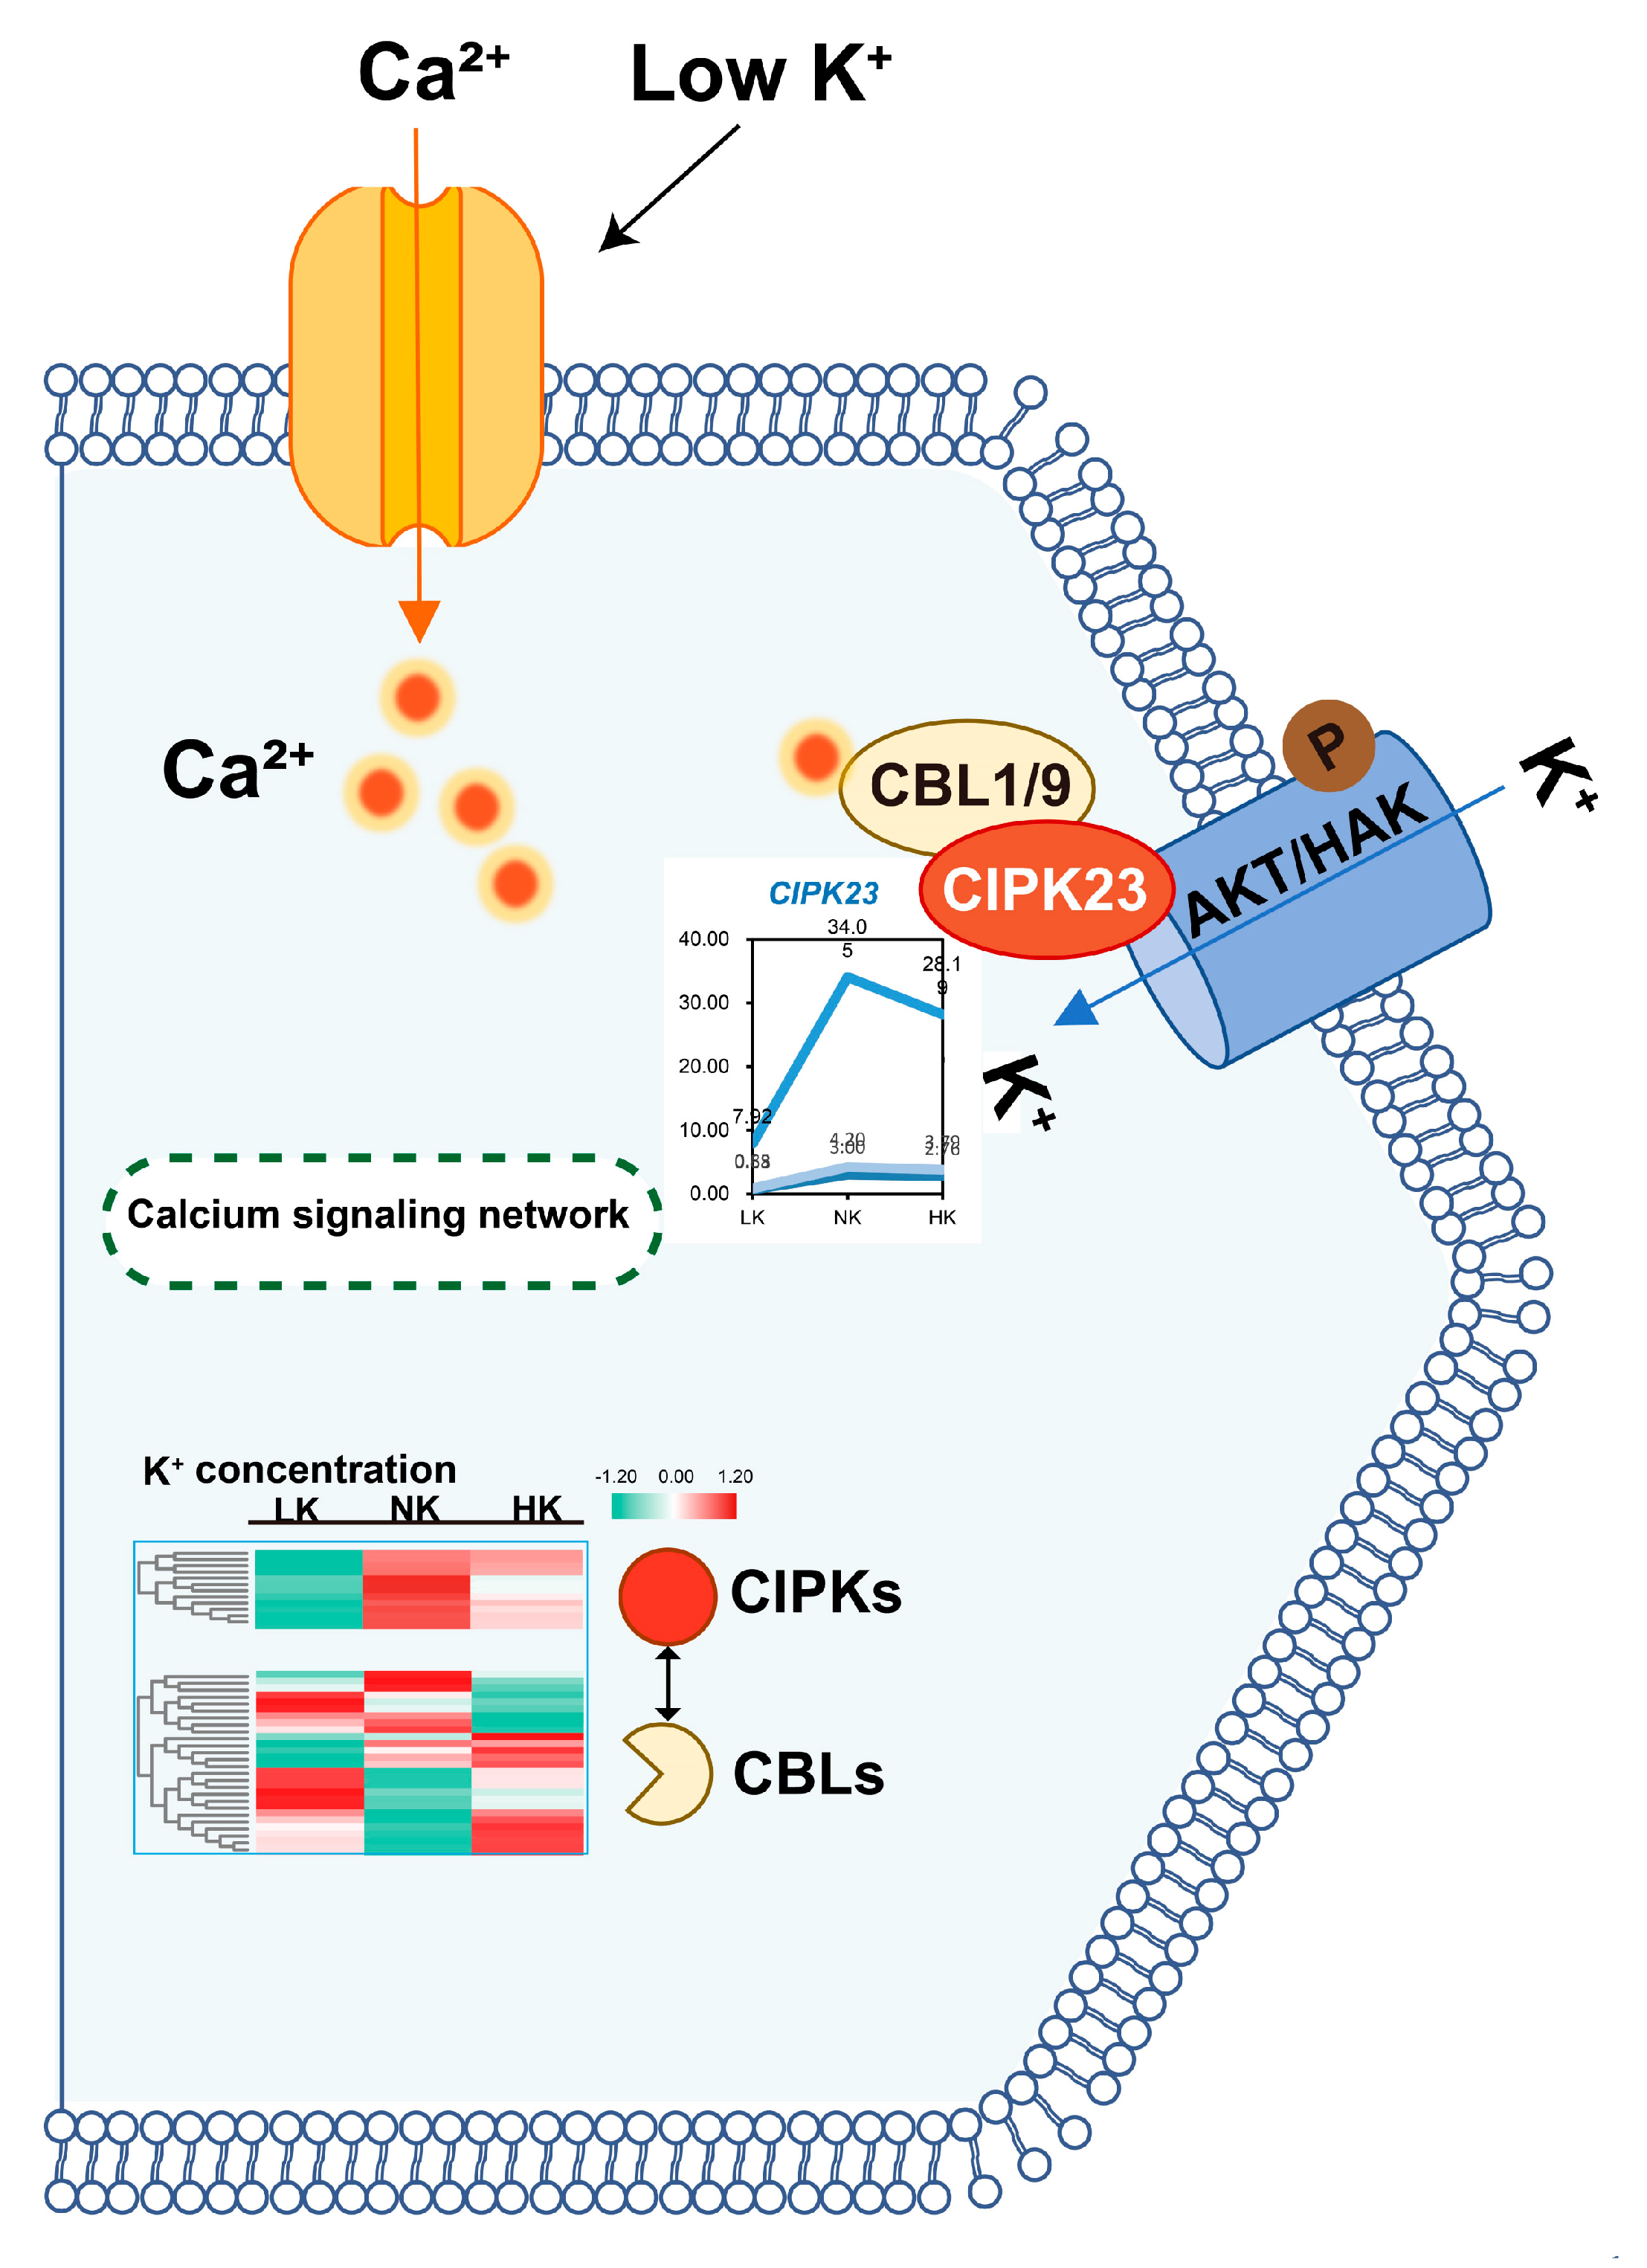
Transcriptomic analysis of K+-treated sugarcane revealed significant enrichment of upregulated DEGs in Ca2+-related GO terms (Figure 7) (e.g., Ca2+ binding, transmembrane transport, and channel activities) exclusively in the NK_LK comparison, suggesting Ca2+-mediated K+ uptake optimization occurs at moderate K+ concentrations. Functional annotation of 117 Ca2+-associated DEGs identified genes encoding calcium-dependent protein kinases, calmodulin-like proteins, and transporters (including Ca2+-permeable channels and Na+/Ca2+ exchanger-like proteins (NCLs), which were significantly induced in roots under optimal K+ (NK). Among 26 non-DEG CBL genes, 24 maintained constitutive expression (Fragments Per Kilobase of transcript per Million mapped reads (FPKM) 2–44) across treatments, while 20 of 109 CIPK genes were upregulated in NK_LK, including CIPK6/7/11/23/31. Notably, three CIPK23 orthologs (Sspon.02G0024240-1P/2B/3C) showed >2-fold induction under NK, consistent with reported CIPK23-AKT1/HAK5 activation under K+ limitation. Similarly, the genes encoding CIPK6 (regulating AKT2 via CBL4) and CIPK31 (interacting with AKT1-like) were K+-responsive, demonstrating coordinated Ca2+-CBL-CIPK regulation of K+ transport systems during sugarcane root adaptation to K availability.

3.9. The Co-Expression Network of Key Genes Involved in Potassium Uptake by Sugarcane Roots Participates in the Regulation of Economic Traits of Sugarcane

Our experimental results demonstrate that optimized K+ fertilization significantly enhanced both biomass yield and sucrose accumulation in plant cane, first-ratoon, and second-ratoon crops. As the primary site for K+ acquisition, root systems exhibited marked growth inhibition under K+ deficiency conditions, highlighting the necessity to elucidate the transcriptional regulatory networks governing sugarcane root responses to differential K+ availability to comprehensively understand the molecular mechanisms underlying economically important agronomic traits. Utilizing weighted gene co-expression network analysis (WGCNA, Weighted Gene Co-expression Network Analysis) (Figure 8) with a soft threshold power of 6, this study systematically analyzed 9886 DEGs, which were clustered into 11 distinct co-expression modules (MEblack, MEgreen, MEdarkorange, MEdarkturquoise, MEorange, MEwhite, MEbrown, MEcyan, MEdarkred, MEblue, and MEdarkgreen). Module-trait relationship analysis incorporated seven key agronomic parameters: plant height (Height), plant cane yield (NY), first-ratoon yield (RFY), second-ratoon yield (RSY), plant cane sucrose content (NS), first-ratoon sucrose content (RFS), and second-ratoon sucrose content (RSS). Statistical evaluation revealed three modules (MEorange, MEwhite, and MEblue) that showed significant positive correlations (r > 0.65, p < 0.05) with multiple traits. Specifically, MEorange demonstrated significant associations with Height and RSS, MEwhite showed strong correlations with NY, NS, and RSS, while MEblue exhibited a specific correlation with RFY, suggesting distinct functional specialization of these gene networks in mediating K+-responsive phenotypic outcomes.

3.10. Analysis of the Functional Characterization and Co-Expression Network of Agronomic Trait-Associated Gene Modules

To determine the molecular mechanisms underlying K-mediated regulation of sugarcane’s agronomic traits, this study performed comprehensive expression profiling, functional annotation, and enrichment analyses on the three key co-expression modules (MEorange, MEwhite, MEblue) identified through WGCNA. The modules contained 45, 36, and 1061 DEGs, respectively, with predominant expression under optimal K (NK) conditions, suggesting their crucial role in mediating K-dependent yield and sucrose accumulation (Figure 9a). GO enrichment of the 1142 combined DEGs revealed significant overrepresentation in 19 functional categories, including ion transmembrane transport (13 terms), carbohydrate phosphatase activity (3 terms), and DNA-binding transcription factor activity (3 terms). Using stringent selection criteria (Figure 9b) (gene significance (GS) > 0.2, module membership (MM) > 0.9, module eigengene-based connectivity (kME) > 0.9), we identified core gene networks involved in K uptake, root development, and biomass accumulation.

4. Discussion

4.1. Potassium Supply Levels Exert Dual Regulatory Effects on Sugarcane Growth and Quality

Potassium serves as an essential macronutrient, constituting approximately 5% of plant dry biomass, and plays critical roles in fundamental physiological processes, including phloem translocation, photosynthetic efficiency, stomatal regulation, and cellular ion homeostasis maintenance [6,27]. The essentiality of K+ is further demonstrated by AKT2/3 knockout mutants, which showed 50% reduction in phloem sucrose content, confirming its indispensable function in phloem loading mechanisms [28]. In sugarcane cultivation systems, the crop exhibits substantial K+ demand, requiring 1.00–2.50 kg K2O per ton of biomass produced, with estimated annual K+ removal rates reaching 790 kg ha−1 [29]. China’s primary sugarcane cultivation regions are predominantly concentrated in southwestern provinces, including Guangxi and Yunnan. Previous investigations have established K fertility classifications for sugarcane fields in these areas based on the soil available K (AK) content across various soil textures (sandy, loam, and clay soils), with clay soils exhibiting AK concentrations below 60 mg/kg being categorized as K-deficient. The experimental site in this study, characterized by AK levels ranging from 55.5 to 56.7 mg/kg, represents a typical K-limited agroecosystem, necessitating K fertilization as an essential agronomic practice to optimize sugarcane productivity and sucrose accumulation. As a K-demanding crop, sugarcane demonstrates a distinct nutrient uptake pattern throughout its growth cycle: K > N > P [30]. Potassium plays a pivotal role in promoting both aerial and root biomass production, thereby enhancing overall crop yield. Through hydroponic experiments, Li et al. demonstrated that K deficiency significantly impaired sugarcane growth, reducing plant dry weight to 51.93–74.10% of K-sufficient controls (p < 0.05), particularly affecting early-stage growth rates and plant height [31]. Complementary field studies have established that K application improves ratoon sprouting, dry matter partitioning, and nutrient acquisition, ultimately increasing effective stem count and plant height, while enhancing ratooning capacity [32]. Consistent with these findings, our field observations revealed significantly reduced yields in first- and second-year ratoon crops under K-limited conditions. While Shukla reported a positive correlation between K application and yield within optimal ranges, excessive fertilization adversely affected sucrose content [11]. Our study corroborates these observations, demonstrating that supra-optimal K levels significantly compromise both biomass production and sucrose accumulation. Extensive agronomic research confirms the detrimental effects of both K deficiency and excess on sugarcane growth and quality parameters.

4.2. Transcriptomic Signatures and Physiological Effects of Biphasic Potassium Regulation in Sugarcane

Previous studies have demonstrated that potassium K deficiency significantly impairs the net photosynthetic rate (Pn) of sugarcane, consequently restricting normal plant development [31]. Potassium-starved sugarcane plants exhibit characteristic phenotypic alterations, including stunted growth, chlorotic leaves, and substantial biomass reduction [33]. Our transcriptomic analysis revealed that DEGs under LK vs. NK conditions were predominantly associated with critical biological processes, particularly cellular iron homeostasis, metal ion regulation, and jasmonic acid response pathways. KEGG pathway enrichment analysis identified 266 significant DEGs, with predominant enrichment in glycerolipid metabolism, phosphatidylinositol signaling, and alanine/aspartate/glutamate metabolism pathways. These molecular findings provide mechanistic insights into the photosynthetic inhibition and growth impairment observed under K-limited conditions. Contrary to the assumption that increased K fertilization always benefits sugarcane production, our study corroborates a previous report that supra-optimal K application adversely affects sucrose accumulation [11]. Transcriptomic profiling of NK vs. HK revealed enrichment of 267 DEGs across GO terms, primarily involved in cell wall-related biological processes, including β-glucan metabolism, cellulose biosynthesis, and plant-type cell wall biogenesis. KEGG analysis annotated 149 significant DEGs, with 7 commonly enriched metabolic pathways showing differential expression patterns (140 upregulated vs. 9 downregulated genes). These DEGs were principally associated with cyanoamino acid metabolism, galactose metabolism, and linoleic acid metabolism pathways, hinting at the molecular basis for sucrose accumulation inhibition under K-excess conditions.

4.3. Transport Proteins Mediate Potassium Uptake to Regulate Growth and Development Processes in Sugarcane

Potassium fertilization significantly enhances sugarcane growth parameters, promoting root, stem, and leaf development, while reducing the root-shoot ratio and improving photosynthetic efficiency, ultimately leading to increased biomass accumulation [34]. Our findings demonstrated that HAK transporter proteins mediate K uptake, thereby regulating sugarcane growth and development. Elevated soil K levels activated multiple potassium transport systems in sugarcane roots, with Shaker family potassium channel genes (AKT1, AKT2, SPIKE) and TPK family gene KCO1 exhibiting concentration-dependent expression patterns: induced at optimal K concentrations but suppressed under excessive K conditions. In contrast, the HAK/KUP/KT family transporters (HAK1, 5, 10, 21, 25) maintained broader expression profiles across varying external K concentrations, thereby facilitating plant K acquisition and translocation. Comparative studies in other crops revealed distinct functional specializations among HAK transporters: Setaria italica HAK1 shows preferential upregulation under K limitation, while HAK2 enhances K accumulation at high K+ concentrations [35]. Yeast complementation assays demonstrated superior low-potassium adaptability and transport capacity of SiHAK1 compared with those of OsHAK1, OsHAK5, and HvHAK1. Similarly, maize ZmHAK5 functions as a high-affinity K transporter, with knockout mutants exhibiting impaired K uptake and overexpression lines showing enhanced growth and K acquisition. In sugarcane, both HAK1 and HAK21 display functional K transport activity capable of complementing yeast K uptake mutants [36]. Field observations of transgenic rice revealed that OsHAK5 overexpression altered plant architecture, reducing height while increasing tillering, whereas knockout lines showed decreased tiller number and fertility. Similarly, OsHAK16 knockout impaired overall plant growth, reducing root and stem biomass [37], while OsHAK1 deficiency disrupted sucrose transport, compromised root development, and reduced pollen viability, panicle fertility, and ultimately, grain yield [38,39]. Collectively, these findings underscore the pivotal role of HAK transporters in mediating K homeostasis and influencing fundamental growth and developmental processes across crop species. Notably, the blue module contained Sspon.03G0022900-2B (ACS7, encoding 1-aminocyclopropane-1-carboxylate synthase 7, involved in ethylene biosynthesis), whose Arabidopsis ortholog AtACS7 regulates root gravitropism via calcium signaling [40]; Sspon.02G0013210-3D (ERF109, encoding ethylene-responsive transcription factor 109), homologous to Arabidopsis jasmonic acid (JA)-responsive root stem cell activator [41]; and Sspon.03G0003630-2B (CIPK11, encoding CBL-interacting serine/threonine-protein kinase 11), corresponding to AtCIPK11 which mediates iron uptake through CBL1/9-FIT signaling [42]. Three trehalose-6-phosphate phosphatase genes (TPP6/7/1) were identified among carbohydrate metabolism-related terms, consistent with reported roles in root architecture regulation [22,43].

4.4. Calcium-Mediated Signaling Coordinates Plant Potassium Homeostasis Through the CBL/CIPK-AKT1/HAK5 Regulatory Module

Plants perceive soil ionic fluctuations (e.g., K+ and Na+) through Ca2+-mediated signaling cascades [44], in which extracellular stimuli trigger transient cytosolic Ca2+ spikes detected by specific Ca2+ sensors that initiate downstream responses [45]. Substantial evidence confirms that Ca2+ signaling facilitates K+ acquisition [46], exemplified by Arabidopsis AKT1′s functional dependence on CBL/CIPK phosphorylation [47] and Dionaea muscipula AKT1′s CBL9/CIPK23-dependent activation of inward-rectifying K+ channels at 100 mM external K+ [48]. Accumulating evidence suggests that Ca2+ signaling plays a pivotal role in modulating K+ uptake [46,49]. In Arabidopsis thaliana, the functionality of the potassium channel AKT1 is regulated via phosphorylation by the CBL/CIPK complex, a Ca2+-sensing kinase module [47]. Notably, heterologous co-expression of the Venus flytrap (Dionaea muscipula) AKT1 homolog with Arabidopsis CBL9/CIPK23 reconstituted hyperpolarization-activated inward-rectifying K+ channel activity under high external K+ (100 mM) conditions [48]. Our transcriptomic analysis revealed that DEGs upregulated upon K fertilization were significantly enriched in Ca2+-related GO terms. Intriguingly, these Ca2+-associated terms were exclusively enriched in the NK_LK comparison, suggesting that Ca2+-mediated regulation of the K+ transport machinery is predominantly activated under K+-deficient conditions. To validate this hypothesis, this stud performed expression profiling and functional annotation of 117 Ca2+-responsive DEGs. These genes exhibited pronounced upregulation in sugarcane root tissues following optimal K+ supplementation (NK treatment), indicating that K+ influx triggers Ca2+-dependent signaling. Furthermore, this study identified multiple CBL and CIPK isoforms in our dataset, with CIPK6, 7, 11, 23, and 31 maintaining sustained high expression in sugarcane roots across varying K+ regimes. Recent studies in citrus (Citrus sinensis) demonstrated that CsCIPK23 physically interacts with the Ca2+ sensor CsCBL1 to phosphorylate and activate the tonoplast sugar transporter CsTST2, thereby enhancing fruit sugar accumulation [47,50,51]. Similarly, Ling reported that sugarcane CIPK23 confers tolerance to K+ deficiency, drought, and salinity [52]. Structural studies by Sánchez-Barrena demonstrated that CIPK23 binding to the ankyrin repeat domain of AKT1 governs kinase docking and channel gating, with domain-specific mutations altering CIPK23-dependent regulation of K+ flux [53].

4.5. Optimal Potassium Nutrition Induces Transcriptional Reprogramming in Root Systems, Thereby Enhancing High-Yield and High-Sucrose Phenotypic Expression in Sugarcane

Potassium is a vital macronutrient essential for plant physiological processes, constituting up to 5% of total plant dry biomass. As a critical cellular osmotic regulator, K+ participates in fundamental physiological functions, including phloem translocation, photosynthetic efficiency, stomatal regulation, and cellular ion homeostasis maintenance [6,27]. Notably, AKT2/3 K+ channel mutants exhibited a 50% reduction in phloem sucrose content compared with that in wild-type plants, demonstrating K+’s pivotal role in phloem sucrose loading [28]. In sugarcane cultivation systems, K demand is particularly substantial, with each ton of cane production requiring 1.00–2.50 kg K2O and annual K+ removal reaching approximately 790 kg ha−1 [29]. Our investigation revealed that optimal K+ fertilization significantly enhanced both biomass yield and sucrose accumulation in plant cane and successive ratoon crops (1st and 2nd stubble). Given the roots’ primary role in K+ acquisition and the pronounced sensitivity of root development to K+ deficiency, this study established a comprehensive transcriptomic framework to determine the molecular mechanisms governing K+-dependent agronomic trait regulation. Through WGCNA of 9886 DEGs, this study identified three key modules (MEorange, MEwhite, and MEblue) showing strong positive correlations (r > 0.65, p < 0.05) with critical yield parameters. Module-trait association analysis demonstrated that (1) MEorange correlated significantly with height and RSS; (2) MEwhite was associated with NY, NS, and RSS; while (3) MEblue exhibited specific correlation with RFY. Functional characterization of these modules revealed predominant gene activation under NK conditions, indicating that optimal K+ status triggers transcriptional reprogramming in root tissues that positively regulates high-yield and high-sucrose phenotypes. This study provides mechanistic insights into K+-mediated enhancement of sugarcane productivity, uncovering novel regulatory networks in root systems that coordinate K+ sensing with agronomic trait expression. Our findings establish a molecular framework for optimizing K+ fertilization strategies to maximize sugarcane yield and sugar content.

5. Conclusions

Potassium fertilization plays a crucial role in sugarcane cultivation, significantly influencing yield and sucrose accumulation. Optimal K application maximized both productivity and sugar content, whereas either excessive (inhibitory) or deficient (stress-inducing) K levels adversely affected sugarcane performance. Notably, Shaker family channels (AKT1, AKT2, SPIKE) and TPK member KCO1 are specifically upregulated under adequate K supply, while HAK/KUP/KT transporters (HAK1/5/10/21/25) exhibit constitutive activation across varying K concentrations, highlighting their pivotal role in K+ homeostasis.

Author Contributions

Writing—original draft preparation, R.L.; Methodology, R.L., Z.Z., Y.Z. and Y.L.; Formal Analysis, R.L. and Z.Z.; Investigation, R.L., Y.L., Z.Z. and J.L.; Data Curation, R.L., J.L. and Y.Z.; Writing—Review and Editing, Y.Z. and J.D.; Conceptualization, R.L., Y.Z. and J.D.; Supervision, J.D.; Project Administration, J.D. All authors have read and agreed to the published version of the manuscript.

Funding

This work was supported by grants from the China Agriculture Research System (CARS-17), Yunnan Agricultural Joint Special Project (202301BD070001-213) and Yunnan Joint Laboratory of Seed Science and Industry (2022YFD2301100).

Data availability Statement

Data will be made available on request.

Conflicts of Interest

The authors declare that they have no known competing financial interests or personal relationships that could have appeared to influence the work reported in this paper.

References

  1. Dinesh Babu, K.S.; Janakiraman, V.; Palaniswamy, H.; Kasirajan, L.; Gomathi, R.; Ramkumar, T.R. A short review on sugarcane: Its domestication, molecular manipulations and future perspectives. Genet. Resour. Crop Evol. 2022, 69, 2623–2643. [Google Scholar] [CrossRef] [PubMed]
  2. Boschiero, B.N.; Mariano, E.; Torres-Dorante, L.O.; Sattolo, T.M.S.; Otto, R.; Garcia, P.L.; Dias, C.T.S.; Trivelin, P.C.O. Nitrogen fertilizer effects on sugarcane growth, nutritional status, and productivity in tropical acid soils. Nutr. Cycl. Agroecosyst. 2020, 117, 367–382. [Google Scholar] [CrossRef]
  3. Katal, K.; Alipour, A.; Zahedi, H.; Sharghi, Y.; Alavifazel, M. Effects of different irrigation levels and phosphate fertilizer doses with or without nano iron application on sugar beet growth and physiology. Russ. J. Plant Physiol. 2024, 71, 190. [Google Scholar] [CrossRef]
  4. Zeng, X.P.; Zhu, K.; Lu, J.M.; Jiang, Y.; Yang, L.T.; Xing, Y.X.; Li, Y.R. Long-term effects of different nitrogen levels on growth, yield, and quality in sugarcane. Agronomy 2020, 10, 353. [Google Scholar] [CrossRef]
  5. Crusciol, C.A.C.; Campos, M.D.; Martello, J.M.; Alves, C.J.; Nascimento, C.A.C.; Pereira, J.C.D.R.; Cantarella, H. Organomineral fertilizer as source of P and K for sugarcane. Sci. Rep. 2020, 10, 5398. [Google Scholar] [CrossRef]
  6. Cui, J.; Tcherkez, G. Potassium dependency of enzymes in plant primary metabolism. Plant Physiol. Biochem. 2021, 166, 522–530. [Google Scholar] [CrossRef]
  7. Deng, S. Modern Sugarcane Production and Technology; Guangdong Science and Technology Press: Guangzhou, China, 1991. [Google Scholar]
  8. Cavalcante, V.; Prado, R.; Júnior de Almeida, H.; Cruz, F.; Santos, D.M.M. Gaseous exchanges, growth and foliar anatomy of sugarcane plants grown in potassium (K) deprived nutrient solution. Aust. J. Crop Sci. 2015, 9, 577–584. [Google Scholar]
  9. Xie, J.L.; Li, C.N.; Li, Y.; Liang, Q.; Liu, X.Y.; Luo, T.; Lin, L.; Liang, T.; He, W.Z.; Tang, H.Y. Effects of potassium fertilizer application amount on sugarcane yield, sugar accumulation and stress resistance. Soil Fert. Sci. China 2019, 2, 133–138. [Google Scholar]
  10. Liu, Z.F.; Lin, D.; Peng, C.Y. Effect of applying potassium on yield and quality of sugarcane. Sugar Crops China 2009, 4, 34–35+43. [Google Scholar]
  11. Shukla, S.K.; Yadav, R.L.; Singh, P.N.; Singh, I. Potassium nutrition for improving stubble bud sprouting, dry matter partitioning, nutrient uptake and winter initiated sugarcane ratoon yield. Eur. J. Agron. 2009, 30, 27–33. [Google Scholar] [CrossRef]
  12. Tan, H.W.; Zhou, L.Q.; Xie, R.L.; Huang, M.F. Potassium uptake and its utilization in sugarcane under the different fertilization levels. J. South. Agric. 2011, 42, 295–298. [Google Scholar]
  13. Huang, Z.R.; Zhou, W.L.; Ao, J.H.; Cheng, D.W.; Yang, Y.H.; Jiang, Y.; Li, Q.W. Sugarcane yield and soil potassium balance in potassium application of four consecutive years. Chin. J. Trop. Crops 2020, 41, 1347–1353. [Google Scholar]
  14. Salokhe, S. Development of an efficient protocol for production of healthy sugarcane seed cane through meristem culture. J. Agric. Food Res. 2021, 4, 100126. [Google Scholar] [CrossRef]
  15. Zhao, Y.; Ai, J.; Wang, Y.T.; Zhang, Z.F.; Yang, H.Q.; Li, J.Q.; Guo, Z.J.; Liu, H.J.; Qin, W.; Deng, J.; et al. Research on the production potential of main sugarcane varieties under different planting modes in hilly and mountainous areas. Sci. Agric. Sin. 2024, 57, 3743–3757. [Google Scholar]
  16. Sharma, R.; Sindhu, S.S.; Glick, B.R. Potassium solubilizing microorganisms as potential biofertilizer: A sustainable climate-resilient approach to improve soil fertility and crop production in agriculture. J. Plant Growth Regul. 2024, 43, 2503–2535. [Google Scholar] [CrossRef]
  17. Xu, X.X.; Du, X.; Wang, F.; Sha, J.C.; Chen, Q.; Tian, G.; Zhu, Z.L.; Ge, S.F.; Jiang, Y.M. Effects of potassium levels on plant growth, accumulation and distribution of carbon, and nitrate metabolism in apple dwarf rootstock seedlings. Front. Plant Sci. 2020, 11, 904. [Google Scholar] [CrossRef]
  18. Wang, J.; Lu, Y.H.; Zhang, X.M.; Hu, W.J.; Lin, L.J.; Deng, Q.X.; Xia, H.; Liang, D.; Lv, X.L. Effects of potassium-containing fertilizers on sugar and organic acid metabolism in grape fruits. Int. J. Mol. Sci. 2024, 25, 2828. [Google Scholar] [CrossRef]
  19. Soumare, A.; Sarr, D.; Diedhiou, A. Potassium sources, microorganisms, and plant nutrition challenges and future research directions: A review. Pedosphere 2022, 33, 105–115. [Google Scholar] [CrossRef]
  20. Li, X.T.; Tong, X.N.; Yu, Q.H.; Wang, N.; Wang, X.G.; Cao, M.J. Potassium efficiency of different low K tolerant soybean varieties. Soybean Sci. 2014, 33, 385–388. [Google Scholar]
  21. Lu, T.; Chen, H.T.; Shen, Z.G.; Chen, X. Advance of potassium channels and transporters in plant. Acta Agric. Boreali-Sin. 2019, 34, 372–379. [Google Scholar]
  22. Wang, W.; Chen, Q.; Xu, S.; Liu, W.C.; Zhu, X.; Song, C.P. Trehalose-6-phosphate phosphatase E modulates ABA-controlled root growth and stomatal movement in Arabidopsis. J. Integr. Plant Biol. 2020, 62, 1518–1534. [Google Scholar] [CrossRef]
  23. Hao, D.L.; Li, X.H.; Kong, W.Y.; Chen, R.R.; Liu, J.X.; Guo, H.L.; Zhou, J.Y. Phosphorylation regulation of nitrogen, phosphorus, and potassium uptake systems in plants. Crop J. 2023, 11, 1034–1047. [Google Scholar] [CrossRef]
  24. Luo, H.B.; Huang, C.M.; Cao, H.Q.; Wei, Y.W.; Xu, L.; Wu, K.C.; Deng, Z.N.; Wu, X.J.; Ye, L.P.; Yi, X.P. Molecular cloning and functional analysis of Shak10 gene promoter from sugarcane (Saccharum officinarum L.). Trop. Plant Biol. 2024, 17, 204–213. [Google Scholar]
  25. Li, K.L.; Xue, H.; Tang, R.J.; Luan, S. TORC pathway intersects with a calcium sensor kinase network to regulate potassium sensing in Arabidopsis. Proc. Natl. Acad. Sci. USA 2023, 120, e2316011120. [Google Scholar] [CrossRef]
  26. Li, W.F.; Fang, Y.H.; Chen, X.K.; Xia, H.M.; Li, F.Q.; Wang, Y. Rapid determination method of cane sugar content. Sugar Crops China 2009, 2, 14–15. [Google Scholar]
  27. Wang, Y.; Chen, Y.F.; Wu, W.H. Potassium and phosphorus transport and signaling in plants. J. Integr. Plant Biol. 2021, 63, 34–52. [Google Scholar] [CrossRef]
  28. Deeken, R.; Geiger, D.; Fromm, J.; Koroleva, O.; Ache, P.; Langenfeld-Heyser, R.; Sauer, N.; May, S.T.; Hedrich, R. Loss of the AKT2/3 potassium channel affects sugar loading into the phloem of Arabidopsis. Planta 2002, 216, 334–344. [Google Scholar] [CrossRef]
  29. Gopalasundaram, P.; Bhaskaran, A.; Rakkiyappan, P. Integrated nutrient management in sugarcane. Sugar Tech 2012, 14, 3–20. [Google Scholar] [CrossRef]
  30. Su, G. The Potassium Nutrition of Sugarcane; Guangdong Agricultural Sciences: Guangzhou, China, 1981. [Google Scholar]
  31. Li, Q.W.; Lu, Y.L.; Zhou, W.L.; Chen, D.W.; Ao, J.H.; Huang, Y.; Huang, Z.R.; Jiang, Y. Effects of low potassium stress on growth and photosynthetic characteristics of different sugarcane lines. Sugarcane Cane Sugar 2011, 6, 1–5. [Google Scholar]
  32. El-Tilib, M.; Elnasikh, M.; Elamin, E.A. Phosphorus and potassium fertilization effects on growth attributes and yield of two sugarcane varieties grown on three soil series. J. Plant Nutr. 2004, 27, 663–699. [Google Scholar] [CrossRef]
  33. Jin, Y.F.; Chen, D.W.; Li, Q.W.; Huang, Y.; Huang, Z.R. Effect of different levels of potassium on sugarcane germination and seedling growth. Guangdong Agric. Sci. 2013, 40, 72–74. [Google Scholar]
  34. Zheng, C.; Li, Q.W.; Huang, Z.R.; Ao, J.H. Potassium uptake difference of different sugarcane varieties. Chin. J. Trop. Crops 2011, 32, 2221–2225. [Google Scholar]
  35. Zhang, H.W.; Xiao, W.; Yu, W.W.; Yao, L.; Li, L.G.; Wei, J.H.; Li, R.F. Foxtail millet SiHAK1 excites extreme high-affinity K+ uptake to maintain K+ homeostasis under low K+ or salt stress. Plant Cell Rep. 2018, 37, 1533–1546. [Google Scholar] [CrossRef] [PubMed]
  36. Feng, X.M.; Wang, Y.J.; Zhang, N.N.; Wu, Z.L.; Zeng, Q.Y.; Wu, J.Y.; Wu, X.B.; Wang, L.; Zhang, J.S.; Qi, Y.W. Genome-wide systematic characterization of the HAK/KUP/KT gene family and its expression profile during plant growth and in response to low-K+ stress in Saccharum. BMC Plant Biol. 2020, 20, 20. [Google Scholar] [CrossRef]
  37. Feng, H.M.; Tang, Q.; Cai, J.; Xu, B.C.; Xu, G.H.; Yu, L. Rice OsHAK16 functions in potassium uptake and translocation in shoot, maintaining potassium homeostasis and salt tolerance. Planta 2019, 250, 549–561. [Google Scholar] [CrossRef]
  38. Chen, G.; Hu, Q.D.; Luo, L.; Yang, T.Y.; Zhang, S.; Hu, Y.B.; Yu, L.; Xu, G.H. Rice potassium transporter OsHAK1 is essential for maintaining potassium-mediated growth and functions in salt tolerance over low and high potassium concentration ranges. Plant Cell Environ. 2015, 38, 2747–2765. [Google Scholar] [CrossRef]
  39. Chen, G.; Zhang, Y.; Ruan, B.; Guo, L.B.; Zeng, D.L.; Gao, Z.Y.; Zhu, L.; Hu, J.; Ren, D.Y.; Yu, L.; et al. OsHAK1 controls the vegetative growth and panicle fertility of rice by its effect on potassium-mediated sugar metabolism. Plant Sci. 2018, 274, 261–270. [Google Scholar] [CrossRef] [PubMed]
  40. Huang, S.J.; Chang, C.L.; Wang, P.H.; Tsai, M.C.; Hsu, P.H.; Chang, I.F. A type III ACC synthase, ACS7, is involved in root gravitropism in Arabidopsis thaliana. J. Exp. Bot. 2013, 64, 4343–4360. [Google Scholar] [CrossRef]
  41. Zhou, W.K.; Lozano-Torres, J.L.; Blilou, I.; Zhang, X.Y.; Zhai, Q.Z.; Smant, G.; Li, C.Y.; Scheres, B. A jasmonate signaling network activates root stem cells and promotes regeneration. Cell 2019, 177, 942–956.e14. [Google Scholar] [CrossRef]
  42. Gratz, R.; Manishankar, P.; Ivanov, R.; Köster, P.; Mohr, I.; Trofimov, K.; Steinhorst, L.; Meiser, J.; Mai, H.J.; Drerup, M.; et al. CIPK11-dependent phosphorylation modulates FIT activity to promote Arabidopsis iron acquisition in response to calcium signaling. Dev. Cell 2019, 48, 726–740.e10. [Google Scholar] [CrossRef]
  43. Lin, Q.F.; Gong, J.X.; Zhang, Z.L.; Meng, Z.Z.; Wang, J.Y.; Wang, S.; Sun, J.; Gu, X.; Jin, Y.T.; Wu, T.; et al. The Arabidopsis thaliana trehalose-6-phosphate phosphatase gene AtTPPI regulates primary root growth and lateral root elongation. Front. Plant Sci. 2022, 13, 1088278. [Google Scholar] [CrossRef]
  44. Luan, S.; Lan, W.; Lee, S.C. Potassium nutrition, sodium toxicity, and calcium signaling: Connections through the CBL–CIPK network. Curr. Opin. Plant Biol. 2009, 12, 339–346. [Google Scholar] [CrossRef]
  45. Yu, Q.Y.; An, L.J.; Li, W.L. The CBL–CIPK network mediates different signaling pathways in plants. Plant Cell Rep. 2014, 33, 203–214. [Google Scholar] [CrossRef]
  46. Zhang, R.; Dong, Q.Y.; Zhao, P.; Eickelkamp, A.; Ma, C.M.; He, G.F.; Li, F.J.; Wallrad, L.; Becker, T.; Li, Z.H.; et al. The potassium channel GhAKT2BD is regulated by CBL–CIPK calcium signalling complexes and facilitates K+ allocation in cotton. FEBS Lett. 2022, 596, 1904–1920. [Google Scholar] [CrossRef] [PubMed]
  47. Li, K.L.; Tang, R.J.; Wang, C.; Luan, S. Potassium nutrient status drives posttranslational regulation of a low-K response network in Arabidopsis. Nat. Commun. 2023, 14, 360. [Google Scholar] [CrossRef]
  48. Scherzer, S.; Böhm, J.; Krol, E.; Shabala, L.; Kreuzer, I.; Larisch, C.; Bemm, F.; Al-Rasheed, K.A.S.; Shabala, S.; Rennenberg, H.; et al. Calcium sensor kinase activates potassium uptake systems in gland cells of Venus flytraps. Proc. Natl. Acad. Sci. USA 2015, 112, 7309–7314. [Google Scholar] [CrossRef] [PubMed]
  49. Zhang, H.C.; Yin, W.L.; Xia, X.L. Shaker-like potassium channels in Populus, regulated by the CBL–CIPK signal transduction pathway, increase tolerance to low-K+ stress. Plant Cell Rep. 2010, 29, 1007–1012. [Google Scholar] [CrossRef] [PubMed]
  50. Ragel, P.; Ródenas, R.; García-Martín, E.; Andrés, Z.; Villalta, I.; Nieves-Cordones, M.; Rivero, R.M.; Martínez, V.; Pardo, J.M.; Quintero, F.J.; et al. The CBL-interacting protein kinase CIPK23 regulates HAK5-mediated high-affinity K+ uptake in Arabidopsis roots. Plant Physiol. 2015, 169, 2863–2873. [Google Scholar]
  51. Xu, J.; Li, H.D.; Chen, L.Q.; Wang, Y.; Liu, L.L.; He, L.; Wu, W.H. A protein kinase, interacting with two calcineurin B-like proteins, regulates K+ transporter AKT1 in Arabidopsis. Cell 2006, 125, 1347–1360. [Google Scholar] [CrossRef]
  52. Ling, Q.P.; Zeng, Q.Y.; Hu, F.; Chen, J.W.; Wu, J.Y.; Li, Q.W.; Qi, Y.W. Molecular cloning and expression analysis of CIPK23 gene from sugarcane under low potassium, drought and salt stress. Mol. Plant Breed. 2015, 13, 1329–1335. [Google Scholar]
  53. Sánchez-Barrena, M.J.; Chaves-Sanjuan, A.; Raddatz, N.; Mendoza, I.; Cortés, Á.; Gago, F.; González-Rubio, J.M.; Benavente, J.L.; Quintero, F.J.; Pardo, J.M.; et al. Recognition and activation of the plant AKT1 potassium channel by the kinase CIPK231. Plant Physiol. 2020, 182, 2143–2153. [Google Scholar] [CrossRef] [PubMed]
Figure 1. Differential growth responses of sugarcane (Saccharum spp.) to potassium (K) fertilization during early developmental stages. (a) Schematic illustrating the experimental set up of the hydroponic cultivation system for seedling-stage K treatments (KH1–KH5). (b) Phenotypic manifestations after 60 days of exposure to graded K concentrations, demonstrating dose-dependent growth variations. (c) Analysis of height differences in sugarcane plants (n = 4) after two months of water-cultivation. Different lowercase letters above the boxes indicate significant differences among treatments based on Tukey’s HSD test. (d) Field-grown plant growth kinetics during the tillering phase, depicting the absolute growth rates (cm day−1) across five developmental intervals (days after sowing (DAS) 60–150) under differential K fertilization (KF1–KF5).
Agronomy 15 02060 g001
Figure 2. Effects of potassium fertilization regimes on sugarcane yield and sucrose accumulation across consecutive cropping cycles. (a) Yield performance of first-year newly planted sugarcane. (b) Yield of first-year ratoon crop. (c) Yield of second-year ratoon crop. (d) Sucrose concentration in first-year newly planted sugarcane. (e) Sucrose concentration in first-year ratoon crop. (f) Sucrose concentration in second-year ratoon crop. Data marked with different letters (a–d) indicate statistically significant differences (p < 0.05) among potassium treatments.
Agronomy 15 02060 g002
Figure 3. Transcriptomic profiling and differential gene expression patterns under varying potassium regimes. (a) Inter-sample correlation matrix demonstrating transcriptional reproducibility. (bd) Volcano plots illustrating differentially expressed genes (DEGs) between treatment pairs: (b) LK vs. NK, (c) LK vs. HK, and (d) NK vs. HK, with thresholds set at |log2fold-change (FC)| > 1 and false discovery rate (FDR) < 0.01. LK, Low K2O; NK, KF3 (normal K2O); HK, KF5 (high K2O).
Agronomy 15 02060 g003
Figure 4. Functional enrichment analysis of differentially expressed genes (DEGs) in sugarcane root systems under varying potassium regimes (a) Top 10 significantly enriched Gene Ontology (GO) terms for DEGs in the low potassium (LK) versus normal potassium (NK) comparison. (b) GO enrichment profile for the LK versus high potassium (HK) comparison. (c) GO term distribution for the NK versus HK comparison. The ordinate represents specific GO functional categories, while the abscissa denotes gene counts, demonstrating potassium-dependent transcriptional regulation patterns in root tissues. ESC/E/(Z), Extra Sex Combs/Enhancer of Zeste; ESCRT, endosomal sorting complex required for transport; PRC1, polycomb repressive complex 1; Ndc80, nuclear division cycle 80; PcG, polycomb group; NMS, nuclear male sterility; MCM, minichromosome maintenance; UDP, uridine diphosphate.
Agronomy 15 02060 g004
Figure 5. Metabolic pathway enrichment profiles of differentially expressed genes (DEGs) in sugarcane root systems under potassium stress. (a) Kyoto Encyclopedia of Genes and Genomes (KEGG) pathway enrichment analysis of DEGs under low potassium (LK) versus normal potassium (NK) conditions. (b) Enriched pathways in the LK versus high potassium (HK) comparison. (c) Pathway distribution in the NK versus HK comparison. The ordinate displays enriched KEGG pathways, while the abscissa indicates the gene ratio, with dot sizes corresponding to gene counts per pathway.
Agronomy 15 02060 g005
Figure 6. Expression profiles of potassium transport-related genes in sugarcane roots under different potassium treatments The heatmap illustrates expression patterns of K+ channels and transporters in sugarcane roots following potassium application, with color gradients representing Fragments Per Kilobase of transcript per Million mapped reads (FPKM) values (red: high expression; blue: low expression). LK, Low K2O; NK, KF3 (normal K2O); HK, KF5 (high K2O); AKT, protein kinase B; KCO1, CA2+ activated outward rectifying K+ channel 1; TPK, tandem-pore K+ channel; HAK/KUP/KT, High-affinity K+ transporters/K+ uptake permeases/K+ transporters; CHX, cation/H+ exchanger.
Agronomy 15 02060 g006
Figure 7. Calcium signaling-mediated potassium acquisition in sugarcane roots. The schematic illustrates calcium signal transduction-associated differentially expressed genes (DEGs) involved in K+ uptake under potassium deficiency. Cellular K+ deprivation triggers Ca2+ influx, activating calcium signaling cascades that subsequently regulate K+ channel proteins for ion absorption. Gene expression levels are visualized by Fragments Per Kilobase of transcript per Million mapped reads (FPKM) values (red: high expression; green: low expression). LK, Low K2O; NK, KF3 (normal K2O); HK, KF5 (high K2O); CBL, calcineurin B-like protein; AKT, protein kinase B; HAK, high-affinity K+ transporter; CIPK, CBL-interacting protein kinase.
Agronomy 15 02060 g007
Figure 8. Weighted gene co-expression network analysis (WGCNA) of sugarcane agronomic traits across different ratoon crops. The heatmap (right panel) displays correlation coefficients (numerical values in boxes) and corresponding p-values between gene co-expression modules and phenotypic traits, where red and blue colors indicate positive and negative correlations, respectively. Modules showing significant positive associations (correlation coefficient > 0.65, p < 0.05) are highlighted. The line graphs (left panel) illustrate expression patterns of genes within three positively correlated modules. LK, Low K2O; NK, KF3 (normal K2O); HK, KF5 (high K2O); ME, expression module; NY, plant cane yield; RFY, first-ratoon yield; RSY, second-ratoon yield; NS, plant cane sucrose content; RFS, first-ratoon sucrose content; RSS, second-ratoon sucrose content.
Agronomy 15 02060 g008
Figure 9. Functional characterization and co-expression network of agronomic trait-associated gene modules. (a) Gene Ontology (GO) enrichment analysis of MEblue module genes, with circle size representing gene counts per term and color intensity indicating statistical significance (blue: highly significant, p < 0.01). (b) Regulatory network of potassium-responsive core genes, depicting interactions between transcription factors (hexagonal nodes) and non-transcription factor genes (circular nodes) induced by potassium application. ME, expression module.
Agronomy 15 02060 g009
Table 1. Concentrations of Element Stock Solutions in the Nutrient Solution.
MacroelementsMicroelements
Nutritional SaltsDensity/g·L−1Nutritional SaltsDensity/g·L−1
Ca(NO3)2·4H2O236.00H3BO32.86
KNO3101.00MnCl2·4H2O1.81
MgSO4·7H2O98.00ZnSO4·7H2O0.22
KH2PO427.00CuSO4·5H2O0.08
KCl90.00Na2MoO4·2H2O0.03
NaNO342.50FeSO4·7H2O5.56
NaH2PO443.50EDTA-Na27.49
Na2SO428.40
Table 2. Quality analysis of the transcriptome sequencing.
SampleRaw Reads
(Gb)
Clean ReadsClean Bases (Gb)GC Content
(%)
Q20
(%)
Q30
(%)
LK18.8358,878,8588.8254.0596.7890.06
LK26.5243,448,2946.5051.5096.7689.79
LK36.4843,206,5846.4751.8196.8590.11
NK17.9452,907,2447.9252.2797.0190.57
NK28.3855,896,5268.3751.9397.1190.91
NK36.4643,037,9846.4352.0998.2994.43
HK16.8545,662,8046.8353.1197.9493.17
HK26.3642,398,6266.3452.1598.0493.45
HK36.4643,037,7966.4452.9397.6692.20
Disclaimer/Publisher’s Note: The statements, opinions and data contained in all publications are solely those of the individual author(s) and contributor(s) and not of MDPI and/or the editor(s). MDPI and/or the editor(s) disclaim responsibility for any injury to people or property resulting from any ideas, methods, instructions or products referred to in the content.