Article

Visual Observation of Polystyrene Microplastics/Nanoplastics in Peanut Seedlings and Their Effects on Growth and the Antioxidant Defense System

College of Agriculture, Henan University of Science and Technology, Luoyang 471000, China
*
Authors to whom correspondence should be addressed.
Agronomy 2025, 15(8), 1895; https://doi.org/10.3390/agronomy15081895
Submission received: 10 July 2025 / Revised: 1 August 2025 / Accepted: 5 August 2025 / Published: 6 August 2025
(This article belongs to the Collection Crop Physiology and Stress)

Abstract

Peanut cultivation is widely practiced using plastic mulch film, resulting in the accumulation of microplastics/nanoplastics (MPs/NPs) in agricultural soils, potentially negatively affecting peanut growth. To investigate the effects of two polystyrene (PS) sizes (5 μm, 50 nm) and three concentrations (0, 10, and 100 mg L−1) on peanut growth, photosynthetic efficiency, and physiological characteristics, a 15-day hydroponic experiment was conducted using peanut seedlings as the experimental material. The results indicated that PS-MPs/NPs inhibited peanut growth, reduced soil and plant analyzer development (SPAD) values (6.7%), and increased levels of malondialdehyde (MDA, 22.0%), superoxide anion (O2, 3.8%) superoxide dismutase (SOD, 16.1%) and catalase (CAT, 12.1%) activity, and ascorbic acid (ASA, 12.6%) and glutathione (GSH, 9.1%) contents compared to the control. Moreover, high concentrations (100 mg L−1) of PS-MPs/NPs reduced the peanut shoot fresh weight (16.1%) and SPAD value (7.2%) and increased levels of MDA (17.1%), O2 (5.6%), SOD (10.6%), POD (27.2%), CAT (7.3%), ASA (12.3%), and GSH (6.8%) compared to low concentrations (10 mg L−1) of PS-MPs/NPs. Notably, under the same concentration, the impact of 50 nm PS-NPs was stronger than that of 5 μm PS-MPs. The peanut shoot fresh weight of PS-NPs was lower than that of PS-MPs by an average of 7.9%. Additionally, we found that with an increasing exposure time of PS-MPs/NPs, the inhibitory effect of low concentrations of PS-MPs/NPs on the fresh weight was decreased by 2.5%/9.9% (5 d) and then increased by 7.7%/2.7% (15 d). Conversely, high concentrations of PS-MPs/NPs consistently reduced the fresh weight. Correlation analysis revealed a clear positive correlation between peanut biomass and both the SPAD values as well as Fv/Fm, and a negative correlation with MDA, SOD, CAT, ASA, and GSH. Furthermore, the presence of PS-MPs/NPs in roots, stems, and leaves was confirmed using a confocal laser scanning microscope. The internalization of PS-MPs/NPs within peanut tissues negatively impacted peanut growth by increasing the MDA and O2 levels, reducing the SPAD values, and inhibiting the photosynthetic capacity. In conclusion, the study demonstrated that the effects of PS on peanuts were correlated with the PS size, concentration, and exposure time, highlighting the potential risk of 50 nm to 5 μm PS being absorbed by peanuts.

1. Introduction

The application of agricultural film mulches, plastic-coated fertilizers, and sewage sludge has resulted in the progressive accumulation and long-term persistence of microplastics (MPs; ≤5 mm) and nanoplastics (NPs; 1–100 nm) in agricultural soils [1,2]. Consequently, MPs/NPs are considered persistent contaminants in agricultural systems [3,4]. These MPs/NPs have the potential to be absorbed, accumulated, and transported along food chains by both plants and animals [5,6], posing a serious threat to agroecosystems and human health. Despite growing attention to the effects of MPs/NPs on agroecosystems, critical gaps persist in understanding how plastic particle characteristics (type, size, and concentration) interact to influence physiological responses.
MPs/NPs have the potential to penetrate root tissues and influence plant growth [7,8]. Notably, Li et al. [9] demonstrated that smaller sized (0.2 μm) PS beads could pass through the epidermal layers of wheat roots into the apical meristem and be transported within the roots, as shown by fluorescent labeling. However, 7.0 μm and 10 μm PS microbeads were not detected in the vascular system of wheat roots. Recent studies on the effects of MPs/NPs on crop growth have shown diverse results. Exposure to MPs/NPs treatments often leads to oxidative stress and reduced photosynthesis in crops [10,11,12]. Some scholars believe that the impact of MPs on plants is influenced by particle sizes and concentrations of MPs [13,14]. Different types of microplastics can inhibit seed germination at concentrations of 500 mg L−1 or below, but the inhibitory effect diminishes at a 1000 mg·L−1 microplastic treatment [15]. At low concentrations (10 mg·L−1), MPs have no significant effect on tobacco growth, whereas high concentrations (1000 mg·L−1) significantly reduce the fresh biomass and root length in tobacco [16]. MPs with larger particle sizes may accumulate on the root surface, reducing the uptake of water and nutrients and subsequently decreasing plant biomass [17,18]. However, Cao et al. [19] observed that NPs (30 nm) resulted in a lower tomato yield, SPAD value, and Fv/Fm compared to MPs (1 μm), with green fluorescently labeled 30 nm PS beads observed in leaves. These findings indicate that NPs may pose phytotoxicity risks by interacting with plant cellular structures and physiological processes [20]. Current studies have primarily focused on the effects of single microplastic sizes or concentrations, resulting in a limited understanding of the synergistic interactions between varying concentrations and particle sizes, as well as their dynamic temporal effects. Notably, Lian et al. [21] demonstrated that the phytotoxicity of NPs increases with the exposure time; however, the interaction mechanism among the size, concentration levels, and exposure time is not yet fully understood. Moreover, while fluorescence labeling techniques have confirmed MPs/NPs translocation within plant tissues [9], their correlation with oxidative damage and photosynthesis inhibition requires systematic investigation.
Peanut (Arachis hypogaea L.), as a representative geocarpic crop, develops roots and fruits that are directly exposed to soil contaminants. Halder et al. [22] found that a low concentration (0.5%) of polyvinyl chloride (PVC) microplastics could significantly reduce peanut dry weight; 3.5% PVC (35 g kg−1 soil) is the most toxic concentration for peanuts, causing comprehensive growth inhibition, oxidative damage, and nodule dysfunction. However, the mechanisms underlying the root-to-leaf translocation of MPs/NPs in peanuts remain poorly understood. Notably, the existing research largely overlooks two critical aspects: (i) whether the physiological effects of MPs on peanuts are regulated by different MPs sizes and concentrations and (ii) whether MPs can be internalized via root uptake and transported to aerial tissues in peanuts. To unravel the interactive effects of polystyrene (PS) size, concentration, and time on peanut growth, we conducted a 15-day hydroponic experiment. Additionally, we aimed to establish causal relationships between intratissue distribution patterns of MPs and toxicity mechanisms using a confocal laser scanning microscope (CLSM). This study establishes a theoretical framework for evaluating the ecological risks associated with microplastic/nanoplastic contamination in agricultural soils, particularly for oilseed crops.

2. Materials and Methods

2.1. Plant and Microplastic Materials

The peanut (Arachis hypogaea L. cv. Huayu 16) was used for this experiment. Seeds of a uniform size were surface-sterilized in 10% H2O2 for 20 min, thoroughly rinsed with ultrapure water, and then soaked in ultrapure water for 24 h. Thereafter, the seeds were placed on wet filter paper in an incubator and kept in the dark at 28 °C for germination. The seedlings were grown under controlled environmental conditions (28/20 °C day/night temperature, 50/70% humidity, 14/10 h light/dark photoperiod) of Henan University of Science and Technology from 2 July to 24 July 2024.
Monodisperse fluorescently labeled polystyrene (PS) microspheres were purchased from Jiangsu Zhichuan Technology Co., Ltd. (Suzhou, China), and they served as the test MPs/NPs. Nano-sized (50 nm diameter, 488/520 nm) and micro-sized (5 μm diameter, 488/520 nm) PS microspheres were used.

2.2. Experimental Treatments

A hydroponic experiment under controlled conditions was conducted to exclude soil matrix interference and isolate the effects of polystyrene microplastics/nanoplastics (PS-MPs/NPs) on peanut seedlings, thereby enabling precise manipulation of exogenous variables. The PS microspheres were added as a suspension of 100 mg mL−1 in distilled water. To ensure the homogeneous dispersion of the PS microspheres in the modified Hoagland’s nutrient solution and to prevent aggregation, the microsphere suspension was sonicated for 10 min at 25 °C (SB25-12DT, Ningbo Scientz Biotechnology Co., Ltd., Ningbo, China). Two sizes of polystyrene microplastics (50 nm and 5 μm) were selected for the present study, and three concentrations of polystyrene microplastics (0 mg L−1, 10 mg L−1, and 100 mg L−1) were used. The 0 mg L−1 PS was the control treatment (CK).
On the day of the test start, uniform seedlings were selected, and each seedling was anchored using cotton and transferred into a 100 mL test tube containing 80 mL of modified Hoagland’s nutrient solution (Figure 1). The test tubes were placed in a box wrapped with aluminum foil to simulate the dark soil environment. Each treatment consisted of thirty peanut seedlings transplanted into individual 100 mL test tubes each containing 80 mL of the respective treatment solution. The nutrient solution was checked daily and replaced every three days to maintain consistent concentrations throughout the exposure period.

2.3. Confocal Laser Scanning Microscope Observation

After 10 d of exposure to PS microspheres, we sampled the roots, stems, and leaves; washed them with distilled water; and sonicated the selected root samples for 10 min to remove any PS particles. Fresh peanut roots were manually cut with a razor blade to prepare longitudinal sections (approximately 0.5 cm in length) and transverse sections of roots and stems. The sections were placed on a glass slide in distilled water and covered with a coverslip. A confocal laser scanning microscope (FluoView FV3000, Olympus, Tokyo, Japan) was used to observe fluorescently labeled polystyrene (PS) microspheres one by one in plant sections at the fluorescence excitation/emission wavelengths (488 nm/520 nm).

2.4. Measurement of Peanut Biomass

Peanut shoot and root tissues were collected for index determination on 5 d, 10 d, and 15 d. The fresh weight (FW) of the sample was measured from 6 plants by electronic balance.

2.5. SPAD Value and Chlorophyll Fluorescence of Leaves

The soil and plant analyzer development (SPAD) value was measured using a SPAD-502 chlorophyll meter (SPDA, Konica Minolta, Tokyo, Japan). The MINI-PAM-II Photosynthesis Yield Analyzer (MINI-PAM-II, WALZ, Bavaria, Germany) was used to measure chlorophyll fluorescence parameters after leaving the leaves in the dark for 20 min.

2.6. Peanut Physiological Indicators

2.6.1. Measurement of MDA and O2 Content

The malondialdehyde (MDA) content in the leaf was measured by the thiobarbituric acid method [23], and the result was expressed as μmol g−1 FW. The superoxide anion (O2) content in the leaf was determined by hydroxylamine oxidation [24], and the result was expressed as μg g−1 FW.

2.6.2. Measurement of Antioxidant Enzyme Activities

Superoxide dismutase (SOD) activity was measured by the NBT method [25], and the results were expressed as U g−1 FW. Catalase (CAT) activity was measured according to a previously established protocol [26] by monitoring the reduction in absorbance of H2O2 at 240 nm for 3 min, and the results were expressed as U g−1 min−1 FW. Peroxidase (POD) activity was measured by the guaiacol method [27], and the results were expressed as U g−1 min−1 FW.

2.6.3. Measurement of Antioxidant Content

Ascorbic acid (AsA) was determined according to the method of Karam et al. [28], and the results were expressed as μmol g−1 FW. Glutathione (GSH) was determined according to the method of Hussain et al. [29], and the results were expressed as μmol g−1 FW.

2.7. Statistical Analysis

All experimental data were analyzed with the statistical packages SPSS 19.0 (IBM, New York, NY, USA) and Microsoft Excel 2019 (Microsoft, Redmond, WA, USA). A two-way ANOVA was conducted to evaluate both individual and integrated effects of polystyrene (PS) particle size, concentration, and exposure duration on peanut growth. The Duncan’s test was used for the ANOVA to verify the significant difference among all groups (p < 0.05), and Origin 2023 (Origin Lab, Northampton, MA, USA) was used for Spearman’s correlation analysis and drawing.

3. Result

3.1. Effects of Polystyrene Microplastics/Nanoplastics on Fresh Weight of Peanut

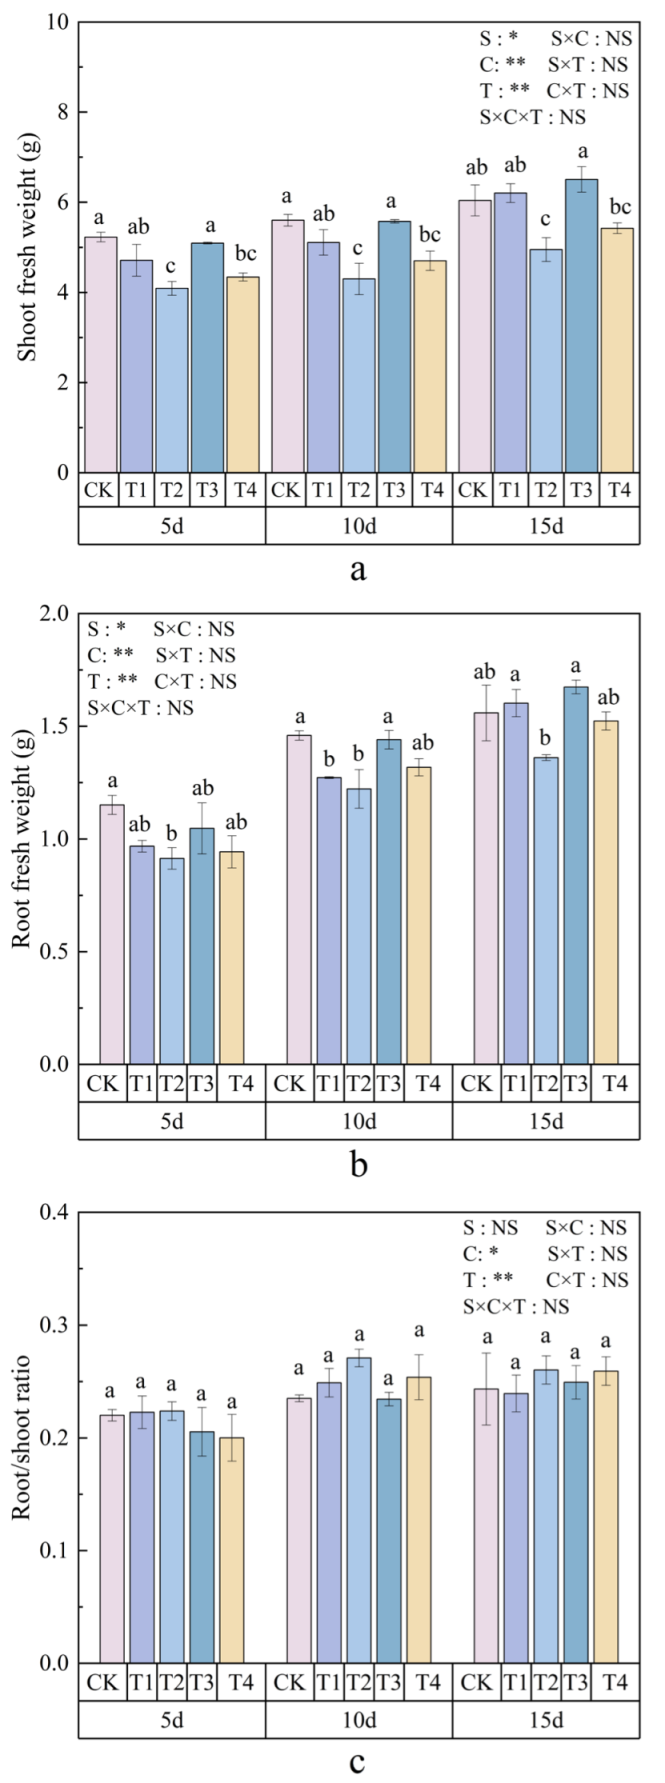
The PS size, concentration, and exposure time significantly influenced the fresh weight of peanuts (Figure 2). When compared to the control (CK), the shoot and root fresh weights of different treatments were decreased by 9.9% and 15.9% (10 mg L−1 PS-NPs, 5 d), 21.8% and 20.6% (100 mg L−1 PS-NPs, 5 d), 2.5% and 9.0% (10 mg·L−1 PS-MPs, 5 d), and 17.0% and 18.1% (100 mg·L−1 PS-MPs, 5 d), respectively. Notably, the 100 mg·L−1 PS-NPs treatment significantly reduced peanut biomass. Under the 100 mg·L−1 PS-NPs treatment, the shoot fresh weight and root fresh weight on 10 d were significantly decreased by 16.3% and 23.2% compared to the CK. At the same PS particle size, the shoot fresh weights of high concentrations (100 mg L−1) of PS-MPs/NPs were significantly decreased by 20.2%/16.6% (15 d) compared to those of low concentrations (10 mg L−1) of PS-MPs/NPs. At the same PS concentration, the shoot fresh weights of the low/high concentrations of PS-MPs were increased by 4.9%/9.5% (15 d), compared to those of the low/high concentrations of PS-NPs. With an increasing exposure time, the shoot fresh weights and root fresh weights were initially inhibited and later promoted under low concentrations of PS-MPs/NPs, whereas high concentrations of PS-MPs/NPs consistently reduced peanut biomass. The PS treatments had no significant effect on the root/shoot ratio.

3.2. Effects of Polystyrene Microplastics/Nanoplastics on SPAD Value of Peanut

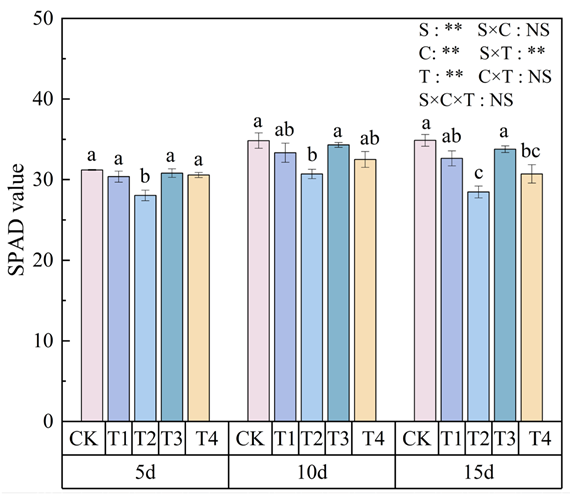
The PS size, concentration, and exposure time significantly affected the SPAD value of leaves (Figure 3). On day 5, the peanut SPAD values of different treatments were decreased by 2.7% (10 mg L−1 PS-NPs), 10.2% (100 mg L−1 PS-NPs), 1.3% (10 mg L−1 PS-MPs), and 2.0% (100 mg L−1 PS-MPs), respectively, compared to those of the CK. The 100 mg L−1 PS-NPs treatment significantly decreased the SPAD value. The 100 mg L−1 PS-NPs treatment significantly decreased the SPAD value by 10.2% (5 d), 11.9% (10 d), and 18.4% (15 d), respectively. With the same PS particle size, the SPAD value of high concentrations (100 mg L−1) of PS-MPs/NPs are significantly decreased by 12.8%/9.1% (15 d) compared to that of low concentrations (10 mg L−1) of PS-MPs/NPs. With the same PS concentration, the SPAD value of the low/high concentrations of PS-MPs was increased by 3.5%/7.9% (15 d) compared to that of the low/high concentrations of PS-NPs. With an increasing exposure time of PS, the SPAD values were inhibited and then subsequently promoted under low concentrations of PS-MPs/NPs, while high concentrations of PS-MPs/NPs consistently reduced SPAD values.

3.3. Effects of Polystyrene Microplastics/Nanoplastics on Chlorophyll Fluorescence of Peanut

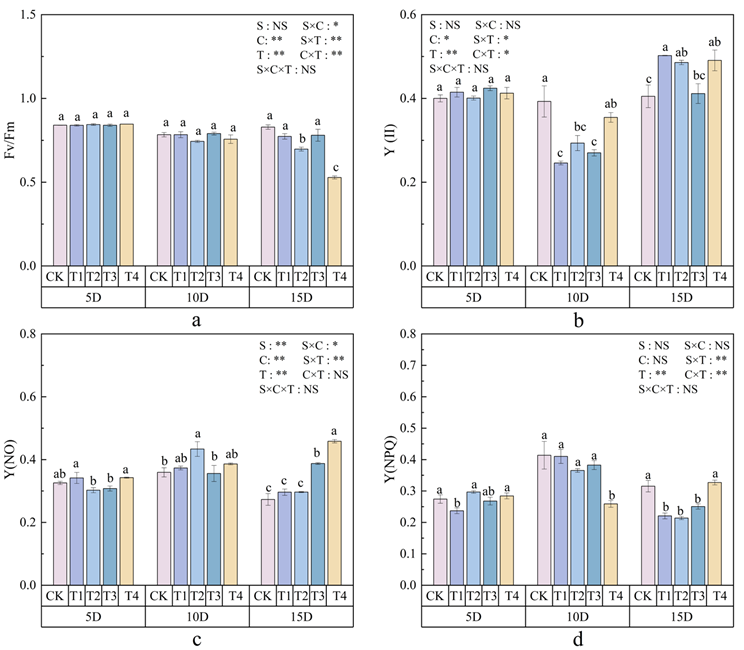
Figure 4 shows a plot showing the impact of microplastics/nanoplastics on peanut chlorophyll fluorescence parameters. On day 10, the Y(II) of PS-MPs/NPs treatments significantly decreased by 37.4% (10 mg L−1 PS-NPs), 25.3% (100 mg L−1 PS-NPs), 31.2% (10 mg L−1 PS-MPs), and 9.7% (100 mg L−1 PS-MPs) compared to that of the CK. However, on day 15, the Y(II) values increased by 24.0% (10 mg L−1 PS-NPs), 19.9% (100 mg L−1 PS-NPs), 1.6% (10 mg L−1 PS-MPs), and 21.2% (100 mg L−1 PS-MPs) compared to those of the CK. The Y(NO) values of PS-MPs/NPs treatments increased by 8.5% (10 mg L−1 PS-NPs, 15 d), 8.6% (100 mg L−1 PS-NPs, 15 d), 41.9% (10 mg L−1 PS-MPs 15 d), and 67.9% (100 mg L−1 PS-MPs 15 d) compared to those of the CK. The Y(NO) values of PS-MPs/NPs treatments increased by 0.9% (10 mg L−1 PS-NPs, 10 d), 11.7% (100 mg L−1 PS-NPs, 10 d), 7.6% (10 mg L−1 PS-MPs, 10 d), and 37.4% (100 mg L−1 PS-MPs, 10 d) compared to those of the CK. The 100 mg L−1 PS-NPs treatment significantly reduced Fv/Fm on day 15. Fv/Fm of high concentrations (100 mg L−1) of PS-NPs significantly decreased by 17.6% (15 d) compared to that of the CK. At the same PS particle size, Y(NO) of high concentrations (100 mg L−1) of PS-MPs/NPs increased by 16.2%/8.6% (10 d) compared to that of low concentrations (10 mg L−1) of PS-MPs/NPs. At the same PS concentration, Y(NPQ) values under low/high concentrations of PS-MPs decreased by 6.7%/29.1% (10 d) compared to those under low/high concentrations of PS-NPs.

3.4. Effects of Polystyrene Microplastics/Nanoplastics on MDA and O2 Content of Peanut

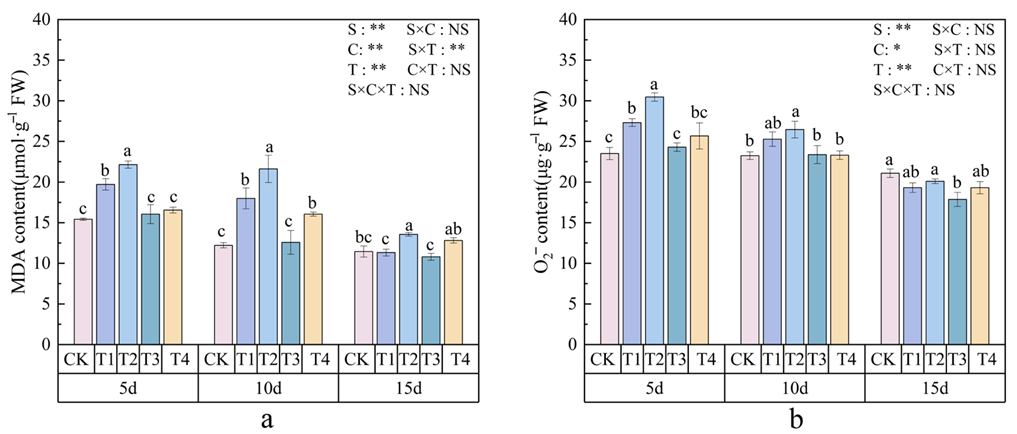
The PS size, concentration, and the exposure time significantly affected the MDA and O2 content (Figure 5). On day 5, the MDA and O2 contents increased by 27.9% and 16.2% (10 mg L−1 PS-NPs), 43.6% and 29.6% (100 mg L−1 PS-NPs), 3.3% and 3.3% (10 mg L−1 PS-MPs), and 7.3% and 9.2% (10 mg L−1 PS-MPs) compared to the CK. The 100 mg L−1 PS-NPs treatment significantly increased the MDA and O2 contents in peanuts. Under this treatment, the MDA and O2 contents on day 10 significantly increased by 77.0% and 13.8% compared to those of the CK. At the same PS particle size, the MDA and O2 contents under high concentrations (100 mg L−1) of PS-MPs/NPs were higher than under low concentrations of (10 mg L−1) PS-MPs/NPs. Under the same PS concentration, the MDA and O2 contents of low/high concentrations of PS-MPs treatments were lower than those under the corresponding concentrations of PS-NPs. With an increasing exposure time of PS, the MDA and O2 contents were initially promoted and then inhibited under low concentrations of PS-MPs/NPs, and high concentrations of PS-MPs/NPs consistently promoted the MDA and O2 contents in peanuts.

3.5. Effects of Polystyrene Microplastics/Nanoplastics on Antioxidant Enzyme Activities of Peanut

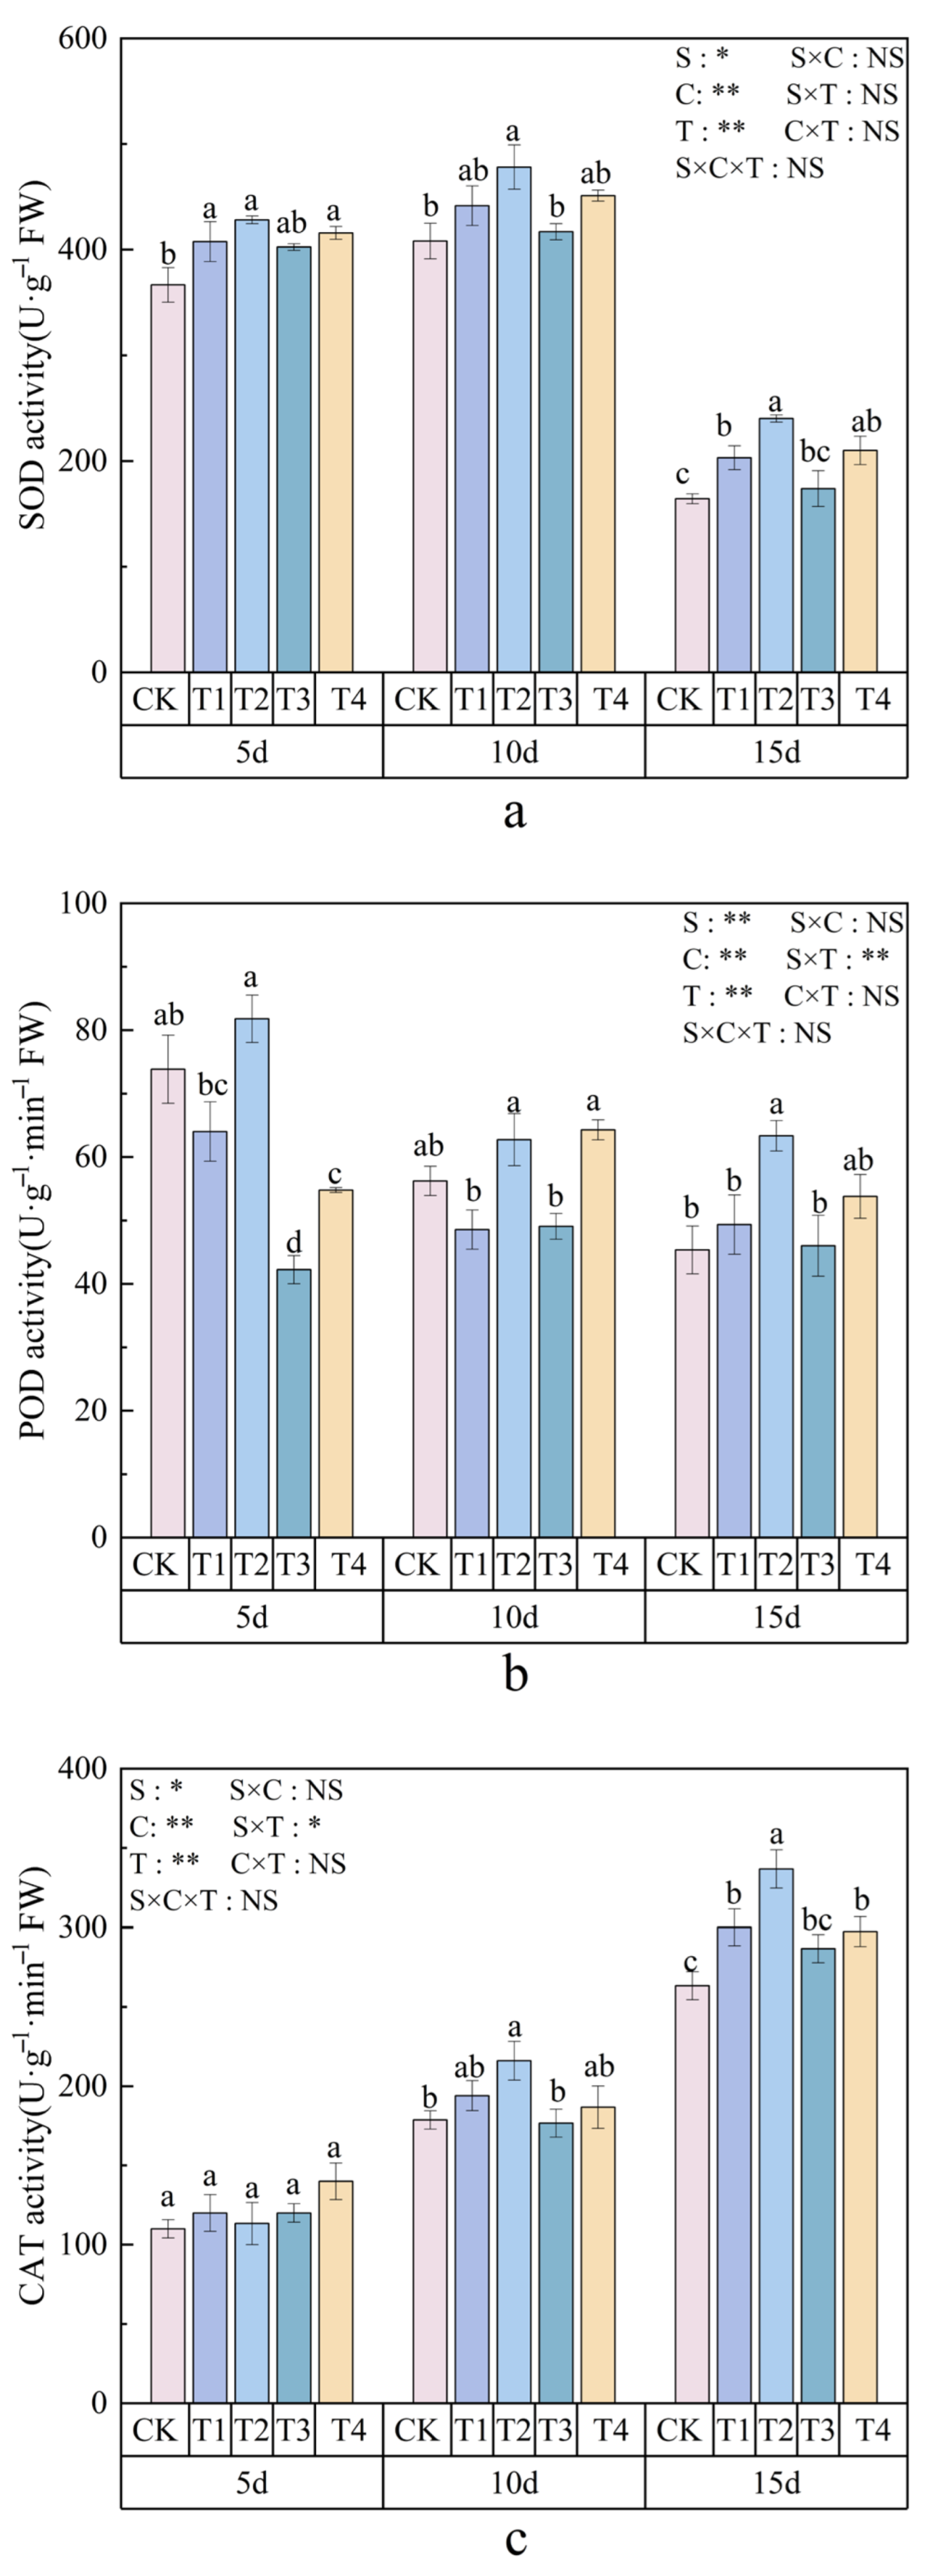
The PS concentration, size, and exposure time had a significant effect on the activities of SOD, POD, and CAT (Figure 6). Compared to the CK, the SOD, POD, and CAT activities under PS-MPs/NPs treatments increased by 23.6%, 8.8%, and 13.9% (10 mg L−1 PS-NPs, 15 d); 46.3%, 39.7%, and 27.9% (100 mg L−1 PS-NPs 15 d); 5.9%, 1.5%, and 8.9% (10 mg L−1 PS-MPs, 15 d); and 27.8%, 18.6%, and 12.9% (100 mg L−1 PS-MPs, 15 d), respectively. The 100 mg·L−1 PS-NPs treatment significantly increased the antioxidant enzyme activities of peanuts. Under the 100 mg·L−1 PS-NPs treatment, SOD, POD, and CAT activities increased by 17.2%, 11.6%, and 20.9% on day 10, respectively, compared to the CK. At the same PS size, the antioxidant enzyme activities of high concentrations (100 mg L−1) of PS-MPs/NPs were higher than those under low concentrations (10 mg L−1). At the same PS concentration, activities under low/high concentrations of PS-MPs were lower than those under the corresponding concentrations of PS-NPs. With an increasing exposure time, SOD and CAT activities in PS treatments were consistently higher than in the CK, while POD activity was higher than the CK only on day 15.

3.6. Effects of Polystyrene Microplastics/Nanoplastics on the Antioxidant Content of Peanut

The PS size, concentration, and exposure time affected the antioxidant content of peanuts (Figure 7). When compared to the CK, the ASA and GSH of PS-MPs/NPs treatments were significantly increased by 13.8% and 12.6% (10 mg L−1 PS-NPs, 15 d), 24.6% and 18.2% (100 mg L−1 PS-NPs, 15 d), 8.1% and 15.2% (10 mg L−1 PS-MPs, 15 d), and 17.1% and 17.1% (100 mg L−1 PS-MPs, 15 d). The 100 mg L−1 PS-NPs treatment significantly increased the antioxidant content of peanuts. When compared to the CK, the ASA and GSH of 100 mg L−1 PS-NPs treatment were significantly increased by 18.2% and 13.0% (5 d), respectively. At the same PS size, the antioxidant contents of high concentrations (100 mg L−1) of PS-MPs/NPs were higher than those under low concentrations (10 mg L−1) of PS-MPs/NPs. Similarly, at the same PS concentration, antioxidant contents under low/high concentrations of PS-MPs treatments were lower than those under the corresponding concentrations of PS-NPs. With an increasing exposure time, antioxidant contents under high concentrations of PS-NPs treatments were consistently higher than the CK.

3.7. Correlation Analysis

Figure 8 presents a Pearson correlation analysis of different variables. The root fresh weight and shoot fresh weight were significantly or extremely significantly positively correlated with the SPAD value and Fv/Fm and significantly negatively correlated with Y(NO), the MDA content, SOD activity, CAT activity, and the ASA content. These results indicate that exposure to high concentrations of PS-MPs/NPs increased the MDA content, antioxidant enzyme activities, and antioxidant content, while decreasing photosynthetic efficiency, ultimately inhibiting peanut growth.

3.8. Visual Observation of Polystyrene Microplastics/Nanoplastics in Peanut Seedings

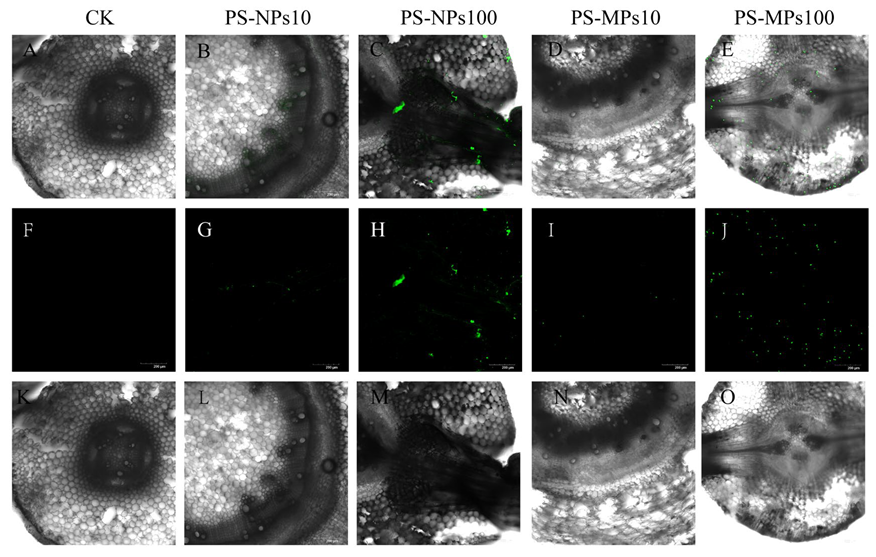
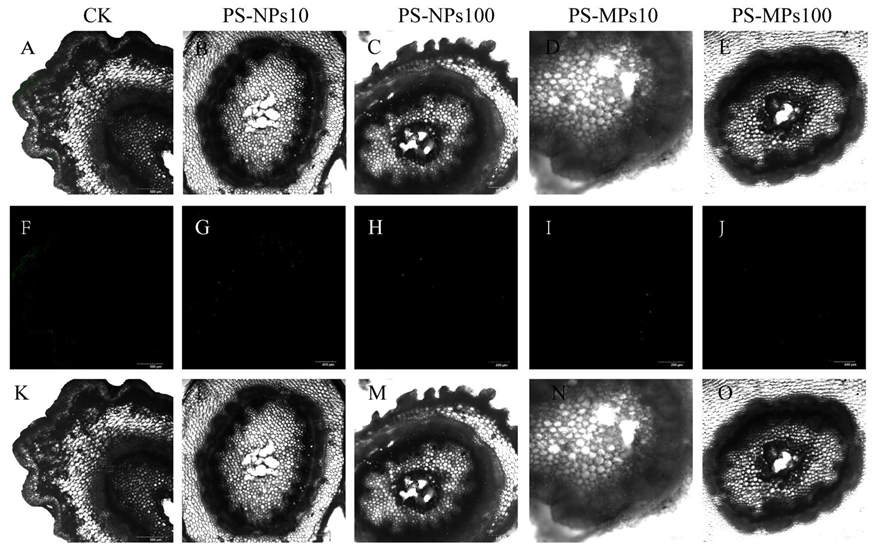
No fluorescence signal was detected in the roots of peanuts from the CK treatment (Figure 9 and Figure 10). Peanut roots cultivated in microplastic/nanoplastic suspensions showed clear, concentration-dependent fluorescence across a range from 10 to 100 mg L−1. In this study, a strong fluorescence signal was obtained in the roots of peanuts in varying concentrations of PS-MPs/NPs suspensions. The roots, stems, and leaves of peanuts grown in polystyrene micro/nanoplastic suspensions exhibited significant fluorescence signals (Figure 10, Figure 11 and Figure 12). Confocal microscopic images of cross-sections in the root tissue clearly showed the presence of PS-NPs, which were agglomerated and formed relatively large clusters in the intercellular spaces (Figure 10), while 5 μm PS particles were observed as distinct fluorescent signals in root cross-sections (Figure 10). The detection of 50 nm PS and 5 μm PS in both the stem and leaf tissues (Figure 11 and Figure 12) confirmed the translocation of PS-MPs/NPs from the root to the shoot in peanut plants.

4. Discussion

4.1. Effects of Polystyrene Microplastics/Nanoplastics on Peanut Growth

Different concentrations and sizes of microplastics caused varying effects on plant growth [30,31]. Zhu et al. [32] used different particle sizes of microplastics as materials and found that microplastics inhibited the growth of rice, with 50 nm microplastics being more toxic than 5 μm microplastics. Consistently, our results showed that high concentrations of PS-NPs significantly inhibited the shoot fresh weight and root fresh weight of peanuts. According to Sun et al. [31] and Yuan et al. [33], the effects of low concentrations of PS (0.1–50 mg L−1) on plant growth are weaker than those of high concentrations (50–1000 mg L−1); additionally, the toxicity of PS-NPs is stronger than that of PS-MPs [16]. In our study, on days 5 and 10, exposure to low concentrations of PS-MPs/NPs inhibited peanut growth, as indicated by the shoot fresh weight and root fresh weight measurements. However, by day 15, the negative effects on shoot fresh weight, root fresh weight, and plant height gradually diminished. This observation aligns with the findings of Liu et al. [34], who found that 10 mg L−1 of polystyrene microplastics significantly inhibited maize shoot biomass on day 5, but the inhibitory effect weakened with time indicating that plants may develop mechanisms to mitigate PS-NPs- and PS-MPs-induced stress [35]. In our study, with an extended exposure time, the inhibitory effects of low-concentration PS on peanut growth gradually weakened and even showed signs of growth stimulation, whereas high-concentration PS treatments consistently suppressed growth, regardless of duration. This phenomenon may result from reversible cellular damage, as peanut plants grow may activate antioxidant regulatory systems to alleviate PS-MPs/NPs toxicity, thereby restoring normal cell function [36]. Our results confirmed that exposure to PS-MPs/NPs increased the MDA content, which in turn induced higher SOD and CAT activities as defense responses [32,37]. Furthermore, the microplastics used in this study were small enough to be absorbed by peanut seedlings, leading to cellular damage and an increased MDA content. In addition, high concentrations of PS-MPs/NPs accumulated on the root surface, obstructing epidermal pores and hindering water and nutrient absorption, ultimately retarding plant growth [18]. These results show that peanuts are more sensitive to PS-MPs/NPs under high-concentration conditions (100 mg L−1), although the degree of sensitivity may vary.

4.2. Effects of Polystyrene Microplastics/Nanoplastics on Photosynthetic Efficiency of Peanut

We observed that microplastics/nanoplastics significantly reduced the SPAD value and chlorophyll fluorescence parameters (e.g., Fv/Fm and Y(II)). The reduced SPAD value suggested that both PS-MPs/NPs may damage chloroplasts, potentially impairing chlorophyll synthesis or accelerating its degradation, thereby negatively affecting the photosynthetic capacity of leaves [13]. Furthermore, the decline in Fv/Fm values confirms damage to the photosystem II (PS II) reaction centers caused by microplastics/nanoplastics, leading to reduced light energy conversion efficiency [38]. These findings are consistent with the results of Zhu et al. [32], who reported that nanoplastics significantly inhibited photosynthesis in rice leaves. In our research, low-concentration PS-NPs had no significant effect on the SPAD value, whereas high-concentration PS-NPs significantly reduced it. Li et al. [35] studied the effects of amino polystyrene microplastics (PS-NH2) on the physiology and gene expression of Navicula sp. and suggested that increasing PS-NH2 concentrations reduce the chlorophyll content. This may be related to the accumulation of NPs in plant tissues and the oxidative stress they induce in plant tissues [7,39,40]. Additionally, the SPAD value under the PS-MPs treatment was generally higher than that under the PS-NPs treatment, indicating that NPs may more easily enter cells and cause more severe toxic effects [32].
In our study, the high-concentration PS-MPs/NPs treatment decreased Y(NPQ) and increased Y(NO) in peanut on days 10 and 15. The decrease in Y(NPQ) indicates that PS-MPs/NPs stress may disrupt the plant’s photoprotective mechanisms, making it more susceptible to light-induced damage. The PS-MPs/NPs treatments may affect photosynthesis-related gene expression, leading to inhibition of photosynthetic electron transport in peanuts [41,42]. Zhang et al. [43] added polystyrene nanoplastics (PS-NPs, 100 nm) to Thompson Seedless (TS, Vitis vinifera L.) in a hydroponic environment and found that Vitvi04g01700 was downregulated. This downregulation could be linked to disruption of the photosynthetic process, as the expression of key photosynthetic genes is crucial for the efficient operation of the photosystem. Furthermore, our results suggest that the high-concentration PS-MPs/NPs treatment induces oxidative stress in peanuts, as evidenced by the increased levels of MDA and O2 after 5 days and 15 days of treatment. This oxidative stress could be a contributing factor to the inhibition of photosynthetic electron transport, resulting in changes in Y(NPQ) and Y(NO). Notably, as the exposure time increased, the inhibitory effects of low-concentration PS-NPs on the SPAD values and chlorophyll fluorescence parameters gradually weakened and even showed a slight promotive effect. This phenomenon may be attributed to the plant’s adaptive response, potentially through the regulation of antioxidant systems or activation of cellular repair mechanisms [36,37]. The upregulation of antioxidant enzymes and antioxidants, such as SOD, CAT, ASA, and GSH, in response to PS-MPs/NPs exposure may indicate an attempt by peanuts to mitigate the oxidative damage caused by these particles [32]. However, high concentrations of PS consistently caused negative effects, suggesting that high-concentration PS-MPs/NPs may lead to irreversible damage in plants.

4.3. Effects of Polystyrene Microplastics/Nanoplastics on Antioxidant System of Peanut

Microplastics/nanoplastics can promote the generation of reactive oxygen species (ROS) (such as O2) through pathways including physical damage or chemical adsorption [44,45]. Chen et al. [46] revealed that NPs can exert cytotoxicity and genotoxicity on crops and induce oxidative damage by increasing MDA and H2O2 levels. In the present study, on day 5, the content of MDA and O2 were significantly (p < 0.05) increased by PS-NPs. The increased level of lipid peroxidation in plant cell membranes and ROS accumulation leads to a higher content of MDA, which may explain this phenomenon [47]. Notably, high concentrations of PS-NPs had a more substantial effect and caused more damage to peanut membrane lipids, consistent with the corresponding reduction in shoot fresh weight. Additionally, the MDA and O2 content under PS-NPs treatments suggested a size- and concentration-dependent oxidative stress response in peanuts exposed to microplastics. To alleviate the negative effects of ROS, plants activate a range of antioxidant enzymes and antioxidants, including SOD, POD, CAT, ASA, and GSH [48,49,50]. Our study has demonstrated that the effects of microplastics on antioxidant enzyme activities and antioxidant contents vary depending on the particle size and concentration. This phenomenon may occur because nanoplastics could be absorbed by plant roots and transported upward along the xylem, leading to an increase in the contents of MDA and O2, elevated SOD and POD activities, and a decrease in the activities of CAT, resulting in significant oxidative stress in plants [43]. According to the current findings, POD activity was initially inhibited but showed increased activity by day 15. It is suggested that SOD, CAT, ASA, and GSH appear to function as the primary defense systems against PS-induced oxidative stress in peanuts. In our results, exposure to PS-MPs/NPs on days 5 and 10 increased MDA and O2 levels, enhanced the activities of SOD and CAT, and elevated the ASA and GSH contents, while decreasing the activities of POD. The stress response included triggered alterations in the expression of membrane-related genes, which in turn activated antioxidant defense mechanisms to help plant cells withstand oxidative damage [43,51].

4.4. Absorb and Transport of Polystyrene Microplastics/Nanoplastics in Peanut Seedings

Plants can absorb and transport PS-MPs/NPs through various pathways, including surface adsorption, stomatal uptake, crack entry, and intercellular transport [9,52,53,54]. MPs with larger sizes, which are unable to penetrate root tissues, may predominantly accumulate on the root surface [54]. We found that under external stimuli, the root apical meristem secreted a substantial amount of adhesive root exudates, capable of adsorbing and aggregating plastic particles around the root tip. In our research, both 50 nm and 5 μm PS were observed in peanut roots, stems, and leaves. Kim et al. [5] also demonstrated that plant roots can absorb microplastics and transport them to multiple internal regions. Notably, 50 nm PS exhibited greater agglomeration and formed relatively larger clusters than 5 μm PS. Li et al. [9] also observed 0.2 μm PS clusters in lettuce root and stem tissue. In our study, confocal images of root and stem cross-sections revealed the translocation pathways of PS-MPs/NPs in peanut plants. Regarding progress on migration, PS particles were clearly observed along the cell walls in root tissues. Liu et al. [55], using a hydroponic experiment, demonstrated that both 80 nm and 1 μm PS particles could be absorbed by rice roots and transported to stems and leaves. They suggested that the symplastic pathway may facilitate the translocation of 80 nm PS microspheres from the root epidermis to the stele. This implies that the PS-MPs/NPs could be absorbed by peanut roots, causing cellular damage, leading to membrane lipid peroxidation and the inhibition of photosynthetic efficiency, thereby indirectly reducing peanut biomass [32,45].

5. Conclusions

Our study showed that peanut plants can absorb and translocate PS microplastics/nanoplastics (PS-NPs/PS-NPs) leading to intensified membrane lipid peroxidation, elevated antioxidant enzyme activities and antioxidant contents, disrupted photosynthetic function, and ultimately inhibited growth. Among the key influencing factors, the PS concentration had a more pronounced effect on peanut toxicity than the PS particle size, especially as the exposure time increased. We found that peanuts showed a size-, concentration-, and time-dependent response to polystyrene plastic exposure: nanoplastics exerted stronger inhibitory effects than PS microplastics, and high concentrations of PS were more toxic than low concentrations. Notably, the toxicity of PS decreased over time, suggesting a potential physiological adaptation or stress mitigation response in peanut seedlings. The findings of this study not only contribute to understanding the accumulation and potential ecotoxicological impacts of PS-MPs/NPs in peanuts but also provide a theoretical basis for agricultural ecological risk assessment.

Author Contributions

Conceptualization, Y.L.; formal analysis, Y.L. and X.H.; investigation, M.Z. and J.L.; methodology, X.H., L.F., and X.Y.; resources, Q.L., Z.M., N.J., J.G., Y.W., and L.L.; software, Y.L.; validation, L.L.; writing—original draft, Y.L.; writing—review and editing, A.Y., M.S., Y.W., and L.L. All authors have read and agreed to the published version of the manuscript.

Funding

This work was supported by the National Natural Science Foundation of China (31700367) and the Scientific and Technological Research Projects in Henan Province (252102320074).

Institutional Review Board Statement

Not applicable.

Data Availability Statement

Data are contained within the article.

Conflicts of Interest

The authors declare no conflicts of interest.

References

  1. Hofmann, T.; Ghoshal, S.; Tufenkji, N.; Adamowski, J.F.; Bayen, S.; Chen, Q.; Demokritou, P.; Flury, M.; Hüffer, T.; Ivleva, N.P.; et al. Plastics Can Be Used More Sustainably in Agriculture. Commun. Earth Environ. 2023, 4, 332. [Google Scholar] [CrossRef]
  2. Van den Berg, P.; Huerta-Lwanga, E.; Corradini, F.; Geissen, V. Sewage Sludge Application as a Vehicle for Microplastics in Eastern Spanish Agricultural Soils. Environ. Pollut. 2020, 261, 114198. [Google Scholar] [CrossRef]
  3. Thompson, R.C.; Moore, C.J.; vom Saal, F.S.; Swan, S.H. Plastics, the Environment and Human Health: Current Consensus and Future Trends. Philos. Trans. R. Soc. Lond. B Biol. Sci. 2009, 364, 2153–2166. [Google Scholar] [CrossRef]
  4. Wagner, S.; Reemtsma, T. Things We Know and Don’t Know about Nanoplastic in the Environment. Nat. Nanotechnol. 2019, 14, 300–301. [Google Scholar] [CrossRef] [PubMed]
  5. Kim, D.; Kim, H.; Lee, J.; Choi, M.-J.; Kweon, H.-S.; An, Y.-J. Evidence of Parental Transfer of Nanoplastics in Pea (Pisum sativum) Plants. J. Hazard. Mater. 2024, 465, 133516. [Google Scholar] [CrossRef] [PubMed]
  6. Teuten, E.L.; Saquing, J.M.; Knappe, D.R.U.; Barlaz, M.A.; Jonsson, S.; Björn, A.; Rowland, S.J.; Thompson, R.C.; Galloway, T.S.; Yamashita, R.; et al. Transport and Release of Chemicals from Plastics to the Environment and to Wildlife. Philos. Trans. R. Soc. Lond. B Biol. Sci. 2009, 364, 2027–2045. [Google Scholar] [CrossRef]
  7. Khalid, N.; Aqeel, M.; Noman, A. Microplastics Could Be a Threat to Plants in Terrestrial Systems Directly or Indirectly. Environ. Pollut. 2020, 267, 115653. [Google Scholar] [CrossRef] [PubMed]
  8. Ingraffia, R.; Amato, G.; Iovino, M.; Rillig, M.C.; Giambalvo, D.; Frenda, A.S. Polyester Microplastic Fibers in Soil Increase Nitrogen Loss via Leaching and Decrease Plant Biomass Production and N Uptake. Environ. Res. Lett. 2022, 17, 054012. [Google Scholar] [CrossRef]
  9. Li, L.; Luo, Y.; Li, R.; Zhou, Q.; Peijnenburg, W.J.G.M.; Yin, N.; Yang, J.; Tu, C.; Zhang, Y. Effective Uptake of Submicrometre Plastics by Crop Plants via a Crack-Entry Mode. Nat. Sustain. 2020, 3, 929–937. [Google Scholar] [CrossRef]
  10. Dong, Y.; Gao, M.; Qiu, W.; Song, Z. Uptake of Microplastics by Carrots in Presence of as (III): Combined Toxic Effects. J. Hazard. Mater. 2021, 411, 125055. [Google Scholar] [CrossRef]
  11. Liu, Y.; Xu, F.; Ding, L.; Zhang, G.; Bai, B.; Han, Y.; Xiao, L.; Song, Y.; Li, Y.; Wan, S.; et al. Microplastics Reduce Nitrogen Uptake in Peanut Plants by Damaging Root Cells and Impairing Soil Nitrogen Cycling. J. Hazard. Mater. 2023, 443, 130384. [Google Scholar] [CrossRef]
  12. Wu, X.; Liu, Y.; Yin, S.; Xiao, K.; Xiong, Q.; Bian, S.; Liang, S.; Hou, H.; Hu, J.; Yang, J. Metabolomics Revealing the Response of Rice (Oryza sativa L.) Exposed to Polystyrene Microplastics. Environ. Pollut. 2020, 266, 115159. [Google Scholar] [CrossRef]
  13. Bosker, T.; Bouwman, L.J.; Brun, N.R.; Behrens, P.; Vijver, M.G. Microplastics Accumulate on Pores in Seed Capsule and Delay Germination and Root Growth of the Terrestrial Vascular Plant Lepidium Sativum. Chemosphere 2019, 226, 774–781. [Google Scholar] [CrossRef]
  14. Wang, C.; Luo, Q.; Zhang, J.; Zhang, X.; Yang, N.; Feng, L. Toxic Effects of Microplastics and Nanoplastics on Plants: A Global Meta-Analysis. Environ. Pollut. 2023, 337, 122593. [Google Scholar] [CrossRef] [PubMed]
  15. Shi, R.; Liu, W.; Lian, Y.; Wang, Q.; Zeb, A.; Tang, J. Phytotoxicity of Polystyrene, Polyethylene and Polypropylene Microplastics on Tomato (Lycopersicon esculentum L.). J. Environ. Manage. 2022, 317, 115441. [Google Scholar] [CrossRef] [PubMed]
  16. Zhang, S.; Gao, W.; Cai, K.; Liu, T.; Wang, X. Effects of Microplastics on Growth and Physiological Characteristics of Tobacco (Nicotiana tabacum L.). Agronomy 2022, 12, 2692. [Google Scholar] [CrossRef]
  17. Taylor, S.E.; Pearce, C.I.; Sanguinet, K.A.; Hu, D.; Chrisler, W.B.; Kim, Y.-M.; Wang, Z.; Flury, M. Polystyrene Nano- and Microplastic Accumulation at Arabidopsis and Wheat Root Cap Cells, but No Evidence for Uptake into Roots. Environ. Sci.-Nano 2020, 7, 1942–1953. [Google Scholar] [CrossRef]
  18. Giambalvo, D.; Amato, G.; Ingraffia, R.; Antonella Lo Porto; Mirabile, G.; Ruisi, P.; Livio Torta; Frenda, A.S. Nitrogen Fertilization and Arbuscular Mycorrhizal Fungi Do Not Mitigate the Adverse Effects of Soil Contamination with Polypropylene Microfibers on Maize Growth. Environ. Pollut. 2023, 334, 122146. [Google Scholar] [CrossRef]
  19. Cao, X.; Wang, C.; Luo, X.; Yue, L.; White, J.C.; Wang, Z.; Xing, B. Nano- and Microplastics Increase the Occurrence of Bacterial Wilt in Tomato (Solanum lycopersicum L.). ACS Nano 2024, 18, 18071–18084. [Google Scholar] [CrossRef]
  20. Lian, J.; Liu, W.; Sun, Y.; Men, S.; Wu, J.; Zeb, A.; Yang, T.; Ma, L.Q.; Zhou, Q. Nanotoxicological Effects and Transcriptome Mechanisms of Wheat (Triticum aestivum L.) under Stress of Polystyrene Nanoplastics. J. Hazard. Mater. 2021, 423, 127241. [Google Scholar] [CrossRef]
  21. Lian, J.; Wu, J.; Xiong, H.; Zeb, A.; Yang, T.; Su, X.; Su, L.; Liu, W. Impact of Polystyrene Nanoplastics (PSNPs) on Seed Germination and Seedling Growth of Wheat (Triticum aestivum L.). J. Hazard. Mater. 2020, 385, 121620. [Google Scholar] [CrossRef]
  22. Halder, U.; Chaithra Radharamanan; Venkatesan, K.; Perumal, S. Inhibition of Peanut (Arachis hypogaea L.) Growth, Development, and Promotion of Root Nodulation Including Plant Nitrogen Uptake Triggered by Polyvinyl Chloride Microplastics. ACS Omega 2025, 10, 18668–18681. [Google Scholar] [CrossRef]
  23. Velikova, V.; Yordanov, I.; Edreva, A. Oxidative Stress and Some Antioxidant Systems in Acid Rain-Treated Bean Plants. Plant Sci. 2000, 151, 59–66. [Google Scholar] [CrossRef]
  24. Abozeid, A.; Ying, Z.; Lin, Y.; Liu, J.; Zhang, Z.; Tang, Z. Ethylene Improves Root System Development under Cadmium Stress by Modulating Superoxide Anion Concentration in Arabidopsis Thaliana. Front. Plant Sci. 2017, 8, 253. [Google Scholar] [CrossRef] [PubMed]
  25. Agarwal, S.; Pandey, V. Antioxidant Enzyme Responses to NaCl Stress in Cassia Angustifolia. Biol. Plant. 2004, 48, 555–560. [Google Scholar] [CrossRef]
  26. Turk, H.; Erdal, S.; Genisel, M.; Atici, O.; Demir, Y.; Yanmis, D. The Regulatory Effect of Melatonin on Physiological, Biochemical and Molecular Parameters in Cold-Stressed Wheat Seedlings. Plant Growth Regul. 2014, 74, 139–152. [Google Scholar] [CrossRef]
  27. Sachadyn-Król, M.; Materska, M.; Chilczuk, B.; Karaś, M.; Jakubczyk, A.; Perucka, I.; Jackowska, I. Ozone-Induced Changes in the Content of Bioactive Compounds and Enzyme Activity during Storage of Pepper Fruits. Food Chem. 2016, 211, 59–67. [Google Scholar] [CrossRef]
  28. Karam, E.A.; Batool Keramat; Sorbo, S.; Maresca, V.; Zahra Asrar; Hossein Mozafari; Basile, A. Interaction of Triacontanol and Arsenic on the Ascorbate-Glutathione Cycle and Their Effects on the Ultrastructure in Coriandrum sativum L. Environ. Exp. Bot. 2017, 141, 161–169. [Google Scholar] [CrossRef]
  29. Hussain, F.; Hadi, F.; Rongliang, Q. Effects of Zinc Oxide Nanoparticles on Antioxidants, Chlorophyll Contents, and Proline in Persicaria hydropiper L. And Its Potential for Pb Phytoremediation. Environ. Sci. Pollut. Res. 2021, 28, 34697–34713. [Google Scholar] [CrossRef]
  30. de Souza Machado, A.A.; Lau, C.W.; Kloas, W.; Bergmann, J.; Bachelier, J.B.; Faltin, E.; Becker, R.; Görlich, A.S.; Rillig, M.C. Microplastics Can Change Soil Properties and Affect Plant Performance. Environ. Sci. Technol. 2019, 53, 6044–6052. [Google Scholar] [CrossRef] [PubMed]
  31. Sun, X.-D.; Yuan, X.-Z.; Jia, Y.; Feng, L.-J.; Zhu, F.-P.; Dong, S.-S.; Liu, J.; Kong, X.; Tian, H.; Duan, J.-L.; et al. Differentially Charged Nanoplastics Demonstrate Distinct Accumulation in Arabidopsis Thaliana. Nat. Nanotechnol. 2020, 15, 755–760. [Google Scholar] [CrossRef]
  32. Zhu, W.; Lu, S.; Jiang, H.; Wang, P.; He, C.; Bian, H.; Wang, J. Interactions between Phenanthrene and Polystyrene Micro/Nano Plastics: Implications for Rice (Oryza sativa L.) Toxicity. Environ. Pollut. 2023, 337, 122360. [Google Scholar] [CrossRef]
  33. Yuan, W.; Zhou, Y.; Liu, X.; Wang, J. A New Perspective on the Nanoplastics Disrupting the Reproduction of an Endangered Fern in Artificial Freshwater. Environ. Sci. Technol. 2019, 53, 12715–12724. [Google Scholar] [CrossRef] [PubMed]
  34. Liu, T. Absorption, Accumulation, and Growth Response of Maize to Polystyrene Plastics Particles; Xi’an University of Architecture and Technology: Xi’an, China, 2023. [Google Scholar] [CrossRef]
  35. Li, X.; Wang, Z.; Chen, Y.; Li, Q. Polystyrene Microplastics Induce Photosynthetic Impairment in Navicula Sp. At Physiological and Transcriptomic Levels. Int. J. Mol. Sci. 2024, 26, 148. [Google Scholar] [CrossRef]
  36. Chen, F.; Tang, S.; Yuan, H.; Ma, Z.; Chen, T.; Yang, T.; Zhang, B. Impacts of Polystyrene Microplastics on Seed Germination and Seedling Growth of Typical Crops. Ecol. Environ. Sci. 2023, 31, 2382–2392. [Google Scholar] [CrossRef]
  37. Pehlivan, N.; Gedik, K. Particle Size-Dependent Biomolecular Footprints of Interactive Microplastics in Maize. Environ. Pollut. 2021, 277, 116772. [Google Scholar] [CrossRef]
  38. Wang, S.; Wang, Y.; Liang, Y.; Cao, W.; Sun, C.; Ju, P.; Zheng, L. The Interactions between Microplastic Polyvinyl Chloride and Marine Diatoms: Physiological, Morphological, and Growth Effects. Ecotoxicol. Environ. Saf. 2020, 203, 111000. [Google Scholar] [CrossRef] [PubMed]
  39. Zhang, S.; Wang, L.; Yao, J.; Wu, N.; Ahmad, B.; van Nocker, S.; Wu, J.; Abudureheman, R.; Li, Z.; Wang, X. Control of Ovule Development in Vitis Vinifera by VvMADS28 and Interacting Genes. Hortic. Res. 2023, 10, uhad070. [Google Scholar] [CrossRef] [PubMed]
  40. Li, G.; Qiu, C.; Zhang, D.; Lv, M.; Liao, X.; Li, Q.; Wang, L. Effects of Polystyrene Nanoplastics (PSNPs) on the Physiology of Allium sativum L.: Photosynthetic Pigments, Antioxidant Enzymes, Phytohormones, and Nutritional Quality. Environ. Exp. Bot. 2024, 259, 105654. [Google Scholar] [CrossRef]
  41. Dong, Y.; Gao, M.; Song, Z.; Qiu, W. Microplastic Particles Increase Arsenic Toxicity to Rice Seedlings. Environ. Pollut. 2020, 259, 113892. [Google Scholar] [CrossRef]
  42. Li, Z.; Li, Q.; Li, R.; Zhou, J.; Wang, G. The Distribution and Impact of Polystyrene Nanoplastics on Cucumber Plants. Environ. Sci. Pollut. Res. 2020, 28, 16042–16053. [Google Scholar] [CrossRef]
  43. Zhang, S.; Zhang, F.; Cai, L.; Xu, N.; Zhang, C.; Yadav, V.; Zhou, X.; Wu, X.; Zhong, H. Visual Observation of Polystyrene Nano-Plastics in Grape Seedlings of Thompson Seedless and Assessing Their Effects via Transcriptomics and Metabolomics. J. Hazard. Mater. 2024, 478, 135550. [Google Scholar] [CrossRef] [PubMed]
  44. Li, X.; Zeng, G.; Du, X.; Zhou, R.; Lian, J.; Liu, J.; Guo, X.; Tang, Z. Effects of Polyethylene and Biodegradable Microplastics on the Physiology and Metabolic Profiles of Dandelion. Environ. Pollut. 2024, 352, 124116. [Google Scholar] [CrossRef]
  45. Zhou, C.-Q.; Lu, C.-H.; Mai, L.; Bao, L.-J.; Liu, L.-Y.; Zeng, E.Y. Response of Rice (Oryza sativa L.) Roots to Nanoplastic Treatment at Seedling Stage. J. Hazard. Mater. 2021, 401, 123412. [Google Scholar] [CrossRef]
  46. Chen, L.; Qiu, T.; Huang, F.; Zeng, Y.; Cui, Y.; Chen, J.; White, J.C.; Fang, L. Micro/Nanoplastics Pollution Poses a Potential Threat to Soil Health. Glob. Change Biol. 2024, 30, e17470. [Google Scholar] [CrossRef]
  47. Farooq, M.A.; Niazi, A.K.; Akhtar, J.; Saifullah; Farooq, M.; Souri, Z.; Karimi, N.; Rengel, Z. Acquiring Control: The Evolution of ROS-Induced Oxidative Stress and Redox Signaling Pathways in Plant Stress Responses. Plant Physiol. Biochem. 2019, 141, 353–369. [Google Scholar] [CrossRef]
  48. Wang, C.; Tian, Y.; Wang, X.; Geng, J.; Jiang, J.; Yu, H.; Wang, C. Lead-Contaminated Soil Induced Oxidative Stress, Defense Response and Its Indicative Biomarkers in Roots of Vicia Faba Seedlings. Ecotoxicology 2010, 19, 1130–1139. [Google Scholar] [CrossRef] [PubMed]
  49. Choudhury, F.K.; Rivero, R.M.; Blumwald, E.; Mittler, R. Reactive Oxygen Species, Abiotic Stress and Stress Combination. Plant J. 2016, 90, 856–867. [Google Scholar] [CrossRef]
  50. Hu, W.; Zhang, J.; Yan, K.; Zhou, Z.; Zhao, W.; Zhang, X.; Pu, Y.; Yu, R. Beneficial Effects of Abscisic Acid and Melatonin in Overcoming Drought Stress in Cotton (Gossypium hirsutum L.). Physiol. Plant. 2021, 173, 2041–2054. [Google Scholar] [CrossRef]
  51. Cao, S.; Xu, Q.; Cao, Y.; Qian, K.; An, K.; Zhu, Y.; Binzeng, H.; Zhao, H.; Kuai, B. Loss-of-Function Mutations in DET2 Gene Lead to an Enhanced Resistance to Oxidative Stress in Arabidopsis. Physiol. Plant. 2005, 123, 57–66. [Google Scholar] [CrossRef]
  52. Gao, S.; Mu, X.; Li, W.; Wen, Y.; Ma, Z.; Liu, K.; Zhang, C. Invisible Threats in Soil: Microplastic Pollution and Its Effects on Soil Health and Plant Growth. Environ. Geochem. Health 2025, 47, 158. [Google Scholar] [CrossRef] [PubMed]
  53. Liu, Z.; Qin, M.; Li, R.; Peijnenburg, W.J.G.M.; Yang, L.; Liu, P.; Shi, Q. Transport Dynamics and Physiological Responses of Polystyrene Nanoplastics in Pakchoi: Implications for Food Safety and Environmental Health. Agric. Food Chem. 2025, 73, 10923–10933. [Google Scholar] [CrossRef]
  54. Jiang, X.; Chen, H.; Liao, Y.; Ye, Z.; Li, M.; Klobučar, G. Ecotoxicity and Genotoxicity of Polystyrene Microplastics on Higher Plant Vicia Faba. Environ. Pollut. 2019, 250, 831–838. [Google Scholar] [CrossRef] [PubMed]
  55. Liu, Y.; Guo, R.; Zhang, S.; Sun, Y.; Wang, F. Uptake and Translocation of Nano/Microplastics by Rice Seedlings: Evidence from a Hydroponic Experiment. J. Hazard. Mater. 2022, 421, 126700. [Google Scholar] [CrossRef] [PubMed]
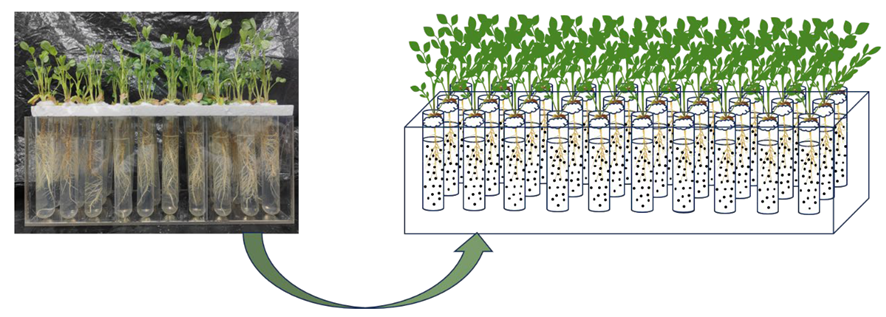
Figure 1. Hydroponic peanut diagram.
Agronomy 15 01895 g001
Figure 2. Effects of polystyrene microplastics/nanoplastics of different concentrations on the shoot fresh weight (a), root fresh weight (b), and root/shoot ratio (c) of peanut. CK, T1, T2, T3, and T4 demonstrate the control, 10 mg·L−1 PS-NPs, 100 mg·L−1 PS-NPs, 10 mg·L−1 PS-MPs, and 100 mg·L−1 PS-MPs, respectively. S, C, and T demonstrate the size, concentration, and exposure time, respectively. “*” denotes significant differences (p < 0.05), “**” denotes highly significant differences (p < 0.01), and “NS” is non-separation. Values are means of replicates ± standard error. The bars with different lowercase letters indicate significant differences among the treatments (p < 0.05).
Agronomy 15 01895 g002
Figure 3. Effects of polystyrene microplastics/nanoplastics of different concentrations on SPAD value. CK, T1, T2, T3, and T4 demonstrate the control, 10 mg·L−1 PS-NPs, 100 mg·L−1 PS-NPs, 10 mg·L−1 PS-MPs, and 100 mg·L−1 PS-MPs, respectively. S, C, and T demonstrate the size, concentration, and exposure time, respectively. “**” denotes highly significant differences (p < 0.01), and “NS” is non-separation. Values are means of replicates ± standard error. The bars with different lowercase letters indicate significant differences among the treatments (p < 0.05).
Agronomy 15 01895 g003
Figure 4. Effects of polystyrene microplastics/nanoplastics of different concentrations on Fv/Fm (a), Y(II) (b), Y(NO) (c), and Y(NPQ) (d). CK, T1, T2, T3, and T4 demonstrate the control, 10 mg·L−1 PS-NPs, 100 mg·L−1 PS-NPs, 10 mg·L−1 PS-MPs, and 100 mg·L−1 PS-MPs, respectively. S, C, and T demonstrate the size, concentration, and exposure time, respectively. “*” denotes significant differences (p < 0.05), “**” denotes highly significant differences (p < 0.01), and “NS” is non-separation. Values are means of replicates ± standard error. The bars with different lowercase letters indicate significant differences among the treatments (p < 0.05). Fv/Fm, maximum photochemical rate; Y(II), actual photochemical quantum efficiency; Y(NO), quantum yield for non-regulating energy dissipation; Y(NPQ), quantum yield for regulating energy dissipation in peanut.
Agronomy 15 01895 g004
Figure 5. Effects of polystyrene microplastics/nanoplastics of different concentrations on MDA (a) and O2 (b) content of peanuts. CK, T1, T2, T3, and T4 demonstrate the control, 10 mg·L−1 PS-NPs, 100 mg·L−1 PS-NPs, 10 mg·L−1 PS-MPs, and 100 mg·L−1 PS-MPs, respectively. S, C, and T demonstrate the size, concentration, and exposure time, respectively. “*” denotes significant differences (p < 0.05), “**” denotes highly significant differences (p < 0.01), and “NS” is non-separation. Values are means of replicates ± standard error. The bars with different lowercase letters indicate significant differences among the treatments (p < 0.05).
Agronomy 15 01895 g005
Figure 6. Effects of polystyrene microplastics/nanoplastics of different concentrations on SOD (a), POD (b), and CAT (c) of peanuts. CK, T1, T2, T3, and T4 demonstrate the control, 10 mg·L−1 PS-NPs, 100 mg·L−1 PS-NPs, 10 mg·L−1 PS-MPs, and 100 mg·L−1 PS-MPs, respectively. S, C, and T demonstrate the size, concentration, and exposure time, respectively. “*” denotes significant differences (p < 0.05), “**” denotes highly significant differences (p < 0.01), and “NS” is non-separation. Values are means of replicates ± standard error. The bars with different lowercase letters indicate significant differences among the treatments (p < 0.05).
Agronomy 15 01895 g006
Figure 7. Effects of polystyrene microplastics/nanoplastics of different concentrations on ASA (a) and GSH (b) of peanuts. CK, T1, T2, T3, and T4 demonstrate the control, 10 mg·L−1 PS-NPs, 100 mg·L−1 PS-NPs, 10 mg·L−1 PS-MPs, and 100 mg·L−1 PS-MPs, respectively. S, C, and T demonstrate the size, concentration, and exposure time, respectively. “*” denotes significant differences (p < 0.05), “**” denotes highly significant differences (p < 0.01), and “NS” is non-separation. Values are means of replicates ± standard error. The bars with different lowercase letters indicate significant differences among the treatments (p < 0.05).
Agronomy 15 01895 g007
Figure 8. Correlation heat map of peanut indicators. “*” denotes significant differences (p < 0.05), and “**” denotes highly significant differences (p < 0.01).
Agronomy 15 01895 g008
Figure 9. Confocal microscopic images of the peanut root surface after 10 days of exposure to different treatments. (AE) are the corresponding merged images of bright-field images and fluorescent images; (FJ) are fluorescent images; and (KO) are bright-field images.
Agronomy 15 01895 g009
Figure 10. Confocal microscopic images of root transverse section of peanut seedlings after 10 days of exposure to different treatments. (AE) are the corresponding merged images of bright-field images and fluorescent images; (FJ) are fluorescent images; and (KO) are bright-field images.
Agronomy 15 01895 g010
Figure 11. Confocal microscopic images of stem transverse section of peanut seedlings after 10 days of exposure to different treatments. (AE) are the corresponding merged images of bright-field images and fluorescent images; (FJ) are fluorescent images; and (KO) are bright-field images.
Agronomy 15 01895 g011
Figure 12. Confocal microscopic images of leaf longitudinal sections of peanut seedlings after 10 days of exposure to different treatments. (AE) are the corresponding merged images of bright-field images and fluorescent images; (FJ) are fluorescent images; and (KO) are bright-field images.
Agronomy 15 01895 g012
Disclaimer/Publisher’s Note: The statements, opinions and data contained in all publications are solely those of the individual author(s) and contributor(s) and not of MDPI and/or the editor(s). MDPI and/or the editor(s) disclaim responsibility for any injury to people or property resulting from any ideas, methods, instructions or products referred to in the content.