Article

A Classification Method for the Severity of Aloe Anthracnose Based on the Improved YOLOv11-seg

1
College of Electronic Engineering (College of Artificial Intelligence), South China Agricultural University, Guangzhou 510642, China
2
College of Plant Protection, South China Agricultural University, Guangzhou 510642, China
*
Author to whom correspondence should be addressed.
Agronomy 2025, 15(8), 1896; https://doi.org/10.3390/agronomy15081896
Submission received: 11 July 2025 / Revised: 29 July 2025 / Accepted: 31 July 2025 / Published: 7 August 2025
(This article belongs to the Special Issue Smart Pest Control for Building Farm Resilience)

Abstract

Anthracnose, a significant disease of aloe with characteristics of contact transmission, poses a considerable threat to the economic viability of aloe cultivation. To address the challenges of accurately detecting and classifying crop diseases in complex environments, this study proposes an enhanced algorithm, YOLOv11-seg-DEDB, based on the improved YOLOv11-seg model. This approach integrates multi-scale feature enhancement and a dynamic attention mechanism, aiming to achieve precise segmentation of aloe anthracnose lesions and effective disease level discrimination in complex scenarios. Specifically, a novel Disease Enhance attention mechanism is introduced, combining spatial attention and max pooling to improve the accuracy of lesion segmentation. Additionally, the DCNv2 is incorporated into the network neck to enhance the model’s ability to extract multi-scale features from targets in challenging environments. Furthermore, the Bidirectional Feature Pyramid Network structure, which includes an additional p2 detection head, replaces the original PANet network. A more lightweight detection head structure is designed, utilizing grouped convolutions and structural simplifications to reduce both the parameter count and computational load, thereby enhancing the model’s inference capability, particularly for small lesions. Experiments were conducted using a self-collected dataset of aloe anthracnose infected leaves. The results demonstrate that, compared to the original model, the improved YOLOv11-seg-DEDB model improves segmentation accuracy and mAP@50 for infected lesions by 5.3% and 3.4%, respectively. Moreover, the model size is reduced from 6.0 MB to 4.6 MB, and the number of parameters is decreased by 27.9%. YOLOv11-seg-DEDB outperforms other mainstream segmentation models, providing a more accurate solution for aloe disease segmentation and grading, thereby offering farmers and professionals more reliable disease detection outcomes.

1. Introduction

Aloe is a widely recognized perennial herbaceous plant, valued for its diverse applications in food, medicine, cosmetics, and health. Historically, aloe has been utilized in traditional medicine for its therapeutic properties, including wound healing, anti-inflammatory effects, immune regulation, and anti-diabetic benefits, making it an effective treatment for various diseases [1,2]. Moreover, aloe has significant uses in animal husbandry. Due to its anti-inflammatory, antioxidant, and antibacterial properties, incorporating aloe into poultry feed has been shown to enhance production performance, improve digestive health, and reduce the incidence of disease [3]. However, aloe cultivation is highly sensitive to environmental factors such as soil composition, temperature, light, and moisture [4]. Inappropriate environmental conditions and the presence of invasive organisms can lead to pest infestations and disease outbreaks, which significantly affect crop yield and result in substantial economic losses. The primary diseases affecting aloe include anthracnose, as well as a smaller number of leaf blight and leaf spot diseases, which cause sunken lesions and necrotic spots on the leaf surface, thereby reducing yield [5].
Traditional methods for diagnosing aloe diseases rely heavily on manual observation and subjective judgment. These methods are time-consuming, labor-intensive, prone to errors, and lack the precision necessary for accurate disease identification [6]. With the advancement of machine learning and deep learning technologies, artificial intelligence (AI) and robotic systems are increasingly being integrated into agricultural automation [7]. The utilization of AI and robotic systems to perform tasks such as field identification, detection, and path planning offers significant advantages over manual operations. These technological solutions not only demonstrate superior efficiency but also contribute to substantial cost reduction while minimizing the likelihood of operational errors. As an advanced image processing and data analysis tool, deep learning can replace human eyes and learn and analyze by collecting visual information. It can not only recognize and calculate targets but also take corresponding preventive measures for special situations, showing great potential in the agricultural sector [8]. By leveraging computer vision, AI-based deep learning systems are capable of automatically identifying crop pests and diseases, which not only enhances detection efficiency and accuracy but also significantly reduces labor costs, contributing to the sustainable development of agriculture [9].
While object detection methods have shown substantial success across various fields, they still face limitations in tasks such as lesion identification and morphological analysis [10]. These tasks require not only precise localization of the target but also an in-depth analysis of the target’s morphological characteristics requirements that traditional object detection techniques struggle to meet [11]. In contrast, semantic segmentation models have pixel-level accuracy and the ability to accurately segment the target boundary. They can accurately segment the shape of the target or calculate the pixel area, which have better effects in medicine [12] and disease degree classification [13], gradually become a research hotspot in recent years. These models are widely applied in image analysis tasks but still face challenges, including high practical complexity and limited fault tolerance. As a result, there is an ongoing need for further refinement to enhance precision and recall rates, reduce false positives and negatives, and achieve a lightweight design. Many existing semantic segmentation models aim to address the challenge of irregular small target segmentation, particularly in plant disease segmentation. For example, Hao Zhou et al. [14] proposed an improved Deeplabv3+ model with a gated pyramid feature fusion structure and a lightweight MobileNetv2 backbone, which improved the model’s mIoU and accuracy while reducing parameters, can efficiently and accurately identify the diseases on oil tea leaves. Wang Jianlong et al. [15] developed an improved RAAWC-UNet network, which incorporated a modulation factor and convolutional block attention module (CBAM) to enhance detection capabilities for small lesions. By replacing the downsampling layer with atrous spatial pyramid pooling (ASPP), the model achieved higher segmentation accuracy in complex environments. While these models improved accuracy, they also increased the number of parameters, highlighting the need for lightweight solutions. Some studies have sought to combine multiple network models to leverage their respective advantages. For example, Esgario et al. [16] integrated UNet and PSPNet models for coffee leaf segmentation, and employed CNN models like ResNet for disease classification, with a practical Android client for users to upload images and obtain disease information. While this system is practical, it still requires an internet connection and has not yet addressed the issue of lightweight local deployment. Mac et al. [17] introduced a greenhouse tomato disease detection system combining Deep Convolutional Generative Adversarial Networks (DCGANs) and ResNet-152 models, which enhanced image data and improved classification and segmentation accuracy, achieving 99.69% accuracy on an augmented dataset. Similarly, Lu Bibo et al. [18] proposed a MixSeg model combining CNN, Transformer, and multi-layer perceptron architectures, which achieved high IoUs for apple scab and grey spot segmentation. However, its segmentation capability for other diseases and crops requires further optimization. In contrast, Polly et al. [19] introduced a multi-stage deep learning system combining YOLOv8, Deeplabv3+, and UNet models. This system accurately localizes diseases in drone images and performs pixel-level semantic segmentation, achieving over 92% accuracy for seven diseases and an IoU exceeding 85%, offering quantitative damage area results.
With the introduction of the YOLOv11 model, its exceptional lightweight features and multifunctional advantages have made it the model of choice for many researchers [20]. Sapkota et al. [21] addressed labor shortages in US plantations by improving the YOLOv11 series segmentation model. Through data augmentation and the CBAM attention mechanism, they enhanced the model’s segmentation accuracy for tree trunks and branches, providing valuable support for orchard robots in pruning and picking operations. Tao Jinxiao et al. [22] proposed the CEFW-YOLO model, which enhanced disease detection by compressing convolutional modules and introducing ECC and FML attention modules. By optimizing the loss function, they improved boundary regression accuracy, increasing mAP@50 and inference speed, and enabling efficient deployment on edge devices. However, unlike segmentation models, object detection solutions are limited in their ability to assess disease severity. The aforementioned research highlights the significant progress made with deep learning technologies in crop disease recognition and segmentation. However, further optimization is required, particularly in improving accuracy, reducing errors, and achieving lightweight deployment.
To address the challenges associated with accurately identifying aloe anthracnose lesions in complex environments and assessing disease severity, this paper proposes a high-performance disease segmentation model, YOLOv11-seg-DEDB, based on an enhanced YOLOv11-seg. This model not only enables precise segmentation of aloe disease lesions but also facilitates disease grading, allowing for effective assessment of disease severity and replacing traditional manual identification methods. The key improvements introduced in this work are as follows: (1) A DE attention mechanism, specifically designed for small lesion segmentation, is embedded at the end of the backbone network and before each detection head module, enhancing the network’s segmentation capability at lesion boundaries; (2) The DCNv2 is incorporated into the network neck to improve feature extraction and fusion in complex environments; (3) The BiFPN structure replaces the original PANet network, reducing redundant calculations. Additionally, a p2 detection head is introduced to further improve the fusion of lesion features and preserve small target details; (4) A lightweight detection head is designed by merging repeated modules across branches and eliminating unnecessary complex functions, resulting in a significant reduction in the model’s parameter count. YOLOv11-seg-DEDB not only runs faster than other mainstream segmentation models, such as UNet and Deeplabv3+, but also has a 5.3% increase in accuracy and a 27.9% reduction in parameter count compared to the original YOLOv11-seg.
These improvements enable the model to more accurately identify lesions and assess disease severity in complex environments, offering an effective technical solution for disease prevention and control. This model provides an efficient, precise approach to safeguarding aloe yields and ensuring the sustainable use of resources.

2. Materials and Methods

2.1. Materials

2.1.1. Data Introduction and Acquisition

The study was conducted at Jianqiao Aloe Co., Ltd., located in Zengcheng District, Guangzhou City, Guangdong Province. Aloe vera was selected as the research subject, planted from March to November in field, with a temperature ranging from 20 to 35 degrees Celsius. Aloe requires abundant sunlight to grow and has extremely strong drought tolerance, being able to adapt to intense sunlight, but it needs the soil to be kept moist. It is necessary to strengthen the management of fertilizer and water in aloe fields. Excessive water accumulation can cause the roots of aloe to rot.
The main diseases of aloe include anthracnose, brown spot disease, and leaf blight, etc. The latter two diseases can cause the leaves to wither. Aloe anthracnose is a special disease with obvious black spots on the surface of the leaves, which effectively distinguishes it from other diseases. As a contact-type infectious disease, aloe anthracnose has a much higher probability of occurrence and a greater degree of damage than other diseases. Aloe anthracnose is widespread and cannot be completely eradicated. Some prevention and control measures can be taken to reduce its occurrence probability. Applying compost or well-rotted organic fertilizer made by enzyme bacteria and avoiding excessive application of nitrogen fertilizer can reduce the infection probability of aloe anthracnose. When aloe anthracnose occurs, the infected leaves or the entire aloe should be removed immediately.
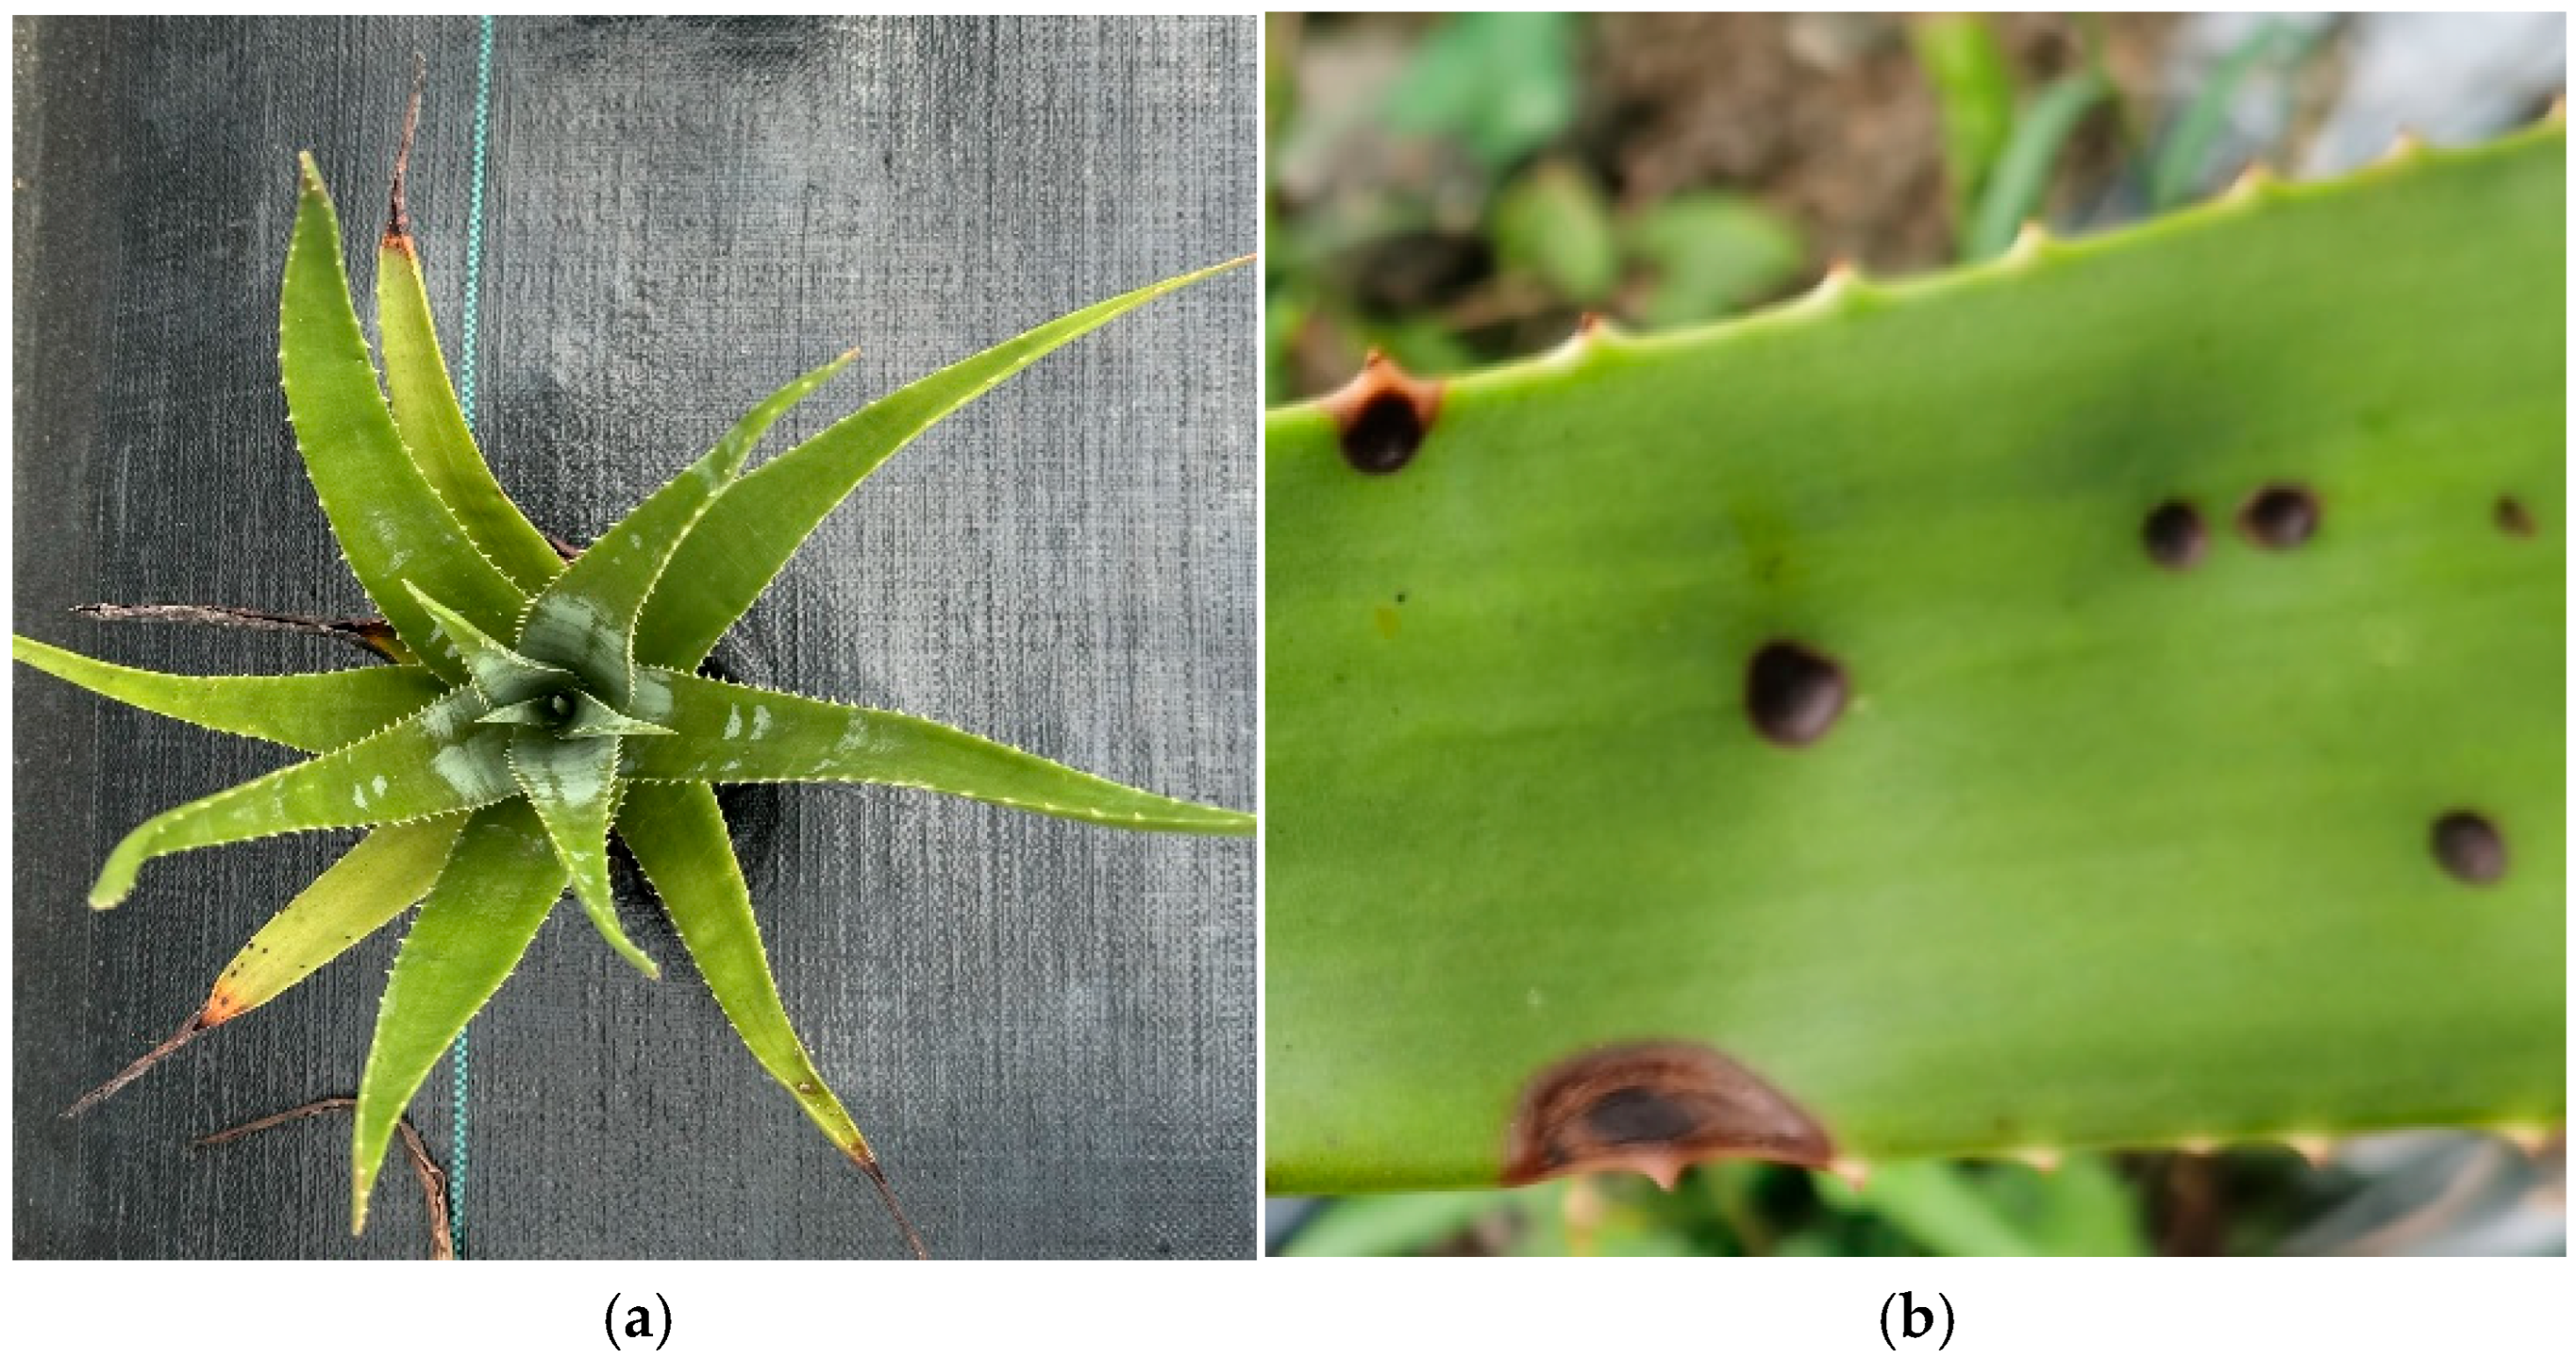
In this study, ten 10 m by 10 m square samples were randomly selected in field for sampling. RGB images of aloe anthracnose were collected to establish a disease dataset. The dataset was collected in November 2024 and comprises a total of 604 images, including 102 images of whole aloe plants and 502 images of aloe leaves. It encompasses various environmental conditions, such as different weather scenarios (sunny, cloudy, rainy), lighting conditions (direct light, backlight), shooting angles (top-down, straight-on, oblique), and shooting distances, ensuring a diverse and complex dataset. The following characteristics define the images in the dataset: (1) all images were captured with a 48-megapixel RGB optical camera with a 1/1.28-inch sensor, each image being square and having a resolution of 4284 × 4284 pixels; (2) the anthracnose symptoms depicted in the images include early-stage yellow spots and late-stage black spots; (3) the raw, unprocessed images exhibit a degree of background complexity, including occlusions by other plant leaves, dead leaves on the ground, and small black targets (Figure 1).

2.1.2. Data Augmentation

The original image dataset features high-resolution images, with each image averaging approximately 5 MB, resulting in a total dataset size exceeding 3 GB. Unprocessed high-resolution images not only prolong training times but may also exacerbate background noise, thereby hindering training performance. To address this, image compression techniques were employed to uniformly reduce the resolution to 640 × 640 pixels, scaling proportionally to maintain the integrity of target features while significantly reducing storage requirements and improving training efficiency [23]. For data annotation, despite the availability of automated tools [24], precision challenges remain, particularly for rare species and medical image segmentation [25]. Therefore, manual annotation of anthracnose lesions was performed using LabelMe 5.5.0, with each lesion labeled individually, resulting in a total of 12,408 annotated lesions. The generated .json files were subsequently converted into YOLO format .txt files for model training.
Aloe anthracnose lesions exhibit significant variation in shape and size. To enhance the robustness and generalization ability of the model, five distinct data augmentation techniques were applied: random brightness adjustment, random contrast adjustment, image flipping (both horizontal and vertical), salt-and-pepper noise, and Gaussian blur. The brightness and contrast adjustments help mitigate deviations in lighting conditions. The flipping improves the model’s ability to recognize targets from various angles. Gaussian blur and salt-and-pepper noise simulate background blur and noise that are commonly encountered in real-world conditions. To increase the randomness of the augmentation, one to five of these transformations were randomly selected for each image, with varying degrees of application. Additionally, beginning with YOLOv4, the YOLO network incorporates a mosaic data augmentation method [26], which randomly crops and stitches together multiple images to form irregular composite images. This technique increases both the quantity and complexity of the dataset, enhancing the model’s feature extraction capabilities. Given that semantic segmentation models require accurate extraction of target shapes, states, and sizes, and to prevent excessive distortion of target boundaries that could compromise semantic structure and contextual information [27], the augmentation process excluded stretching, compression, or other deformation techniques, thereby preserving the original semantic integrity of the targets. As a result of these preprocessing steps, the dataset was expanded to 2416 images, comprising 1812 augmented images and 604 original images (Figure 2).
The augmented dataset contains a total of 2416 images. Respectively, the images were randomly divided into training, validation, and test sets in the ratio of 80%, 16%, and 4%. All images have a resolution of 640 × 640 and are stored in .jpg format. All labels are stored in YOLO format .txt files.

2.2. The Structure of YOLOv11-seg-DEDB

2.2.1. YOLOv11: The Balance Between Parameter Count and Accuracy

The YOLO [28] series of network models represents a class of one-stage object detection algorithms, offering faster processing speeds and fewer parameters in comparison to two-stage network models. With each successive iteration, the YOLO series has progressively enhanced detection accuracy while preserving its lightweight architecture. YOLOv11 [20], which is the most recent version developed by Ultralytics, continues the lightweight network structure established in YOLOv8 [29]. It further optimizes the backbone and neck architecture, introduces novel convolutional mechanisms, and significantly enhances the network’s feature extraction capabilities. These advancements result in improved feature extraction efficiency and detection speeds that far exceed those of previous versions. The YOLOv11 series offers versatile models designed to accommodate a broad range of application scenarios, including classification, detection, segmentation, tracking, and pose estimation tasks. The series provides five model sizes—n, s, m, l, x—each of which scales in parameter count, with larger models generally yielding higher accuracy.
YOLOv11-seg, the segmentation model in the YOLOv11 series, is structured in three primary components: the backbone, the neck, and the head. The backbone is tasked with extracting multi-level features from the input image, spanning from low-level to high-level representations. In YOLOv11-seg, the C3k2 module replaces the C2f module from YOLOv8-seg, and a C2PSA module is added after the SPPF module, further enhancing the model’s focus and feature capture capabilities. These modifications are particularly beneficial for improving the accuracy of small target segmentation. The neck component, employing a Feature Pyramid Network (FPN) [30], bridges the backbone to the remaining network, enabling the collection and fusion of multi-scale features from various image regions. This process enhances the model’s ability to segment targets across different scales. Finally, the head component utilizes detection heads to classify, locate, and delineate the shape of targets within the image, thereby generating the final segmentation results, which include segmented regions, category probabilities, and confidence scores.
For the segmentation task related to aloe anthracnose, precise disease identification and severity grading are critical, requiring the model to exhibit high accuracy. Benefiting from the lightweight and deployable nature of the YOLO series [31], YOLOv11-seg provides an optimal balance between accuracy and real-time performance, making it more efficient than many other segmentation models. Through targeted optimizations, it demonstrates significant improvements in both accuracy and operational efficiency across various fields [32]. Consequently, YOLOv11-seg was selected as the base network model for this study, focusing on its application in disease segmentation tasks.

2.2.2. Disease Enhance Attention: Precisely Focus on Small Target Disease

Aloe anthracnose is characterized by the appearance of small black lesions on the leaf surface [33]. To address the complexities of environmental factors in field conditions and to enhance the model’s performance in feature extraction for aloe anthracnose segmentation, this paper introduces a Disease Enhance (DE) attention mechanism specifically designed for plant lesion segmentation. The DE attention is integrated at the end of the neck network and prior to each detection head in the YOLOv11-seg model. This mechanism combines a dual-path channel attention module with a local contrast spatial attention enhancement module, adopting a lightweight structure to optimize the network’s lesion feature extraction capabilities while minimizing computational costs. The structure of the DE attention is outlined as follows:
The channel attention module utilizes a parallel pooling shared fully connected architecture. By sharing the bottleneck layer, this architecture integrates Global Average Pooling (GAP) and Global Max Pooling (GMP) operations, enabling the model to capture global contextual features and enhance local salient features. Compared to traditional independent connection layers, this shared architecture significantly reduces the number of parameters through shared weight matrices.
The input feature map is: X R B × C × H × W , where the real set R contains feature maps representing the number of channels C , height H , and width W , containing B images. When the feature map passes through the channel attention module, GAP compresses it along the spatial dimension, generating channel statistical features G A P ( X ) R B × C . GMP extracts the maximum response value of each channel G M P ( X ) R B × C . Finally, the outputs of GAP and GMP are dynamically fused through a shared fully connected layer, as shown in the following formula:
W c = σ ( F C s h a r e d ( G A P ( X ) ) + F C s h a r e d ( G M P ( X ) ) )
where σ is the sigmoid activation function, normalizing weights to [0, 1]. F C s h a r e d is the shared fully connected layer, using the He initialization strategy for non-linear mapping of the dual-pooling features, ensuring stable gradient propagation under ReLU activation.
The spatial attention module focuses on the spatial dimensions of the feature map, comprising a local contrast calculation and depthwise convolution. By quantifying local grayscale variations, it enhances the edge features of anthracnose lesions. The contrast map is subsequently processed through a depthwise separable convolution operation, resulting in the output spatial feature map.
When the feature map is input to the spatial attention module, it is converted into a single-channel grayscale image I R B × 1 × H × W , significantly reducing redundant calculations and enhancing edge feature information of anthracnose lesions. Then, a 3 × 3 sliding window is used to calculate local contrast, which can more effectively segment the characteristic yellowish-brown edges of anthracnose lesions and the edge differences from healthy tissue. The formula is as follows:
C ( x , y ) = I ( x , y ) 1 9 i = 1 1 j = 1 1 I ( x + i , y + j )
where I ( x , y ) is the grayscale value of the input feature map at coordinate ( x , y ) .
Depthwise separable convolution is applied with a 7 × 7 convolution kernel to capture wide-field spatial features, followed by a 1 × 1 convolution to fuse channel information and generate spatial weights. The formula is as follows:
W s = σ ( C o n v 1 × 1 ( C o n v 7 × 7 ( C ( x , y ) ) ) ) R B × 1 × H × W
where σ is the sigmoid activation function, normalizing weights to [0, 1]. C o n v 7 × 7 is the depthwise convolution kernel. C o n v 1 × 1 is the pointwise convolution. C ( x , y ) is the local contrast.
Feature fusion uses a broadcasting mechanism to concatenate and multiply the channel weights and spatial weights. The formula is as follows:
Y = X W c W s
where X is the original input feature map. W c is the channel attention weight matrix. W s is the spatial attention weight matrix. denotes element-wise multiplication, achieving synergistic feature enhancement in channel and spatial dimensions, effectively improving segmentation accuracy for small targets like lesions (Figure 3).

2.2.3. Deformable Convolutional Network v2

Aloe anthracnose lesions exhibit characteristics such as irregular shapes, blurred boundaries, and uneven distribution, which pose challenges for segmentation using traditional convolutional methods. To overcome these limitations, this study incorporates the Deformable Convolutional Network v2 (DCNv2) [34] into all convolutional layers of the original model’s neck network, thereby enabling more flexible feature extraction and fusion for lesion segmentation.
A DCN [35] is composed of three main components: the embedding stacking layer, the feature crossing layer, and the combination layer. Initially, the embedding stacking layer preprocesses the raw features by transforming high-dimensional sparse features into low-dimensional, dense real-valued vectors, while simultaneously stacking other continuous features as input to the network. In the feature processing phase, both a parallel cross network and a deep network are employed for feature extraction. The cross network leverages the residual network structure [36], facilitating higher-order feature extraction by cross-fusing outputs from different layers, which effectively mitigates the risk of gradient vanishing. The deep network serves as a conventional feature extraction network. Lastly, the combination layer fuses the output features from both the cross network and the deep network.
DCNv2 is an enhanced version of the DCN, which improves the model’s capability in both modeling and training, thereby strengthening the network’s ability to focus on specific regions of the image. DCNv2 offers two distinct network configurations: stacked and parallel, as illustrated in Figure 4.
DCNv2 employs a new feature: a cross network. It replaces the one-dimensional vector used in the previous version with a two-dimensional matrix, with the formula as follows:
x l + 1 = x 0 ( W l x l + b l ) + x l
where x l , x l + 1 R d represent the outputs of the l -th, ( l + 1 ) -th layers of the cross network. W l , b l R d are the parameters and bias term of the l -th layer. denotes matrix multiplication.
In addition to the feature cross network, DCNv2 also has a deep network operating in parallel, with the formula as follows:
h l + 1 = f ( W l h l + b l )
where h l , h l + 1 R m represent the outputs of the l -th, ( l + 1 ) -th layers of the deep network. W l , b l R m are the parameters and bias term of the l -th layer. f (   ) is an element-wise activation function, defaulting to the ReLU function, though other functions are also applicable.
The combination layer concatenates the outputs of the cross network and the deep network using matrix transformation and outputs the result through an activation function, with the formula as follows:
p = σ ( [ x L 1 T , h L 2 T ] W l o g i t s )
where x L 1 T R d , h L 1 T R m are the outputs of the cross network and the deep network. W l o g i t s R d + m is the transformation matrix. σ is the sigmoid activation function.
The loss function used by the DCNv2 network is as follows:
l o s s = 1 N i = 1 N y i log p i + ( 1 y i ) log ( 1 p i ) + λ l W l 2 2
The loss function incorporates a regularization term, where p i is the predicted probability, y i is the ground truth label, N is the number of input feature maps, and λ is the L 2 regularization parameter.
Currently, four versions of DCNs have been proposed. In comparison to the later versions [37,38], DCNv2 exhibits superior capabilities in modeling geometric deformations and fusing multi-scale features. Additionally, it demonstrates enhanced adaptability to object deformation, occlusion, and changes in pose. These attributes make DCNv2 particularly well-suited for tasks involving small object detection and dense scenes. Given its outstanding performance, DCNv2 was ultimately selected as the core component for enhancing the convolutional layers in the head network of the YOLOv11-seg model.

2.2.4. Bidirectional Feature Pyramid Network with p2 Detection Head

The neck network of the YOLOv11-seg model employs the PANet [39] structure. This structure builds upon FPN [30] by introducing both top-down and bottom-up bidirectional feature fusion paths, significantly shortening the distance for shallow features to propagate to deeper layers. However, the traditional feature propagation method only fuses multi-scale feature information through simple weighted summation. As the number of layers for vertical feature transmission increases, original feature information may be lost. To address this, this paper proposes replacing the original neck network structure with a weighted Bidirectional Feature Pyramid Network (BiFPN) [40], thereby reducing the loss of feature information for small targets like anthracnose lesions.
Traditional feature fusion networks typically perform a simple cross-scale weighted summation of features from different levels, without effectively distinguishing the contribution of each layer’s features. In contrast, BiFPN preserves the bidirectional feature fusion paths of PANet, while optimizing the fusion strategy to facilitate efficient interaction between high-resolution shallow features and deep semantic features across multiple levels. Moreover, BiFPN simplifies the architecture by removing the topmost and bottommost nodes in the top-down path. These nodes, having fewer input edges, contribute minimally to the final fusion result. Eliminating these redundant nodes not only reduces computational complexity but also enhances network efficiency. Additionally, while PANet introduces a lateral feature transmission mechanism that fuses features with those from previous paths during propagation, BiFPN further enhances this by incorporating direct connections between the original input and output nodes at the same level, bypassing intermediate layers. This mechanism helps to prevent the loss of original feature information, better preserving fine-grained details, without introducing significant computational overhead.
The YOLOv11-seg model strikes a balance between accuracy and computational efficiency. Its neck network performs feature fusion through the p3, p4, and p5 layers, outputting fusion results from these three layers. This lightweight design fully leverages multi-scale feature information. Given that, in the anthracnose lesion segmentation task, deep-level small target features contribute more significantly to segmentation accuracy than shallow high-resolution features, this paper introduces the BiFPN structure into the neck network of YOLOv11-seg and incorporates a p2 detection head. This modification outputs additional small target features, further improving the model’s precision in segmenting aloe anthracnose lesions (Figure 5).
After introducing the p2 detection head, the model outputs fused features through four detection heads, enabling more comprehensive retention of the original feature information of anthracnose lesions, thereby significantly improving the segmentation accuracy of tiny targets [41]. Although the output from four detection heads increases computational load to some extent, the structural simplification achieved by BiFPN through pruning redundant nodes and optimizing connection methods keeps the computational increment within an acceptable range.

2.2.5. Lightweight Segment Head: Fewer Parameters, Higher Efficiency

The introduction of the p2 detection head increased the model’s parameter count compared to the original three-head design. To address this, the detection head of the YOLOv11-seg model was optimized and a lighter variant was designed.
The original YOLOv11-seg detection head employs a dual-path decoupled design. After feature fusion, the neck network outputs a feature map F R H × W × 256 . This feature map is processed by two modules: cv2 and cv3. The cv2 module predicts bounding box coordinates through two 3 × 3 convolutional layers for channel adjustment, followed by a 1 × 1 convolutional layer to map bounding box predictions. The cv3 module follows a similar structure but outputs channels equal to the number of classes to represent per-class prediction probabilities.
To mitigate the computational overhead from the added detection head, the original design was optimized. Considering that each branch requires two 3 × 3 convolutional layers, these layers were repositioned earlier in the pipeline and Partial Convolution (PConv) was introduced in parallel, significantly reducing parameters. Furthermore, the head structure was simplified by removing non-essential end-to-end training mechanisms and multi-level cascading designs, effectively minimizing computational redundancy while maintaining a balance between accuracy and efficiency (Figure 6).

2.2.6. YOLOv11-seg-DEDB Model

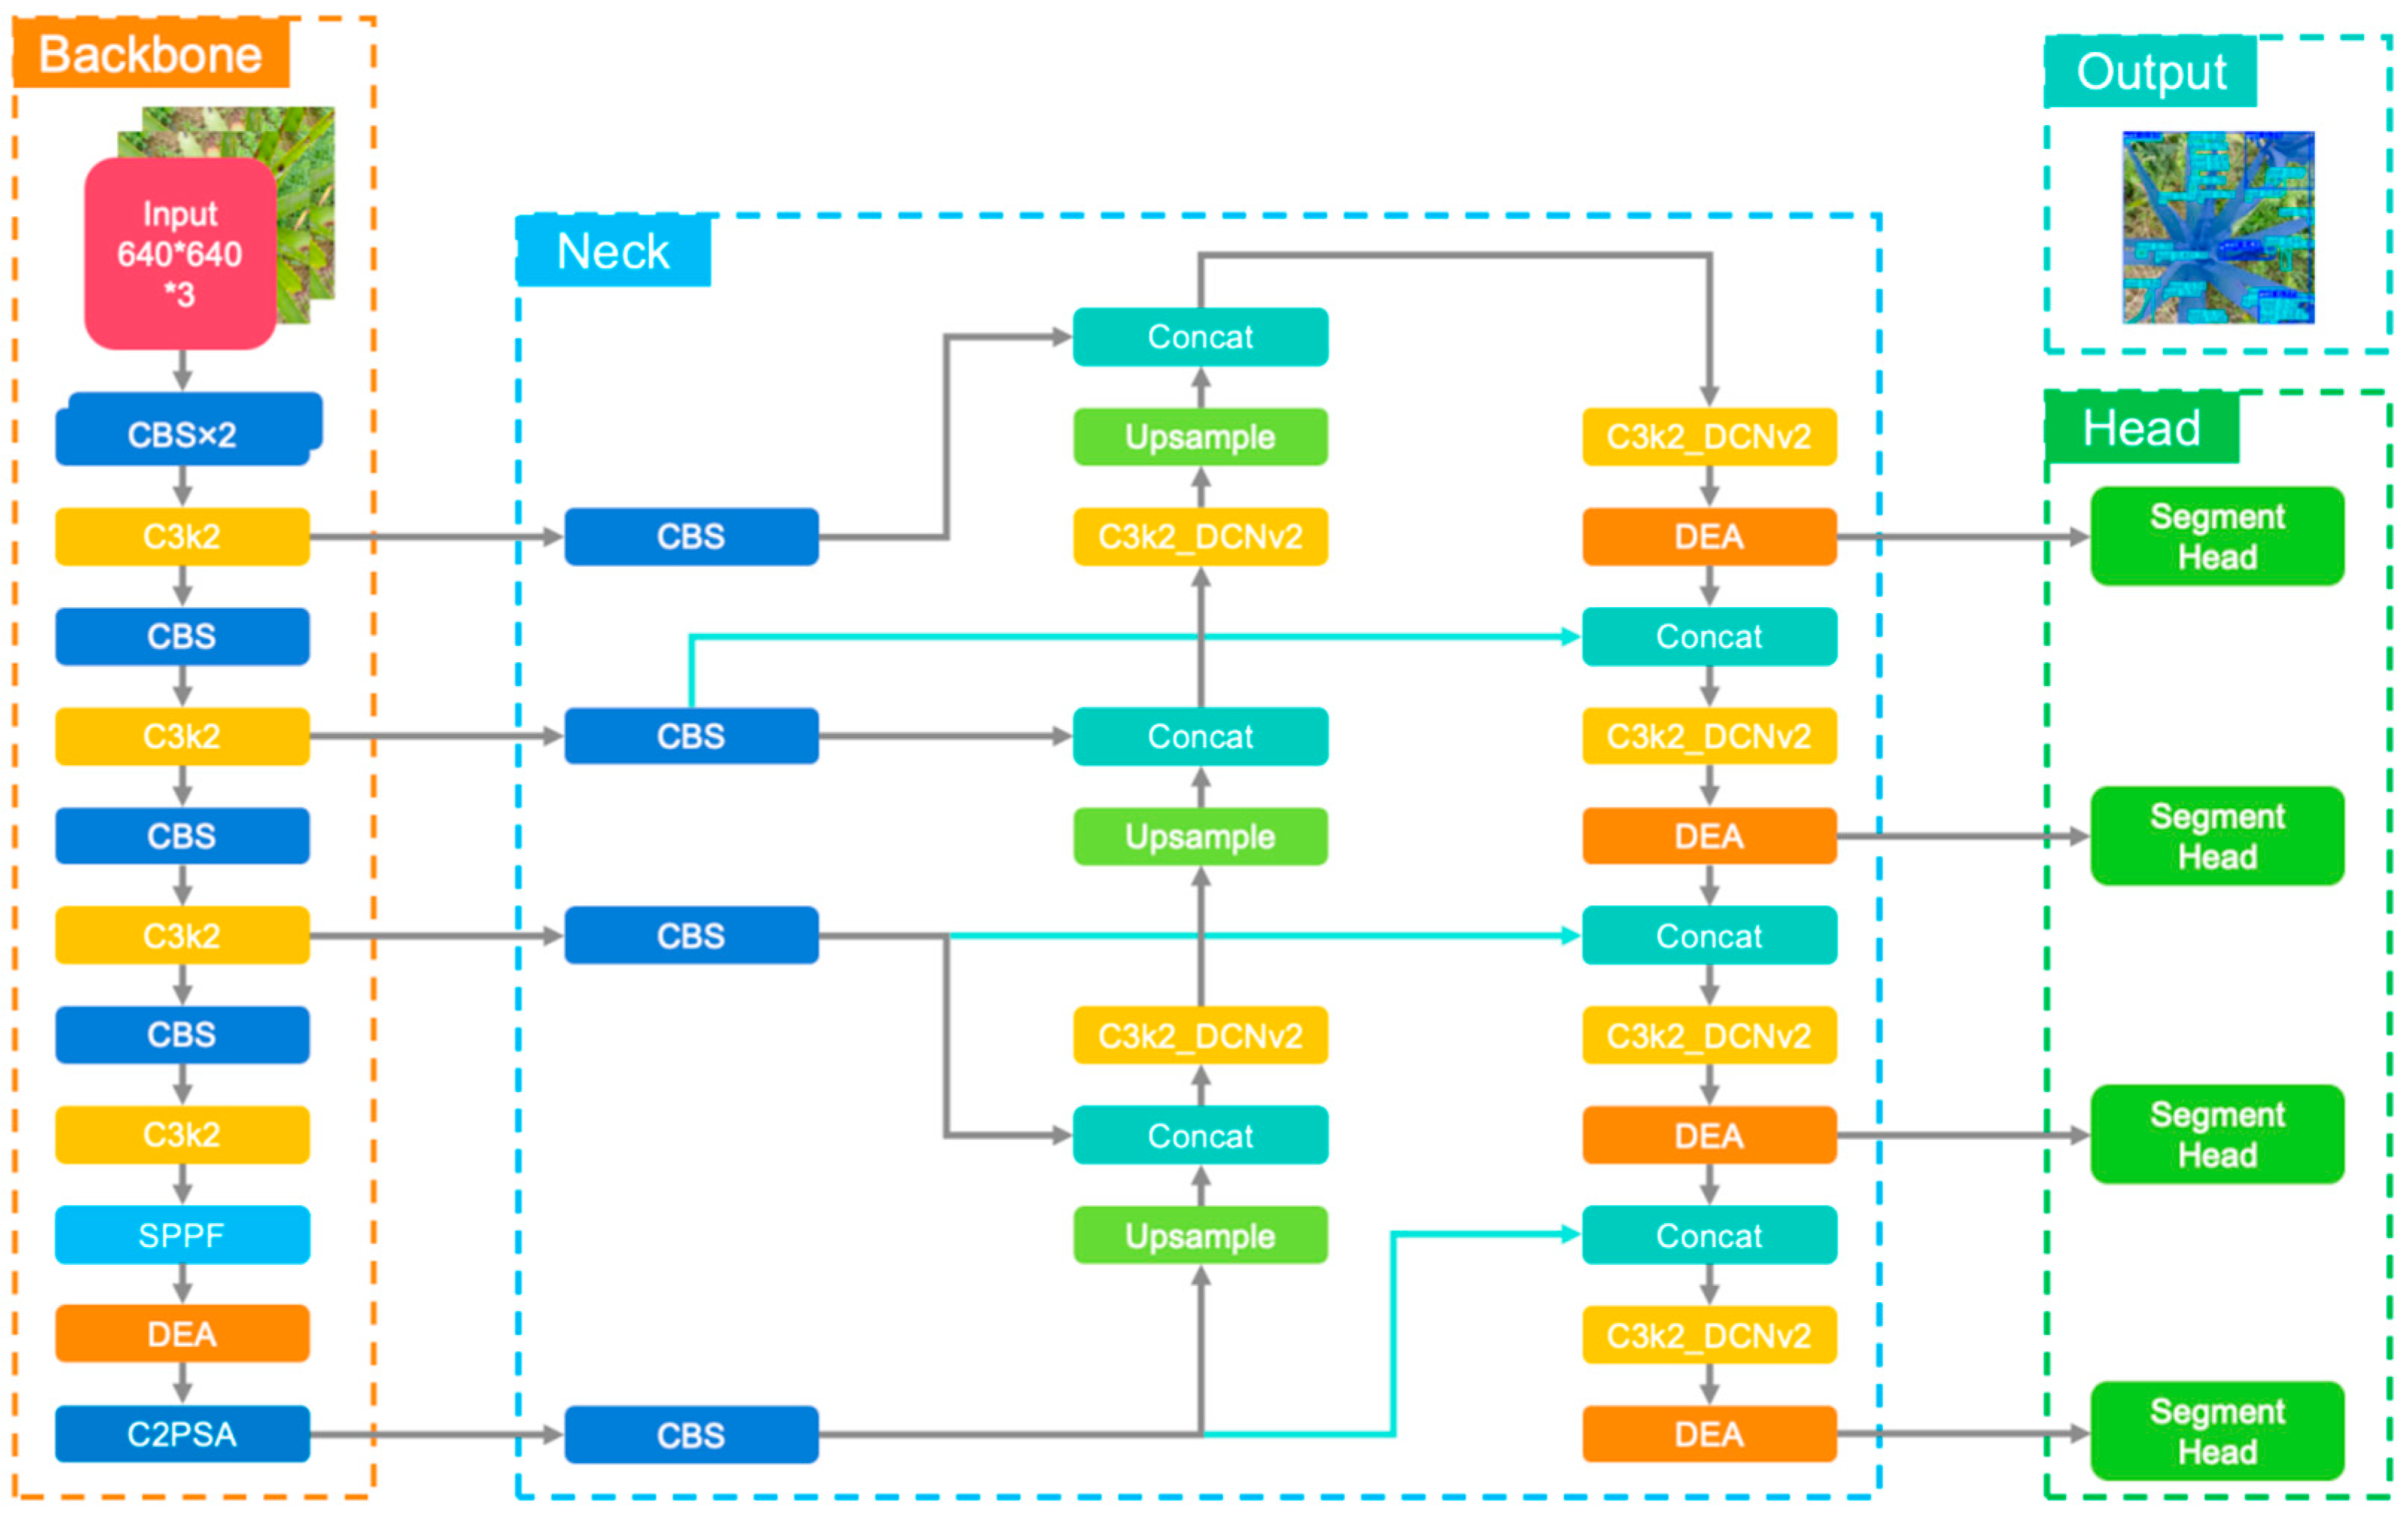
This study proposes a YOLOv11-seg-DEDB model for aloe anthracnose lesion segmentation and disease severity grading. Building upon the YOLOv11-seg model, the proposed model incorporates the DE attention mechanism, specifically designed for lesion segmentation, into both the backbone network and preceding each detection head output. Additionally, the neck network is enhanced by replacing standard convolutions with DCNv2 modules and substituting the original PANet with a BiFPN structure. Furthermore, a p2 detection head is introduced and a more efficient detection head is designed for output. The YOLOv11-seg-DEDB model architecture comprises four main components: the input layer, backbone, neck, and head.
The input layer is responsible for performing image scaling and data augmentation, subsequently feeding the processed feature maps into the backbone network. The YOLOv11 series models do not impose strict constraints on input image dimensions. To balance training efficiency and model accuracy, a square input size of 640 × 640 pixels is commonly recommended. For non-square images, the input layer automatically resizes the image proportionally, ensuring that the longer side reaches 640 pixels while padding the shorter side with black to maintain a 640 × 640 square format. Following this, a built-in data augmentation scheme is applied, which involves random image stitching and noise processing, thus enhancing the diversity and quality of the input images. This preprocessing step ultimately improves the effectiveness of subsequent feature extraction.
The primary task of the backbone network is feature extraction from the input image. It consists of CBS modules, C3k2 modules, SPPF modules, and C2PSA modules. The front part of the backbone network features five CBS modules alternately connected with four C3k2 modules to extract multi-scale feature information. The latter part includes one SPPF module and one C2PSA module for more effective integration and processing of the extracted features. To further enhance feature extraction capability, the YOLOv11-seg-DEDB model incorporates the DE attention mechanism module between the SPPF and C2PSA modules, specifically designed for small targets like lesions. The DE attention module combines channel attention and spatial attention with local contrast enhancement, aiming to better segment the characteristic yellowish-brown edges of aloe anthracnose lesions, thereby improving the feature extraction capability of the backbone network.
The neck network is responsible for enhancing the extracted features and transmitting them to the head network for final output. The YOLOv11-seg-DEDB model implements three key improvements to the original neck network. Firstly, the PANet structure is replaced with a BiFPN network. This modification allows for more effective retention of original feature map information while pruning ineffective edge nodes, thereby reducing computational load. Secondly, four C3k2 modules within the neck network are enhanced by integrating DCNv2 networks, improving the network’s modeling and focusing capabilities on the image. Finally, a p2 detection head is introduced, significantly enhancing the model’s ability to output features for segmenting small targets like aloe anthracnose lesions.
The head network analyzes the feature information and outputs the segmentation mask, class, and confidence score, ultimately presenting the information to the user via visualized results. The introduction of the p2 detection head in the neck network increases the number of outputs from three to four, consequently increasing computational load. The YOLOv11-seg-DEDB model addresses this by refining the detection head into a more lightweight design. By incorporating PConv and removing redundant modules, the structure of the detection head is simplified, computational redundancy is reduced, and a balance between model lightweighting and high accuracy is maintained.
In conclusion, the improved YOLOv11-seg-DEDB model demonstrates superior performance in segmenting aloe anthracnose lesions. It is highly effective in both lesion segmentation and disease severity grading tasks, showcasing its potential for practical applications in image segmentation and analysis (Figure 7).

2.3. Severity Grading of Anthrancnose

Aloe anthracnose [33] is a fungal disease primarily caused by Colletotrichum gloeosporioides, predominantly affecting the leaves of aloe plants and rarely spreading to the stems. Upon infection, lesions on the aloe leaves typically manifest with yellowish edges, dark brown centers, and an approximately elliptical shape. Initial lesions, which are only a few millimeters in size, rapidly expand to form large, sunken black spots, often accompanied by the emergence of additional small black spots surrounding them. If left untreated, the disease can progress, leading to the decay of the entire aloe plant. Aloe anthracnose induces leaf shrinkage and depression, thereby directly impacting aloe yield. If detection and control measures are not implemented promptly, large-scale infections may occur, resulting in significant economic losses.
Preventive measures for aloe anthracnose primarily include improving fertilizer and water management, avoiding continuous cultivation in high-risk areas frequently affected by the disease, and applying organic fertilizers to enhance soil conditions. Once an aloe plant is infected, the affected parts must be excised, and in severe cases, the entire plant may need to be discarded. In light of this, the YOLOv11-seg-DEDB model proposed in this study offers a method for segmenting aloe anthracnose lesions. In conjunction with the FAO grading standards [42], the infection severity of aloe anthracnose is assessed by calculating the proportion of the lesion area relative to the total leaf area. The process is as follows: An image to be evaluated for disease severity is input into the trained model for detection. The model effectively segments both the aloe anthracnose lesions and healthy leaf areas. To improve segmentation accuracy, binarization processing is applied to enhance image contrast. The model then generates visualized segmentation results, with distinct categories labeled in different colors: the lesion area is labeled as “bad” and the healthy leaf area as “well”. The area corresponding to each label is computed by counting the number of pixels. The proportion of lesion area is then calculated by the ratio of lesion pixels to the total leaf pixels, providing a quantitative measure of infection severity. It is important to note that, as a semantic segmentation model cannot assign two labels to the same pixel, the total leaf area is determined by summing the lesion area and the healthy leaf area. The formula for calculating the area proportion is as follows:
P = A d A l = ( x , y ) R b p ( x , y ) ( x , y ) R l p ( x , y ) = ( x , y ) R b p ( x , y ) ( x , y ) R b p ( x , y ) + ( x , y ) R w p ( x , y )
where P is the percentage of aloe anthracnose disease severity. A d , A l represent the lesion area and aloe leaf area. p ( x , y ) is the pixel at coordinate ( x , y ) . R b , R w , R l represent the lesion region, healthy leaf region, and entire leaf region.
Relying solely on the percentage value makes it difficult to accurately express the disease severity. This study quantifies the aloe disease severity using relevant standards [11,19]. The grading scheme is as follows:
Table 1 is the percentage calculation of disease severity based on pixel-level segmentation, which may involve some segmentation error, a tolerance margin is set for judging healthy aloe. The specific grading criteria are as follows: When P < 0.1 % , aloe is judged as healthy. When 0.1 % P < 1 % , aloe is mildly infected; although it does not affect yield, vigilance is required. When 1 % P < 5 % , aloe is moderately infected, and lesions should be promptly excised to prevent spread. When 5 % P < 15 % , aloe is severely infected; if timely prevention and control measures are not taken, yield will be significantly affected. When P 15 % , aloe is completely necrotic and must be removed immediately. Through this grading scheme combined with the model segmentation results, the stage of aloe anthracnose can be clearly determined. The corresponding prevention and control measures can be taken accordingly, thereby effectively safeguarding aloe yield and reducing economic losses.

2.4. Processing Environment and Evaluation Indicators

The hardware platform used in this study was a server suitable for deep learning, configured as follows: Processor model Intel(R) Core(TM) i9-10920X CPU@3.50 GHz, RAM 64 GB DDR4, graphics card model NVIDIA GeForce RTX 3090. The server operating system was Windows 10. The software development environment was Visual Studio Code 1.96.1. The Compute Unified Device Architecture (CUDA) version was 12.3. the deep learning framework was PyTorch 2.0.0. The development compiler was Python 3.9.0.
The training parameters for the YOLOv11-seg-DEDB model proposed in this study were configured through train_seg.py. Specific parameters were as follows: The model used the pre-trained weights YOLOv11n-seg, the training epochs were set to 300, the batch size was 32 images, the number of worker threads was 8. The improvement plan does not involve the modification of hyper-parameters; all parameters remain unchanged from original settings. In this study, the learning rate was 0.01, the optimization function used Stochastic Gradient Descent (SGD), the momentum for SGD was 0.937, and the weight decay for the optimizer was set to 0.0005. The model outputted relevant parameter information for the current training after each epoch and generated the final model parameters and weight files upon training completion (after 300 epochs).
To clearly demonstrate the experimental results, this study employed multiple metrics to evaluate the performance of the YOLOv11-seg series models, including Precision, Recall, F1-score, segmentation mean Average Precision (mAP@50), and model parameter count (Params). Definitions of any evaluation metrics are as follows:
P r e c i s i o n = T P T P + F P   × 100 %
R e c a l l = T P T P + F N × 100 %
where TP (True Positive) represents pixels correctly segmented as lesions, FP (False Positive) represents pixels incorrectly segmented as lesions, FN (False Negative) represents pixels that should have been segmented as lesions but were missed. Precision is defined as the proportion of pixels correctly segmented as aloe anthracnose lesions among all pixels segmented as lesions. Recall is defined as the proportion of pixels correctly segmented as aloe anthracnose lesions among the pixels that actually belong to aloe anthracnose lesions in the original image.
F 1 = 2 × P r e c i s i o n × R e c a l l P r e c i s i o n + R e c a l l
m A P m a s k @ 50 = 0 N 0 1 P ( R ) d R N × 100 %
To comprehensively evaluate the performance of the segmentation model, two additional metrics were introduced: F1-score and segmentation mean Average Precision (mAP@50). F1-score combines Precision and Recall, aiming to balance the relationship between the two; mAP@50 measures the segmentation accuracy across different categories to reflect the model’s performance in each class.

3. Results

3.1. Training Results of YOLOv11-seg-DEDB

The YOLOv11n-seg model served as the pre-trained model for this study. Optimal performance was achieved after 300 training epochs. To evaluate the proposed enhancements, ablation studies were conducted, comparing the modified model against the baseline and other semantic segmentation models. The training outcomes for the YOLOv11-seg-DEDB model are presented in Figure 8.
Figure 8a illustrates the precision, recall, and mAP@50 curves for the YOLOv11-seg-DEDB model, evaluated on both the training and validation sets for aloe anthracnose. The results indicate that the precision, recall, and mAP@50 metrics stabilized after approximately 240 epochs. Figure 8b presents the Precision–Recall (PR) curve for the YOLOv11-seg-DEDB model. The model demonstrates excellent performance in segmenting aloe leaves and achieving high precision in segmenting anthracnose lesions. However, a slight decline in precision was observed as recall increased, which is a common challenge faced by segmentation models in detecting small targets.
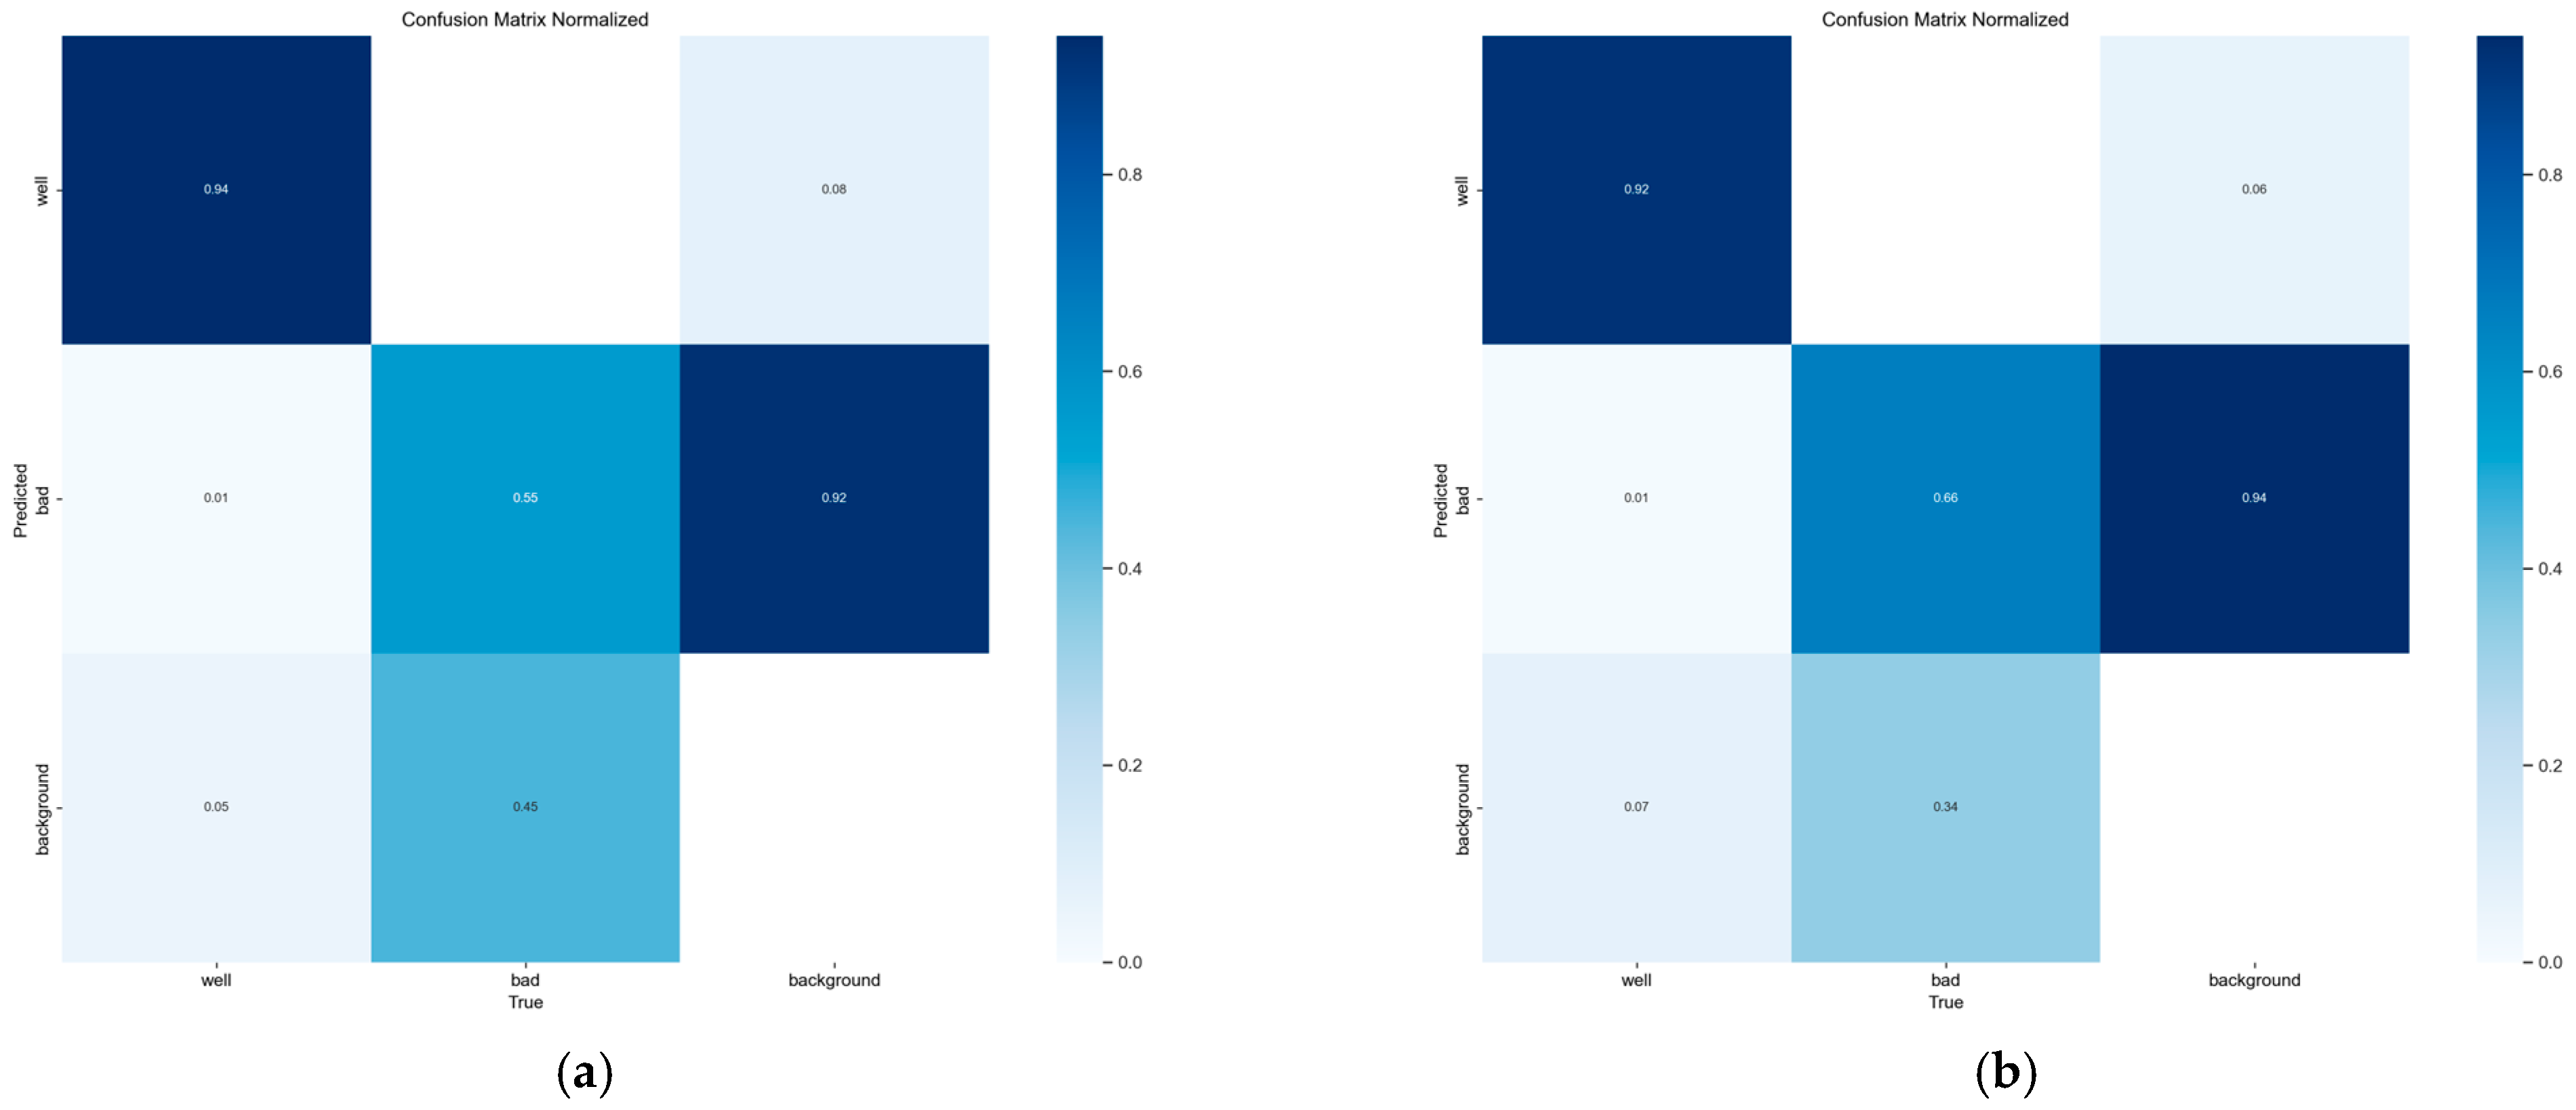
Figure 9 displays the confusion matrices comparing the original YOLOv11-seg model with the enhanced YOLOv11-seg-DEDB model for segmenting aloe leaves and anthracnose lesions. Given that the primary focus of this study was to improve the segmentation of small and challenging lesion targets, the proposed modifications inevitably impacted the segmentation capability for healthy leaves. The confusion matrix results indicate that the enhanced YOLOv11-seg-DEDB model significantly improved segmentation precision for anthracnose lesions while maintaining high overall precision and effectively reducing the false negative rate. Although some false positive occurrences remained, experimental data and visual segmentation results suggest that these were mostly confined to a few pixels at the lesion boundaries, exerting minimal impact on the disease area calculation.
When segmenting individual aloe leaves, both models successfully identified lesions and leaf tissue. However, the original YOLOv11-seg model exhibited inferior performance at lesion boundaries, often misclassifying them as non-leaf or non-lesion regions, leading to incomplete segmentation (highlighted by red boxes in Figure 10b,e). In contrast, the enhanced YOLOv11-seg-DEDB model effectively mitigated this issue, providing more accurate segmentation of the boundary between healthy leaf tissue and lesions. For whole-plant aloe detection, which involves multiple targets and complex backgrounds, both models exhibited some degree of missed detection. Moreover, the original YOLOv11-seg model showed reduced precision in segmenting healthy leaves (Figure 10h,k), with red and orange boxes indicating incomplete leaf segmentation and missed lesions, respectively. Conversely, the YOLOv11-seg-DEDB model demonstrated superior performance in segmenting lesions near the plant center and provided more precise boundary delineation. Additionally, the DEDB model consistently exhibited higher confidence levels in lesion segmentation compared to the original model.
It is worth noting that the models used in these experiments were the ”n” variants, representing the smallest parameter size within the YOLOv11-seg series. With sufficient computational resources, larger models (e.g., ”x”) could further enhance segmentation precision and recall. In summary, the YOLOv11-seg-DEDB model demonstrates improved precision in segmenting aloe anthracnose lesions and superior performance in delineating the boundaries between healthy leaf tissue and lesions.

3.2. Ablation Study

This study introduces four key enhancements to the YOLOv11n-seg model. Since the modification to the detection head primarily impacts feature output, this ablation study focuses on evaluating the remaining three core improvements. As presented in Table 2, each experimental group utilized a unique combination of these modules, which were compared against the baseline YOLOv11n-seg model. A total of nine experimental groups were established. All experiments employed the same aloe anthracnose lesion dataset, with consistent training epochs and hyper-parameter settings across all groups. Model performance was assessed using several metrics, including lesion segmentation precision (p (bad)), overall segmentation precision (p (all)), F1-score (F1 (all)), mean Average Precision for segmentation (mAP@50 (all)), number of parameters (Params), and model size.
Table 2 shows the comparison of different indicators of the model under different module combinations. Firstly, integrating either the DE attention mechanism or the DCNv2 into the YOLOv11n-seg model yielded improvements in segmentation precision. However, compared to the baseline model, the introduction of the DE attention mechanism alone resulted in a slight decrease in the F1-score. This is attributed to the mechanism potentially increasing the model’s aggressiveness in lesion segmentation, thereby elevating the false positive rate. Consequently, combining the DE attention mechanism with the DCNv2 effectively mitigated this risk by enhancing the model’s focus on genuine lesion features. Furthermore, adopting the BiFPN structure significantly reduced both model size and parameter count by 15% and 19.8%, respectively. The introduction of the p2 detection head markedly improved the model’s capability to segment small lesion targets, although it slightly diminished the overall segmentation precision (p (all)) for all targets by 0.3%, primarily affecting healthy leaf segmentation. To achieve optimal overall model performance, the synergistic combination of the DE attention mechanism and DCNv2 proved essential.
When all three core improvements (DE attention, DCNv2, BiFPN(p2)) were applied simultaneously, all evaluation metrics demonstrated improvement. Compared to the baseline model, the overall segmentation precision (p (all)) and mean segmentation accuracy (mAP@50 (all)) increased by 3.0% and 3.9%, respectively, while lesion segmentation precision (p (bad)) saw a substantial gain of 5.8%. Concurrently, model size and parameter count were significantly reduced. Notably, even compared to the larger YOLOv11s-seg model, this enhanced configuration exhibited superior performance in precision and mean segmentation accuracy. Finally, the YOLOv11n-seg-DEDB model incorporated the lightweight detection head. Although this modification slightly impacted segmentation capability compared to the three-module combination, it resulted in a significant further reduction in model size and parameters, achieving reductions of 23.3% (4.6 MB) and 27.9% (2.04 M).
In summary, for deployment on devices with ample computational power, utilizing the combination of DE attention, DCNv2, and BiFPN(p2) maximizes model performance. However, considering the requirements for deployment on edge or mobile devices, where balancing performance and lightweight design is crucial, the YOLOv11n-seg-DEDB model presents a more suitable solution.

3.3. Comparison Experiments of Modules and Models

This section validates the effectiveness of the proposed YOLOv11-seg-DEDB network model through comparative experiments. These include a comparison between the proposed DE attention mechanism and mainstream attention modules, and a comparison between the YOLOv11n-seg-DEDB model and other leading segmentation models. Model performance was assessed using several metrics, including lesion segmentation precision (p (bad)), overall segmentation precision (p (all)), F1-score (F1 (all)), mean Average Precision for segmentation (mAP@50 (all)), number of parameters (Params), and model size.
Table 3 presents a comparison between the proposed DE attention mechanism and several mainstream attention mechanisms (CBAM, EMA, SE), all based on the YOLOv11n-seg model. The results indicate that the incorporation of any attention mechanism leads to an increase in model size and parameter count, as these mechanisms primarily enhance feature extraction capabilities without fundamentally altering the network architecture. Except for CBAM, attention mechanisms improved segmentation precision. The proposed DE attention achieved the best performance in terms of target segmentation precision (p (bad), p (all)), and mean segmentation accuracy (mAP@50 (all)). Although the F1-score of DE attention was slightly lower than those of EMA and SE, the DCNv2 network’s effectiveness in feature fusion mitigated false positive issues. As a result, the high precision of DE attention makes it particularly suitable for the aloe anthracnose lesion segmentation task.
Table 4 compares the YOLOv11-seg-DEDB model with other mainstream YOLO segmentation models. The results demonstrate that the YOLOv11n-seg-DEDB model outperforms all other segmentation models in terms of precision for aloe anthracnose lesions (p (bad)), achieving 82.5%. Regarding p (all), the improved model was only 0.1% lower than the significantly larger YOLOv11s-seg model. The YOLOv9t-seg model matched the improved model’s overall precision (p (all) 85.4%). However, this model’s utilization of five detection heads increased its sensitivity to targets, consequently elevating the false positive rate. This is reflected in its lower F1-score and mAP@50 compared to the improved model. In contrast, the YOLOv11n-seg-DEDB model not only achieved a 0.5% higher mAP@50 than YOLOv11s-seg (76.4% vs. 75.9%) but also exhibited a smaller model size and fewer parameters than the YOLOv5n-seg (the smallest baseline model).
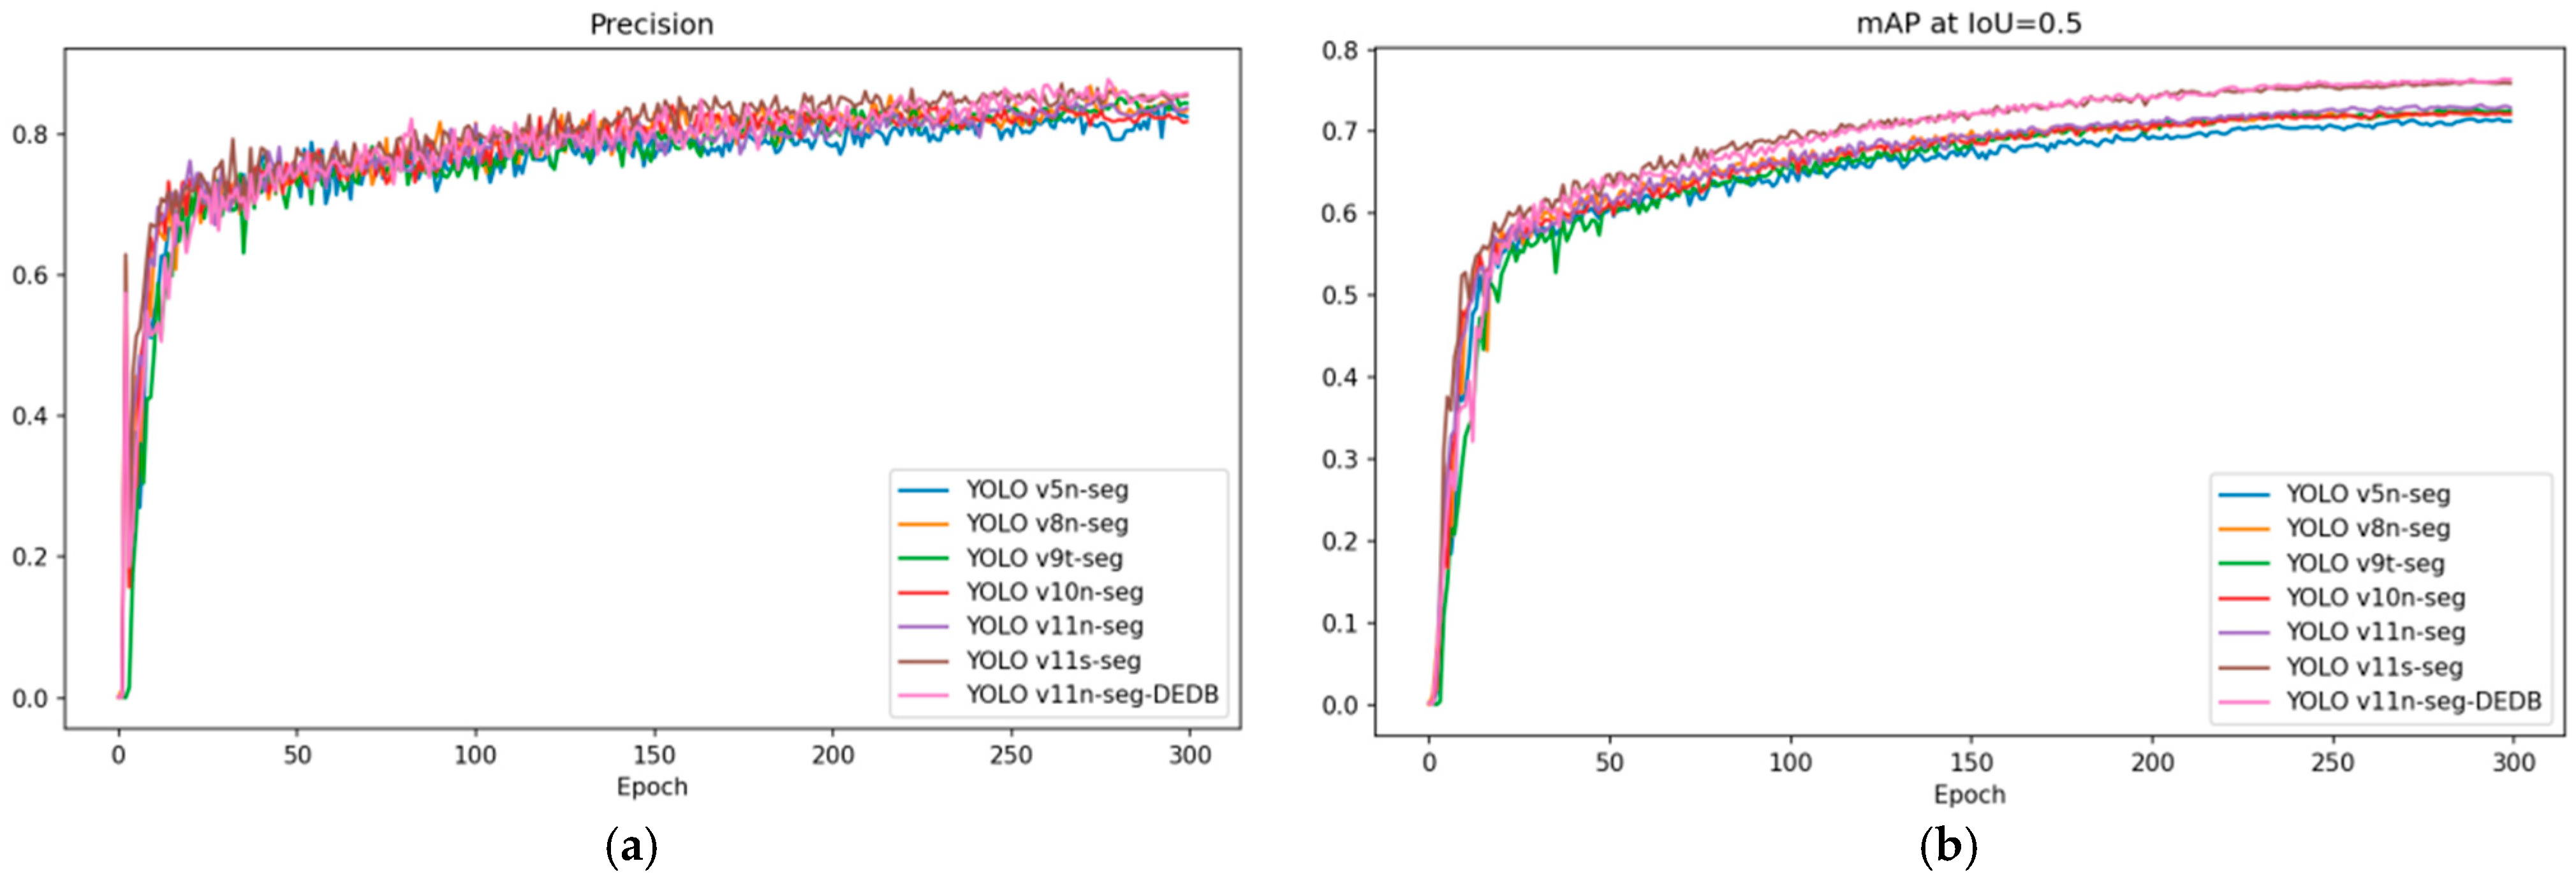
Figure 11 illustrates the changes in precision and mAP@50 for different models as training epochs increase. All models demonstrated a rapid increase in both precision and mAP@50, reaching approximately 70% and 60% within the first 30 epochs. Following this, although some fluctuations occurred, both metrics generally showed a slow upward trend across all models, stabilizing around epoch 260 and converging by epoch 300. Notably, YOLOv9t-seg, YOLOv11s-seg, and YOLOv11n-seg-DEDB maintained higher precision levels than the other models. Furthermore, YOLOv11s-seg and YOLOv11n-seg-DEDB demonstrated significantly superior mAP@50 performance. Considering the substantially larger size of YOLOv11s-seg compared to the other models, the YOLOv11n-seg-DEDB model offers the best overall performance balance among the evaluated segmentation models.

3.4. Visual Output of Disease Severity Classification

Section 2.3 detailed the formula for calculating the severity percentage of aloe anthracnose disease and the corresponding grading standards. To provide a more intuitive presentation of the results, a dedicated visualization program was developed. The interface of this program is depicted in Figure 12.
Figure 12 illustrates the interface of the Aloe Anthracnose Disease Severity Classification System. Upon launching the program, users are prompted to input the image requiring detection. After loading the input image, the system automatically performs image detection and segmentation, presenting the results visually. The left panel of the interface displays the segmentation results, distinguishing lesion areas (bad) from healthy leaf areas (well). The top-left corner of each segmented region is annotated with its corresponding label type and confidence score. The right panel presents statistical results, including the number of lesions, the number of healthy leaf segments, the pixel counts for lesions and healthy leaves, and the calculated lesion area ratio relative to the total leaf area. Based on this area ratio, the program outputs the disease severity level according to the predefined standards. Figure 12a demonstrates the segmentation performance on a single leaf under simple environmental conditions, while Figure 12b showcases the segmentation results for an entire aloe plant within a complex background.
This visualization program effectively communicates the detection and segmentation outcomes for aloe anthracnose. It not only precisely locates lesions but also quantitatively assesses the severity of the infection. The system enables users to clearly understand the impact of the disease on the aloe plant, facilitating timely implementation of appropriate control measures to mitigate economic losses.

4. Discussion

This study utilized RGB cameras to capture images of anthracnose lesions on field-grown aloe vera leaves under diverse weather and lighting conditions. The raw images, with an initial resolution of 4284 × 4284 pixels, were subsequently downscaled to 640 × 640 pixels to reduce storage requirements and enhance training efficiency. A series of data augmentation techniques were applied to enhance data diversity, thereby strengthening the intensity and robustness of model training.
By improving the mainstream semantic segmentation models, this study proposes a novel YOLOv11-seg-DEDB model tailored for effective segmentation of aloe anthracnose lesions and grading of disease severity. A DE attention mechanism, integrated with DCNv2, is designed to significantly improve segmentation precision and recall rates. Furthermore, BiFPN architecture is adopted with an additional p2 detection head, enabling the incorporation of more small-target features into the feature fusion process. To optimize computational efficiency, a lightweight segmentation-detection head is developed, effectively reducing model parameters and size. Table 4 shows the YOLOv11-seg-DEDB model outperforms other mainstream segmentation models in both segmentation accuracy and model compactness. Compared to the original YOLOv11-seg model, it improves segmentation accuracy and mAP@50 for infected lesions by 5.3% and 3.4%, while reducing model parameters by 27.9%. These results validate its superior performance in aloe anthracnose segmentation tasks. In summary, comparative experiments with various network architectures confirm that the YOLOv11-seg-DEDB model not only enhances the segmentation precision of aloe anthracnose lesions, particularly under complex environmental conditions, but also ensures the lightweight nature of the model. This enables simultaneous lesion segmentation and disease severity grading, effectively meeting practical application requirements.
With the rapid advancement of deep learning, there is an escalating demand for more sophisticated approaches in agricultural disease research. Timely detection of diseases, accurate assessment of disease severity, and subsequent implementation of differential control measures and economic impact evaluations hold critical significance for sustainable agricultural management [43]. Wang Jianlong et al. [15] developed an improved RAAWC-UNet network, which incorporated a modulation factor and CBAM to enhance detection capabilities for small lesions. By replacing the downsampling layer with ASPP, the model achieved higher segmentation accuracy in complex environments. While these models improved accuracy, they also increased the number of parameters, highlighting the need for lightweight solutions. Esgario et al. [16] integrated UNet and PSPNet models for coffee leaf segmentation, and employed CNN models like ResNet for disease classification, with a practical Android client for users to upload images and obtain disease information. While this system is practical, it still requires an internet connection and has not yet addressed the issue of lightweight local deployment. Previous studies have provided valuable references for the present research, thus the improvements in this work balance accuracy and lightweighting. Notably, the YOLOv11-seg-DEDB model integrates both detection and segmentation capabilities, enabling not only counting of aloe anthracnose lesions but also grading of disease severity through calculation of lesion area. Additionally, its lightweight design facilitates deployment on mobile and edge devices, enhancing user accessibility. These strengths of the study are anticipated to contribute to more in-depth analyses and advancements in this research field.

5. Conclusions

The primary contribution of this work lies in establishing a high-precision, low-complexity intelligent diagnostic framework for aloe anthracnose. The synergistic integration of the DE attention mechanism and DCNv2 modules significantly enhances the model’s ability to detect irregular, small-scale lesions within complex field scenes. Furthermore, the combination of BiFPN and the lightweight detection head optimizes computational efficiency, providing a technical foundation for deployment on mobile or edge devices. The disease grading system, based on pixel-level segmentation results, enables objective quantification of anthracnose severity, offering an effective tool for early disease warning and informed control decisions in precision agriculture.
This study acknowledges several limitations: Firstly, the model’s adaptability to scenes with high leaf occlusion density requires further enhancement, indicating a need to improve robustness under extreme environmental complexity. Secondly, the existing grading standard relies solely on lesion area percentage and does not account for the influence of lesion spatial distribution (e.g., proximity to growth points) on disease progression. Thirdly, despite substantial model volume has been significantly compressed, the repeated invocation of the DE attention and DCNv2 modules may introduce inference latency. Optimization techniques, such as operator refinement or hardware acceleration, could further enhance real-time performance. Lastly, the model currently focuses exclusively on anthracnose. Future research should extend it to multi-disease recognition, addressing other common aloe afflictions, such as leaf spot and leaf blight. Therefore, in the future, improvements to other modules will be considered to ensure the model’s universality in various disease segmentation tasks. Future work will also explore model pruning and quantization techniques to optimize inference speed and develop a unified multi-disease segmentation framework incorporating dynamic severity assessment algorithms for comprehensive disease diagnosis. In the future, mobile apps or monitoring platforms will be developed to meet the needs of different users (individual farmers or large-scale planting enterprises) for agricultural planting and disease detection. This work provides a valuable technical reference for deep learning-driven plant phenotyping analysis and holds promising implications for advancing smart agriculture.
Author Contributions

Conceptualization, W.F., X.Y., and W.Z.; methodology, W.Z.; software, W.Z. and X.L.; validation, X.L., J.C., and L.Z.; formal analysis, W.Z. and Q.Y.; investigation, X.L. and X.C.; resources, J.C., B.C., and J.W.; data curation, X.L., Q.Y., and B.C.; writing—original draft preparation, W.Z.; writing—review and editing, W.F.; visualization, J.C., L.Z., X.C., and J.W.; supervision, X.Y.; project administration, X.Y.; funding acquisition, W.F. All authors have read and agreed to the published version of the manuscript.

Funding

This research was funded by the Open Fund Project of National Key Laboratory of Green Pesticides, South China Agricultural University, grant number GPLSCAU202408; the Guangzhou Science and Technology Plan Project, grant number 202206010088; the Open Fund Project of National Key Laboratory of Agricultural Equipment Technology, South China Agricultural University, grant number SKLAET-202413; the Guangdong Province Rural Science and Technology Special Envoy Project, grant number KTP20240128. In part by the National Natural Science Foundation of China under Grant 62401212; In part by the Guangdong Basic and Applied Basic Research Foundation under Grant 2024A1515010162; In part by the Science and Technology Projects of Guangzhou under Grant 2024A04J4757.

Data Availability Statement

The data that support the findings of this study are available from the corresponding author upon reasonable request.

Conflicts of Interest

The authors declare no conflicts of interest.

References

  1. Christaki, E.V.; Florou-Paneri, P.C. Aloe vera: A plant for many uses. J. Food Agric. Environ. 2010, 8, 245–249. [Google Scholar]
  2. Pura, A.; Pura, C.; Florea, E.M.G.F. The phytochemical constituents and therapeutic uses of genus Aloe: A review. Not. Bot. Horti Agrobot. Cluj-Napoca 2021, 49, 12332. [Google Scholar] [CrossRef]
  3. Ebrahim, A.A.; Elnesr, S.S.; Abdel-Mageed, M.A.A.; Aly, M.M.M. Nutritional significance of aloe vera (Aloe barbadensis Miller) and its beneficial impact on poultry. World’s Poult. Sci. J. 2020, 76, 803–814. [Google Scholar] [CrossRef]
  4. Baruah, A.; Bordoloi, M.; Baruah, H.P. Aloe vera: A multipurpose industrial crop. Ind. Crops Prod. 2016, 94, 951–963. [Google Scholar] [CrossRef]
  5. Ahmad, T.; Nie, C.; Cao, C.; Xiao, Y.; Yu, X.; Liu, Y. First record of Alternaria tenuissima causing Aloe barbadensis leaf blight and leaf spot disease in Beijing, China. Crop Prot. 2024, 175, 106447. [Google Scholar] [CrossRef]
  6. Sallom, A.; Alabbound, M. Evaluating image segmentation as a valid method to estimate walnut anthracnose and blight severity. DYSONA-Appl. Sci. 2023, 4, 1–5. [Google Scholar]
  7. Saleem, M.H.; Potgieter, J.; Arif, K.M. Automation in Agriculture by Machine and Deep Learning Techniques: A Review of Recent Developments. Precis. Agric. 2021, 22, 2053–2091. [Google Scholar] [CrossRef]
  8. Kamilaris, A.; Prenafeta-Boldú, F.X. Deep learning in agriculture: A survey. Comput. Electron. Agric. 2018, 147, 70–90. [Google Scholar] [CrossRef]
  9. Upadhyay, A.; Chandel, N.S.; Singh, K.P.; Chakraborty, S.K.; Nandede, B.M.; Kumar, M.; Subeesh, A.; Upendar, K.; Salem, A.; Elbeltagi, A. Deep learning and computer vision in plant disease detection: A comprehensive review of techniques, models, and trends in precision agriculture. Artif. Intell. Rev. 2025, 58, 92. [Google Scholar] [CrossRef]
  10. Liu, J.; Wang, X. Plant diseases and pests detection based on deep learning: A review. Plant Methods 2021, 17, 22. [Google Scholar] [CrossRef]
  11. Faye, D.; Diop, I.; Mbaye, N.; Dione, D.; Diedhiou, M.M. Plant disease severity assessment based on machine learning and deep learning: A survey. J. Comput. Commun. 2023, 11, 57–75. [Google Scholar] [CrossRef]
  12. Wu, R.; Liu, Y.; Liang, P.; Chang, Q. UltraLight VM-UNet: Parallel Vision Mamba Significantly Reduces Parameters for Skin Lesion Segmentation. Patterns 2024, in press. [Google Scholar] [CrossRef]
  13. Tang, Z.; He, X.; Zhou, G.; Chen, A.; Wang, Y.; Li, L.; Hu, Y. A Precise Image-Based Tomato Leaf Disease Detection Approach Using PLPNet. Plant Phenomics 2023, 5, 18. [Google Scholar] [CrossRef] [PubMed]
  14. Zhou, H.; Peng, Y.; Zhang, R.; He, Y.; Li, L.; Xiao, W. GS-DeepLabV3+: A mountain tea disease segmentation network based on improved shuffle attention and gated multidimensional feature extraction. Crop Prot. 2024, 183, 14. [Google Scholar] [CrossRef]
  15. Wang, J.; Jia, J.; Zhang, Y.; Wang, H.; Zhu, S. RAAWC-UNet: An apple leaf and disease segmentation method based on residual attention and atrous spatial pyramid pooling improved UNet with weight compression loss. Front. Plant Sci. 2024, 15, 1305358. [Google Scholar] [CrossRef]
  16. Esgario, J.G.M.; Castro, P.B.C.D.; Tassis, L.M.; Krohling, R.A. An app to assist farmers in the identification of diseases and pests of coffee leaves using deep learning. Inf. Process. Agric. 2021, 9, 38–47. [Google Scholar] [CrossRef]
  17. Mac, T.T.; Nguyen, T.D.; Dang, H.K.; Nguyen, D.T.; Nguyen, X.T. Intelligent agricultural robotic detection system for greenhouse tomato leaf diseases using soft computing techniques and deep learning. Sci. Rep. 2024, 14, 23887. [Google Scholar] [CrossRef]
  18. Lu, B.; Lu, J.; Xu, X.; Jin, Y. MixSeg: A lightweight and accurate mix structure network for semantic segmentation of apple leaf disease in complex environments. Front. Plant Sci. 2023, 14, 1233241. [Google Scholar] [CrossRef]
  19. Polly, R.; Devi, E.A. Semantic segmentation for plant leaf disease classification and damage detection: A deep learning approach. Smart Agric. Technol. 2024, 9, 100526. [Google Scholar] [CrossRef]
  20. Khanam, R.; Hussain, M. YOLOv11: An Overview of the Key Architectural Enhancements. arXiv 2024, arXiv:2410.17725. [Google Scholar]
  21. Sapkota, R.; Karkee, M. Integrating yolo11 and convolution block attention module for multi-season segmentation of tree trunks and branches in commercial apple orchards. arXiv 2024, arXiv:2412.05728. [Google Scholar]
  22. Tao, J.; Li, X.; He, Y.; Islam, M.A. CEFW-YOLO: A High-Precision Model for Plant Leaf Disease Detection in Natural Environments. Agriculture 2025, 15, 883. [Google Scholar] [CrossRef]
  23. Yin, Z.; Xing, E.; Shen, Z. Squeeze, Recover and Relabel: Dataset Condensation at ImageNet Scale from a New Perspective. Adv. Neural Inf. Process. Syst. 2024, 36, 73582–73603. [Google Scholar]
  24. Kirillov, A.; Mintun, E.; Ravi, N.; Mao, H.; Rolland, C.; Gustafson, L.; Xiao, T.; Whitehead, S.; Berg, A.C.; Lo, W.Y.; et al. Segment Anything. arXiv 2023, arXiv:2304.02643. [Google Scholar]
  25. Larsen, L.B.; Neerup, M.M.; Hallam, J. Online computational ethology based on modern it infrastructure. Ecol. Inform. 2021, 63, 101290. [Google Scholar] [CrossRef]
  26. Bochkovskiy, A.; Wang, C.-Y.; Liao, H.-Y.M. YOLOv4: Optimal Speed and Accuracy of Object Detection. arXiv 2020, arXiv:2004.10934. [Google Scholar]
  27. Cao, C.; Lin, T.; He, D.; Li, F.; Yue, H.; Yang, J.; Ding, E. Adversarial Dual-Student with Differentiable Spatial Warping for Semi-Supervised Semantic Segmentation. IEEE Trans. Circuits Syst. Video Technol. 2022, 33, 793–803. [Google Scholar] [CrossRef]
  28. Redmon, J.; Divvala, S.; Girshick, R.; Farhadi, A. You Only Look Once: Unified, Real-Time Object Detection. In Proceedings of the 2016 IEEE Conference on Computer Vision and Pattern Recognition (CVPR), Las Vegas, NV, USA, 27–30 June 2016. [Google Scholar]
  29. Swathi, Y.; Challa, M. YOLOv8: Advancements and Innovations in Object Detection. In International Conference on Smart Computing and Communication; Springer: Singapore, 2024; Volume 946, pp. 1–13. [Google Scholar]
  30. Lin, T.Y.; Dollar, P.; Girshick, R.; He, K.; Hariharan, B.; Belongle, S. Feature pyramid networks for object detection. In Proceedings of the 2017 IEEE Conference on Computer Vision and Pattern Recognition, Honolulu, HI, USA, 21–26 July 2017. [Google Scholar]
  31. Alvarez, A.B. Performance evaluation of yolov8, yolov9, yolov10, and yolov11 for stamp detection in scanned documents. Appl. Sci. 2025, 15, 3154. [Google Scholar] [CrossRef]
  32. Abdulqader, A.F.; Abdulameer, S.; Bishoyi, A.K.; Yadav, A.; Rekha, M.M.; Kundlas, M.; Kavitha, V.; Aminov, Z.; Abdulali, Z.S.; Alwan, M.; et al. Multi-objective deep learning for lung cancer detection in ct images: Enhancements in tumor classification, localization, and diagnostic efficiency. Discov. Oncol. 2025, 16, 529. [Google Scholar] [CrossRef]
  33. Shutrodhar, A.; Shamsi, S. Anthracnose and leaf spot diseases of Aloe vera L. from Bangladesh. Dhaka Univ. J. Biol. Sci. 2013, 22, 103–108. [Google Scholar] [CrossRef]
  34. Wang, R.; Shivanna, R.; Cheng, D.; Jain, S.; Chi, E. DCN V2: Improved Deep & Cross Network and Practical Lessons for Web-scale Learning to Rank Systems. In Proceedings of the Web Conference 2021, Virtual, 12–23 April 2021; pp. 1785–1797. [Google Scholar]
  35. Wang, R.; Fu, B.; Fu, G.; Wang, M. Deep & Cross Network for Ad Click Predictions. In ADKDD’17: Proceedings of the ADKDD’17, Proceedings of the KDD ’17: The 23rd ACM SIGKDD International Conference on Knowledge Discovery and Data Mining, Halifax, Canada, 14 August 2017; Association for Computing Machinery: New York, NY, USA, 2017; pp. 1–7. [Google Scholar]
  36. He, K.; Zhang, X.; Ren, S.; Sun, J. Deep residual learning for image recognition. In Proceedings of the 2016 IEEE Conference on Computer Vision and Pattern Recognition, Las Vegas, NV, USA, 27–30 June 2016. [Google Scholar]
  37. Wang, W.; Dai, J.; Chen, Z.; Huang, Z.; Li, Z.; Zhu, X.; Hu, X.; Lu, T.; Li, H.; Wang, X.; et al. InternImage: Exploring Large-Scale Vision Foundation Models with Deformable Convolutions. In Proceedings of the 2023 IEEE/CVF Conference on Computer Vision and Pattern Recognition, Vancouver, BC, Canada, 17–24 June 2023; pp. 14408–14419. [Google Scholar]
  38. Xiong, Y.; Li, Z.; Chen, Y.; Wang, F.; Zhu, X.; Luo, J.; Wang, W.; Lu, T.; Li, H.; Qiao, Y. Efficient deformable convnets: Rethinking dynamic and sparse operator for vision applications. In Proceedings of the 2024 IEEE/CVF Conference on Computer Vision and Pattern Recognition, Seattle, WA, USA, 16–22 June 2024. [Google Scholar]
  39. Liu, S.; Qi, L.; Qin, H.; Shi, J.; Jia, J. Path Aggregation Network for Instance Segmentation. In Proceedings of the 2018 IEEE Conference on Computer Vision and Pattern Recognition, Salt Lake City, UT, USA, 18–23 June 2018. [Google Scholar]
  40. Tan, M.; Pang, R.; Le, Q.V. EfficientDet: Scalable and Efficient Object Detection. In Proceedings of the 2020 IEEE/CVF Conference on Computer Vision and Pattern Recognition (CVPR), Seattle, WA, USA, 13–19 June 2020. [Google Scholar]
  41. Tian, F.; Song, C.; Liu, X. Small target detection in coal mine underground based on improved rtdetr algorithm. Sci. Rep. 2025, 15, 12006. [Google Scholar] [CrossRef]
  42. Koima, I.N.; Kilalo, D.C.; Orek, C.O.; Wagacha, J.M.; Nyaboga, E.N. Survey of Fungal Foliar and Panicle Diseases in Smallholder Sorghum Cropping Systems in Different Agro-Ecologies of Lower Eastern Kenya. Microbiol. Res. 2022, 13, 765–787. [Google Scholar] [CrossRef]
  43. Jiao, J.; Yang, M.; Zhang, T.; Zhang, Y.; Yang, M.; Li, M.; Liu, C.; Song, S.; Bai, T.; Song, C.; et al. A sensitive visual method for onsite detection of quarantine pathogenic bacteria from horticultural crops using an LbCas12a variant system. J. Hazard. Mater. 2022, 426, 128038. [Google Scholar] [CrossRef]
Figure 1. Examples of aloe anthracnose dataset: (a) entire aloe; (b) single leaf.
Agronomy 15 01896 g001
Figure 2. Examples of data augmentations: (a) original image; (b) brightness variation; (c) contrast variation; (d) flipping; (e) salt-and-pepper noise; (f) Gaussian blur.
Agronomy 15 01896 g002
Figure 3. Flowchart of DE attention.
Agronomy 15 01896 g003
Figure 4. DCNv2 module: (a) stacked; (b) parallel.
Agronomy 15 01896 g004
Figure 5. Comparison of neck network structures: (a) FPN; (b) PANet; (c) BiFPN with p2.
Agronomy 15 01896 g005
Figure 6. Flowchart of lightweight segment head.
Agronomy 15 01896 g006
Figure 7. YOLOv11-seg-DEDB network structure diagram.
Agronomy 15 01896 g007
Figure 8. Training results of YOLOv11-seg-DEDB. (a) Evaluation curve; (b) PR curve.
Agronomy 15 01896 g008
Figure 9. Confusion matrices of YOLOv11-seg (a) and YOLOv11-seg-DEDB (b).
Agronomy 15 01896 g009
Figure 10. Comparison of segmentation effects: (a,d,g,j) original ground truth labels; (b,e,h,k) segmentation results from the YOLOv11-seg model; (c,f,i,l) segmentation results from the YOLOv11-seg-DEDB model. The red boxes indicate incomplete segmentation, while the yellow boxes indicate undetected segmentation.
Agronomy 15 01896 g010
Figure 11. Comparison of changes in accuracy (a) and recall rate (b) of different models.
Agronomy 15 01896 g011
Figure 12. Aloe anthracnose disease degree classification system. (a) Single leaf; (b) entire aloe.
Agronomy 15 01896 g012
Table 1. Classification standards for the severity of aloe anthracnose.
The Proportion of Lesion AreaInfection Level
P < 0.1 % Health
0.1 % P < 1 % Mild infection
1 % P < 5 % Moderate infection
5 % P < 15 % Severe infection
P 15 % Necrosis
Table 2. Ablation study of YOLOv11-seg.
Modelp (Bad)p (All)F1 (All)mAP@50 (All)ParamsModel Size
YOLOv11n-seg77.2%83.4%74.8%73.0%2.83 M6.0 MB
YOLOv11n-seg + DE78.5%84.7%74.6%73.5%2.84 M6.1 MB
YOLOv11n-seg + DCN78.9%85.4%75.5%73.4%2.89 M6.2 MB
YOLOv11n-seg + BiFPN(p2)80.9%83.1%75.9%76.5%2.27 M5.1 MB
YOLOv11n-seg + DE + DCN79%85.2%75.9%73.9%2.90 M6.2 MB
YOLOv11n-seg + DE + BiFPN(p2)82.8%85.8%76.6%76.4%2.27 M5.1 MB
YOLOv11n-seg + DCN + BiFPN(p2)82.5%85.4%76.7%76.6%2.31 M5.2 MB
YOLOv11n-seg + DE + DCN + BiFPN(p2)83.0%86.4%77.0%76.9%2.32 M5.2 MB
YOLOv11n-seg-DEDB82.5%85.4%76.7%76.4%2.04 M4.6 MB
Table 3. Comparison of attention mechanisms.
Modelp (Bad)p (All)F1 (All)mAP@50 (All)ParamsModel Size
YOLOv11n-seg77.2%83.4%74.8%73.0%2.83 M6.0 MB
YOLOv11n-seg + CBAM76.2%82.0%74.1%72.3%2.90 M6.2 MB
YOLOv11n-seg + EMA76.7%83.8%75.0%73.0%2.85 M6.1 MB
YOLOv11n-seg + SE77.4%83.9%75.0%73.2%2.84 M6.1 MB
YOLOv11n-seg + DE78.5%84.7%74.6%73.5%2.84 M6.1 MB
Table 4. Comparison of different segmentation models.
Modelp (Bad)p (All)F1 (All)mAP@50 (All)ParamsModel Size
YOLOv5n-seg77.5%82.5%72.8%71.2%2.43 M5.2 MB
YOLOv8n-seg77.1%83.4%74.1%72.6%2.94 M6.2 MB
YOLOv9t-seg *80.0%85.4%74.1%72.5%3.56 M8.1 MB
YOLOv10n-seg75.6%81.8%73.9%72.1%2.52 M5.4 MB
YOLOv11n-seg77.2%83.4%74.8%73.0%2.83 M6.0 MB
YOLOv11s-seg *79.5%85.5%77.0%75.9%10.01 M20.6 MB
YOLOv11n-seg-DEDB82.5%85.4%76.7%76.4%2.04 M4.6 MB
* To ensure fairness, all models are the ”n” model (lightweight), except for YOLOv9, where the comparable ”t” model was substituted due to the absence of an ”n” model. The larger YOLOv11s-seg model is also included for further performance comparison.
Disclaimer/Publisher’s Note: The statements, opinions and data contained in all publications are solely those of the individual author(s) and contributor(s) and not of MDPI and/or the editor(s). MDPI and/or the editor(s) disclaim responsibility for any injury to people or property resulting from any ideas, methods, instructions or products referred to in the content.