Article

Seasonal Changes in the Soil Microbiome on Chernozem Soil in Response to Tillage, Fertilization, and Cropping System

1
Institute of Agricultural Chemistry and Soil Science, Faculty of Agricultural and Food Sciences and Environmental Management, University of Debrecen, 4032 Debrecen, Hungary
2
Kálmán Kerpely Doctoral School, University of Debrecen, 138 Böszörményi Street, 4032 Debrecen, Hungary
3
Department of Crop and Animal Production, Faculty of Agriculture and Environmental Sciences, Mountains of the Moon University, Fort Portal City P.O. Box 837, Uganda
4
Institute for Soil Sciences, Centre for Agricultural Research, Hungarian Research Network, 1116 Budapest, Hungary
5
Institute of Land Use, Technical and Precision Technology, Faculty of Agricultural and Food Sciences and Environmental Management, University of Debrecen, 4032 Debrecen, Hungary
*
Author to whom correspondence should be addressed.
Agronomy 2025, 15(8), 1887; https://doi.org/10.3390/agronomy15081887
Submission received: 25 June 2025 / Revised: 30 July 2025 / Accepted: 2 August 2025 / Published: 5 August 2025

Abstract

Soil microbial communities are crucial for ecosystem services, soil fertility, and the resilience of agroecosystems. This study investigated how long-term (31 years) agronomic practices—tillage, NPK fertilization, and cropping system—along with measured environmental variables influence the microbial biomass and its community composition in Chernozem soil under corn cultivation. The polyfactorial field experiment included three tillage treatments ((moldboard (MT), ripped (RT), strip (ST)), two fertilization regimes (NPK (N: 160; P: 26; K: 74 kg/ha), and unfertilized control) and two cropping systems (corn monoculture and corn–wheat biculture). The soil samples (0–30 cm) were collected in June and September 2023. Microbial biomass and community structure were quantified using phospholipid fatty acid (PLFA) analysis, which allowed the estimation of total microbial biomass and community composition (arbuscular mycorrhizal (AM) fungi, fungi, Gram-negative (GN) and Gram-positive (GP) bacteria, actinomycetes). Our results showed that microbial biomass increased from June to September, rising by 270% in unfertilized plots and by 135% in NPK-fertilized plots, due to higher soil moisture. Reduced tillage, especially ST, promoted significantly higher microbial biomass, with biomass reaching 290% and 182% of that in MT plots in June and September, respectively. MT had a higher ratio of bacteria-to-fungi compared to RT and ST, indicating a greater sensitivity of fungi to disturbance. NPK fertilization lowered soil pH by about one unit (to 4.1–4.8) and reduced microbial biomass—by 2% in June and 48% in September—compared to the control, with the particular suppression of AM fungi. The cropping system had a smaller overall effect on microbial biomass.

1. Introduction

Soil health plays an essential role in promoting sustainable development, as it reflects the ability of the soil to function as a living ecosystem that sustains plants, animals, and humans while supporting ecosystem stability and resilience [1]. Maintaining soil health is therefore essential to ensure long-term agricultural productivity and environmental balance. The assessment of soil health requires a comprehensive approach that integrates multiple indicators, including chemical, physical, and biological parameters. Chemical indicators include pH, soil organic carbon (SOC), total nitrogen (TN), and available nutrients [2,3,4]; physical indicators comprise soil texture and porosity [5]; and biological indicators include microbial activity, biomass, and community composition [4,6]. Among these, soil microbiological parameters are considered key indicators of soil health, as soil microbes are highly sensitive to environmental changes caused by both climate change and anthropogenic activities [5,7,8]. Therefore, understanding the structure and dynamics of the soil microbiome is particularly important, as microorganisms play an important role in nutrient cycling and organic matter decomposition, which are essential for sustainable agricultural production. Among the different approaches to characterize microbial communities, phospholipid fatty acid analysis (PLFA) [9], a widely used method, was used in this study to assess microbial community structure in this study. Although the PLFA profiling of soil does not provide species-level resolution, it gives a reliable insight into the composition of major microbial groups and is sensitive to environmental changes, making it a useful method for monitoring soil health over time [10].
Corn (Zea mays L.) is the most widely cultivated cereal crop worldwide. In central Europe, including Hungary, it is extensively grown for both human consumption and animal feed [11]. Hungary consistently ranks among the top corn-producing countries in the European Union, with more than 1 million hectares cultivated annually, yielding between 6 and 9 million tons depending on weather conditions [12]. In Eastern Europe, cereal crops such as corn and wheat are often cultivated on Chernozem and other fertile soils. Chernozem soils are among the highest-quality soils globally and play a significant role in agricultural production [13]. These soils have a favorable structure and are rich in organic matter, which contributes to their natural fertility. Despite their high productivity, however, they face several critical challenges. Intensive cultivation and inappropriate nutrient management have led to various forms of degradation, especially acidification and organic matter depletion. Soil acidification is particularly pressing problem, often caused by inappropriate chemical fertilization practices [14]. At the same time, a significant decline in soil organic matter can be observed, largely due to continuous intensive agricultural practices and insufficient recycling of organic matter. This progressive degradation negatively affects soil structure, reduces water-holding capacity, impairs microbial activity and threatens long-term soil fertility [15,16].
While many studies have investigated the impacts of agricultural land use on the physical and chemical properties of soils, considerably less attention has been given to the impact of agricultural management on soil microbial activity and community composition [17,18]. This research gap highlights the need for further investigation on the effects of different agrotechnical interventions on soil microbial communities—particularly in the context of upcoming EU conservation policies that emphasize sustainable soil management [19]. Among the most influential management practices are tillage systems, fertilization strategies, and crop rotation, all of which may significantly affect both the chemical and biological properties of soil. In conventional agriculture, plowing or moldboard tillage (MT) is traditionally used, where the topsoil is regularly turned over [20]. While this method is effective for weed control and seedbed preparation, it often has negative effects on the soil microbial community [21]. By exposing the soil surface and removing the protective organic matter layer, plowing can lead to soil crusting, organic matter depletion, and the deterioration of soil structure [22]. In recent years, however, there has been an increasing shift towards regenerative agricultural practices such as stripped tillage (ST), ripped tillage (RT), and no-till (NT) [23,24]. These practices help to preserve soil structure, retain organic matter, and conserve soil moisture through mulching, which protects the soil surface from evaporation and oxidation of organic matter [25]. A reduction in tillage intensity is often recommended to maintain SOC [26,27,28]. Numerous studies comparing reduced tillage, no-till and plow-based tillage systems have shown that cultivation methods significantly affect soil properties including bulk density, structure, and microbial activity [29,30]. For example, no-till systems showed higher proportion of weed seed and increased dehydrogenase activity in the topsoil. By contrast, conventional plowing often results in a stratified bulk density, and the formation of compacted plow pans [31]. Tillage practices not only impact physical soil parameters but also have a significant effect on soil microbial communities and their ecological functions, particularly in relation to carbon cycling and nutrient dynamics. Dadalto et al. [32] observed increased microbial carbon biomass and soil respiration under no-till systems. Similarly, Vilkiene et al. [33] found that reduced tillage increased microbial diversity and activity due to the accumulation of organic matter and nutrients in upper soil layers. No-till systems are also known to favor beneficial microbes involved in nutrient transformation and plant protection, whereas conventional tillage often promotes fungal saprotrophs and plant pathogens [28].
In addition to tillage, crop rotation is another key management factor influencing soil parameters. Crop rotation is a widespread agricultural practice that offers several advantages over monoculture and appears to play a significant role in shaping the composition of the soil microbial community by altering nutrient availability, and root exudate profiles [34]. Monocultures on the contrary cause the spread of pests and diseases that often require the increased use of chemicals to control, while crop rotation can help reduce these risks [35]. Several studies show that crop rotations, especially those that include legumes or cover crops, significantly increase microbial biomass and enzyme activities [36,37]. Despite its proven disadvantages, monoculture is still widely practiced in some countries [38,39], and relatively few studies have examined the microbiological differences between corn monoculture and corn-winter wheat biculture systems.
Chemical fertilization is another major factor affecting soil microbial life [40,41,42]. The scientific literature reports mixed results: while some studies suggest that fertilization increases the biomass and alters the community structure of soil microorganisms [43], other studies report that the application of nitrogen fertilizer stimulates fungal growth [44]. In contrast, several findings indicate that nitrogen fertilization may reduce the abundance and/or diversity of soil microbial communities, potentially due to acidification effects [45,46]. These discrepancies suggest that the impact of NPK fertilization depends on different factors such as initial soil fertility, soil pH and the types and application rates of chemical fertilizers [47].
These findings highlight the need to further investigate how different agrotechnical interventions influence soil microbial communities, particularly under long-term field conditions in highly productive Chernozem soil. Considering the growing emphasis on sustainable soil management within European Union agricultural policy, such investigations are of both scientific and practical importance [19]. Based on this background, we hypothesized that the soil microbiome of Chernozem soil under continental climate conditions is sensitive to various agrotechnical practices, and that changes in microbial community composition can be effectively monitored through the phospholipid fatty acid (PLFA) profile analysis. The main objective of this study was to evaluate the long-term (31-year) effects of intensive and reduced tillage systems (MT, ST, RT), fertilization regimes, and crop rotation patterns (corn monoculture vs. wheat–corn biculture) on the chemical and microbiological parameters of Chernozem soil under corn cultivation. An additional aim was to assess the seasonal dynamics of microbial communities and soil parameters.

2. Materials and Methods

2.1. Experimental Design

The long-term field experiment was established in 1991 at the experimental research station of the University of Debrecen (47°33′ N, 21°26′ E), Hungary. The region has a continental climate with an average annual temperature of 11 °C and annual precipitation of about 600 mm. The reference group of the soil is Endocalcic Chernozem (according to IUSS WG WRB-2022 [48]), which can be characterized by a loamy texture. The polyfactorial experiment was structured as follows: tillage method—moldboard tillage, ripped tillage, strip tillage; fertilization—control (no fertilization), NPK (N: 160 kg/ha; P: 26 kg/ha; K: 74 kg/ha); crop rotation—monoculture (corn) and biculture (winter wheat–corn). The three tillage methods differed primarily in the depth of tillage and the extent of soil disturbance. Strip tillage (ST) involved shallow tillage (0–10 cm), which was limited to narrow seed rows and only minimally disturbed the surrounding soil. In ripped tillage (RT), the soil was loosened deeply (up to 45 cm) by breaking up compacted layers vertically without causing soil inversion. Moldboard tillage (MT) caused the highest degree of soil disturbance as it completely inverted the soil to a depth of 30 cm. Plant residues were not removed from the experimental area, but were treated differently depending on the type of tillage: with MT, residues were incorporated into the soil at the plowing depth (0–30 cm); with ST they remained on the soil surface and with RT they were incorporated into the upper soil layer (0–10 cm).
The biculture system refers to a crop rotation conducted across two years: one year the crop was winter wheat, and the following year it was corn. In the monoculture system, corn was grown every year, with one harvest per year.
All treatments were repeated three times (Figure 1). One third of the total nitrogen (N) was applied as base fertilizer, the remaining two thirds as top dressing. The total amounts of phosphorus (P) and potassium (K) were applied as base fertilizer. The N, P, and K nutrients were supplemented by the application of calcium–ammonium–nitrate (CAN), monoammonium–phosphate (MAP), potassium chloride (KCl), and urea–ammonium–nitrate (UAN) as top dressing.
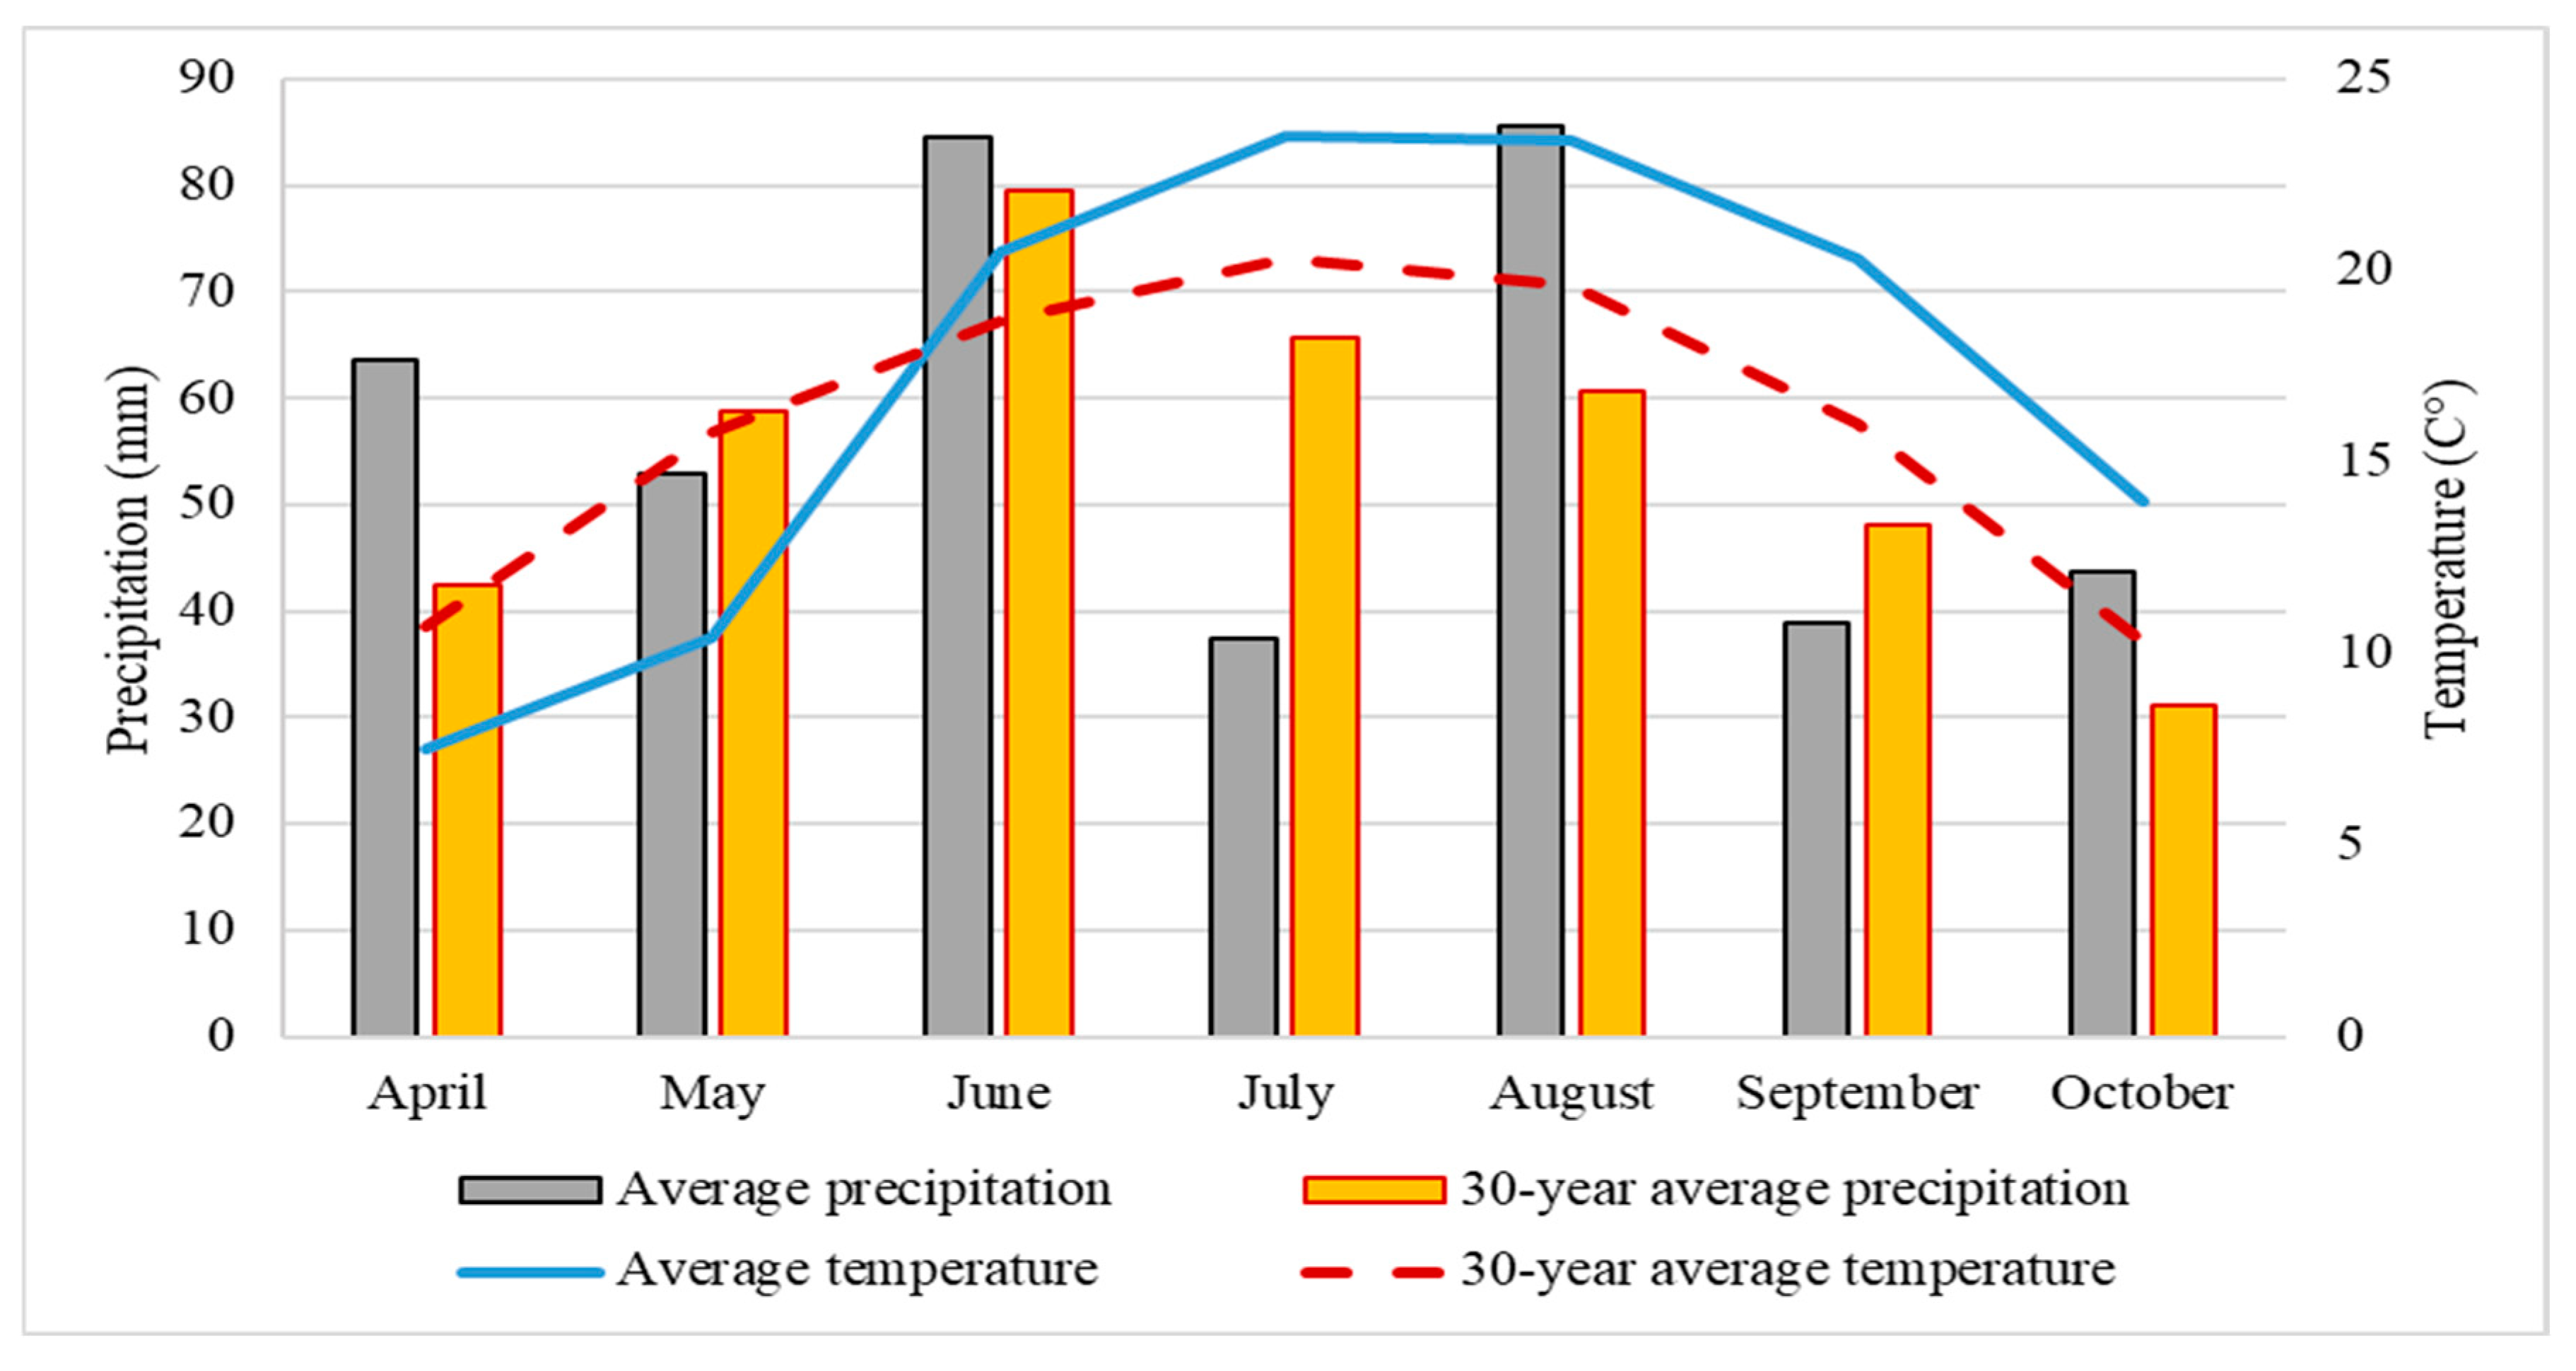
Precipitation during the growing season (Apr–Sep) in 2023 was slightly higher (393 mm) than the 30-year average (355 mm) (Figure 2). May was particularly dry, but from June to August, there was more precipitation than the 30-year average. The mean temperature in May was 5 °C lower, but from June to October it was almost 3–5 °C higher than the 30-year average.

2.2. Sample Collection and Processing

Soil samples were collected from the corn rows at a depth of 0–30 cm, using a soil auger, in close proximity to the plants. Sampling took place on 2nd June (shortly before top dressing) and on 8 September 2023. At both sampling dates, corn plants were at similar developmental stages in the mono- and biculture systems. In early June, the corn plants had six to seven fully developed leaves, and by early September, they were in a late reproductive stage, with kernels not yet fully mature.
The samples were analyzed for pHKCl, soil organic carbon (SOC), total nitrogen (TN), and microbial biomass and community composition using phospholipid fatty acid (PLFA) profiling.
Five soil sub-samples were taken per plot and mixed to form a composite sample. The roots were subsequently removed from the samples. One portion of the samples was freeze-dried and ground into a fine, homogeneous powder to analyze the microbial biomass and community, while the other portion was air-dried, ground and passed through a 2 mm sieve to measure the soil chemical parameters.

2.3. Measurement of Soil Physico-Chemical Parameters

Soil moisture content was determined by oven-drying at 105 °C. The pHKCl was measured using a 1 M KCl solution at a soil-to-solution ratio of 1:2.5. Soil organic carbon (SOC) and TN were analyzed by the dry combustion method using a Primacs SNC100 analyzer (Skalar Analytical B.V., Breda, The Netherlands) and presented as a percentage of the dry weight of the soil.

2.4. Measurement of Soil Microbial Biomass and Composition

Soil microbial biomass was determined by PLFA analysis according to the method of Ellis [49]. In brief, soil lipids were extracted from 2 g of freeze-dried soil with a mixture of methanol, chloroform, and K2HPO4 (1:0.5:0.4 v/v/v), subjected to alkaline methanolysis and analyzed using a gas chromatograph (Agilent 8890, Agilent Technologies, Inc., Santa Clara, CA, USA) with a flame ionization detector (FID). Peaks were identified by their retention time using a standard fatty acid mixture (Bacterial Acid Methyl Esters Supelco #47080-U, plus MJS Biolynx #MT1208 for 16:1ω5) and the Biolog PLFAD1 method in Sherlock software 6.5 (Biolog, Microbial Identification Inc., Newark, DE, USA). Each PLFA concentration was determined using an internal 19:0 standard and expressed as nmol PLFA/g dry weight of soil. Soil microbial biomass was estimated from the total amount of PLFAs detected. Community composition was determined by analyzing the PLFA pattern and estimated from the specific PLFA classification by Sherlock 6.5 software. Specific fatty acids that serve as biomarkers for different groups of microorganisms were as follows: fungi as 18:2ω6 PLFA [50]; arbuscular mycorrhizal (AM) fungi as 16:1ω5 PLFA [51], Gram-positive bacteria (GP) as iso- and anteiso-saturated, branched PLFAs [52]; Gram-negative bacteria (GN) as monounsaturated and cyclopropyl PLFAs [52]; general bacteria as unbranched, saturated PLFAs (14:0, 15:0, 16:0, 17:0, 18:0) [53,54]; actinomycetes as 10-methyl fatty acids (10Me16:0, 10Me17:0, 10Me18:0) (Zelles, 1999) [52]; and eukaryote as polyunsaturated PLFAs [53]; anaerobic bacteria as PLFAs of the dimethyl acetal (DMA).
The amount of total fungi (F) was calculated as the sum of fungi and AM fungi, while total bacteria (B) was expressed as the sum of GP, GN, and general bacteria [55]. The composition and shifts in the microbial community were assessed using the ratio of total bacteria to total fungi (B/F), and the ratio of Gram-positive to Gram-negative bacteria (GP/GN).

2.5. Statistical Analysis

Three-way ANOVA was used to assess the effect of interactions among NPK fertilization, tillage methods, and crop rotation on the soil physico-chemical properties and microbial characteristics. The homogeneity of variances and normality were tested using Levene’s test and the Shapiro–Wilk test, respectively, prior to conducting the ANOVA. The assumptions of ANOVA were met, as no significant deviations from normality or homogeneity were detected. When significant interaction effects were observed between the independent variables, one-way ANOVA or independent sample T-tests were conducted on the segmented datasets. Mean soil parameter values were compared using Tukey’s post hoc test at a significance level of p ≤ 0.05. The dataset was analyzed using SPSS version 27.0. The results in the tables and figures are given as mean ± 2 SEM (standard error of the mean). The effect of treatments on the overall microbial community structure was tested using with a single-factorial PERMANOVA based on Bray–Curtis dissimilarity, while principal component analysis (PCA) was used to visualize patterns in community composition between treatments. In addition, a multifactorial PERMANOVA was performed to assess the combined influence of multiple factors on community structure. The influence of environmental variables was analyzed using redundancy analysis (RDA) followed by a permutation test to determine the percentage of variance explained by each explanatory variable. The PCA, RDA, and PERMANOVA analyses, and their visualizations were performed in R version 4.5.1 (R Foundation for Statistical Computing, Vienna, Austria), mainly using the packages ‘FactoMineR’, ‘factoextra’, ‘dplyr’, ‘vegan’, and ‘ggplot2’.

3. Results

3.1. The Physico-Chemical Parameters of Soil

In general, tillage, NPK fertilization, and cropping system significantly (p ≤ 0.05) influenced the soil physico-chemical parameters, with the exception of the soil moisture content in June, where the treatments had no significant effect (Table 1). Since interactions were identified for some parameters, the results are also shown using a split dataset (Table 2).
At the time of sampling, the soil moisture content was higher in early September (15.1–18.9%) compared to early June (9.6–13.4%) (Table 2). The NPK fertilization had no influence on the moisture values. In monoculture, the soil moisture content in June was not influenced by different tillage methods. In the biculture system, the moisture value in ST was significantly higher than in RT and MT in the control plots. In September, the moisture content was higher in the RT plots than in the MT and ST plots, especially in the unfertilized control plots of both monoculture and biculture systems.
The soil pHKCl was significantly lower in the NPK-treated plots (ranging between 4.1 and 4.8) than in the control plots (ranging between 4.7 and 5.5). In addition, lower pHKCl values were measured in the RT plots than in the MT and ST plots. No significant differences in pH values were observed between the soil samples obtained under monoculture corn and those under the wheat–corn biculture system. The soil organic carbon (SOC) content did not differ between June and September. In most cases, the SOC content did not change as a result of NPK fertilization, except for the ST treatment in September, where significantly higher SOC values were found in the fertilized plots (2.2%; 2.3%) compared to the control (1.8%; 2.0%). The highest SOC values were measured in the fertilized plots with reduced tillages (RT and ST), compared to those with intensive MT, with the greatest differences observed in September. In some cases, higher SOC values were observed in the biculture plots compared to the monoculture plots (Table S1).
Contrary to our expectations, the total nitrogen (TN) content measured in the fertilized plots was not higher than in the control plots. This is probably due to the fact that nitrogen fertilization in June only took place after soil sampling, and most of the applied nitrogen had already been taken up by the plants in September, as they produced more biomass in the NPK fertilized plots. In June, the TN content in the RT and ST plots was significantly higher than in the MT plots, especially in the fertilized plots. By September, all RT and ST plots exhibited higher TN levels than the MT plots, regardless of fertilization. In most cases, TN was also significantly greater in biculture plots compared to monoculture plots (Table S1).

3.2. Soil Microbial Biomass and Community Composition

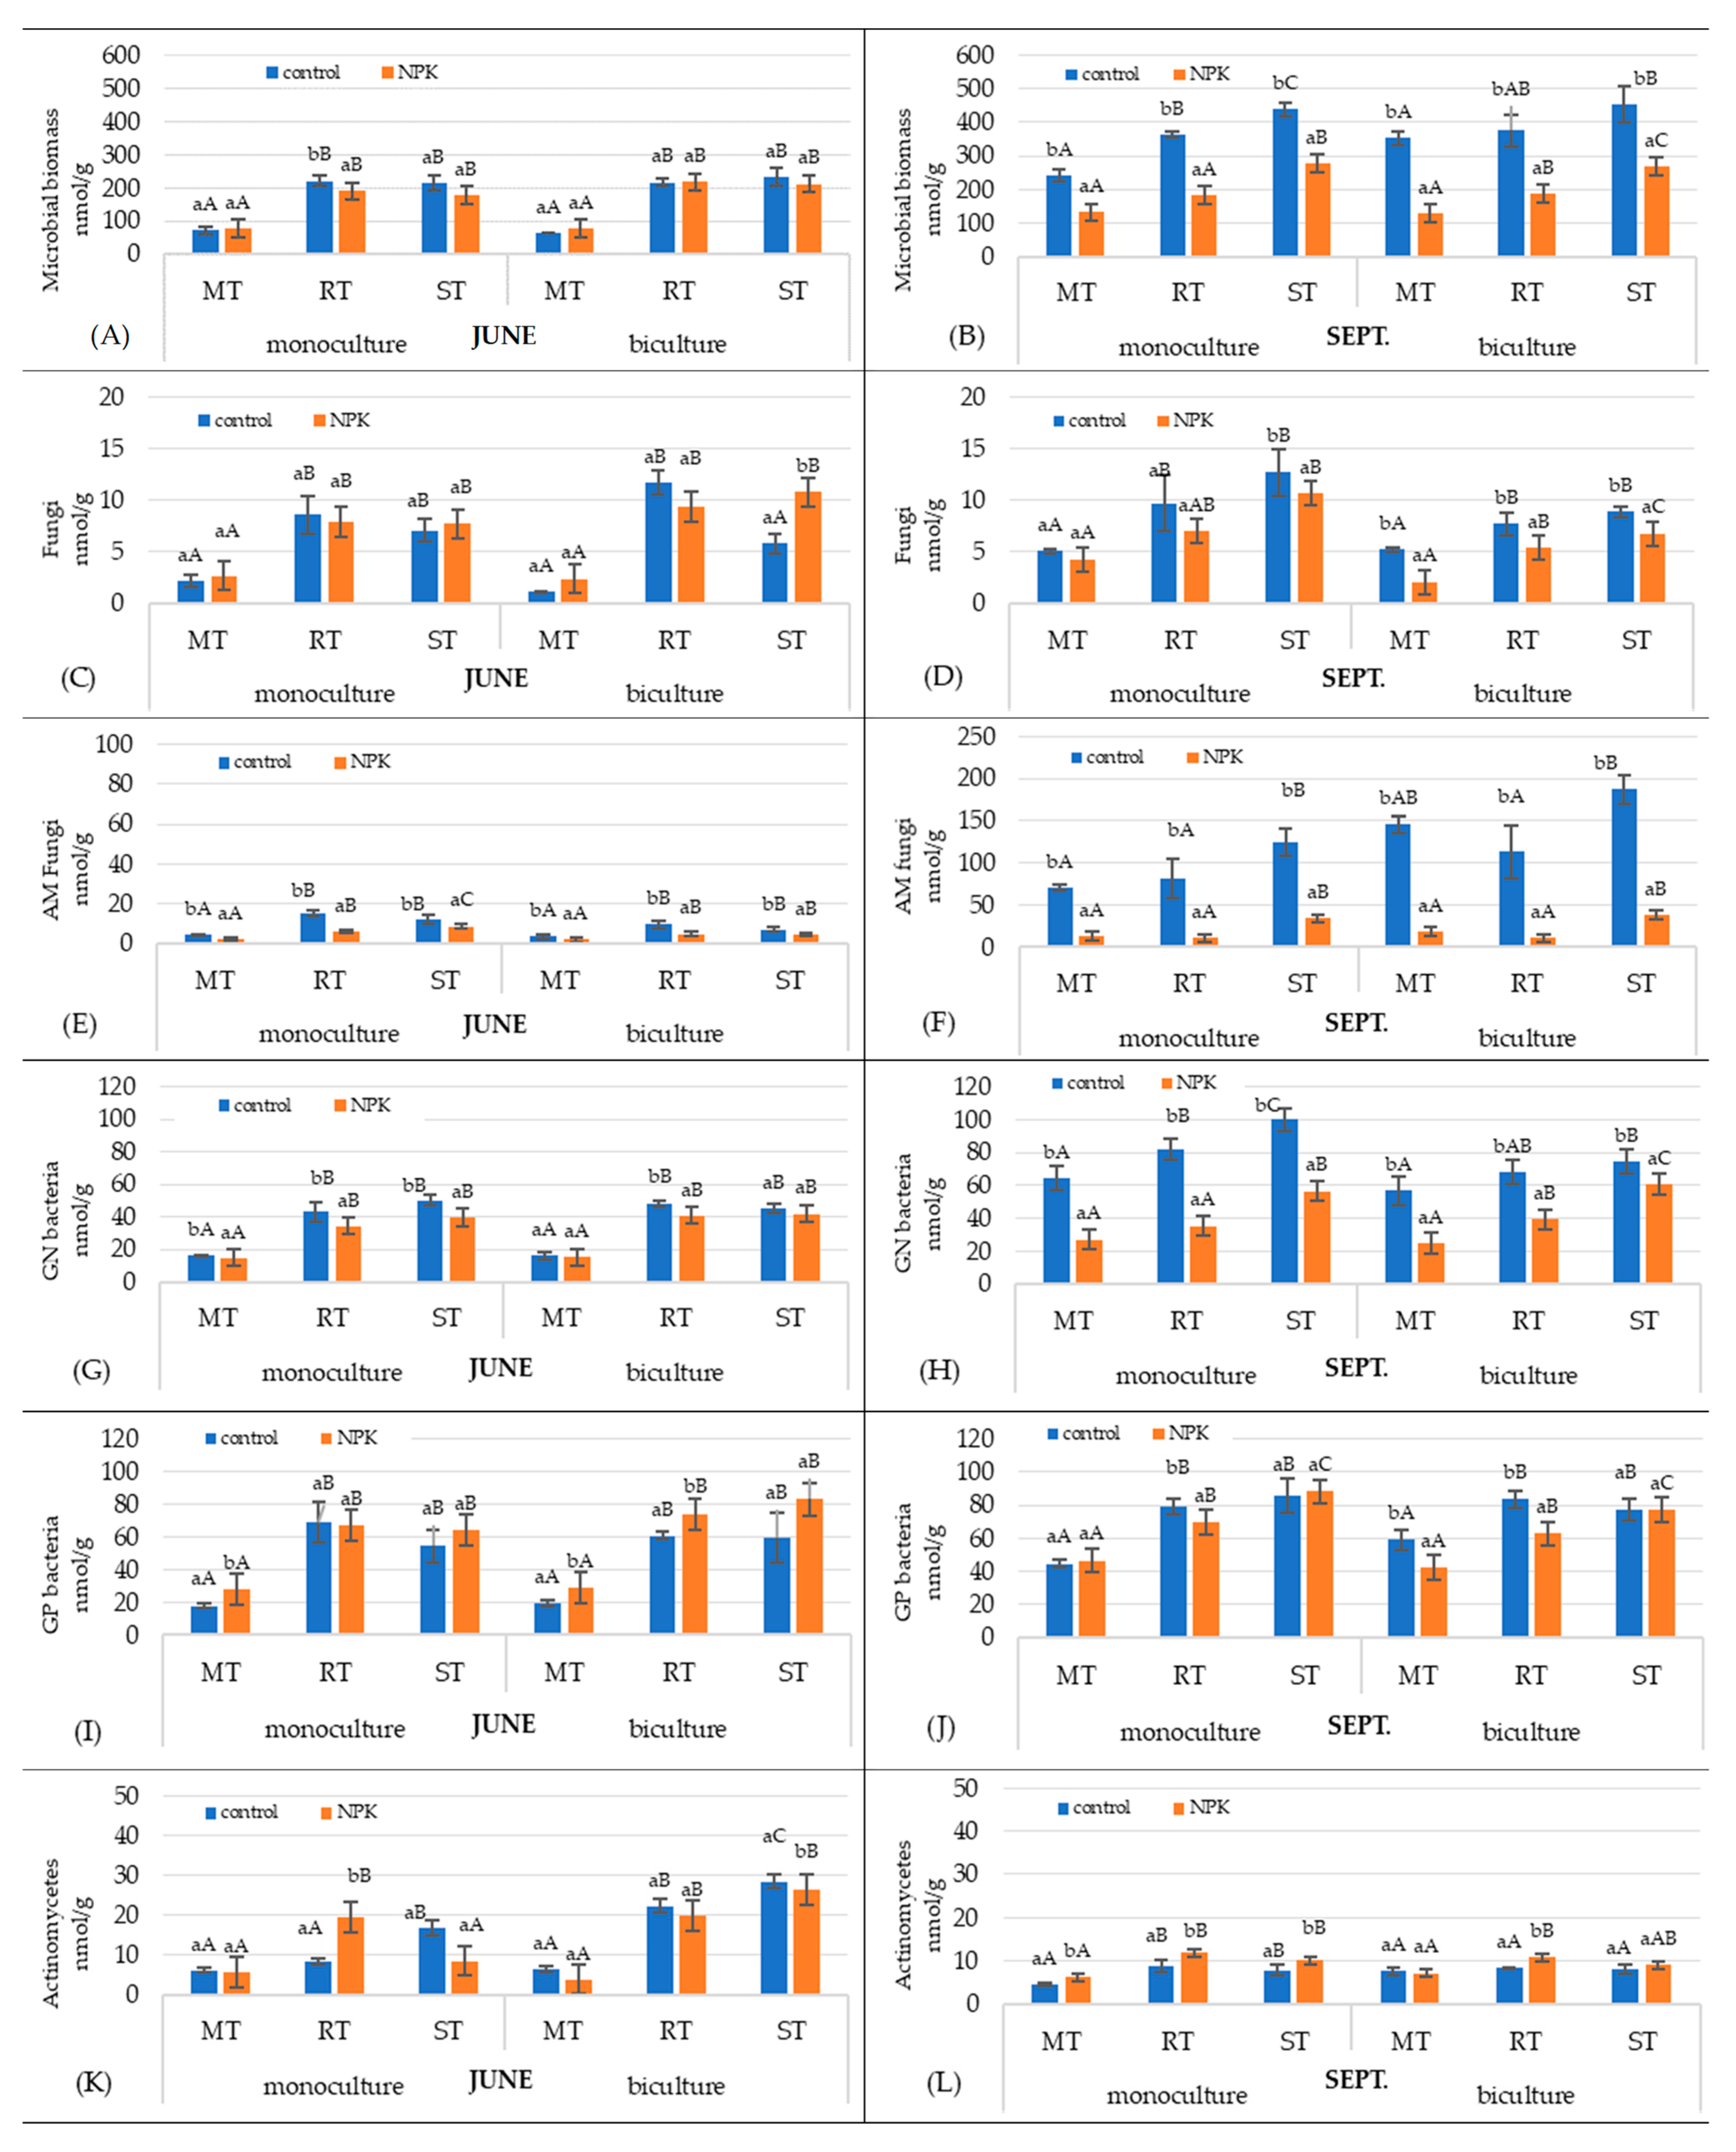
In general, tillage, NPK fertilization, and cropping systems had significant influence on almost all microbiological parameters both in June and September (Table 3). As the three-way ANOVA analysis revealed significant interaction effects for some independent variables on the microbiological soil parameters, the results are presented in the split dataset (Figure 2).

3.2.1. Microbial Biomass

The comparison of seasonal soil microbiome dynamics revealed that microbial biomass was significantly higher in September (128–453.6 nmol/g soil; Figure 3B) than in June (64.4–233.6 nmol/g soil; Figure 3A). These values were strongly influenced by NPK fertilization and soil tillage (Figure 3), whereas cropping system had a lesser effect (Table 3).
In June, microbial biomass did not differ significantly between fertilized (76.4–217 nmol/g soil) and unfertilized control plots (64.4–233.6 nmol/g soil). However, by September, microbial biomass in the NPK-fertilized plots (128–278.8 nmol/g soil) was significantly lower than in the control plots (242.5–453.6 nmol/g soil).
The comparison of the microbial biomass under different tillage systems revealed a significantly lower biomass in the intensive tillage system (MT: 64–372 nmol/g soil), compared to the two reduced tillage systems (ST: 180–454 nmol/g soil; RT: 154–421 nmol/g soil) in both June and September. The lowest value was measured in MT in June (61.9 nmol/g soil), while the highest was recorded in ST in September (454 nmol/g soil). In the MT control plots in September, the microbial biomass was higher in the biculture compared to the monoculture (Table S2). However, no significant differences in biomass were found between the two cropping systems in other tillages (RT and ST).

3.2.2. Microbial Community Composition

The effects of NPK fertilization, tillage, and cropping systems varied considerably among different microorganism groups, with each group showing distinct response patterns depending on the treatment and timing (Figure 3).
Fungi: In June (Figure 3C), fungal biomass was generally less affected by fertilization and cropping system but strongly influenced by tillage. The lowest values were measured under the most intensive MT, both in monoculture and biculture cropping systems compared to RT and ST. In September (Figure 3D), fungal biomass was slightly higher than in June, and all three factors—fertilization, cropping system and tillage—had a major influence on the values. Both fertilization and intensive tillage (MT) had a significant reducing effect on the fungal values. The highest fungal biomass (12.2 nmol/g) was measured in the control of the monoculture system under ST.
Arbuscular mycorrhizal (AM) fungi: The biomass of AM fungi was much higher in September (10.7–186.7 nmol/g soil; Figure 3F) than in June (2.1–15.0 nmol/g soil; Figure 3E), and NPK fertilization reduced its value, by an eighth to a tenth compared to the control. Similarly to fungal biomass, AM fungi biomass was significantly lowest in MT followed by RT and ST. While in June the biomass of AM fungi was slightly higher in the monoculture control plots compared to the biculture plots, in September, it was significantly higher in the biculture control plots (148.4 nmol/g soil) than in the monoculture plots (92.2 nmol/g soil) (Table S2).
Bacteria (GN, GP): The bacterial biomass, especially the biomass of GN bacteria, differed in the NPK treated and control plots and in the different tillage systems (Figure 3G,H). The changes were more pronounced in September, when the amount of GN bacteria in the fertilized plots was reduced by about half compared to the control. The biomass of GP bacteria was less variable in the fertilized plots compared to the control (Figure 3I,J). The abundance of GN and GP bacteria was significantly lower under the most intensive tillage method (MT), compared to the less disruptive tillages (ST, RT).
Actinomycetes: The response of actinomycetes to NPK fertilization and seasonal changes contrasted with that of the other main microbial groups. The biomass of actinomycetes was higher in June (3.8–28.4 nmol/g soil; Figure 3K) than in September (7.2–11.9 nmol/g soil; Figure 3L), and it was clearly observed that fertilization increased their biomass. The intensive tillage (MT) also reduced the amount of actinomycetes compared to RT and ST in both mono- and biculture cropping systems.
In summary, the population of most microbial groups in both monoculture and biculture was higher in September than in June, with the exception of actinomycetes, which were more abundant in June. In plots that had received long-term NPK fertilization, the abundance of most microbial groups was lower compared to the control plots; however, the actinomycetes showed an opposite trend. Among the tillage methods, RT and ST provided more favorable conditions for microbial communities than MT. In most cases, there were no significant differences in microbial biomass and community composition between mono- and biculture systems. However, an exception was observed in the control treatment of MT in September, where the microbial biomass was significantly higher in the biculture than in the monoculture cropping system.

3.2.3. Ratios of Microbial Groups

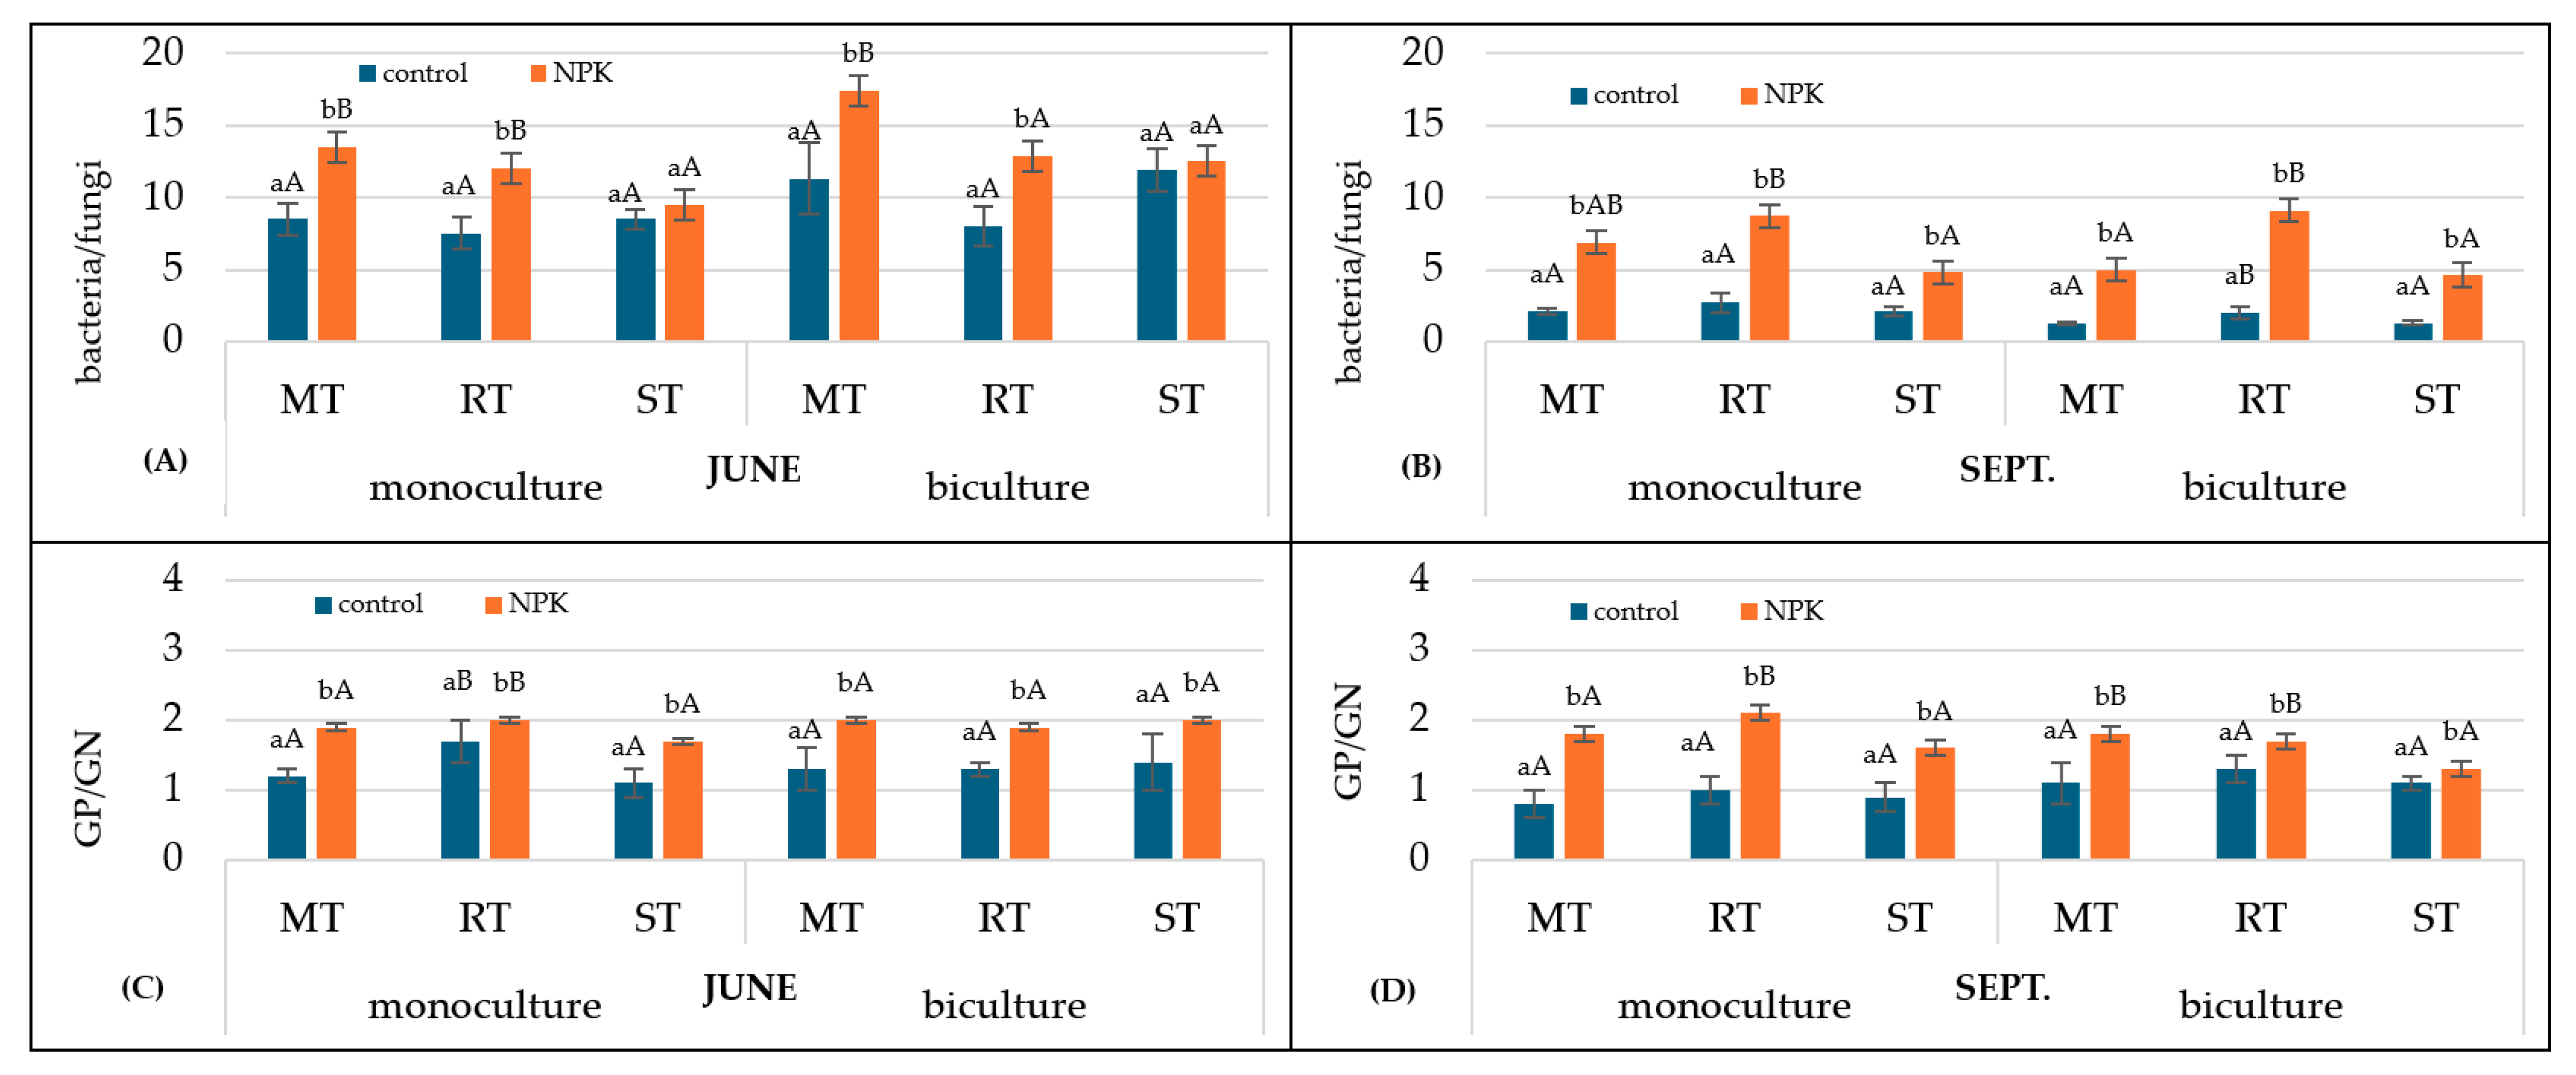
Indicators for the structure of the microbial community, such as the bacteria-to-fungi (B/F) ratio and Gram-positive to Gram-negative (GP/GN) bacteria ratio, showed remarkable fluctuations depending on fertilization, tillage, and season (Figure 4).
Bacteria-to-fungi ratio (B/F) ratio: In June, the ratio of B/F ranged from 7.5 to 17.5 (Figure 4A), while in September the values decreased and ranged from 1.3 to 8.7 (Figure 4B). In September, the B/F ratio in the plots fertilized with NPK was about three times as high as in the control. Within the monoculture plots that received NPK fertilization, the B/F values were lower with strip tillage (ST) than with moldboard tillage (MT) and reduced tillage (RT).
Gram-positive-to-Gram-negative (GP/GN) bacteria ratio: In June (Figure 4C), the GP/GN ratio was higher in the NPK fertilized plots (1.7–2.0) than in the control plots (1.1–1.7). In September (Figure 4D), the GP/GN ratio in the NPK plots was between 1.3 and 2.1, while it was significantly lower in the control plot, ranging from 0.8 to 1.3. The most pronounced effect of tillage was observed in September under NPK fertilization, where the lowest GP/GN ratio occurred under ST compared to MT and RT tillages within the biculture system.

3.2.4. Relative Abundance of Microbial Groups

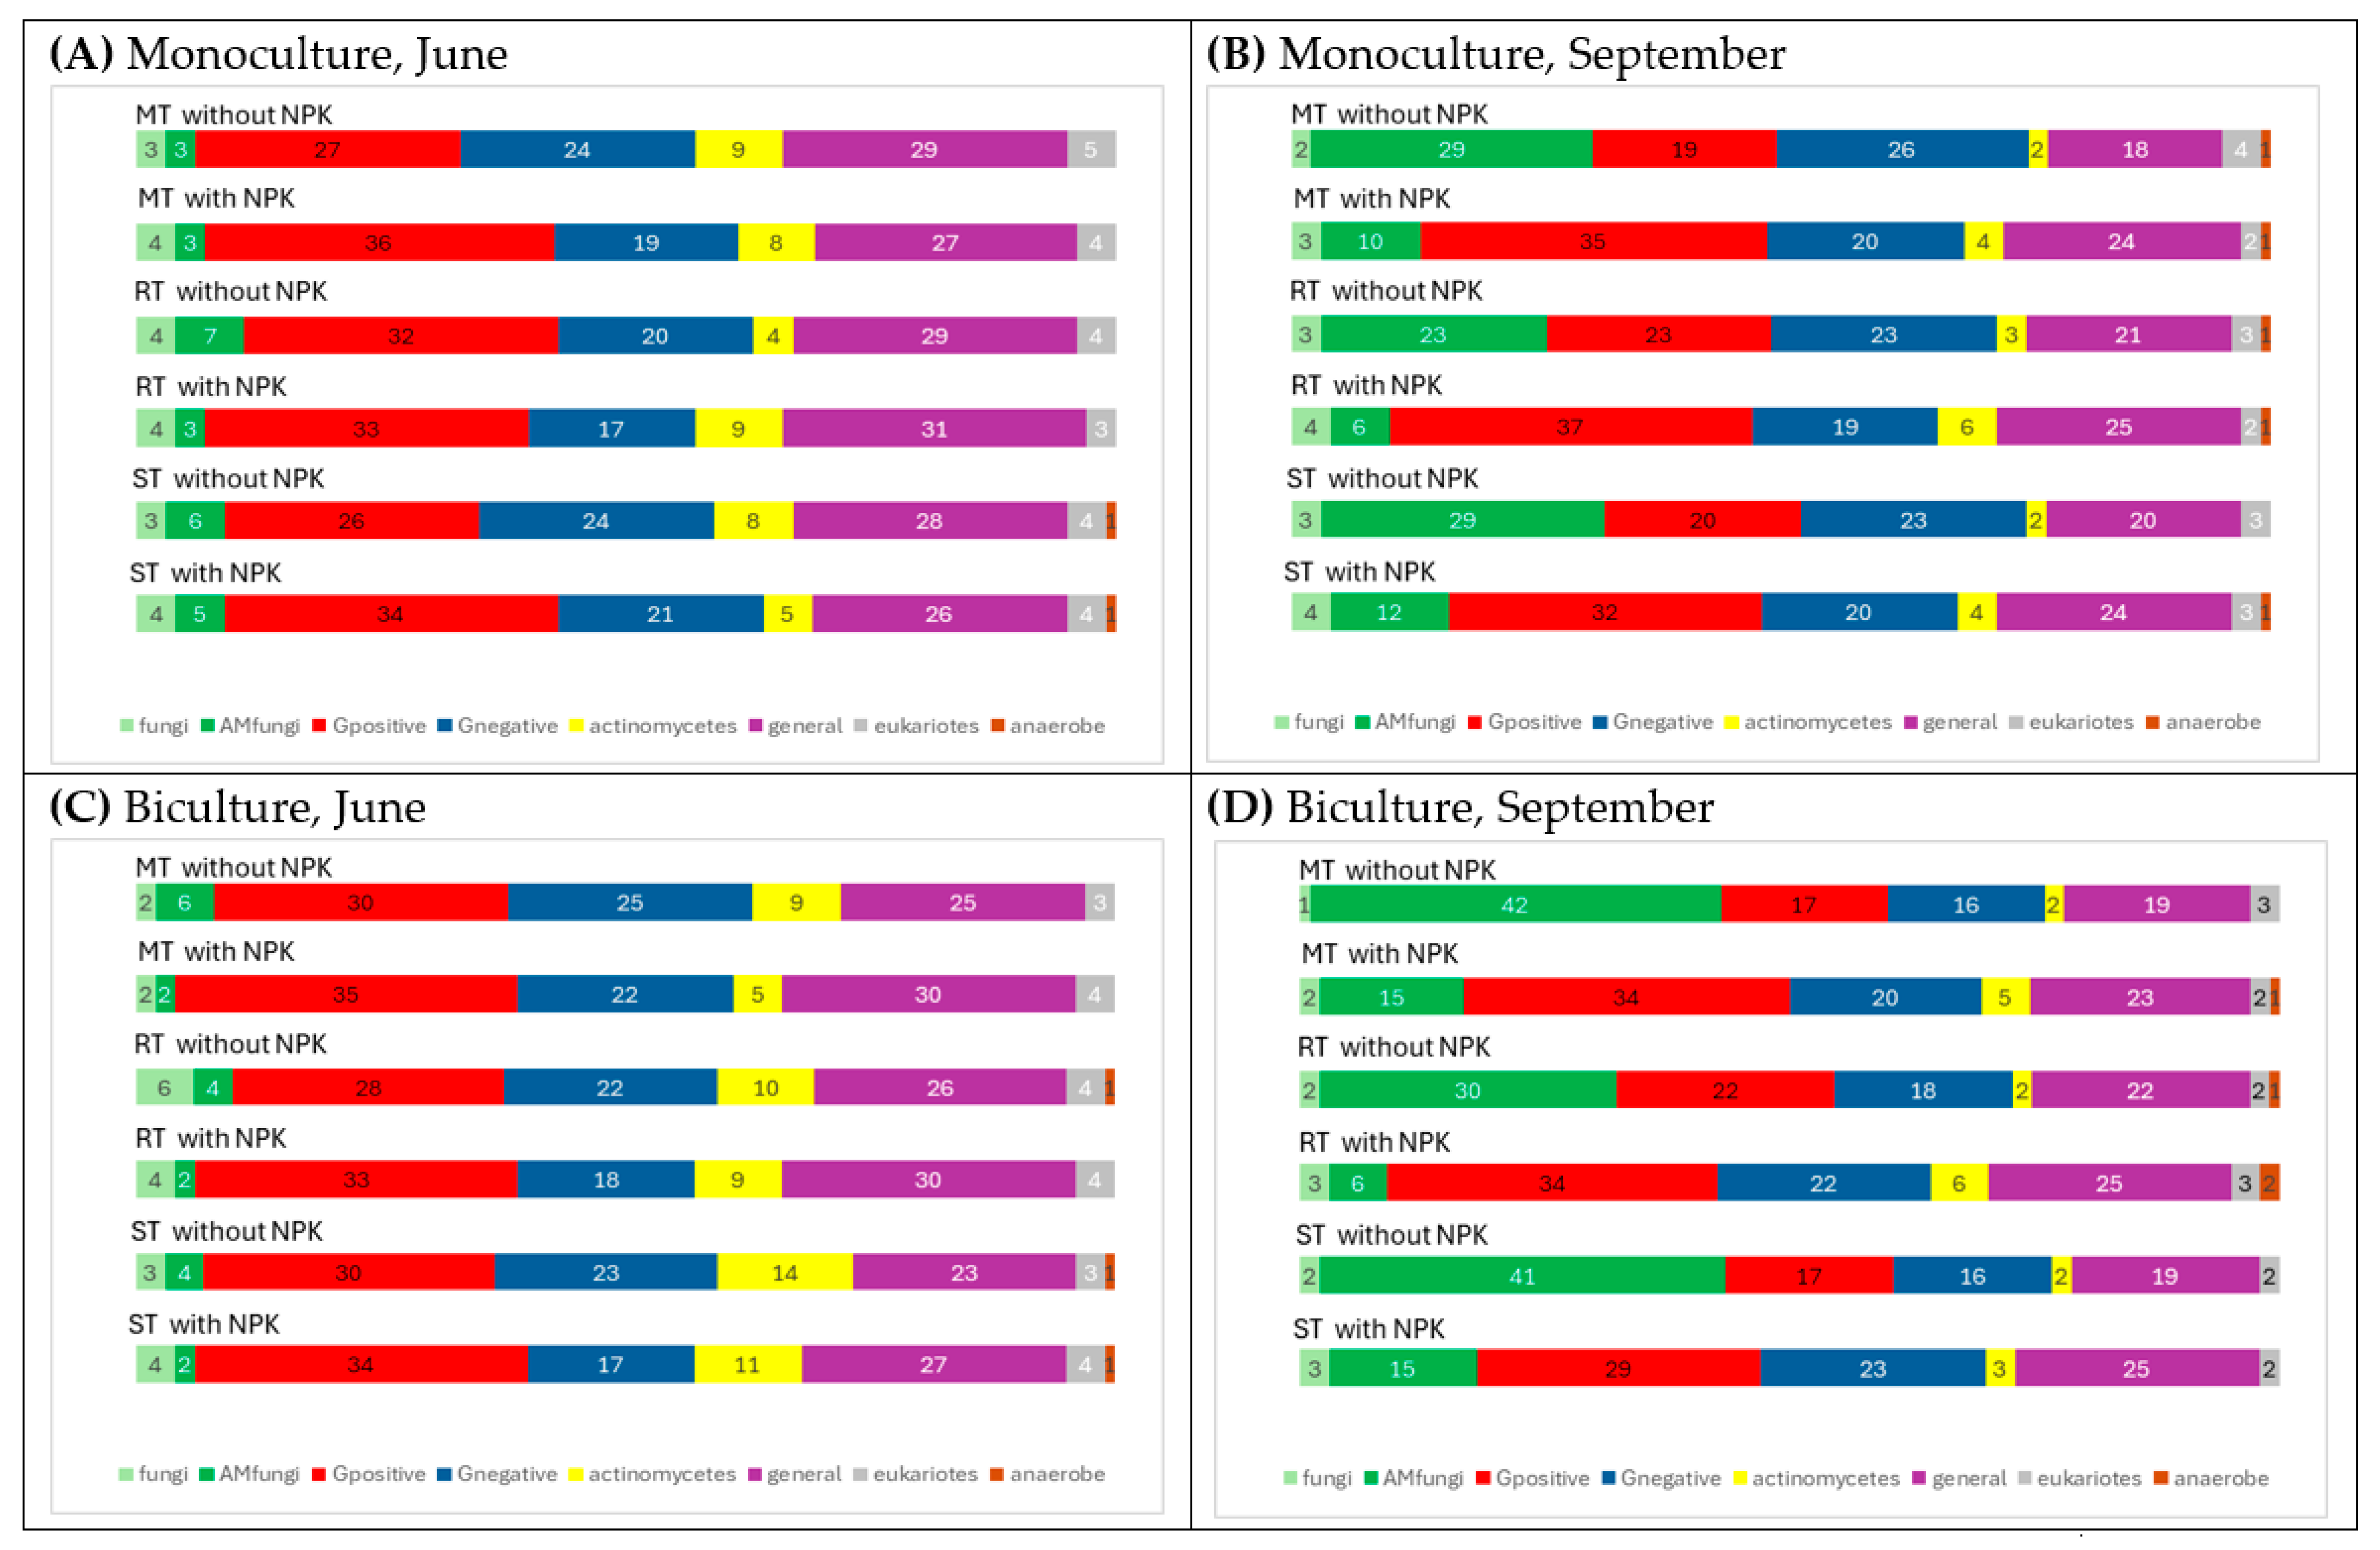
The relative abundance of fungi was significantly higher in September than in June, particularly in the control plots of the biculture system (Figure 5D). This is primarily attributed to an increase in AM fungi. In the monoculture control plots (without NPK), the relative abundance of AM fungi increased from 3 to 7% in June to 23–29% in September (Figure 5A,B), while in the biculture control, it increased from 4 to 6% to 30–42% (Figure 5C,D). However, NPK fertilization significantly reduced the relative abundance of AM fungi in both seasons. In September, the relative abundance of GN bacteria was lower in the NPK fertilized plots than in the control plots both in monoculture and in biculture cropping systems.
The relative abundance of actinomycetes—slightly higher in the NPK-treated plots than in the control, was lower in September than in June across both cropping systems.

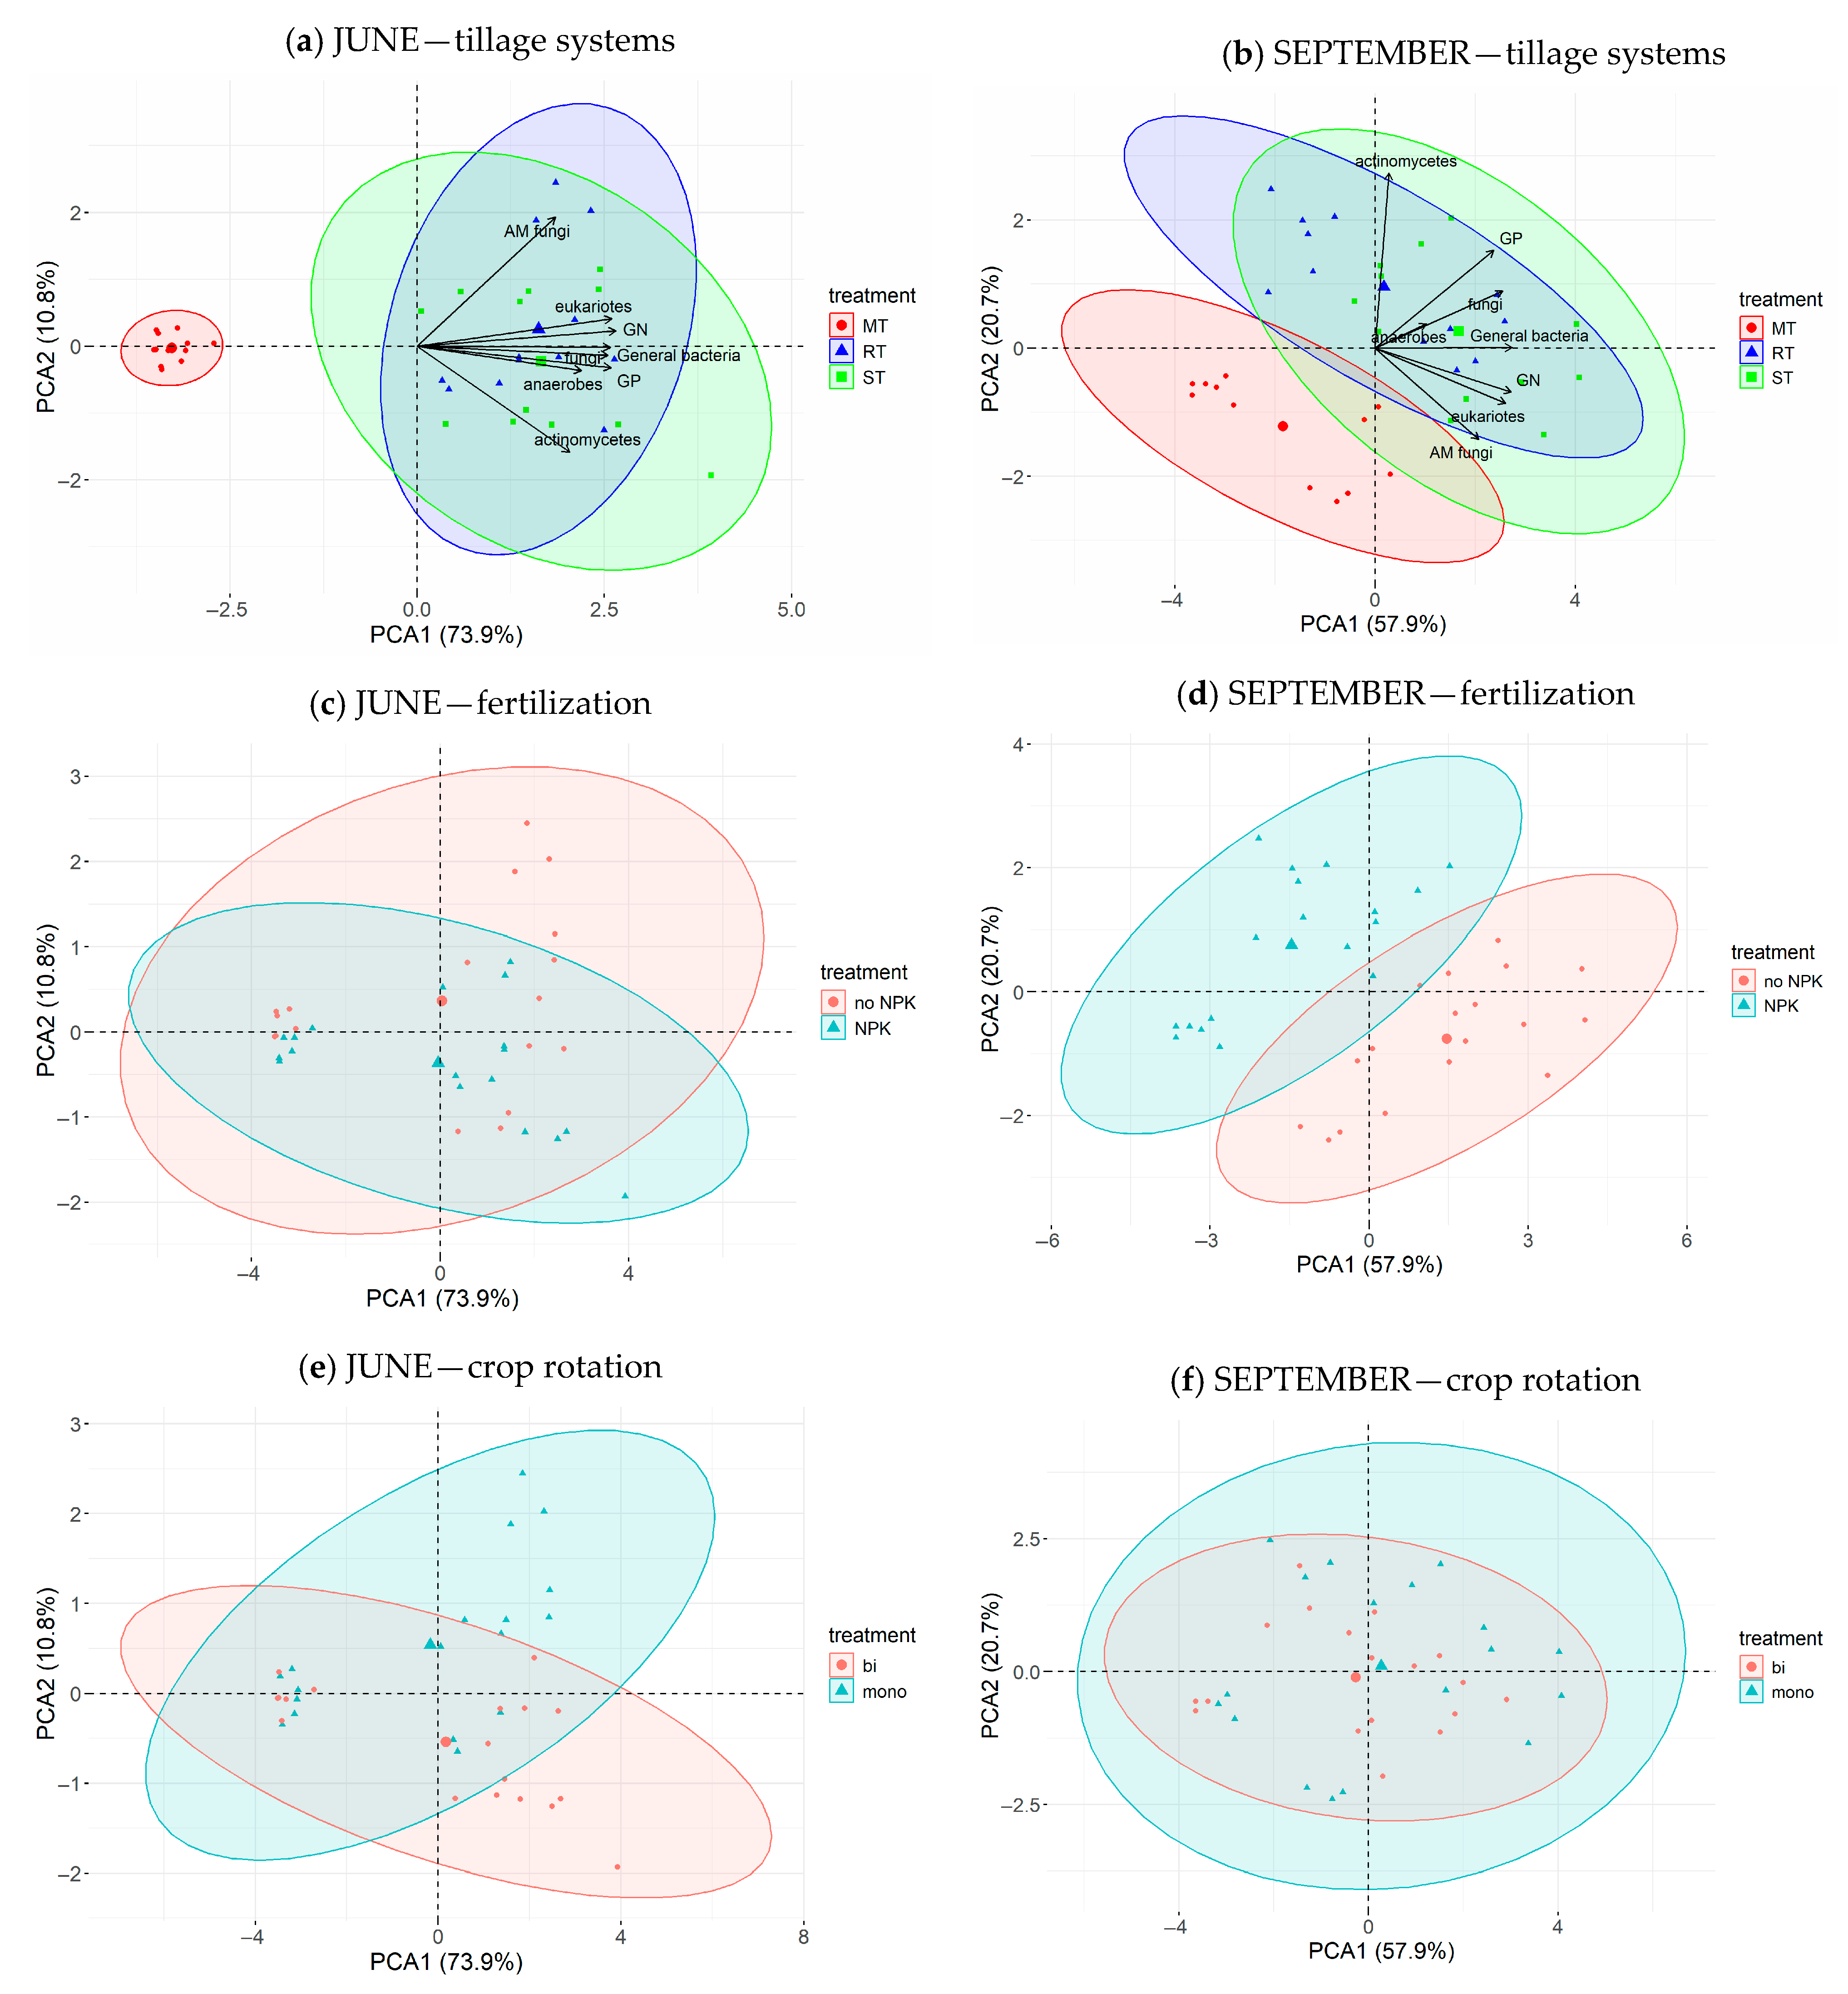
3.2.5. The Results of PCA and RDA

June: The first principal component (PCA1) explains 73.9% of the total variance, while the second principal component (PCA2) accounts for an additional 10.8%, together explaining 84.7% of the total variability in the microbial community data. The vectors in the biplot represent different microbial groups and their contributions to PCA1 and PCA2. The vectors of GN, GP, general bacteria, fungi, eukaryotes, and anaerobes, which point in the same direction as PCA1, indicate a positive correlation between these microbial groups and PCA1. In contrast, actinomycetes and AM fungi point in different directions along the PCA2 axis, suggesting that PCA2 indicates the abundance of AM fungi and the absence of actinomycetes.
The PERMANOVA analysis revealed that tillage had a significant effect on the microbial community composition (p = 0.001), as shown in the PCA plot (Figure 6a), where the clear separation of the MT ellipse from the RT and ST ellipses indicates a distinct microbial community structure under conventional tillage. In contrast, fertilization had no significant effect on the microbial community composition (p = 0.402), which is consistent with the patterns observed in the PCA plot (Figure 6c). When the microbial communities were grouped by crop rotation (Figure 6e), the ellipses showed considerable overlap, indicating that there was no clear separation between the groups of major components. This observation was confirmed by PERMANOVA tests (p = 0.616).
September: PCA1 captures 57.9% of the total variation in the data, while PCA2 contributes an additional 20.7%. Together, they explain 78.6% of the total diversity of the microbial community structure. In the PCA of the September dataset, it can also be observed that PCA1 is primarily determined by the abundance of GN, GP, general bacteria, fungi, eukaryotes, and anaerobes. However, the vectors representing these microbial groups are more scattered compared to the June data. PCA2 is largely driven by the values associated with actinomycetes, followed by AM fungi. These two groups show opposite trends along the second component, reflecting a negative correlation between them, similar to that observed in June.
In September, the groups corresponding to the different tillage treatments no longer clearly separate along the PCA1 axis alone, but rather on the basis of the combined influence of PCA1 and PCA2. It can still be observed that the microbial community structure in the MT treatment differs from that in the RT and ST treatments (Figure 6b). This distinction is further supported by the PERMANOVA analysis, which revealed a significant effect of tillage on microbial community composition (p = 0.001). When treatments were grouped based on fertilization status, a clear separation emerged: microbial communities in fertilized plots were distinct from those in unfertilized ones (Figure 6d; PERMANOVA, p = 0.001). In contrast, no significant difference was observed between monoculture and biculture systems (PERMANOVA, p = 0.437), indicating a similar community structure. A multifactorial PERMANOVA conducted on the combined dataset (including samples from both June and September) demonstrated that tillage (R2 = 36.8%, p = 0.001), season (R2 = 22.9%, p = 0.001), and fertilization (R2 = 9.3%, p = 0.001) each had a significant influence on microbial community composition. Crop rotation, however, did not exert a statistically significant effect (R2 = 0.4%, p = 0.392). Residual variation accounted for 30.6% of the total variance. In conclusion, the multifactorial PERMANOVA analysis reveals that tillage, followed by season and fertilization, significantly shapes microbial community composition, while crop rotation has less effect.
The redundancy analysis (RDA) diagram (Figure 7) illustrates the relationships between the microbial community composition, sample points, and environmental variables such as the soil moisture content, pHKCl, TN, and SOC. The first RDA axis (RDA1) explained 46.4% of the total variance in microbial community composition, while the second axis (RDA2) contributed a further 2.6%, resulting in a cumulative explained variance of 49.0%. The variable moisture explains 29.1% of the total variance, followed by pH with 16.3%, TN with 2.5%, and SOC with 2.0%.
Sample point distributions were examined across different treatment groups, and the configuration showing the clearest separation was selected for presentation in Figure 7. In this RDA plot, the samples are primarily separated along the first axis (RDA1) according to season: September samples cluster toward the left side of the diagram, aligning more closely with the moisture vector, suggesting a strong seasonal influence on microbial community composition potentially linked to higher soil moisture in September. June samples are distributed toward the right, near the SOC vector, indicating a compositional association with higher soil organic carbon.
The RDA indicates that soil moisture and pH are the most influential environmental gradients shaping the AM fungal community, as evidenced by the strong alignment and proximity of the AM fungi vector with these environmental variables. GN bacteria exhibit a similar, though less pronounced, association, suggesting a moderate response to changes in pH and moisture. In contrast, the vectors representing total nitrogen (TN) and soil organic carbon (SOC) show little directional alignment with AM fungi, implying a weaker relationship. Other microbial groups, including GP bacteria, fungi, actinomycetes, eukaryotes, and general bacteria, cluster closer to the origin, suggesting a less differentiated response to the measured environmental variables. Some of these groups appear weakly aligned with SOC and TN, indicating a potential, albeit limited, positive influence.
Overall, the RDA suggests that soil moisture and pH are the primary environmental drivers shaping the AM fungal and GN bacterial communities, while TN and SOC have a smaller influence on the microbial composition in the analyzed samples.

4. Discussion

4.1. Changes in the Physico-Chemical Parameters of Soil

The higher soil moisture values in September compared to June can be explained by the seasonal fluctuation in precipitation (Table S3). There was no precipitation during the week preceding June sampling, and May was also relatively dry, with a total precipitation of 52 mm. In contrast, a total of 78.1 mm of precipitation was received the week prior to sampling in September.
The long-term acidifying effect observed under NPK fertilization over 31 years is primarily due to the continuous application of MAP (monoammonium phosphate), UAN (urea ammonium nitrate), and KCl (potassium chloride), which are known to contribute to soil acidification [56,57].
Moldboard tillage (MT) plots had significantly lower SOC and NT values than ST and RT plots, as MT disturbs the soil more deeply, exposes organic material to oxygen, and accelerates its decomposition. Thus, conventional tillage (MT) leads to greater losses and a more unstable soil environment, while reduced tillage (RT, ST) contributes to the accumulation of organic matter and nitrogen. The higher SOC values observed in the wheat–corn biculture system compared to the corn monoculture are probably due to the increased root biomass of wheat in the upper soil layer and the more diverse organic inputs, which enhance the accumulation of carbon and nitrogen in the soil [58].

4.2. Changes in Soil Microbial Biomass and Community Composition

Seasonal changes: The total microbial biomass and its community structure were strongly influenced by seasonal changes, with significantly higher biomass observed in September than in June. One possible explanation for this pattern could be the higher soil moisture content in September (Table 2), which probably created more favorable conditions for fungal and bacterial growth. This is further supported by the RDA, which identified soil moisture as the most influential environmental factor shaping the microbial community (Figure 7). Similar results were observed by Fan et al. [59] who investigated the patterns of soil microorganisms and enzymatic activities across various forest types in coastal sandy regions in China. They also attributed the high abundance of bacteria and fungi in September to favorable soil temperature and moisture conditions, which can directly affect the population and number of microorganisms.
In addition to soil moisture, root exudation patterns also influence the microbial community. During summer, corn roots become more extensively developed and release large amounts of secondary metabolites—such as flavonoids, benzoxazinoids, sugars, and phenols—that serve as nutrient sources for soil microbes, thereby promoting microbial growth, nutrient uptake, and enhanced plant–microbe interactions [60].
In our study, the trend of increased microbial abundance in September was particularly pronounced for AM fungi, likely due to their strong dependence on host plant root development and activity, as AM fungi form symbiotic associations with plant roots. However, in early summer (June), root systems are typically less developed, resulting in limited colonization opportunities for AM fungi. By September, more extensive root networks promoted greater AM fungal colonization and biomass accumulation.
In contrast to the fungi and bacteria, actinomycetes showed an opposite trend, with higher abundance observed in June than in September. Similarly to our findings, Fan et al. [59] also observed greater abundance of bacteria, fungi, and the total microbiome in September, while the quantity of actinomycetes was higher in March. According to the authors, this increased presence of actinomycetes in spring may be attributed to their greater resilience to cooler temperatures and fluctuating nutrient availability, which could provide a competitive advantage over other microbial groups during early summer.
Effect of fertilization: Long-term application of NPK fertilizers resulted in a reduction in total microbial biomass compared to the control, with a more pronounced effect observed in September (Figure 3). One possible explanation for this trend is that the 31 years of continuous NPK fertilizer application (N160:P26:K74 kg/ha), combined with the 0% CaCO3 content in the topsoil, have contributed to soil acidification, resulting in a decrease in soil pH by nearly one unit (to 4.1–4.8) compared to the control (Table 2). According to Rousk et al. [61], soil pH is a major influencing factor of the soil microbial community. Based on their results, when pH was below pH:4.5, both plant yield and all microbial parameters decreased. In addition to soil pH, long-term NPK fertilization may have effects on microbial biomass by altering nutrient ratios and introducing ionic imbalances, such as excessive nitrate, ammonium, and chloride, which stress microbial communities. Similarly, elevated soil electrical conductivity from accumulated salts further contributes to osmotic stress, compounding the negative effects on microbial activity and diversity [43,62]. Although NPK fertilizers supply essential nutrients to plants, they also introduce not only cations but anions like chloride, which may accumulate in the soil over time. This accumulation can lead to increased soil salinity and electrical conductivity, contributing to osmotic stress and negatively affecting microbial activity and diversity. Zhang et al. [63] observed that chloride ions (Cl) had a markedly negative impact on soil microbial biomass and enzyme activity, underscoring the particular sensitivity of the soil microbiome to Cl-induced salinity stress.
In addition to the decline in total microbial biomass, the composition of the microbial community also changed in response to fertilization, with the most pronounced reduction observed in AM fungi, followed by GN bacteria. The decline in AM fungi may be attributed not only to the decrease in pH but also to the increased nutrient availability. The main role of AM fungi is to supply phosphorus and other nutrients to plants. If phosphorus is readily available in the soil (e.g., due to fertilization), the plant no longer requires the association with the fungi, which leads to a decrease in colonization. Similarly to our findings, Toledo et al. [64] also found similar trends in their study examining the effects of mineral fertilization on microbial biomass in semiarid grasslands of Argentina, where AM fungal root colonization was lower in NPK fertilized plots than in control. Moreover, NPK fertilization led to a more pronounced decline in the abundance of GN bacteria compared to GP bacteria. This may be due to the thicker peptidoglycan cell wall of GP bacteria, which makes them more resistant to environmental stresses [65].
Effect of tillage practices: Higher soil microbial biomass was measured in the reduced tillage plots (RT and ST) compared to the intensively managed MT plots (Figure 3), suggesting that reduced tillage practices are more favorable to soil microbial communities. This positive effect may also be attributed to the higher SOM content associated with reduced tillage systems. Li et al. [66], Gu et al. [67], and de la Cruz-Ortiz et al. [68], have consistently shown that conservation tillage practices are more beneficial to soil microbes than conventional plow tillage. The benefits from conservation tillage practices are attributed to reduced soil disturbance, which helps to preserve organic matter and soil structure [69].
It was observed that soil management systems with varying tillage intensities altered not only the total microbial biomass but also the community composition (Figure 6a,b). In the plots with MT, both fungal and bacterial abundances were significantly reduced compared to RT and ST; however, the increase in the B/F ratio indicated that fungal abundance declined more markedly than bacterial abundance (Figure 3). Our results are consistent with the findings of Malik et al. [70], who reported that intensively managed soils exhibit higher bacteria-to-fungi biomass ratios compared to more extensively managed systems. According to the authors [70], this may be due to factors such as frequent tillage, high fertilization rates, and a lower soil C/N ratio, all of which tend to favor bacterial dominance over fungi.
Effect of crop rotation: The influence of crop rotation on microbial biomass was generally less pronounced than other agrotechnical factors. An exception was observed in the control plots under the MT system measured in September, where microbial biomass was higher in the biculture than in the monoculture cropping system. This result suggests that in these plots, biculture may have provided more favorable conditions for the soil microbiome, likely due to increased plant diversity. Different plant species release a greater variety of root exudates, which supports a more diverse and abundant soil microbial community. Wheat has a higher root biomass in the upper soil layers, which contributes more organic substrates through root exudates and residue inputs that support greater microbial growth and biomass in the bulk soil [71].
Moreover, the higher soil organic carbon (SOC) values measured in the biculture system further indicate an accumulation of organic matter that can sustain a richer microbial community. Li et al. [72] also demonstrated that intercropping improves soil fertility and microbial dynamics through complementary plant interactions and increased biomass return.
However, this beneficial effect was not observed under the RT and ST systems. In these reduced tillage systems, the less disturbed soil structure and greater microbial resilience may have masked any potential response to cropping diversity. In terms of microbial composition, the most pronounced difference between the two cropping systems was observed in the relative abundance of AM fungi, particularly in the control plots in September (Figure 4). The AM fungal biomass and its relative ratio was significantly higher in control plots of biculture system compared to monoculture plots. This may be because in the absence of NPK fertilization, beneficial plant–fungal interactions were not suppressed and could respond more positively to increased plant diversity.

5. Conclusions

Our findings confirm the hypothesis that different agrotechnical practices (31 years of NPK fertilization, intensive (MT) and reduced tillages (ST, RT) and crop rotation) influence the physico-chemical and microbiological properties of Chernozem soil under corn cultivation.
Seasonal changes caused high differences in microbial biomass and community composition. One possible reason for the increase in total microbial biomass was the higher soil moisture content in September (17 w/w%) compared to June (10.9 w/w%), which enhanced microbial growth—up to 270% in the unfertilized control and 135% in the NPK-treated plots. The largest seasonal increase was observed in AM fungi, whose biomass increased approximately twentyfold in the control plots and fivefold in the NPK-treated plots from June to September. In contrast, actinomycetes showed an opposite trend, with higher abundance observed in June than in September.
Reduced tillage systems, particularly strip tillage (ST), which also showed higher soil organic carbon (SOC) and total nitrogen (TN) content, supported significantly greater microbial biomass and promoting AM fungi than intensive tillage (MT). In June, the microbial biomass in the ST plots was 290% higher than in the MT plots, while in September it remained elevated at 182% of the MT level. Additionally, intensive tillage (MT) exhibited higher bacteria-to-fungi ratios than RT and ST, indicating greater fungal sensitivity to soil disturbance.
The long-term application of NPK fertilizers (160 kg N/ha; 26 kg P/ha; 74 kg K/ha) over 31 years lowered the pH of the chernozem soil by approximately one unit, reaching values between 4.1 and 4.8. NPK fertilization reduced microbial biomass by an average of 2% in June and 48% in September compared to the control, with the most pronounced decrease observed in arbuscular mycorrhizal (AM) fungi among all measured microbial groups.
Cropping system (corn monoculture vs. wheat–corn biculture) had a generally smaller impact on microbial biomass than other agrotechnical factors, but some benefit of biculture was observed. In some cases, higher SOC and TN were observed in the biculture cropping system compared to monoculture. Increased microbial biomass was measured in control plots with MT, particularly measured in September; however, this effect was not observed under reduced tillage systems (RT and ST), where better soil conditions may have buffered the impact of crop rotation. The most notable difference in microbial composition between two cropping systems was seen in the biomass of AM fungi, which responded positively to biculture in the absence of fertilization, especially in September.
These results underline the critical need for adopting sustainable soil management practices that maintain microbial diversity and activity, mitigate acidification, and support long-term fertility. Based on our results, we propose the following recommendations for agronomic practice on Chernozem soil:
  • Reduced tillage systems, particularly ST, should be adopted to enhance microbial stability and promote beneficial fungal groups such as arbuscular mycorrhizal fungi, thereby providing effective soil health conservation.
  • The long-term use of NPK (N: 160; P: 26; K: 74 kg/ha) fertilizers should be carefully managed due to their acidifying effect and negative impact on microbial biomass.
  • Crop diversification is advisable to improve microbial balance and soil nutrient dynamics.
  • Seasonal variability must be taken into account when assessing soil health, as microbial biomass and community structure showed pronounced seasonal variation.

Supplementary Materials

The following supporting information can be downloaded at: https://www.mdpi.com/article/10.3390/agronomy15081887/s1. Table S1: The effect of crop rotation on soil moisture content, pHKCl, SOC and TN; Table S2: The effect of crop rotation on microbial composition; Table S3: Daily precipitation (in mm) in Latókép from January to September 2023.

Author Contributions

Conceptualization, A.B.K. and R.K.; data curation, A.B.K. and Á.B.; formal analysis, E.K.J. and Á.B.; investigation, I.K. and A.T.; methodology, A.B.K. and T.N.; software, M.T. and R.K.; writing—original draft, R.K., C.G. and A.B.K.; writing—review and editing, E.K.J. and A.S. All authors have read and agreed to the published version of the manuscript.

Funding

This research received no external funding.

Data Availability Statement

The original contributions presented in this study are included in the article/Supplementary Material. Further inquiries can be directed to the corresponding author(s).

Acknowledgments

Preparation of the paper was supported by the University of Debrecen Program for Scientific Publication.

Conflicts of Interest

The authors declare no conflicts of interest. The funders had no role in the design of the study; in the collection, analyses or interpretation of the data; in the writing of the manuscript; or in the decision to publish the results.

Abbreviations

MTmoldboard tillage
RTripped tillage
STstrip tillage
SOCsoil organic carbon
TNtotal nitrogen
PLFAphospholipid fatty acid
AMarbuscular mycorrhizal
NPKnitrogen, phorphorus, potassium
DNAdeoxyribonucleic acid
NTno-till
IUSS WG WRBInternational Union of Soil Sciences, Working Group, World Reference Base for Soil Resources
CANcalcium–ammonium–nitrate
MAPmonoammonium–phosphate
KClpotassium chloride
UANurea–ammonium–nitrate
FIDflame ionization detector
K2HPO4dipotassium phosphate
GPGram-positive bacteria
GNGram-negative bacteria
Ffungi
Btotal bacteria
B/Fthe ratio of total bacteria to total fungi
GP/GNthe ratio of Gram-positive to Gram-negative bacteria
SEMstandard error of the mean
Till.tillage
Crop r.crop rotation
n.s.non-significant
PCAprincipal component analysis
RDAredundancy analysis
C/Nratio of carbon to nitrogen

References

  1. Karlen, D.L.; Veum, K.S.; Sudduth, K.A.; Obrycki, J.F.; Nunes, M.R. Soil health assessment: Past accomplishments, current activities, and future opportunities. Soil Tillage Res. 2019, 195, 104365. [Google Scholar] [CrossRef]
  2. Almási, C.; Orosz, V.; Tóth, T.; Mansour, M.M.; Demeter, I.; Henzsel, I.; Bogdányi, Z.; Szegi, T.A.; Makádi, M. Effects of Sewage Sludge Compost on Carbon, Nitrogen, Phosphorus, and Sulfur Ratios and Soil Enzyme Activities in a Long-Term Experiment. Agronomy 2025, 15, 143. [Google Scholar] [CrossRef]
  3. Abdu, A.; Laekemariam, F.; Gidago, G.; Getaneh, L. Explaining the soil quality using different assessment techniques. Appl. Environ. Soil Sci. 2023, 2023, 6699154. [Google Scholar] [CrossRef]
  4. Şeker, C.; Özaytekin, H.H.; Negiş, H.; Gümüş, İ.; Dedeoğlu, M.; Atmaca, E.; Karaca, Ü. Identification of regional soil quality factors and indicators: A case study on an alluvial plain (central Turkey). Solid. Earth 2017, 8, 583–595. [Google Scholar] [CrossRef]
  5. Cardoso, E.J.B.N.; Vasconcellos, R.L.F.; Bini, D.; Miyauchi, M.Y.H.; Santos, C.A.d.; Alves, P.R.L.; Paula, A.M.d.; Nakatani, A.S.; Pereira, J.d.M.; Nogueira, M.A. Soil health: Looking for suitable indicators. What should be considered to assess the effects of use and management on soil health? Sci. Agric. 2013, 70, 274–289. [Google Scholar] [CrossRef]
  6. Schloter, M.; Nannipieri, P.; Sørensen, S.J.; van Elsas, J.D. Microbial indicators for soil quality. Biol. Fertil. Soils 2018, 54, 1–10. [Google Scholar] [CrossRef]
  7. Csontos, P.; Mucsi, M.; Ragályi, P.; Tamás, J.; Kalapos, T.; Pápay, G.; Mjazovszky, Á.; Penksza, K.; Szili-Kovács, T. Standing vegetation exceeds soil microbial communities in soil type indication: A procrustes test of four salt-affected pastures. Agronomy 2021, 11, 1652. [Google Scholar] [CrossRef]
  8. Allen, D.E.; Singh, B.P.; Dalal, R.C. Soil health indicators under climate change: A review of current knowledge. In Soil Health and Climate Change. Soil Biology; Singh, B., Cowie, A., Chan, K., Eds.; Springer: Berlin/Heidelberg, Germany, 2011; Volume 29, pp. 25–45. [Google Scholar] [CrossRef]
  9. Willers, C.; Jansen van Rensburg, P.J.; Claassens, S. Phospholipid fatty acid profiling of microbial communities–a review of interpretations and recent applications. J. Appl. Microbiol. 2015, 119, 1207–1218. [Google Scholar] [CrossRef] [PubMed]
  10. Chen, H.; Zhao, X.; Lin, Q.; Li, G.; Kong, W. Using a combination of PLFA and DNA-based sequencing analyses to detect shifts in the soil microbial community composition after a simulated spring precipitation in a semi-arid grassland in China. Sci. Total Environ. 2019, 657, 1237–1245. [Google Scholar] [CrossRef]
  11. Shiferaw, B.; Prasanna, B.M.; Hellin, J.; Bänziger, M. Crops that feed the world 6. Past successes and future challenges to the role played by maize in global food security. Food Secur. 2011, 3, 307–327. [Google Scholar] [CrossRef]
  12. Mizik, T.; Rádai, Z. The Significance of the Hungarian Maize Production in Relation to the Common Agricultural Policy. Rev. Agric. Rural Dev. 2021, 10, 44–51. [Google Scholar] [CrossRef]
  13. Ibáñez, J.; Pérez-Gómez, R.; Martínez, F.S.J. The spatial distribution of soils across Europe: A fractal approach. Ecol. Complex. 2009, 6, 294–301. [Google Scholar] [CrossRef]
  14. Domnariu, H.; Trippe, K.M.; Botez, F.; Partal, E.; Postolache, C. Long-term impact of tillage on microbial communities of an Eastern European Chernozem. Sci. Rep. 2025, 15, 642. [Google Scholar] [CrossRef]
  15. Fageria, N. The Role of Soil Organic Matter in Maintaining Sustainability of Cropping Systems. Commun. Soil Sci. Plant Anal. 2012, 43, 2063–2113. [Google Scholar] [CrossRef]
  16. Jakab, G.; Madarász, B.; Masoudi, M.; Karlik, M.; Király, C.; Zacháry, D.; Filep, T.; Dekemati, I.; Centeri, C.; Al-Graiti, T.; et al. Soil organic matter gain by reduced tillage intensity: Storage, pools, and chemical composition. Soil Tillage Res. 2023, 226, 105584. [Google Scholar] [CrossRef]
  17. Kurganova, I.N.; de Gerenyu, V.O.L.; Smolentseva, E.N.; Semenova, M.P.; Lichko, V.I.; Smolentsev, B.A. Influence of Land Use on the Physical Properties of Chernozems in the Forest-Steppe Zone of Western Siberia. Eurasian Soil Sci. 2021, 54, 1337–1349. [Google Scholar] [CrossRef]
  18. Labaz, B.; Kowalska, J.B.; Kabala, C.; Kobierski, M.; Waroszewski, J.; Dudek, M.; Szopka, K.; Gruszka, D. Distribution and Pools of Soil Organic Carbon in Chernozemic Soils Impacted by Intensive Farming and Erosion in the Loess Plateau in South-East Poland. Agronomy 2024, 14, 2544. [Google Scholar] [CrossRef]
  19. Dupraz, P.; Guyomard, H. Environment and Climate in the Common Agricultural Policy. EuroChoices 2019, 18, 18–25. [Google Scholar] [CrossRef]
  20. Priori, S.; Zanini, M.; Falcioni, V.; Casa, R. Topsoil vertical gradient in different tillage systems: An analytical review. Soil Tillage Res. 2024, 236, 105947. [Google Scholar] [CrossRef]
  21. Galka, B.; Kabala, C.; Karczewska, A.; Sowinski, J.; Jakubiec, J. Variability of soil properties in an intensively cultivated experimental field. Soil Sci. Annu. 2016, 67, 10. [Google Scholar] [CrossRef]
  22. Breza-Boruta, B.; Kotwica, K.; Bauza-Kaszewska, J. Effect of Tillage System and Organic Matter Management Interactions on Soil Chemical Properties and Biological Activity in a Spring Wheat Short-Time Cultivation. Energies 2021, 14, 7451. [Google Scholar] [CrossRef]
  23. Khangura, R.; Ferris, D.; Wagg, C.; Bowyer, J. Regenerative Agriculture—A Literature Review on the Practices and Mechanisms Used to Improve Soil Health. Sustainability 2023, 15, 2338. [Google Scholar] [CrossRef]
  24. Rhodes, C.J. The Imperative for Regenerative Agriculture. Sci. Prog. 2017, 100, 80–129. [Google Scholar] [CrossRef]
  25. Jat, M.L.; Dagar, J.C.; Sapkota, T.B.; Govaerts, B.; Ridaura, S.; Saharawat, Y.S.; Sharma, R.K.; Tetarwal, J.; Jat, R.K.; Hobbs, H. Climate change and agriculture: Adaptation strategies and mitigation opportunities for food security in South Asia and Latin America. Adv. Agron. 2016, 137, 127–235. [Google Scholar] [CrossRef]
  26. Haddaway, N.R.; Hedlund, K.; Jackson, L.E.; Kätterer, T.; Lugato, E.; Thomsen, I.K.; Jørgensen, H.B.; Isberg, P.-E. How does tillage intensity affect soil organic carbon? A systematic review. Environ. Evid. 2017, 6, 30. [Google Scholar] [CrossRef]
  27. Govednik, A.; Potočnik, Ž.; Eler, K.; Suhadolc, M. Combined effects of long-term tillage and fertilisation regimes on soil organic carbon, microbial biomass, and abundance of the total microbial communities and N-functional guilds. Appl. Soil Ecol. 2023, 188, 104876. [Google Scholar] [CrossRef]
  28. Srour, A.Y.; Ammar, H.A.; Subedi, A.; Pimentel, M.; Cook, R.L.; Bond, J.; Fakhoury, A.M. Microbial communities associated with long-term tillage and fertility treatments in a corn-soybean cropping system. Front. Microbiol. 2020, 11, 1363. [Google Scholar] [CrossRef]
  29. Lampurlanés, J.; Cantero-Martínez, C. Soil Bulk Density and Penetration Resistance under Different Tillage and Crop Management Systems and Their Relationship with Barley Root Growth. Agron. J. 2003, 95, 526–536. [Google Scholar] [CrossRef]
  30. Romaneckas, K.; Kimbirauskienė, R.; Sinkevičienė, A. Impact of Tillage Intensity on Planosol Bulk Density, Pore Size Distribution, and Water Capacity in Faba Bean Cultivation. Agronomy 2022, 12, 2311. [Google Scholar] [CrossRef]
  31. Tamm, K.; Nugis, E.; Edesi, L.; Lauringson, E.; Talgre, L.; Viil, P.; Plakk, T.; Võsa, T.; Vettik, R.; Penu, P. Impact of cultivation method on the soil properties in cereal production. Agron. Res. 2016, 14, 280–289. [Google Scholar]
  32. Dadalto, J.P.; Fernandes, H.C.; Teixeira, M.M.; Cecon, P.R.; Matos, A.T.d. Tilage influence on soil microbial activity. Eng. Agrícola 2015, 35, 506–513. [Google Scholar] [CrossRef]
  33. Vilkiene, M.; Mockeviciene, I.; Karcauskiene, D.; Suproniene, S.; Doyeni, M.O.; Ambrazaitiene, D. Biological indicators of soil quality under different tillage systems in retisol. Sustainability 2021, 13, 9624. [Google Scholar] [CrossRef]
  34. Marschner, P.; Crowley, D.; Yang, C.H. Development of specific rhizosphere bacterial communities in relation to plant species, nutrition and soil type. Plant Soil 2004, 261, 199–208. [Google Scholar] [CrossRef]
  35. Brooker, R.W.; Bennett, A.E.; Cong, W.F.; Daniell, T.J.; George, T.S.; Hallett, P.D.; Hawes, C.; Iannetta, P.P.; Jones, H.G.; Karley, A.J. Improving intercropping: A synthesis of research in agronomy, plant physiology and ecology. New Phytol. 2015, 206, 107–117. [Google Scholar] [CrossRef]
  36. Jiao, Y.; Yuan, L. Positive effects of increasing crop diversity in land use on soil microbial biomass, enzyme activity and bacterial community composition. Soil Res. 2019, 57, 779–787. [Google Scholar] [CrossRef]
  37. Liu, Q.; Zhao, Y.; Li, T.; Chen, L.; Chen, Y.; Sui, P. Changes in soil microbial biomass, diversity, and activity with crop rotation in cropping systems: A global synthesis. Appl. Soil Ecol. 2023, 186, 104815. [Google Scholar] [CrossRef]
  38. Gałązka, A.; Gawryjołek, K.; Grządziel, J.; Księżak, J. Effect of different agricultural management practices on soil biological parameters including glomalin fraction. Plant Soil Environ. 2017, 63, 300–306. [Google Scholar] [CrossRef]
  39. Dóka Fülöp, P.P. Role of watersupply in monoculture maize (Zea mays L.) production. Cereal Res. Commun. 2007, 35, 353–356. [Google Scholar] [CrossRef]
  40. Dincă, L.C.; Grenni, P.; Onet, C.; Onet, A. Fertilization and Soil Microbial Community: A Review. Appl. Sci. 2022, 12, 1198. [Google Scholar] [CrossRef]
  41. Guo, Z.; Wan, S.; Hua, K.; Yin, Y.; Chu, H.; Wang, D.; Guo, X. Fertilization regime has a greater effect on soil microbial community structure than crop rotation and growth stage in an agroecosystem. Appl. Soil Ecol. 2020, 149, 103510. [Google Scholar] [CrossRef]
  42. Li, W.; Xie, L.; Zhao, C.; Hu, X.; Yin, C. Nitrogen Fertilization Increases Soil Microbial Biomass and Alters Microbial Composition Especially Under Low Soil Water Availability. Microb. Ecol. 2023, 86, 536–548. [Google Scholar] [CrossRef]
  43. Geisseler, D.; Scow, K.M. Long-term effects of mineral fertilizers on soil microorganisms—A review. Soil Biol. Biochem. 2014, 75, 54–63. [Google Scholar] [CrossRef]
  44. Esperschütz, J.; Gattinger, A.; Mäder, P.; Schloter, M.; Fließbach, A. Response of soil microbial biomass and community structures to conventional and organic farming systems under identical crop rotations. FEMS Microbiol. Ecol. 2007, 61, 26–37. [Google Scholar] [CrossRef] [PubMed]
  45. Liu, J.; Liu, M.; Wu, M.; Jiang, C.; Chen, X.; Cai, Z.; Wang, B.; Zhang, J.; Zhang, T.; Li, Z. Soil pH rather than nutrients drive changes in microbial community following long-term fertilization in acidic Ultisols of southern China. J. Soils Sediments 2018, 18, 1853–1864. [Google Scholar] [CrossRef]
  46. Balla Kovács, A.; Juhász, E.K.; Béni, Á.; Kincses, I.; Tállai, M.; Sándor, Z.; Kátai, J.; Rátonyi, T.; Kremper, R. Changes in Microbial Community and Activity of Chernozem Soil under Different Management Systems in a Long-Term Field Experiment in Hungary. Agronomy 2024, 14, 745. [Google Scholar] [CrossRef]
  47. Luo, P.; Han, X.; Wang, Y.; Han, M.; Shi, H.; Liu, N.; Bai, H. Influence of long-term fertilization on soil microbial biomass, dehydrogenase activity, and bacterial and fungal community structure in a brown soil of northeast China. Ann. Microbiol. 2015, 65, 533–542. [Google Scholar] [CrossRef]
  48. IUSS Working Group WRB. World reference base for soil resources. World Soil Resour. Rep. 2006, 103, 1–128. [Google Scholar]
  49. Ellis, S.; Ritz, K. A modified high-throughput analysis of PLFAs in soil. MethodsX 2018, 5, 1491–1497. [Google Scholar] [CrossRef]
  50. Frostegård, Å.; Tunlid, A.; Bååth, E. Phospholipid fatty acid composition, biomass, and activity of microbial communities from two soil types experimentally exposed to different heavy metals. Appl. Environ. Microbiol. 1993, 59, 3605–3617. [Google Scholar] [CrossRef]
  51. Frostegård, A.; Bååth, E. The use of phospholipid fatty acid analysis to estimate bacterial and fungal biomass in soil. Biol. Fertil. Soils 1996, 22, 59–65. [Google Scholar] [CrossRef]
  52. Zelles, L. Fatty acid patterns of phospholipids and lipopolysaccharides in the characterisation of microbial communities in soil: A review. Biol. Fertil. Soils 1999, 29, 111–129. [Google Scholar] [CrossRef]
  53. Kujur, M.; Patel, A.K. PLFA Profiling of soil microbial community structure and diversity in different dry tropical ecosystems of Jharkhand. Int. J. Curr. Microbiol. App. Sci. 2014, 3, 556–575. [Google Scholar]
  54. Gude, A.; Kandeler, E.; Gleixner, G. Input related microbial carbon dynamic of soil organic matter in particle size fractions. Soil Biol. Biochem. 2012, 47, 209–219. [Google Scholar] [CrossRef]
  55. Bach, E.M.; Baer, S.G.; Meyer, C.K.; Six, J. Soil texture affects soil microbial and structural recovery during grassland restoration. Soil Biol. Biochem. 2010, 42, 2182–2191. [Google Scholar] [CrossRef]
  56. Kádár, I.; Ragályi, P.; Murányi, A.; Radimszky, L.; Gajdó, A. Effect of Gérce alginit on the fertility of an acid sandy soil. Agrokémia és Talajt. Agrokem. 2015, 64, 437–452. [Google Scholar] [CrossRef]
  57. Havlin, J.L.; Tisdale, S.L.; Nelson, W.L.; Beaton, J.D. Soil Fertility and Fertilizers; Pearson Education India: Noida, India, 2016. [Google Scholar]
  58. Lal, R. Soil carbon sequestration impacts on global climate change and food security. Science 2004, 304, 1623–1627. [Google Scholar] [CrossRef]
  59. Fan, L.; Tarin, M.W.K.; Zhang, Y.; Han, Y.; Rong, J.; Cai, X.; Chen, L.; Shi, C.; Zheng, Y. Patterns of soil microorganisms and enzymatic activities of various forest types in coastal sandy land. Glob. Ecol. Conserv. 2021, 28, e01625. [Google Scholar] [CrossRef]
  60. Santangeli, M.; Steininger-Mairinger, T.; Vetterlein, D.; Hann, S.; Oburger, E. Maize (Zea mays L.) root exudation profiles change in quality and quantity during plant development—A field study. Plant Sci. 2024, 338, 111896. [Google Scholar] [CrossRef] [PubMed]
  61. Rousk, J.; Brookes, P.C.; Bååth, E. The microbial PLFA composition as affected by pH in an arable soil. Soil Biol. Biochem. 2010, 42, 516–520. [Google Scholar] [CrossRef]
  62. Sun, R.; Zhang, X.-X.; Guo, X.; Wang, D.; Chu, H. Bacterial diversity in soils subjected to long-term chemical fertilization can be more stably maintained with the addition of livestock manure than wheat straw. Soil Biol. Biochem. 2015, 88, 9–18. [Google Scholar] [CrossRef]
  63. Zhang, Q.; Wakelin, S.A.; Liang, Y.; Chu, G. Soil microbial activity and community structure as affected by exposure to chloride and chloride-sulfate salts. J. Arid. Land. 2018, 10, 737–749. [Google Scholar] [CrossRef]
  64. Toledo, S.; Gargaglione, V.; Peri, P.L. Mineral fertilization impacts microbial activity and endophytic fungi but not microbial biomass in semiarid grasslands. Pedobiologia 2024, 102, 150929. [Google Scholar] [CrossRef]
  65. Schimel, J.; Balser, T.C.; Wallenstein, M. Microbial stress-response physiology and its implications for ecosystem function. Ecology 2007, 88, 1386–1394. [Google Scholar] [CrossRef]
  66. Li, J.; Jia, L.; Struik, P.C.; An, Z.; Wang, Z.; Xu, Z.; Ji, L.; Yao, Y.; Lv, J.; Zhou, T. Plant and soil responses to tillage practices change arbuscular mycorrhizal fungi populations during crop growth. Front. Microbiol. 2024, 15, 1394104. [Google Scholar] [CrossRef]
  67. Gu, S.; Wu, S.; Guan, Y.; Zhai, C.; Zhang, Z.; Bello, A.; Guo, X.; Yang, W. Arbuscular mycorrhizal fungal community was affected by tillage practices rather than residue management in black soil of northeast China. Soil Tillage Res. 2020, 198, 104552. [Google Scholar] [CrossRef]
  68. de la Cruz-Ortiz, Á.V.; Álvarez-Lopeztello, J.; Robles, C.; Hernández-Cuevas, L.V. Tillage intensity reduces the arbuscular mycorrhizal fungi attributes associated with Solanum lycopersicum, in the Tehuantepec Isthmus (Oaxaca), Mexico. Appl. Soil Ecol. 2020, 149, 103519. [Google Scholar] [CrossRef]
  69. Sándor, Z.; Tállai, M.; Kincses, S.; László, Z.; Kátai, J.; Vágó, I. Effect of various soil cultivation methods on some microbial soil properties. DRC Sustain. Future J. Environ. Agric. Energy 2020, 1, 14–20. [Google Scholar] [CrossRef]
  70. Malik, A.A.; Chowdhury, S.; Schlager, V.; Oliver, A.; Puissant, J.; Vazquez, P.G.; Jehmlich, N.; Von Bergen, M.; Griffiths, R.I.; Gleixner, G. Soil fungal: Bacterial ratios are linked to altered carbon cycling. Front. Microbiol. 2016, 7, 1247. [Google Scholar] [CrossRef] [PubMed]
  71. Dakora, F.D.; Phillips, D.A. Root exudates as mediators of mineral acquisition in low-nutrient environments. Plant Soil 2002, 245, 35–47. [Google Scholar] [CrossRef]
  72. Li, L.; Sun, J.; Zhang, F.; Li, X.; Yang, S.; Rengel, Z. Wheat/maize or wheat/soybean strip intercropping I. Yield advantage and interspecific interactions on nutrients. Field Crops Res. 2001, 71, 123–137. [Google Scholar] [CrossRef]
Figure 1. The experimental design (Debrecen-Látókép, 2023) MT: moldboard tillage; RT: ripper tillage; ST: strip tillage; C: control (no fertilization); F: NPK fertilization.
Agronomy 15 01887 g001
Figure 2. Average temperature and monthly precipitation for the 2023 crop year and the values of the 30-year average (Debrecen-Látókép, 2023).
Agronomy 15 01887 g002
Figure 3. Effects of NPK fertilization, crop rotation and tillage systems on soil microbial biomass and community composition (expressed in nmol/g dry soil). Different small letters indicate significant differences between control and NPK treatments; different capital letters indicate significant differences between the tillage systems MT: moldboard tillage; RT: ripper tillage, ST: strip tillage; (A) microbial biomass in June; (B) microbial biomass in Sept.; (C) fungi in June; (D) fungi in Sept.; (E) AM fungi in June; (F) AM fungi in Sept.; (G) GN bacteria in June; (H) GN bacteria in Sept.; (I) GP bacteria in June; (J) GP bacteria in Sept.; (K) actinomycetes in June; (L) actinomycetes in Sept.
Agronomy 15 01887 g003
Figure 4. Effect of NPK fertilization, crop rotation and tillage systems on the ratios of bacteria/fungi and Gram-positive/Gram-negative bacteria (GP/GN). Different small letters indicate significant differences between control and NPK treatments; different capital letters indicate significant differences between the tillage systems. MT: moldboard tillage; RT: ripper tillage, ST: strip tillage; (A) B/F ratio in June; (B) B/F ratio in Sept.; (C) GP/GN in June; (D) GP/GN in Sept.
Agronomy 15 01887 g004
Figure 5. Relative abundance of microbial groups in mono- and biculture systems in June and September: (A) monoculture, June; (B) monoculture, September; (C) biculture, June; (D) biculture, September.
Agronomy 15 01887 g005
Figure 6. Principal component analysis (PCA) of microbial community structure grouped by tillage system, NPK fertilization, and crop rotation.
Agronomy 15 01887 g006
Figure 7. Redundancy a\nalysis (RDA) of microbial community structure in relation to environmental factors related to combined data from June and September. TN = total nitrogen; SOC = soil organic carbon; GN = Gram-negative bacteria; GP = Gram-positive bacteria; AM fungi = arbuscular mycorrhizal fungi; euk. = eukaryotes; act. = actinomycetes.
Agronomy 15 01887 g007
Table 1. Effect of tillage, NPK fertilization, and crop rotation and their interactions on soil physico-chemical parameters.
TreatmentSoil Physico-Chemical Parameters
JuneSeptember
Moisture
Content
pHKClSOCTNMoisture
Content
pHKClSOCTN
Tillage0.396 n.s0.001 ***0.000 ***0.000 ***0.000 ***0.000 ***0.000 ***0.000 ***
NPK0.151 n.s0.000 ***0.255 n.s0.827 n.s0.007 *0.000 ***0.000 ***0.294 n.s
Crop rotation0.304 n.s 0.07 n.s0.000 ***0.000 ***0.032 *0.028 *0.000 ***0.000 ***
NPK × till.0.744 n.s0.539 n.s0.001 ***0.007 *0.000 ***0.433 n.s0.000 ***0.302 n.s
Crop r.× till.0.160 n.s0.607 n.s0.080 n.s0.07 n.s0.113 n.s0.572 n.s0.037 n.s0.017 n.s
Crop r. × NPK0.192 n.s0.368 n.s0.216 n.s0.007 *0.014 *0.447 n.s0.061 n.s0.524 n.s
Crop r.× NPK × Till0.777 n.s0.684 n.s0.093 n.s0.084 n.s0.592 n.s0.488 n.s0.138 n.s0.126 n.s
* p ≤ 0.05; *** p ≤ 0.001; n.s: non-significant; SOC: soil organic carbon; TN: total nitrogen; till. = tillage; Crop r. = crop rotation (monoculture, biculture).
Table 2. The effect of NPK fertilization and tillage systems on soil moisture content, pHKCl, SOC, and TN.
MonocultureBiculture
ControlNPKControlNPK
Moisture content % (June)
MT12.3 ± 0.8 aA11.4 ± 1.4 aA11.7 ± 0.9 aA10.3 ± 2.4 aA
RT9.6 ± 0.9 aA10.6 ± 3.3 aA11.7 ± 0.9 aA10.1 ± 3.3 aA
ST10.6 ± 3.1 aA10.1 ± 2.3 aA13.4 ± 0.4 aB11.3 ± 2.2 aA
Moisture content % (September)
MT15.5 ± 0.4 aA16.5 ± 0.5 aA16.2 ± 1.9 aAB16.3 ± 0.5 aA
RT18.5 ± 1.8 aB18.3 ± 0.7 aAB18.0 ± 0.6 aB16.6 ± 0.5 aA
ST15.1 ± 0.8 aA18.9 ± 1.2 aB15.2 ± 1.1 aA16.8 ± 0.4 aA
pHKCl (June)
MT5.4 ± 0.4 bA4.6 ± 0.1 aA5.3 ± 0.5 bA4.6 ± 0.2 aB
RT4.9 ± 0.1 bA4.4 ± 0.2 aA4.9 ± 0.5 bA4.1 ± 0.2 aA
ST5.4 ± 0.4 bA4.6 ± 0.2 aA5.2 ± 0.4 bA4.3 ± 0.1 aB
pHKCl (September)
MT5.5 ± 0.2 bB4.8 ± 0.1 aB5.2 ± 0.4 bA4.5 ± 0.2 aA
RT4.9 ± 0.3 bA4.4 ± 0.3 aA4.7 ± 0.1 bA4.2 ± 0.4 aA
ST5.4 ± 0.3 bB4.6 ± 0.2 aAB5.1 ± 0.5 bA4.7 ± 0.2 aA
SOC % (June)
MT1.8 ± 0.2 aA1.7 ± 0.1 aA2.0 ± 0.2 aA1.8 ± 0.1 aA
RT1.8 ± 0.1 aA2.0 ± 0.1 aA2.2 ± 0.2 aA2.1 ± 0.2 aB
ST2.0 ± 0.2 aA2.1 ± 0.2 aB2.0 ± 0.1 aA2.2 ± 0.2 aB
SOC % (September)
MT1.7 ± 0.1 aA1.7 ± 0.1 aA1.7 ± 0.1 aA1.8 ± 0.1 aA
RT2.0 ± 0.1 aB2.0 ± 0.1 aB2.3 ± 0.1 aC2.2 ± 0.1 aB
ST1.8 ± 0.2 aAB2.2 ± 0.2 bB2.0 ± 0.1 aB2.3 ± 0.1 bC
TN % (June)
MT0.21 ± 0.02 aA0.19 ± 0.01 aA0.21 ± 0.01 aA0.20 ± 0.01 aA
RT0.20 ± 0.01 aA0.21 ± 0.01 aB0.23 ± 0.02 aA0.22 ± 0.01 aB
ST0.21 ± 0.01 aA0.22 ± 0.01 aB0.22 ± 0.01 aA0.24 ± 0.02 aB
TN% (September)
MT0.19 ± 0.01 aA0.19 ± 0.01 aA0.20 ± 0.01 aA0.20 ± 0.01 aA
RT0.21 ± 0.01 aB0.22 ± 0.01 aB0.24 ± 0.01 aB0.23 ± 0.01 aB
ST0.20 ± 0.02 aAB0.20 ± 0.01 aAB0.23 ± 0.01 aB0.23 ± 0.02 aAB
Different lowercase letters denote significant differences between control and NPK treatments within a row, separated into mono- and bicultures, and different uppercase letters denote significant differences between tillage systems within a column. MT: moldboard tillage; RT: ripper tillage; ST: strip tillage.
Table 3. Results of three-way ANOVA analysis on the effects of tillage, NPK fertilization, and crop rotation and their interactions on the soil microbial biomass and community (June, September 2023).
Independent VariablesMicrobial BiomassFungiAm
Fungi
GN BacteriaGP BacteriaActinomycetes
June
Tillage0.000 ***0.000 ***0.000 ***0.000 ***0.000 ***0.000 ***
NPK fertilization0.042 *0.131 n.s0.000 ***0.000 ***0.001 ***0.506 n.s
Crop rotation0.038 *0.085 n.s0.000 ***0.145 n.s0.129 n.s0.000 ***
NPK × Tillage0.028 *0.004 **0.000 ***0.021 n.s0.274 n.s0.008 *
Crop rotation × NPK0.09 n.s0.051 n.s 0.000 ***0.017 *0.161 n.s0.000 ***
Crop rotation × Tillage0.106 n.s0.227 n.s0.01 *0.149 n.s0.089 n.s0.164 n.s
Crop rot. × NPK × Tillage0.663 n.s0.053 n.s0.066 n.s0.311 n.s0.469 n.s0.006 *
September
Tillage0.000 ***0.000 ***0.000 ***0.000 ***0.000 ***0.000 ***
NPK fertilization0.000 ***0.000 ***0.000 ***0.000 ***0.000 ***0.000 ***
Crop rotation0.011 * 0.000 ***0.000 ***0.003 **0.238 n.s0.359 n.s
NPK × Tillage0.718 n.s0.872 n.s0.007 *0.191 n.s0.003 *0.016 *
Crop rotation × NPK0.027 * 0.030 *0.058 n.s0.415 n.s0.004 *0.001 *
Crop rotation × Tillage0.105 n.s0.452 n.s0.000 ***0.000 ***0.005 *0.024 *
Crop rot. × NPK × Tillage0.022 *0.383 n.s0.190 n.s0.063 n.s0.161 n.s0.547 n.s
* p ≤ 0.05; ** p ≤ 0.01; *** p ≤ 0.001; AM: arbuscular mycorrhizal fungi; GN: Gram-negative bacteria; GP: Gram-positive bacteria; n.s: non-significant.
Disclaimer/Publisher’s Note: The statements, opinions and data contained in all publications are solely those of the individual author(s) and contributor(s) and not of MDPI and/or the editor(s). MDPI and/or the editor(s) disclaim responsibility for any injury to people or property resulting from any ideas, methods, instructions or products referred to in the content.