Article

Grain Dehydration and Grain-Filling Characteristics of Different Maize Varieties in Heilongjiang

1
College of Agriculture, Northeast Agricultural University, Harbin 150030, China
2
Harbin Daoli District Agricultural and Rural Development Service Center, Harbin 150016, China
3
College of Agriculture, Inner Mongolia University for Nationalities, Tongliao 028043, China
4
College of Life Sciences, Northeast Forestry University, Harbin 150069, China
*
Author to whom correspondence should be addressed.
Agronomy 2025, 15(6), 1356; https://doi.org/10.3390/agronomy15061356
Submission received: 16 April 2025 / Revised: 18 May 2025 / Accepted: 27 May 2025 / Published: 31 May 2025

Abstract

To study the grain-filling and dehydration characteristics of maize and their relationships with yield and screen maize varieties with high yield, high quality, and suitability for mechanical harvesting, this study systematically analyzed the grain-filling and dehydration characteristics of eight early-maturing maize varieties (LK17, BN308, KD15, LK19, G806, G723, and CH6, with DMY3 as the control) planted at the 852 Farm in Heilongjiang Province. The results demonstrated the following: (1) The filling rate of all varieties followed a single-peak curve, peaking at 20–25 days after pollination (DAP); BN308 and CH6 exhibited the highest peak filling rates (1.77 g/(100 kernels·d) and 1.67 g/(100 kernels·d), respectively). (2) Dehydration displayed a clear biphasic pattern. The rapid phase, occurring from 13 to 37 days after pollination, revealed a rate of 2.02 to 2.38 (%/d). This was followed by a slower phase after 37 days, in which the rate declined to 0.75 to 1.31 (%/d). LK19 displayed the fastest dehydration rate (0.89 (%/d)) and the lowest harvest moisture content (19.25%). (3) BN308 achieved the highest yield (13,081.58 kg/ha)-15.5% higher than the control. We clarified that the grain-filling parameters are the core driving factors for high-yield maize. Extending the active grain-filling period and increasing the grain-filling rate can significantly boost the yield, and the active grain-filling period has the greatest impact on the yield. Principal component analysis shows that the starch, fat and protein content, together with the grain-filling parameters, jointly affect the comprehensive quality of the varieties, and balanced selection is required.

1. Introduction

Maize is an important grain crop in China, playing a crucial role in agricultural development and farmers’ income growth [1]. Northeast China is a key maize production area, contributing 33% of the country’s maize production [2]. However, maize production in this high-latitude, cold-temperate region faces two critical climatic constraints: insufficient accumulated temperature during grain filling, resulting in poor kernel plumpness; and persistently high grain moisture at harvest (typically >28%), which impedes mechanical harvesting operations. The grain filling and dehydration characteristics are key factors affecting the yield and quality of maize [3,4]. The grain-filling rate and duration ultimately determine grain yield [4,5,6,7]. The grain-filling period is greatly affected by environmental factors such as light, temperature, and moisture. Light can influence the growth and development of maize, the establishment of plant morphology, and the formation of kernels. Research has found that among the various environmental factors affecting the grain-filling period of maize, temperature conditions are indispensable [8]. Maize is prone to high- and low-temperature stress during its growth and development. It is reported that the grain-filling rate decreases when the temperature is below 16 °C. Zhao Fucheng [9] and others believe that high-temperature treatment significantly shortens the grain-filling process, leading to a decrease in sugar content and an increase in starch content.
The dehydration rate of maize kernels is a crucial agronomic trait. It not only affects the moisture content of maize at maturity but also has a significant impact on the efficiency of mechanical harvesting and the storage quality. Previous studies have shown that an insufficient dehydration rate of kernels may lead to mold growth and deterioration of maize during storage, thereby reducing the quality of maize [10,11,12].
In terms of mechanical harvesting, the Chinese national standard stipulates that the kernel breakage rate during mechanical harvesting should be less than 5% [13]. Further research results indicate that there is a close relationship between kernel moisture content and breakage rate. When the kernel moisture content is below 20%, the kernels are hardly damaged during the harvesting process. When the moisture content is between 20% and 35%, although the maize can be harvested, the breakage rate is quite high. This highlights the importance of controlling the moisture content of maize kernels within an appropriate range to improve the quality of mechanical harvesting [14].
This experiment aimed to quantify differences in grain filling and dehydration characteristics among eight early-maturing maize varieties. The study investigated the grain-filling rates and duration periods of each variety to elucidate their grain-filling patterns. By observing temporal changes in kernel moisture content, we identified and delineated rapid and slow phases of the dehydration process. The ultimate objective was to clarify the relationships between grain-filling characteristics, dehydration traits, and final yield.

2. Materials and Methods

2.1. Experimental Design and Site Description

The local predominantly planted spring maize variety (DMY3) in Heilongjiang Province was used as the control group, while seven other early-maturing maize varieties (LK17, BN308, KD15, LK19, G806, G723, CH6) were developed for cultivation. Information about the eight maize varieties is shown in Table 1.
The experiment utilized a randomized block design with eight maize varieties that had three replications with a total of 24 plots. Each plot consisted of 12 rows, with a row length of 18 m, row spacing of 0.65 m, and a planting density of 5000 plants per mu (1 mu = 666.7 m2). Sowing was conducted mechanically on May 21, when the soil temperature at a depth of 5 cm remained at or above 5 °C for five consecutive days. Harvesting took place in October at physiological maturity, respectively.
The experiment was conducted in 2024 at the experimental site of the 852 Farm, which is situated in the eastern humid region of Heilongjiang Province, characterized by a temperate monsoon climate that experiences simultaneous rain and heat. The soil was meadow albic soil (albic subtype), with soybean as the preceding crop, a tillage depth of 25 cm, and medium fertility. The fertilization rate for the experimental field was 87 kg/ha urea, 90 kg/ha diammonium phosphate, and 52.5 kg/ha potassium sulfate. The farm has an average frost-free period of 129 days, an annual sunshine duration of 2233.3 h. The meteorological data, including for the growing season at the 852 Farm, are shown below (Figure 1).
In this study, the tested materials included nationally or provincially approved maize varieties and introduced varieties, comprising eight early-maturing maize varieties planted at the 852 Farm in Heilongjiang Province.

2.2. Determination of Grain Dry Weight and Dehydration-Related Traits

Samples were collected every 6 days starting from the 13th day after pollination (with a 1-day advance or delay permitted in cases of severe weather). Ten ears of maize were randomly selected from each plot, and of these, three standard ears were chosen. The kernels were stripped from the middle part of the ears. Then, we took 100 kernels from each ear and mixed them to form one sample. The fresh weight was recorded, and samples were dried at 105 °C for 30 min and then at 80 °C to a constant weight to calculate the 100-kernel dry weight (g/100 kernels). The grain moisture content was measured at physiological maturity and harvesting stages based on dynamic sampling of grain dry and fresh weights [15,16].
M C P M % = F W P M D W P M F W P M 100
M C H % = F W H D W H F W H   100
D R   % = M C P M M C H t
  • MC: Moisture content.
  • FW: Fresh weight.
  • DW: Dry weight.
  • PM: Physiological maturity.
  • H: Harvest.
  • DR: Dehydration rate.
  • t: Time interval (days).

2.3. Measurement of Grain-Filling Parameters

Using days after pollination as an independent variable and 100-kernel weight as a dependent variable (W), the grain-filling process was simulated using the Richards equation W = A (1 + Be − Ct) − 1/D, using Origin 2021, in accordance with the method of Zhu et al. [17]. The grain-filling rate was calculated as F = AC ∗ Be − Ct/(1 + Be − Ct)(D + 1)/D, where W is the kernel weight (g), A is the final kernel weight (g), t is days after pollination (d), and B, C, D are the regression parameters (B: initial value; C: growth rate; D: shape parameter; when D = 1, the equation becomes the logistic equation). Grain-filling characteristic parameters were calculated according to the formulas (Table 2).

2.4. Yield and Quality Measurement

We selected 5 sampling points. From each point, we randomly collected 100 maize kernels to measure the 100-kernel weight (grams). Additionally, we chose 5 standard ears per sampling point for morphological analysis, recording the average number of rows per ear (rows) and kernels per row (kernels). The moisture content (%) of each sampling point was measured using an LDS-1G grain moisture meter (Shanghai Qingpu Ossis Checking&surveying Instrument Co., Ltd., Shanghai, China), with triplicate measurements per sample. The final moisture value was the average across all 5 sampling points.
Yield per mu (kg) = (Average kernel rows × Average kernels per row × Ears per unit area × 100-kernel weight [g])/100,000 × 667.
Yield per hectare (kg) = Yield per mu × 15
Protein, fat, and starch content were determined using a FOSS near-infrared grain analyzer NIRS DS2500 (Foshua Science and Trade Co., Ltd., Beijing, China). After air-drying maize kernels from each experimental plot, three representative whole-kernel samples per plot were randomly collected. To ensure purity, a soft-bristled brush or a low-power vacuum cleaner was used to carefully remove loose debris and fine contaminants from the sample surfaces. The processed samples were then placed into the analyzer’s sample chamber for testing. Each sample was measured from three replications, with the average value calculated, recorded, and used as the final result.

2.5. Statistical Analysis

All data were analyzed through one-way analysis of variance using SPSS 26.0 software. The significance of differences between treatments was determined using Duncan’s test (p < 0.05). Principal component analysis was performed using SPSS 26.0, and the specific steps were as follows: For the 13 analysis variables (such as T, Rmax, and Wmax), the suitability of the data for PCA was verified by combining the KMO test (>0.7) and Bartlett’s test of sphericity (p < 0.001). Components were extracted based on the correlation coefficient matrix, and the principal components with eigenvalues >1 were retained. The Varimax orthogonal rotation was used to generate the rotated component matrix, which improved the interpretability of the components for subsequent analysis.

3. Results

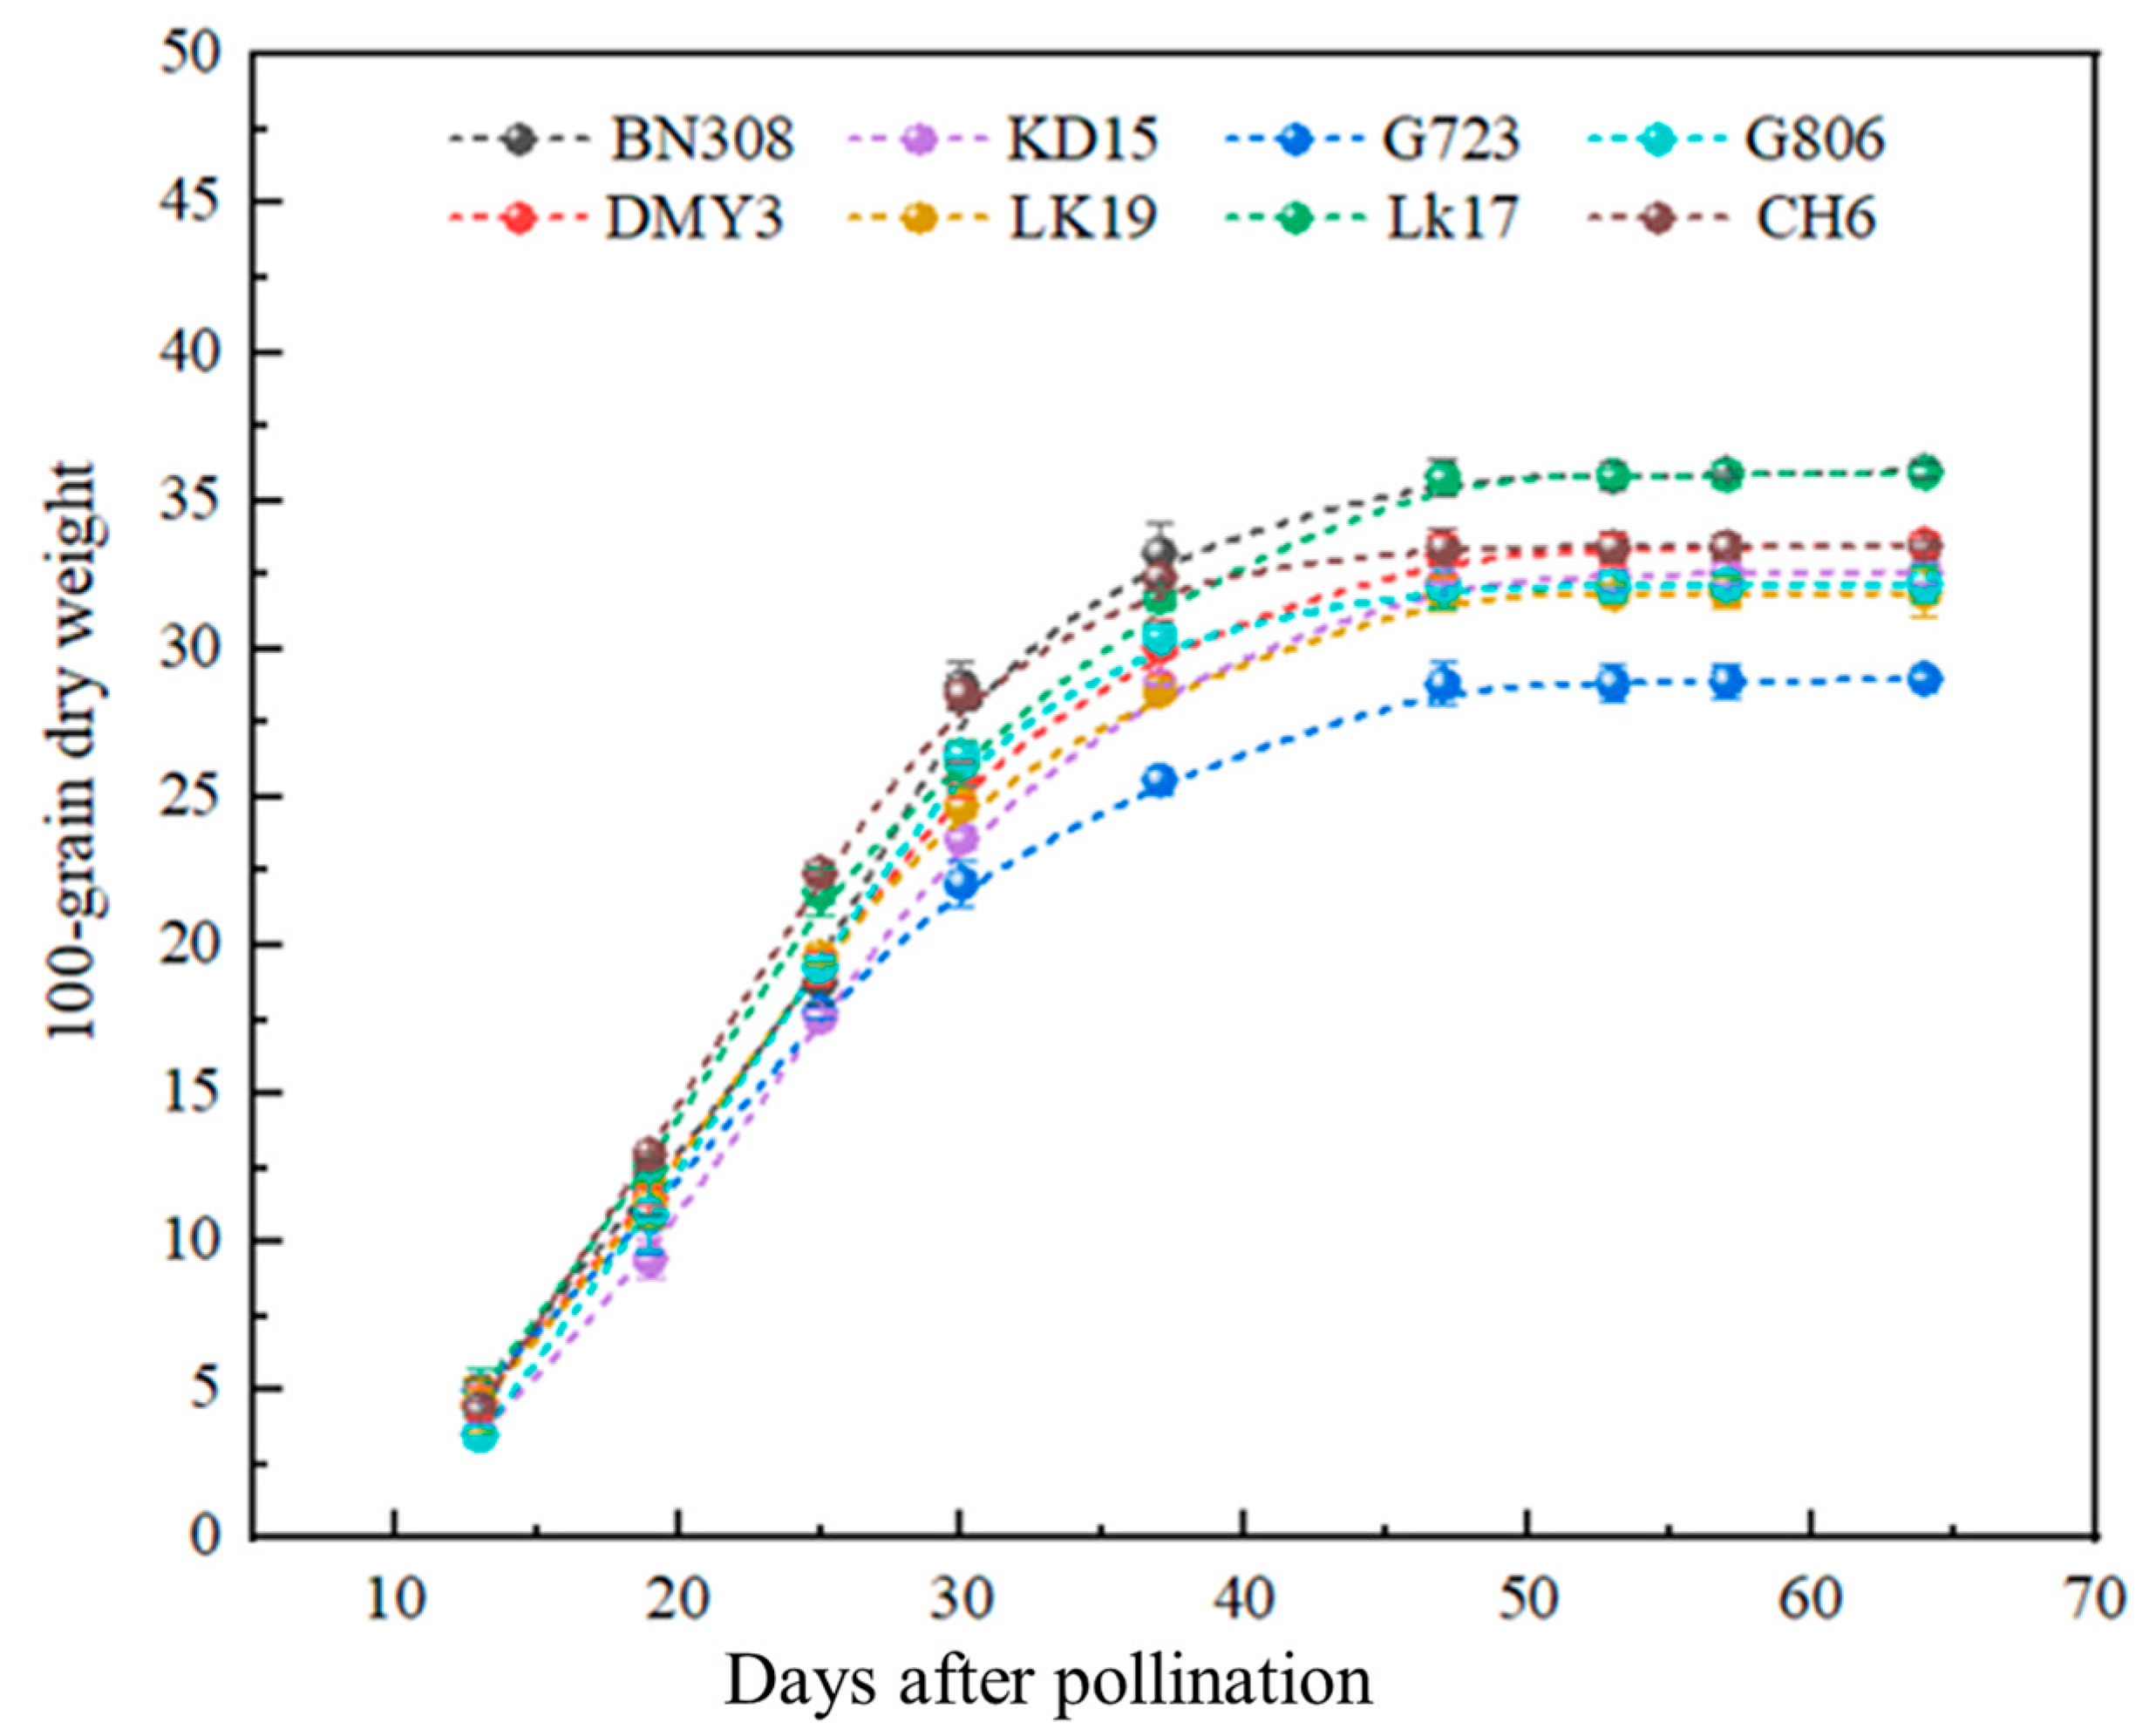
3.1. Grain Dry Weight

Dry matter accumulation of all varieties exhibited a typical “S”-shaped curve (Figure 2) with days after pollination and stabilized after 40 days. The varieties BN308 and LK17 showed the highest dry matter accumulation, with 100-kernel dry weights of 35.81 g and 35.78 g, respectively, surpassing the control, DMY3 (33.54 g), by 2.27 g and 2.24 g (p < 0.05). G723 had the lowest accumulation (28.82 g). During the first 20 DAP, dry matter accumulation rates did not differ significantly among varieties. However, after 20 DAP, distinct divergence emerged, which may be attributed to genetic differences in grain-filling characteristics among varieties. Analysis of variance (ANOVA) further confirmed that variety, DAP, and their interaction all had highly significant effects (p < 0.01) on dry matter accumulation (Table 3), indicating that different varieties possess unique growth regulation mechanisms during the later stages of grain development.

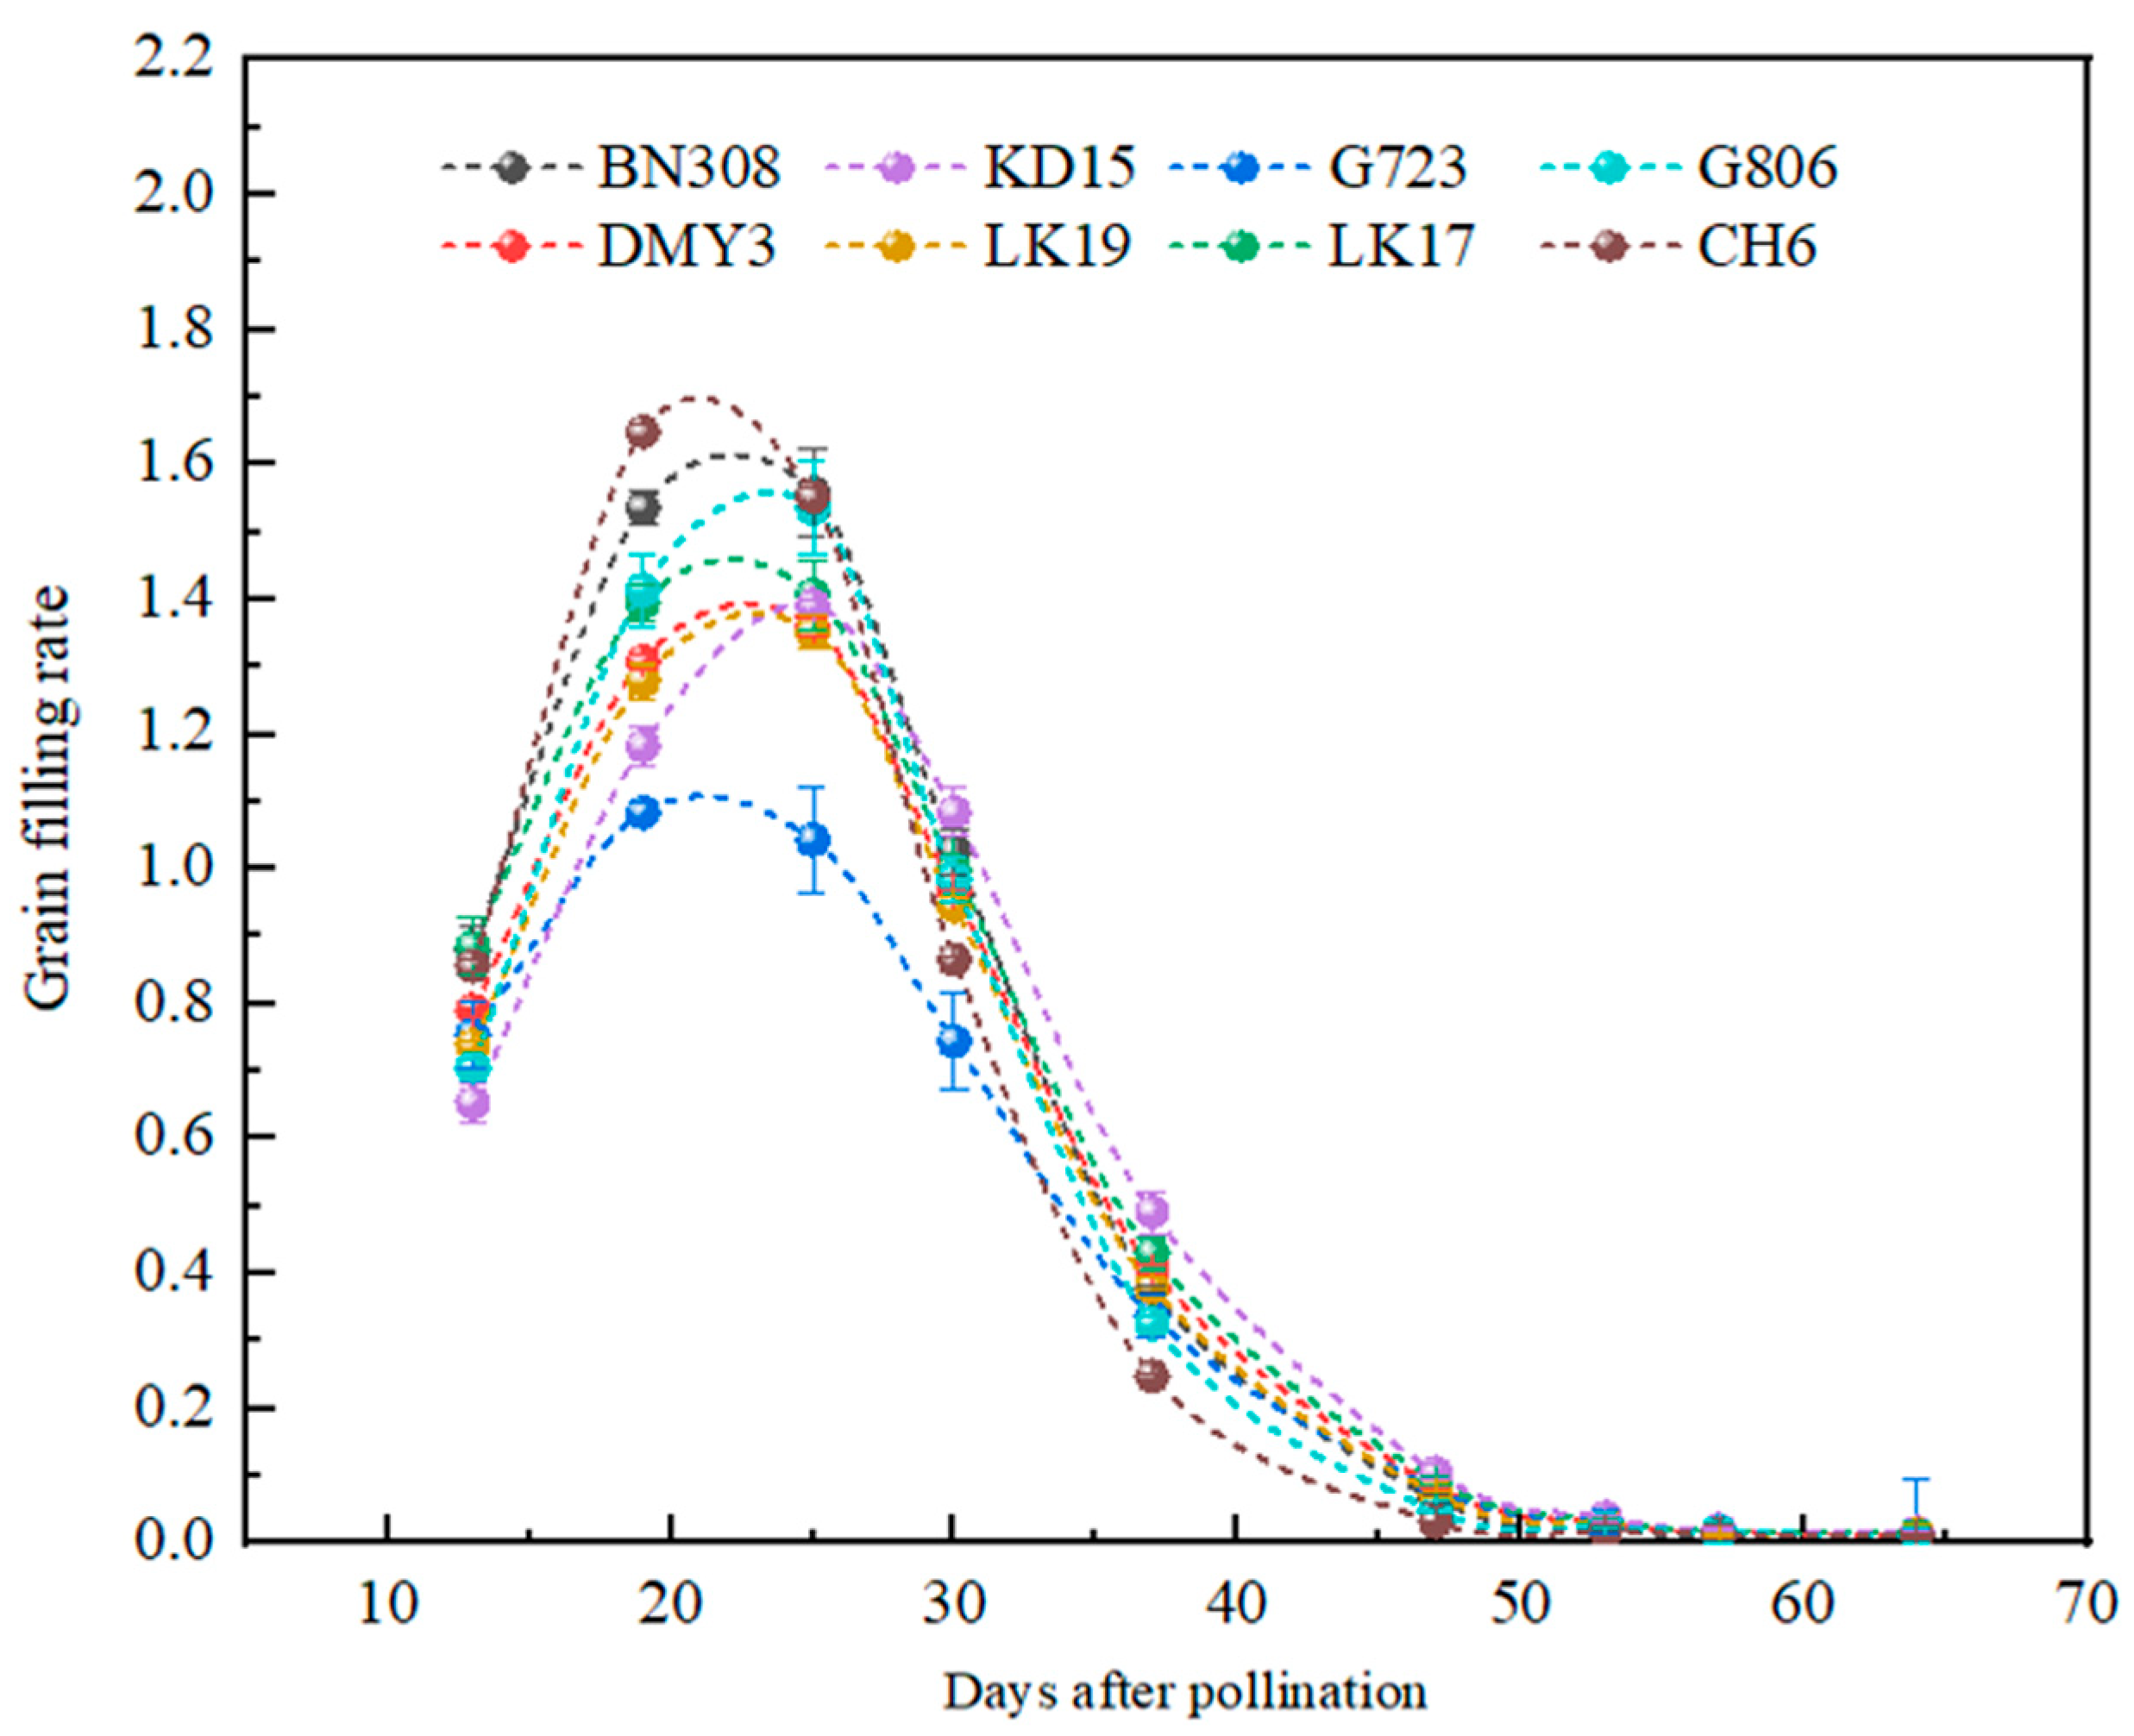
3.2. Grain-Filling Rate

The grain-filling rates of all varieties showed a unimodal curve (Figure 3) and peaked at 20–25 days after pollination. BN308 and CH6 had the highest filling rates (1.77 and 1.67 g/(100 kernels·d)), while G723 had the lowest (1.13 g/(100 kernels·d). The downward trend became pronounced around 30 days after pollination (DAP). By 40 DAP, the grain-filling rates of all varieties dropped below 0.4 g/(100 kernels·d). Between 50 and 60 DAP, the grain-filling rates of most varieties were stabilized, indicating that the grain-filling process of maize kernels was essentially completed during this period. Analysis of variance (ANOVA) revealed highly significant differences among varieties (p < 0.01) (Table 4).

3.3. Grain-Filling Parameters

As presented in Table 4 and Table 5, the grain-filling processes of different maize varieties were effectively modeled using the logistic equation, with coefficients of determination (R2) exceeding 0.99, demonstrating its excellent fitting.

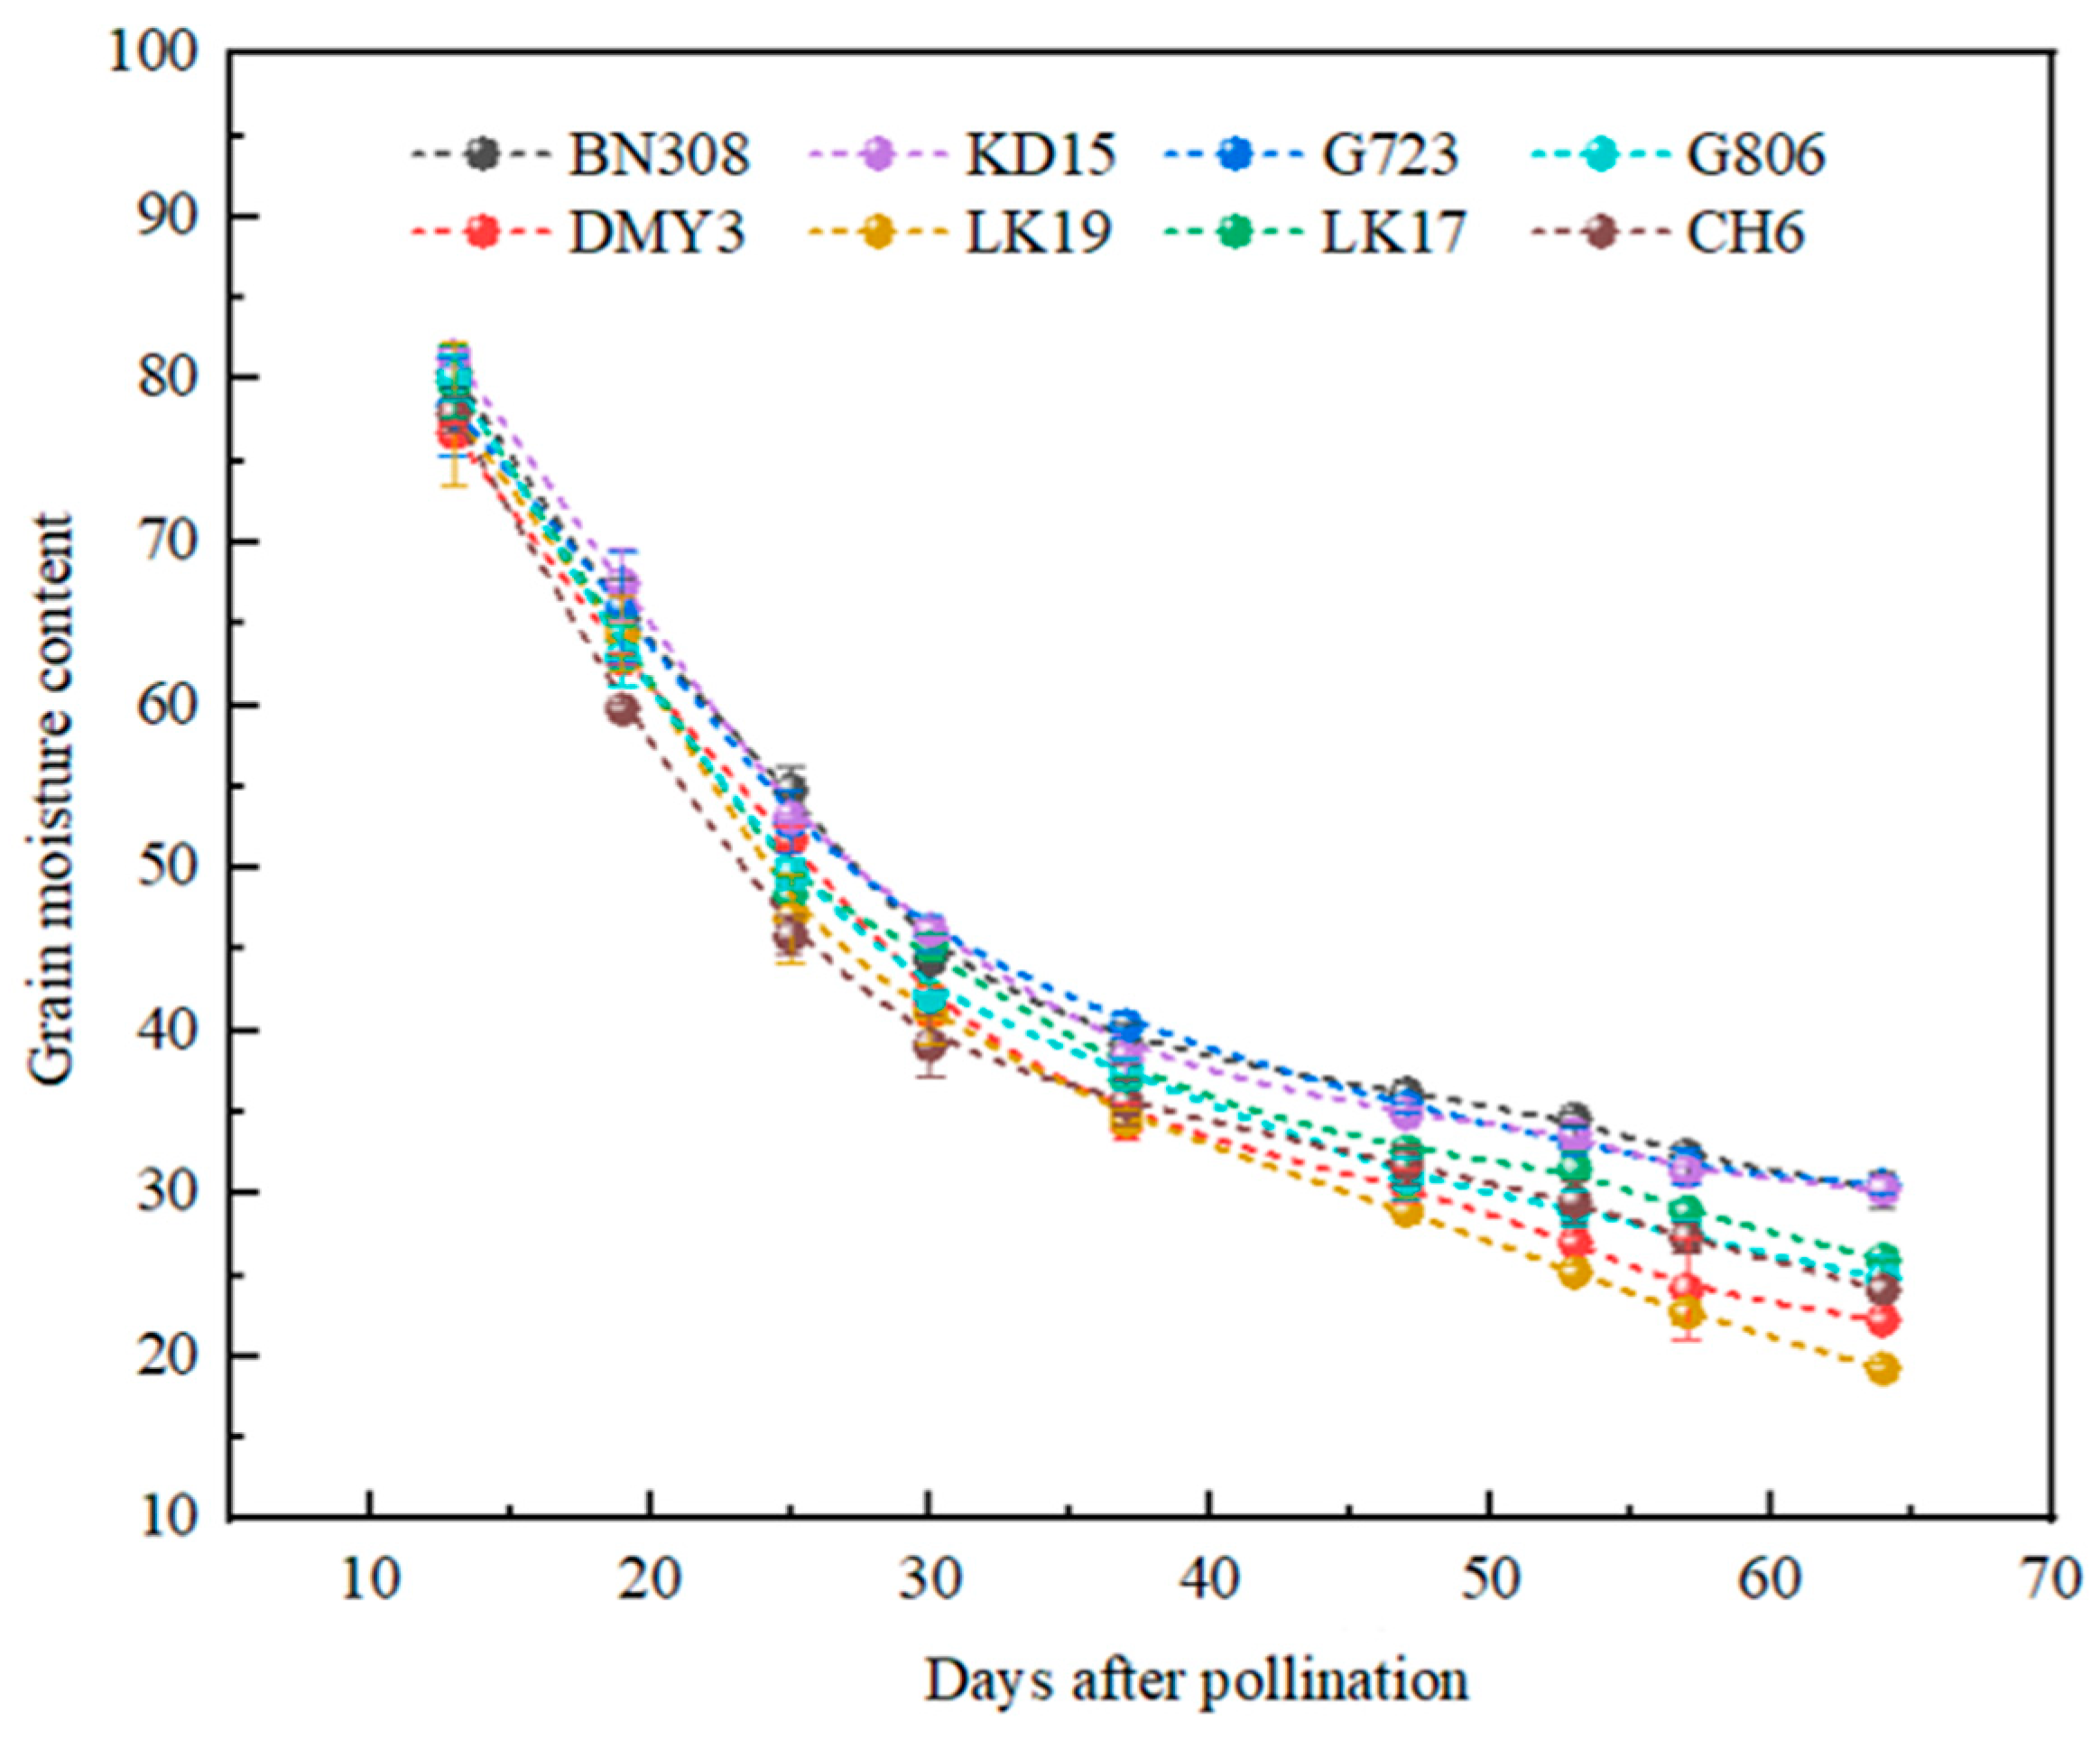
3.4. Grain Moisture Content

The kernel moisture content of all varieties significantly declined during the grain-filling stage (Figure 4). The process was divided into two distinct phases: a rapid dehydration phase (13–37 days after pollination) and a slow dehydration phase (after 37 days). Compared to DMY3, the variety BN308 showed a greater dehydration amplitude during the rapid phase (57.2% vs. 52.3%), but its moisture content at physiological maturity was significantly higher (36.2 ± 0.6% vs. 30.5 ± 0.5%, p < 0.01). During the slow phase, LK19 demonstrated superior dehydration performance, with a final moisture content of 19.3 ± 0.3%, which was significantly lower than DMY3 (22.3 ± 0.6%, p < 0.05), and a post-maturity dehydration rate of 0.89 ± 0.87%/d, an 18.7% increase over DMY3 (0.75 ± 0.13%/d). In contrast, G723 had consistently higher moisture content (p < 0.01), in the range of 30.5 ± 0.4% at harvest, which was 36.8% higher than the DMY3 variety. LK19 exhibited the most suitable dehydration traits for mechanical harvesting. ANOVA confirmed that variety, days after pollination, and their interaction significantly affected kernel moisture content (p < 0.01) (Table 6).

3.5. Post-Maturity Dehydration Rate

The moisture content at physiological maturity varied among all varieties, ranging from 28.97% to 36.18% (Table 7). The BN308 variety had the highest moisture content (5.64%) compared to DMY3, while LK19 had the lowest (1.57%). Harvest moisture content ranged from 19.25% to 30.47%. The variety G723 had the highest moisture content, which was 8.22 percentage points higher than DMY3, while LK19 had the lowest, being 3 percentage points lower. The average post-maturity dehydration rate ranged from 0.42 to 0.89%/d. Only LK19 exceeded DMY3′s rate (0.14%/d higher), while the others were lower.

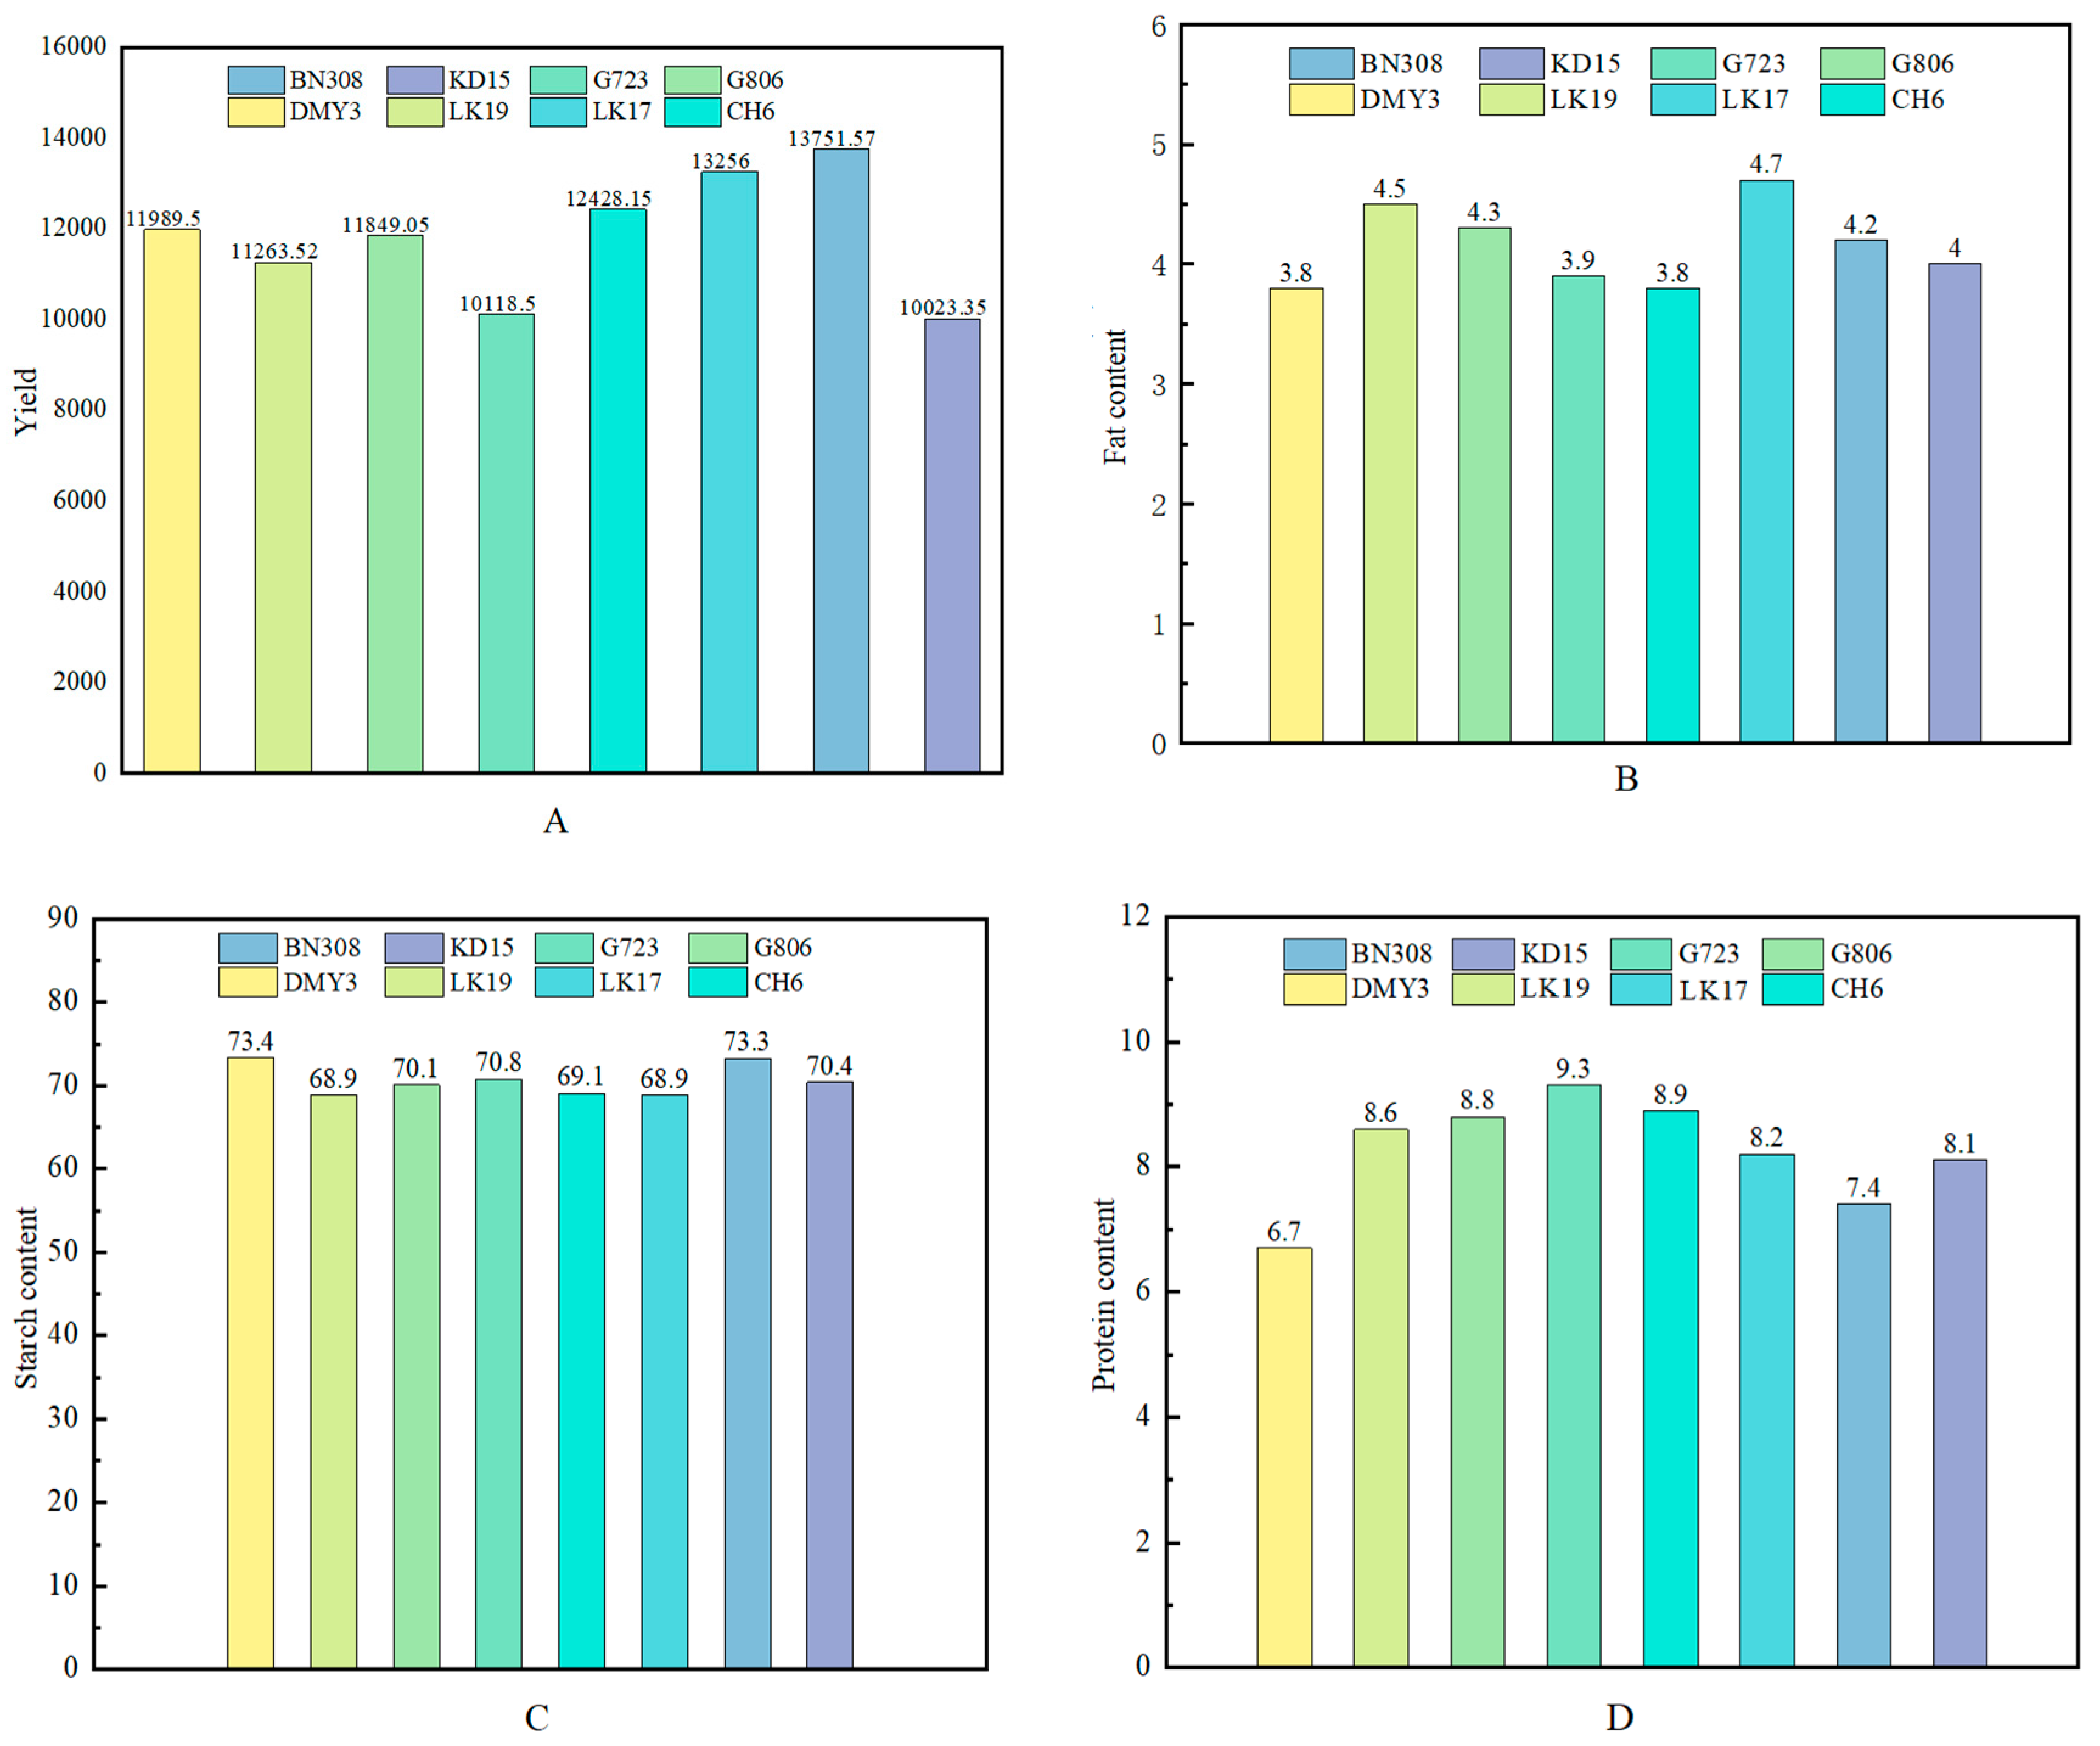
3.6. Yield and Quality

The yield differences among the eight varieties were significant, ranging from 9352.35 to 13,081.58 kg/ha. The control (DMY3) yielded 11,317 kg/ha. CH6, LK17, and BN308 outperformed DMY3, while LK19, G806, G723, and KD15 underperformed. The yield ranking followed the order of BN308 > LK17 > CH6 > DMY3 > G806 > LK19 > G723 > KD15. Quality analysis showed that DMY3 had 6.7% protein, 3.8% fat, and 73.4% starch. Other varieties generally showed slightly higher protein and fat content but lower starch content compared with the DMY3 variety (Figure 5B–D).

3.7. Contribution Rate

Through principal component analysis of 13 single indicators, the coefficients, eigenvalues, and contribution rates of each principal component were obtained (Table 8). Meanwhile, the top four principal components with eigenvalues greater than 1 were selected. As shown in Table 8, the contribution rates of C1, C2, C3, and C4 were 46.128%, 17.269%, 14.377%, and 13.261%, respectively, and their cumulative contribution rate reached 91.035%. Therefore, the 13 interrelated single traits could be transformed into four non-interfering composite indices (CIs). These four composite indices could be used to accurately and objectively identify and evaluate yield, dehydration rate, and quality.
The traits with larger coefficients in each principal component were arranged in descending order. The traits determining the first principal component were mainly based on dry weight per 100 kernels > Wmax > Rmean > yield; the traits determining the second principal component were mainly based on the average dehydration rate after physiological maturity > fat > P > T; the traits determining the third principal component were mainly based on starch > P > dry weight per 100 grains > Wmax; the traits determining the fourth principal component were mainly based on T > P > yield > protein > Rmean.
Based on the above results, dry weight per 100 kernels, Wmax, Rmean, yield, average dehydration rate after physiological maturity, fat, P, T, starch, and protein could be used as identification indicators for screening high-yielding, high-quality, and rapidly dehydrating maize varieties.

3.8. Correlation Analysis

Conduct correlation analysis on the yield, quality, grain-filling parameters, and kernel dehydration-related traits of eight maize varieties, with the results shown in Table 9. Maize yield is closely related to grain-filling parameters. The dry weight of 100 kernels exhibits a highly significant positive correlation with yield (r = 0.866 **), indicating that dry matter accumulation in kernels is a key factor affecting yield. Both the active grain-filling period (P) (r = 0.953 **) and the mean grain-filling rate (Rmean) (r = 0.858 **) show highly significant positive correlations with yield, suggesting that prolonging the active grain-filling period and increasing the grain-filling rate can significantly enhance yield. Additionally, kernel moisture content shows a highly significant negative correlation with the dehydration rate after physiological maturity (r = −0.853 **), implying that high moisture content delays dehydration and affects harvest timing. Regarding quality traits, protein content shows a significant negative correlation with starch content (r = −0.745 *), hinting at potential metabolic competition between the two. In conclusion, optimizing grain-filling parameters (e.g., extending the grain-filling period and increasing the grain-filling rate) can effectively improve maize yield, while the regulation of kernel moisture content and quality traits requires balancing based on breeding objectives.

4. Discussion

As one of the widely planted grain crops in China, maize is an important crop for ensuring national food security and maintaining the steady development of the national economy. With the advancement of modern agricultural production technology, the full mechanization of maize production has become the development trend of maize production. Here, our study showed that BN308 demonstrated a high yield (15.5% yield increase), a long grain-filling period (50.87 days), and a relatively high dehydration rate. LK19 exhibited harvest moisture content (19.25%) and dehydration rates (0.89%/d) approaching the ideal thresholds for mechanical harvesting (moisture <20%). The grain-filling rate showed an overall downward trend during the sampling period. It was relatively high from the first sampling to 30 days after pollination, and continued to decline after 30 days of pollination. By the end of the sampling period, the filling rates of some varieties were relatively low. The grain dehydration rate of the tested maize varieties showed an overall downward trend during the sampling period. It gradually decreased from 25 days to 47 days after pollination, and slightly accelerated at the end of the sampling, which might have been affected by climatic factors.
Excessively high moisture content of maize grains at harvest leads to a relatively high grain breakage rate during mechanical grain harvesting, which seriously affects the harvesting quality, yield, benefits, storage, and transportation of maize grains. Zhao demonstrated that the post-maturity grain dehydration rate in maize is independent of varietal differences in physiological maturity timing. However, it exhibits a significant positive correlation with the grain moisture content at physiological maturity [18]. The dehydration of maize grains occurs throughout their growth and development process, and there is also a moisture change process before physiological maturity [19]. Researchers have referred to the dehydration before physiological maturity as the physiological dehydration stage and the dehydration stage after physiological maturity as the natural dehydration stage. During this latter stage, the grain dehydration rate is mainly affected by external environmental conditions. The research results of Wang Zhihong [20] showed that a fast dehydration rate in the late physiological maturity stage of maize is conducive to mechanized harvesting and is one of the essential characteristics of maize varieties suitable for mechanized harvesting. In this study, the moisture content at physiological maturity was positively correlated with the harvest moisture (r = 0.83, p < 0.01), which was in line with Xu’s findings [15]. Notably, the BN308 variety had the highest physiological maturity moisture (36.18%) but this did not result in the highest harvest moisture (30.24%), due to its unique kernel structures [4]. LK19′s fast dehydration (0.89%/d) but lower yield suggests a trade-off between dehydration rate and yield potential, offering insights for breeding maize.
This finding extends the understanding of Liu et al. [21] regarding the biphasic dehydration characteristics of maize, providing new insights for breeding maize varieties suitable for mechanical harvesting. Additionally, this study revealed a complex relationship between grain-filling parameters and final yield.
Grain-filling characteristics are inherent features of maize varieties and are closely related to yield formation. Maize yield is the result of the mutual influence and combined action of multiple factors. Previous studies have suggested that the basis for forming grain yield is dry matter accumulation, and the fundamental way to achieve high yield is to increase dry matter accumulation [22,23]. The grain weight of different varieties is mainly affected by the duration of grain filling, while that of the same variety is mainly influenced by the grain-filling rate. The varieties BN308, LK17, and CH6 displayed better performance in terms of yield and dehydration traits. Their dehydration followed a biphasic pattern: a rapid phase from 13 to 37 days after pollination, with a daily rate of 2.17%, followed by a slow phase with a rate of 0.75% to 1.31% per day. These results are consistent with those of Liu et al. [21]. These varieties also had longer filling durations (50–51 days) and higher average filling rates (0.77, 0.72, and 0.77 g/(100 kernels·d)). This further contributed to high yield. Consistent findings were independently corroborated by several studies [24,25,26,27,28,29,30]. The grain-filling duration determines yield differences. For instance, while CH6 exhibited the highest grain-filling rate (1.77 g/(100 kernels·d)), it did not achieve the highest yield. This observation aligns with the nonlinear relationship between grain filling traits and yield [6]. Such an inconsistency suggests that sustained filling capacity during the late grain-filling stages may be more critical than peak filling rates.

5. Conclusions

To screen maize varieties with high yield, quality, and suitability for mechanical harvesting, this study investigated the grain-filling and dehydration characteristics of eight early-maturing maize varieties in Heilongjiang Province, targeting two major climatic constraints in high-latitude, cold-temperate maize production. It was clarified that the grain-filling parameters are the core driving factors for high-yield maize. Extending the active grain-filling period and increasing the grain-filling rate can significantly boost the yield, and the active grain-filling period has the greatest impact on the yield. Principal component analysis shows that the starch, fat and protein content, together with the grain-filling parameters (such as Wmax and Rmean), jointly affect the comprehensive quality of the varieties, and balanced selection is required.

Author Contributions

Conceptualization, D.Y.; methodology, Y.L.; software, J.L.; validation, H.Z., Y.Z. (Yumeng Zhang) and Y.Z. (Yanci Zhou); formal analysis, X.G.; investigation, Y.W.; resources, J.Z. (Jiahao Zhang); data curation, J.Z. (Jingwen Zhang); writing—original draft preparation, S.Y.; writing—review and editing, D.Y.; visualization, Y.L.; supervision, D.Y.; project administration, D.Y.; funding acquisition, D.Y. All authors have read and agreed to the published version of the manuscript.

Funding

This work was supported by the National Outstanding Agricultural Research Talents of Agriculture. No. 2015012.

Data Availability Statement

All relevant data are within the paper.

Acknowledgments

We would like to thank the editors and the anonymous reviewers for their work, helpful suggestions, and comments.

Conflicts of Interest

The authors declare no conflicts of interest.

References

  1. Jing, Z.C.; Song, X.; Zhang, Z.H. Research on the development of China’s maize industry: A Cost-Benefit Analysis. Heilongjiang Grain 2024, 11, 107–109. [Google Scholar]
  2. Du, G.; Zhang, L.; Xu, X.; Wang, J. Spatial-temporal characteristics of maize production potential change under the background of climate change in Northeast China over the past 50 years. Geogr. Res. 2016, 35, 864–874. [Google Scholar]
  3. Yang, W.; Peng, S.; Dionisio-Sese, M.L.; Laza, R.C.; Visperas, R.A. Grain Filling Duration, a Crucial Determinant of Genotypic Variation of Grain Yield in Field-Grown Tropical Irrigated Rice. Field Crops Res. 2008, 105, 221–227. [Google Scholar] [CrossRef]
  4. Gasura, E.; Setimela, P.; Edema, R.; Gibson, P.T.; Okori, P.; Tarekegne, A. Exploiting Grain-Filling Rate and Effective Grain-Filling Duration to Improve Grain Yield of Early-Maturing Maize. Crop Sci. 2013, 53, 2295–2303. [Google Scholar] [CrossRef]
  5. Shen, L.X.; Huang, Y.K.; Li, T. Top-grain filling characteristics at an early stage of maize (Zea mays L.) with different nitrogen use efficiencies. J. Integr. Agric. 2017, 16, 626–639. [Google Scholar] [CrossRef]
  6. Borrás, L.; Otegui, M.E. Maize kernel weight response to postflowering source–sink ratio. Crop Sci. 2001, 41, 1816–1822. [Google Scholar] [CrossRef]
  7. Guo, J.; Wang, Z.; Wei, Q.; Li, G.; Yang, H.; Lu, D. Response of waxy maize (Zea mays L. var. ceratina Kulesh) leaf photosynthesis to low temperature during the grain-filling stage. Funct. Plant Biol. 2023, 50, 335–346. [Google Scholar] [CrossRef] [PubMed]
  8. Wu, Y.; Zhou, G.; Song, Y.; Zhou, L. Thresholds and extent of temperature effects on maize yield differ in different grain-filling stages. Sci. Total Environ. 2024, 25, 918. [Google Scholar] [CrossRef] [PubMed]
  9. Zhao, F.C.; Jing, L.Q.; Yan, F.B.; Lu, D.; Wang, G.; Lu, W. The effects of high temperature stress during the filling period on sugar accumulation and sucrose metabolism-related enzyme activities in sweet corn kernels. Acta Agron. Sin. 2013, 39, 1644–1651. [Google Scholar] [CrossRef]
  10. Wang, X.; Wang, X.; Xu, C.; Tan, W.; Wang, P.; Meng, Q. Decreased kernel moisture in medium-maturing maize hybrids with high yield for mechanized grain harves. Crop Sci. 2019, 59, 2794–2805. [Google Scholar] [CrossRef]
  11. Tubbs, T.; Woloshuk, C.; Ileleji, E.K. A simple low-cost method of determining whether it is safe to store maize. AIMS Agric. Food 2017, 2, 43–55. [Google Scholar] [CrossRef]
  12. Li, L.; Ming, B.; Gao, S.; Wang, K.; Hou, P.; Jin, X.; Chu, Z.; Zhang, W.; Huang, Z.; Li, H.; et al. A regional analysis model of maize kernel moisture. Agron. J. 2020, 113, 1467–1479. [Google Scholar] [CrossRef]
  13. Li, S.K. Factors Affecting the quality of mechanical maize grain harvesting in China and development directions of grain harvesting technology. J. Shihezi Univ. (Nat. Sci.) 2017, 35, 265–272. [Google Scholar]
  14. Li, Y.J.; Shi, J.M.; Ju, C.M.; Zhu, J. Preliminary Report on the Correlation between Maize Kernel Moisture and Variety Traits. J. Maize Sci. 2000, 4, 37–38. [Google Scholar]
  15. Xu, T.J.; Lv, T.F.; Zhao, J.R.; Wang, R.H.; Xing, J.F.; Zhang, Y.; Cai, W.T.; Liu, X.E.; Liu, X.Z.; Chen, C.Y.; et al. Study on grain dehydration characteristics of summer sowing corn varieties in the Huang Huai Hai region. Agric. Sci. China 2021, 54, 708–719. [Google Scholar]
  16. Guo, H.; Yu, X.; Gao, J.; Ma, D.; Hu, S.; Wang, X. Grain dehydration characteristics of old and modern maize hybrids and their response to different planting densities. Agronomy 2022, 12, 1640. [Google Scholar] [CrossRef]
  17. Zhu, Q.S.; Cao, X.Z.; Luo, Y.Q. Growth analysis of rice grain filling. Acta Agron. Sin. 1988, 3, 182–193. [Google Scholar]
  18. Zhao, S.J.; Wu, H.M. Assessment of natural desiccation rate in Zea mays Kernels. J. Jiling Agric. Sci. 2002, 5, 24–26. [Google Scholar]
  19. Cross, Z.H. Leaf expansion rate effects on yield and yield components in early-maturing maize. Crop Sci. 1991, 31, 579–583. [Google Scholar] [CrossRef]
  20. Wang, Z.H.; Zhou, Z.F.; Guo, H.; Wang, J.; Jin, H.L.; Liu, H.Y.; Wang, L.F.; Shen, Y.F.; Yang, M.L.; Wang, B.T. Research analysis and germplasm improvement strategies for dehydration rate in maize kernels. J. Agric. 2015, 5, 15–18. [Google Scholar]
  21. Liu, G.; Bian, Q.; Fu, Y.; Liu, Y.; Wei, Y.; Zhu, J.; Wang, Z. Study on the dehydration characteristics of spring maize after physiological maturity and the suitable period of mechanical grain harvest. Wirel. Commun. Mob. Comput. 2022, 2022, 170057. [Google Scholar] [CrossRef]
  22. Qian, C.R.; Wang, R.H.; Zhao, J.R.; Yv, Y.; Xv, T.J.; Hao, Y.B.; Jiang, Y.B.; Gong, X.J.; Li, L.; Ge, X.L. Characteristics of dry matter accumulation, allocation, and translocation in maize at different maturity periods. Chin. J. Ecol. 2017, 36, 2177–2183. [Google Scholar]
  23. Wang, L.M.; Li, S.Q.; Shao, M.A. Effects of water and nitrogen supply on the accumulation and distribution of dry matter and nitrogen in vegetative organs of the corn canopy. Sci. Agric. Sin. 2010, 43, 2697–2705. [Google Scholar]
  24. Ke, F.L.; Ma, X.L.; Huang, R.D.; Wang, C.H.; Xv, A.B. The influence of planting density on the grain filling characteristics of Xianyu 335 population. Corn Sci. 2011, 19, 58–62+66. [Google Scholar]
  25. Borrás, L.; Zinselmeier, C.; Senior, M.L.; Westgate, M.E.; Muszynski, M.G. Characterization of grain-filling patterns in diverse maize germplasm. Crop Sci. 2009, 49, 999–1009. [Google Scholar] [CrossRef]
  26. Wang, R.H.; Xu, T.J.; Chen, C.Y.; Wang, Y.D.; Lyu, T.F.; Liu, Y.E.; Cai, W.T.; Liu, X.Z.; Zhao, J.R. Grain filling and dehydration characteristics of different maturity types of corn varieties. Acta Agron. Sin. 2021, 47, 149–158. [Google Scholar] [CrossRef]
  27. Yao, D.D.; Wang, J.; Wang, W.P. Grain filling characteristics of three main spring maize varieties in the eastern Hebei regio. J. Hebei Norm. Univ. Sci. Technol. 2019, 33, 8–15. [Google Scholar]
  28. Wang, L. The Effect of Controlled Release Urea and Conventional Urea Combination on Starch Formation and Filling Characteristics of Spring Corn Grains. Master’s thesis, Ningxia University, Yinchuan, China, 2019. [Google Scholar]
  29. Cui, Y.K.; Wang, L.X.; Kong, L.J.; Zhao, W.M.; Zhang, M.J.; Chen, Y.P.; Yuan, J.H. Analysis of yield and grain filling characteristics of different glutinous corn varieties in the southern fresh corn region. Corn Sci. 2023, 31, 67–72. [Google Scholar]
  30. Li, S.C.; Lu, J.H.; Meng, B.M.; Dong, Z.X. The relationship between the proliferation of maize endosperm cells and the enrichment of storage capacity. Corn Sci. 2000, 4, 45–47. [Google Scholar]
Figure 1. Meteorological data during maize growing period in 852 Farm in 2024. Min indicates the minimum temperature; max indicates the maximum temperature. Precipitation shows daily precipitation.
Agronomy 15 01356 g001
Figure 2. Dynamic changes in dry matter accumulation of maize kernels.
Agronomy 15 01356 g002
Figure 3. Dynamic changes in maize grain-filling rate.
Agronomy 15 01356 g003
Figure 4. Dynamic changes in maize kernel moisture content.
Agronomy 15 01356 g004
Figure 5. Yield and percentage of internal protein, fat, and starch content in kernels of tested maize varieties. (A) yield of different maize varieties; (B) percentage of protein content; (C) percentage of fat content; (D) percentage of starch content.
Agronomy 15 01356 g005
Table 1. Information on the eight maize varieties.
VarietyNameSourceMaturity Days
DMY3(CK)Demeiy39F592 × 6F576113
LK17Longken17kenxi15 × kenxi17114
BN308Bona308H3399 × H366123
KD15Kendan15jia34 × jia45117
LK19Longken19beixi114 × beixi69113
G806Doctor Jin806jin339 × jin386123
G723Doctor Jin723W113 × W445114
CH6Chenghe6W12-01 × ww-04128
Note: The origins of some maize varieties are represented using transliteration.
Table 2. Calculation formulas for grain-filling characteristic parameters.
IndicatorCalculation Formula
Grain-filling duration (d)T = (ln B + 4.59512)/C
Active grain-filling period (d)P = 6/C
Days to maximum filling rate (d)Tmax = (ln B)/C
Kernel weight at max rate (g)Wmax = A/2
Maximum filling rate [g/(100 kernels × d)]Rmax = (C × Wmax)/2
Average filling rate [g/(100 kernels × d)]Rmean = A/T
Table 3. Analysis of variance (ANOVA) of dry weight of 100 maize kernels.
Source of VariationDFSSF-ValueSignificance
Variety (V)776.918260.461**
Days after pollination (DAP)82755.3599330.222**
V × DAP564.00513.563**
Note: ** indicates highly significant differences at p < 0.01 level.
Table 4. Analysis of variance (ANOVA) of grain-filling rate in maize kernels.
Source of VariationDFSSF-ValueSignificance
Variety (V)70.05758.426**
Days after pollination (DAP)88.1198341.066**
V × DAP560.02525.822**
Note: ** indicates highly significant differences at p < 0.01 level.
Table 5. Fitting characteristic parameters of maize kernel grain filling.
Variety Characteristic Parameters Coefficient of Determination
T (d)Tmax (d)Wmax (g)Rmax [g/(100 kernels·d)]P (d)Rmean
[g/(100 kernels·d)]
BN30850.87 ± 0.14 a22.14 ± 0.33 bcd18.08 ± 0.19 a1.67 ± 0.68 b38.59 ± 1.62 a0.77 ± 0.13 a0.994
CH650.81 ± 0.78 ab21.54 ± 0.70 cd16.71 ± 0.30 b1.77 ± 0.19 a35.15 ± 0.68 bc0.77 ± 0.04 a0.999
DMY3(CK)49.40 ± 0.38 cd22.45 ± 0.43 bc16.73 ± 0.3 b1.42 ± 0.18 c35.23 ± 0.47 bc0.68 ± 0.04 c0.999
G80645.54 ± 0.64 f22.69 ± 0.52 b16.10 ± 0.55 cd1.62 ± 0.91 b32.53 ± 1.36 d0.71 ± 0.31 b0.999
G72347.04 ± 0.71 e21.35 ± 1.14 d14.51 ± 0.15 e1.13 ± 0.56 d29.87 ± 0.89 e0.57 ± 0.06 e0.998
KD1543.19 ± 0.26 g23.92 ± 0.46 a16.46 ± 0.33 bc1.40 ± 0.01 c28.30 ± 0.36 e0.65 ± 0.08 d0.999
LK1749.81 ± 0.64 bc22.09 ± 0.59 bcd18.01 ± 0.07 a1.49 ± 0.45 c36.24 ± 1.10 b0.72 ± 0.10 b0.995
LK1948.57 ± 0.76 d22.60 ± 0.15 b15.97 ± 0.10 d1.41 ± 0.36 c33.91 ± 0.85 cd0.66 ± 0.10 cd0.998
Note: T—duration of grain filling; Tmax—days to reach the maximum grain-filling rate; Wmax—maize biomass when the grain-filling rate reaches its maximum; Rmax—maximum grain-filling rate of the kernel; P—active period of grain filling; Rmean—average grain-filling rate. Lowercase letters following the same column of numbers indicate significant differences at the p < 0.05 level.
Table 6. Analysis of variance of maize kernel moisture content.
Source of VariationDFSSF-ValueSignificance
Variety (V)7199.082104.755**
Days after pollination (DAP)87843.2404127.038**
V × DAP568.8744.669**
Note: ** indicates highly significant differences at p < 0.01 level.
Table 7. Moisture content of grains of tested varieties and average dehydration rate after physiological maturity.
Variety CodePhysiological Maturity
Water Content (%)
Harvest Moisture Content (%)Average Dehydration Rate After Physiological Maturity (%/d)
BN30836.18 ± 0.55 a30.24 ± 1.03 a0.54 ± 0.14 bc
CH629.78 ± 1.179 cd24.73 ± 0.57 b0.46 ± 0.71 bc
DMY3 (CK)30.54 ± 1.03 c22.25 ± 0.55 c0.75 ± 0.13 a
G72335.34 ± 0.28 a30.47 ± 0.44 a0.44 ± 0.61 bc
G80630.96 ± 1.25 c24.85 ± 1.29 b0.56 ± 0.26 bc
KD1534.93 ± 0.22 a30.28 ± 0.63 a0.42 ± 0.39 c
LK1732.59 ± 0.28 b25.98 ± 0.12 b0.60 ± 0.34 b
LK1928.97 ± 0.69 d19.25 ± 0.29 d0.89 ± 0.87 a
Note: Lowercase letters following the same column of numbers indicate significant differences at the p < 0.05 level.
Table 8. Coefficients, eigenvalues, and contribution rates of each principal component.
IndexC1C2C3C4
Dry weight per 100 kernels0.9520.0630.192−0.120
Seed moisture content0.052−0.8880.146−0.155
T0.5670.2900.1600.725
Tmax−0.0220.0330.110−0.968
Wmax0.9460.0360.189−0.157
Rmax0.828−0.114−0.1240.100
P0.8060.3220.2230.425
Rmean0.938−0.054−0.0160.136
Average dehydration rate after physiological maturity0.0380.9840.125−0.025
Protein−0.398−0.233−0.8430.239
Fat0.3870.466−0.498−0.298
Starch0.055−0.1360.9500.063
Yield0.9160.1370.1090.308
Eigenvalue5.9972.2451.8651.728
Contribution rate46.12817.26914.37713.261
Cumulative contribution rate46.12863.39777.77491.035
Table 9. Correlation coefficients of yield, quality, grain-filling parameters, and kernel dehydration-related traits among eight maize varieties.
CharacteristicDry Weight per 100 KernelsSeed Moisture ContentTTmaxWmaxRmaxPRmeanAverage Dehydration Rate After Physiological MaturityProteinFatStarchYield
Dry weight per 100 kernels1
Seed moisture content0.0761
T0.532−0.2811
Tmax0.0900.065−0.6951
Wmax0.999 **0.1130.4980.1231
Rmax0.662−0.0730.429−0.0260.6491
P0.777 *−0.2320.894 **−0.4090.750 *0.6111
Rmean0.823 *−0.0400.580−0.0910.810 *0.963 **0.769 *1
Average dehydration rate after physiological maturity0.107−0.853 **0.3060.0850.082−0.0670.370−0.0061
Protein−0.6050.038−0.266−0.316−0.601−0.154−0.470−0.305−0.3421
Fat0.373−0.2150.0720.1340.3780.0660.2870.1570.4090.1051
Starch0.1870.2920.1550.0260.185−0.0440.2660.0490.000−0.745 *−0.4541
Yield0.866 **−0.0620.782 *−0.3350.845 **0.711 *0.953 **0.858 **0.169−0.4080.3570.1911
Note: T—duration of grain filling; Tmax—days to reach the maximum grain-filling rate; Wmax—maize biomass when the grain-filling rate reaches its maximum; Rmax—maximum grain-filling rate of the kernel; P—active period of grain filling; Rmean—average grain-filling rate. ** and * indicate significant correlations at p < 0.01 and p < 0.05 levels, respectively.
Disclaimer/Publisher’s Note: The statements, opinions and data contained in all publications are solely those of the individual author(s) and contributor(s) and not of MDPI and/or the editor(s). MDPI and/or the editor(s) disclaim responsibility for any injury to people or property resulting from any ideas, methods, instructions or products referred to in the content.

